Article

Uncertainty-Aware Interpretable Deep Learning for Slum Mapping and Monitoring

1
Deep Medicine, Oxford Martin School, Nuffield Department of Women’s & Reproductive Health, University of Oxford, Oxford OX1 3BD, UK
2
Institute for Intelligent Systems Research and Innovation (IISRI), Deakin University, CISR Drive, Waurn Ponds, VIC 3216, Australia
3
National Health Service (NHS), Royal Berkshire Hospital, Craven Road, Reading RG1 5AN, UK
*
Author to whom correspondence should be addressed.
Remote Sens. 2022, 14(13), 3072; https://doi.org/10.3390/rs14133072
Submission received: 28 April 2022 / Revised: 9 June 2022 / Accepted: 17 June 2022 / Published: 26 June 2022

Abstract

:
Over a billion people live in slums, with poor sanitation, education, property rights and working conditions having a direct impact on current residents and future generations. Slum mapping is one of the key problems concerning slums. Policymakers need to delineate slum settlements to make informed decisions about infrastructure development and allocation of aid. A wide variety of machine learning and deep learning methods have been applied to multispectral satellite images to map slums with outstanding performance. Since the physical and visual manifestation of slums significantly varies with geographical region and comprehensive slum maps are rare, it is important to quantify the uncertainty of predictions for reliable and confident application of models to downstream tasks. In this study, we train a U-Net model with Monte Carlo Dropout (MCD) on 13-band Sentinel-2 images, allowing us to calculate pixelwise uncertainty in the predictions. The obtained outcomes show that the proposed model outperforms the previous state-of-the-art model, having both higher AUPRC and lower uncertainty when tested on unseen geographical regions of Mumbai using the regional testing framework introduced in this study. We also use SHapley Additive exPlanations (SHAP) values to investigate how the different features contribute to our model’s predictions which indicate a certain shortwave infrared image band is a powerful feature for determining the locations of slums within images. With our results, we demonstrate the usefulness of including an uncertainty quantification approach in detecting slum area changes over time.

Graphical Abstract

1. Introduction

Urbanisation refers to a socio-economic process that involves the transformation of the built environment into urban settlements and the relocation of rural inhabitants to urban areas [1]. Along with demographic changes, this can both aid and obstruct sustainable development, often at the same time and in the same place. When planned and managed properly, urbanisation has the potential to bring prosperity and assist inhabitants in overcoming poverty by improving productivity, employment opportunities, and overall quality of life; when poorly planned, it can exacerbate problems regarding access to social and environmental resources, leading to a cascade of consequences that fuel environmental degradation, deprivation, and social exclusion [2,3,4,5,6]. The substantial proliferation and expansion of urban informal settlements are typical products of mismanaged urbanisation [7,8,9]. Informal settlements are the most visible symptoms of the incapability of urban management to scale up housing supply in response to rising demand, resulting in the formation of disorganised clusters with varying levels of essential provisions, infrastructure, and amenities [10,11,12,13,14]. Such settlements are closely related to slums, whose dwellers are deprived in multiple ways, suffering from lack of access to water or sanitation, overcrowding, non-durable housing, or illegal tenure [9].
Along with the acceleration of urbanisation, the worldwide slum population has continued to grow over the years, surpassing 1 billion in 2018, accounting for 23.5% of the global population [15]. Particularly in low- and middle-income countries (LMICs), which will contribute hugely to future global urbanisation, the proportion of slum dwellers is substantially higher. For instance, about 41.3% of Greater Mumbai’s population lives in slums [16] and over 62% of the urban population in Sub-Saharan Africa resides in slums [17]. Additionally, income losses resulting from the COVID-19 pandemic have forced an increasing number of people to live in slums, causing greater crowding and deteriorating slum residents’ quality of life and further increasing their vulnerability [18].
To achieve the Sustainable Development Goals (SDGs), in particular SDG 11 of sustainable, safe, resilient, and inclusive cities and communities, it is important to accurately and routinely monitor and map the dynamic development of these urban settlements at high spatial and temporal resolutions [19,20,21]. However, reliable, up-to-date, and publicly accessible spatial information for these areas is often unavailable owing to technological restrictions and a scarcity of resources [14,22,23,24]. This phenomenon is magnified in LMICs, where internal and circular population migration is more intensive, causing data on slums to quickly become obsolete [8]. As such, the continuous expansion of slum areas remains under-reported in censuses or surveys, impeding the targeted provision of infrastructure and assistance to the most impoverished areas, consequently hindering their improvement.
To address these issues, remote sensing imagery sourced from aerial and spaceborne platforms provides a sustainable source of spatial-contextual information on slums, facilitating detection and tracking of their development, comparing the inter-and intra-slum heterogeneity, analysing morphological characteristics, and informing policymaking [7,20,25,26,27,28]. Using remote sensing imagery has several advantages over conventional survey-based methods like taking a census, including but not limited to cost-efficiency, global coverage, and higher resolution in both space and time [20,27,29]. Furthermore, these advantages are augmented by the advancement in computer vision, including machine learning [30] and deep learning [14,28,31,32]. There are different levels of accessibility of satellite images, with some images being free to use and publicly accessible, and these are the most desirable to use in the often less well-funded settings that unfortunately are more common within LMICs. The lack of any pixel-level deep convolutional slum mapping models for multispectral satellite data is the first of four main gaps that we identify in the literature.
Whilst there are various machine learning models that have been applied to the slum mapping problem, so far model interpretability has not been investigated. Knowing how models make decisions can be just as important as a model having high performance as this gives users increased confidence in using the model [33]. This is particularly important in applications like slum mapping where there is still no substantial uptake in model use in real applications outside of academia [27]. Identifying the most powerful multispectral image bands that the investigated models use to distinguish slum dwellings is the second of the four main research gaps that are investigated in this paper.
One consistent problem with these machine learning slum mapping models is that outputs are not accompanied by uncertainty measures [34] that inform users about the level of confidence the model has in its predictions, despite this being called for in the literature [32,35]. Building a model with uncertainty quantification works towards tackling problems of reduced model deployment and trust [36,37,38,39,40]. Generally, uncertainty quantification is shown to be important and successful in scenarios where output data is used to make significant decisions [37], with examples in medical applications [41], self-driving cars [42] and natural language processing [43]. If, for example, a local government was going to spend large amounts of money on infrastructure development to improve the lives of slum-dwellers, they might like to use a mapping model to estimate the number of people living in slums within a geographical region. Even a small amount of uncertainty could add up to become a significant error when calculations are done over the scale of entire cities like Mumbai and Karachi where millions of slum dwellers reside. Knowing about model uncertainty would be very useful and allow the local government to make more confident decisions. This represents the third of the four main research gaps.
When training and testing their models in the same cities, existing studies have consistently used random data splits (whether at the pixel or image level) to separate data into training and test sets. This results in scenarios where the model is being trained in close geographic proximity to where it is being tested, different to how it would be deployed in a real-world application. Due to the great heterogeneity of slums with both their physical and visual manifestation varying significantly even within geographical localities [27,44], splitting the data randomly in the way used in previous studies where test data is geographically so mixed in with training data results in unrepresentative and favourable testing conditions. This is because the model has seen neighbouring (and more likely similar) pixels or images to what it is predicting on and so can perform better. We recognise this less realistic testing procedure as a fourth main research gap that inspires our regional testing approach.
In summary, the main contributions of this study, in the order which they appear in the rest of the paper, are as follows:
  • We present our U-Net model which is the first deployment of a convolutional deep learning model to identify slum buildings in individual pixels in free and publicly available multispectral satellite images.
  • We introduce our regional testing approach which we use to test our model against the Random Forest model that represents the current state-of-the-art for pixel-level classification. This testing method allows for more representative performance scores to be obtained, measuring more realistically how well models generalise to unseen whole geographical regions giving users greater confidence in applying the model.
  • We demonstrate that confidence measurements can be obtained per pixel within an input image by using Monte Carlo Dropout (MCD) in our U-Net model, demonstrating for the first time uncertainty quantification built into a deep learning slum mapping model. This produces uncertainty values that we measure alongside AUPRC (Area Under the Precision-Recall Curve) within our regional testing framework, showing that our U-Net model with MCD achieves a 9% improved regional test AUPRC and orders of magnitude decreased regional test uncertainty compared to the Random Forest model.
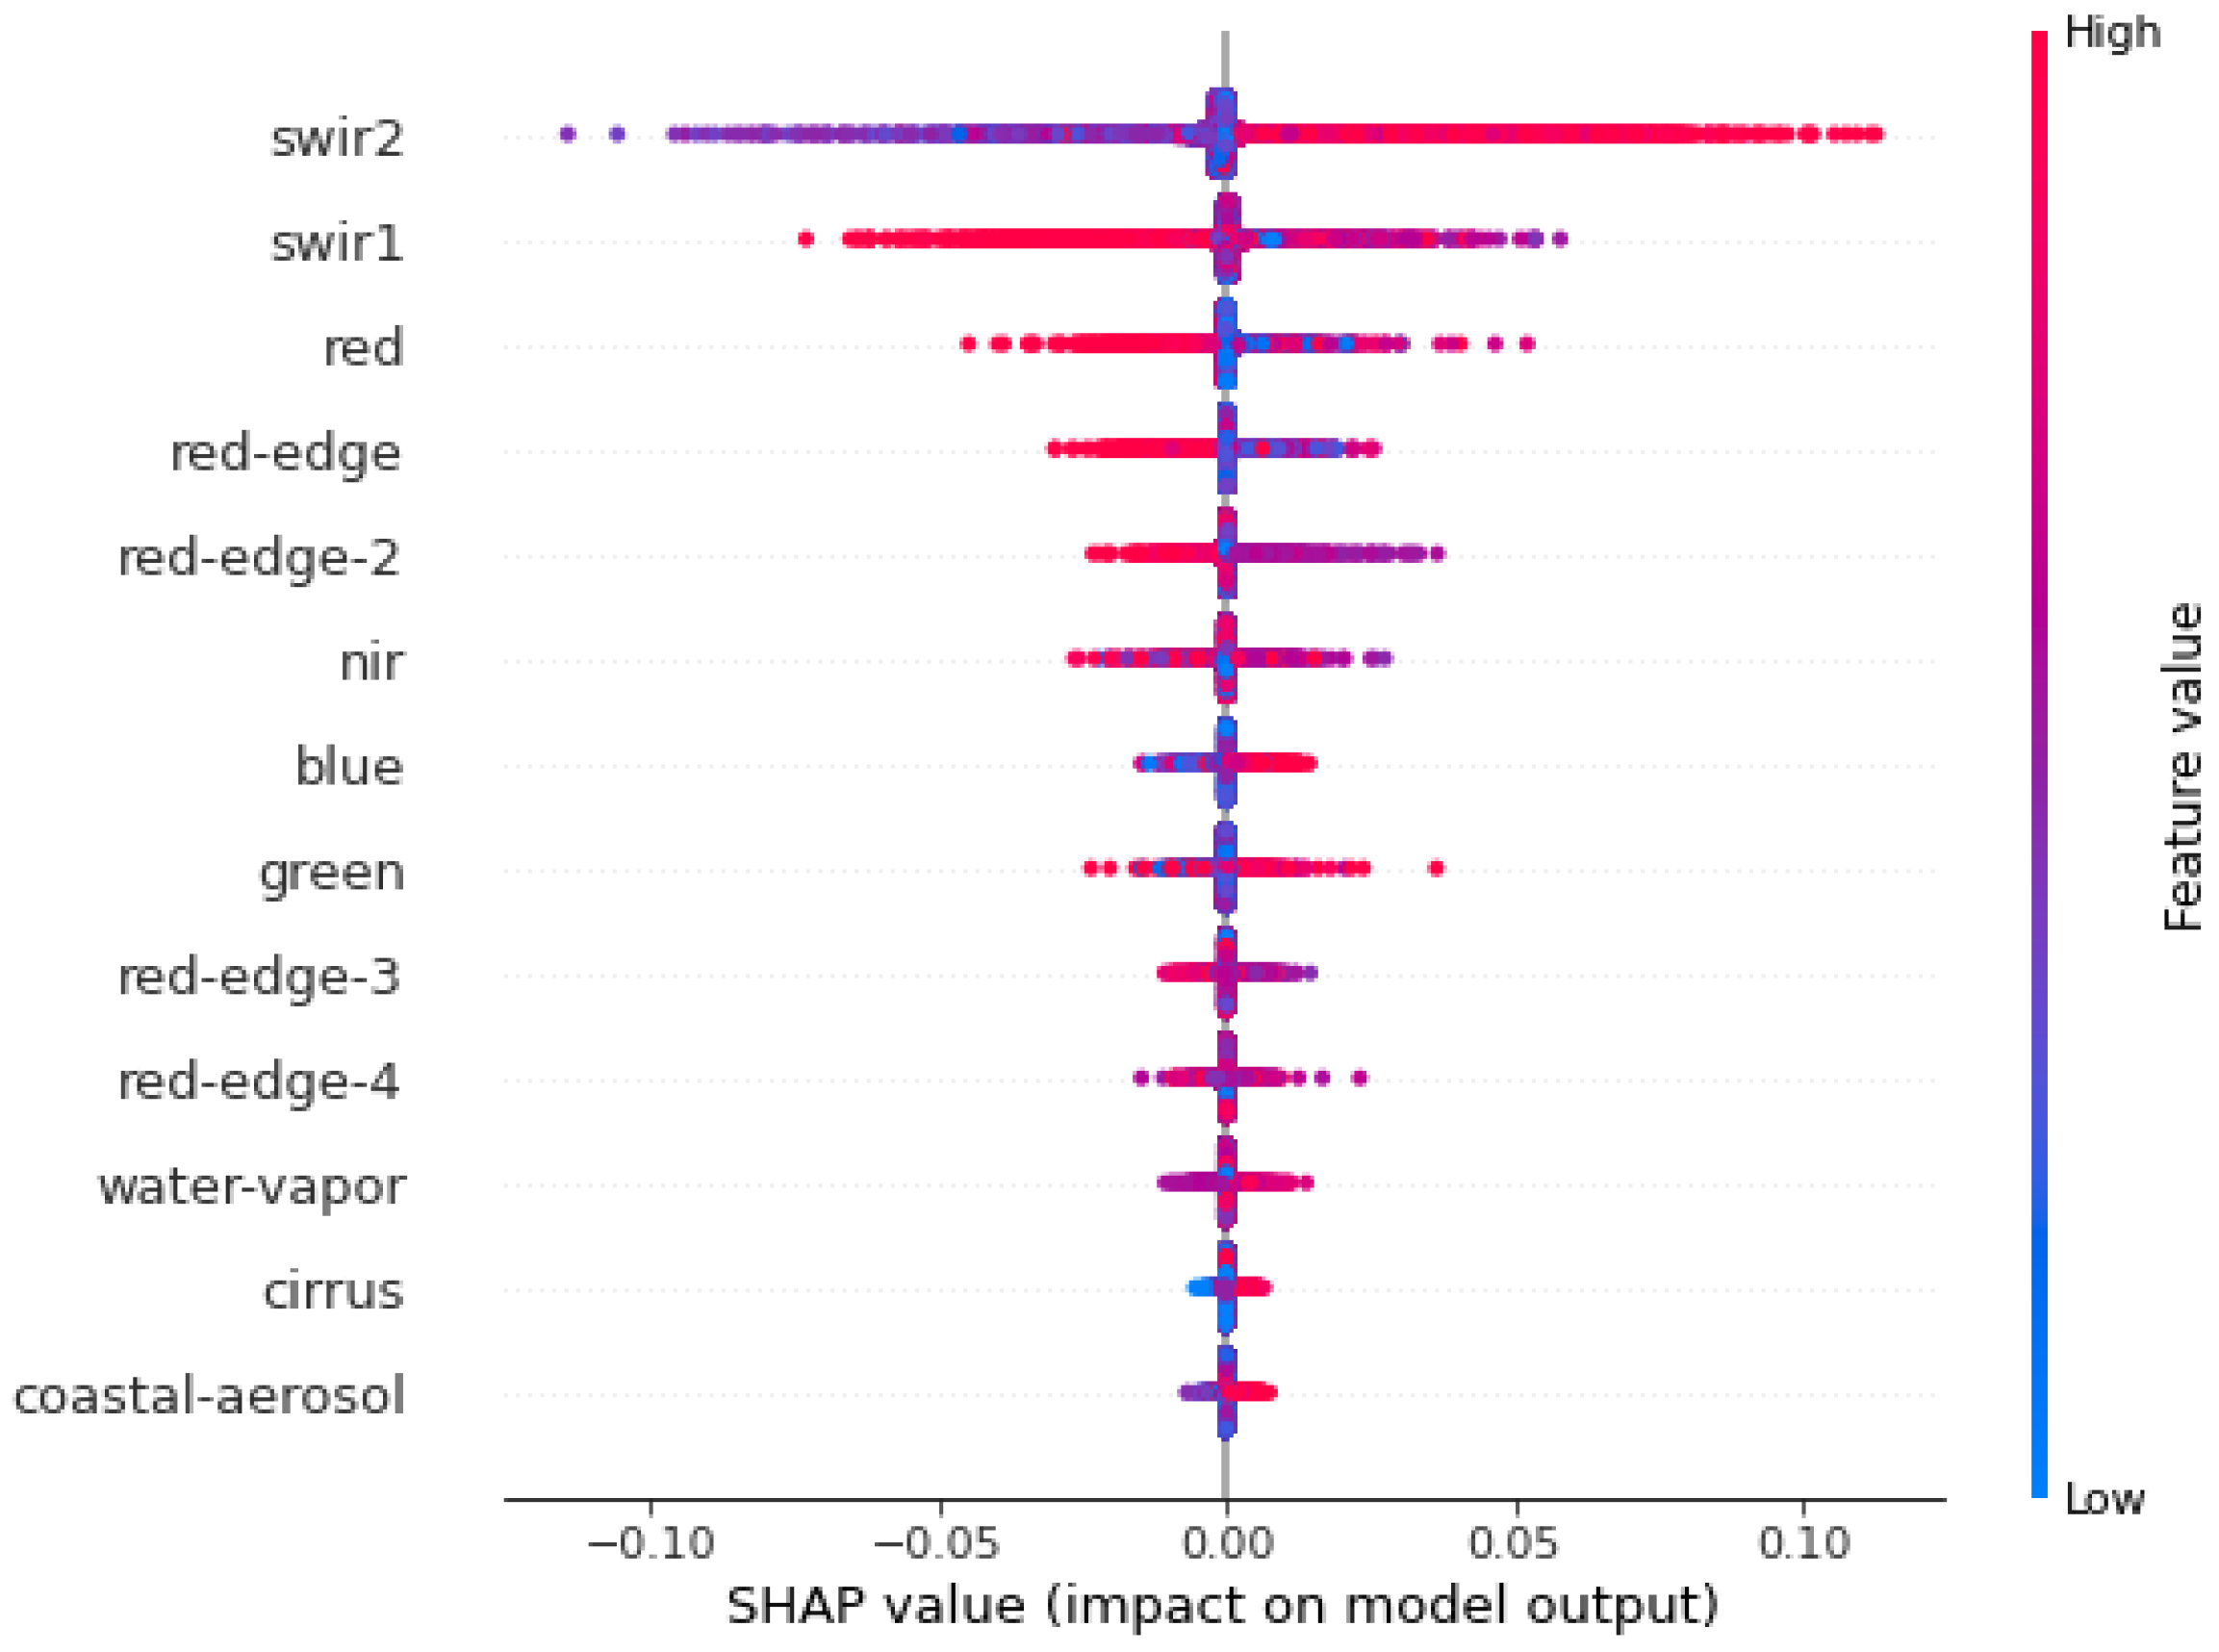
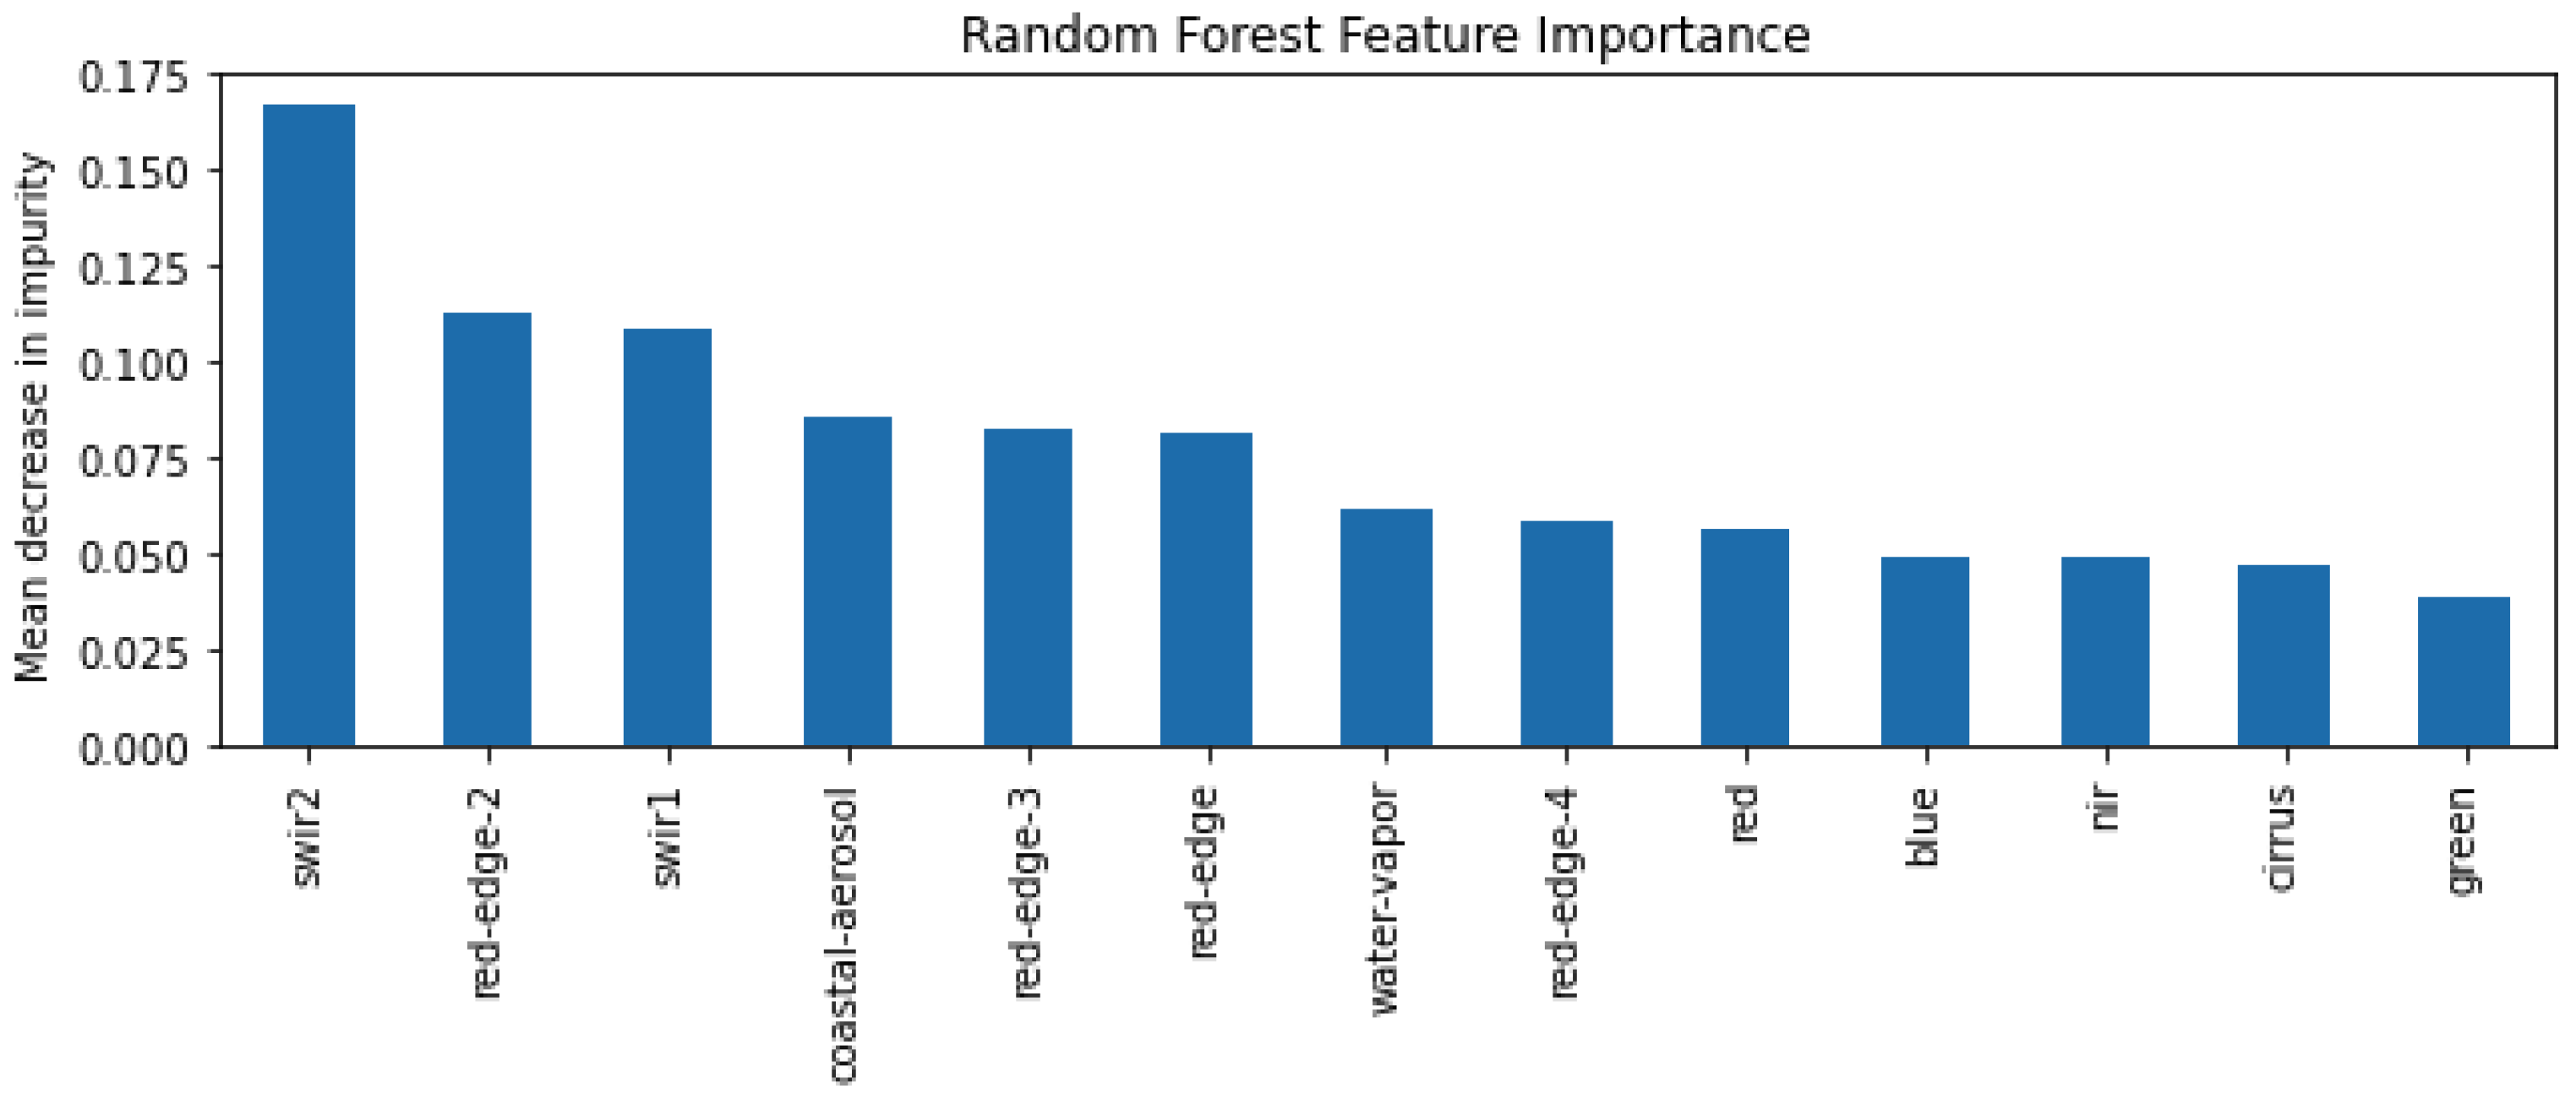
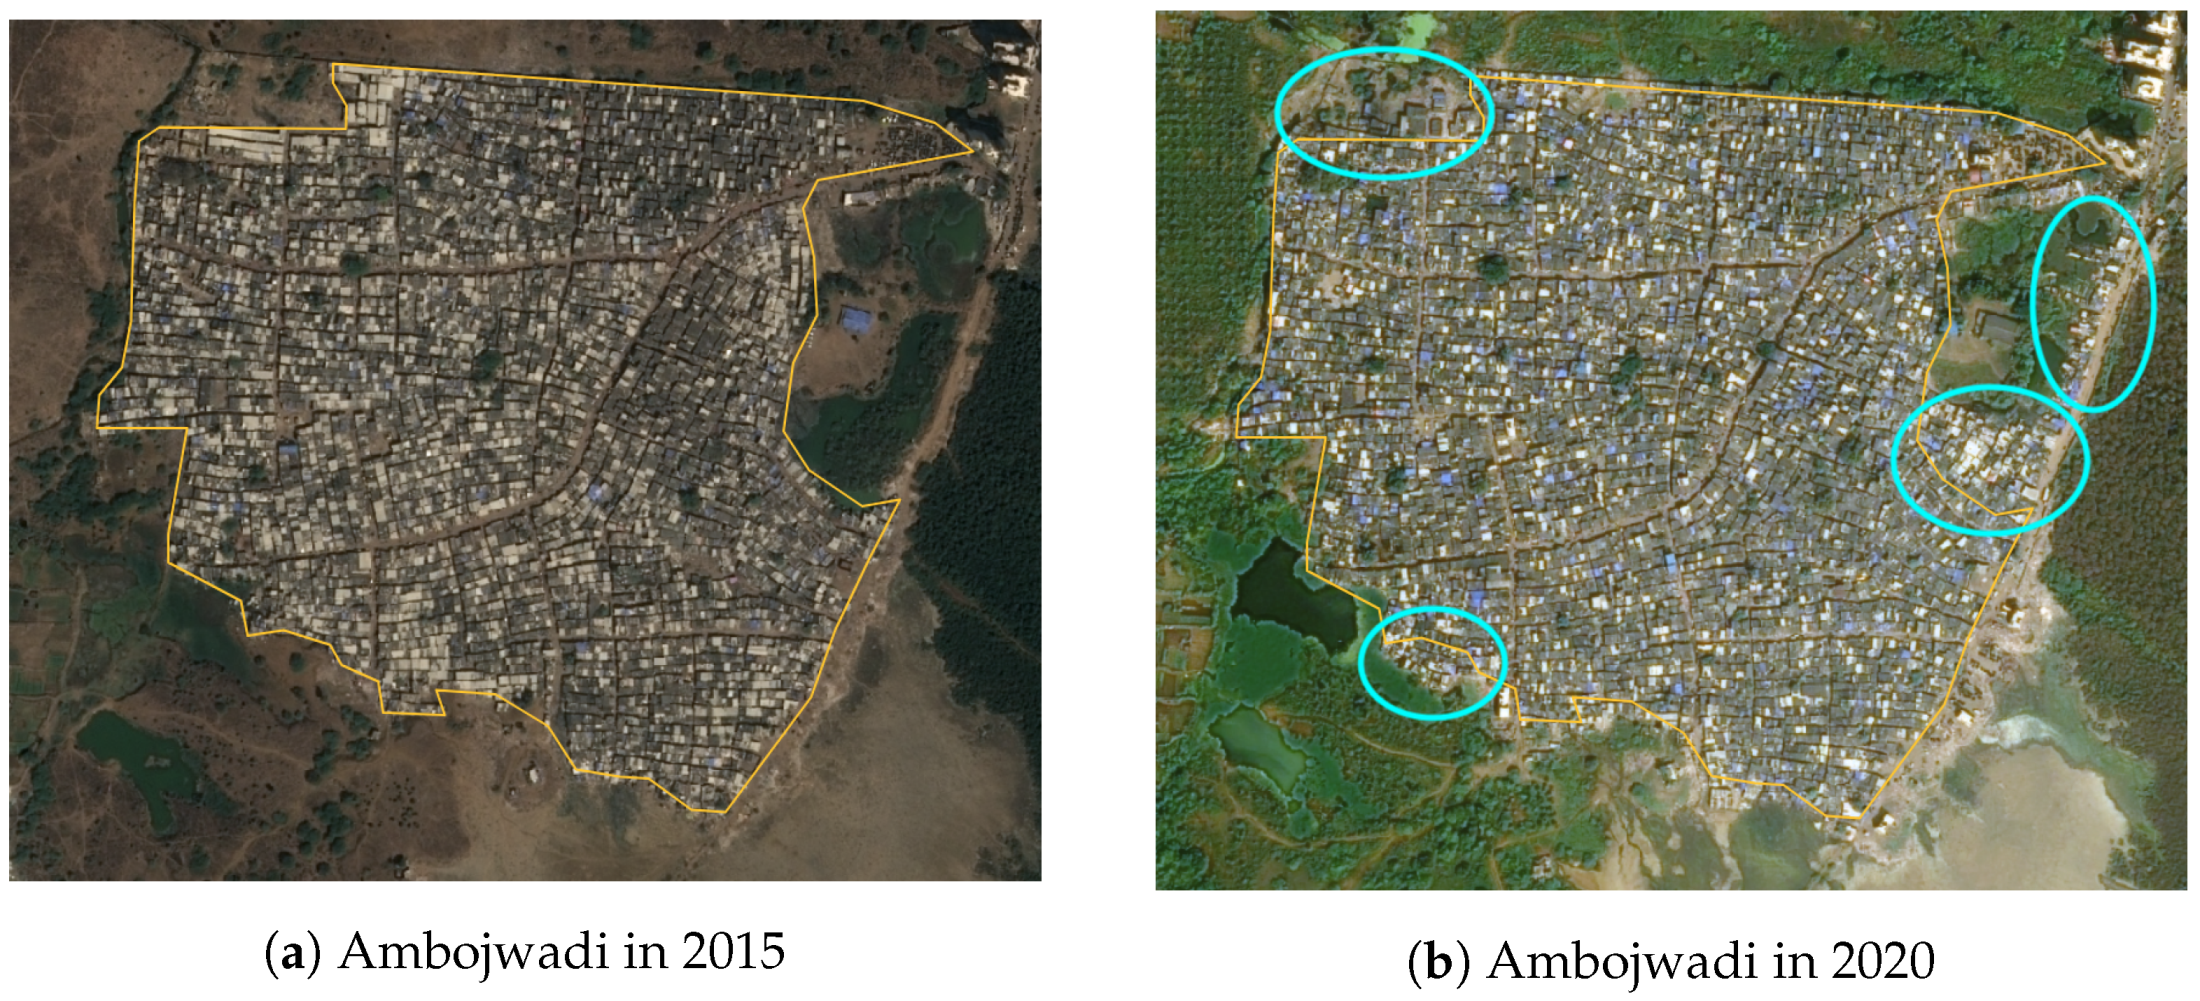
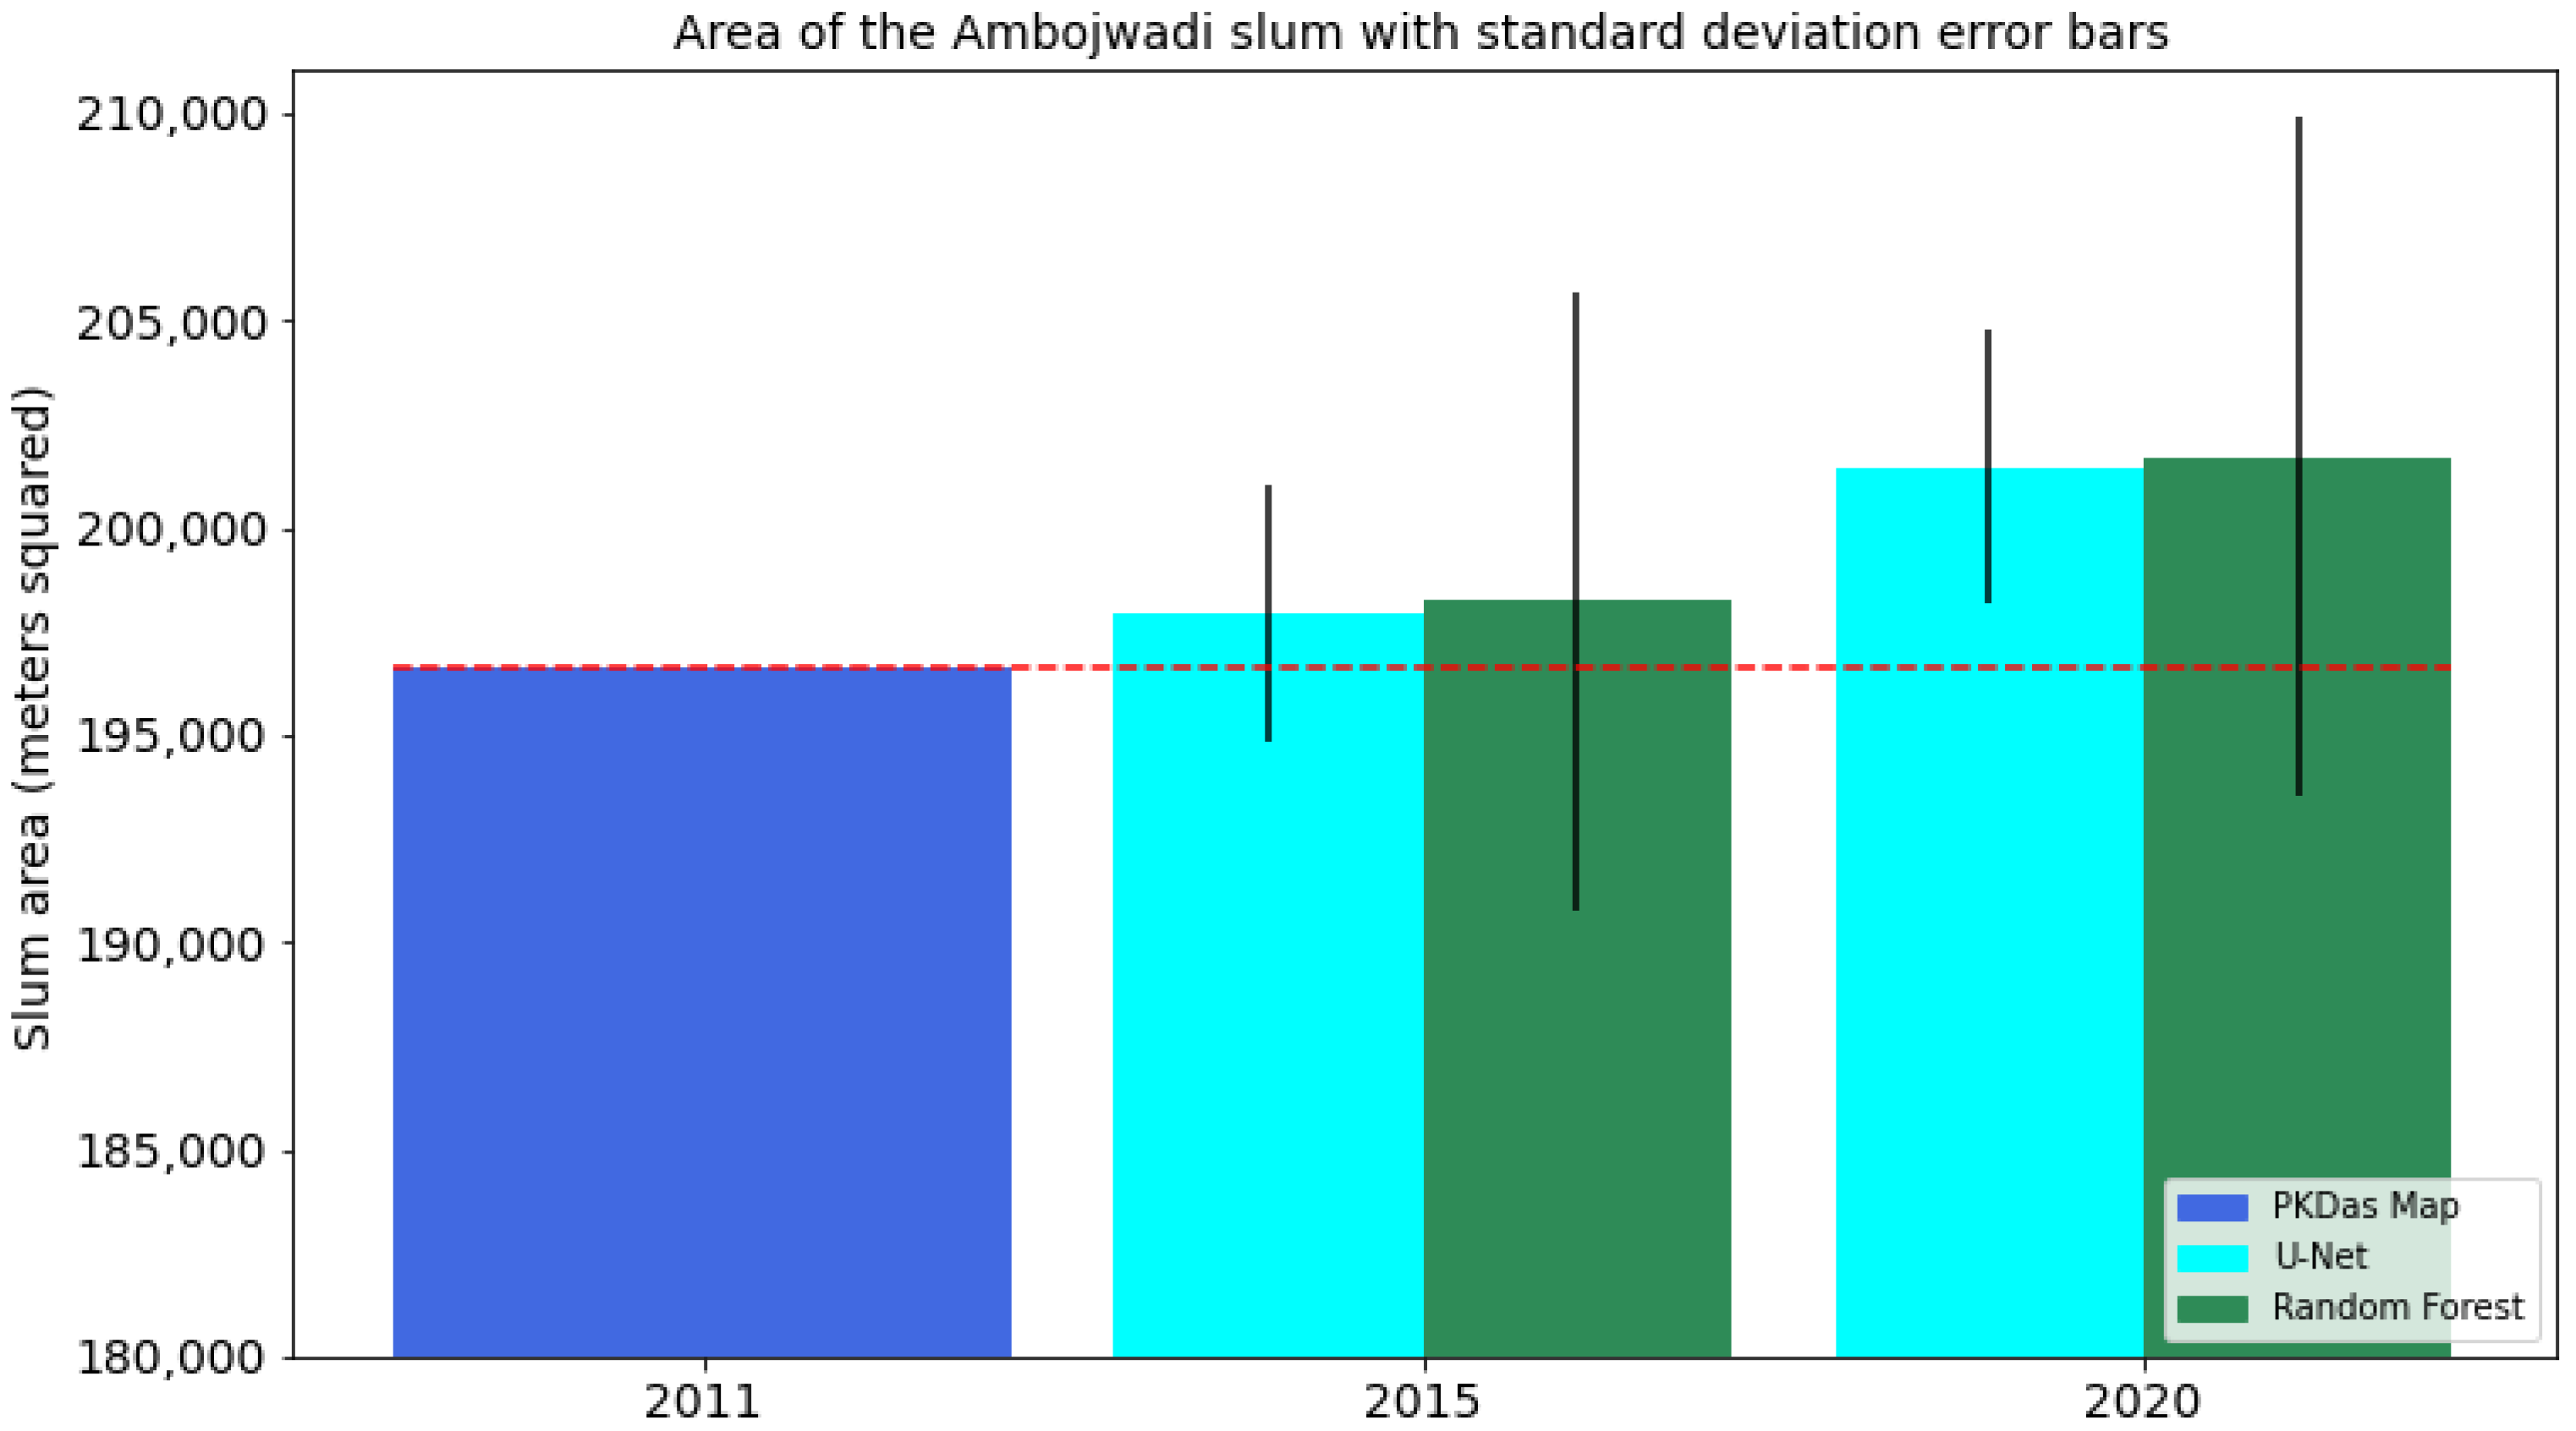
  • We investigate the interpretability of the models and show that certain multispectral bands, particularly a shortwave infrared band, are the most powerful features for both the U-Net and Random Forest models. We demonstrate the strength of our U-Net model with a slum area monitoring example, showing that knowledge of the uncertainty provides us with much greater confidence in the application of the model.
The outline for this paper is as follows. The existing literature related to the slum mapping problem is reviewed in Section 2 focusing on papers working at high spatial resolutions of 10-m or better and the current literature gaps. Then, in Section 3 the proposed methodology is explained. Next, we outline our results in Section 4 where we compare our model to the current state-of-the-art technique. In Section 5 our results are discussed before concluding with the limitations of our approach and the findings of the paper in Section 6.

2. Literature Review

2.1. Slum Mapping without Uncertainty Quantification

The review paper [27] highlights important research progress in the numerous studies in the area of slum mapping from remotely sensed satellite imagery and shows that machine learning-based methods have displayed great promise for mapping slums. Currently, when using publicly available multispectral satellite images for 10-m or better spatial resolution slum mapping, the [32] model which uses decision trees represents the state-of-the-art. However, as recommended by [27], purely single pixel-based approaches like [32] should be avoided as they ignore the surrounding pixel context.
Whilst previously convolutional neural network (CNN) models (which incorporate surrounding pixel information when making predictions) have been used for slum mapping, to date, these models have been applied to expensive and not publicly available visual Red, Green, Blue (RGB) Very High Resolution (VHR) imagery [14,28,32,45] or have been used on publicly available images in ways that limit the strength of the models, for example classifying large boxes of pixels in a single classification [14] significantly sacrifice mapping resolution. Other multispectral models have been produced using free and publicly available satellite imagery but used single pixel-based approaches in the form of tree-based approaches [21,32]. To the best of our knowledge, there is no approach so far using surrounding pixel context information via convolutional network methods for free and publicly available multispectral image datasets.
It has generally been found that models trained in one slum display poor generalisation performance when evaluated on a different unseen slum. This is likely due to the variation in slum appearances caused by differing building materials or space constraints causing good model parameters to vary between geographical areas [26]. The rarity of quality training data and the interpretability and generalisability of models represent pressing problems that require further work in this area [27]. We think testing procedures used in the literature inflate test scores and so we use test datasets completely geographically separate from training datasets rather than including pixels or images from all over the geographical region of interest in both the test and training datasets.
Multiple studies have used traditional machine learning approaches and have obtained high test accuracy scores of around 90% on test datasets [21,46]. However, due to the imbalanced nature of the datasets involved with this problem (most pixels in the images representing non-slum land), these accuracy scores are not necessarily representative of strong generalisation ability.

2.2. Slum Mapping with Uncertainty Quantification

We emphasise that only frequentist (i.e., non-Bayesian) approaches have been taken [27,32] by authors implementing machine learning models. The frequentist approach means that one particular set of model weights is assumed to be optimal rather than taking a Bayesian approach where a posterior distribution of possible model predictions is considered. Previously machine learning model uncertainty has never been considered in works on the slum mapping problem, despite being called for by [27,32]. There are two studies which consider uncertainty in a basic way, however, neither obtain per-pixel uncertainty measurements for the obtained predictions.
In [7], the spatial (extensional) uncertainties in slum boundaries delineated by urban scientists on VHR maps were considered. Substantial variations in the predictions made were found among these human experts particularly at the boundaries of settlements, highlighting the importance of objectively quantifying the uncertainty of models for this task. With a traditional non-machine learning Object-Based Image Analysis (OBIA) approach and a focus on Jakarta, Indonesia, ref. [35] interviewed local experts to produce lists of common characteristics of slums in the area. These were converted into rule sets for different OBIA models. The level of agreement between the models was calculated as an integer confidence score out of five and used as a proxy for certainty, rather than a precise uncertainty value like can be obtained by modern computer vision models [36].
It has been repeatedly emphasised that understanding the levels of uncertainty is an important area of study and represents an important work to be done to improve machine learning slum mapping model interpretability and deployability [26,27,32,35]. We emphasise that, as far as we know, there are no existing machine learning models for slum mapping which have uncertainty quantification in the literature and so this motivates this aspect of our work.

3. Materials and Methods
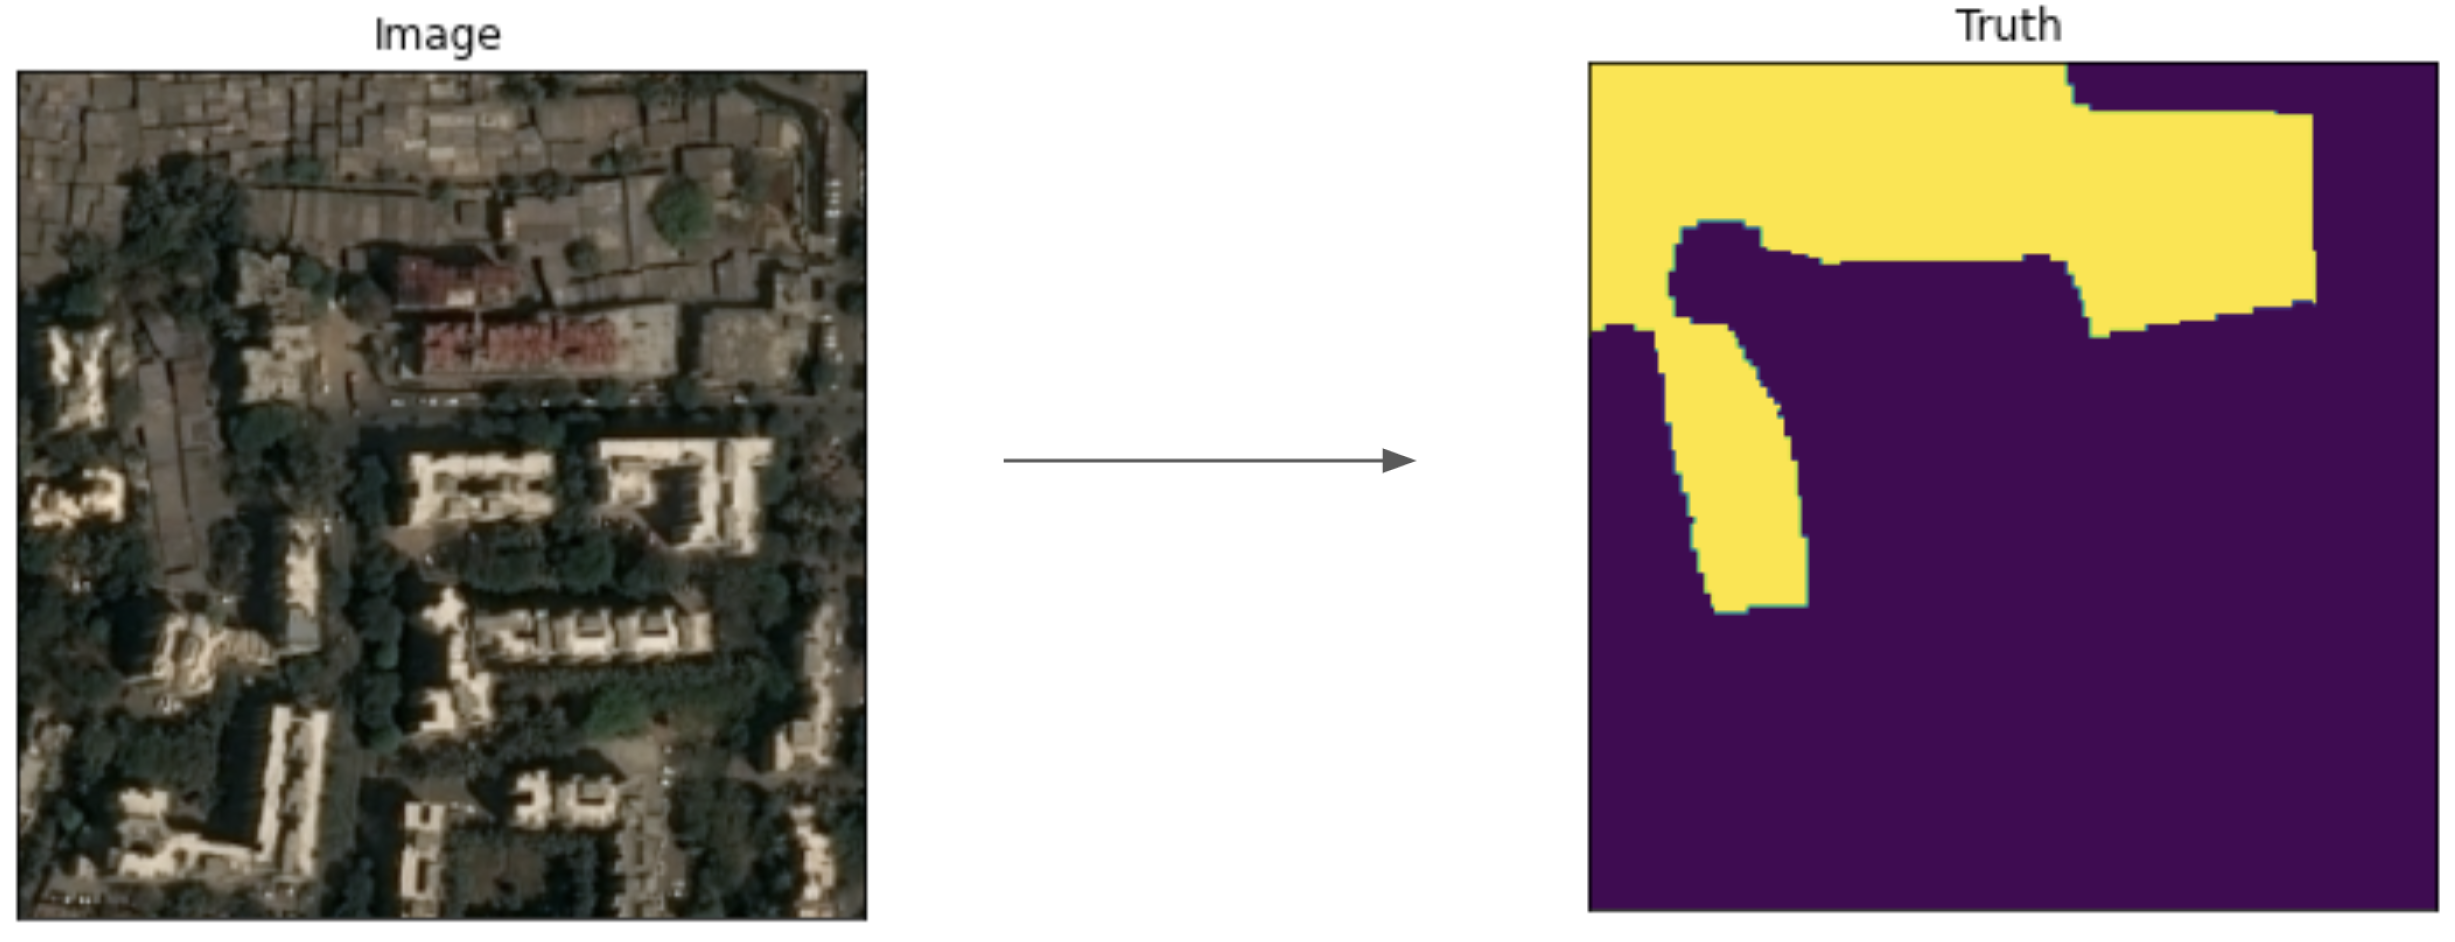
3.1. Dataset

In this paper, we focus on the city of Mumbai, India, where in 2011 P.K. Das & Associates produced an award-winning map of the city’s slums which can be viewed in Figure 1. Red areas denote slums, black lines denote roads and the yellow line indicates the boundary of the Greater Mumbai area. Light blue lines denote the boundaries between the regions that we use in our regional testing approach. This map is one of few high quality and comprehensive publicly available slum maps of large cities. Mumbai has been the focus of several slum mapping studies and for good reason. Mumbai is one of the most populated cities in the world with 20 million inhabitants. The city spans a vast geographical area of 4355 km 2 and is home to one of the largest slum-dwelling populations anywhere in the world at around 6.5 million people [47]. Over 80% of these slum dwellers live on lands unsuitable for development like marshland, hills or along railways. Our dataset is comprehensive for the Greater Mumbai Region, providing much a stronger dataset than that used by [32], who report that their Mumbai map is less than 75% complete. We used 10-meter resolution 13-band multispectral imagery from January 2015 to December 2020 from the Sentinel-2 satellite and processed by Descartes Labs.
We chose this data because the image data is freely available through the European Space Agency (https://sentinel.esa.int/web/sentinel/sentinel-data-access (accessed on 16 June 2022)) it contains multispectral bands to allow us to provide models with data from outside the visible spectrum and is of a high resolution allowing for mapping to a fine level of granularity. We tiled the Mumbai region, using square tiles with a width of 64 pixels with 2 pixels of padding. Details of the dataset creation process can be found in the Supplementary Materials and the code is available on GitHub (https://github.com/harry-gibson/dl_image_segmentation (accessed on 16 June 2022)).

3.2. Problem Statement

This study uses a dataset of N = 1335 image-target pairs D = { ( x i , y i ) : i = 1 , . . . , N } from Mumbai where the target y i is a binary array corresponding to and of the same dimensions as x i , with 0 values representing non-slum and 1 values for slum. The targets are obtained as ground truth data from the P.K. Das map made in collaboration with local authorities [48]. Figure 2 shows an example image x on the left and the corresponding target y on the right. A good model will output high probabilities for pixels that are slum (shown in yellow in the ground-truth image on the right in Figure 2) and low probabilities for pixels that are not slum (shown in dark purple).

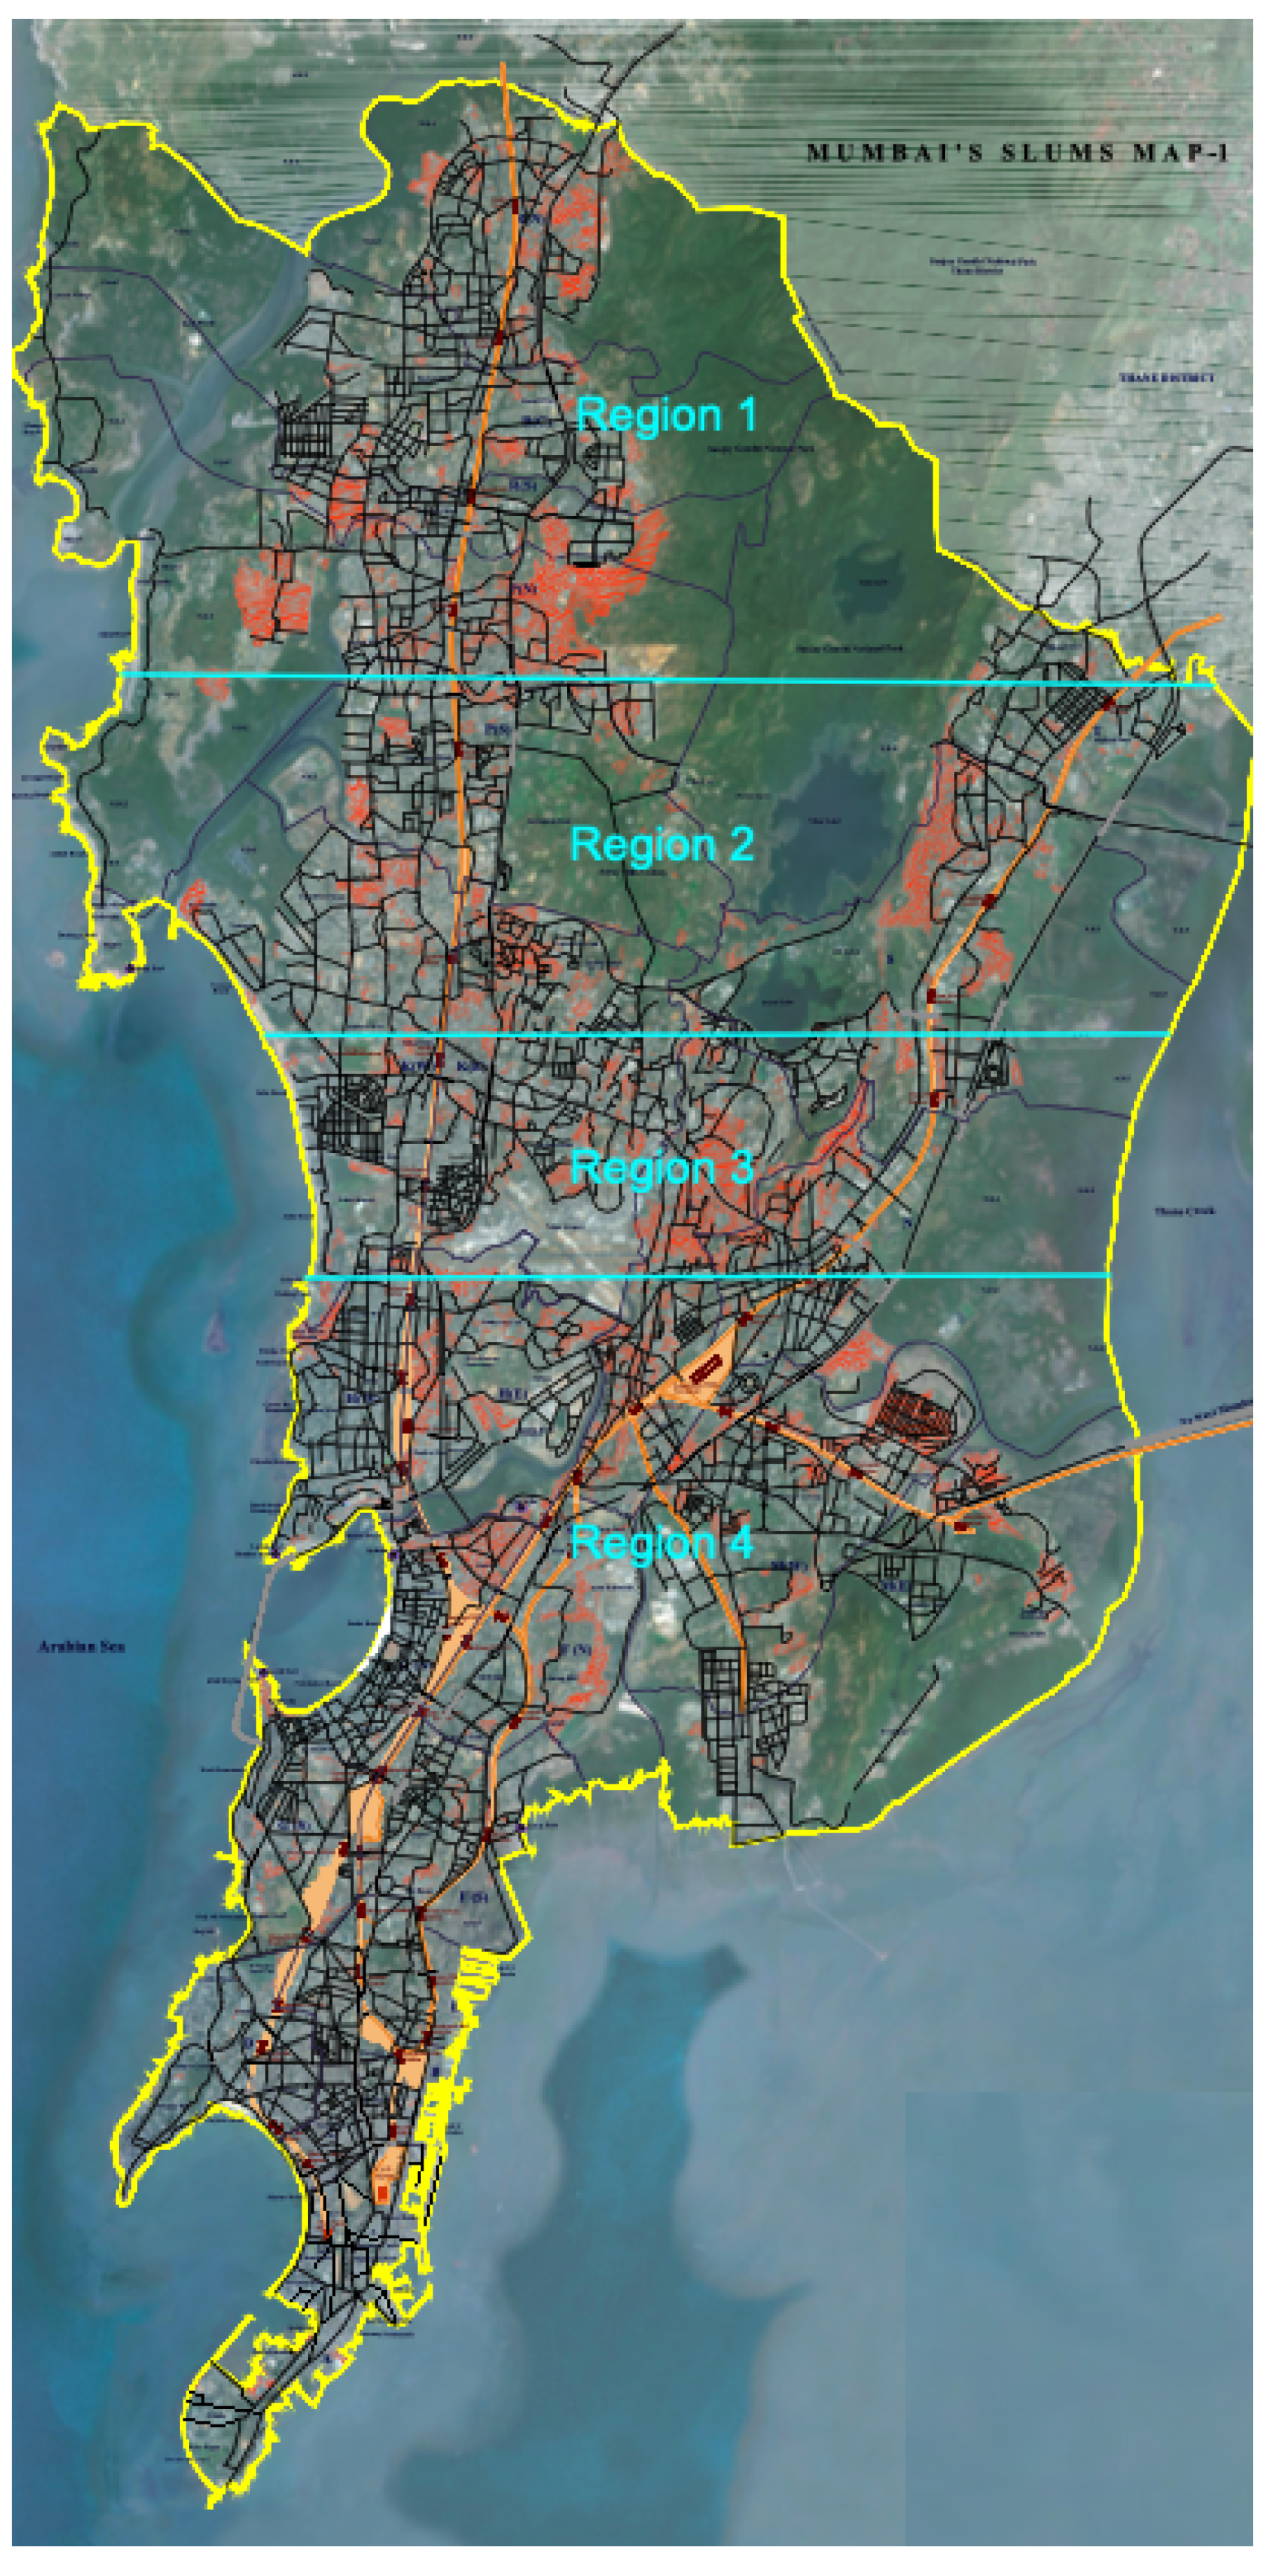
3.3. Regional Testing

We measure the performance of the models using our regional testing approach which we explain here. We split the dataset of images into four geographical regions as shown in Figure 1 with the regions chosen so that each contains roughly the same number of slum pixels. To perform regional testing we use a leave one out approach, with the specific region which has not been included in the training and validation set being used as unseen test data. For example the AUPRC scores reported for Region 1 correspond to the performance from a model trained and validated on data from Regions 2, 3, and 4 that was tested on Region 1. Using random data splits can result in the model being trained in close geographic proximity to where it is being tested, which is not representative of how models generalise. Pixel-level splitting into train and test sets would result in an even more significant mixing of the two sets at a more local level. Regional testing provides a more rigorous and representative form of model testing, indicating better how well models perform in unseen geographical regions.

3.4. Metrics

As the dataset is highly imbalanced with many more not-slum pixels than slum pixels, accuracy alone is not a good measure of the performance of a model—only about 10% of the pixels in the dataset are slum. To address this issue, we use the Area Under the Precision-Recall Curve (AUPRC) and the uncertainty explained in Section as metrics to distinguish between models. We use the AUPRC as it is typically more informative than the Area Under the Receiver Operator Characteristic (AUROC) for imbalanced datasets and does not give a false sense of high performance on imbalanced classification tasks [49].

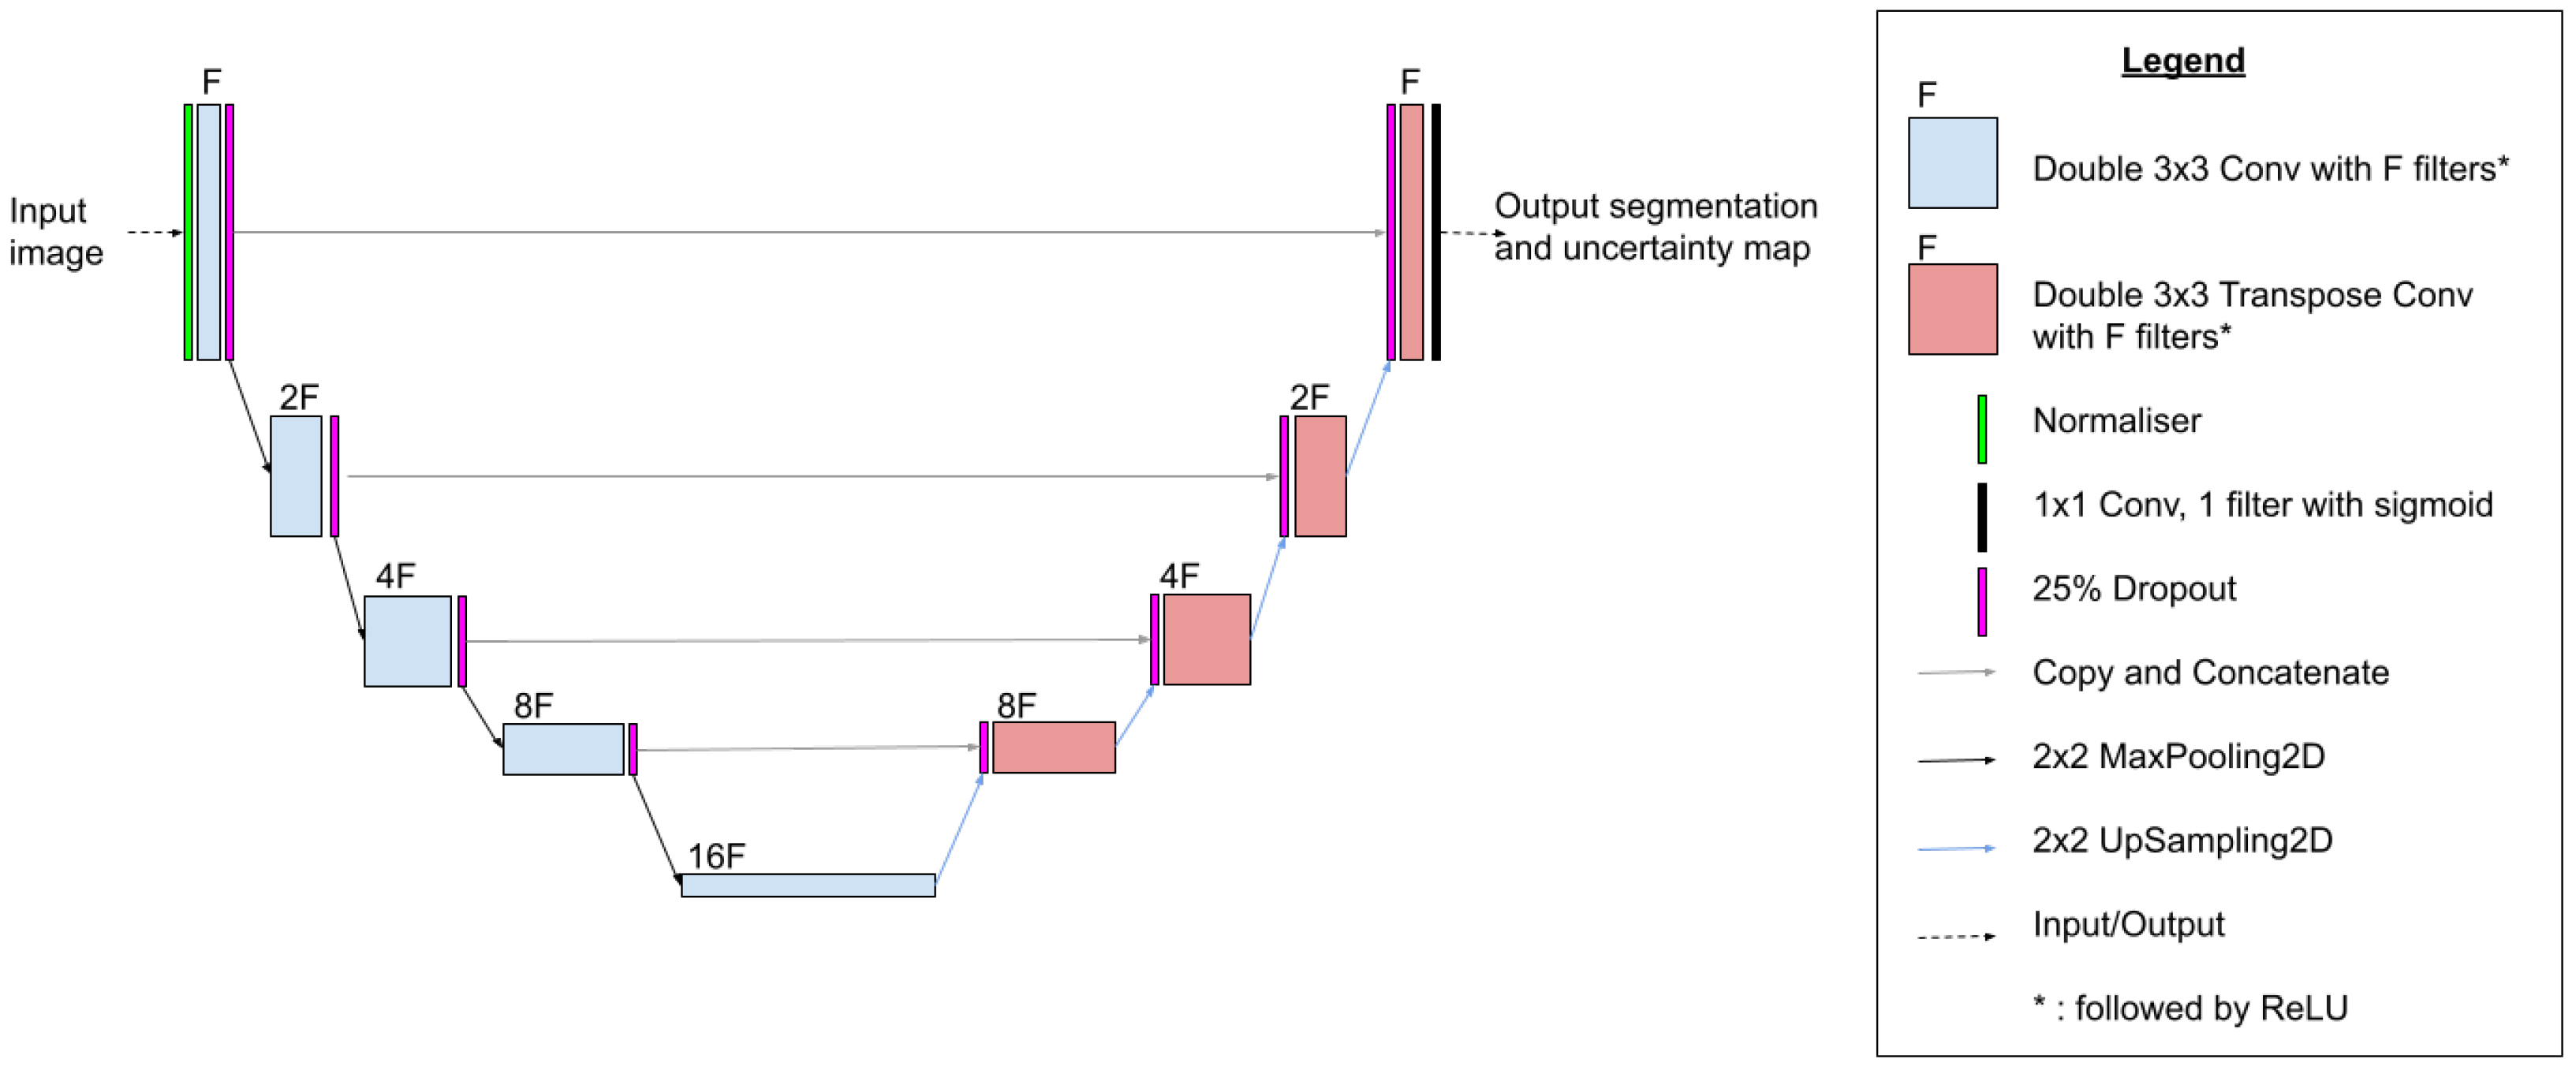
3.5. Proposed Uncertainty-Aware U-Net

Our model is based on the U-Net architecture that was initially proposed by [50] and has seen successful application in various image segmentation tasks. This model uses a convolutional encoder-decoder architecture as shown in Figure 3 and therefore importantly uses information from surrounding pixel context as called for in the literature [27]. A normaliser trained on the training data is used to help the gradient descent process converge more quickly during training. The Adam optimiser [51] with an initial learning rate 0.001 with 100 epochs of training and a batch size of 128 was used. We used F = 32 in Figure 3 to set the number of filters for our U-Net model. We used the standard binary cross-entropy loss L BCE as the loss. For target and predicted segmentations y and y ^ of tiles with dimensions H × W and pixel values y h , w , y ^ h , w , the binary cross-entropy loss is is given by
L BCE ( y , y ^ ) = 1 H · W h = 1 , w = 1 H , W y h , w log ( y ^ h , w ) + ( 1 y h , w ) log ( ( 1 y ^ h , w ) )
We use Monte Carlo Dropout (MCD) [37,52,53] between every layer of the architecture which intuitively randomly turns off a proportion of weights in the model. Each of these different randomly dropped-out models make a slightly different prediction, which simulates the process of sampling from the distribution of the weights. Dropout also prevents overfitting during training [54].
In the following, we briefly explain MCD. For a training set D = x i , y i i = 1 N with inputs x i and target segmentations y i , and a neural network with parameters θ , we can think of the neural network as a conditional distribution p ( y | x , θ ) . Given a test image x * , the posterior predictive distribution is
p y * | x * , D = p y * | x * , θ p ( θ | D ) d θ ,
where p ( θ | D ) is a posterior distribution over θ given the training data.
The posterior predictive distribution is intractable to find analytically. We can approximate it by using MCD as introduced in [52]. For T models with dropout activated at test time to give different model parameters θ t and writing p ^ t : = p ( y * | x * , θ t ) we approximate
p y * | x * , D 1 T t = 1 T p ^ t
Using dropout in this way is preferable as it reduces computation whilst preventing overfitting during training [54]. MCD is explained further in [52,54,55]. We use 500 different dropout models times to sample a wide range of models from the distribution. The dropout rate for all the models was 0.25.

3.6. Baseline Model: Random Forest

Random Forest models [56] have seen successful widespread application to problems in remote sensing [57]. Tree-based models have been used for slum mapping from satellite images in several studies [21,32,46] including the current state-of-the-art slum mapping model for free and publicly available multispectral satellite imagery [32] which provides a state-of-the-art benchmark for comparison of our proposed model.
We used a 500 tree Random Forest model, with each tree having a maximum depth of 20 and a minimum leaf node size of 10 as the baseline model. Both of these hyperparameters effectively control the maximum depth and doing this improves generalisation by giving lower out-of-sample variance, reducing the likelihood of overfitting [58] and also ensuring that our probability estimates are more consistent and out-of-sample variance is lower [59]. As stated in [60], a 500-tree Random Forest provides equivalent performance to using a 15-tree Canonical Correlation Forest. Therefore the Canonical Correlation Forest model with 10 trees used by [32] to obtain the previous state-of-the-art in slum mapping from free and publicly available multispectral satellite imagery will have performance equivalent to or inferior to the Random Forest model we implement in this paper. This is because increasing the number of sub-models within the ensemble improves performance and reduces prediction variance [61].

3.7. Calculation of Uncertainty

In this study, we used moment-based predictive uncertainty as in [62], simplifying their calculations to our case where the model output probabilities are one-dimensional scalars rather than multi-dimensional probability vectors. This involves calculating the variance of an output given the predictive distribution of the output, which we approximate empirically. In our binary classification case where the dropout model with index t assigns probability p ^ t to the positive class as its final output for a particular pixel in a particular input image, we approximate the true underlying variational variance uncertainty distribution by:
Uncertainty = p ^ ¯ ( 1 p ^ ¯ )
where p ^ ¯ : = 1 T t = 1 T p ^ t for that pixel.
Gal in [55] showed that this plugged-in estimator converges in probability to the true variational variance when the number of models T becomes large. This calculation allows us to quantify the uncertainty as called for by [26].
For the Random Forest model, the p ^ t values are obtained as the individual probability assignments (calculated using the proportion of training classes within the tree node the test case resides in) to the positive slum class from each of the constituent decision trees within the forest. The Brier score [63] of the Random Forest probability predictions was not reduced by using isotonic or sigmoid calibration and hence calibration was not used. For our MCD-based U-Net model, the p ^ t values are obtained as the individual probability assignments to the positive slum class from each of the different dropout models.

3.8. Comparison Strategy

The approaches to slum mapping are different between the Random Forest and U-Net models. The Random Forest model takes as input the data from a specific pixel and uses this to classify it into slum and not-slum. This makes it a pixel based-approach. U-Net, however, segments a whole satellite image into a binary mask of slum and not-slum which is a whole-image segmentation approach. By considering the image as a bag of pixels we make these two approaches comparable by only looking at the pixel level to see the AUPRC score uncertainties for each model.

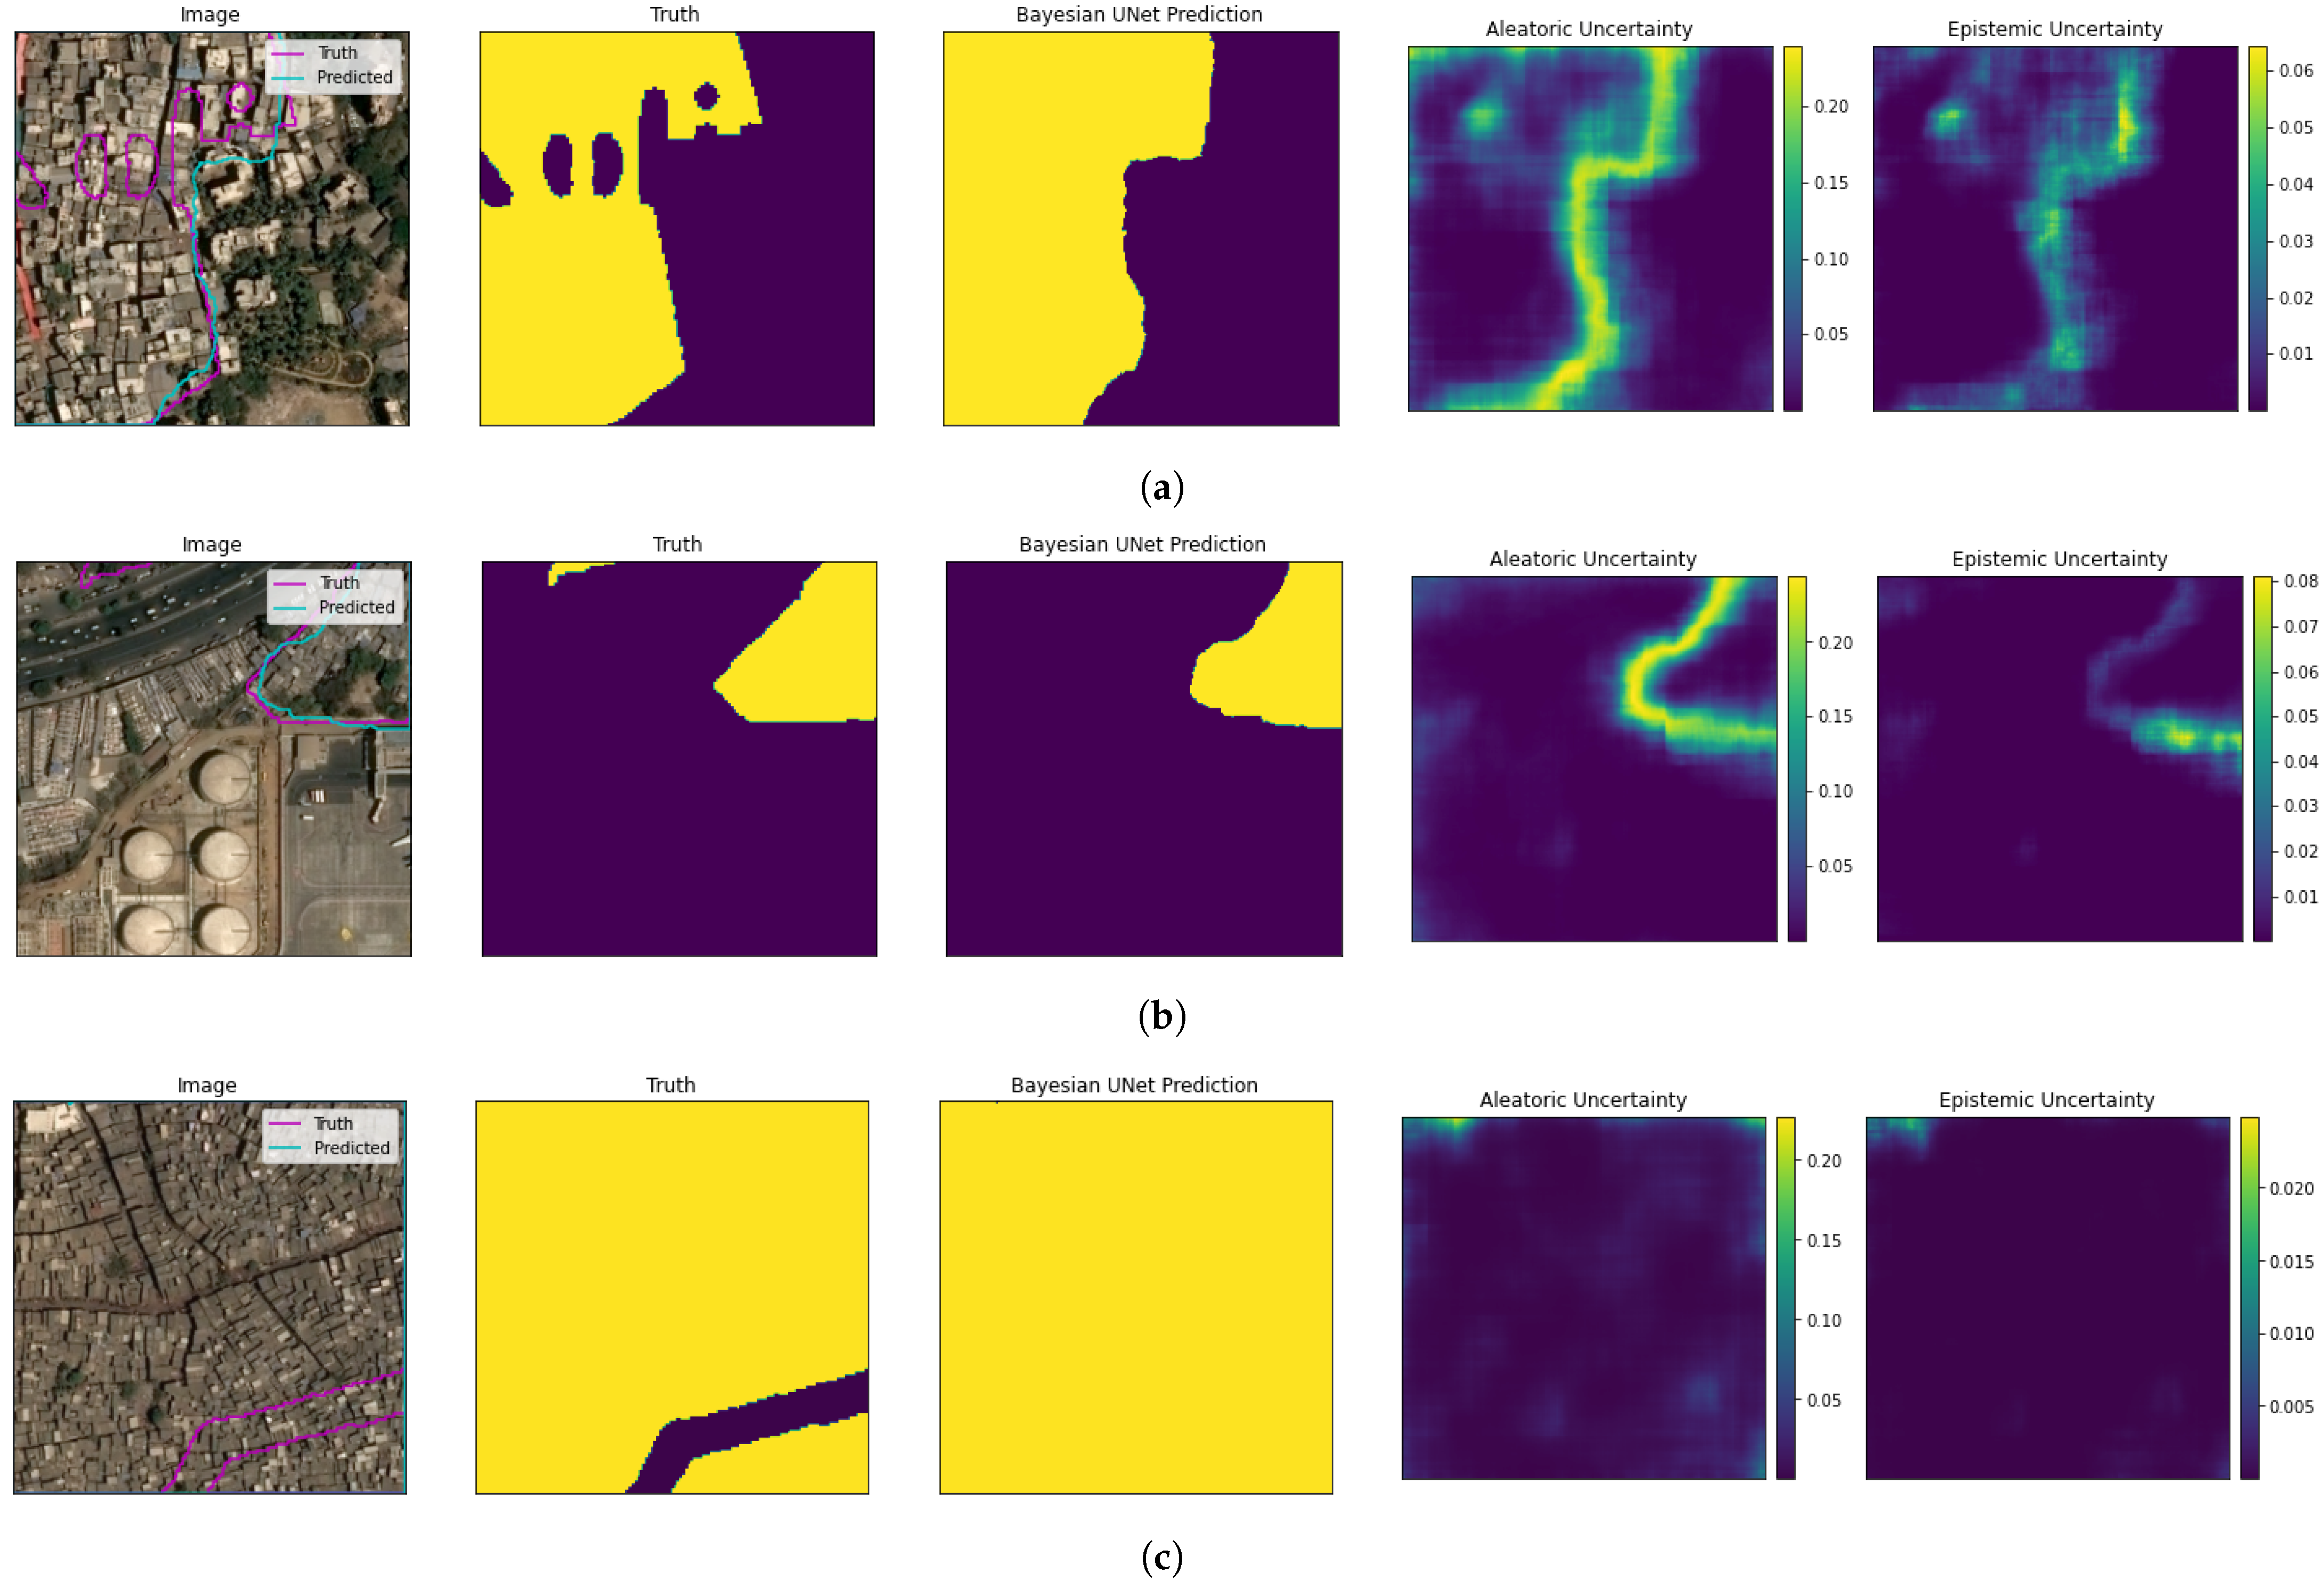
3.9. Example U-Net Model Predictions

Figure 4 shows some predictions made by the proposed model on three different tiles when a (non-optimised) classification threshold of 0.5 is used. Each row shows the tile, the ground truth label without masking (yellow denotes slum and dark purple denotes not slum), the Bayesian U-Net prediction along with the aleatoric and epistemic uncertainties. When added together, these two uncertainties form the overall uncertainty that we investigate in this paper. Note that we have shown very high 1-m resolution RGB images in the first column whilst 10-meter resolution multispectral images were actually used by the model. Figure 4c shows an example of ground truth mislabelling as a strip has been labelled as not-slum whilst appearing to be slum. Whilst mislabelling like this in the dataset does occur, the vast majority of the pixels appeared on visual inspection to be labelled correctly, providing the model with enough accurate training data. When the image is all slum or all not-slum like in the case of Figure 4c, it can be observed that the model predicts with very low uncertainty values almost at zero for every pixel in the image.

4. Results

We compare our uncertainty-based U-Net model described in Section 3.5 to the baseline Random Forest model described in Section 3.6. We use the Regional Testing approach as outlined in Section 3.3.

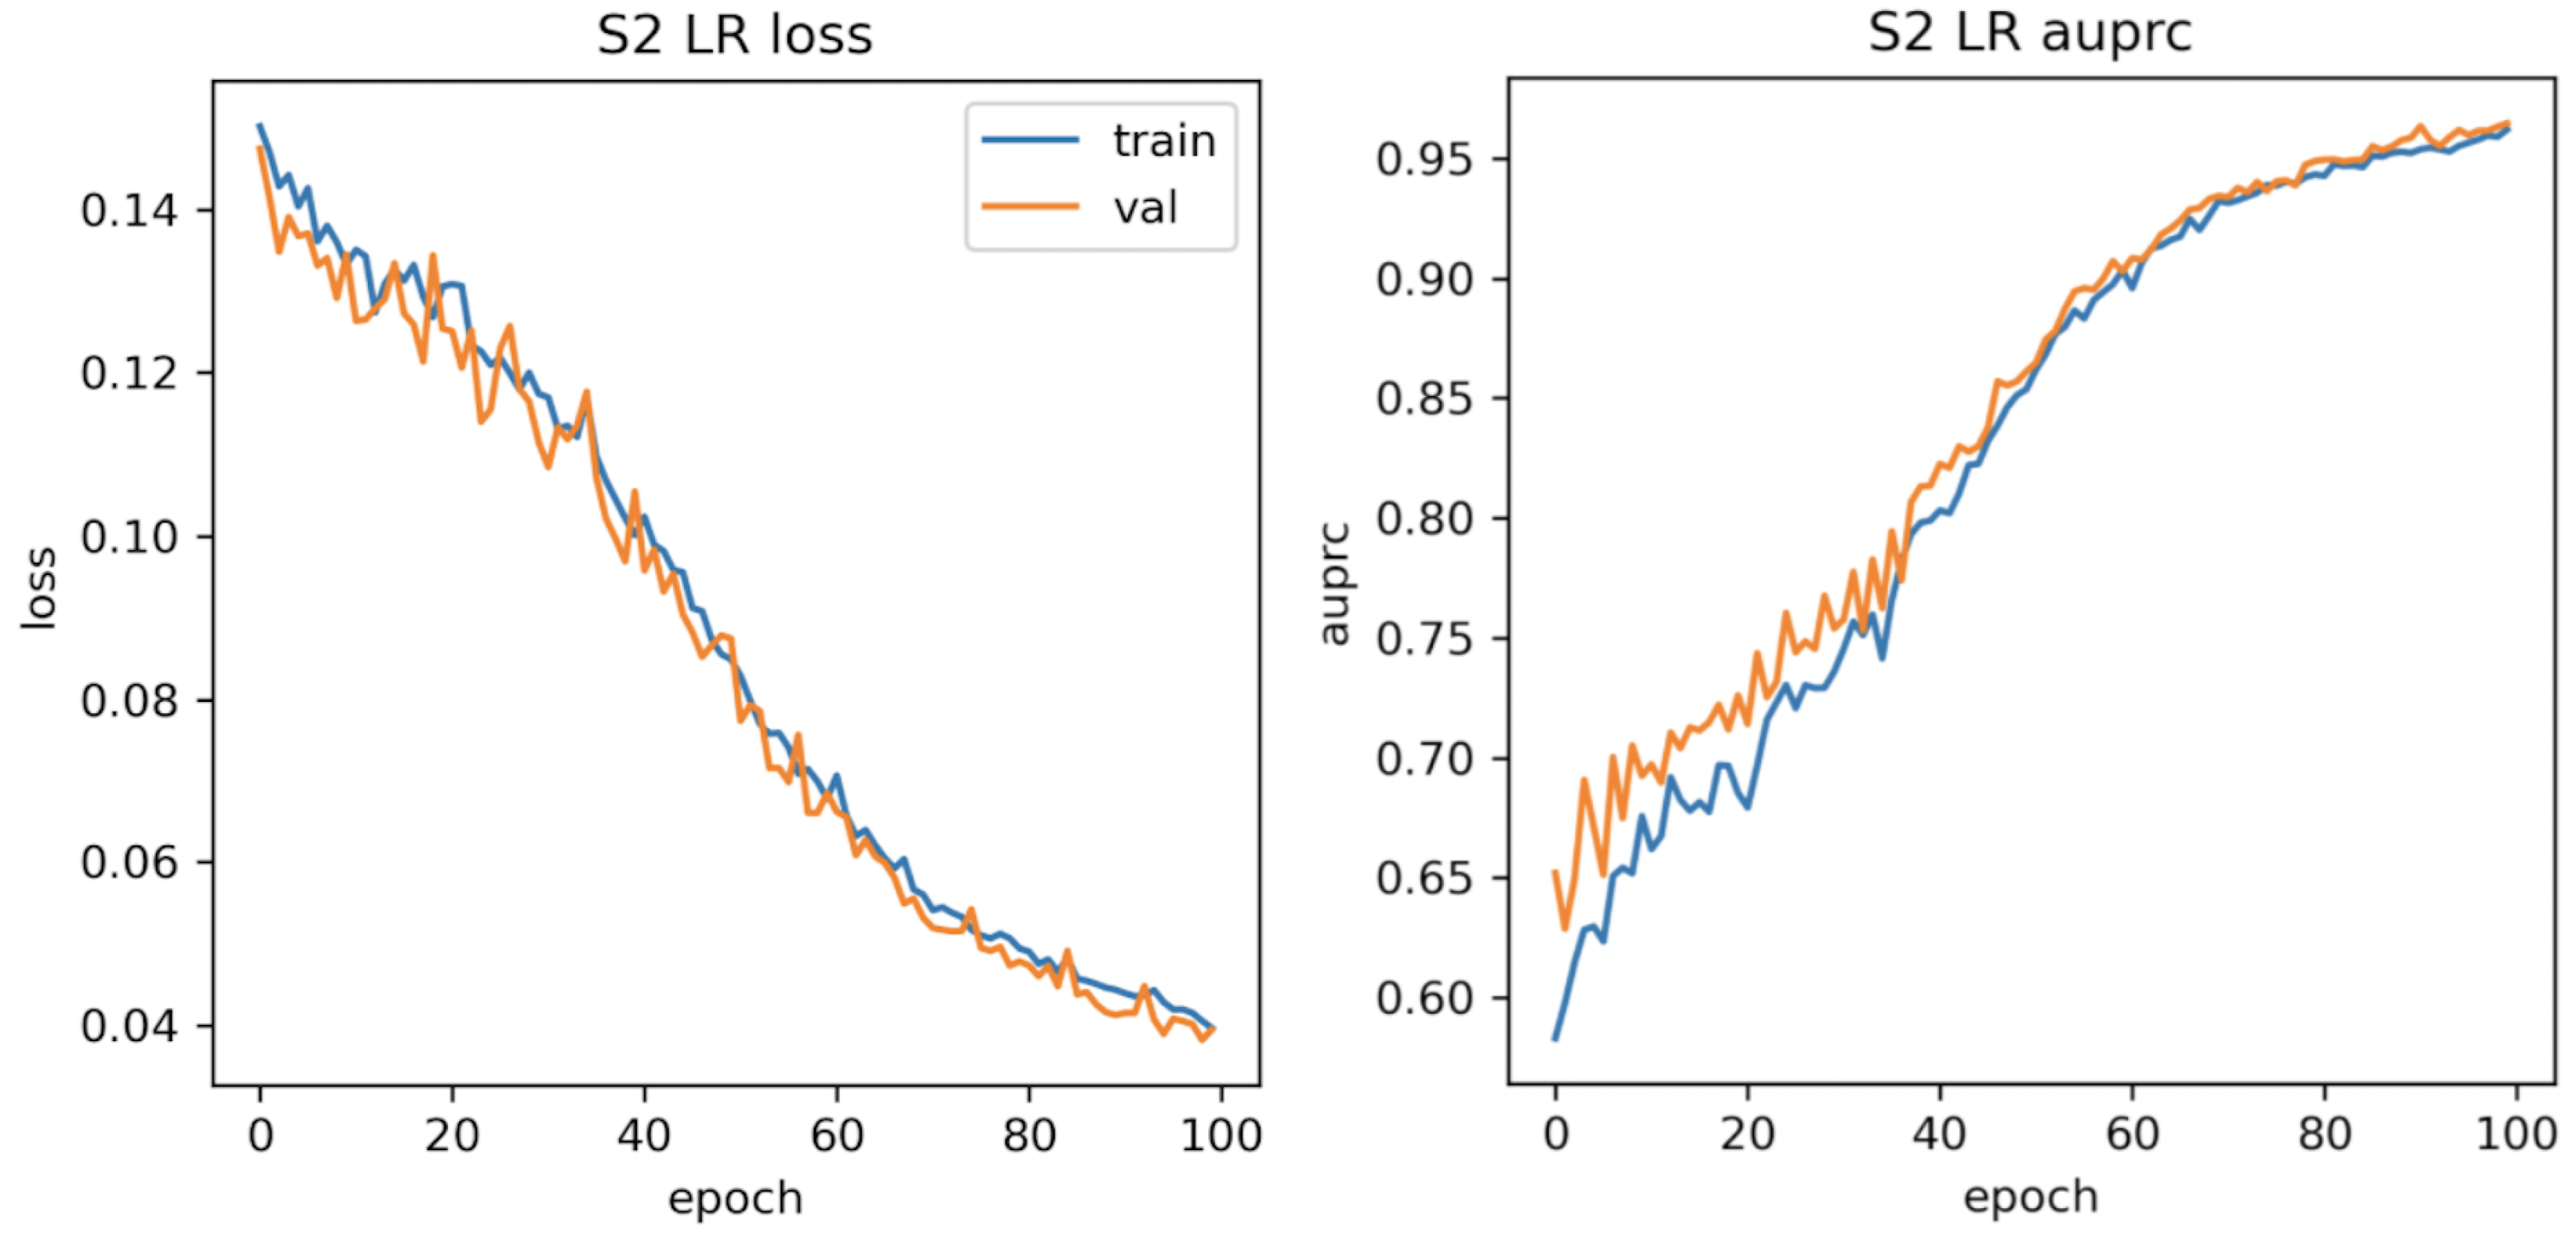
4.1. Regional Test AUPRC

The results for the models when measuring regional test AUPRC is presented in Table 1. The average across all regions is also shown. We see that the U-Net model consistently outperforms the Random Forest model in each region, resulting in a 9% improvement in the average regional test AUPRC score. Figure 5 shows the training history plots of the different metrics on the training and validation data for our U-Net model with MCD. Note that due to training the model using dropout, the validation metric values are often slightly higher than the corresponding training metric value at the same epoch. This is because at validation time dropout is not used during this validation process, resulting in a more robust model.

4.2. Regional Test Uncertainty

Table 2 shows the results for the models when measuring regional test uncertainty. The average across all regions is also shown. Information about the calculation of uncertainty can be found in Section 3.7. We see that the U-Net model consistently significantly outperforms the Random Forest model in each region, with many orders of magnitude of improvement in average regional test uncertainty.

4.3. Model Interpretability

Usually, one of the main disadvantages of using different deep learning architectures like U-Net is the lack of model interpretability available. We overcome this by calculating the SHapley Additive exPlanations (SHAP) values [33] of our model on test set pixels (pixels from Region 1 when trained on Regions 2, 3 and 4) to interpret our U-Net model and gain insight into how our model associates different input feature values with outputs. By using SHAP values we can obtain information about both feature importance and the influence of feature values on predictions. The multispectral data in Sentinel-2 satellite images contain bands of shortwave infrared (swir) and red-edge (the region in the spectrum between red and near infrared light), and these regions are each split into multiple smaller bands which are measured by the imaging equipment on the satellite, denoted by a number (e.g., swir2). Figure 6 shows a summary plot for the SHAP values. Each dot represents a test set pixel and features are ranked vertically in descending order of feature importance. The horizontal position of the dots represents the feature impact on the prediction using the SHAP value. The colour of the dot represents whether the feature value is high or low for that pixel. We can read off the five most important features from Figure 6 as swir2, swir1, red, red-edge and red-edge-2. We can see that there is a trend shown in Figure 6 that higher values of swir2 intensity generally have positive SHAP values indicating an association between the model being more likely to predict high outputs indicating slum and high values in the swir2 band. This is because the model outputs a sigmoid value in [ 0 , 1 ] where values closer to 0 indicate a higher probability of not-slum and values closer to 1 indicate a higher probability of the slum class.
Higher values of swir1 intensity generally have negative SHAP values indicating an association between the model being more likely to predict not-slum and high values in the swir1 band. We can see that the other three of the five most important features (red, red-edge and red-edge-2) have a similar impact on the model output to swir1: higher values in these bands are associated with lower model output which represents the pixel being more likely to be in the not-slum class. We also analysed the feature importance of the bands in the Random Forest model by using the mean decrease in impurity after training on Regions 2,3 and 4. The results of this are displayed in Figure 7 which shows that swir2, red-edge-2 and swir1 are the most important features used by the Random Forest model.

4.4. Slum Area Monitoring

We use a real-world application to demonstrate the usefulness of slum mapping models with uncertainty quantification. We use the models to track changes in the areas of slums, a task that has significant applications to humanitarian aid [30]. We used satellite images from different years and used our models to predict where the slums are situated within the images. Similarly to [25], we investigate a particular area of interest, choosing the Ambojwadi slum which shows noticeable growth between 2011 and 2020. Images of the area of interest were obtained annually between January 2015 and December 2020. We trained our models on images from the years 2015 to 2019 inclusive from outside the area of interest and then used them to predict on images of the area of interest from 2015 and 2020. By then comparing the 2011 ground truth [48] to the model predictions for the 2015 and 2020 images, we can see how the models detect slum areas to have changed over the decade.
The growth of Ambojwadi is shown in Figure 8 (with more buildings appearing as shown in the circled regions) and the detected area change with time for our Random Forest baseline model and our Monte Carlo Dropout U-Net model is shown in Figure 9. Note that the y-axis starts at 180,000 m squared. The total uncertainty in model predictions is represented by the black standard deviation error bars. The 2011 area has been calculated from the ground truth labelling when the region was surveyed. The red dotted line shows the 2011 slum area for reference. We can see in Figure 9 that both the U-Net and Random Forest models show similar predictions for the growth of the Ambojwadi slum between 2011 to 2020. The error bars representing the predictive uncertainty (in the form of the standard deviations of the predicted areas by the population of 500 sampled MCD models and Random Forest of 500 trees, respectively) show that between 2011 and 2015 both models detect a small amount of growth but not at a level where we can be confident—the error bars for both models overlap with the red dotted line which shows the 2011 area. Hence we cannot conclude with confidence that either model has detected genuine change in the slum area between 2011 and 2015. But in 2020, Figure 9 shows that both of the models show predicted areas noticeably higher than in 2011 but the Random Forest model still has an error bar overlap with the 2011 area. However, the U-Net model shows no overlap in the error bar for its 2020 prediction with the 2011 area, representing a confident detection of the increase in the Ambojwadi slum area by 2020.

5. Discussion

Figure 9 emphasises the advantage of using our uncertainty quantified model, allowing us to make confident conclusions about a definite increase in slum area in the Ambojwadi region with our U-Net model showing no overlap of error bar from its 2020 prediction with the original 2011 area. This demonstrates the potential of our proposed slum mapping model for decision-making in policy and infrastructure to support slum residents. In addition, Table 1 demonstrates the significant improvement in test AUPRC when using our U-Net model as opposed to tree-based methods. These types of deep models generally outperform more traditional machine learning algorithms in vision problems [64] and taking into account local pixel context in the form of convolutions benefits the model by providing more information for the model to use when determining pixel output, agreeing with [27]. We used AUPRC as it measures the overall performance of the models without requiring a threshold to be chosen and is much less influenced by the imbalanced dataset than other metrics like AUROC. We believe that it is important that AUPRC is used to compare models in the future to allow for consistent benchmarking for this problem. Note that the AUPRC scores obtained for Region 1 are the lowest for both models, so models tested on this region after training on the other three struggle the most. This is indicative that Region 1 is least similar to the other regions in terms of slum appearance and features. Whilst this does show that our model, like all models, can struggle with generalisability, using our regional testing cross-validation approach at least gives us a more representative idea of how well the models perform on geographical areas of unseen data.
Table 2 shows that the regional test set predictive uncertainty of the applied U-Net model is orders of magnitude lower than the tree-based method. The U-Net model takes into consideration surrounding pixel information, unlike the individual pixel-based approach used by the tree-based model. Note that Region 1 shows the highest uncertainty scores for both models, emphasising that this region is least similar to the others, with models trained on other regions being less certain about their predictions on this region. It is reassuring that the model is not more confident in its predictions here than for other regions where it is more accurate, unlike the findings of [35] where the agreement (a proxy for model uncertainty) between their rule-based OBIA models was associated with lower predictive performance. Note that in Figure 9 we can see proportionally higher uncertainty in our models than in Table 1 as slum boundaries are the highest uncertainty pixels and these make up a much larger proportion of the Ambojwadi region of interest compared to the four large geographical regions that we used in our regional testing framework.
Figure 6 and Figure 7 agree with [65] who found that information about the material composition of buildings can be determined with data resolved to the wavelength level with reflectance in shortwave infrared regions being a powerful predictor for remote sensing based land use classification. In our case, this can be interpreted as slums having a distinct signature in the shortwave infrared image band that is different from the signature of formal housing and this is learned by the model. These findings that shortwave infrared bands are the most powerful features align with the use of these features in the Normalized Difference Built-Up Index (NDBI) for distinguishing built-up areas [66]. The proposed model may use these infrared part of the spectrum to also gain information about the heat signature of slum dwellings which would typically be less well insulated than other building types.

6. Conclusions

This paper presented four main contributions. We presented our U-Net model which, to the best of our knowledge, represents the first deployment of a convolutional deep learning model to identify slums at the individual pixel level in free and publicly available multispectral satellite images. We tested our U-Net model against the previous state-of-the-art pixel-level model using our newly introduced regional testing approach. This testing method allowed for more representative performance scores to be obtained, measuring how well models generalise to unseen whole geographical regions and giving users greater confidence in applying the model. We incorporated uncertainty quantification at the pixel level by using Monte Carlo Dropout (MCD) in our U-Net model, the first time uncertainty quantification has been built into a machine-based slum mapping model. This produced uncertainty values that we measured alongside AUPRC within our regional testing framework, with the MCD U-Net achieving 9% improved regional test AUPRC and orders of magnitude lower regional test uncertainty compared to the previous state-of-the-art model. We, therefore, recommend the future deployment of our MCD U-Net model for slum mapping tasks as it has shown to achieve state-of-the-art performance. We demonstrated the strength of our U-Net model with a slum area monitoring example and showed that knowledge of the uncertainty provides us with much greater confidence in the model application. We investigated the feature importance and interpretability of our model using SHAP values and found that a certain shortwave infrared band was the most powerful feature for both the U-Net and Random Forest model, agreeing with previous research on determining building class from satellite multispectral data.
One limitation that we had to work with in this paper was using a dataset which was only for one city, Mumbai. As a future work direction, we plan to use a bigger dataset including more cities around the world. We would also like to see different data modalities such as street view imagery be incorporated into slum mapping models as data becomes more widely collected and available in the modern world. Additionally, using telecommunications data to provide models with information about residents’ movement patterns and population density could provide more powerful insights.

Supplementary Materials

The following are available at https://www.mdpi.com/article/10.3390/rs14133072/s1, Details of the dataset creation process are available in the Supplementary Materials.

Author Contributions

Conceptualisation, T.F., H.G., Y.C., K.R., M.M.; methodology, T.F., H.G., M.M.; software, T.F., H.G.; resources, T.F., H.G., Y.C.; data curation, H.G.; writing—original draft preparation, T.F., M.M.; writing—review and editing, T.F., M.M., Y.L., M.A., M.P., G.S.-K., A.H., K.R.; visualisation, T.F.; supervision, M.M., K.R.; project administration M.M., K.R.; funding acquisition, K.R. All authors have read and agreed to the published version of the manuscript.

Funding

This research was funded by the Oxford Martin School programme on Informal Cities and by the Economic and Social Research Council (ES/P011055/1).

Institutional Review Board Statement

Not applicable.

Informed Consent Statement

Not applicable.

Data Availability Statement

The code used to create the dataset can be accessed on GitHub (https://github.com/harry-gibson/dl_image_segmentation (accessed on 16 June 2022)).

Conflicts of Interest

The authors declare no conflict of interest.

References

  1. Department of Economic and Social Affairs. World Urbanization Prospects: The 2018 Revision; United Nations: Rome, Italy, 2019. [Google Scholar] [CrossRef] [Green Version]
  2. Kuddus, M.A.; Tynan, E.; McBryde, E. Urbanization: A problem for the rich and the poor? Public Health Rev. 2020, 41, 1–4. [Google Scholar] [CrossRef]
  3. United Nations Development Program. Rapid Urbanisation: Opportunities and Challenges to Improve the Well-Being of Societies|Human Development Reports; United Nations Development Program: New York, NY, USA, 2018. [Google Scholar]
  4. Trindade, T.C.; MacLean, H.L.; Posen, I.D. Slum infrastructure: Quantitative measures and scenarios for universal access to basic services in 2030. Cities 2021, 110, 103050. [Google Scholar] [CrossRef]
  5. Department of Economic and Social Affairs. Inequality in a Rapidly Changing World; United Nations: Rome, Italy, 2020; p. 216. [Google Scholar]
  6. Yue, L.; Xue, D.; Draz, M.U.; Ahmad, F.; Li, J.; Shahzad, F.; Ali, S. The Double-Edged Sword of Urbanization and Its Nexus with Eco-Efficiency in China. Int. J. Environ. Res. Public Health 2020, 17, 446. [Google Scholar] [CrossRef] [Green Version]
  7. Kohli, D.; Stein, A.; Sliuzas, R. Uncertainty analysis for image interpretations of urban slums. Comput. Environ. Urban Syst. 2016, 60, 37–49. [Google Scholar] [CrossRef]
  8. Lucci, P.; Bhatkal, T.; Khan, A.; Berliner, T. What Works in Improving the Living Conditions of Slum Dwellers. Available online: https://cdn.odi.org/media/documents/10188.pdf (accessed on 16 June 2022).
  9. UN Habitat. Urbanization and Development: Emerging Futures—World Cities Report 2016; United Nations Human Settlements Programme: Nairobi, Kenya, 2016; pp. 1–196. [Google Scholar]
  10. Abbott, J. An analysis of informal settlement upgrading and critique of existing methodological approaches. Habitat Int. 2002, 26, 303–315. [Google Scholar] [CrossRef]
  11. Anand, N.; Rademacher, A. Housing in the Urban Age: Inequality and Aspiration in Mumbai. Antipode 2011, 43, 1748–1772. [Google Scholar] [CrossRef] [Green Version]
  12. Friesen, J.; Taubenböck, H.; Wurm, M.; Pelz, P.F. The similar size of slums. Habitat Int. 2018, 73, 79–88. [Google Scholar] [CrossRef]
  13. Ooi, G.L.; Phua, K.H. Urbanization and slum formation. J. Urban Health 2007, 84, 27–34. [Google Scholar] [CrossRef] [Green Version]
  14. Verma, D.; Jana, A.; Ramamritham, K. Transfer learning approach to map urban slums using high and medium resolution satellite imagery. Habitat Int. 2019, 88, 101981. [Google Scholar] [CrossRef]
  15. UN-Habitat. Unpacking the Value of Sustainable Urbanization. In World Cities Report 2020: The Value of Sustainable Urbanization; UN-Habitat: Nairobi, Kenya, 2020; pp. 43–74. [Google Scholar] [CrossRef]
  16. Fulmer, S. World Population Review. 2021. Available online: https://worldpopulationreview.com/ (accessed on 16 June 2022).
  17. Amegah, A.K. Slum decay in Sub-Saharan Africa. Environ. Epidemiol. 2021, 5, e158. [Google Scholar] [CrossRef]
  18. United Nations. The Sustainable Development Goals Report; United Nations Publications: New York, NY, USA, 2021; pp. 1–56. [Google Scholar] [CrossRef] [Green Version]
  19. Banerjee, B.; Acioly, C.; Gebre-Egziabher, A.; Clos, J.; Dietrich, K. Streets as Tools for Urban Transformation in Slums: A Street-Led Approach to Citywide Slum Upgrading; UN-Habitat: Nairobi, Kenya, 2012; Volume 23, pp. 1–86. [Google Scholar]
  20. Mahabir, R.; Croitoru, A.; Crooks, A.; Agouris, P.; Stefanidis, A. A Critical Review of High and Very High-Resolution Remote Sensing Approaches for Detecting and Mapping Slums: Trends, Challenges and Emerging Opportunities. Urban Sci. 2018, 2, 8. [Google Scholar] [CrossRef] [Green Version]
  21. Owusu, M.; Kuffer, M.; Belgiu, M.; Grippa, T.; Lennert, M.; Georganos, S.; Vanhuysse, S. Towards user-driven earth observation-based slum mapping. Comput. Environ. Urban Syst. 2021, 89, 101681. [Google Scholar] [CrossRef]
  22. Mahabir, R.; Crooks, A.; Croitoru, A.; Agouris, P. The study of slums as social and physical constructs: Challenges and emerging research opportunities. Reg. Stud. Reg. Sci. 2016, 3, 399–419. [Google Scholar] [CrossRef] [Green Version]
  23. Pugalis, L.; Giddings, B.; Anyigor, K. Reappraising the World Bank responses to rapid urbanisation: Slum improvements in Nigeria. Local Econ. 2014, 29, 519–540. [Google Scholar] [CrossRef]
  24. Thomson, D.R.; Kuffer, M.; Boo, G.; Hati, B.; Grippa, T.; Elsey, H.; Linard, C.; Mahabir, R.; Kyobutungi, C.; Maviti, J.; et al. Need for an Integrated Deprived Area “Slum” Mapping System (IDEAMAPS) in Low- and Middle-Income Countries (LMICs). Soc. Sci. 2020, 9, 80. [Google Scholar] [CrossRef]
  25. Duque, J.; Patino, J.; Betancourt, A. Exploring the Potential of Machine Learning for Automatic Slum Identification from VHR Imagery. Remote Sens. 2017, 9, 895. [Google Scholar] [CrossRef] [Green Version]
  26. Gevaert, C.M.; Kohli, D.; Kuffer, M. Challenges of mapping the missing spaces. In Proceedings of the 2019 Joint Urban Remote Sensing Event (JURSE), Vannes, France, 22–24 May 2019; pp. 1–4. [Google Scholar] [CrossRef]
  27. Kuffer, M.; Pfeffer, K.; Sliuzas, R. Slums from space-15 years of slum mapping using remote sensing. Remote Sens. 2016, 8, 455. [Google Scholar] [CrossRef] [Green Version]
  28. Wurm, M.; Stark, T.; Zhu, X.X.; Weigand, M.; Taubenböck, H. Semantic segmentation of slums in satellite images using transfer learning on fully convolutional neural networks. ISPRS J. Photogramm. Remote Sens. 2019, 150, 59–69. [Google Scholar] [CrossRef]
  29. Lilford, R.; Kyobutungi, C.; Ndugwa, R.; Sartori, J.; Watson, S.I.; Sliuzas, R.; Kuffer, M.; Hofer, T.; Porto De Albuquerque, J.; Ezeh, A. Because space matters: Conceptual framework to help distinguish slum from non-slum urban areas. BMJ Glob. Health 2019, 4, e001267. [Google Scholar] [CrossRef]
  30. Ghaffarian, S.; Emtehani, S. Monitoring urban deprived areas with remote sensing and machine learning in case of disaster recovery. Climate 2021, 9, 58. [Google Scholar] [CrossRef]
  31. Stark, T.; Wurm, M.; Taubenböck, H.; Zhu, X.X. Slum Mapping in Imbalanced Remote Sensing Datasets Using Transfer Learned Deep Features. In Proceedings of the 2019 Joint Urban Remote Sensing Event (JURSE), Vannes, France, 22–24 May 2019; pp. 1–4. [Google Scholar] [CrossRef]
  32. Gram-Hansen, B.; Helber, P.; Varatharajan, I.; Azam, F.; Coca-Castro, A.; Kopackova, V.; Bilinski, P. Mapping Informal Settlements in Developing Countries using Machine Learning and Low Resolution Multi-spectral Data. In Proceedings of the AAAI/ACM Conference on AI, Ethics, and Society, Honolulu, HI, USA, 27–28 January 2019. [Google Scholar] [CrossRef] [Green Version]
  33. Lundberg, S.M.; Lee, S.I. A unified approach to interpreting model predictions. In Advances in Neural Information Processing Systems; MIT Press: Cambridge, MA, USA, 2017; Volume 30. [Google Scholar]
  34. Zhou, X.; Liu, H.; Pourpanah, F.; Zeng, T.; Wang, X. A Survey on Epistemic (Model) Uncertainty in Supervised Learning: Recent Advances and Applications. Neurocomputing 2022, 489, 449–465. [Google Scholar] [CrossRef]
  35. Pratomo, J.; Kuffer, M.; Martinez, J.; Kohli, D. Coupling Uncertainties with Accuracy Assessment in Object-Based Slum Detections, Case Study: Jakarta, Indonesia. Remote Sens. 2017, 9, 1164. [Google Scholar] [CrossRef] [Green Version]
  36. Kendall, A.; Gal, Y. What uncertainties do we need in Bayesian deep learning for computer vision? In Advances in Neural Information Processing Systems; Neural Information Processing Systems Foundation: South Lake Tahoe, NV, USA, 2017; pp. 5575–5585. Available online: https://dl.acm.org/doi/10.5555/3295222.3295309 (accessed on 16 June 2022).
  37. Abdar, M.; Pourpanah, F.; Hussain, S.; Rezazadegan, D.; Liu, L.; Ghavamzadeh, M.; Fieguth, P.; Cao, X.; Khosravi, A.; Acharya, U.R.; et al. A review of uncertainty quantification in deep learning: Techniques, applications and challenges. Inf. Fusion 2021, 76, 243–297. [Google Scholar] [CrossRef]
  38. Abdar, M.; Samami, M.; Mahmoodabad, S.D.; Doan, T.; Mazoure, B.; Hashemifesharaki, R.; Liu, L.; Khosravi, A.; Acharya, U.R.; Makarenkov, V.; et al. Uncertainty quantification in skin cancer classification using three-way decision-based Bayesian deep learning. Comput. Biol. Med. 2021, 135, 104418. [Google Scholar] [CrossRef]
  39. Abdar, M.; Fahami, M.A.; Chakrabarti, S.; Khosravi, A.; Pławiak, P.; Acharya, U.R.; Tadeusiewicz, R.; Nahavandi, S. BARF: A new direct and cross-based binary residual feature fusion with uncertainty-aware module for medical image classification. Inf. Sci. 2021, 577, 353–378. [Google Scholar] [CrossRef]
  40. Abdar, M.; Salari, S.; Qahremani, S.; Lam, H.K.; Karray, F.; Hussain, S.; Khosravi, A.; Acharya, U.R.; Makarenkov, V.; Nahavandi, S. UncertaintyFuseNet: Robust uncertainty-aware hierarchical feature fusion model with ensemble Monte Carlo dropout for COVID-19 detection. arXiv 2021, arXiv:2105.08590. [Google Scholar] [CrossRef]
  41. Leibig, C.; Allken, V.; Ayhan, M.S.; Berens, P.; Wahl, S. Leveraging uncertainty information from deep neural networks for disease detection. Sci. Rep. 2017, 7, 17816. [Google Scholar] [CrossRef] [Green Version]
  42. Michelmore, R.; Kwiatkowska, M.; Gal, Y. Evaluating Uncertainty Quantification in End-to-End Autonomous Driving Control. arXiv 2018, arXiv:1811.06817. [Google Scholar]
  43. Yu, J.; Lam, M.W.; Hu, S.; Wu, X.; Li, X.; Cao, Y.; Liu, X.; Meng, H. Comparative study of parametric and representation uncertainty modeling for recurrent neural network language models. In Proceedings of the Annual Conference of the International Speech Communication Association, INTERSPEECH, Graz, Austria, 15–19 September 2019; International Speech Communication Association: Baixas, France, 2019; pp. 3510–3514. [Google Scholar] [CrossRef] [Green Version]
  44. Wurm, M.; Taubenböck, H. Detecting social groups from space – assessment of remote sensing-based mapped morphological slums using income data. Remote Sens. Lett. 2018, 9, 41–50. [Google Scholar] [CrossRef]
  45. Maiya, S.R.; Babu, S.C. Slum segmentation and change detection: A deep learning approach. arXiv 2018, arXiv:1811.07896. [Google Scholar]
  46. Leonita, G.; Kuffer, M.; Sliuzas, R.; Persello, C. Machine learning-based slum mapping in support of slum upgrading programs: The case of Bandung City, Indonesia. Remote Sens. 2018, 10, 1522. [Google Scholar] [CrossRef] [Green Version]
  47. Balachandran, M. The world’s biggest survey of slums is underway in India. 2016. Available online: https://qz.com/india/717519/the-worlds-biggest-survey-of-slums-is-underway-in-india/ (accessed on 16 June 2022).
  48. PKDas. 2011. Available online: http://www.pkdas.com/maps/3-Mumbai’s-Slums-Map.pdf (accessed on 16 June 2022).
  49. Davis, J.; Goadrich, M. The Relationship between Precision-Recall and ROC Curves; ACM International Conference Proceeding Series; ACM Press: New York, NY, USA, 2006; Volume 148, pp. 233–240. [Google Scholar] [CrossRef] [Green Version]
  50. Ronneberger, O.; Fischer, P.; Brox, T. U-net: Convolutional networks for biomedical image segmentation. In Proceedings of the International Conference on Medical Image Computing and Computer-Assisted Intervention, Munich, Germany, 5–9 October 2015; Springer: Berlin/Heidelberg, Germany, 2015; pp. 234–241. [Google Scholar]
  51. Kingma, D.P.; Ba, J. Adam: A Method for Stochastic Optimization. arXiv 2017, arXiv:cs.LG/1412.6980. [Google Scholar]
  52. Gal, Y.; Ghahramani, Z. Dropout as a Bayesian Approximation: Representing Model Uncertainty in Deep Learning. In Proceedings of the 33rd International Conference on International Conference on Machine Learning, ICML’16, New York, NY, USA, 20–22 June 2016; Volume 48, pp. 1050–1059. [Google Scholar]
  53. Abdar, M.; Fahami, M.A.; Rundo, L.; Radeva, P.; Frangi, A.; Acharya, U.R.; Khosravi, A.; Lam, H.; Jung, A.; Nahavandi, S. Hercules: Deep Hierarchical Attentive Multi-Level Fusion Model with Uncertainty Quantification for Medical Image Classification. IEEE Trans. Ind. Inform. 2022. [Google Scholar] [CrossRef]
  54. Duerr, O. Probabilistic Deep Learning: With Python, Keras and TensorFlow Probability; Manning Publications Company: Shelter Island, NY, USA, 2020. [Google Scholar]
  55. Gal, Y. Uncertainty in Deep Learning. Ph.D. Thesis, University of Cambridge, Cambridge, UK, 2016. [Google Scholar]
  56. Breiman, L. Random Forests. Mach. Learn. 2001, 45, 5–32. [Google Scholar] [CrossRef] [Green Version]
  57. Belgiu, M.; Drăguţ, L. Random forest in remote sensing: A review of applications and future directions. ISPRS J. Photogramm. Remote Sens. 2016, 114, 24–31. [Google Scholar] [CrossRef]
  58. Segal, M.R. Machine Learning Benchmarks and Random Forest Regression; Center for Bioinformatics and Molecular Biostatistics, UCSF: San Francisco, CA, USA, 2004; pp. 1–14. Available online: https://escholarship.org/uc/item/35x3v9t4 (accessed on 16 June 2022).
  59. Hastie, T.; Tibshirani, R.; Friedman, J. The Elements of Statistical Learning; Springer Series in Statistics; Springer New York Inc.: New York, NY, USA, 2001. [Google Scholar]
  60. Rainforth, T.; Wood, F. Canonical Correlation Forests. arXiv 2015, arXiv:1507.05444. [Google Scholar]
  61. Goodfellow, I.J.; Bengio, Y.; Courville, A. Deep Learning; MIT Press: Cambridge, MA, USA, 2016; Available online: http://www.deeplearningbook.org (accessed on 16 June 2022).
  62. Kwon, Y.; Won, J.H.; Kim, B.J.; Paik, M.C. Uncertainty quantification using Bayesian neural networks in classification: Application to biomedical image segmentation. Comput. Stat. Data Anal. 2020, 142, 106816. [Google Scholar] [CrossRef]
  63. Hernandez-Orallo, J.; Flach, P.; Ferri, C. Brier Curves: A New Cost-Based Visualisation of Classifier Performance. In Proceedings of the 28th International Conference on International Conference on Machine Learning, Bellevue, WA, USA, 28 June–2 July 2011; Omnipress: Madison, WI, USA, 2011. ICML’11. pp. 585–592. [Google Scholar]
  64. Yamashita, R.; Nishio, M.; Do, R.K.G.; Togashi, K. Convolutional neural networks: An overview and application in radiology. Insights Imaging 2018, 9, 611–629. [Google Scholar] [CrossRef] [Green Version]
  65. Kotthaus, S.; Smith, T.E.; Wooster, M.J.; Grimmond, C.S. Derivation of an urban materials spectral library through emittance and reflectance spectroscopy. ISPRS J. Photogramm. Remote Sens. 2014, 94, 194–212. [Google Scholar] [CrossRef] [Green Version]
  66. Zha, Y.; Gao, J.; Ni, S. Use of normalized difference built-up index in automatically mapping urban areas from TM imagery. Int. J. Remote Sens. 2003, 24, 583–594. [Google Scholar] [CrossRef]
Figure 1. The 2011 P.K. Das & Associates Slum Map of Mumbai.
Remotesensing 14 03072 g001
Figure 2. An example image-target pair from the dataset.
Remotesensing 14 03072 g002
Figure 3. Our proposed U-Net architecture with Monte Carlo Dropout for uncertainty-aware slum mapping.
Remotesensing 14 03072 g003
Figure 4. True labels, predicted labels and uncertainty for three different tiles (ac) when using our proposed U-Net model with Monte Carlo Dropout.
Remotesensing 14 03072 g004
Figure 5. Epoch-vs-Loss and Epoch-vs-AUPRC of the U-Net model when training on Regions 2, 3 and 4.
Remotesensing 14 03072 g005
Figure 6. SHAP value summary plot for test set pixels from our U-Net model.
Remotesensing 14 03072 g006
Figure 7. Feature importance for the Random Forest model.
Remotesensing 14 03072 g007
Figure 8. The Ambojwadi slum in 2015 and 2020.
Remotesensing 14 03072 g008
Figure 9. The Ambojwadi slum area in 2015 and 2020 as measured by the U-Net and Random Forest models.
Remotesensing 14 03072 g009
Table 1. Regional test AUPRC scores for Random Forest and U-Net models.
RegionRandom ForestU-Net
10.620.67
20.730.82
30.700.74
40.680.72
Average0.680.74
Table 2. Regional test uncertainty values.
RegionRandom ForestU-Net
12.0  × 10 3 12.9  × 10 9
21.8  × 10 3 11.1  × 10 9
31.5  × 10 3 7.2  × 10 9
41.9  × 10 3 7.5  × 10 9
Average1.8  × 10 3 9.7  × 10 9
Publisher’s Note: MDPI stays neutral with regard to jurisdictional claims in published maps and institutional affiliations.

