
Contributing Factors and Trend Prediction of Urban-Settled Population Distribution Based on Human Perception Measurement: A Study on Beijing, China

 , ,
, ,
Abstract
:
1. Introduction
2. Materials
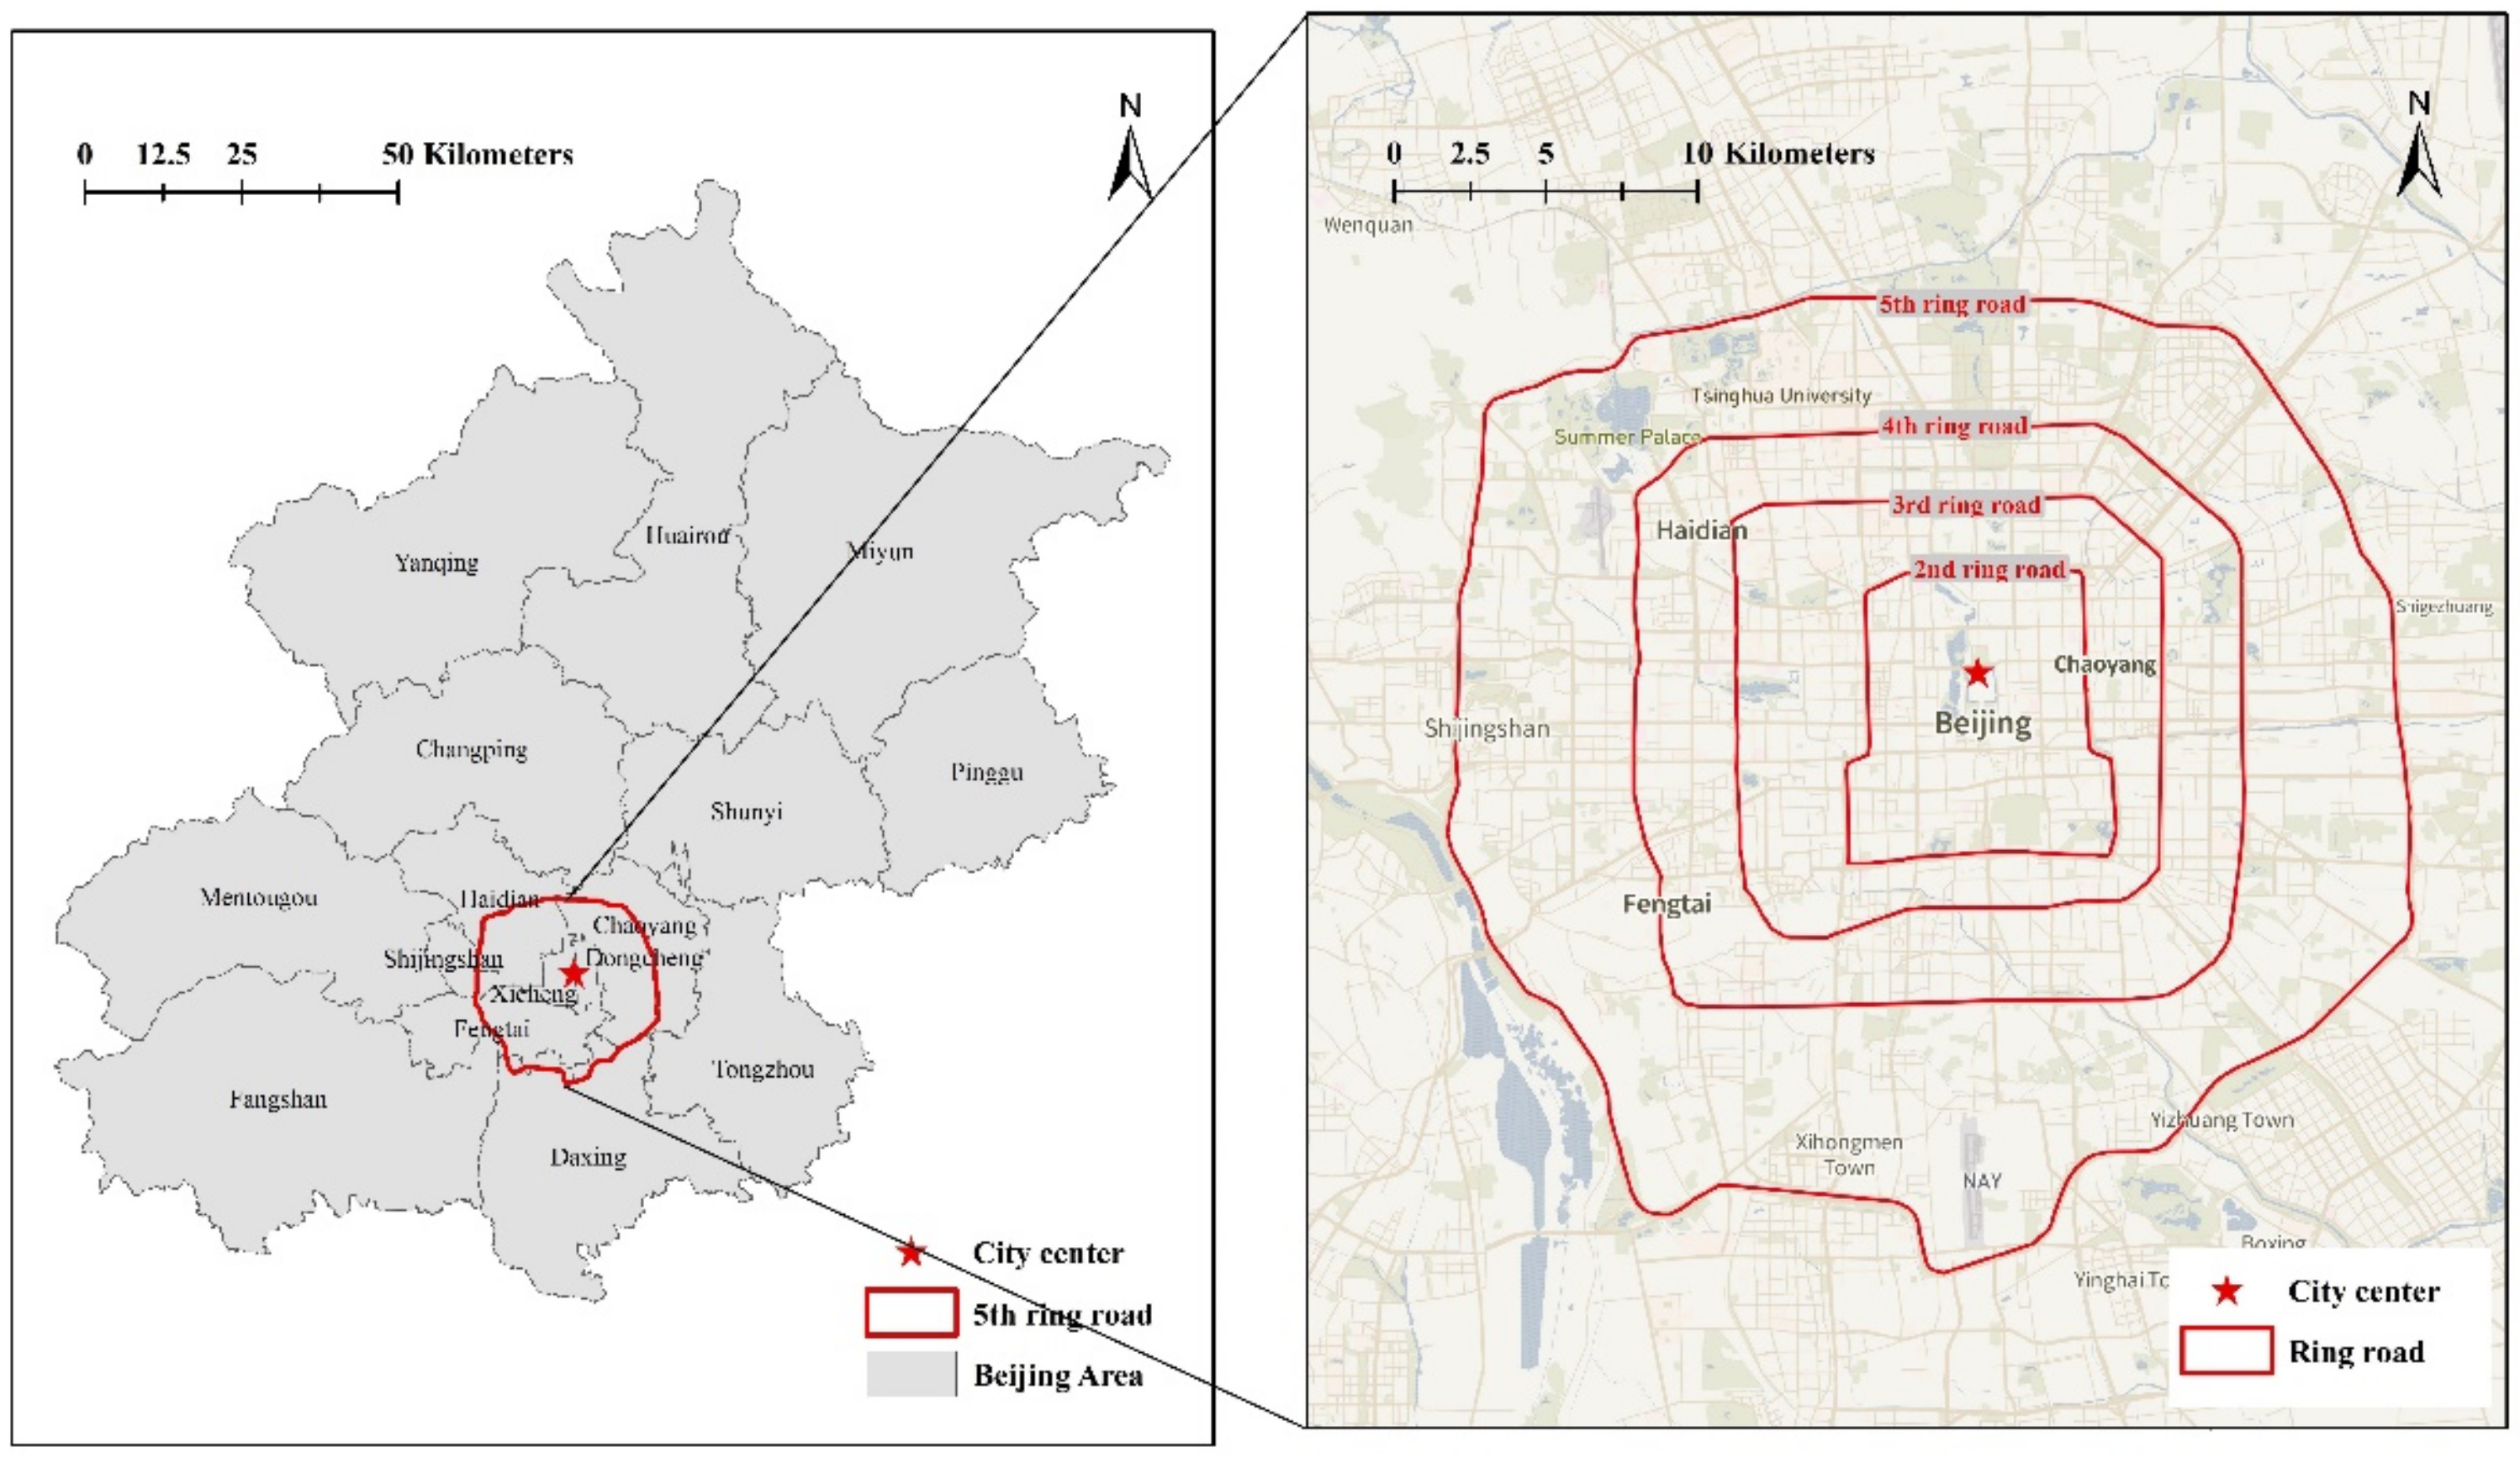
2.1. Study Area
2.2. Data Description and Preprocessing
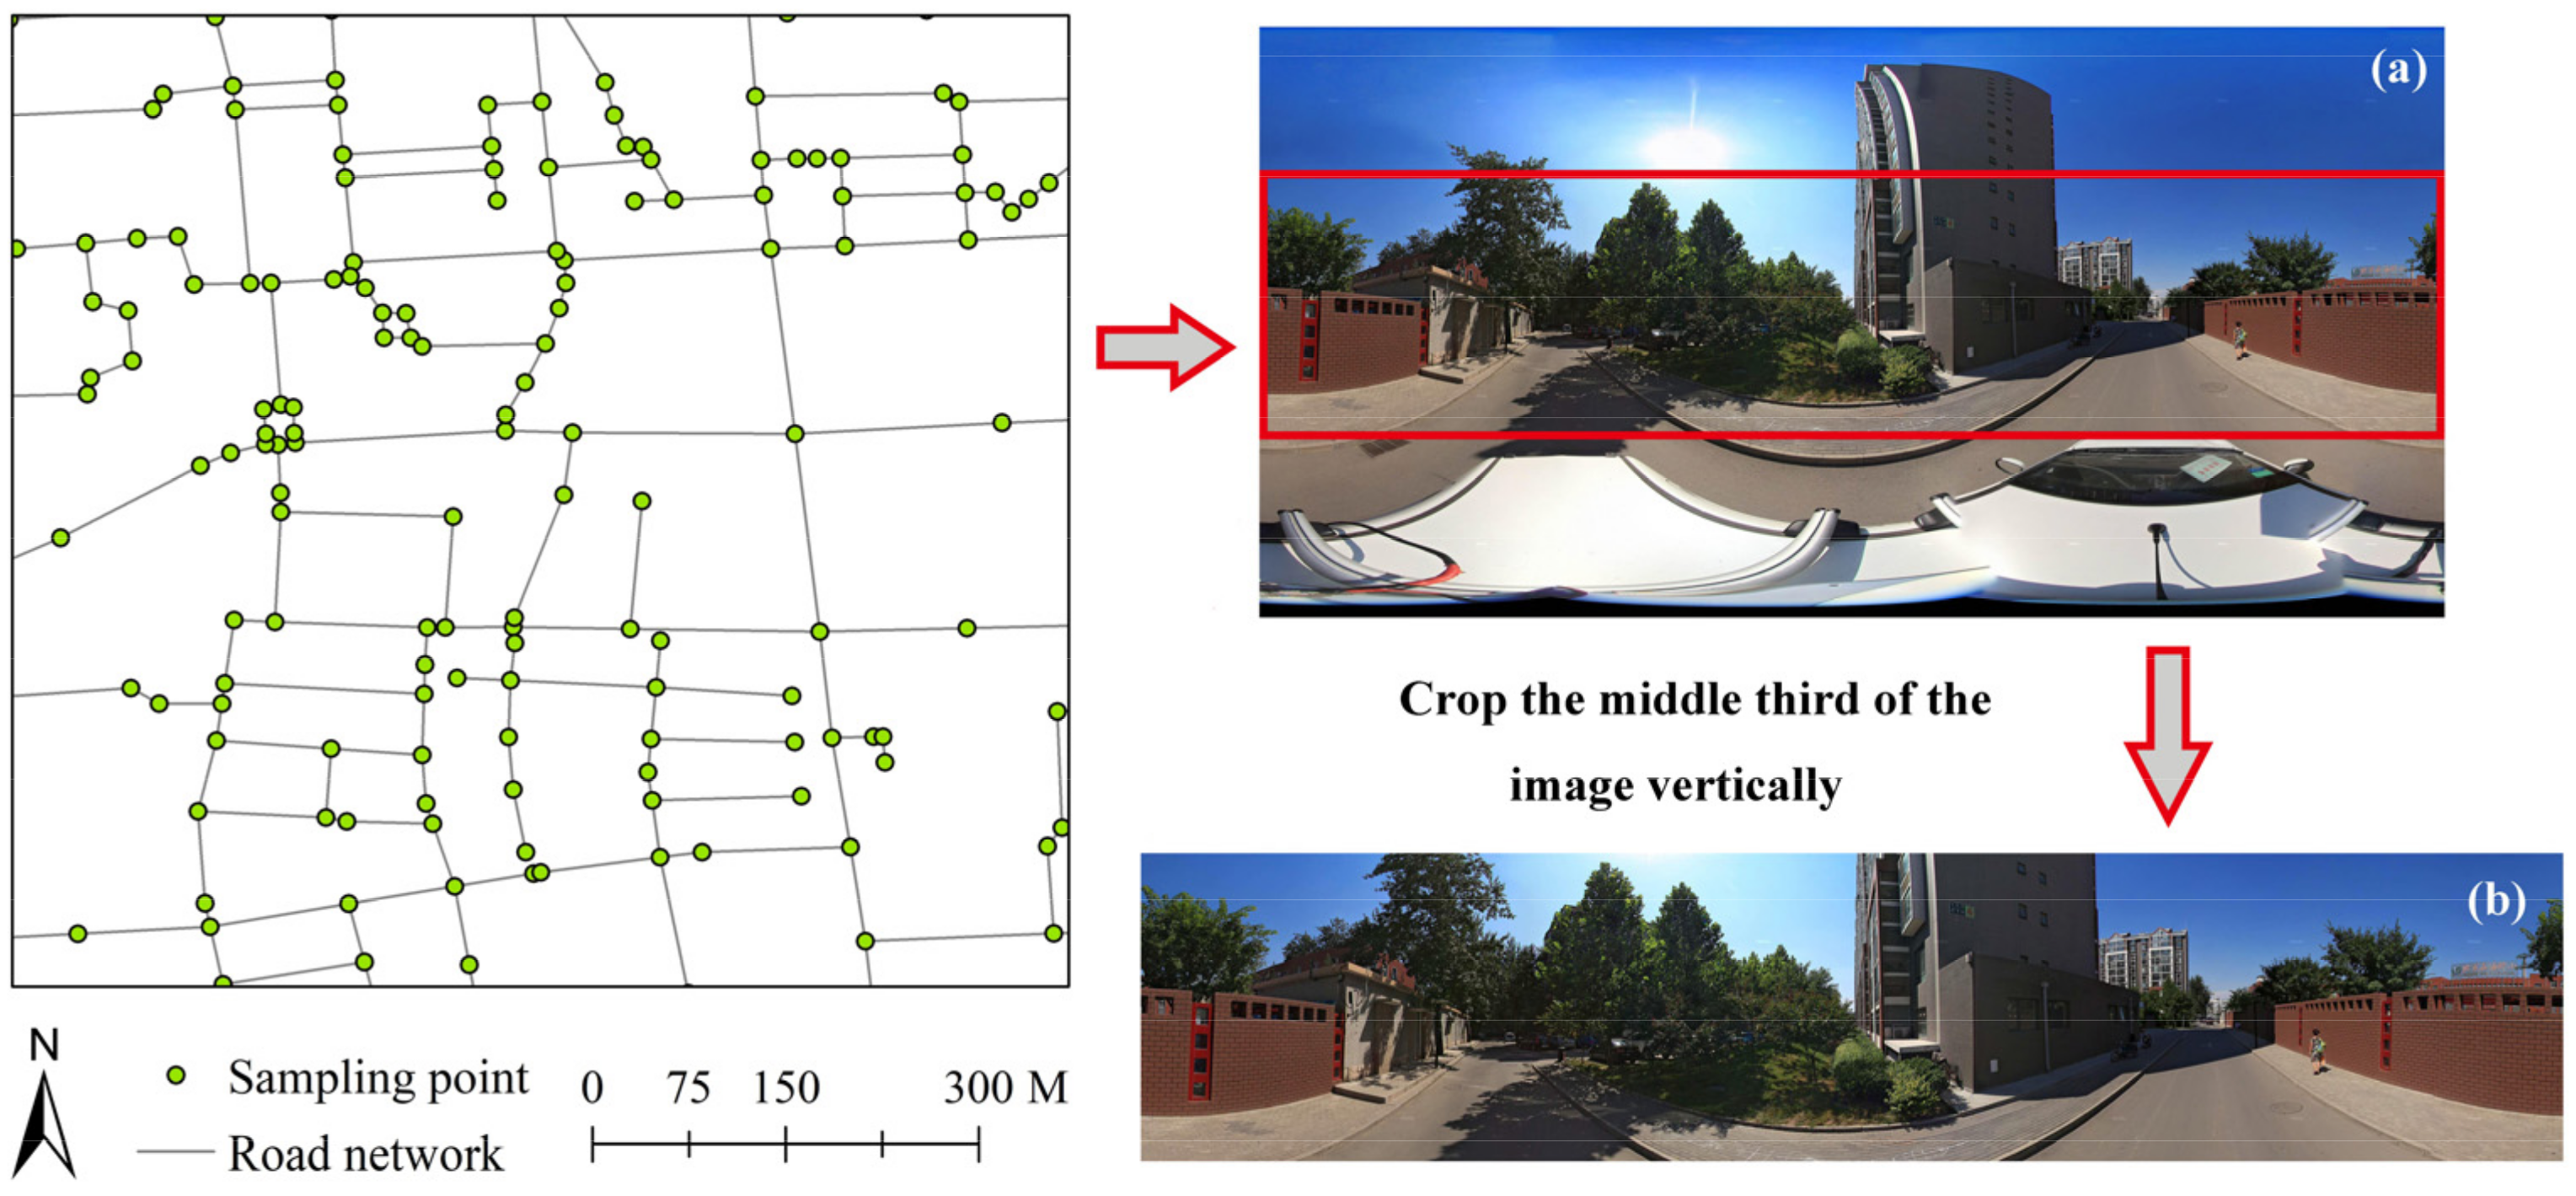
2.2.1. Street-View Images (SVI)
2.2.2. Points of Interest (POI)
2.2.3. Night-Time Light (NTL) Satellite Images
2.2.4. Density of the Settled Population (DSP)
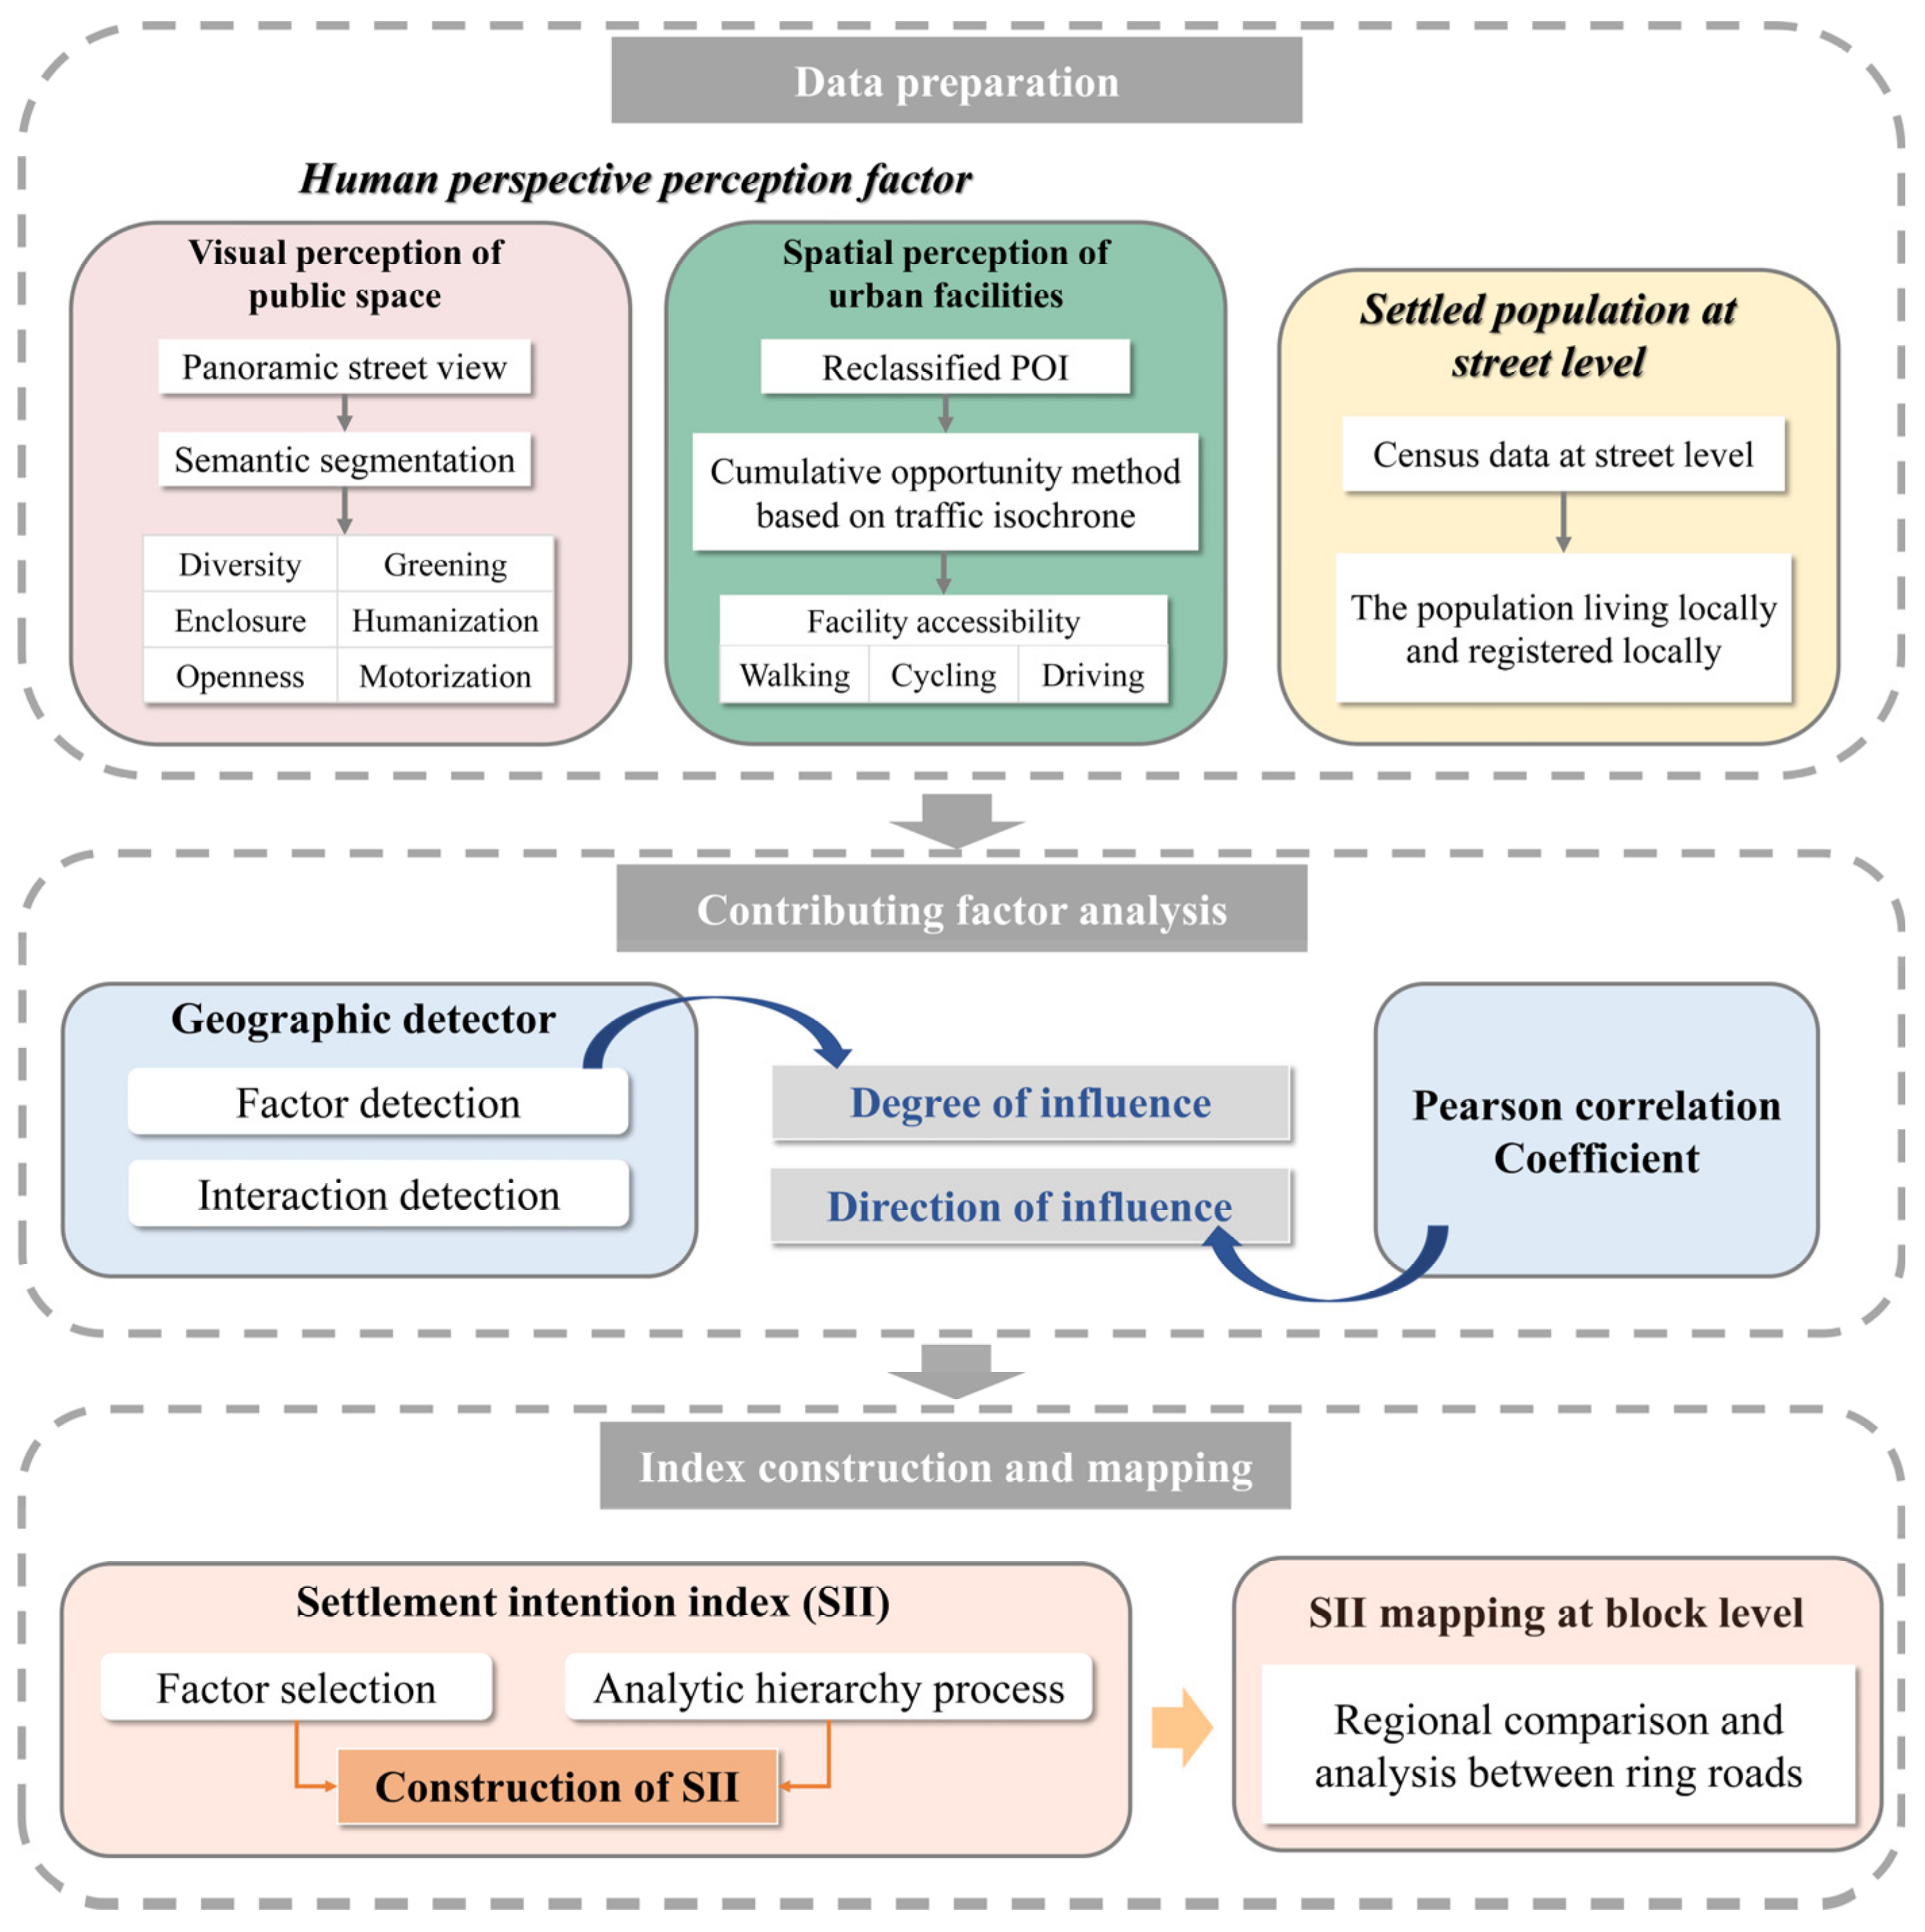
3. Methods
3.1. Perceptual Information Extraction
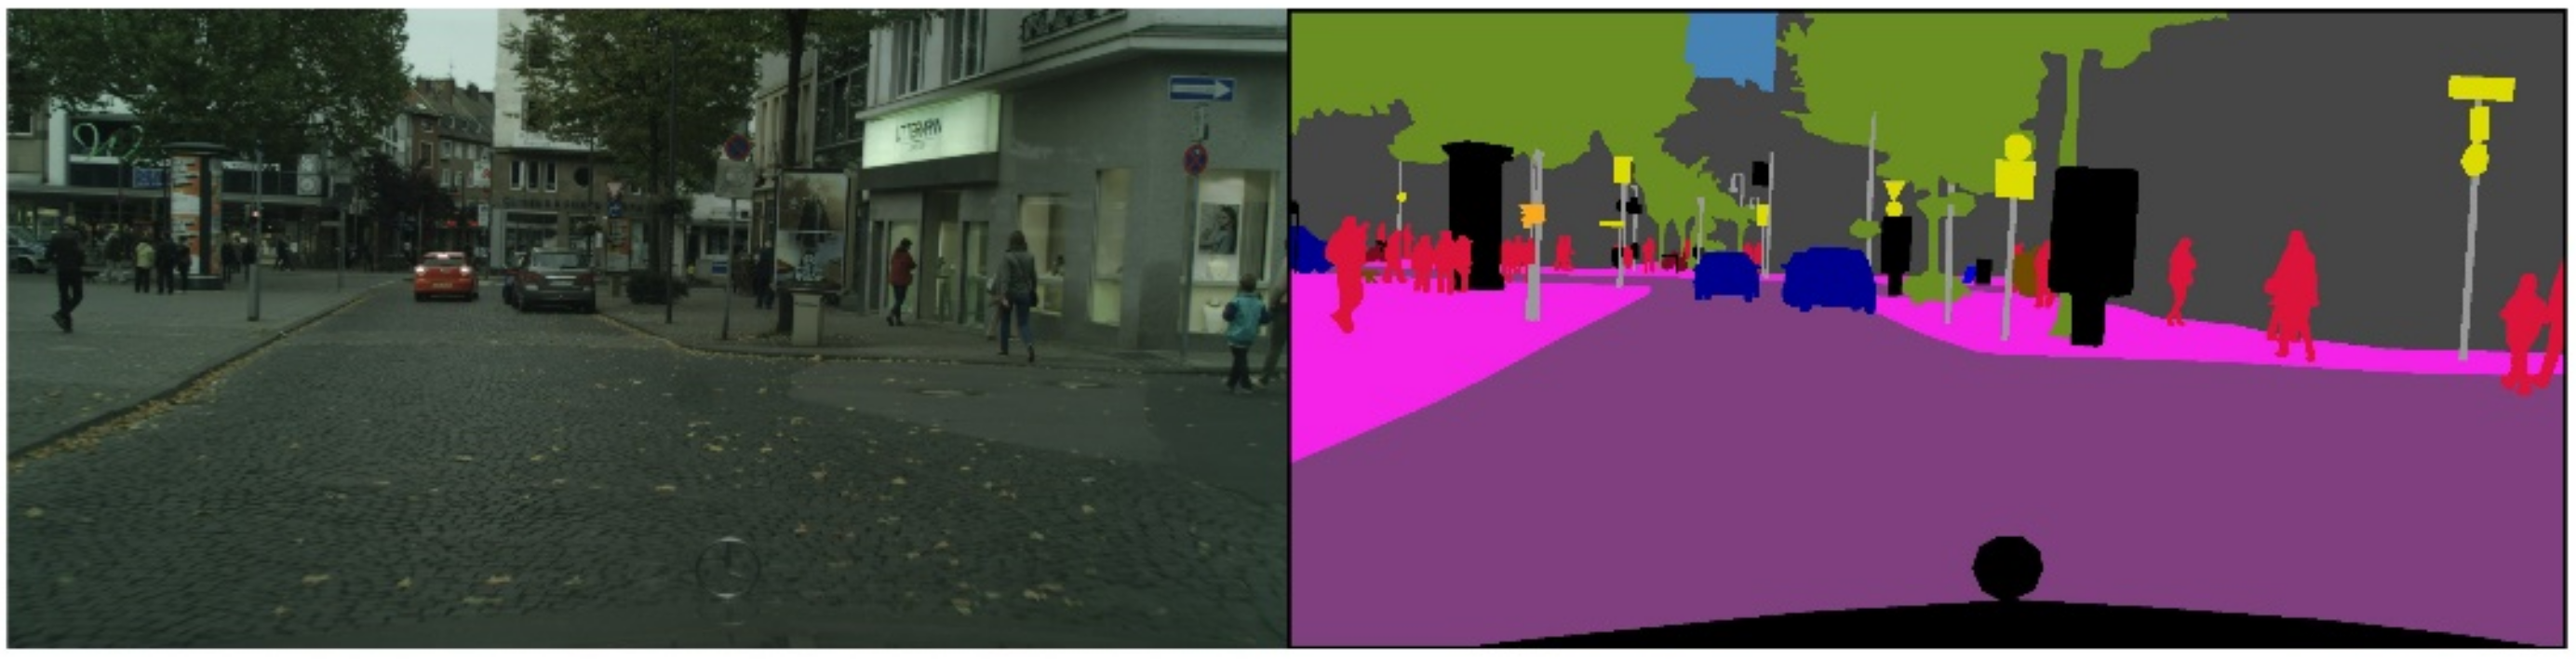
3.1.1. Semantic Segmentation
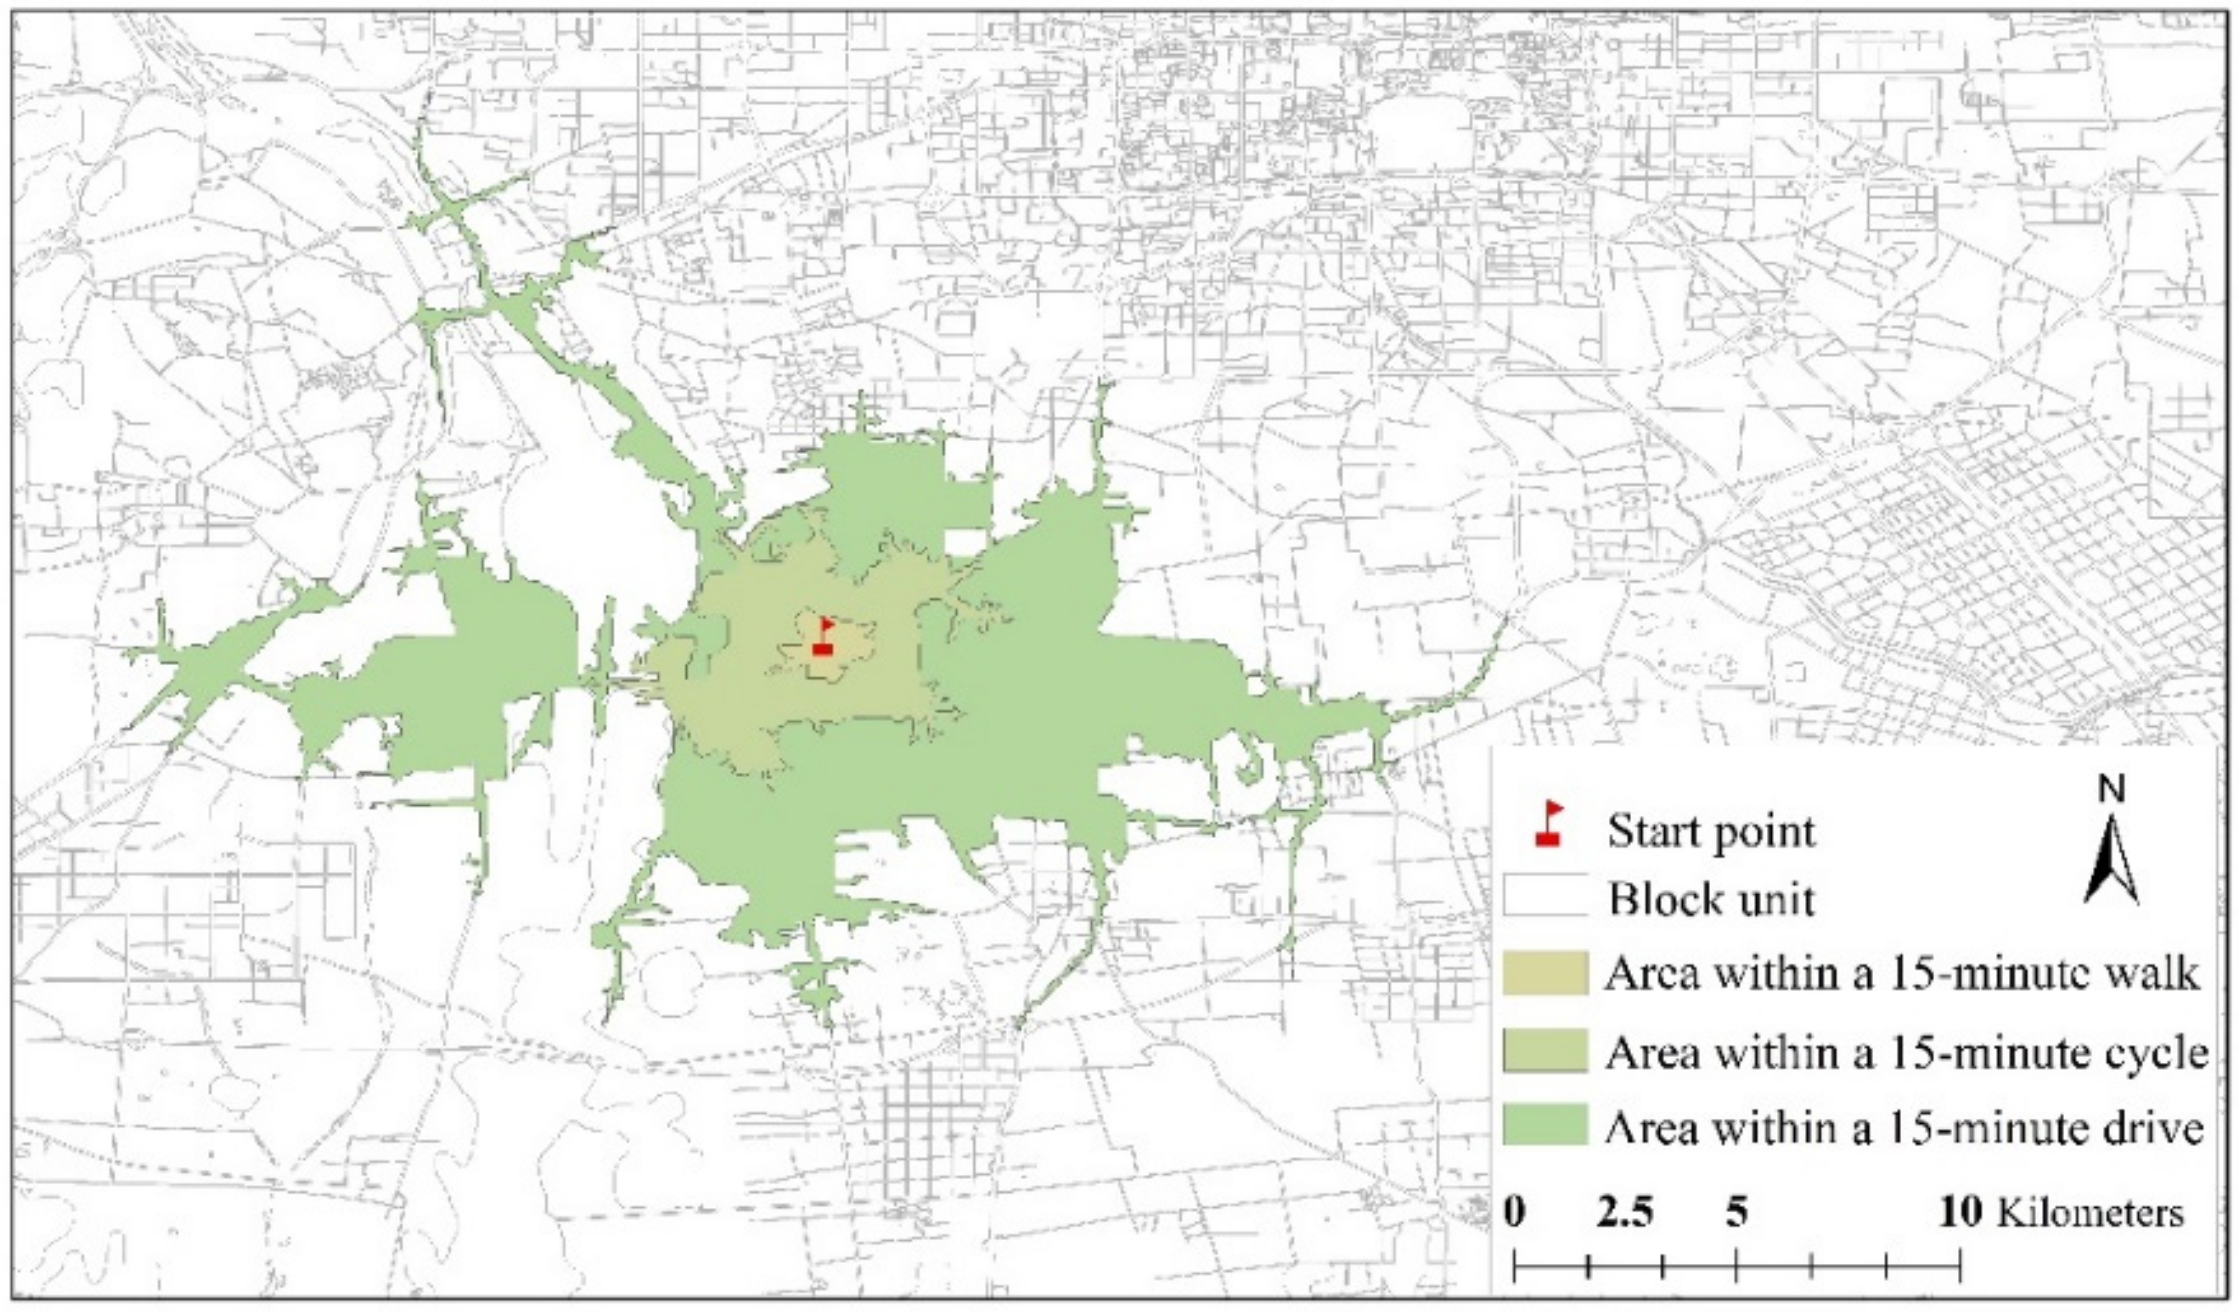
3.1.2. Cumulative Opportunity Method Based on Traffic Isochrone
3.2. Establishment of Perception Factors
3.2.1. Visual Perception Factors of Public Space
- Proportion of elements:
- Street visual greening (SVG): The greening elements include visible information about various types of vegetation. Greening at the urban street level makes a significant contribution to the attractiveness and walkability of residential streets [46]. Green streets are often the main places for people to take a walk, jog, and partake in sports activities [47]. Therefore, greening is one of the important factors of urban ecological environment construction.
- Street visual sky openness (SVS) and street visual enclosure (SVE): The visual perception of the degree of sky openness and closure of urban public spaces reflects the spaciousness of urban roads and the height, density, and continuity of buildings. These are all important factors that affect the comfort and livability of the residents [48,49]. Notably, these two factors describe the characteristics of the elements associated with the building environment.
- Street visual motorization (SVM) and street visual humanization (SVH): SVM represent the suitability of the street scene for automobile traffic and reflects the density of motor vehicle traffic at that time. SVH reflects the element information related to walking and cycling, that is, the humanization degree of the street environment for peoples’ activities. Therefore, these two factors describe the characteristics of elements related to peoples’ traveling activities.
- 2.
- Diversity of elements:
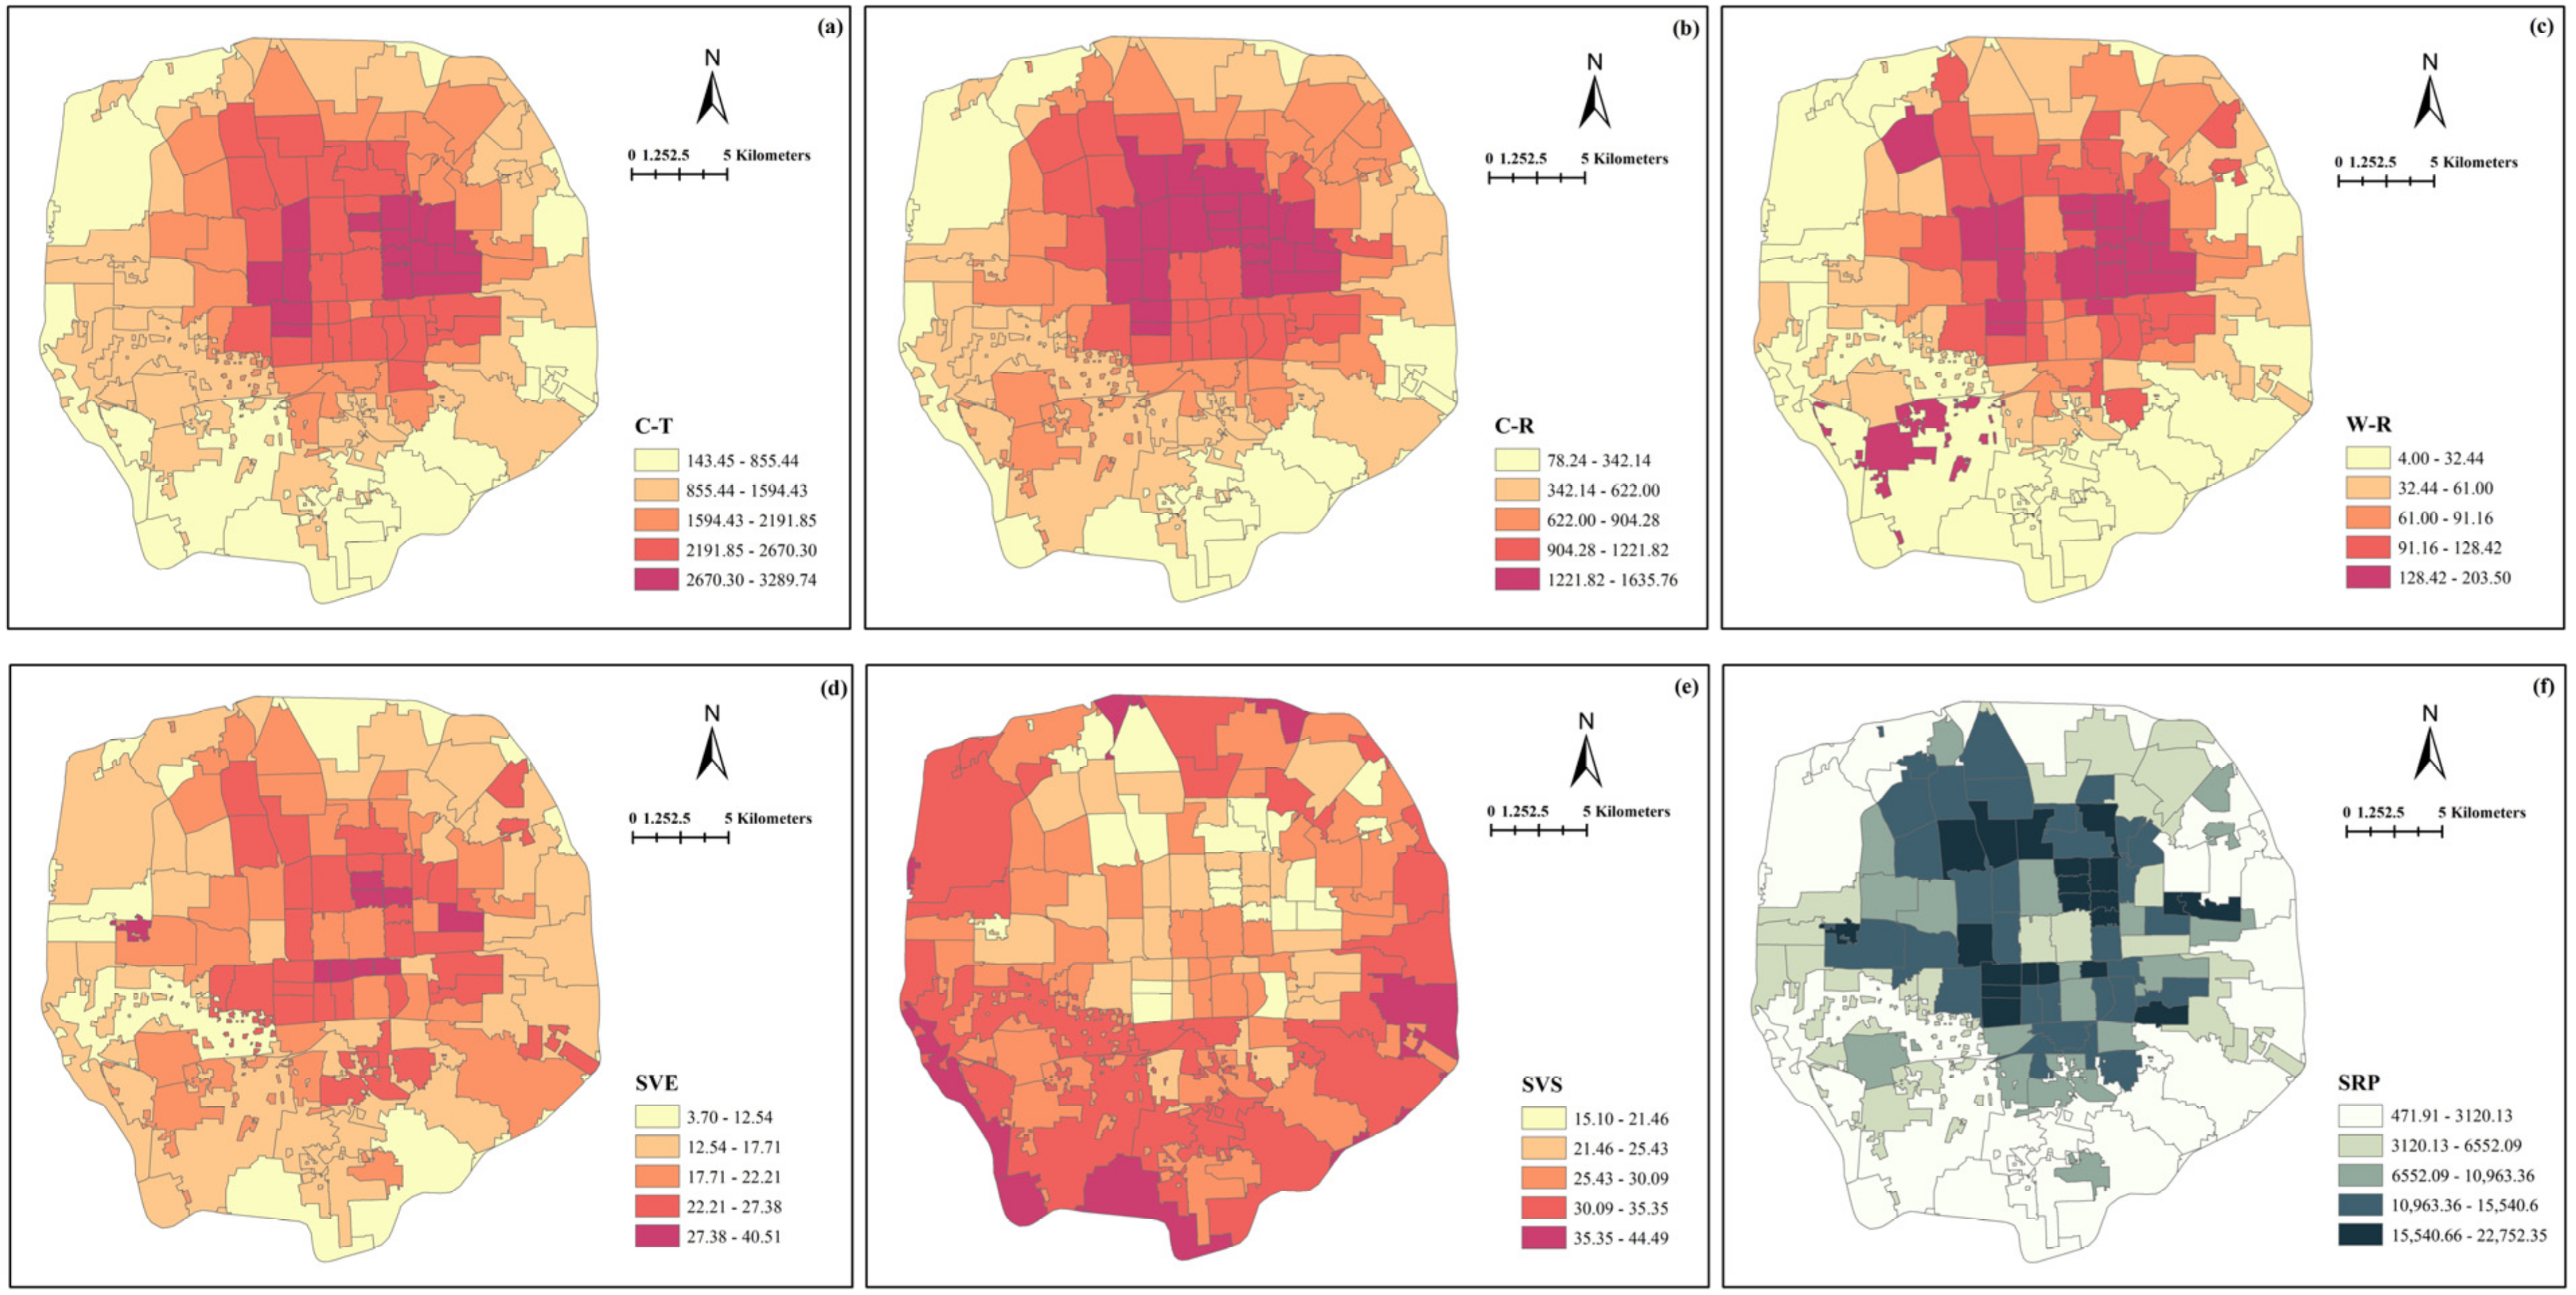
3.2.2. Spatial Perception Factors of Urban Facilities
3.3. Geographic Detector Method
3.3.1. Factor Detection
3.3.2. Interaction Detection
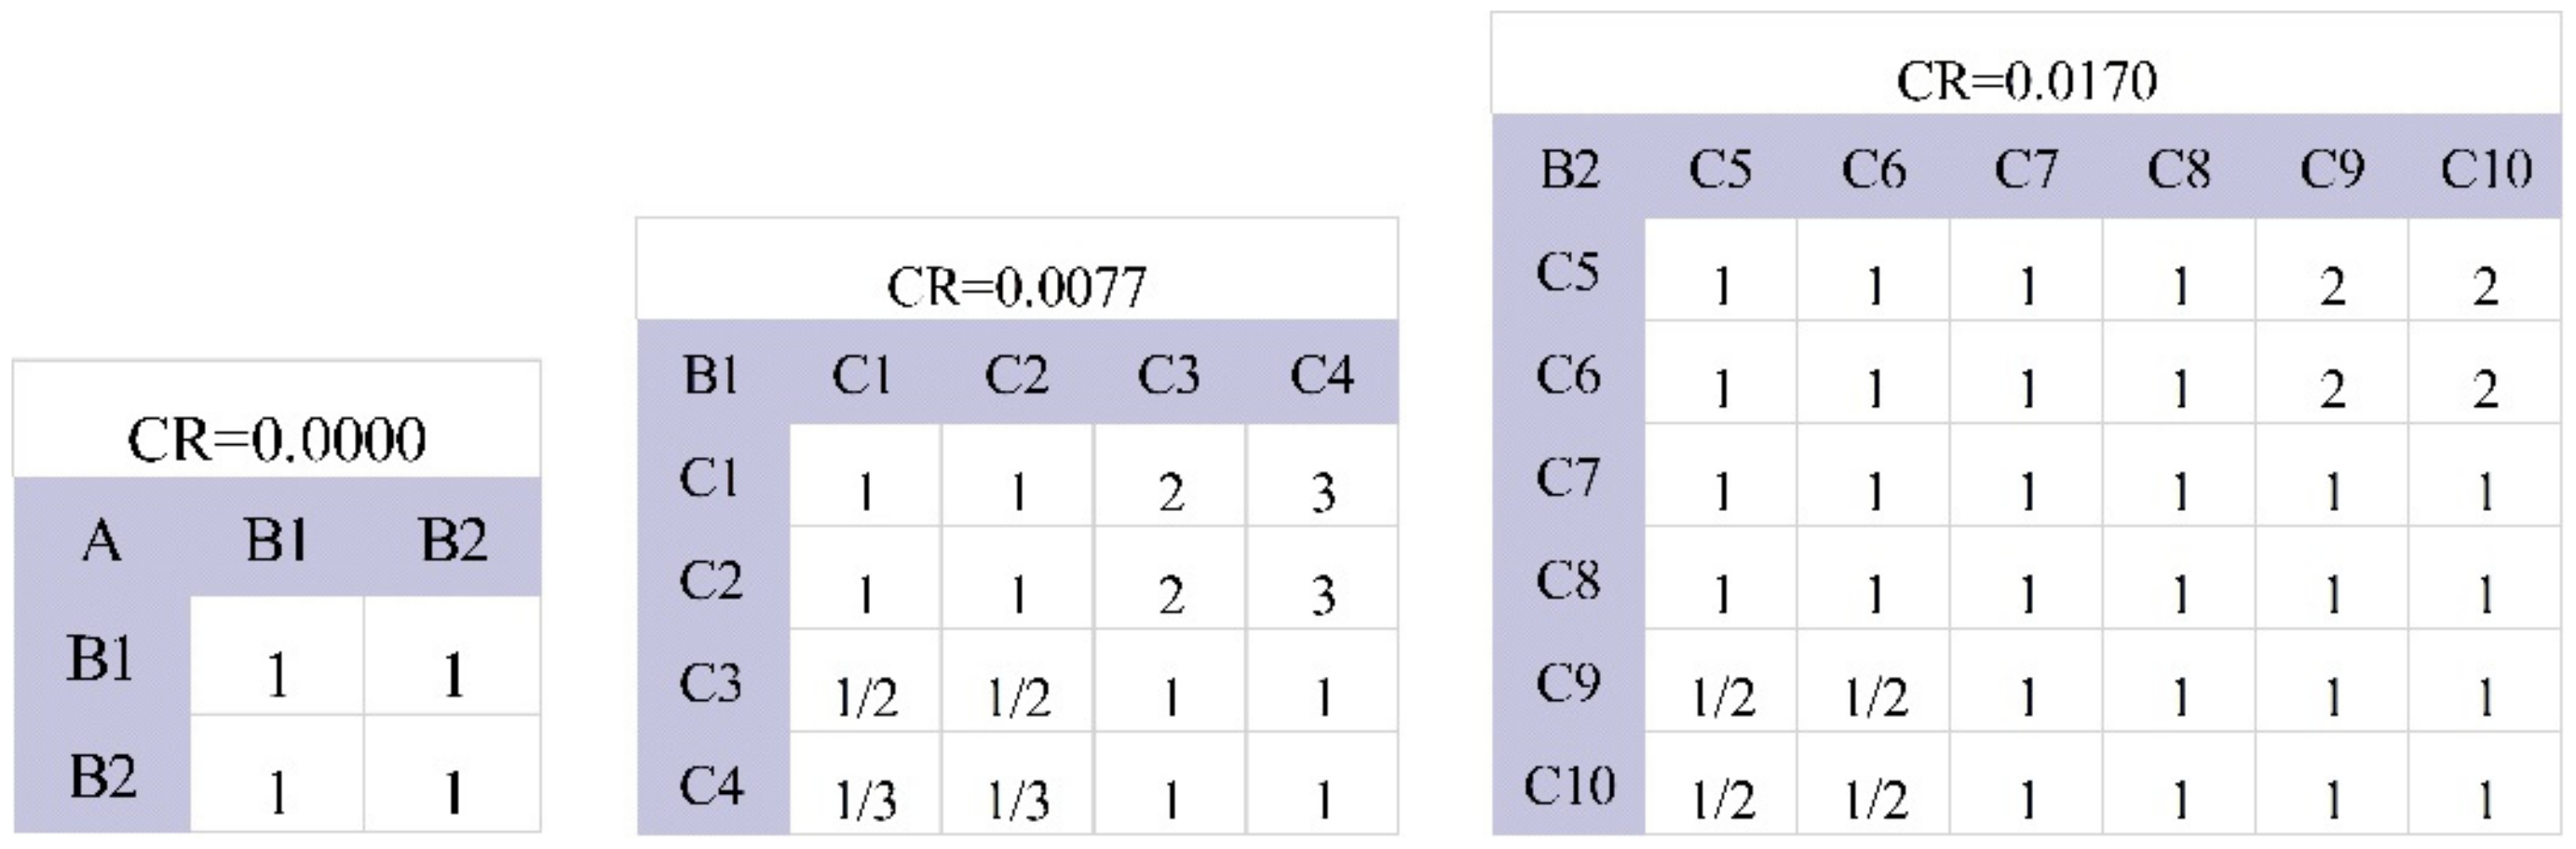
3.4. Analytic Hierarchy Process (AHP)
- Establishing discriminant matrix
- 2.
- Measuring the consistency of the matrix
- 3.
- Calculation of indicator’ weight
4. Results
4.1. Analysis of Contributing Factors, Based on the Geographic Detector Method
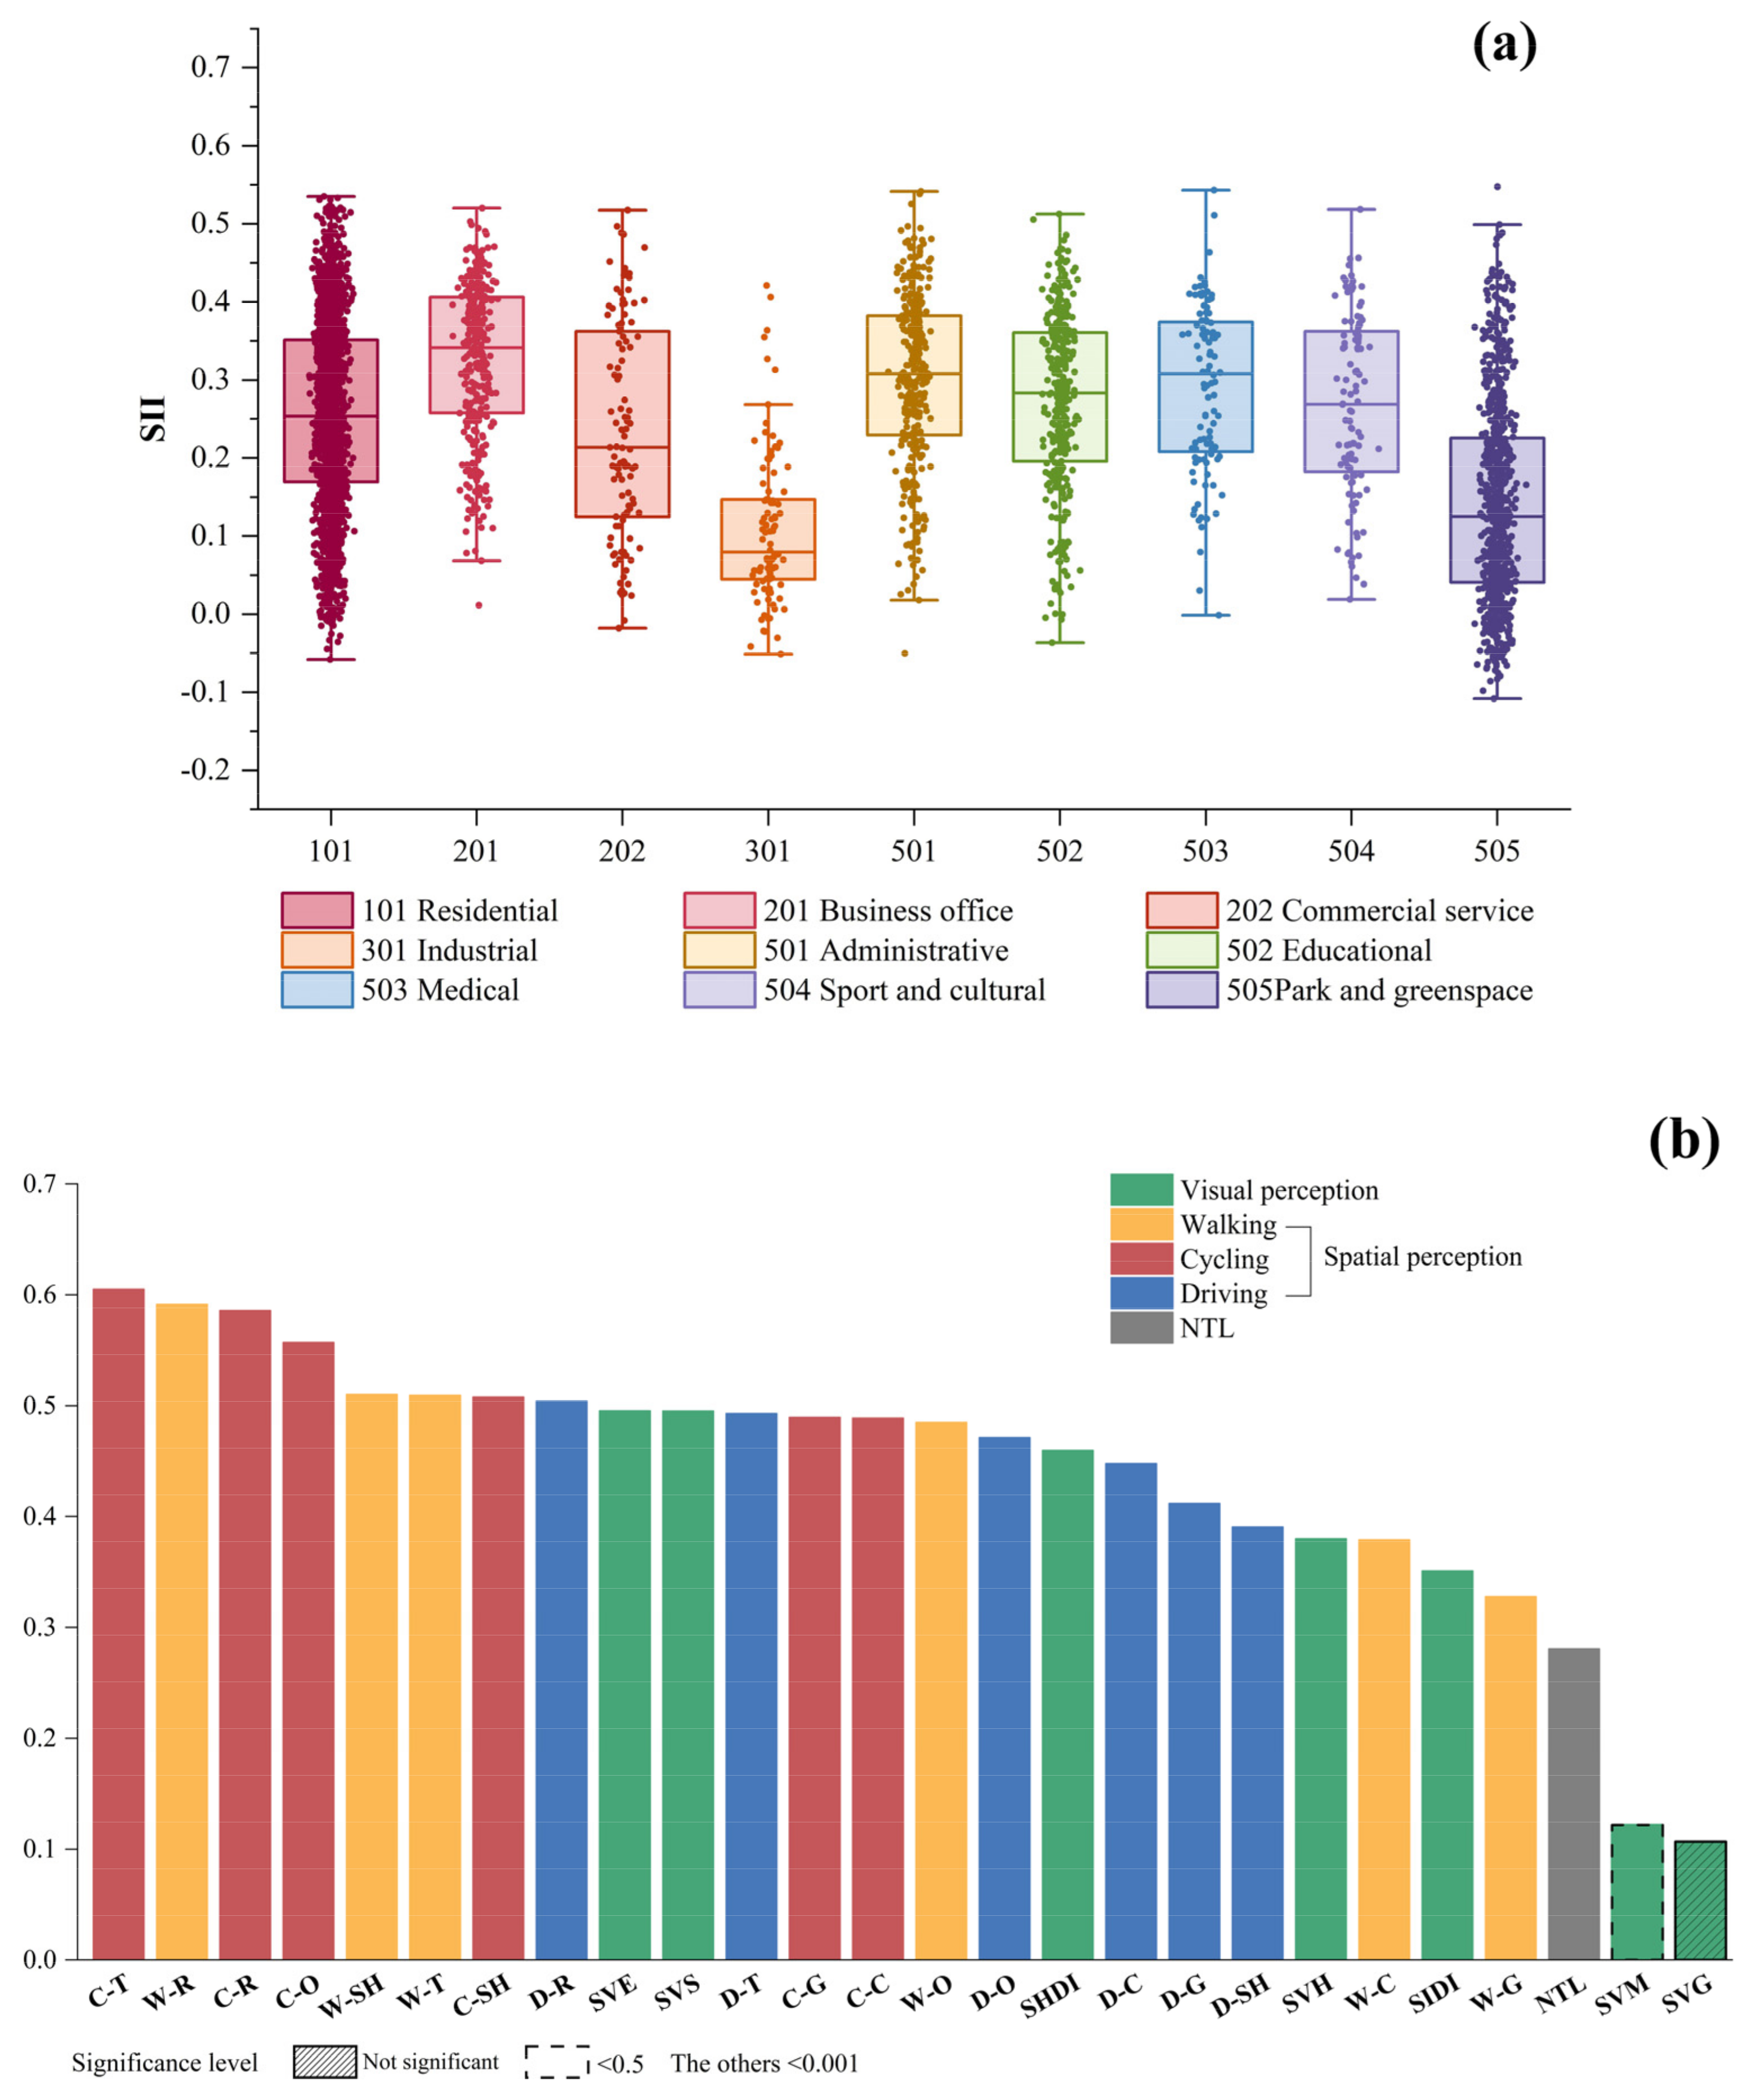
4.1.1. Relative Importance of Perception Factors
4.1.2. Joint Influence of Perception Factors
4.2. Construction of Distribution Trend Prediction Index Based on Analytic Hierarchy Process (AHP)
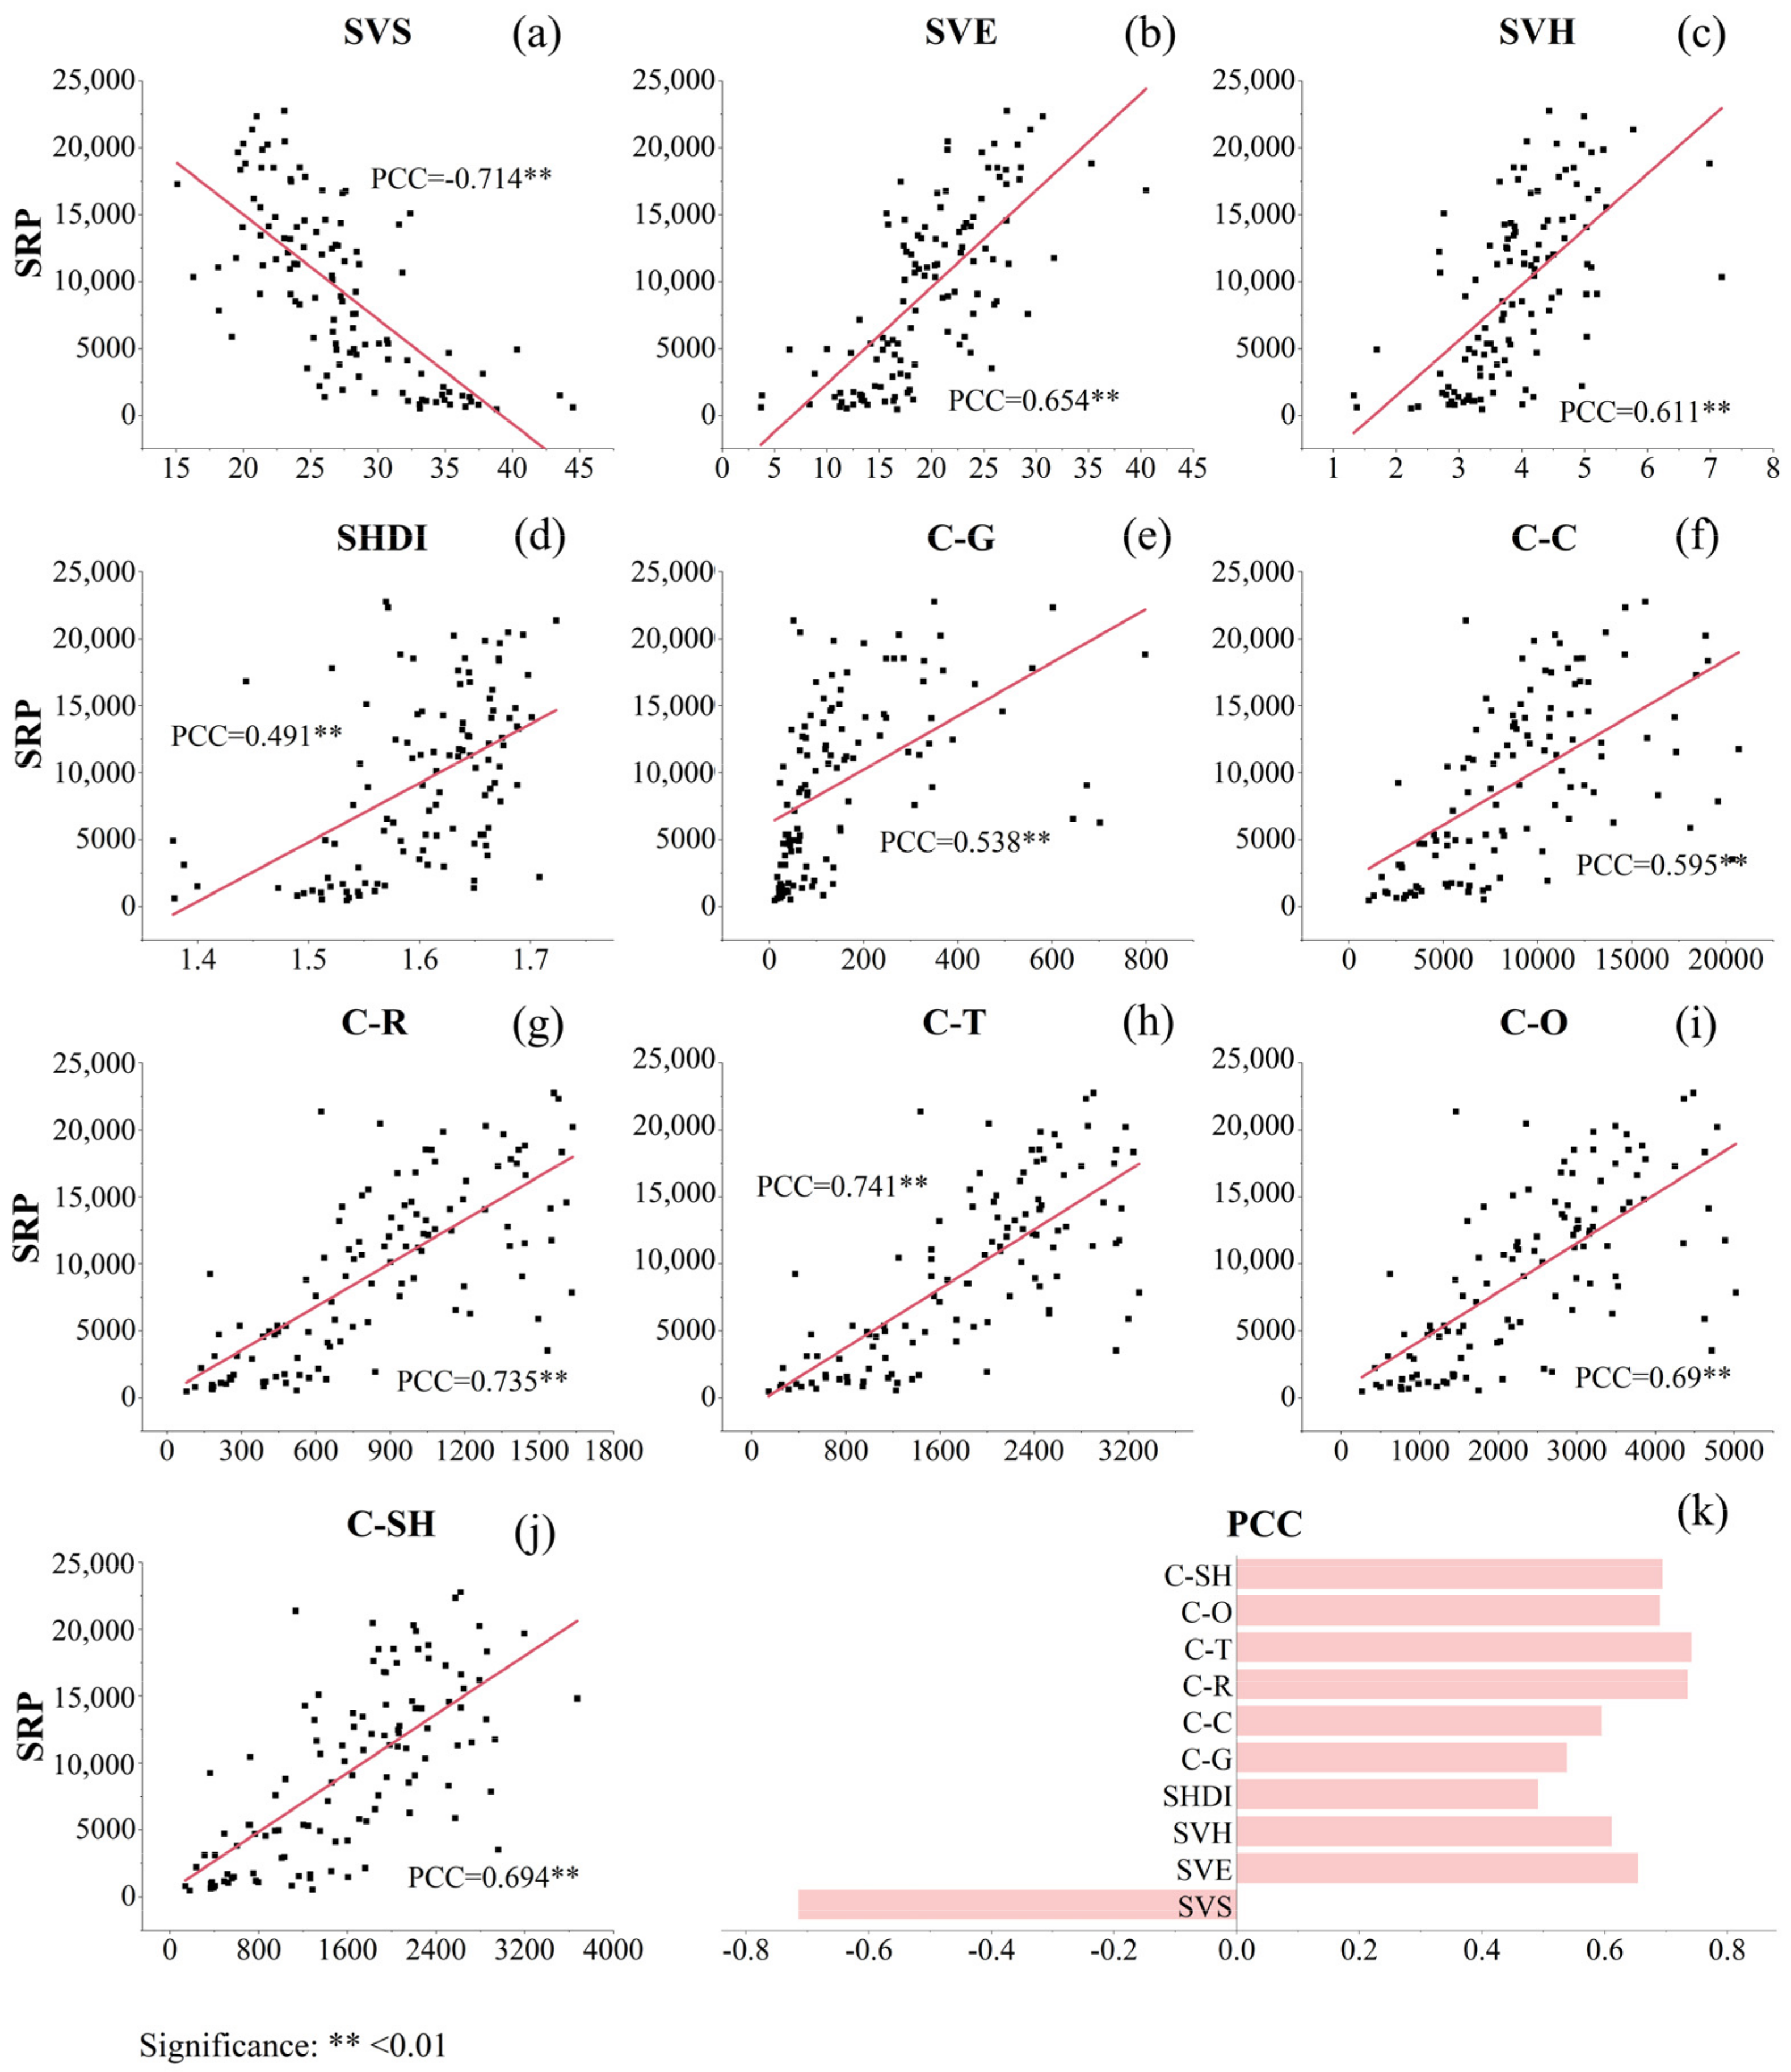
4.2.1. Analysis of Pearson Correlation Coefficient (PCC)
4.2.2. Index Calculation Model
4.3. Settlement Intention Index (SII) Mapping at Block Scale
5. Discussion
5.1. Methodological Contributions
5.2. Potential Contributions
5.2.1. Relationship between Settlement Intention Index (SII) and Urban Land Use Categories
- Identification of population mobility in residential areas: the higher the SII value, the stronger the peoples’ desire to live in the region for a long time, and people settled in residential areas having lower SII values may have the idea of migrating to areas with high SII values.
- Identification of mixed land use: the model provides a basis for the detailed study of land use categories and assists in the identification of mixed land use. In addition to residential areas, land use types having high SII values may include, or be close to, more residential buildings. This can also be used as one of the references to judge the mixing degree of land use in a particular area.
5.2.2. Comparison with Prevailing Population Distribution Studies
5.3. Limitations
- We focused on only the human perceptions of the physical characteristics of urban environment. Social and psychological characteristics, such as economic conditions, job attributes, and social relationships, are also important influencing factors, and thus, should be considered and analyzed in future studies [73,75].
- To ensure the universality of the method, the data sources we used were available open-source data. Peoples’ sense of smell [76,77,78,79] and hearing [80,81] with respect to the environment are proven to affect their behavior. Due to the limitations in data acquisition, we did not consider these factors in our study. Notably, whether these factors have a significant influence on peoples’ living behavior remainss unconfirmed.
- To simplify the construction of the SII model, we did not add the perception factors that had a low influence. Future studies need to further consider the interaction between different factors in the construction of SII.
- In our study, it was difficult to ensure consistency in the acquisition time of SVIs. Notably, the urban landscape difference caused by time difference is an important error source of visual perception quantification of urban public space and must be addressed in future related studies.
- Due to the limitation of spatial accuracy of DSP, our contributing factor analysis can only be carried out at the street scale. In addition, our validation of the effectiveness of SII is still insufficient due to the limitation of the temporal accuracy of the settled population distribution data.
6. Conclusions
- Human perception was one of the important factors influencing the distribution of urban-settled population. Almost all human perception factors had a significant influence on the distribution of settled population, and the influence varied with environmental factors and modes of travel. Visual perception factors related to the built environment and cycling accessibility to various facilities portrayed the greatest influence. Notably, human perception factors having low independent influence portrayed excellent explanatory power, when combined with other factors.
- The population settled in Beijing is concentrated in the center of the city. Managers can improve the urban environmental construction around the fifth ring road by analyzing the mutual enhancement of perception factors, thus alleviating the uneven distribution of the settled population in the city.
- A combination of the geographic detector method and AHP for the construction of the SII values is objective and practical. This combination method considers the differences in the effects of various human perception factors on the spatial distribution of settled population in different urban environments and can be extended to different cities.
Author Contributions
Funding
Data Availability Statement
Conflicts of Interest
References
- United Nations, Department of Economic and Social Affairs. World Urbanization Prospects: The 2008 Revision; Department of Economic and Social Affairs: New York, NY, USA, 2009. [Google Scholar]
- Aerni, P. Coping with Migration-Induced Urban Growth: Addressing the Blind Spot of UN Habitat. Sustainability 2016, 8, 800. [Google Scholar] [CrossRef]
- Pourghasemi, H.R.; Gayen, A.; Panahi, M.; Rezaie, F.; Blaschke, T. Multi-Hazard Probability Assessment and Mapping in Iran. Sci. Total Environ. 2019, 692, 556–571. [Google Scholar] [CrossRef] [PubMed]
- Chen, X.; Li, F.; Li, X.; Hu, Y.; Hu, P. Evaluating and Mapping Water Supply and Demand for Sustainable Urban Ecosystem Management in Shenzhen, China. J. Clean. Prod. 2020, 251, 119754. [Google Scholar] [CrossRef]
- Lin, Y.; Chen, X.; Huang, L.; Zhu, C.; Shahtahmassebi, A.R.; Zhang, J.; Shen, S.; Peng, R.; Deng, J.; Wang, K.; et al. Fine-Scale Mapping of Urban Ecosystem Service Demand in a Metropolitan Context: A Population-Income-Environmental Perspective. Sci. Total Environ. 2021, 781, 146784. [Google Scholar] [CrossRef]
- Feng, Z.; Li, F.; Yang, Y.; Li, P. The Past, Present, and Future of Population Geography in China: Progress, Challenges and Opportunities. J. Geogr. Sci. 2017, 27, 925–942. [Google Scholar] [CrossRef]
- United Nations. Transforming Our World: The 2030 Agenda for Sustainable Development; United Nations: New York, NY, USA, 2015. [Google Scholar]
- Wang, L.; Fan, H.; Wang, Y. Improving Population Mapping Using Luojia 1-01 Nighttime Light Image and Location-Based Social Media Data. Sci. Total Environ. 2020, 730, 139148. [Google Scholar] [CrossRef]
- Jiang, S.; Zhang, Z.; Ren, H.; Wei, G.; Xu, M.; Liu, B. Spatiotemporal Characteristics of Urban Land Expansion and Population Growth in Africa from 2001 to 2019: Evidence from Population Density Data. ISPRS Int. J. Geo-Inf. 2021, 10, 584. [Google Scholar] [CrossRef]
- Chen, Y.; Li, X.; Huang, K.; Luo, M.; Gao, M. High-Resolution Gridded Population Projections for China Under the Shared Socioeconomic Pathways. Earths Future 2020, 8, e2020EF001491. [Google Scholar] [CrossRef]
- Xu, Y.; Song, Y.; Cai, J.; Zhu, H. Population Mapping in China with Tencent Social User and Remote Sensing Data. Appl. Geogr. 2021, 130, 102450. [Google Scholar] [CrossRef]
- Zhao, X.; Zhou, Y.; Chen, W.; Li, X.; Li, X.; Li, D. Mapping Hourly Population Dynamics Using Remotely Sensed and Geospatial Data: A Case Study in Beijing, China. GISci. Remote Sens. 2021, 58, 717–732. [Google Scholar] [CrossRef]
- Wardrop, N.A.; Jochem, W.C.; Bird, T.J.; Chamberlain, H.R.; Clarke, D.; Kerr, D.; Bengtsson, L.; Juran, S.; Seaman, V.; Tatem, A.J. Spatially Disaggregated Population Estimates in the Absence of National Population and Housing Census Data. Proc. Natl. Acad. Sci. USA 2018, 115, 3529–3537. [Google Scholar] [CrossRef] [PubMed]
- Liu, L.; Silva, E.A.; Long, Y. Block-Level Changes in the Socio-Spatial Landscape in Beijing: Trends and Processes. Urban Stud. 2019, 56, 1198–1214. [Google Scholar] [CrossRef]
- Liu, Q.; Tian, Y.; Yin, K.; Zhang, F.; Huang, H.; Chen, F. Landscape Pattern Theoretical Optimization of Urban Green Space Based on Ecosystem Service Supply and Demand. ISPRS Int. J. Geo-Inf. 2021, 10, 263. [Google Scholar] [CrossRef]
- Li, X. Examining the Spatial Distribution and Temporal Change of the Green View Index in New York City Using Google Street View Images and Deep Learning. Environ. Plan. B Urban Anal. City Sci. 2021, 48, 2039–2054. [Google Scholar] [CrossRef]
- Song, Y.; Long, Y.; Wu, P.; Wang, X. Are All Cities with Similar Urban Form or Not? Redefining Cities with Ubiquitous Points of Interest and Evaluating Them with Indicators at City and Block Levels in China. Int. J. Geogr. Inf. Sci. 2018, 32, 2447–2476. [Google Scholar] [CrossRef]
- Owen, N.; Humpel, N.; Leslie, E.; Bauman, A.; Sallis, J.F. Understanding Environmental Influences on Walking: Review and Research Agenda. Am. J. Prev. Med. 2004, 27, 67–76. [Google Scholar] [CrossRef]
- Humpel, N.; Owen, N.; Leslie, E. Environmental Factors Associated with Adults’ Participation in Physical Activity. A Review. Am. J. Prev. Med. 2002, 22, 188–199. [Google Scholar] [CrossRef]
- Guo, J.Y.; Bhat, C.R. Operationalizing the Concept of Neighborhood: Application to Residential Location Choice Analysis. J. Transp. Geogr. 2007, 15, 31–45. [Google Scholar] [CrossRef]
- Habib, M.A.; Miller, E.J. Reference-Dependent Residential Location Choice Model within a Relocation Context. Transp. Res. Rec. 2009, 2133, 92–99. [Google Scholar] [CrossRef]
- Lin, T.; Wang, D.; Guan, X. The Built Environment, Travel Attitude, and Travel Behavior: Residential Self-Selection or Residential Determination? J. Transp. Geogr. 2017, 65, 111–122. [Google Scholar] [CrossRef]
- Masoumi, H.; Aslam, A.B.; Rana, I.A.; Ahmad, M.; Naeem, N. Relationship of Residential Location Choice with Commute Travels and Socioeconomics in the Small Towns of South Asia: The Case of Hafizabad, Pakistan. Sustainability 2022, 14, 3163. [Google Scholar] [CrossRef]
- Meyer, W.B.; Turner, B.L. Changes in Land Use and Land Cover: A Global Perspective; Cambridge University Press: Cambridge, UK, 1994; Volume 4, ISBN 0521470854. [Google Scholar]
- Ewing, R.; Handy, S.; Brownson, R.C.; Clemente, O.; Winston, E. Identifying and Measuring Urban Design Qualities Related to Walkability. J. Phys. Act. Health 2016, 3, S223–S240. [Google Scholar] [CrossRef] [PubMed]
- Hu, D.; Meng, Q.; Zhang, L.; Zhang, Y. Spatial Quantitative Analysis of the Potential Driving Factors of Land Surface Temperature in Different “Centers” of Polycentric Cities: A Case Study in Tianjin, China. Sci. Total Environ. 2020, 706, 135244. [Google Scholar] [CrossRef] [PubMed]
- Zhang, L.; Ye, Y.; Zeng, W.; Chiaradia, A. A Systematic Measurement of Street Quality through Multi-Sourced Urban Data: A Human-Oriented Analysis. Int. J. Environ. Res. Public Health 2019, 16, 1782. [Google Scholar] [CrossRef] [PubMed]
- Hansen, W.G. How Accessibility Shapes Land Use. J. Am. Plan. Assoc. 1959, 25, 73–76. [Google Scholar] [CrossRef]
- Gehrke, S.R.; Singleton, P.A.; Clifton, K.J. Understanding Stated Neighborhood Preferences: The Roles of Lifecycle Stage, Mobility Style, and Lifestyle Aspirations. Travel. Behav. Soc. 2019, 17, 62–71. [Google Scholar] [CrossRef]
- Zondag, B.; de Bok, M.; Geurs, K.T.; Molenwijk, E. Accessibility Modeling and Evaluation: The TIGRIS XL Land-Use and Transport Interaction Model for the Netherlands. Comput. Environ. Urban Syst. 2015, 49, 115–125. [Google Scholar] [CrossRef]
- Baraklianos, I.; Bouzouina, L.; Bonnel, P.; Aissaoui, H. Does the Accessibility Measure Influence the Results of Residential Location Choice Modelling? Transportation 2020, 47, 1147–1176. [Google Scholar] [CrossRef]
- Kim, J.H.; Pagliara, F.; Preston, J. The Intention to Move and Residential Location Choice Behaviour. Urban Stud. 2005, 42, 1621–1636. [Google Scholar] [CrossRef]
- Jang, S.; Yi, C. Imbalance between Local Commuting Accessibility and Residential Locations of Households by Income Class in the Seoul Metropolitan Area. Cities 2021, 109, 103011. [Google Scholar] [CrossRef]
- Yiannakoulias, N.; Bland, W.; Svenson, L.W. Estimating the Effect of Turn Penalties and Traffic Congestion on Measuring Spatial Accessibility to Primary Health Care. Appl. Geogr. 2013, 39, 172–182. [Google Scholar] [CrossRef]
- Geurs, K.T.; De Montis, A.; Reggiani, A. Recent Advances and Applications in Accessibility Modelling. Comput. Environ. Urban Syst. 2015, 49, 82–85. [Google Scholar] [CrossRef]
- Geurs, K.T.; van Wee, B. Accessibility Evaluation of Land-Use and Transport Strategies: Review and Research Directions. J. Transp. Geogr. 2004, 12, 127–140. [Google Scholar] [CrossRef]
- Van Wee, B. Accessible Accessibility Research Challenges. J. Transp. Geogr. 2016, 51, 9–16. [Google Scholar] [CrossRef]
- Liu, Y.; Shen, J. Modelling Skilled and Less-Skilled Interregional Migrations in China, 2000–2005. Popul. Space Place 2017, 23, e2027. [Google Scholar] [CrossRef]
- Gong, P.; Chen, B.; Li, X.; Liu, H.; Wang, J.; Bai, Y.; Chen, J.; Chen, X.; Fang, L.; Feng, S.; et al. Mapping Essential Urban Land Use Categories in China (EULUC-China): Preliminary Results for 2018. Sci. Bull. 2020, 65, 182–187. [Google Scholar] [CrossRef]
- Tsai, V.J.D.; Chang, C. Three-dimensional Positioning from Google Street View Panoramas. IET Image Process. 2013, 7, 229–239. [Google Scholar] [CrossRef]
- Yin, L.; Wang, Z. Measuring Visual Enclosure for Street Walkability: Using Machine Learning Algorithms and Google Street View Imagery. Appl. Geogr. 2016, 76, 147–153. [Google Scholar] [CrossRef]
- Chen, L.-C.; Papandreou, G.; Schroff, F.; Adam, H. Rethinking Atrous Convolution for Semantic Image Segmentation. arXiv 2017, arXiv:1706.05587. [Google Scholar]
- Cordts, M.; Omran, M.; Ramos, S.; Rehfeld, T.; Enzweiler, M.; Benenson, R.; Franke, U.; Roth, S.; Schiele, B. The Cityscapes Dataset for Semantic Urban Scene Understanding. In Proceedings of the 2016 IEEE Conference on Computer Vision and Pattern Recognition (CVPR), Las Vegas, NV, USA, 27–30 June 2016; pp. 3213–3223. [Google Scholar] [CrossRef]
- Shanghai Municipal People’s Government. Shanghai Master Plan 2016–2040 (Draft); Shanghai Municipal People’s Government: Shanghai, China, 2016.
- Tang, J.; Long, Y. Measuring Visual Quality of Street Space and Its Temporal Variation: Methodology and Its Application in the Hutong Area in Beijing. Landsc. Urban Plan. 2019, 191, 103436. [Google Scholar] [CrossRef]
- Xia, Y.; Yabuki, N.; Fukuda, T. Development of a System for Assessing the Quality of Urban Street-Level Greenery Using Street View Images and Deep Learning. Urban For. Urban Green. 2021, 59, 126995. [Google Scholar] [CrossRef]
- Ki, D.; Lee, S. Analyzing the Effects of Green View Index of Neighborhood Streets on Walking Time Using Google Street View and Deep Learning. Landsc. Urban Plan. 2021, 205, 103920. [Google Scholar] [CrossRef]
- Asgarzadeh, M.; Koga, T.; Hirate, K.; Farvid, M.; Lusk, A. Investigating Oppressiveness and Spaciousness in Relation to Building, Trees, Sky and Ground Surface: A Study in Tokyo. Landsc. Urban Plan. 2014, 131, 36–41. [Google Scholar] [CrossRef]
- Asgarzadeh, M.; Lusk, A.; Koga, T.; Hirate, K. Measuring Oppressiveness of Streetscapes. Landsc. Urban Plan. 2012, 107, 1–11. [Google Scholar] [CrossRef]
- McGarigal, K.; Cushman, S.A.; Neel, M.C.; Ene, E. FRAGSTATS: Spatial Pattern Analysis Program for Categorical Maps. Available online: https://www.umass.edu/landeco/research/fragstats/fragstats.html (accessed on 12 October 2009).
- Li, J.; Li, J.; Yuan, Y.; Li, G. Spatiotemporal Distribution Characteristics and Mechanism Analysis of Urban Population Density: A Case of Xi’an, Shaanxi, China. Cities 2019, 86, 62–70. [Google Scholar] [CrossRef]
- Liu, Y.; Zhang, Y.; Jin, S.T.; Liu, Y. Spatial Pattern of Leisure Activities among Residents in Beijing, China: Exploring the Impacts of Urban Environment. Sustain. Cities Soc. 2020, 52, 101806. [Google Scholar] [CrossRef]
- Bittencourt, T.A.; Giannotti, M. The Unequal Impacts of Time, Cost and Transfer Accessibility on Cities, Classes and Races. Cities 2021, 116, 103257. [Google Scholar] [CrossRef]
- Yan, X. Evaluating Household Residential Preferences for Walkability and Accessibility across Three U.S. Regions. Transp. Res. Part D Transp. Environ. 2020, 80, 102255. [Google Scholar] [CrossRef]
- Song, Y.; Wang, J.; Ge, Y.; Xu, C. An Optimal Parameters-Based Geographical Detector Model Enhances Geographic Characteristics of Explanatory Variables for Spatial Heterogeneity Analysis: Cases with Different Types of Spatial Data. GISci. Remote Sens. 2020, 57, 593–610. [Google Scholar] [CrossRef]
- Wang, X.; Meng, Q.; Zhang, L.; Hu, D. Evaluation of Urban Green Space in Terms of Thermal Environmental Benefits Using Geographical Detector Analysis. Int. J. Appl. Earth Obs. Geoinf. 2021, 105, 102610. [Google Scholar] [CrossRef]
- Hu, D.; Meng, Q.; Schlink, U.; Hertel, D.; Liu, W.; Zhao, M.; Guo, F. How Do Urban Morphological Blocks Shape Spatial Patterns of Land Surface Temperature over Different Seasons? A Multifactorial Driving Analysis of Beijing, China. Int. J. Appl. Earth Obs. Geoinf. 2022, 106, 102648. [Google Scholar] [CrossRef]
- Saaty, T.L.; Kearns, K.P. The Analytic Hierarchy Process; McGraw-Hill: New York, NY, USA, 1985. [Google Scholar]
- Saaty, T.L. A Scaling Method for Priorities in Hierarchical Structures. J. Math. Psychol. 1977, 15, 234–281. [Google Scholar] [CrossRef]
- Leake, C.; Malczewski, J. GIS and Multicriteria Decision Analysis; Wiley: New York, NY, USA, 2000; Volume 51. [Google Scholar]
- Xue, R.; Wang, C.; Liu, M.; Zhang, D.; Li, K.; Li, N. A New Method for Soil Health Assessment Based on Analytic Hierarchy Process and Meta-Analysis. Sci. Total Environ. 2019, 650, 2771–2777. [Google Scholar] [CrossRef] [PubMed]
- Lyu, H.M.; Sun, W.J.; Shen, S.L.; Arulrajah, A. Flood Risk Assessment in Metro Systems of Mega-Cities Using a GIS-Based Modeling Approach. Sci. Total Environ. 2018, 626, 1012–1025. [Google Scholar] [CrossRef] [PubMed]
- Guo, B.; Zang, W.; Yang, X.; Huang, X.; Zhang, R.; Wu, H.; Yang, L.; Wang, Z.; Sun, G.; Zhang, Y. Improved Evaluation Method of the Soil Wind Erosion Intensity Based on the Cloud–AHP Model under the Stress of Global Climate Change. Sci. Total Environ. 2020, 746, 141271. [Google Scholar] [CrossRef]
- Mokarram, M.; Pourghasemi, H.R.; Hu, M.; Zhang, H. Determining and Forecasting Drought Susceptibility in Southwestern Iran Using Multi-Criteria Decision-Making (MCDM) Coupled with CA-Markov Model. Sci. Total Environ. 2021, 781, 146703. [Google Scholar] [CrossRef]
- Camara, M.; Jamil, N.R.; Abdullah, A.F.B.; Hashim, R.B.; Aliyu, A.G. Economic and Efficiency Based Optimisation of Water Quality Monitoring Network for Land Use Impact Assessment. Sci. Total Environ. 2020, 737, 139800. [Google Scholar] [CrossRef]
- Bennett, M.M.; Smith, L.C. Advances in Using Multitemporal Night-Time Lights Satellite Imagery to Detect, Estimate, and Monitor Socioeconomic Dynamics. Remote Sens. Environ. 2017, 192, 176–197. [Google Scholar] [CrossRef]
- Gong, Z.; Ma, Q.; Kan, C.; Qi, Q. Classifying Street Spaces with Street View Images for a Spatial Indicator of Urban Functions. Sustainability 2019, 11, 6424. [Google Scholar] [CrossRef]
- Geist, C.; McManus, P.A. Geographical Mobility over the Life Course: Motivations and Implications. Popul. Space Place 2008, 14, 283–303. [Google Scholar] [CrossRef]
- Lange, E. Our Shared Landscape: Design, Planning and Management of Multifunctional Landscapes. J. Environ. Manag. 2008, 89, 143–145. [Google Scholar] [CrossRef] [PubMed]
- Lovell, S.T.; Johnston, D.M. Creating Multifunctional Landscapes: How Can the Field of Ecology Inform the Design of the Landscape? Front. Ecol. Environ. 2009, 7, 212–220. [Google Scholar] [CrossRef]
- Waddell, P. Reconciling Household Residential Location Choices and Neighborhood Dynamics. Sociol. Methods Res. 2006, 1–23. [Google Scholar]
- Zhou, B.; Kockelman, K.M. Microsimulation of Residential Land Development and Household Location Choices: Bidding for Land in Austin, Texas. Transp. Res. Rec. 2008, 2077, 106–112. [Google Scholar] [CrossRef]
- Li, H.; Wei, Y.D.; Wu, Y.; Tian, G. Analyzing Housing Prices in Shanghai with Open Data: Amenity, Accessibility and Urban Structure. Cities 2019, 91, 165–179. [Google Scholar] [CrossRef]
- Weisbrod, G.E.; Lerman, S.R.; Ben-Akiva, M. Tradeoffs in Residential Location Decisions: Transportation versus Other Factors. Transp. Policy Decis. Mak. 1980, 1, 13–26. [Google Scholar]
- Khraif, R.M. Permanent versus Temporary Rural Migrants in Riyadh, Saudi Arabia—A Logit Analysis of Their Intentions of Future Mobility. GeoJournal 1992, 26, 363–370. [Google Scholar] [CrossRef]
- Zhang, Y. Unequal Living Conditions between Urban Migrants and Local Residents in China. Procedia Eng. 2017, 198, 728–735. [Google Scholar] [CrossRef]
- Tang, S.; Feng, J. Understanding the Settlement Intentions of the Floating Population in the Cities of Jiangsu Province, China. Asian Pac. Migr. J. 2012, 21, 509–532. [Google Scholar] [CrossRef]
- Easteal, M.; Bannister, S.; Kang, J.; Aletta, F.; Lavia, L.; Witchel, H. Urban Sound Planning in Brighton and Hove. In Proceedings of the Forum Acusticum, Krakow, Poland, 7–12 September 2014; pp. 7–12. [Google Scholar]
- Henshaw, V. Urban Smellscapes: Understanding and Designing City Smell Environments. In Urban Smellscapes; Routledge: New York, NY, USA, 2013; pp. 1–256. [Google Scholar]
- Lepore, F.; Kostara-Konstantinou, E.; Aletta, F.; Astolfi, A.; Kang, J. A Preliminary Investigation about the Influence of Soundscapes on People’s Behaviour in an Open Public Space. In Proceedings of the 45th International Congress and Exposition on Noise Control Engineering, Hamburg, Germany, 21–24 August 2016; Volume 6, pp. 5219–5224. [Google Scholar]
- Pheasant, R.; Horoshenkov, K.; Watts, G.; Barrett, B. The Acoustic and Visual Factors Influencing the Construction of Tranquil Space in Urban and Rural Environments Tranquil Spaces-Quiet Places? J. Acoust. Soc. Am. 2008, 123, 1446–1457. [Google Scholar] [CrossRef]


| Type | Metrics | Acronym | Description |
|---|---|---|---|
| Visual perception factors of public spaces | Street visual greening | SVG | |
| Street visual sky openness | SVS | ||
| Street visual enclosure | SVE | ||
| Street visual motorization | SVM | ||
| Street visual humanization | SVH | ||
| Shannon’s diversity index | SHDI | ||
| Simpson’s Diversity Index | SIDI | ||
| Spatial perception factors of urban facilities | Walking accessibility to office facilities | W-O | Number of office facilities within a 15-min walk |
| Walking accessibility to traffic facilities | W-T | Number of traffic facilities within a 15-min walk | |
| Walking accessibility to commercial facilities | W-C | Number of commercial facilities within a 15-min walk | |
| Walking accessibility to residential facilities | W-R | Number of residential facilities within a 15-min walk | |
| Walking accessibility to science education and health facilities | W-SH | Number of science education and health facilities within a 15-min walk | |
| Walking accessibility to green space and square facilities | W-G | Number of green space and square facilities within a 15-min walk | |
| Cycling accessibility to office facilities | C-O | Number of office facilities within a 15-min cycle | |
| Cycling accessibility to traffic facilities | C-T | Number of traffic facilities within a 15-min cycle | |
| Cycling accessibility to commercial facilities | C-C | Number of commercial facilities within a 15-min cycle | |
| Cycling accessibility to residential facilities | C-R | Number of residential facilities within a 15-min cycle | |
| Cycling accessibility to science education and health facilities | C-SH | Number of science education and health facilities within a 15-min cycle | |
| Cycling accessibility to green space and square facilities | C-G | Number of green space and square facilities within a 15-min cycle | |
| Driving accessibility to office facilities | D-O | Number of office facilities within a 15-min drive | |
| Driving accessibility to traffic facilities | D-T | Number of traffic facilities within a 15-min drive | |
| Driving accessibility to commercial facilities | D-C | Number of commercial facilities within a 15-min drive | |
| Driving accessibility to residential facilities | D-R | Number of residential facilities within a 15-min drive | |
| Driving accessibility to science education and health facilities | D-SH | Number of science education and health facilities within a 15-min drive | |
| Driving accessibility to green space and square facilities | D-G | Number of green space and square facilities within a 15-min drive |
| Criterion | Interaction |
|---|---|
| Weaken (nonlinear) | |
| Uni-weaken(nonlinear) | |
| Bi-enhance | |
| Independent | |
| Enhance (nonlinear) |
| Scale | Meaning |
|---|---|
| 1 | Compared with j, i and j have the same influence |
| 3 | Compared with j, i has a slightly stronger influence |
| 5 | Compared with j, i has a obviously stronger influence |
| 7 | Compared with j, i has an especially stronger influence |
| 9 | Compared with j, i has a extremely stronger influence |
| 2, 4, 6, 8 | The intermediate situation of the above two adjacent judgment results |
| 1, 1/2, ……, 1/9 | The influence ratio of i and j is contrary to the above description |
| SVG | SVS | SVM | SVE | SVH | SHDI | SIDI |
| / | 0.38 *** | / | 0.42 *** | 0.29 *** | / | / |
| Target Layer | Rule Layer | Index Layer | Weight |
|---|---|---|---|
| Settlement intention index (SII) | Visual perception factor of public space | SVE | 0.1768 |
| SVS | 0.1768 | ||
| SVH | 0.0806 | ||
| SHDI | 0.0659 | ||
| Spatial perception factor of urban facilities | C-T | 0.1028 | |
| C-R | 0.1028 | ||
| C-O | 0.0819 | ||
| C-SH | 0.0819 | ||
| C-G | 0.0653 | ||
| C-C | 0.0653 |
Publisher’s Note: MDPI stays neutral with regard to jurisdictional claims in published maps and institutional affiliations. |
© 2022 by the authors. Licensee MDPI, Basel, Switzerland. This article is an open access article distributed under the terms and conditions of the Creative Commons Attribution (CC BY) license (https://creativecommons.org/licenses/by/4.0/).
Share and Cite
Qi, J.; Meng, Q.; Zhang, L.; Wang, X.; Gao, J.; Jing, L.; Jancsó, T. Contributing Factors and Trend Prediction of Urban-Settled Population Distribution Based on Human Perception Measurement: A Study on Beijing, China. Remote Sens. 2022, 14, 3965. https://doi.org/10.3390/rs14163965
Qi J, Meng Q, Zhang L, Wang X, Gao J, Jing L, Jancsó T. Contributing Factors and Trend Prediction of Urban-Settled Population Distribution Based on Human Perception Measurement: A Study on Beijing, China. Remote Sensing. 2022; 14(16):3965. https://doi.org/10.3390/rs14163965
Chicago/Turabian StyleQi, Junnan, Qingyan Meng, Linlin Zhang, Xuemiao Wang, Jianfeng Gao, Linhai Jing, and Tamás Jancsó. 2022. "Contributing Factors and Trend Prediction of Urban-Settled Population Distribution Based on Human Perception Measurement: A Study on Beijing, China" Remote Sensing 14, no. 16: 3965. https://doi.org/10.3390/rs14163965