
Assessment of Saildrone Extreme Wind Measurements in Hurricane Sam Using MW Satellite Sensors


1
Remote Sensing Systems, 444 10th Street, Suite 200, Santa Rosa, CA 95401, USA
2
NOAA/AOML, 4301 Rickenbacker Cswy, Miami, FL 33149, USA
*
Author to whom correspondence should be addressed.
Remote Sens. 2022, 14(12), 2726; https://doi.org/10.3390/rs14122726
Submission received: 24 April 2022
/
Revised: 2 June 2022
/
Accepted: 4 June 2022
/
Published: 7 June 2022
(This article belongs to the Special Issue High Winds and High Seas)
Abstract
:In 2021, a novel NOAA-Saildrone project deployed five uncrewed surface vehicle Saildrones (SDs) to monitor regions of the Atlantic Ocean and Caribbean Sea frequented by tropical cyclones. One of the SDs, SD-1045, crossed Hurricane Sam (Category 4) on September 30, providing the first-ever surface-ocean videos of conditions in the core of a major hurricane and reporting near-surface winds as high as 40 m/s. Here, we present a comprehensive analysis and interpretation of the Saildrone ocean surface wind measurements in Hurricane Sam, using the following datasets for direct and indirect comparisons: an NDBC buoy in the path of the storm, radiometer tropical cyclone (TC) winds from SMAP and AMSR2, wind retrievals from the ASCAT scatterometers and SAR (RadarSat2), and HWRF model winds. The SD winds show excellent consistency with the satellite observations and a remarkable ability to detect the strength of the winds at the SD location. We use the HWRF model and satellite data to perform cross-comparisons of the SD with the buoy, which sampled different relative locations within the storm. Finally, we review the collective consistency among these measurements by describing the uncertainty of each wind dataset and discussing potential sources of systematic errors, such as the impact of extreme conditions on the SD measurements and uncertainties in the methodology.
1. Introduction
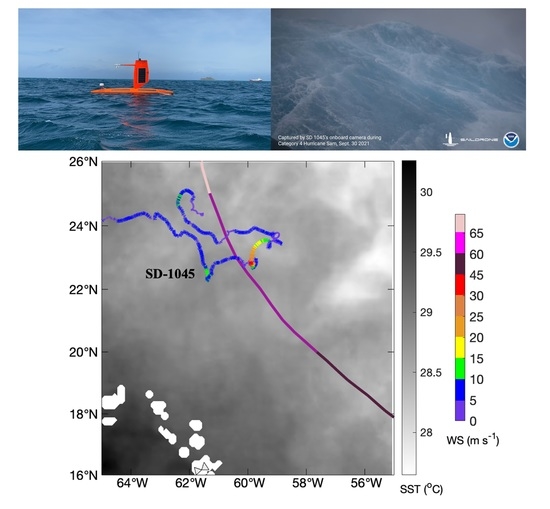
In situ measurements of extreme winds within hurricanes are challenging and scarce at the global level [1]. At present, these measurements are mostly provided by reconnaissance flights, which observe hurricane winds using dropsondes and Stepped Frequency Microwave Radiometers (SFMRs) [2], which are most often in the tropical North Atlantic. In the summer and fall of 2021, a novel project deployed five uncrewed surface vehicle Saildrones (SDs) in regions of the western tropical/subtropical Atlantic and Caribbean Sea where tropical cyclones (TCs) frequently travel. One of the SDs, SD-1045, crossed through the eyewall of Hurricane Sam (Cat. 4) on 30 September 2021, providing views from the ocean’s surface of conditions within a major hurricane. SD-1045 reported near-surface winds as high as about 40 m/s and significant wave heights of up to 14 m, with occasional waves up to 27.6 m.
These unprecedented direct measurements of the ocean near-surface hurricane winds were obtained using a sonic anemometer mounted on top of the SD. One-minute averaged winds were collected continuously as Hurricane Sam passed over SD-1045. The SD also measured other geophysical variables crucial for understanding the physics of air–sea interactions that affect the formation and intensification of hurricanes. These variables include sea level pressure (SLP), sea surface temperature (SST) and air temperature (Tair), surface salinity, significant wave height (SWH), solar radiation, relative humidity (RH), and ocean currents. Navigation data were used to automatically correct the anemometer measurements for the drone’s movement. The suite of SD observations in Hurricane Sam can therefore be considered one of the most important recent observational advances in hurricane research, as the SD provides complete and continuous monitoring of the upper ocean and air–sea interface and can potentially reach remote regions inaccessible to reconnaissance flights.
Before they can be used for operational purposes in forecast and data assimilation models, the accuracy of the SD surface wind observations in these extreme conditions needs to be verified with trusted ground truth wind measurements from different observational platforms. With this objective in mind, here, we focus on a comprehensive comparison of the SD observations with precisely colocated and nearly simultaneous satellite observations from microwave radiometers, scatterometers, Synthetic Aperture Radars (SARs), and a moored buoy that was in the path of Hurricane Sam on the same day, about 150 km southwest of SD-1045. In addition, we use the surface wind field from the Hurricane Weather Research and Forecasting (HWRF) model to aid interpretation of the observations when they cannot be directly compared, as is the case for the SD and the buoy.
One of the biggest challenges pertaining to wind measurements in hurricanes is the limited availability of in situ observations. Reconnaissance flights operated by NOAA and the US Air Force provide vital information for assimilation into forecast models. However, these flights predominantly acquire measurements of TCs occurring in the Atlantic basin and only rarely fly into storms in the East Pacific, as they have limited ability to reach remote locations due to their maximum 8–10 h flight time. Direct measurements in hurricanes have been provided by anemometers on buoys, but the likelihood of a buoy being in the path of a major hurricane is extremely low. Additionally, the accuracy of buoy wind measurements in hurricane conditions has not been sufficiently explored.
Therefore, in remote areas, satellite data are often the only source of information, although satellite estimates of wind fields and hurricane intensity are indirect. For continuous monitoring, infrared/visible (IR/VIS) observations from geostationary satellites use an empirical technique (Dvorak) to monitor the evolution of storm intensity. This technique relates observed cloud patterns and inferred geophysical properties of the storm environment to an actual storm intensity [3,4]. IR/VIS radiation does not penetrate clouds, so these measurements are from cloud tops. Other mature sensors, such as scatterometers and radiometers on polar-orbiting satellites, operate in the microwave spectrum (C–Ka band) and do penetrate clouds, but due to their antenna size, they observe the ocean surface at limited spatial resolutions (12–50 km). Most recently, SARs, which operate at C-band frequencies and have the capability to measure cross-polarization (i.e., RadarSat, or Sentinel 1A,B), began acquiring and distributing data from TCs at a resolution of about 3 km. Studies have shown that SARs have the capability to measure wind speeds up to Category 5 (70 m/s) [5,6]. However, SAR data acquisition presents some challenges, as it has to be planned in advance due to the large volume of data. All of these satellite retrievals are based on geophysical model functions (GMFs) that convert the observables (emissivity or backscatter) to a standard 10 m Equivalent Neutral Wind [7]. The GMFs rely on ground truth wind observations for model training, calibration, and post-processing validation. Even SFMRs on hurricane-penetrating aircraft rely on a model to retrieve wind speed from the radiometer observations; therefore, they also need to be calibrated to some ground truth. Finally, dropsondes from reconnaissance flights acquire in situ (but indirect) measurements based on GPS displacement caused by the storm winds. They provide the most fundamental wind ground truth in the cores of TCs.
For these reasons, acquiring direct measurements inside the core of a major hurricane with a surface vessel drone was a remarkable achievement. It was a risky experimental mission that exceeded expectations. No vessel had ever successfully sailed through a Category 4 hurricane, and the images and videos from SD-1045 inside Sam were shared with the media and broadcast worldwide. If proven accurate, this type of wind measurement will aid in monitoring the development of storms, particularly in areas inaccessible to reconnaissance flights, and it can be assimilated by forecast systems to potentially improve TC intensity predictions. After validation of a sufficient number of missions crossing hurricane paths, the SDs can potentially become a reliable source of ground truth for calibrating satellite model functions at high/extreme winds and for validating all other indirect wind measurements. Additionally, along with the data from other SD sensors, the SD wind measurements are useful for studying air–sea interaction and the formation and intensification of TCs [8]. Therefore, in these early days of the SD missions, it is important to understand the accuracy, potential limitations, and sources of uncertainty of the SD wind measurements.
The main objective of this manuscript is to assess the accuracy of the SD-1045 wind measurements in the extreme conditions encountered during Hurricane Sam. While SD winds have previously been validated through comparison to buoys in low-to-moderate wind regimes [9,10], this type of analysis has never been carried out for the extreme winds in a hurricane. Note that in situ measurements from SFMRs [2] onboard hurricane-penetrating aircrafts in Hurricane Sam are available from the NOAA/AOML Hurricane Research Division but not for the day SD-1045 was in the core of the storm. At this time, the available dropsondes are point measurements that are not colocated or coincident with the SD-1045 measurements and are therefore difficult to use for a detailed comparison. We use different validation methods, including observations from satellites, the National Data and Buoy Center (NDBC) buoy 41044, and guidance from a hurricane high-resolution forecast model. Having multiple sources of comparison allows for a more robust assessment.
The analysis presented here shows that when properly interpreted and adjusted to a height of 10 m, the SD wind measurements in Hurricane Sam are accurate and consistent with the satellite radiometers, scatterometers, and SAR, all of which report 10 m peak winds at or above 50 m/s. The adjustment of SD winds to a reference height of 10 m presented here will be useful for future SD missions. The SDs provide valuable near-real-time information to operational and forecast centers and can be used for cross-validation with all other wind datasets.
The paper is organized as follows: Section 2 gives a brief overview of the SD-1045 mission, describes the surface wind datasets in Hurricane Sam from SD-1045, buoy 41044, satellite radiometers, scatterometers, and SAR, and the HWRF model used in this study. Section 3 describes the methodology for adjusting the SD and buoy datasets to 10 m, which includes a correction for buoy/vessel tilting that lowers the actual anemometer reference height. Section 4 and Section 5 describe the comparisons with the buoy, satellite, and the HWRF model. In Section 6, we provide a discussion on the significance and sources of uncertainty of the SD wind assessment in Hurricane Sam as well as plans for future missions and validation in hurricanes regimes. Results are summarized and conclusions are given in Section 7. Three figures are provided in the Supplementary Material to support topics discussed in the manuscript.
2. Saildrone and Other Wind Observations in Hurricane Sam
Hurricane Sam was the longest-lived major hurricane in the Atlantic in 2021: it formed off the Cape Verde islands on 22 September 2021 and maintained category 3–4 intensity (50–70 m/s, referring to maximum 1 min sustained winds) for an extended period of time, between 25 September and 2 October (Figure 1a). It reached its peak intensity of 69 m/s (135 kt) on 26 September; then, it weakened to 54 m/s (105 kt) and underwent two eyewall replacement cycles (27 and 29–30 September), regaining strength after each one. Sam reached a secondary peak of 67 m/s (130 kt) on 1 October, threatening the Bermuda Islands with tropical storm-force winds. It transitioned to an extratropical storm on 5 October and finally dissipated on 7 October [11]. In the following subsections, we describe hurricane-force winds in Sam as observed by SD-1045 and compare them to satellite observations, measurements from a buoy, and the surface wind field from a forecast model.
2.1. Saildrone SD-1045
Saildrones are autonomous uncrewed surface ocean vehicles (USVs) that are propelled by the wind with a rigid sail, and their sensors are powered by solar radiation and wave energy [12]. They collect climate-quality measurements, with accuracies similar to those of moored buoys, and transmit data in real time during deployment lengths of up to one year. Five specially designed extreme-weather Saildrone USVs were deployed during the 2021 Atlantic hurricane season with the goal of acquiring data from within hurricanes [9,10,13]. In this study, we use data from Saildrone SD-1045, which was deployed from the U.S. Virgin Islands in July 2021 and followed an eastward trajectory to the western tropical Atlantic during August–October (Figure 1).
SD-1045 measured wind velocity at a nominal height of 3.4 m using a three-dimensional ultrasonic anemometer (Gill WindMaster) set to a 20 Hz sampling rate. Its manufacturer-stated accuracy is ±1.5%. For accurate wind measurements, precise knowledge of the vehicle motion and orientation are required. Therefore, the anemometer’s sampling was synchronized with the vehicle’s inertial navigation system and inertial measurement units. They measured the three-dimensional motion of the vehicle’s hull and wing and its speed over ground, and the motion corrections were applied in real time, giving the three-dimensional wind velocity relative to the fixed earth. SD-1045 also measured air temperature and relative humidity at 2.3 m, surface barometric pressure, photosynthetically active radiation, significant wave height and period, ocean temperature and salinity at a depth of 1.5 m, ocean currents between depths of 6 and 90 m, chlorophyll concentration at 2 m, and ocean oxygen concentration at 0.5 m. The one-minute averaged wind velocity, air temperature, relative humidity, barometric pressure, ocean temperature, ocean currents at 6 m depth, and significant wave height are used in this study. Some of these fields are displayed in Figure 2. Wind gusts, defined as the maximum 3 s averaged wind speed in each 1 min interval, are also shown. We use SD-1045’s one-minute averaged anemometer height (sampled at 20 Hz) to adjust the wind speed to a standard height of 10 m. In strong winds and waves, the anemometer height was sometimes significantly less than 3.4 m due to tilting of the Saildrone USV (Figure 2c).
During 20–30 September 2021, SD-1045 was directed eastward to intercept Hurricane Sam (Figure 1a). As the hurricane’s eye approached, SD-1045 was positioned to face into the wind and waves to help hold its position and minimize vehicle rolling (Figure 1b). Even with these preparations, the Saildrone rolled more than 90 degrees several times, with a peak roll of 130 degrees during wind gusts exceeding 50 m/s and significant wave heights of up to 14 m (maximum individual wave height was 27.6 m) (Figure 2), about 35 km from the storm’s center. Hurricane Sam had maximum 1 min. sustained winds of 65 m/s (125 kt) when its eyewall passed over the Saildrone on that day [11] (details at https://www.nhc.noaa.gov/archive/2021/al18/al182021.discus.032.shtml?, accessed on 8 April 2022). This study focuses on the period 22 September to 6 October 2021 (Julian days 265–279). Scientific and navigational SD-1045 data for this period were extracted from files at https://data.pmel.noaa.gov/pmel/erddap/search/index.html?page=1&itemsPerPage=1000&searchFor=Saildrone+Hurricane+Monitoring+2021+NRT+data (accessed on 1 February 2022).
2.2. Moored Buoy 41044
On 30 September 2021, a moored buoy from the National Data Buoy Center (NDBC) was in the path of the core of Hurricane Sam. The buoy is identified by the WMO_ID=41044, and it is moored at (301.3E, 21.6N). It measures wind speed with an RM Young Propeller anemometer mounted at a nominal height of 3.8 m, with winds averaged over 8 min and reported every 10 min. In addition to wind speed, the buoy provides observations of SST at a depth of 2 m, Tair at 3.4 m, SLP at 2.4 m, and wind direction. In this study, we used all of these fields from the 10 min buoy datafile for 2021 distributed by NDBC (https://www.ndbc.noaa.gov/station_history.php?station=41044, accessed on 28 January 2022), with the exception of wind direction, which was missing during the period analyzed here. The buoy anemometer registered a maximum wind speed of 32.2 m/s on 30 September 2021 at about 06:30 UTC. It is worth noting that the buoy recorded winds above 30 m/s for an extended period of time, from 06:00 until 09:30 UTC, when positioned within 50–70 km of the storm’s center. The uncertainty of buoy measurements for high wind speed is estimated to be about 1–2 m/s [14,15].
2.3. Satellite Radiometer Winds
Satellite observations of ocean surface winds, as measured by a series of microwave (MW) radiometers and scatterometers, have been available on a daily basis since 1987, and they are routinely used for marine forecasting [1,16]. Wind measurements in TCs are particularly challenging, as some sensors lose sensitivity at extreme winds above 30 m/s, and the measurements can be biased in the intense rain typical of tropical storms and hurricanes [17]. Recent advances have enabled more accurate wind measurements in such conditions: newer radiometers operating at lower MW frequencies that are mostly unaffacetd by rain and new dedicated algorithms specifically trained in TCs. In this study, we will use a new suite of radiometer wind products developed at Remote Sensing Systems (RSS) for this type of measurement: the RSS TC-winds [18]. These products include wind measurements in TCs obtained by SMAP (Soil Moisture Active Passive) [19], an L-band radiometer unaffected by rain, AMSR-E/AMSR2 (Advanced Microwave Scanning Radiometer) and WindSat. The TC-wind retrieval algorithms for AMSR-E, AMSR2, and WindSat have been trained and corrected for rain in TC conditions using SMAP measurements. These winds have been extensively validated in tropical storms [20] and are routinely used for assimilation into forecast tools such as the US Navy’s Automated Tropical Cyclone Forecasting Systems (ATCF) [21]. The average uncertainty associated with these satellite wind speed observations in TCs is on the order of 10%. The TC winds are produced in near real time and distributed to the public as twice-daily gridded maps on a 0.25 × 0.25 degree Earth Grid on the RSS website (https://www.remss.com/tropical-cyclones/tc-winds/, accessed on 7 January 2022). The SMAP winds are valid at global scales but are less accurate at speeds below 10 m/s due to reduced sensitivity to wind speed. As mentioned above, AMSR-E, AMSR2, and WindSat TC-wind retrievals are specifically trained for TC conditions. Therefore, despite being global products, they are only available in regions where SST is greater than 25 °C and wind speeds are greater than 10 m/s. The uncertainty of radiometer winds in TCs is about 10% [18,19]. An AMSR2 global all-weather wind product (AMSR2 AW-winds), which uses a traditional algorithm for its retrievals and is valid at all wind speeds and SST regimes, is also used for one of the analyses presented here for comparison with other satellite wind products. WindSat stopped operating in November 2020 and was therefore not available during the case study presented here. For a comprehensive approach, we also included comparisons with traditional radiometer wind products, such as the rain-free GMI and SSMIS 10 m winds.
2.4. Satellite Scatterometer Winds
In addition to the radiometer observations, we present comparisons using traditional scatterometer winds from the ASCAT (Advanced Scatterometer) sensors on the MetOp-A, -B, and -C satellites, which were all available during Hurricane Sam. The ASCAT wind products used here [22] were developed and processed at RSS and are freely available at https://www.remss.com/missions/ascat/ (accessed on 7 January 2022) as swath data or twice-daily gridded 0.25 degree maps. The ASCAT surface wind retrievals are only slightly affected by rain at extreme winds [22], with an uncertainty of 1–2 m/s. However, the signal of this C-band co-polarization (VV-pol) scatterometer displays a reduced sensitivity for winds above about 35 m/s, resulting in underestimated surface winds in hurricanes above Category 1 (33–42 m/s) [17,19].
2.5. Satellite Synthetic Aperture Radar (SAR) Winds
An emerging sensor technology for wind measurements in storms uses a C-band Synthetic Aperture Radar. It includes a cross-polarization mode (VH), which exhibits better sensitivity at high wind speeds compared to co-polarized channels (VV, HH), which lose sensitivity in high winds [23]. Depending on the operation mode, the SARs can obtain measurements at fine resolutions of just a few meters. When used for remote sensing of tropical storms, the SAR operates in wide swath mode and has a resolution on the order of 1–3 km. Wind retrievals are reported at a reference height of 10 m and can be interpreted as 1 min sustained winds. Recent studies have proven that SARs can provide some of the most accurate high-resolution observations of TC surface winds for intensities up to Category 5, with uncertainties on the order of 10% [5,6,17]. In this study, we used winds from the Canadian Space Agency RadarSat2 (RS2). The SAR wind retrievals used here were processed at the IFREMER (Institut Français de Recherche pour l’Exploitation de la Mer). The satellite passed over Hurricane Sam at 09:58 UTC on September 30, when SD-1045 was positioned north of the core of the storm. The scan width for the observations was about 450 km, with a spatial resolution of 3 km. All of the SAR data used here are publicly available at https://cyclobs.ifremer.fr/app/tropical (accessed on 15 February 2022).
Table 1 summarizes the observing properties of each of the satellite sensors used for the assessment of the SD wind observations
2.6. Hurricane Weather Research and Forecasting (HWRF) Model
The Hurricane Weather Research and Forecasting (HWRF) system is a high-resolution model developed and operated by the NOAA/NWS/NCEP Environmental Modeling Center for TC applications [24]. HWRF is used by several operational agencies such as the National Hurricane Center (NHC) and the Joint Typhoon Warning Center (JTWC) for forecasting the evolution of TCs in all tropical ocean basins and providing guidance to the community. The model is structured in nested domains, with a large parent domain (about 70° × 70°) and two smaller nested domains that follow the storm. TC field analyses are produced every 6 h, which are initialized with satellite data and in situ observations from instruments on hurricane-penetrating aircrafts and dropsondes. These 0 h analyses (00Z, 06Z, 12Z, and 18Z) are not forecasts but rather represent the state of the storm at those realization times. From these, 3-hourly forecast fields are produced. In this study, we used data from the 0 h analyses for the smaller domains (9° × 9° and ≈1.5 km resolution) and the 3 h forecast fields between the 6-hourly realization times. This was completed to maximize the chances that the SD-1045 would be in the frame of the HWRF storm wind field and that a satellite pass would be available within a short time window, enabling meaningful comparisons. When comparing the HWRF model wind to SD wind, we used the ≈1.5 km original resolution data. In contrast, for comparison between the HWRF and the satellite data, we resampled the HWRF data to a resolution representative of the satellite footprint, using a weighted Gaussian resampling window with 40 km half-power width. We also shifted the model storm to coincide with the storm center at the time of the satellite pass when needed. This methodology is described in detail in [20]. In addition to the model surface wind, one particular analysis in our study uses the sea level pressure field from HWRF.
3. Methodology: Comparison of SD and Buoy Measurements to Satellite Winds
In order to compare surface wind measurements from different observing systems at different temporal and spatial scales, it is important to adjust them to the same reference height and perform ad hoc averages or resampling such that they are representative of similar scales. In this section, we will briefly describe how we adjusted the original datasets to ensure meaningful comparisons.
Hurricane Sam was not a large storm: the radius of hurricane-force winds (defined by the Saffir–Simpson scale as the region with winds above 64 kt, or 33 m/s, https://www.nhc.noaa.gov/aboutsshws.php, accessed on 27 May 2022) was on the order of 40–50 nm (75–90 km). Therefore, validation studies must be performed using a very tight colocation window in space and time. Buoy 41044 and SD-1045 sampled different regions of the storm, so they cannot be compared directly. We will use third-party datasets (from satellites and HWRF) to cross-validate SD and buoy winds. We will also discuss the sources of uncertainty in each wind dataset, including the SD measurements.
The biggest challenge when comparing in situ and satellite data is that direct wind observations from buoys/vessels are from anemometers mounted at a nominal height of 3–5 m, whereas satellites provide indirect measurements as 10 m Equivalent Neutral winds. In high seas, it is hard to estimate the actual height of the anemometers because the sea state/waves can significantly tilt the buoys/vessels.
In addition, satellite radiometers and scatterometers have a large footprint, while the buoy and SD refer to a point location. In order to perform meaningful and accurate comparisons, differences in spatial and temporal sampling and height of the measurements must be taken into account. Here, we will use the following approach to adjust the SD and buoy data:
- Conversion to 10 m: We use the Coupled Ocean-Atmosphere Response Experiment (COARE) 3.5 bulk air–sea flux algorithm to characterize the wind speed profile in the boundary layer and convert the SD and buoy wind measurements to a standard 10 m height, using air–sea observed parameters from the SD and buoy themselves.
- Tilting of anemometer: We use the actual height of the anemometer from the SD navigation record, which includes changes due to tilting effects in strong winds. The buoy does not report the actual height of the anemometer. We inferred it by applying a tilting correction that is similar to the one observed by the SD.
- Time-averaging: For comparisons with satellite data, we perform a time-average of the SD 1 min wind data over a 10 min window so the data are more representative of the scales observed by a satellite footprint.
We chose assumptions and algorithms that represent the most recent state of knowledge in the field, although each has some uncertainty. Additional sources of uncertainty in the comparisons presented in this work arise from: wave-sheltering effects on the SD and buoy; the potential residual impact of rain on the satellite wind measurements; effects of ocean currents on the wind measurements; possible saturation of the scatterometer signal at extreme winds; uncertainties in the calibration of the satellite GMF for wind regimes such as in a major hurricane; and unrealistic spatial structure or overall intensity in the HWRF model wind field.
3.1. Conversion of Saildrone and Buoy Winds to Standard 10 m Reference Height
A simple method often used to convert buoy measurements to a standard height of 10 m before comparing them to satellite data is the assumption of a logarithmic vertical wind profile [25,26], for which the wind speed U(z) at a height z is expressed as:
where U(zm) is the wind speed measured at a height of zm and zo is the roughness length, which indicates the height above the ground for which U = 0. This parameter is usually determined empirically, as it depends on the nature of the surface. A common choice for the ocean surface is zo = 1.5 × 10⁻⁴ m [25]. The expression in (1) is derived from mixing length theory assuming atmospheric neutral stability and might lead to large underestimation of the 10 m winds in extreme winds and in conditions far from stable, such as in a tropical storm environment.
For this reason, we use the COARE bulk flux algorithm, which better represents the vertical profile in a turbulent atmospheric boundary layer [27], to convert SD and buoy wind measurements to a standard height of 10 m. We use the most recent version, COARE 3.5, which includes updates developed with bulk flux measurements of winds of up to 25 m/s [28]. As the SD measured extreme winds, well above those typically used to develop the COARE algorithm, we capped zo at 0.0067 m for wind speeds above 25 m/s. This value was chosen because it represents the average zo from the COARE algorithm in the 23–25 m/s range, and it gives a drag coefficient of 3 × 10⁻³, which is consistent with results described in [29,30]. Extreme conditions with 25+ m/s winds were observed by SD-1045 for about five hours on 30 September 2021.
The COARE algorithm requires the following parameters as input: wind speed registered by the anemometer, anemometer height, SST, and air temperature and relative humidity near the surface together with their reference heights. All of these variables were available as 1 min averages from SD-1045 during Hurricane Sam.
As illustrated in Figure 2c, the actual SD anemometer height suddenly decreased from 3.4 to 2.7 m, when the SD encountered the storm’s peak winds. This tilting effect must be considered for accurate conversion of the wind observations to a reference height of 10 m. Figure 3a illustrates the impact of these choices on the SD-1045 winds on 30 September 2021. The maximum wind measured by SD-1045 at the anemometer height was 40.5 m/s; when the COARE algorithm is used without including the tilting effect, the maximum 10 m winds reached 47.5 m/s, and after including the tilting effect, they reached 50 m/s. The maximum gusts, adjusted to a 10 m height, reached 67.5 m/s.
A similar approach was used to convert the 10 min buoy data from the nominal anemometer height of 3.8 to 10 m. As mentioned in Section 2.2, the buoy also measured SST and Tair, which were used as input to the COARE algorithm. Buoy measurements of surface RH were not available during the period examined here. We used the RH measurements from SD-1045 to estimate RH in the storm environment at the buoy location: as both observing systems were in close proximity to the storm center, it is more reasonable to assume a similar time-varying RH than a constant reference value at the buoy location. However, because the peak winds at the SD-1045 location occurred about 8 h after the peak winds at the buoy, we shifted the SD-1045 RH timeseries back 8 h prior to using the SD-1045 RH for the buoy in order to better describe the environmental conditions at the buoy location relative to the storm center.
The buoy does not report the actual height of the anemometer under tilting conditions. We estimated a scaling factor to represent tilting as a function of wind speed based on the SD measurements, with the maximum reduction in the nominal height by about 20% during the peak winds. The 10 min buoy winds are shown in Figure 3b for three cases: as recorded at the anemometer height (black line), adjusted to 10 m using a traditional log-profile (cyan), and adjusted to 10 m using the COARE 3.5 (green). Peak winds for these cases are 32.2, 35.3, and 38.2 m/s, respectively. Note that for wind speeds below 20 m/s, the simple log-profile conversion to 10 m winds is almost indistinguishable from the more complex adjustment using the COARE algorithm.
3.2. Colocations with Satellite Winds
As discussed briefly in the introduction (Section 1), the in situ wind observations from the SD and buoy cannot be compared directly to the satellite winds, which represent much larger spatial scales typical of radiometers and scatterometers (12–50 km). A common approach when comparing satellite data to point measurements such as buoys is to perform temporal averages of the in situ data to account for the wind variability over a satellite footprint and the broader spatial sampling performed by the satellite [16,31]. For the high wind regime typical of a TC, we chose a temporal averaging window of 10 min for the SD data. The buoy data are already averaged over 10 min. For comparisons between the SD and the high-resolution SAR winds, we used the 1 min SD 10 m winds instead. During the peak of the storm, we found a very small standard deviation of 0.5 m/s between the 1 min and 10 min winds, indicating that the results are not very sensitive to the width of the temporal averaging window applied to the SD data.
We also compared storm scenes from the SAR winds and the HWRF model to the satellite radiometers to verify their consistency. In these cases, the high-resolution SAR and HWRF wind fields were resampled to a spatial scale representative of those of the radiometers, using a Gaussian-shaped spatial resampling window, as discussed in Section 2.6 and in more detail in [20].
4. Assessment of SD and Buoy Wind Observations in Hurricane Sam using Satellite Data
Following the methodology described in Section 3, we found all radiometer and scatterometer passes over the storm for which there was a 10 min SD wind observation with central time within ±5 min of the satellite pass and location, within a 0.25° satellite gridpoint. Figure 4a displays the time series of the SD-1045 10 m winds in Hurricane Sam with the complete set of colocations from all available satellite passes overlaid. It illustrates a remarkable agreement between SD and satellite observations in all wind regimes. For completeness, Figure 4a also displays the original SD wind observations at the nominal height of the anemometer, which were averaged over 10 min bins. Notice how the only significant difference between the measurement height and the 10 m wind speed is during the period of peak winds. Fortunately, an AMSR2 satellite pass occurred at that time, providing an unprecedented opportunity to compare the extreme wind observations.
Similarly, Figure 4a,b display the time series of 10 m winds observed at the buoy location. It includes all satellite winds available within 5 min of the central time of the buoy 10 min observations (to be considered 10 min colocations). The buoy/satellite time series displays very good agreement for wind speeds below 25 m/s. Unfortunately, there was no satellite pass within 25 km and 10 min of the buoy observations at the peak winds, meaning that at that time, the buoy was in the satellites’ swath gaps.
In Figure 5, we display the AMSR2 TC-wind satellite pass over Hurricane Sam on 30 September 2021 at 17:08 UTC, corresponding to the colocation closest to the SD peak time (red circle symbol on Julian Day 273 from the time series in Figure 4a). Figure 5 also displays the position and 10 min averaged 10 m winds for the SD, and the position and 10 m winds for the buoy at the time of the SD observations. Both measurements are color-coded to depict the wind intensity. The remarkable agreement between SD-1045 (41.5 m/s) and AMSR2 TC-winds (45.2 m/s) is apparent even when placed in the context of the storm’s highly variable wind field and the satellite wind speed uncertainty of 10%. The buoy 10 m winds (18.1 m/s) are slightly lower than the satellite observations (22.1 m/s).
Figure 6 displays the 10 m winds from the RadarSat2 SAR pass at 09:58 UTC over Hurricane Sam on 30 September 2021. In this case, the SD was farther away from the eyewall compared to the AMSR2 colocation in Figure 5 at 17:08 UTC, and the SD experienced weaker winds (21.1 m/s), which is consistent with the SAR observation (20.3 m/s) at the SD location. As discussed in Section 2.5, wind retrievals from SAR have a high spatial resolution (3 km here) and provide a detailed view of the fine structure of the surface wind field in the core of the hurricane. Visible in Figure 6 is the very small eye of the storm, about 40 km in diameter, and a small area of reduced winds to the west of the eye, which are possibly remnants of the eyewall replacement cycle that occurred on that day. Similar to Figure 5, the SD and buoy locations and corresponding 10 m wind speeds are overlaid on the satellite wind field. The buoy measured winds of 35.2 m/s, but its location fell outside of the satellite swath for this pass.
Among all lower-resolution satellite winds presented here, the most accurate in TCs are those from SMAP, which is due to their high sensitivity in strong winds and their insensitivity to rain. SMAP passed over Hurricane Sam at 10:25 UTC on 30 September 2021. Figure 7 displays a three-way comparison between the SAR surface wind field at 09:58 UTC, resampled to the SMAP resolution, and the wind field from SMAP at 10:25 UTC, with the SD and Buoy 10 min wind data at the corresponding times overlaid. Again, the SD measurements (21.5 m/s) are consistent with SMAP (23.9) and the resampled SAR (with a value of 19.5 m/s versus the SD 10 min wind of 21.0 m/s). The buoy, located just outside the satellite passes, seems to slightly underestimate the wind speed (31.5 m/s) by visual comparison.
Three-way analyses such as the one presented in Figure 7 provide the opportunity to cross-validate SMAP with the SAR, such that for future SD missions, both can be trusted as validation sources. Figure 8 presents a scatterplot of the SMAP 10 m winds versus the resampled SAR for their passes over Hurricane Sam on 30 September 2021. As these two sensors observed the scene within 30 min of each other (≈6 pm Local Ascending Node Time), a spatial shift is unnecessary because they can be considered to have the same storm center (yellow star in the Figure 7a,b).
Additionally, comparisons can be made between the Saildrone data and ASCAT-B and -C passes over Hurricane Sam at 13:30 and 14:18 UTC, respectively, on 30 September 2021 (displayed in the Supplementary Figure S1). During these passes, SD-1045 was in the core of the storm, in close proximity to the eyewall, and its 10 m winds (33.7 and 40.3 m/s, respectively) are consistent with the ASCAT retrievals (35.8 and 37.4 m/s). It is important to note that the ASCAT scatterometer signal starts losing sensitivity above 35 m/s. This might be the reason why at 40 m/s, the SD winds are higher than ASCAT-C. The buoy, again, fell just outside the ASCAT passes, and no direct comparison could be made.
5. Comparisons of In Situ and Satellite Winds in Hurricane Sam with the HWRF Model
The HWRF model can also be used to assess the accuracy of the Saildrone wind observations in hurricanes. However, one difficulty with these comparisons is that the HWRF 6 h analysis (derived from assimilating observations into a model vortex) and the 3 h forecast fields from the model might have a spatial structure more symmetrical than the real wind field in a storm. These HWRF analyses and forecasts may also show a storm center that is slightly displaced relative to the real storm location. For large storms, it might not result in a significant deviation from the actual wind field. However, for a small and intense storm such as Hurricane Sam, with strong spatial gradients and highly variable wind field (i.e., experiencing an eyewall replacement cycle), the comparisons of in situ wind observations with the model fields are less exact than comparisons to satellite wind fields.
Figure 9 illustrates the HWRF 10 m wind field from the 3 h forecast at 15Z (initialized from the 12Z 0 h analysis) on 30 September 2021, when SD-1045 experienced its peak winds, with the SD-1045 and the buoy winds overlaid. Additional comparisons with the HWRF 0 h analyses at 06Z, 12Z, and 18Z are shown in Supplementary Figure S2. At 15Z, the SD was located in the core of the storm, and its 1 min winds (48.7 m/s) are a lot lower than the HWRF (59.4 m/s); the buoy was outside the storm’s core, and its observed wind speed (20.3 m/s) matches HWRF’s at the buoy location (20.3 m/s). It is important to keep in mind that some disagreement can be expected because the location of the storm center might be slightly off in the model, and even a small displacement relative to the storm center can result in large differences in wind speed due to strong horizontal wind gradients. Nevertheless, the overall agreement between the SD and HWRF surface winds (Figure 9 and Figure S2) is good and suggests that HWRF can indeed be used for assessing the SD winds, although care must be taken regarding the placement of the storm’s center in the model.
To perform a comparison between the HWRF, SAR, and SMAP winds, in Figure 10, we resampled the HWRF 12Z high-resolution scene (in Figure S2, panel b). We used a 40 km half-width Gaussian-weighted window to represent the spatial scales seen by SMAP and applied the same method to rescale the SAR wind field. Overall, there is good consistency between the lower-resolution wind fields from HWRF 12Z (Figure 10) and SAR 09:58 UTC and SMAP 10:35 UTC (both in Figure 7). Figure 11 displays longitudinal and latitudinal cross-sections of the winds through the storm’s center for the high-resolution (solid lines) and resampled (dashed) SAR and HWRF as well as for SMAP. The lowest SAR wind speed in the eye is 14.1 m/s, while HWRF shows a minimum wind speed of 1.3 m/s. Without additional in situ data, it is difficult to assess the accuracy of HWRF’s representation of the eye width and depth. In situ measurements from the SFMR on aircraft reconnaissance flights are not available for September 30, but there are data from the NOAA P3 aircraft on September 29 (https://www.aoml.noaa.gov/ftp/hrd/data/sfmr/2021/sam/, accessed on 24 May 2022). One SFMR latitudinal cross-section of the storm is illustrated in the Supplementary Figure S3 together with HWRF and a SAR pass from Sentinel 1B on the same day. They seem to suggest that the storm’s eye in HWRF is slightly larger than from in situ aircraft measurements.
When the high-resolution wind fields from HWRF and SAR (shown in Figure 11) are resampled, the minimum wind speeds in the storm center are a lot larger (41.3 and 34.5 m/s for SAR and HWRF, respectively), due to the inclusion of the eyewall winds in the resampled central gridpoint. The longitudinal cross-section (S-N) of wind speed for the resampled SAR matches SMAP very well, while the SAR winds from the latitudinal section (W-E) are slightly lower than SMAP. Both suggest that the resampling methodology used here is reasonable.
6. Discussion: Summary of the Assessment and Uncertainties
The results from the comparison of Saildrone peak wind speeds in Hurricane Sam to tightly colocated satellite observations are summarized in Figure 12. The statistics are presented for the SD-1045 winds adjusted to 10 m using the COARE 3.5 algorithm, including a correction for change in measurement height due to the Saildrone tilting. The comparisons with satellite data are performed by first averaging the SD measurements over 10 min bins and then colocating them within 5 min of a gridded 0.25° × 0.25° satellite observation.
The figure highlights the high consistency (0.98 correlation) of the 10 m adjusted SD winds with all of the satellite winds with a small bias of −0.49 m/s and standard deviation of 1.9 m/s. These results lie within the uncertainty limits of the satellite measurements, which at extreme wind speeds are on the order of 10%.
A similar summarizing statistic for the buoy 41044 measurements versus satellite winds could not be performed because on the day the buoy observed peak winds, only one satellite (AMSR2) passed over the buoy, when the buoy was experiencing wind speeds below hurricane-force (see Figure 4b).
Although the comparisons between the satellites and the Saildrone presented in this case study indicate that the two are in good agreement, there are several additional factors that might contribute to uncertainty in the SD and satellite wind statistics in storm regimes. These include:
- Inaccurate assumptions in the COARE algorithm in extreme winds (uncertainties of ≈1–3 m/s depending on the wind speed; Figure 3).
- Neglecting ocean surface currents in the satellite wind retrievals (1–2 m/s, as shown in Figure 2e).
- Incorrect estimates of vessel/buoy tilting, which is a very small effect, as displayed in Figure 3. It is also possible that the SD anemometer was underwater for very short periods of time, affecting the average 1 min wind.
- Wave sheltering effects on the SD, which were not considered in this study, as they are too uncertain to be estimated quantitatively at this time. Preliminary estimates indicate that they could be as high as 6% of the measured wind speed. We note that the significant wave height on the peak day reached 14 m, with waves as high as 27.6 m observed (Introduction).
- Incorrect assumptions related to the direct comparison of point-wise measurements (SD and Buoy) to satellite radiometers/scatterometers sampling much coarser spatial scales (discussed in Section 3.2).
- Small biases in the satellite data due to residual rain impact on the measurement.
The HWRF model wind analyses provide insight into the storm environment at the time of the SD measurements. They are also a reference for indirect comparisons with buoy measurements despite the challenges due to the very small storm size in Hurricane Sam. These comparisons should be explored in more detail in future SD missions in hurricanes. Here, we provided a methodology and a discussion of the challenges for future use.
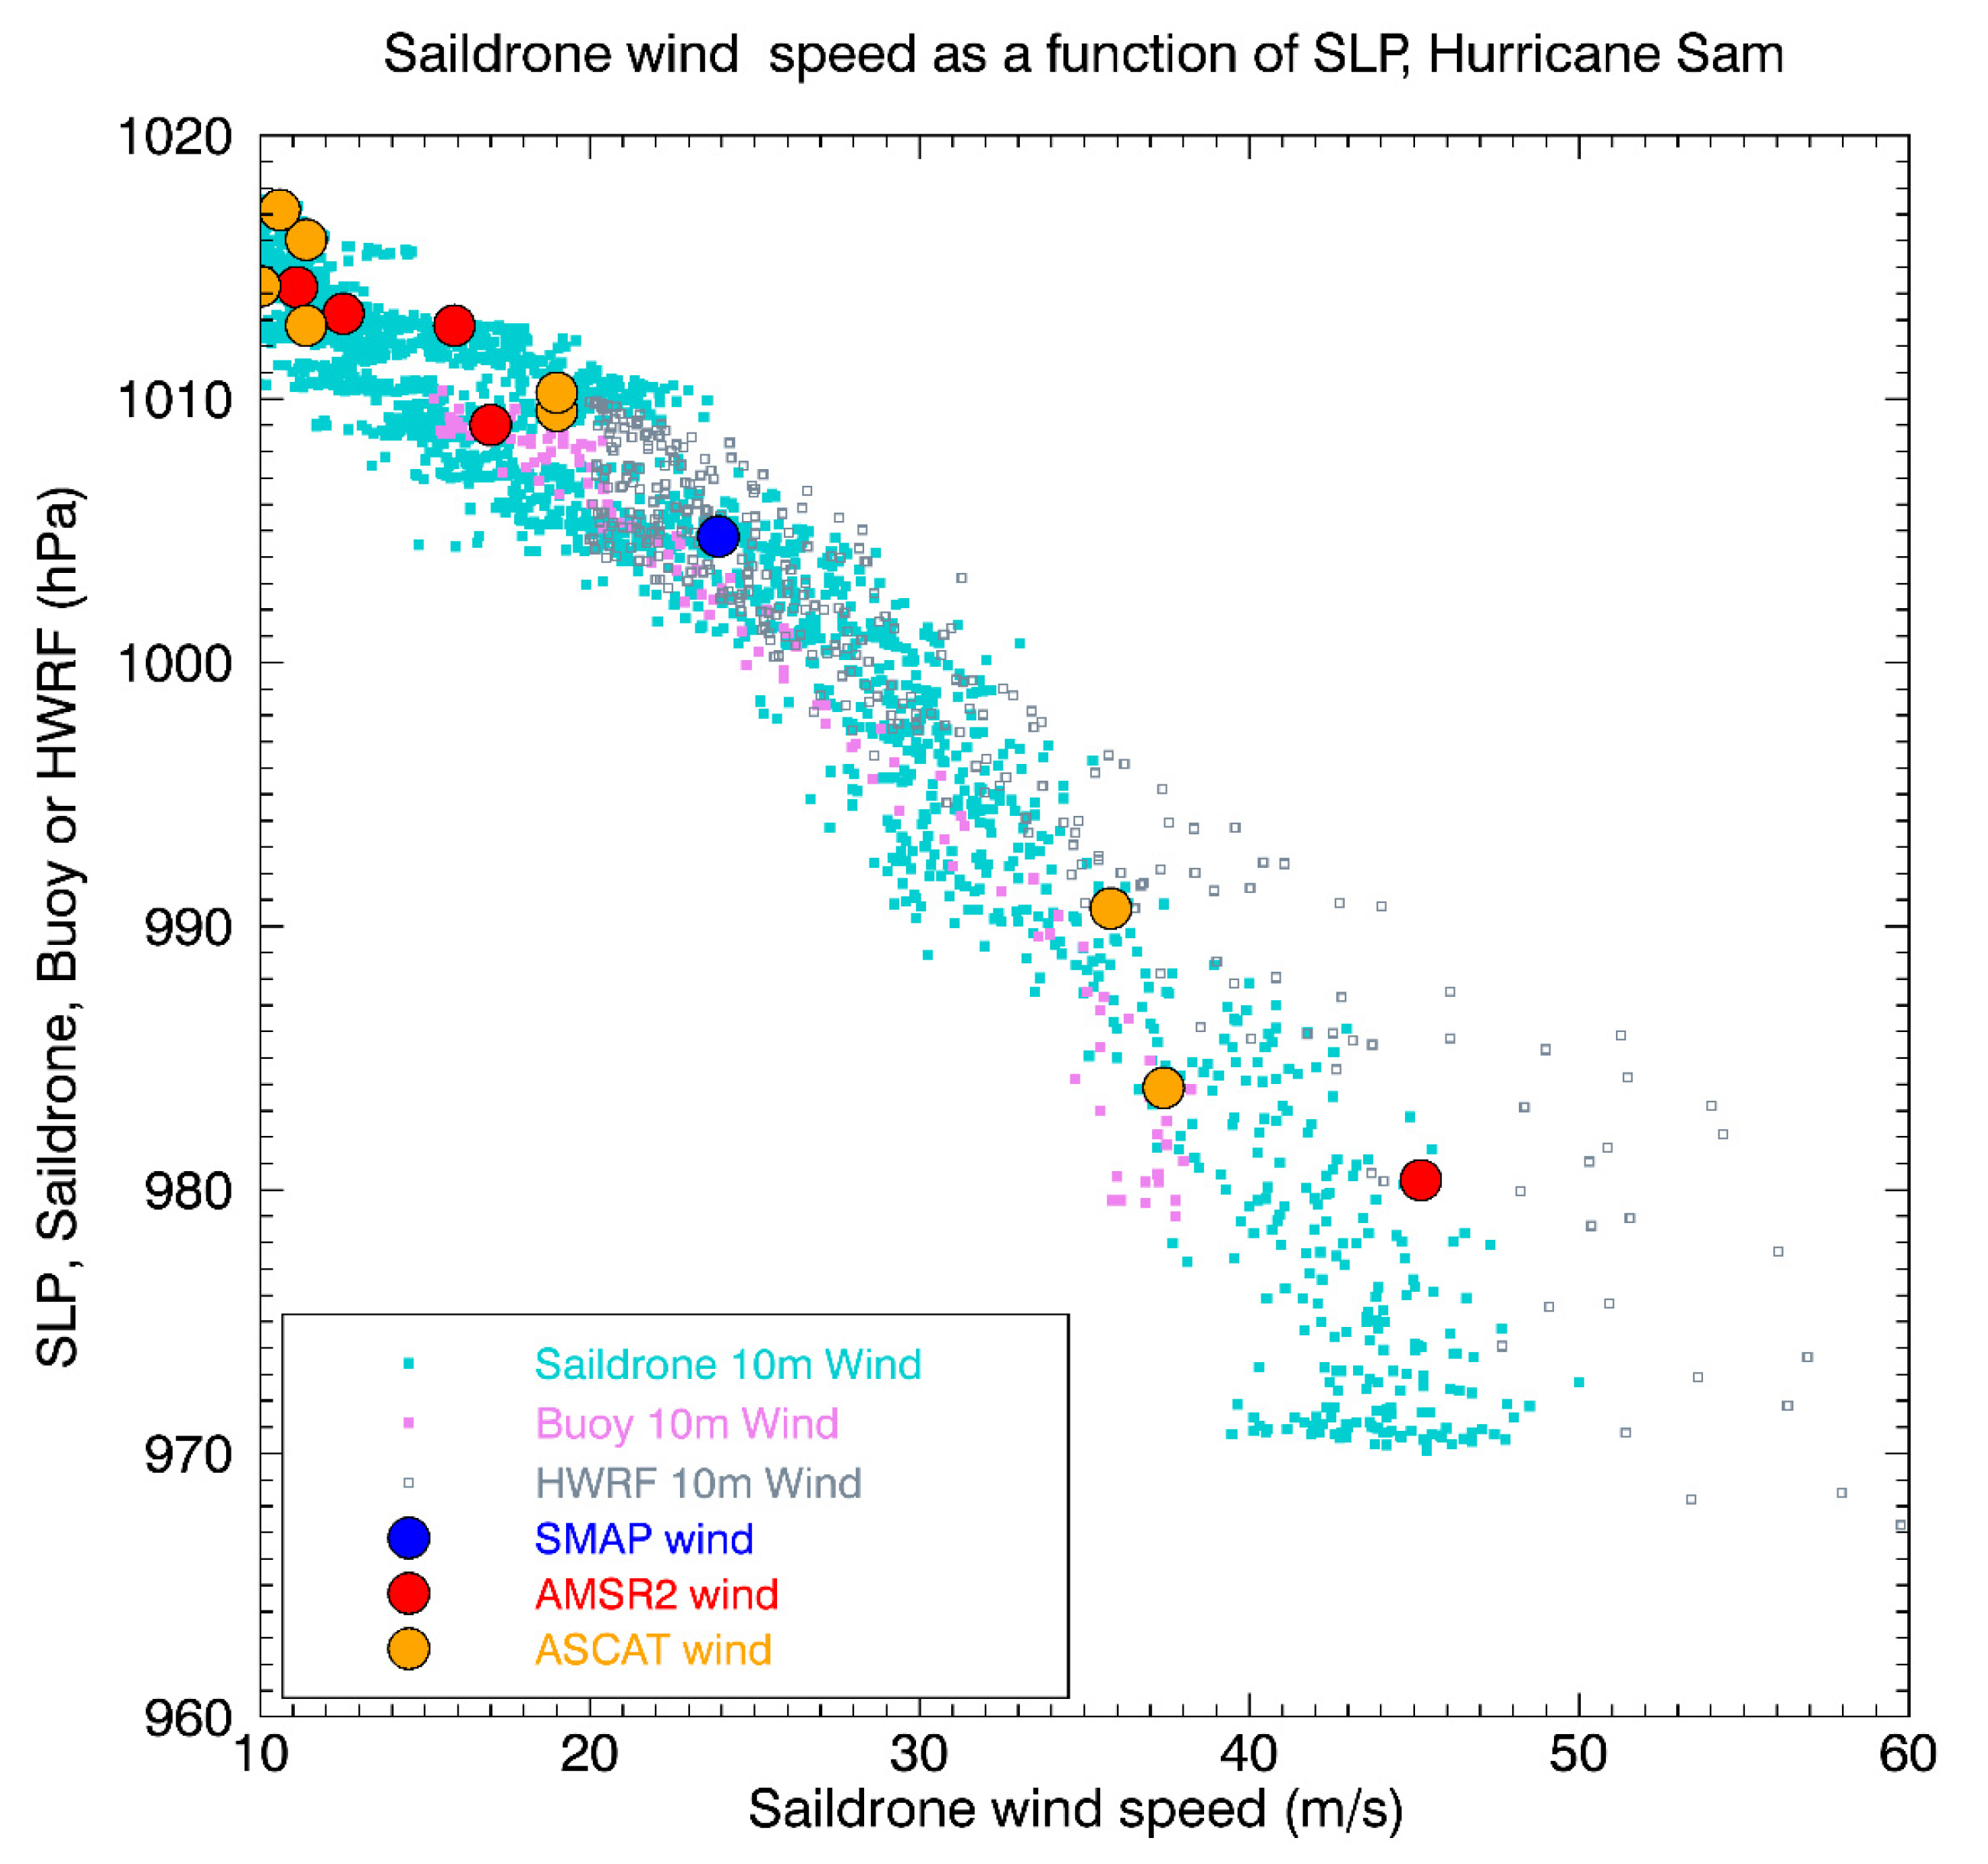
The HWRF model can also provide an indirect opportunity to verify and compare the SD, buoy, and model surface wind/SLP relationships within the storm. An example of such an indirect verification is provided in Figure 13, which displays the wind/SLP relationship on 30 September 2021, from the SD-1045, buoy 41044, and the HWRF model. Overlaid is the relationship between the satellite wind and the colocated SLP from SD-1045. From the figure, we notice that the satellite wind/SLP relationship is within the range of the HWRF model at all wind speeds. The SD-1045 relationship also is very consistent with the model, possibly showing slightly lower winds above 40 m/s than those predicted by the model for SLP lower than 980 hPa. The buoy wind/SLP relationship is consistent with SD-1045 and HWRF up to about 984 hPa and displays slightly lower winds than the model for low SLP.
7. Summary and Conclusions
Here, we presented a case study for the assessment of a new type of in situ measurement of ocean surface winds. We focused on the period between 22 September and 6 October 2021, including observations acquired in the core of a Hurricane Sam, which is a major (Category 4) hurricane in the Atlantic. The observations were obtained from an anemometer mounted on a solar/wind-powered autonomous vessel: the Saildrone. For the first time, in the summer of 2021, five Saildrone vehicles were deployed into very active regions of the northern tropical Atlantic to study ocean/atmospheric conditions leading to the formation and evolution of major storms. One of the missions, SD-1045, crossed the path of Hurricane Sam on 30 September 2021.
This is the first time that measurements of hurricane-force winds have been retrieved from the SD, and as such, it is the only case study available at this time. The SD observations in Sam were assessed versus state-of-the-art satellite retrievals specifically developed for storm conditions i.e., SMAP, AMSR2 TC-winds, and the SAR. Additional comparisons were performed using more traditional scatterometer data (ASCAT) and a hurricane forecast model, HWRF.
One objective of this study was to define the methodology for comparing the SD observations, which are taken point-wise and at a low and variable anemometer height, to satellite observations that are made on a much larger scale, i.e., resolutions of approximately 25–40 km. This methodology involves a conversion of the winds observed at the SD anemometer height (2.6–3.4 m) to a reference height of 10 m, which is typical of the satellite and model data. We used the COARE 3.5 algorithm to define the vertical profile of the winds in the atmospheric boundary layer, with additional assumptions needed for hurricane-force winds. A similar methodology was applied to adjust the measurements from buoy 41044, also in the path of the storm but about 150 km southeast of the SD. Direct comparison between the SD and buoy was not possible due to their separation distance and positions in different sectors of the storm. The satellite data provided a third-party comparison to evaluate whether the buoy and SD were indeed consistent. We additionally explored whether the wind/SLP relationships observed in the storm by the SD and the buoy were consistent with the HWRF model.
This first assessment showed high consistency between the SD and the satellite wind measurements at all wind regimes observed in this case study (0–50 m/s, when adjusted to 10 m winds) with a small bias of −0.49 m/s and standard deviation of 1.9 m/s (Figure 12). The SD-1045 mission in Hurricane Sam also displayed a remarkable ability to observe rapid wind changes (Figure 4a), such as those experienced while crossing strong wind gradients. Once the methodology for assessing SD measurements at these extreme winds is carefully designed, it can serve as a foundation for planning and evaluating future missions using SDs in hurricanes or other extreme winds in the tropics and extra-tropics. Additionally, if properly interpreted, future SD missions can provide a unique and more widely available reference source of calibration/validation for satellite observations in extreme winds. Ideally, opportunities will arise in future missions to compare SD observations to in situ measurements from reconnaissance aircraft dropsondes or SFMR. A triple colocation of simultaneous SD, SMAP, and SAR wind observations within a hurricane would also be very valuable for calibration/validation purposes. This is a possibility, as both SAR and SMAP observe the Earth at the same local time, and it should be explored in future missions by possibly coordinating a SAR acquisition when the SD is in proximity to a hurricane.
Supplementary Materials
The following supporting information can be downloaded at: https://www.mdpi.com/article/10.3390/rs14122726/s1, Figure S1: ASCAT-B and ASCAT-C wind field on 30 September 2021, with overlaid wind speed values from SD-1045 and the buoy 41044; Figure S2: HWRF wind field at 6Z, 12Z, and 18Z on 30 September 2021, with overlaid wind speed values for SD and buoy; Figure S3: Surface wind speed the from the SFMR onboard the NOAA P3 reconnaissance aircraft from an East-West cross section in Hurricane Sam, on 29 September 2021, with overlaid cross-sections from a SAR pass, and the HWRF model for the same day.
Author Contributions
Conceptualization, L.R. and G.R.F.; methodology, L.R. and G.R.F.; software, L.R. and A.M.; validation, L.R.; formal analysis, L.R. and A.M.; investigation, L.R.; resources, L.R., G.R.F. and A.M.; data curation, L.R., G.R.F., A.M. and T.M.; writing—original draft preparation, L.R.; writing—review and editing, L.R., G.R.F., A.M. and T.M.; visualization, L.R. and G.R.F.; supervision, L.R. and G.R.F.; project administration, L.R. and G.R.F.; funding acquisition, L.R. and G.R.F. All authors have read and agreed to the published version of the manuscript.
Funding
The analysis by L.R., A.M. and T.M. was funded by NASA Earth Science, contract number 80HQTR19C0003 (Ocean Vector Wind Science Team). Support for the 2021 Hurricane Saildrone Mission was provided by NOAA’s Office of Marine and Aviation Operations (OMAO), NOAA’s Oceanic and Atmospheric Research (OAR) Ocean Portfolio, and NOAA’s Pacific Marine Environmental Laboratory and Atlantic Oceanographic and Meteorological Laboratory. G.F. was also supported by base funds to NOAA/AOML’s Physical Oceanography Division.
Data Availability Statement
The Saildrone data used in this analysis are available at https://data.pmel.noaa.gov/pmel/erddap/tabledap/sd1045_hurricane_2021.html (accessed on 4 January 2022). The Remote Sensing Tropical Cyclone wind speeds for SMAP and AMSR2 are publicly available at http://www.remss.com/tropical-cyclones/tc-winds/ (accessed on 7 January 2022). ASCAT winds used in this analysis are processed at Remote Sensing Systems and available at https://www.remss.com/missions/ascat/ (accessed on 7 January 2022). The buoy data are distributed by the NBDC at https://www.ndbc.noaa.gov/station_history.php?station=41044 (accessed on 28 January 2022). The SAR data used here are publicly available at https://cyclobs.ifremer.fr/app/tropical (accessed on 15 February 2022). HWRF model data for past storms are archived and have been provided to us under request by Lin Zhu at NOAA/NWS/NCEP/EMC. SFMR data for the Supplementary Figure S2 are publicly available on the NOAA AOML/HRD webpage https://www.aoml.noaa.gov/2021-hurricane-field-program-data (accessed on 24 May 2022).
Acknowledgments
The success of the 2021 mission was possible because of the dedicated work of NOAA’s Hurricane Mission Team and the Saildrone, Inc. Team. The authors like to thank Heather Holbach (NOAA/AOML/HRD), Zorana Jelenak and Joe Sapp (both at NOAA/NESDIS/STAR) for support and discussions about the SFMR data in Hurricane Sam; Lisa Bucci (NOAA/HRD) for useful comments on the original manuscript, and the reviewers for their comments which resulted in an improved revised manuscript.
Conflicts of Interest
The authors declare no conflict of interest.
References
- Bourassa, M.A.; Meissner, T.; Cerovecki, I.; Chang, P.S.; Dong, X.; De Chiara, G.; Donlon, C.; Dukhovskoy, D.S.; Elya, J.; Fore, A.; et al. Remotely Sensed Winds and Wind Stresses for Marine Forecasting and Ocean Modeling. Front. Mar. Sci. 2019, 6, 443. [Google Scholar] [CrossRef] [Green Version]
- Klotz, B.W.; Uhlhorn, E.W. Improved Stepped Frequency Microwave Radiometer Tropical Cyclone Surface Winds in Heavy Precipitation. J. Atmos. Ocean. Technol. 2014, 31, 2392–2408. [Google Scholar] [CrossRef]
- Dvorak, V.F. Tropical Cyclone Intensity Analysis and Forecasting from Satellite Imagery. Mon. Weather Rev. 1975, 103, 420–430. [Google Scholar] [CrossRef]
- Velden, C.; Harper, B.; Wells, F.; Beven, J.L.; Zehr, R.; Olander, T.; Mayfield, M.; Guard, C.C.; Lander, M.; Edson, R.; et al. The Dvorak Tropical Cyclone Intensity Estimation Technique: A Satellite-Based Method That Has Endured for over 30 Years. Bull. Am. Meteorol. Soc. 2006, 87, 1195–1210. [Google Scholar] [CrossRef]
- Mouche, A.; Chapron, B.; Knaff, J.; Zhao, Y.; Zhang, B.; Combot, C. Copolarized and Cross-Polarized SAR Measurements for High-Resolution Description of Major Hurricane Wind Structures: Application to Irma Category 5 Hurricane. J. Geophys. Res. Ocean. 2019, 124, 3905–3922. [Google Scholar] [CrossRef]
- Combot, C.; Mouche, A.; Knaff, J.; Zhao, Y.; Zhao, Y.; Vinour, L.; Quilfen, Y.; Chapron, B. Extensive High-Resolution Synthetic Aperture Radar (SAR) Data Analysis of Tropical Cyclones: Comparisons with SFMR Flights and Best Track. Mon. Weather Rev. 2020, 148, 4545–4563. [Google Scholar] [CrossRef]
- Liu, T.; Tang, W. Equivalent Neutral Wind; JPL Publication 96-17; Jet Propulsion Laboratory, California Institute of Technology: Pasadena, CA, USA, 1996; 20p. [Google Scholar]
- Foltz, G.; Zhang, C.; Meinig, C.; Zhang, J.; Zhang, D. An Unprecedented View Inside a Hurricane. EOS 2022, 103. [Google Scholar] [CrossRef]
- Gentemann, C.L.; Scott, J.P.; Mazzini, P.L.F.; Pianca, C.; Akella, S.; Minnett, P.J.; Cornillon, P.; Fox-Kemper, B.; Cetinić, I.; Chin, T.M.; et al. Saildrone: Adaptively Sampling the Marine Environment. Bull. Am. Meteorol. Soc. 2020, 101, E744–E762. [Google Scholar] [CrossRef] [Green Version]
- Zhang, D.; Cronin, M.; Meing, C.; Farrar, J.T.; Jenkins, R.; Peacock, D.; Keene, J.; Sutton, A.; Yang, Q. Comparing Air-Sea Flux Measurements from a New Unmanned Surface Vehicle and Proven Platforms during the SPURS-2 Field Campaign. Oceanog 2019, 32, 122–133. [Google Scholar] [CrossRef] [Green Version]
- Pasch, R.J.; David, P. Roberts Hurricane Sam (AL182021), National Hurricane Center Tropical Cyclone Report. Available online: https://www.nhc.noaa.gov/data/tcr/AL182021_Sam.pdf (accessed on 1 April 2022).
- Meinig, C.; Burger, E.F.; Cohen, N.; Cokelet, E.D.; Cronin, M.F.; Cross, J.N.; de Halleux, S.; Jenkins, R.; Jessup, A.T.; Mordy, C.W.; et al. Public–Private Partnerships to Advance Regional Ocean-Observing Capabilities: A Saildrone and NOAA-PMEL Case Study and Future Considerations to Expand to Global Scale Observing. Front. Mar. Sci. 2019, 6, 448. [Google Scholar] [CrossRef] [Green Version]
- Miles, T.; Zhang, D.; Foltz, G.; Zhang, J.; Meinig, C.; Bringas, F.; Triñanes, J.; Le Hénaff, M.; Aristizabal Vargas, M.; Coakley, S.; et al. Uncrewed Ocean Gliders and Saildrones Support Hurricane Forecasting and Research. Oceanog 2021, 34, 78–81. [Google Scholar] [CrossRef]
- Stoffelen, A.; Mouche, A.; Polverari, F.; van Zadelhoff, G.; Sapp, J.; Portabella, M.; Chang, P.; Lin, W.; Jelenak, Z. C-Band High and Extreme-Force Speeds (CHEFS); ITT16/166, EUMETSAT: Darmastadt, Germany, 2020. [Google Scholar]
- Wright, E.E.; Bourassa, M.A.; Stoffelen, A.; Bidlot, J.-R. Characterizing Buoy Wind Speed Error in High Winds and Varying Sea State with ASCAT and ERA5. Remote Sens. 2021, 13, 4558. [Google Scholar] [CrossRef]
- Wentz, F.J.; Ricciardulli, L.; Rodriguez, E.; Stiles, B.W.; Bourassa, M.A.; Long, D.G.; Hoffman, R.N.; Stoffelen, A.; Verhoef, A.; O’Neill, L.W.; et al. Evaluating and Extending the Ocean Wind Climate Data Record. IEEE J. Sel. Top. Appl. Earth Obs. Remote Sens. 2017, 10, 2165–2185. [Google Scholar] [CrossRef] [Green Version]
- Knaff, J.A.; Sampson, C.R.; Kucas, M.E.; Slocum, C.J.; Brennan, M.J.; Meissner, T.; Ricciardulli, L.; Mouche, A.; Reul, N.; Morris, M.; et al. Estimating Tropical Cyclone Surface Winds: Current Status, Emerging Technologies, Historical Evolution, and a Look to the Future. Trop. Cyclone Res. Rev. 2021, 10, 125–150. [Google Scholar] [CrossRef]
- Meissner, T.; Ricciardulli, L.; Manaster, A. Tropical Cyclone Wind Speeds from WindSat, AMSR and SMAP: Algorithm Development and Testing. Remote Sens. 2021, 13, 1641. [Google Scholar] [CrossRef]
- Meissner, T.; Ricciardulli, L.; Wentz, F.J. Capability of the SMAP Mission to Measure Ocean Surface Winds in Storms. Bull. Am. Meteorol. Soc. 2017, 98, 1660–1677. [Google Scholar] [CrossRef]
- Manaster, A.; Ricciardulli, L.; Meissner, T. Tropical Cyclone Winds from WindSat, AMSR2, and SMAP: Comparison with the HWRF Model. Remote Sens. 2021, 13, 2347. [Google Scholar] [CrossRef]
- Sampson, C.R.; Schrader, A.J. The Automated Tropical Cyclone Forecasting System (Version 3.2). Bull. Amer. Meteor. Soc. 2000, 81, 1231–1240. [Google Scholar] [CrossRef]
- Ricciardulli, L.; Manaster, A. Intercalibration of ASCAT Scatterometer Winds from MetOp-A, -B, and -C, for a Stable Climate Data Record. Remote Sens. 2021, 13, 3678. [Google Scholar] [CrossRef]
- Mouche, A.A.; Chapron, B.; Zhang, B.; Husson, R. Combined Co- and Cross-Polarized SAR Measurements Under Extreme Wind Conditions. IEEE Trans. Geosci. Remote Sens. 2017, 55, 6746–6755. [Google Scholar] [CrossRef]
- Biswas, M. Hurricane Weather Research and Forecasting (HWRF) Model: 2017 Scientific Documentation, NCAR Techincal Notes, NCAR/TN-544+STR; UCAR/NCAR: Boulder, CO, USA, 2018. [Google Scholar]
- Peixoto, J.P.; Abraham, H. Oort Physics of Climate; Springer: New York, NY, USA, 1992; ISBN 0-88318-712-4. [Google Scholar]
- Mears, C.A.; Smith, D.K.; Wentz, F.J. Comparison of Special Sensor Microwave Imager and Buoy-Measured Wind Speeds from 1987 to 1997. J. Geophys. Res. Ocean. 2001, 106, 11719–11729. [Google Scholar] [CrossRef] [Green Version]
- Fairall, C.W.; Bradley, E.F.; Hare, J.E.; Grachev, A.A.; Edson, J.B. Bulk Parameterization of Air–Sea Fluxes: Updates and Verification for the COARE Algorithm. J. Clim. 2003, 16, 571–591. [Google Scholar] [CrossRef]
- Edson, J.B.; Jampana, V.; Weller, R.A.; Bigorre, S.P.; Plueddemann, A.J.; Fairall, C.W.; Miller, S.D.; Mahrt, L.; Vickers, D.; Hersbach, H. On the Exchange of Momentum over the Open Ocean. J. Phys. Oceanogr. 2013, 43, 1589–1610. [Google Scholar] [CrossRef] [Green Version]
- Chen, S.S.; Zhao, W.; Donelan, M.A.; Tolman, H.L. Directional Wind–Wave Coupling in Fully Coupled Atmosphere–Wave–Ocean Models: Results from CBLAST-Hurricane. J. Atmos. Sci. 2013, 70, 3198–3215. [Google Scholar] [CrossRef]
- Hsu, J.-Y.; Lien, R.-C.; D’Asaro, E.A.; Sanford, T.B. Estimates of Surface Wind Stress and Drag Coefficients in Typhoon Megi. J. Phys. Oceanogr. 2017, 47, 545–565. [Google Scholar] [CrossRef]
- Schlundt, M.; Farrar, J.T.; Bigorre, S.P.; Plueddemann, A.J.; Weller, R.A. Accuracy of Wind Observations from Open-Ocean Buoys: Correction for Flow Distortion. J. Atmos. Ocean. Technol. 2020, 37, 687–703. [Google Scholar] [CrossRef] [Green Version]
- Abdolali, A.; van der Westhuysen, A.; Ma, Z.; Mehra, A.; Roland, A.; Moghimi, S. Evaluating the Accuracy and Uncertainty of Atmospheric and Wave Model Hindcasts during Severe Events Using Model Ensembles. Ocean Dyn. 2021, 71, 217–235. [Google Scholar] [CrossRef]
Figure 1.
Saildrone 1045 in Hurricane Sam. (a) Saildrone SD-1045 1 h averaged positions (black), and Hurricane Sam track and maximum sustained 1 min. wind speed (colors) during 19 September –6 October 2021. (b) Satellite infrared image (cloud-top temperature) of Hurricane Sam on 16 UTC September 30 and the location of SD-1045 at that time (light blue triangle). The yellow square symbol indicates the location of moored buoy 41044. The thin blue line in (b) shows SD-1045’s trajectory during the previous 12 h. Panel b is reproduced from [8].
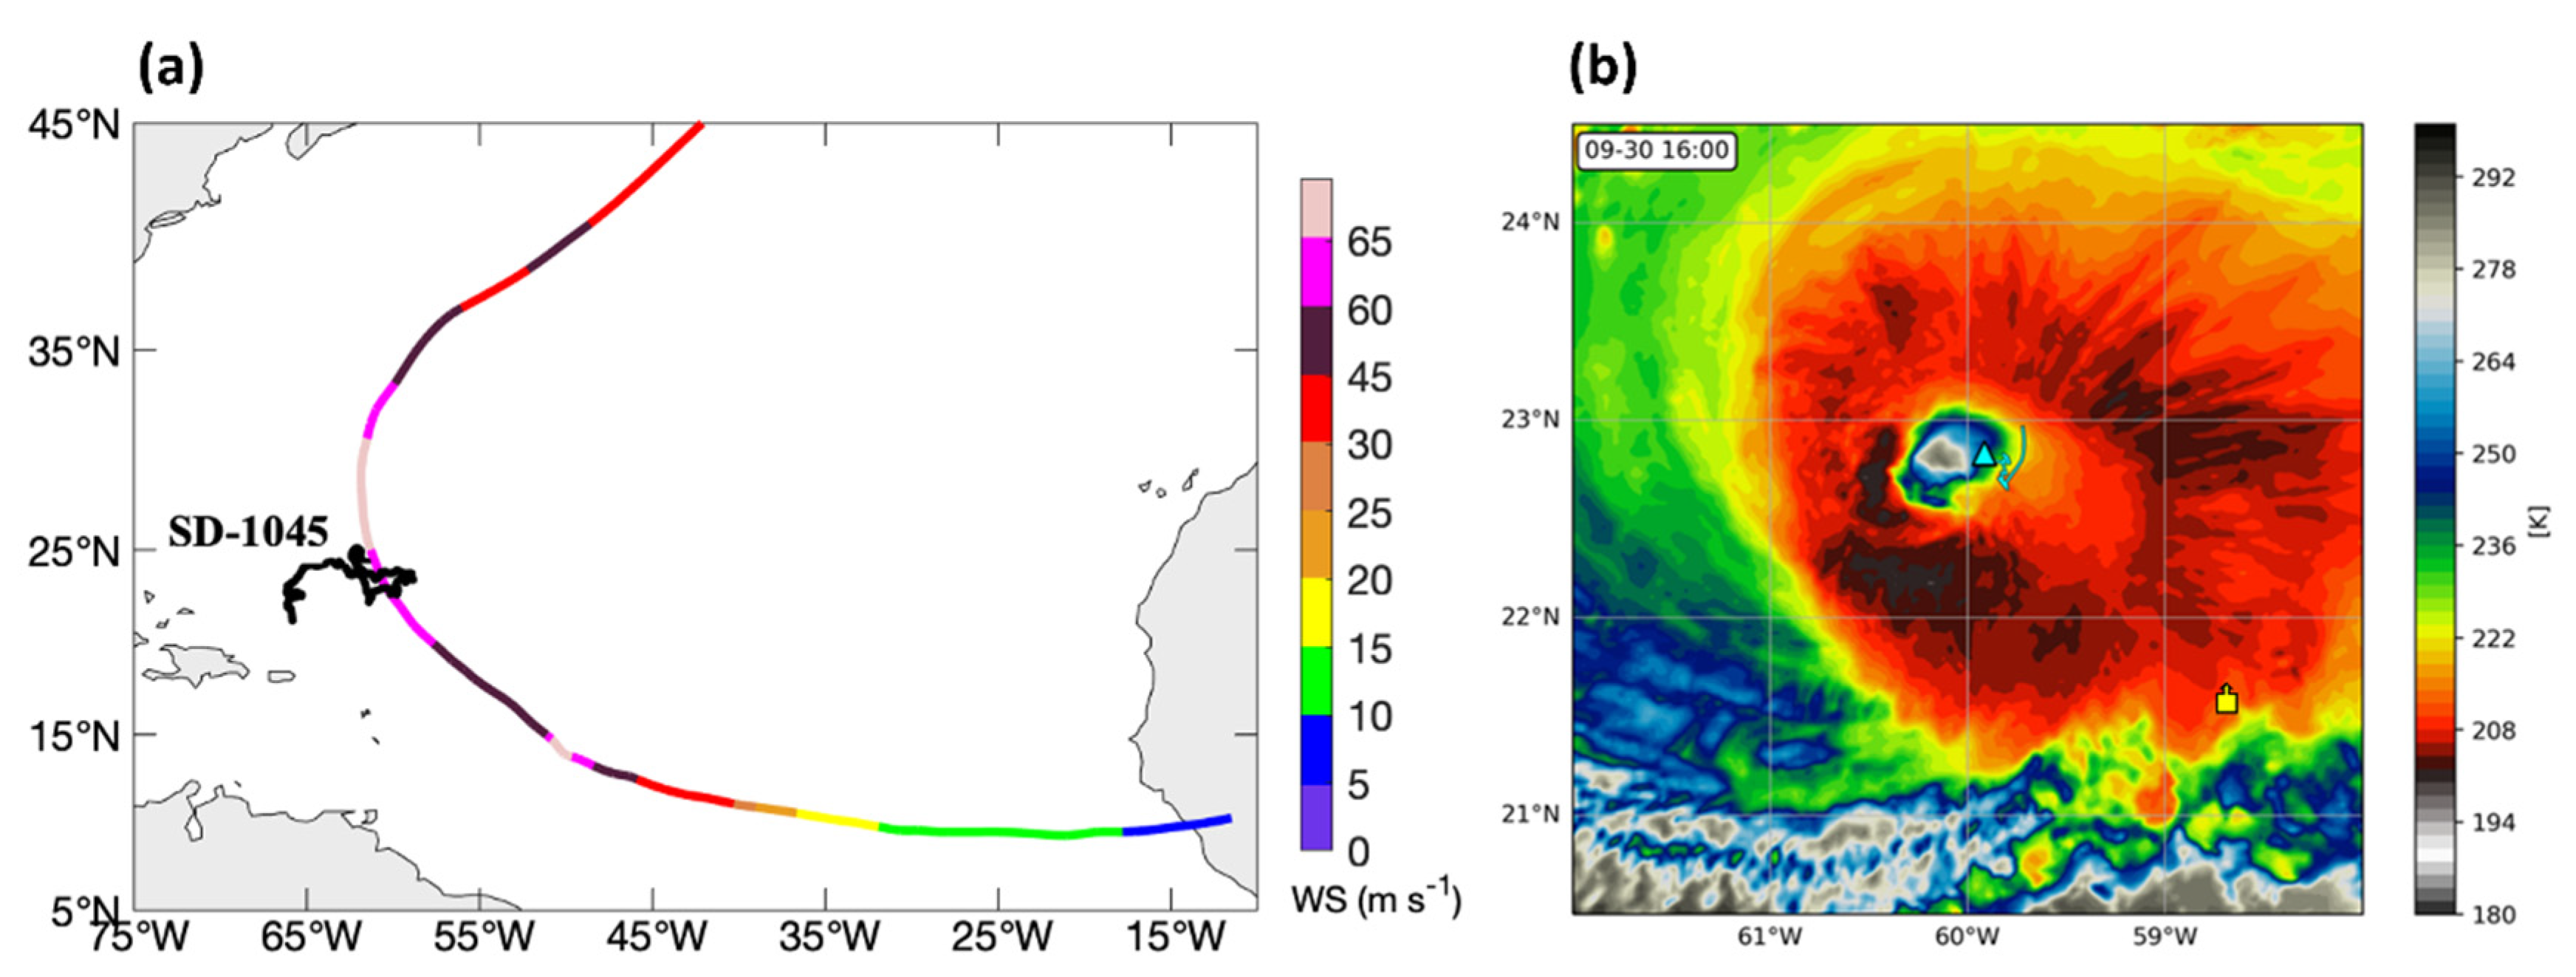
Figure 2.
One-minute averaged data from SD-1045 during Hurricane Sam on 30 September 2021, for wind speed (black) and gusts (gray) (a), sea level pressure (b), and additional variables (c–f). Wind gust in (a) is the maximum 3 s. averaged wind speed in each 1 min. interval; (c) displays the variable anemometer height. The significant wave height in (d) was calculated over 30 min. intervals. Ocean current speed in (e) was measured at a depth of 6 m. In (f), positive angles indicate that the wind was directed to the right of (farther clockwise than) the current.
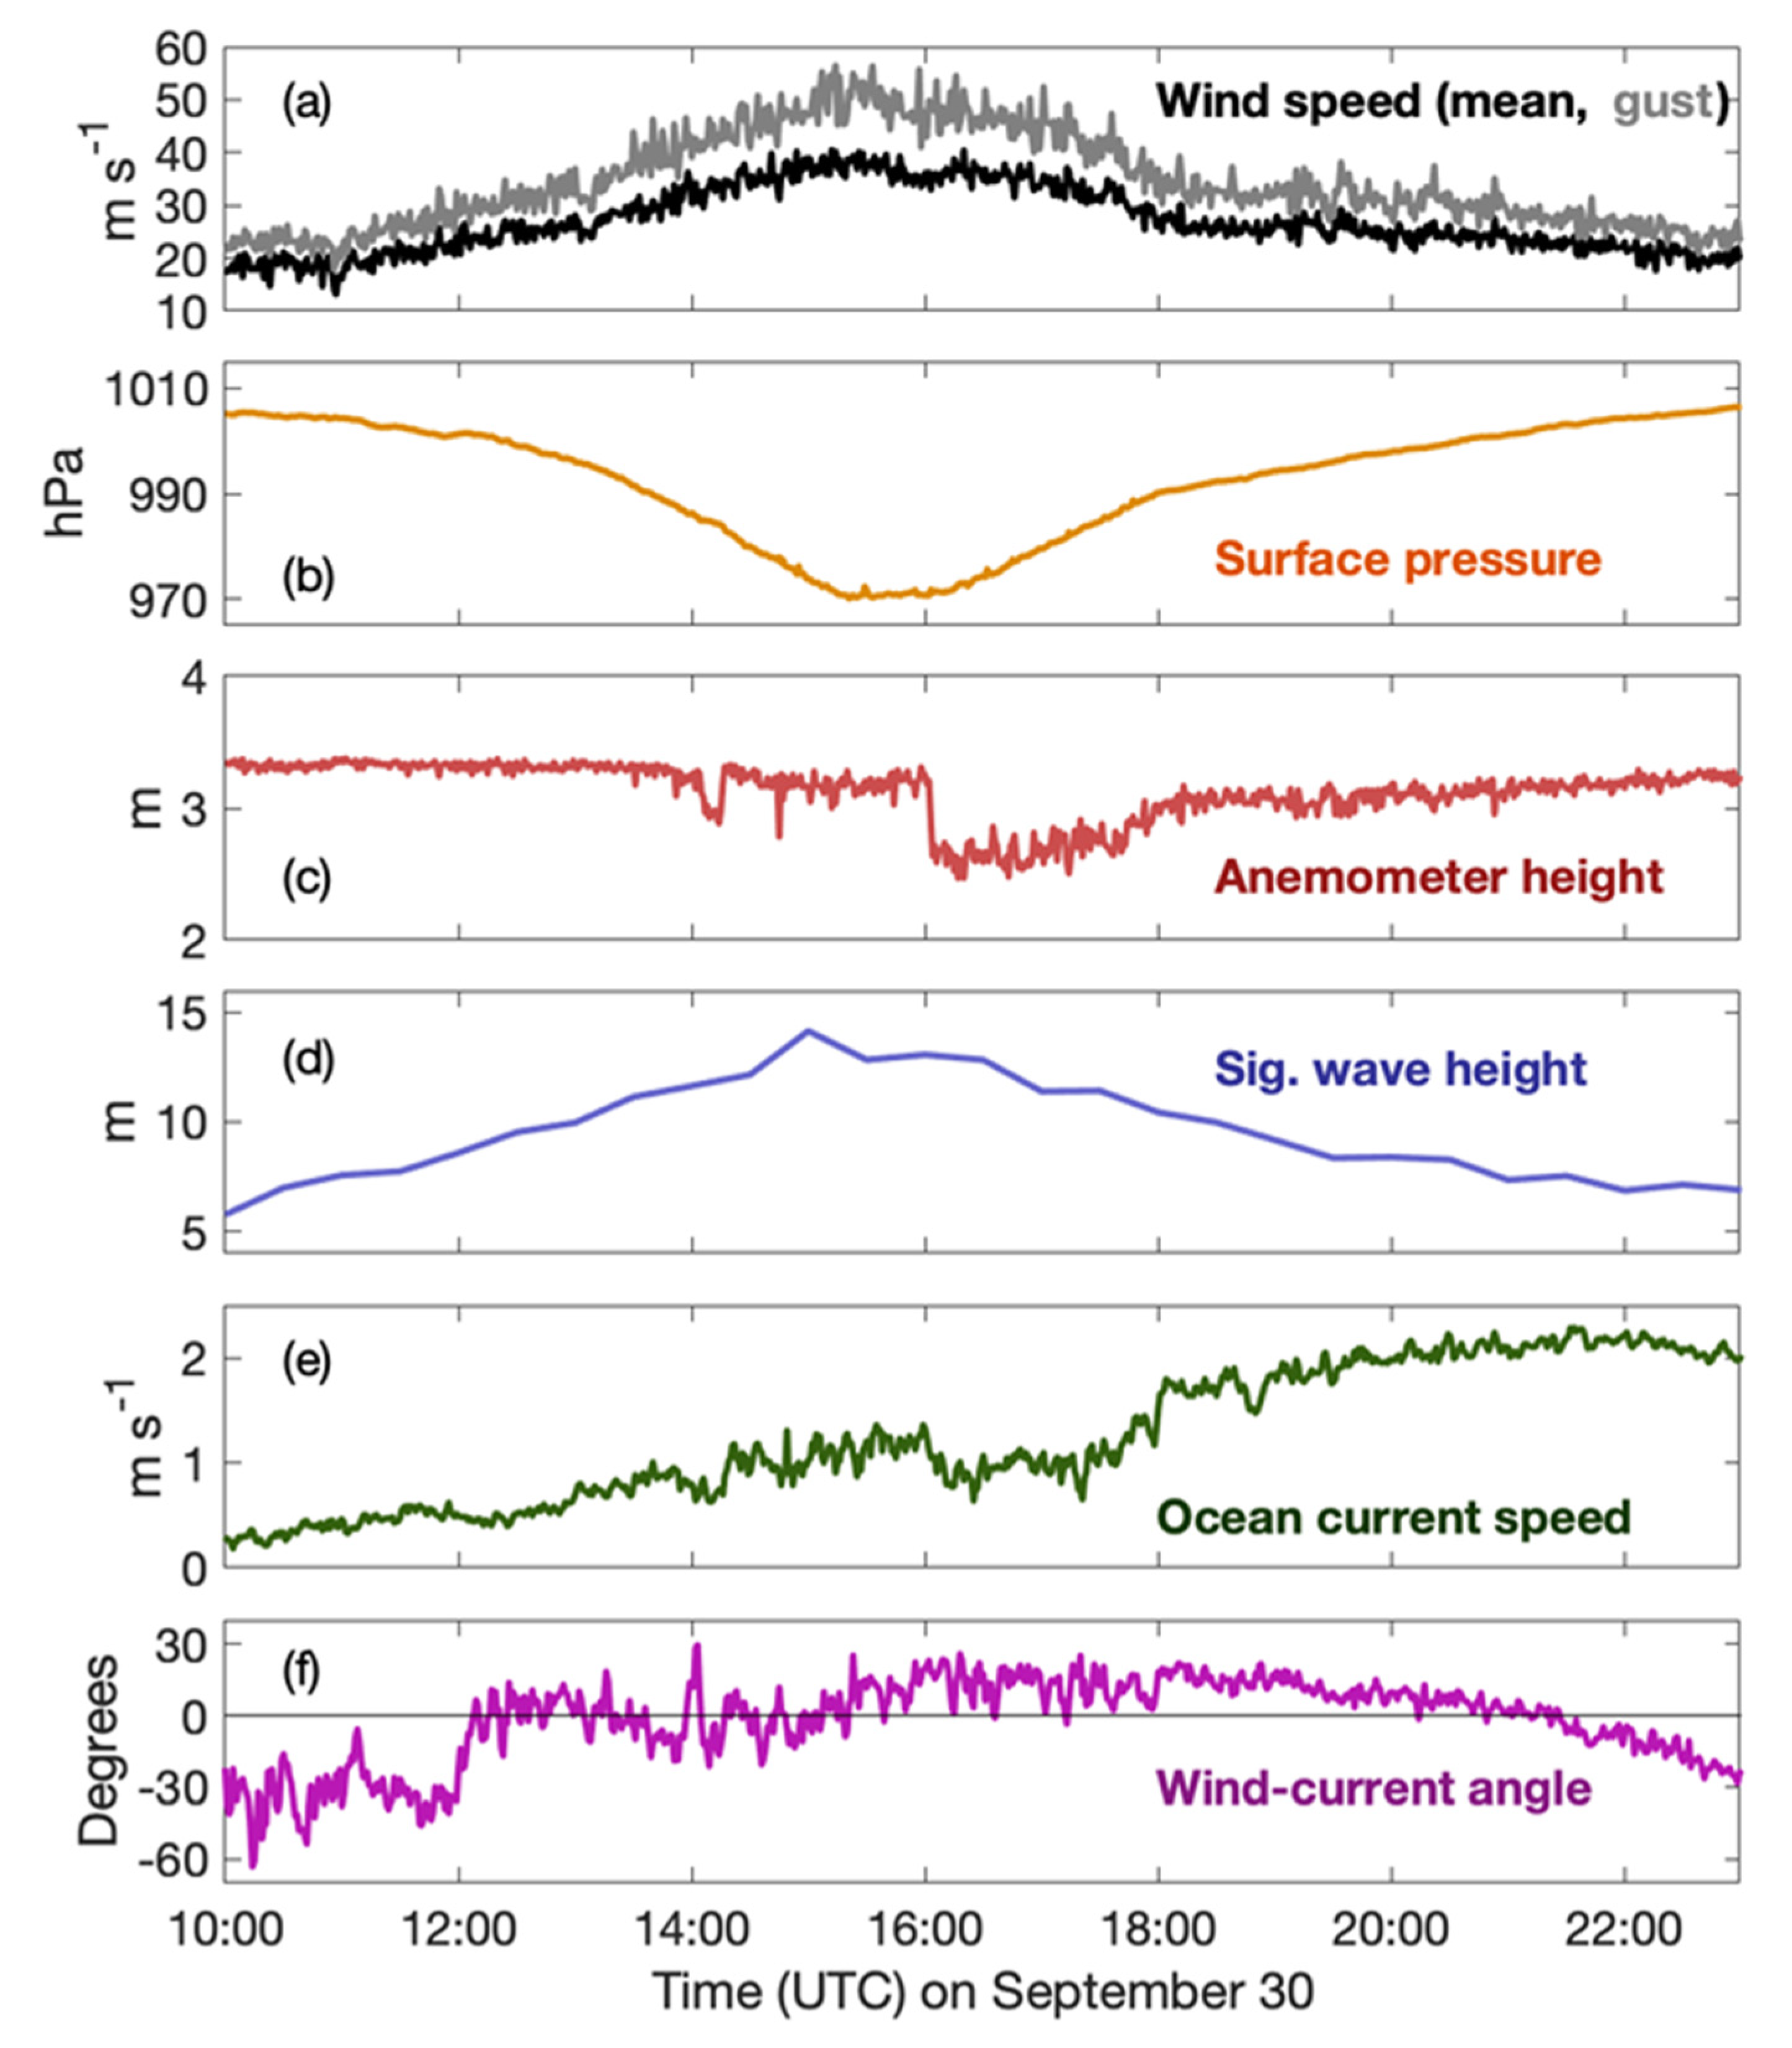
Figure 3.
(a) One minute mean wind speed observed by SD-1045 at the anemometer height (black curve) and adjusted to 10 m winds using the COARE 3.5 algorithm without (blue) or with (green) the Saildrone tilting effect included, for 30 September 2021 (Julian day 273). The gusts converted to 10 m using COARE 3.5 and tilting are also illustrated. (b) Ten-minute mean wind speed as observed by Buoy 41044 at the anemometer height (black curve), adjusted to 10 m winds using a traditional vertical log-profile (cyan curve), and adjusted to 10 m with the COARE 3.5 algorithm (green) with the tilting effect included, for 29–30 September 2021.
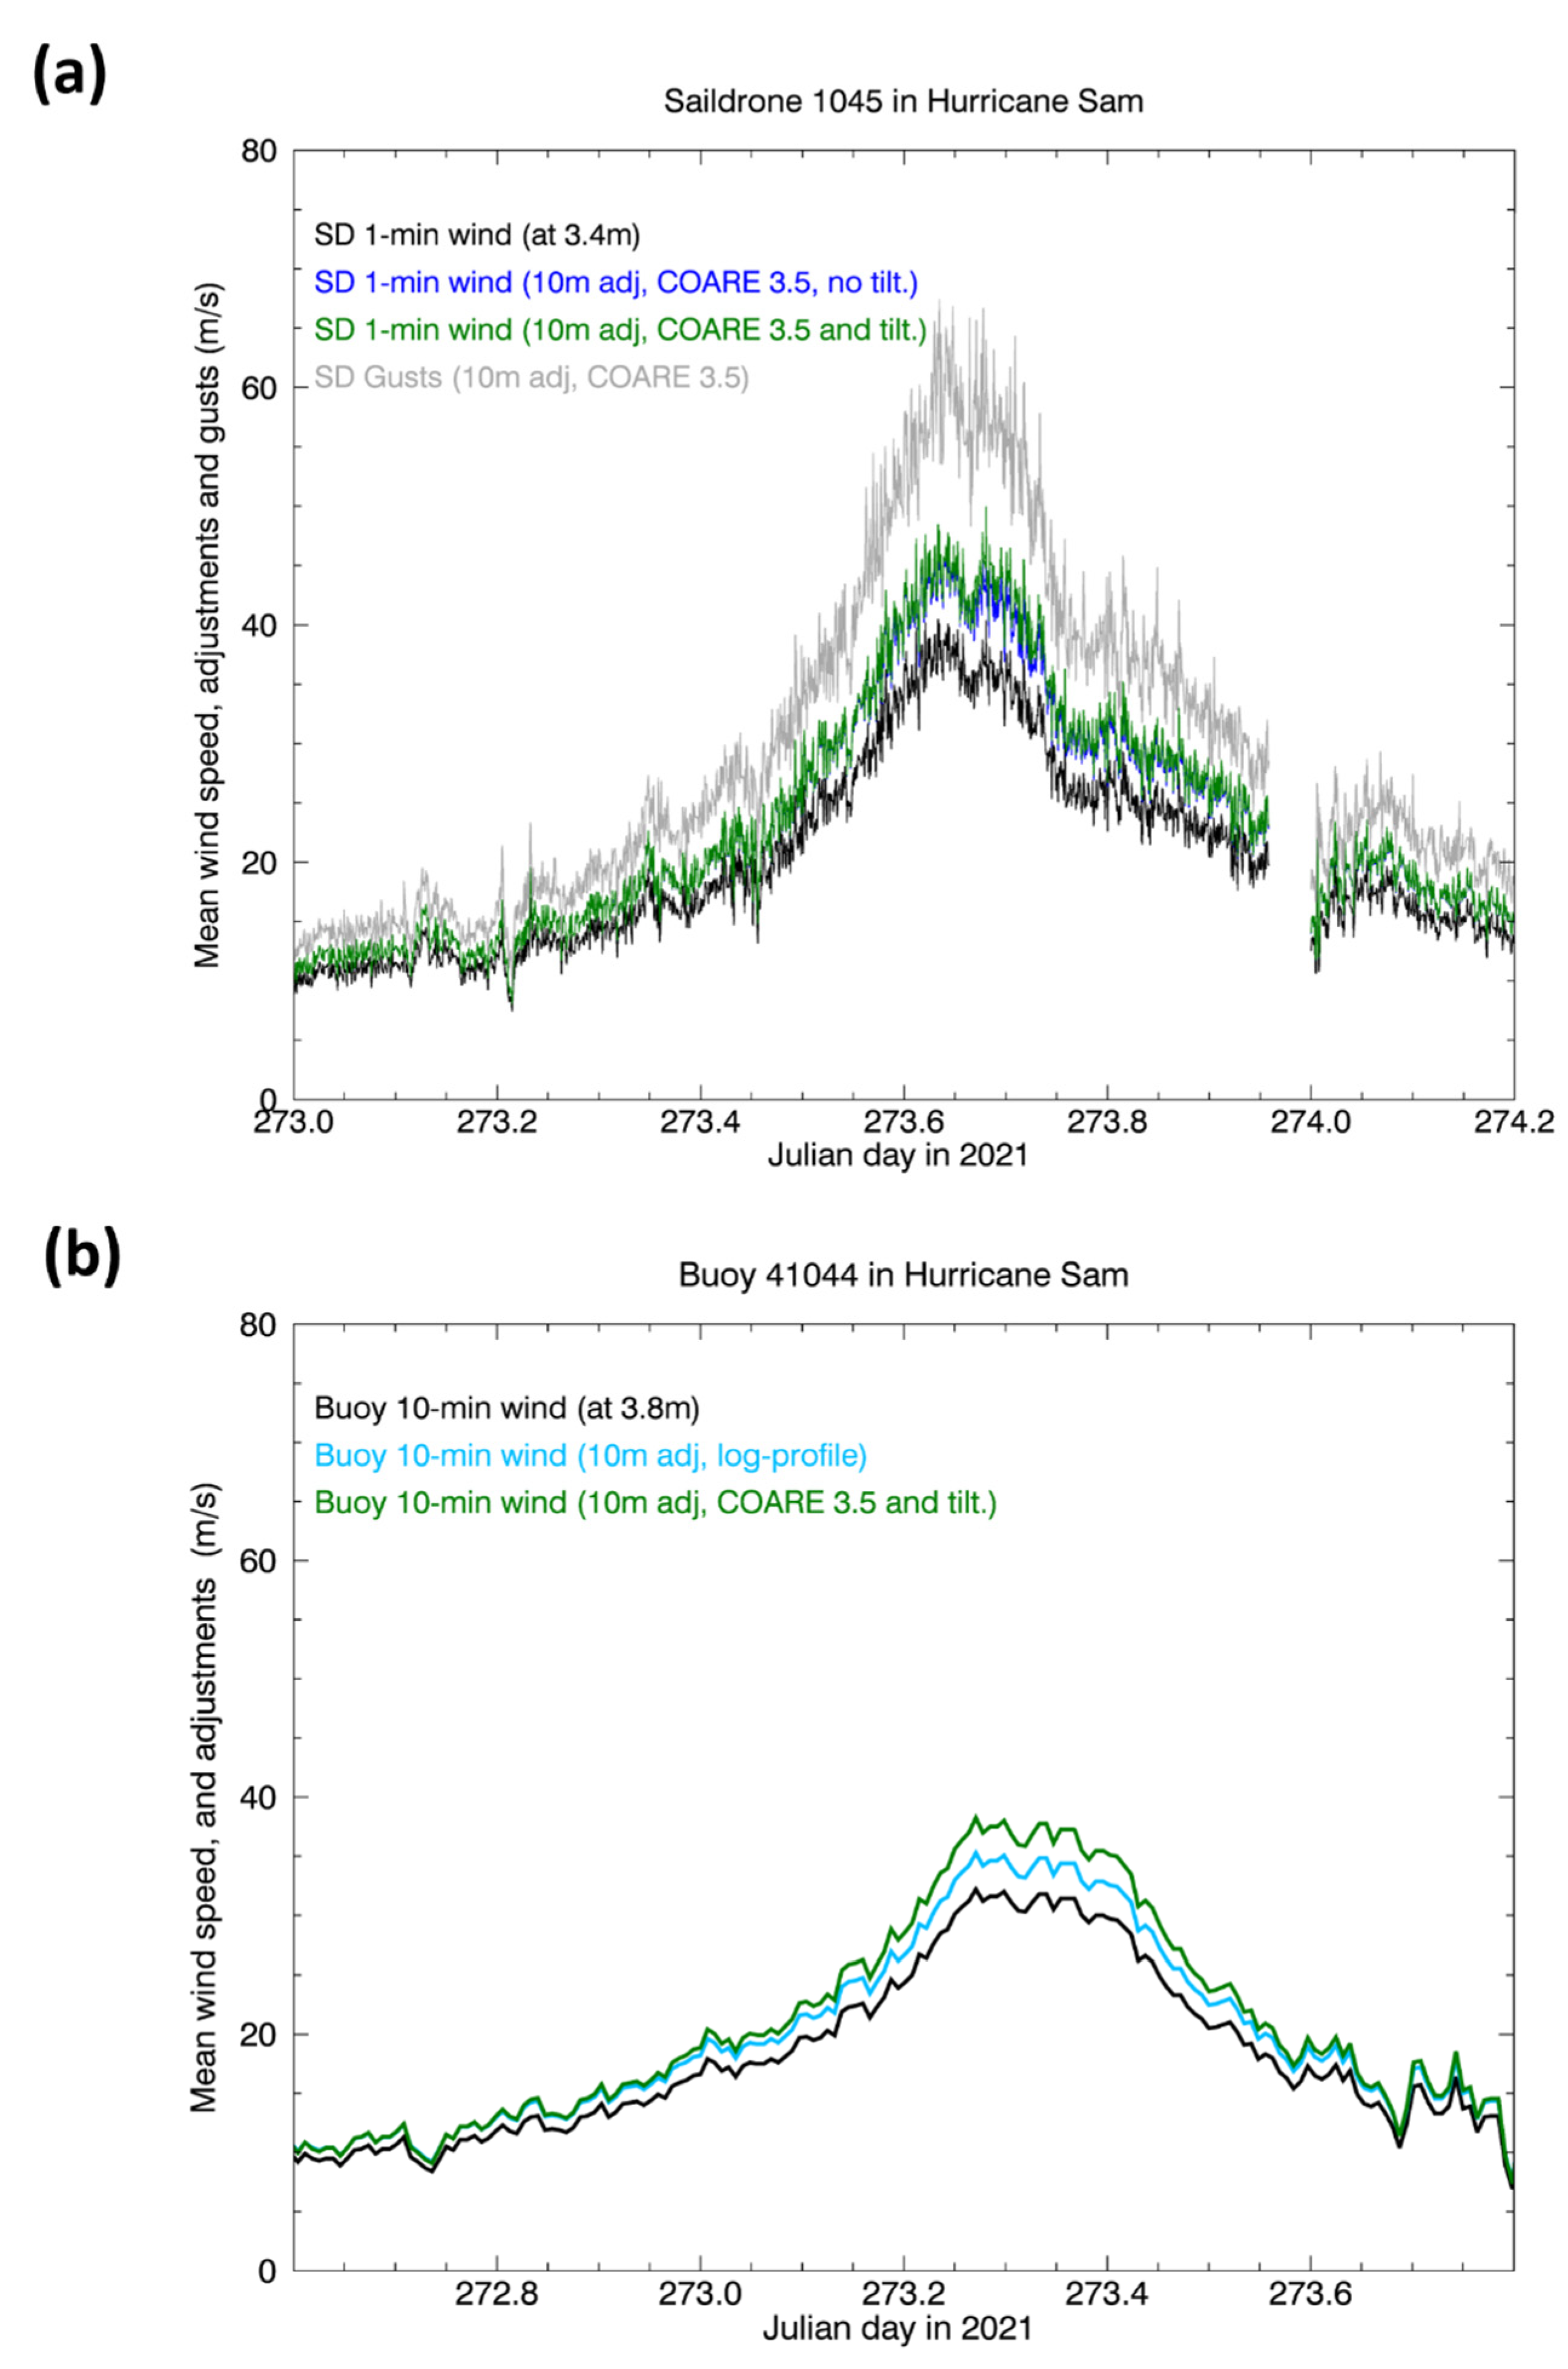
Figure 4.
(a) Time series of the wind speed observed by Saildrone 1045 during Hurricane Sam at the nominal anemometer height of 3.4 m (light blue dotted curve) and converted to 10 m winds using the COARE 3.5 algorithm (grey dotted curve). The symbols represent the corresponding values for the satellite 25 km gridpoint that crossed the Saildrone path within 10 min at the Saildrone locations. The following satellite datasets processed at RSS are illustrated: SMAP, AMSR2 TC-winds, AMSR2 all-weather global winds, the scatterometers ASCAT-A, -B, and -C, and the global rain-free winds from GMI and SSMIS. The time series covers the period 22 September to 5 October 2021 and peaks on 30 September at about 15 UTC (Julian day 273). (b) Similar to panel (a), but for the 10 m wind observed by Buoy 41044, overlaid with all available satellite 10 min colocations (within 25 km). The buoy was near the core of Hurricane Sam at around 06 UTC on 30 September, a few hours earlier than SD-1045.
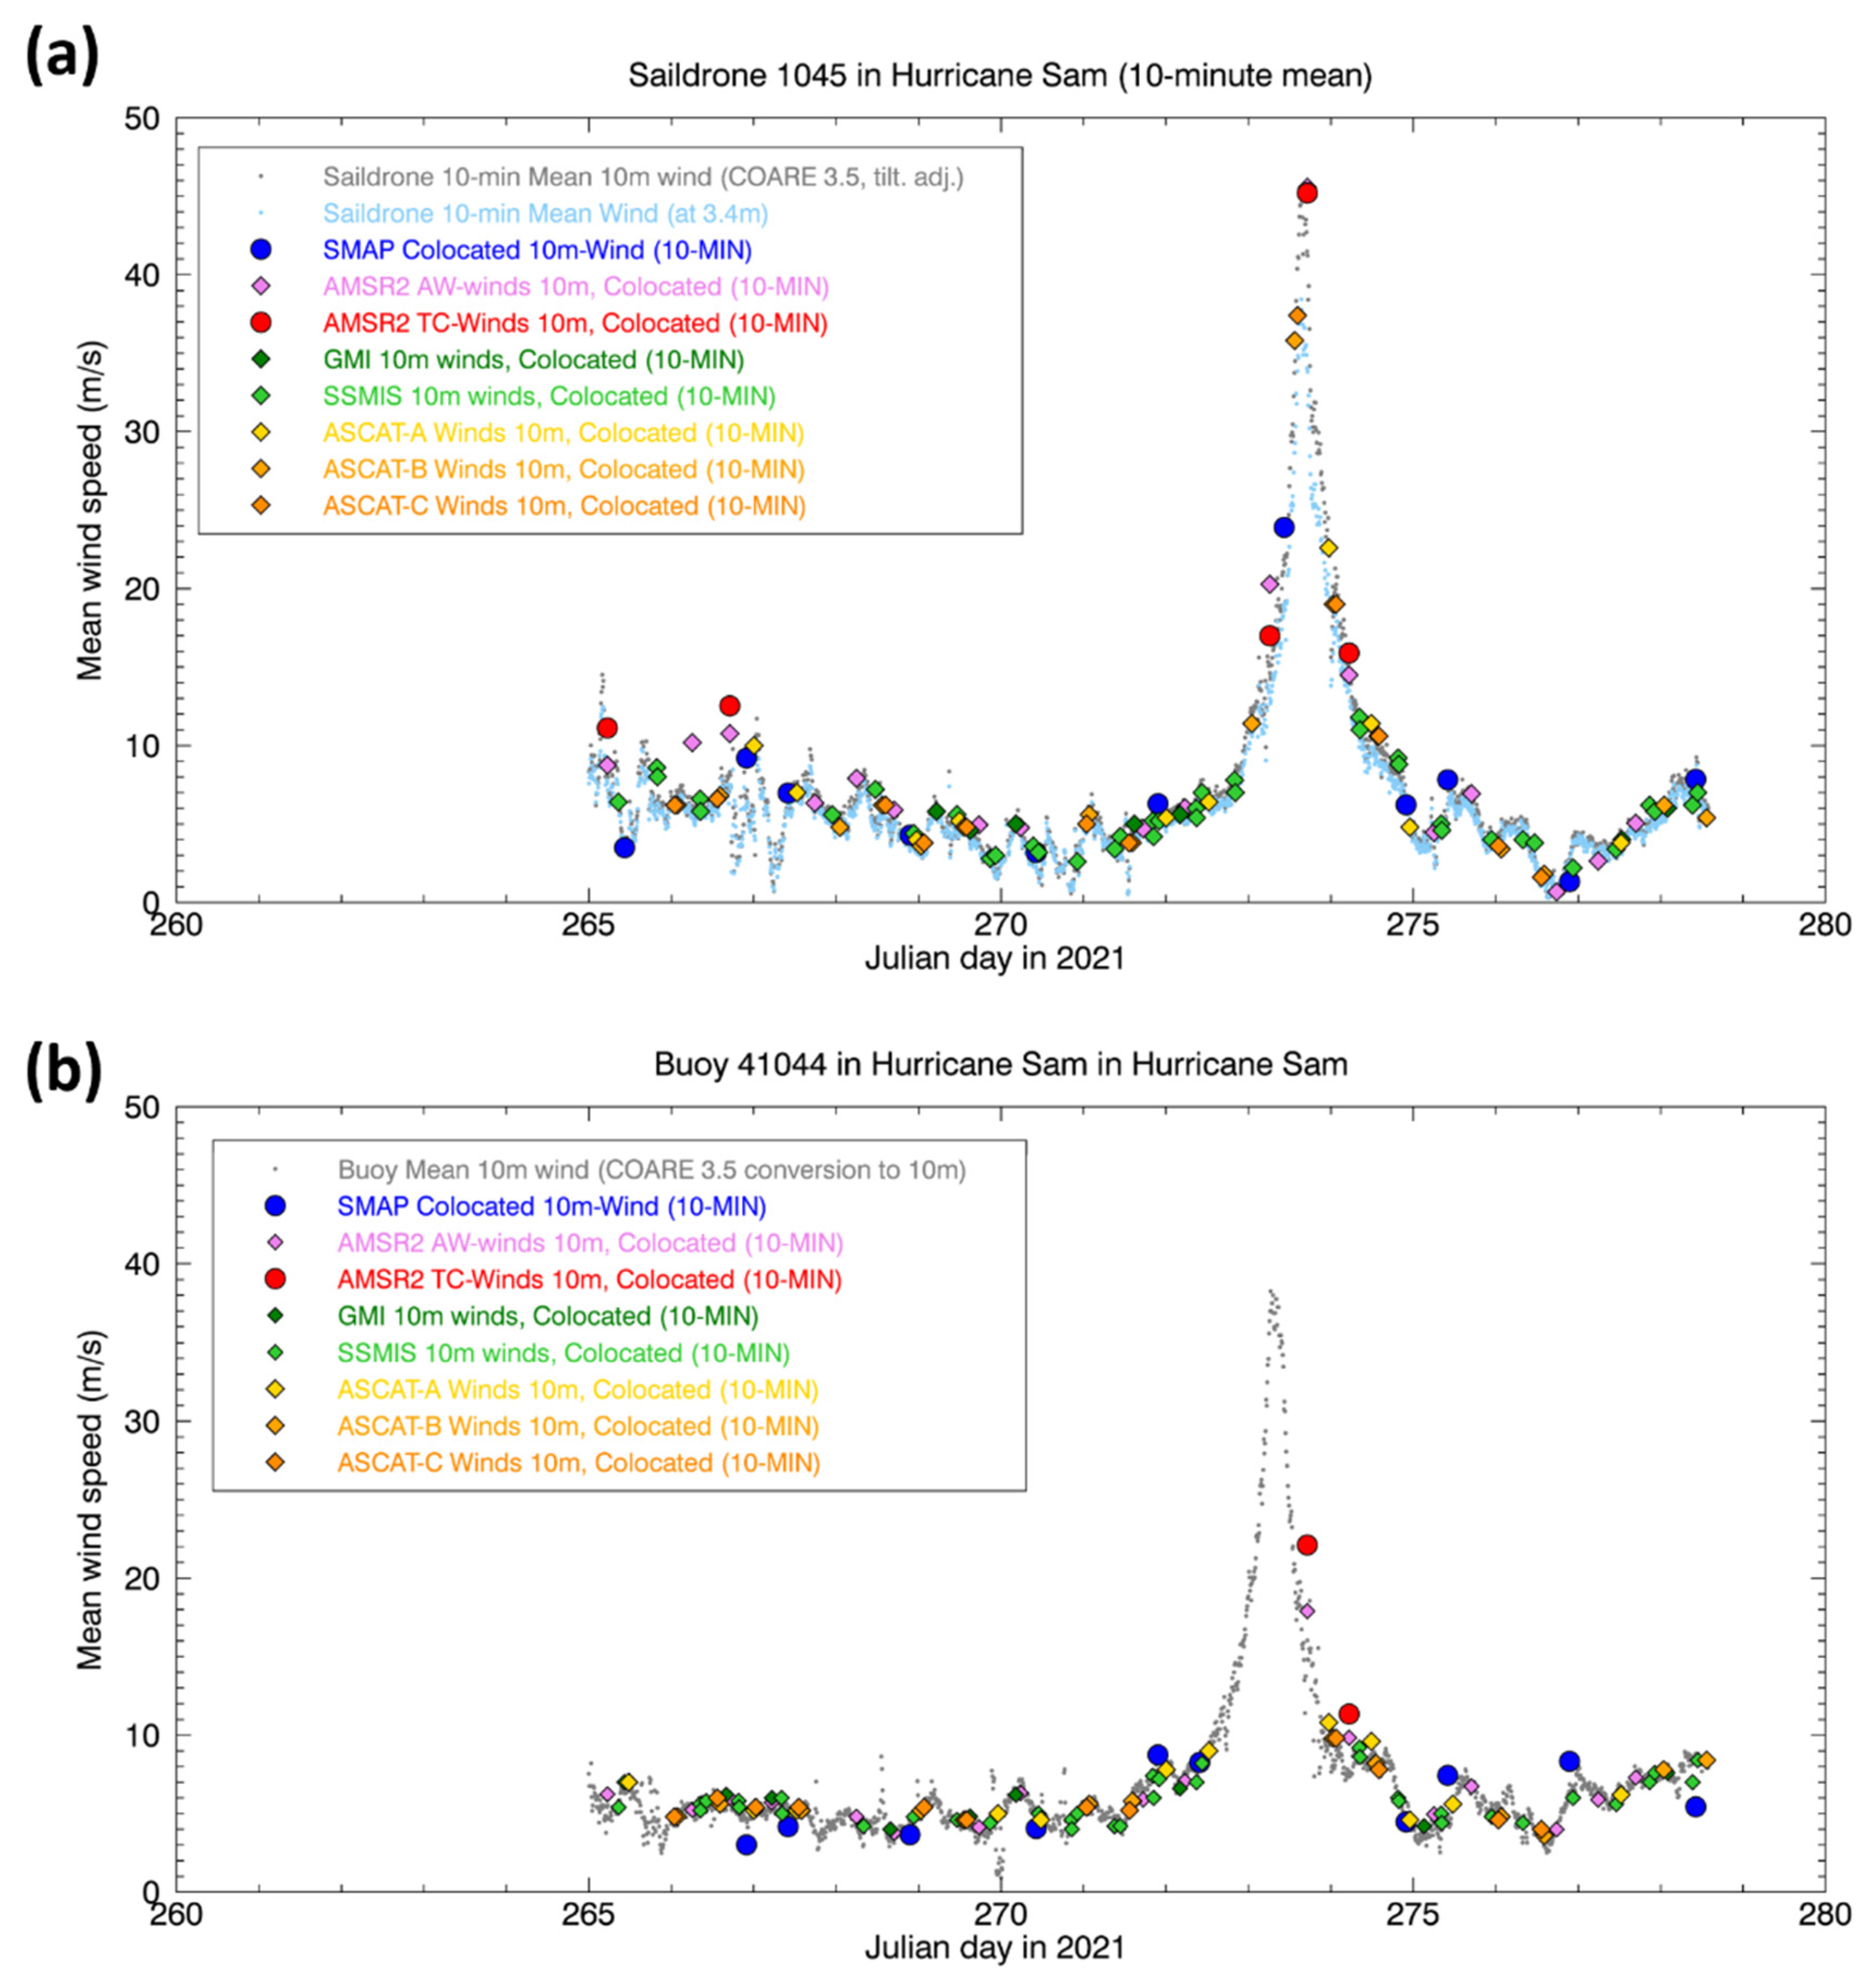
Figure 5.
Wind speed field from the AMSR2 pass over Hurricane Sam at 17:08 UTC on 30 September 2021. These satellite winds are specific for TC conditions and produced only in storm environments for wind speeds above 10 m/s and SST above 25 °C. The colored squares reflect the relatively low resolution (0.25 deg) of the satellite gridded dataset. The SD-1045 (S) and Buoy 41044 (B) positions are overlaid on the satellite pass, with their respective 10 m wind speeds (10-min averages) color-coded using the same scale as the satellite winds.
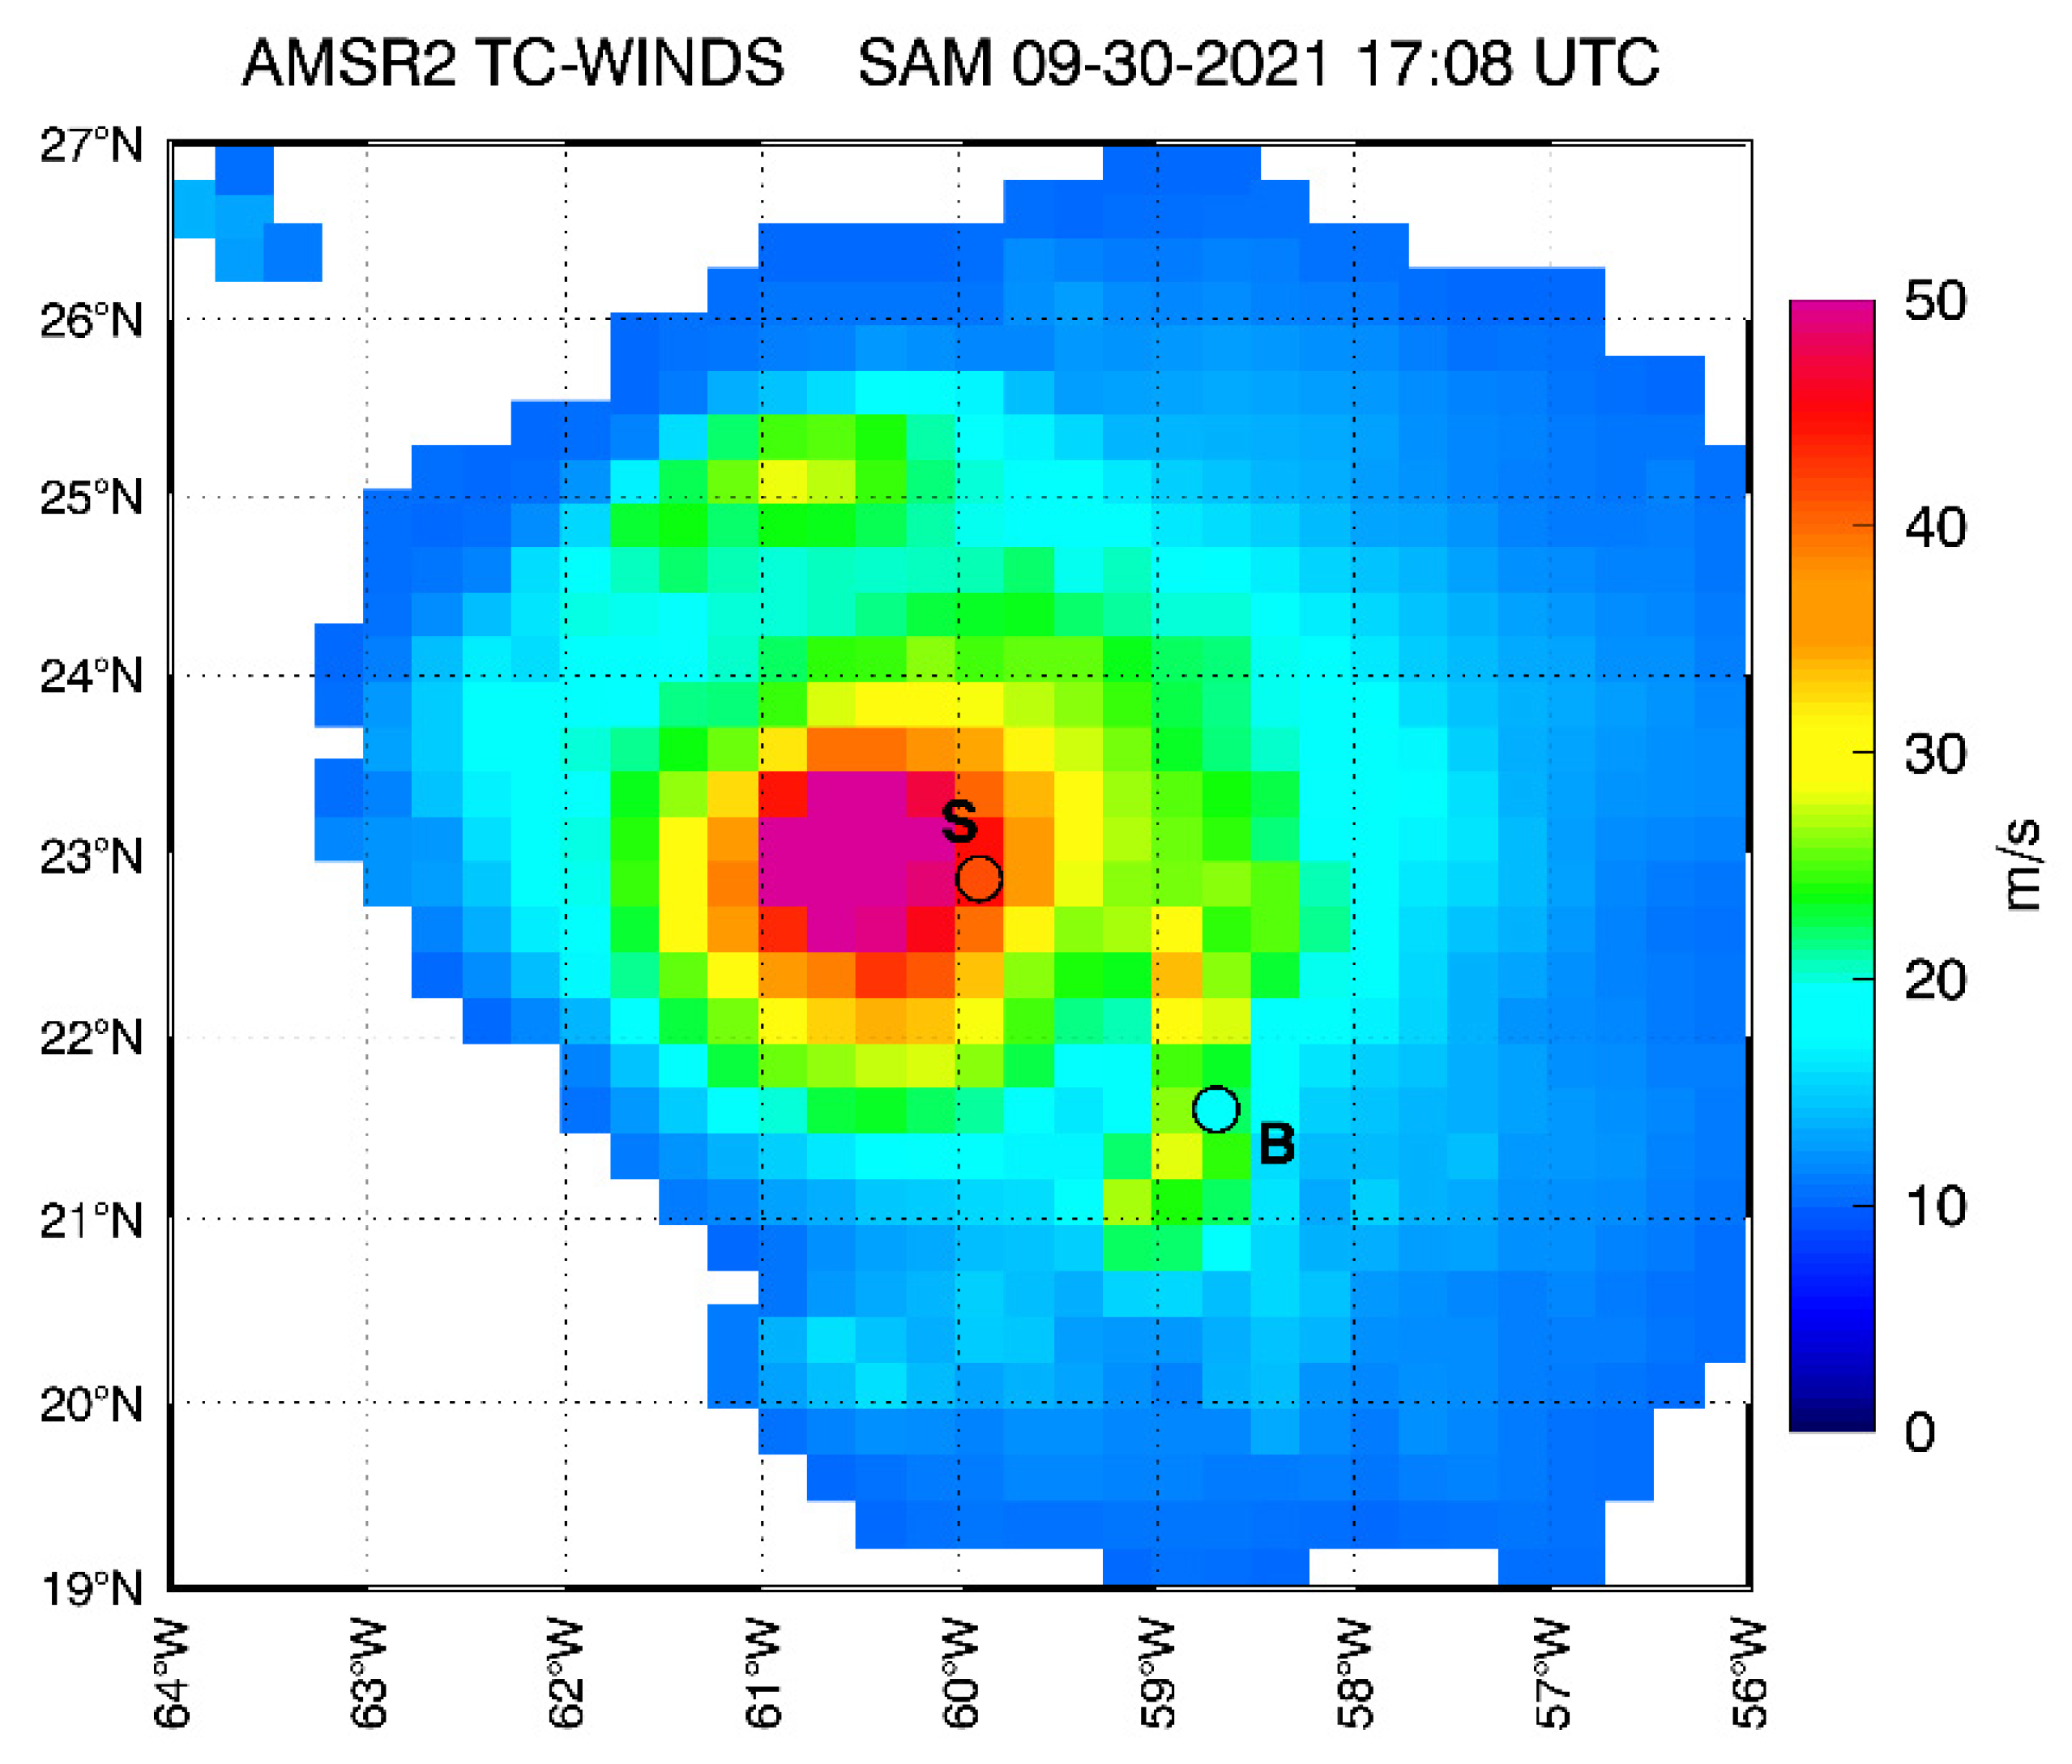
Figure 6.
Surface wind field from the SAR RadarSat2 (RS2) pass over Hurricane Sam at 09:58 UTC on 30 September 2021. The high resolution of the SAR allows for the identification of the fine structure of the wind field in the core of Hurricane Sam, including the small eye and reduced wind on the west of the eye, which was possibly the remnant of the eye replacement cycle that occurred on that day. The SD-1045 (S) and Buoy 41044 (B) positions are overlaid on the satellite pass, with their respective 10 m wind speeds (1 min average for SD) color-coded with the same scale as the satellite winds. Note that the buoy falls outside the swath of the satellite in this case.
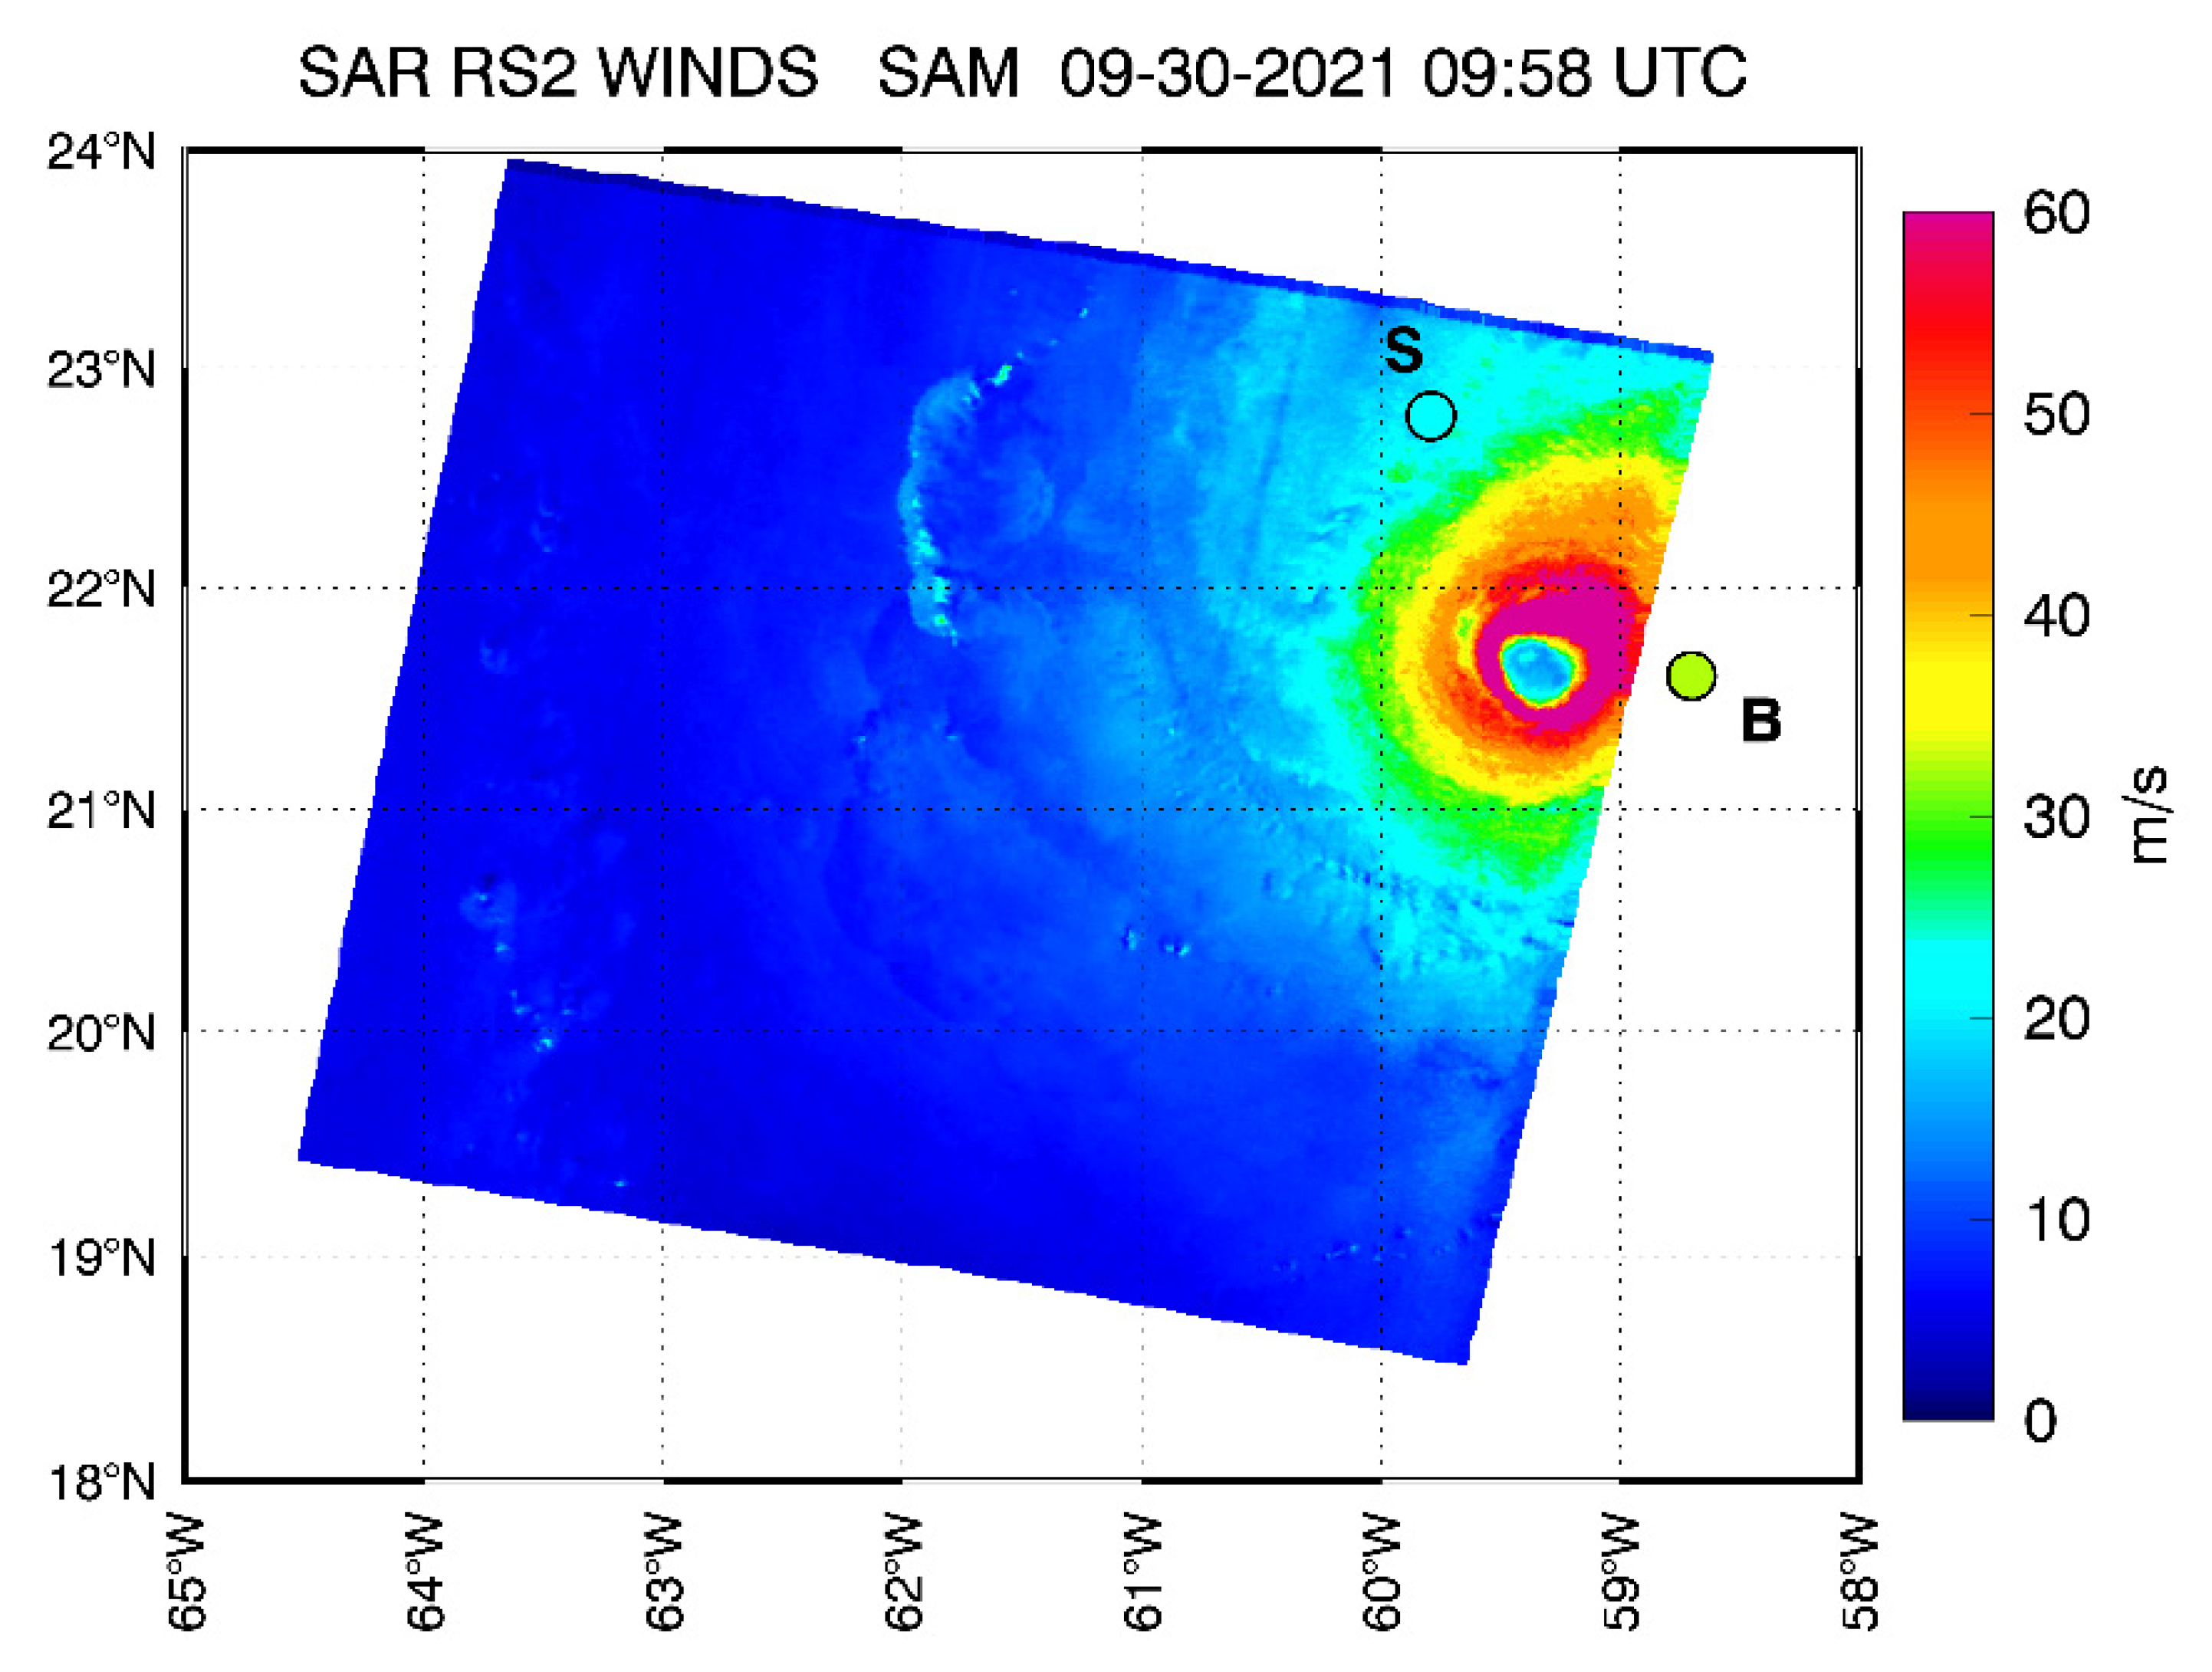
Figure 7.
(a) SAR RS2 wind field (resampled) at 09:58 UTC compared to (b) SMAP winds at 10:25 UTC on 30 September 2021. Overlaid are the SD-1045 and Buoy 10 m winds at the respective times, color-coded to reflect their wind intensity (in the range 0–50 m/s). The yellow star indicates the center of the storm as identified by the SAR data at high resolution (Figure 6).
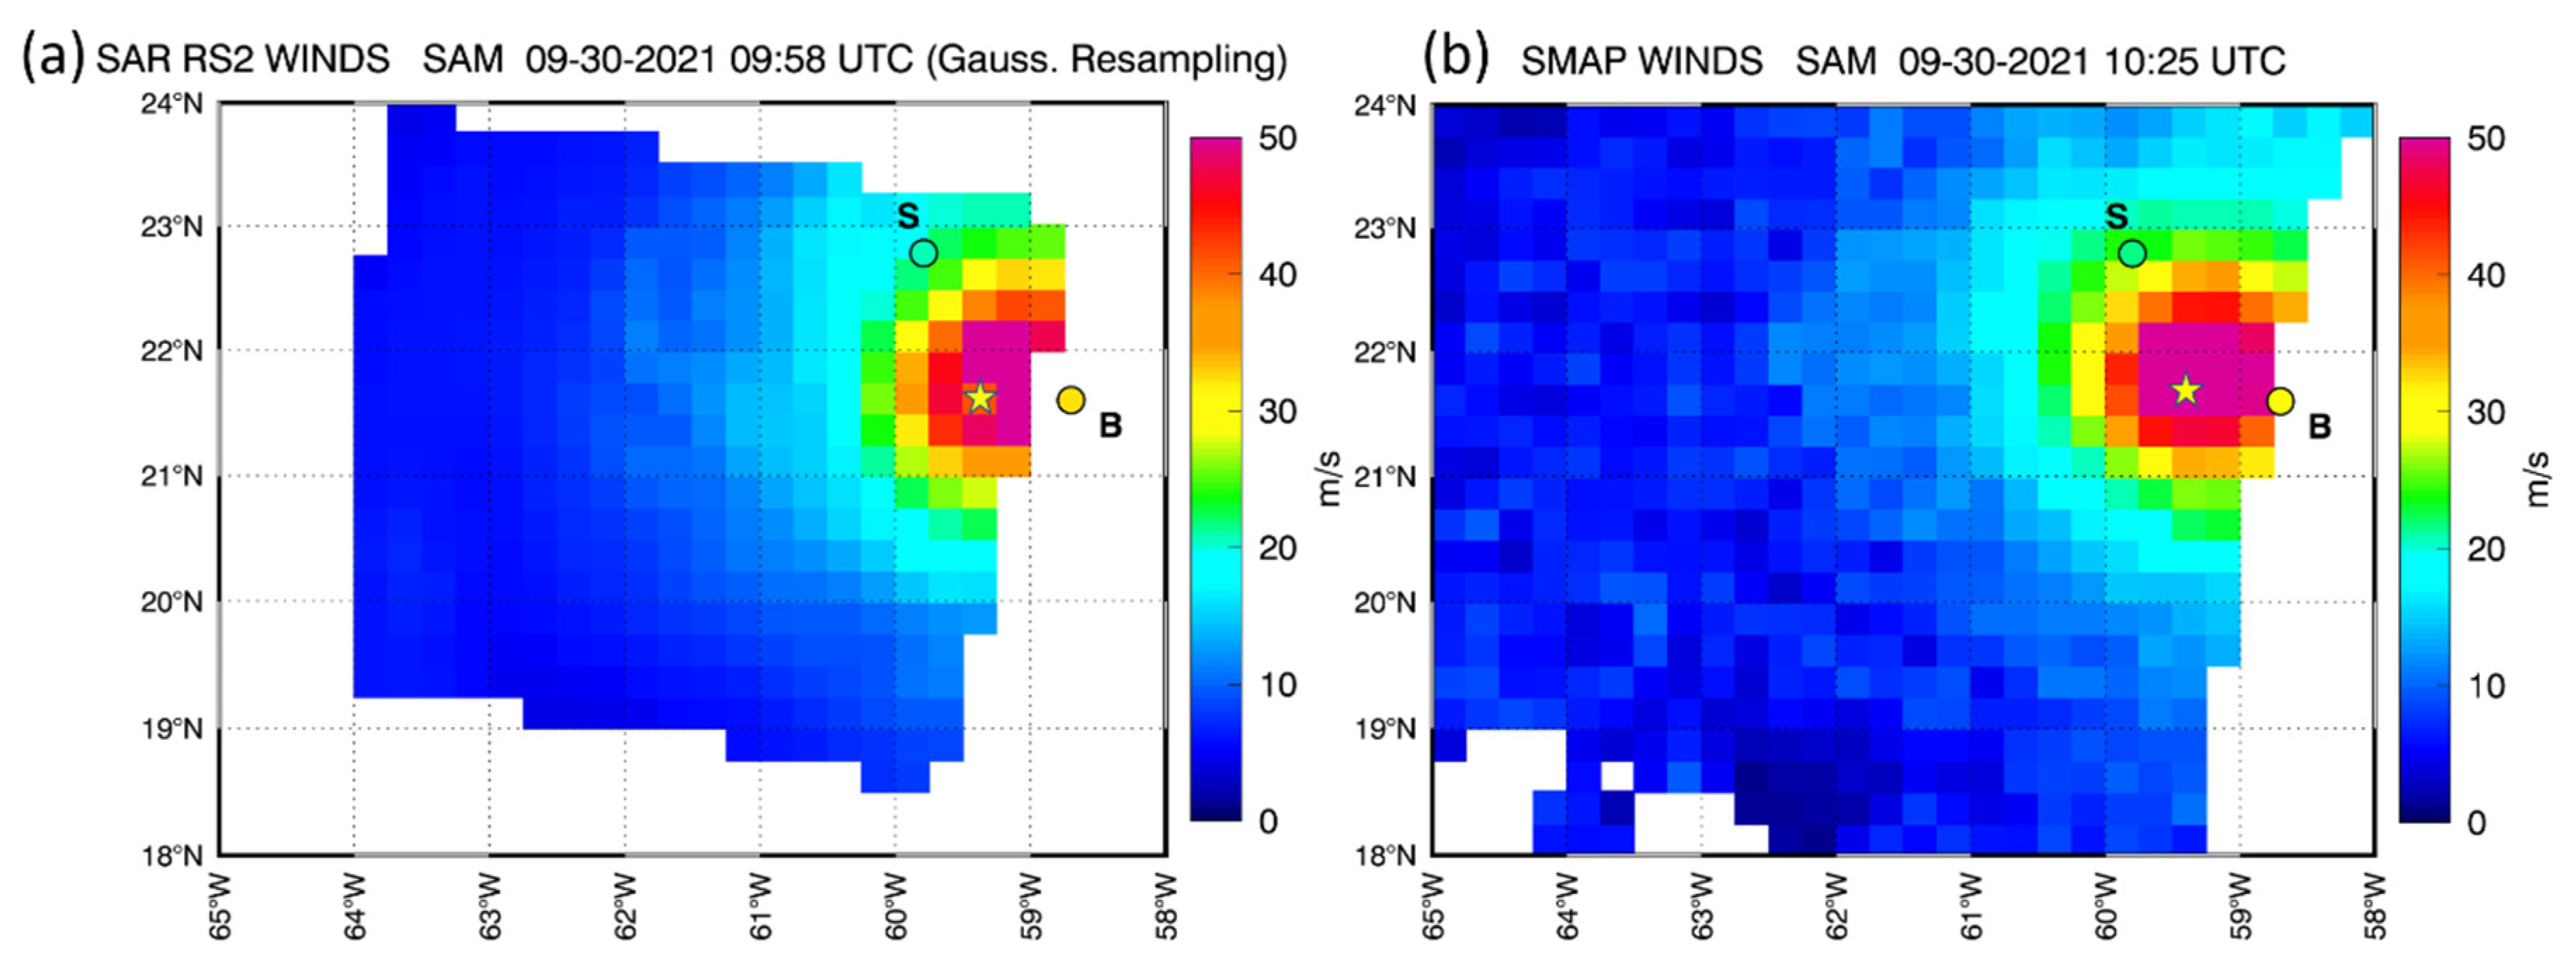
Figure 8.
Scatterplot of SMAP 10 m winds versus the resampled SAR RS2 winds in Hurricane Sam on 30 September 2021 for the passes illustrated in Figure 7a,b. The statistics for bias, standard deviation and correlation coefficient refer only to wind retrievals above 10 m/s.
Figure 8.
Scatterplot of SMAP 10 m winds versus the resampled SAR RS2 winds in Hurricane Sam on 30 September 2021 for the passes illustrated in Figure 7a,b. The statistics for bias, standard deviation and correlation coefficient refer only to wind retrievals above 10 m/s.
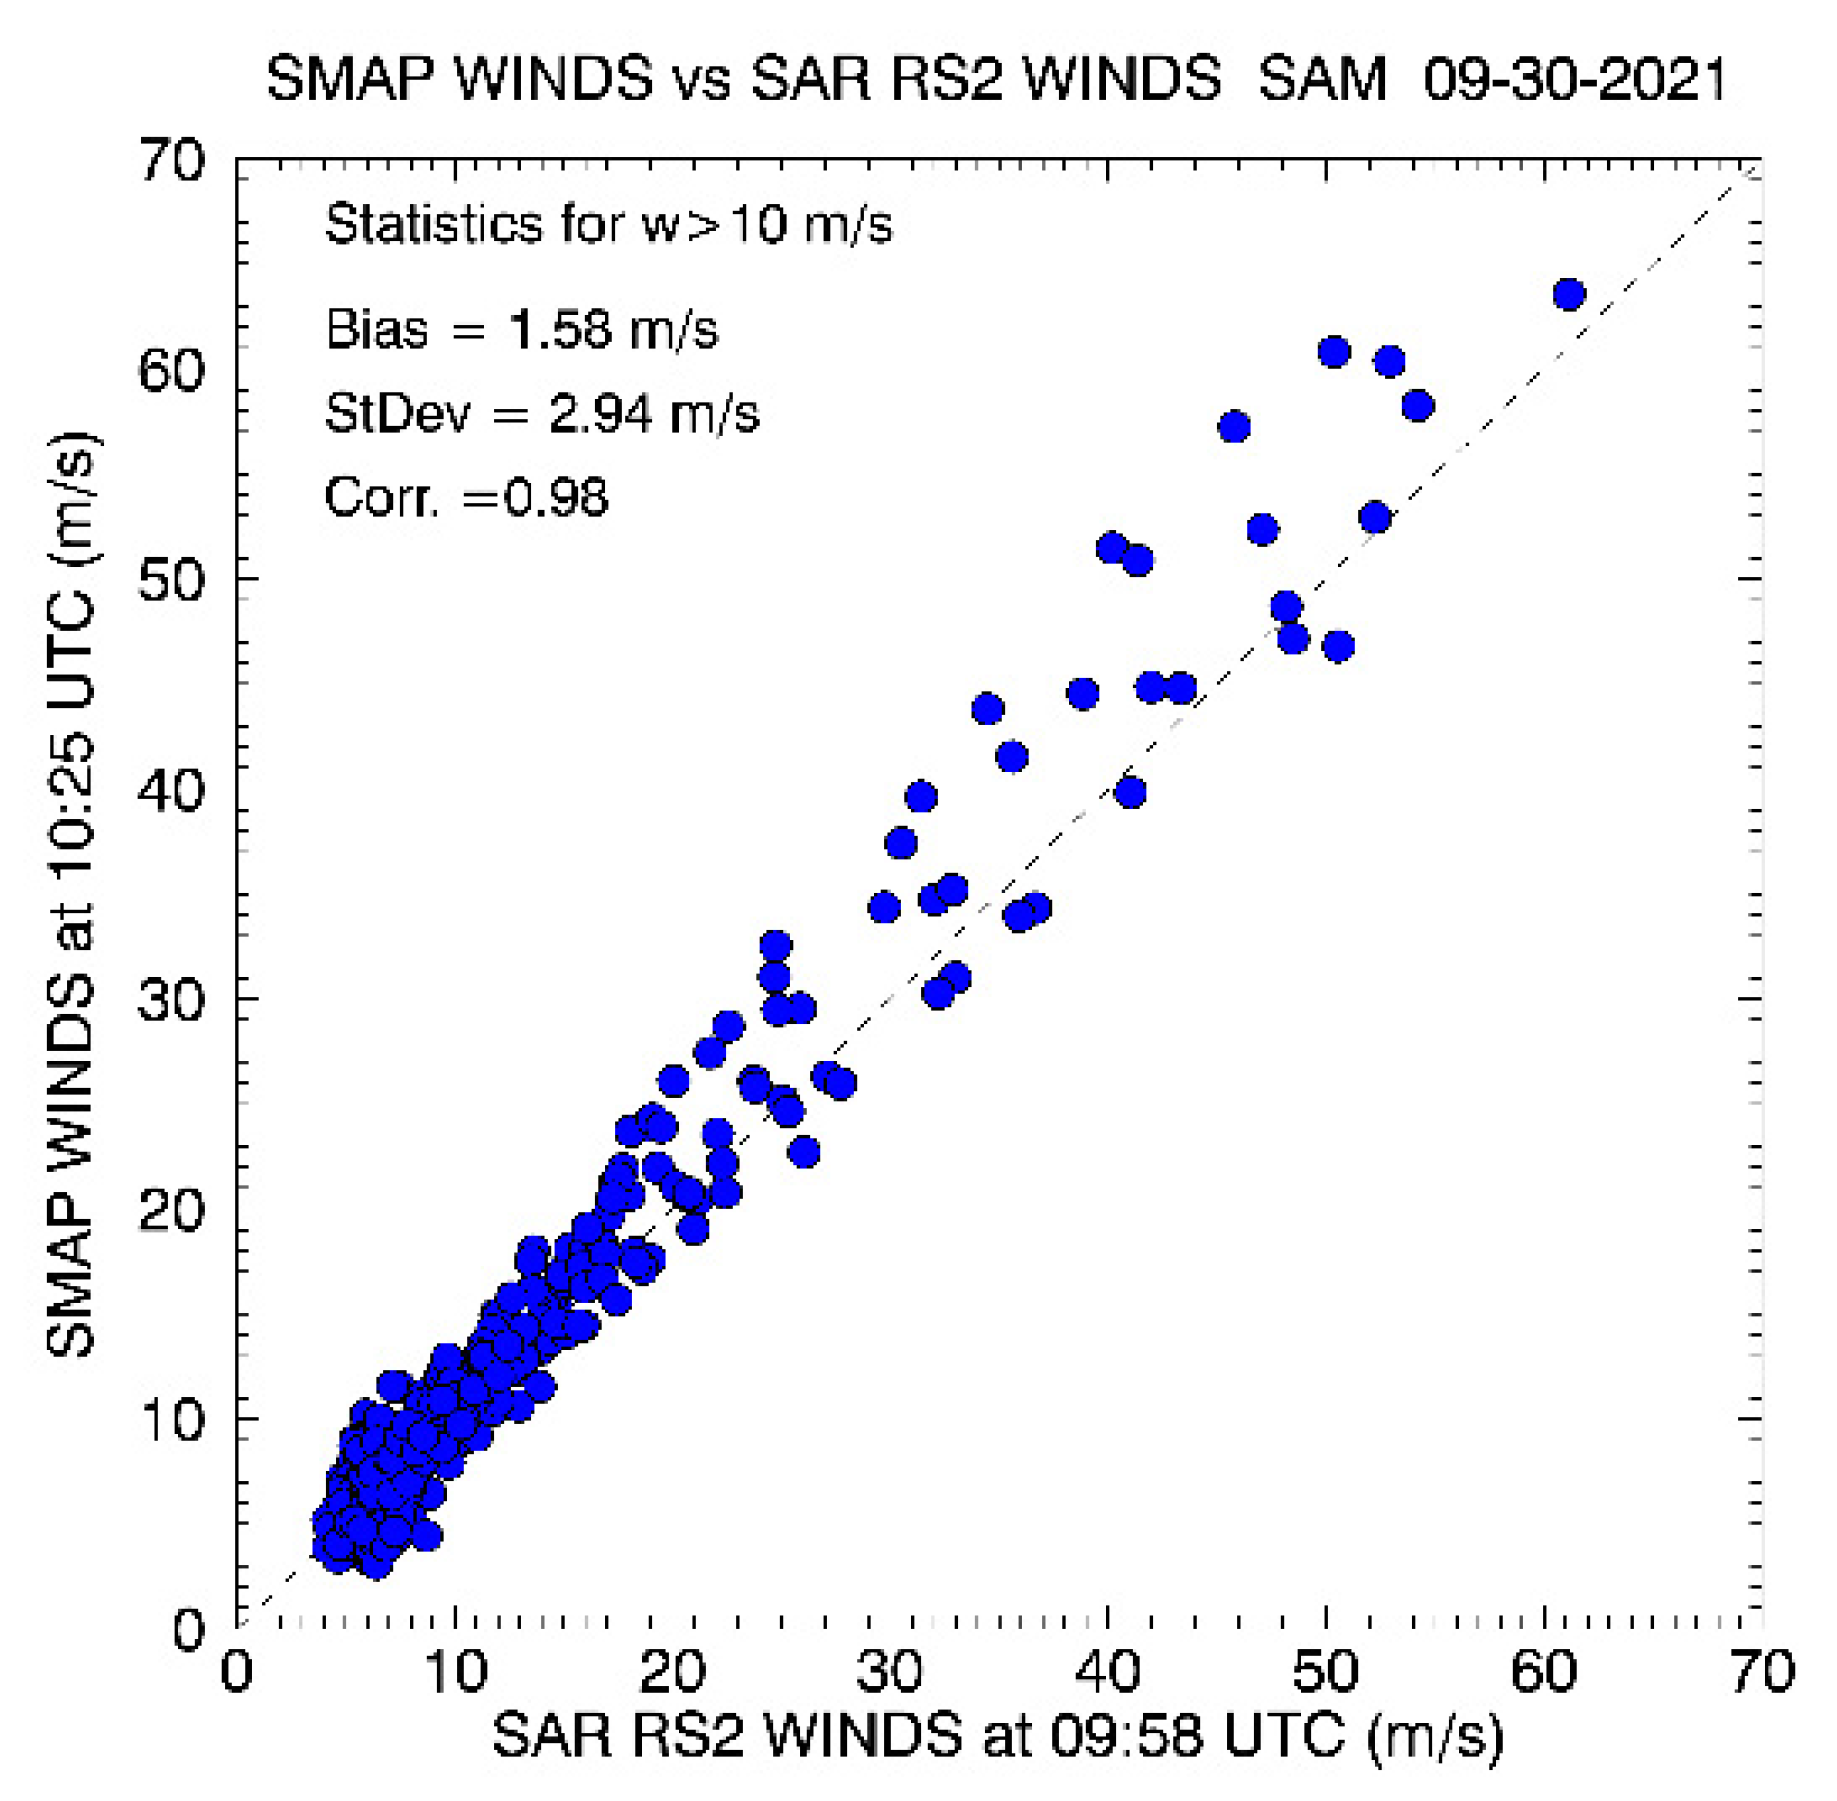
Figure 9.
HWRF model scene for the surface wind field in Hurricane Sam on 30 September 2021, for the 3 h forecast field at 15Z, when SD-1045 was in the core of the storm and experienced the peak winds. The SD-1045 and buoy locations and corresponding 10 m wind speed are overlaid on the model wind field, displayed within a common range of 0–50 m/s. For this small storm, a comparison between the in situ and the model wind field is more challenging due to the strong wind gradients and the potentially slightly displayed storm center in the model field.
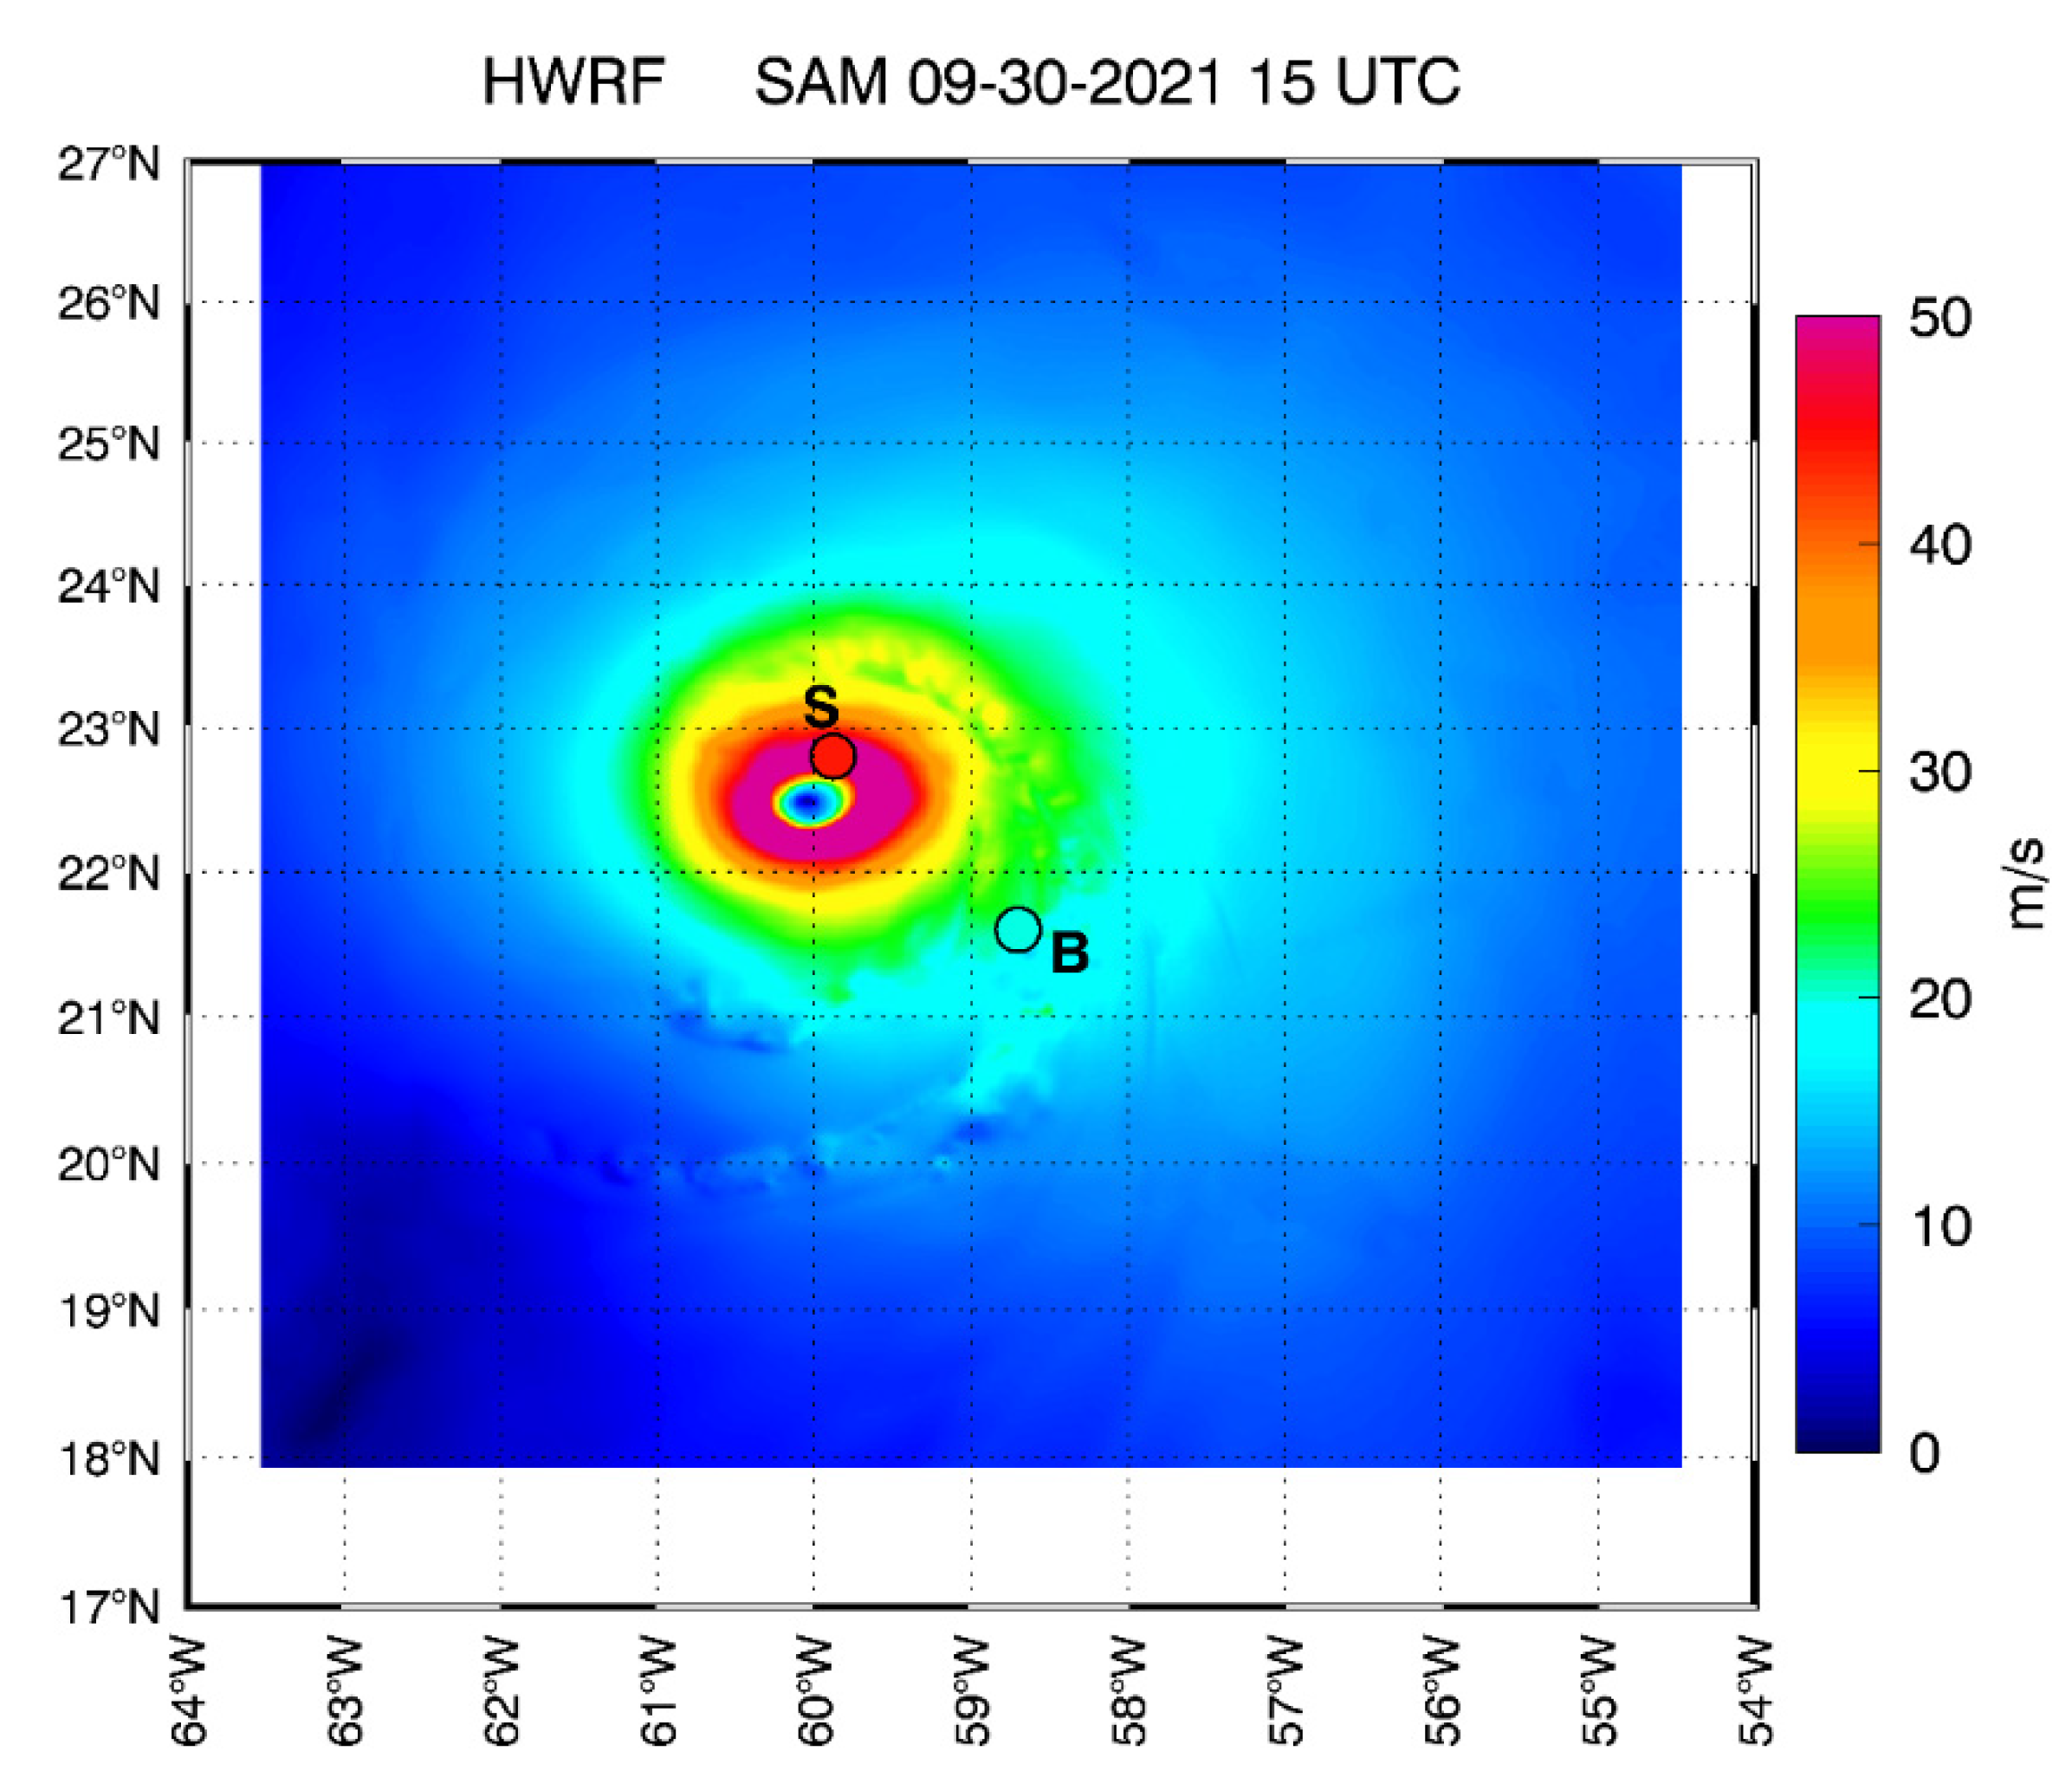
Figure 10.
Similar to Figure 7a, but for the HWRF 12Z resampled wind field for Hurricane Sam on 30 September 2021. Overlaid are the SD-1045 (27.7 m/s) and buoy 10 m winds (24.2 m/s) at the respective times, color-coded to reflect their wind intensity (in the range 0–50 m/s). The correspondent resampled HWRF values at the SD and buoy location are 31.7 and 28.2 m/s, respectively. The yellow star indicates the center of the storm as identified by the high-resolution HWRF 12Z field (Supplementary Figure S2, panel b).
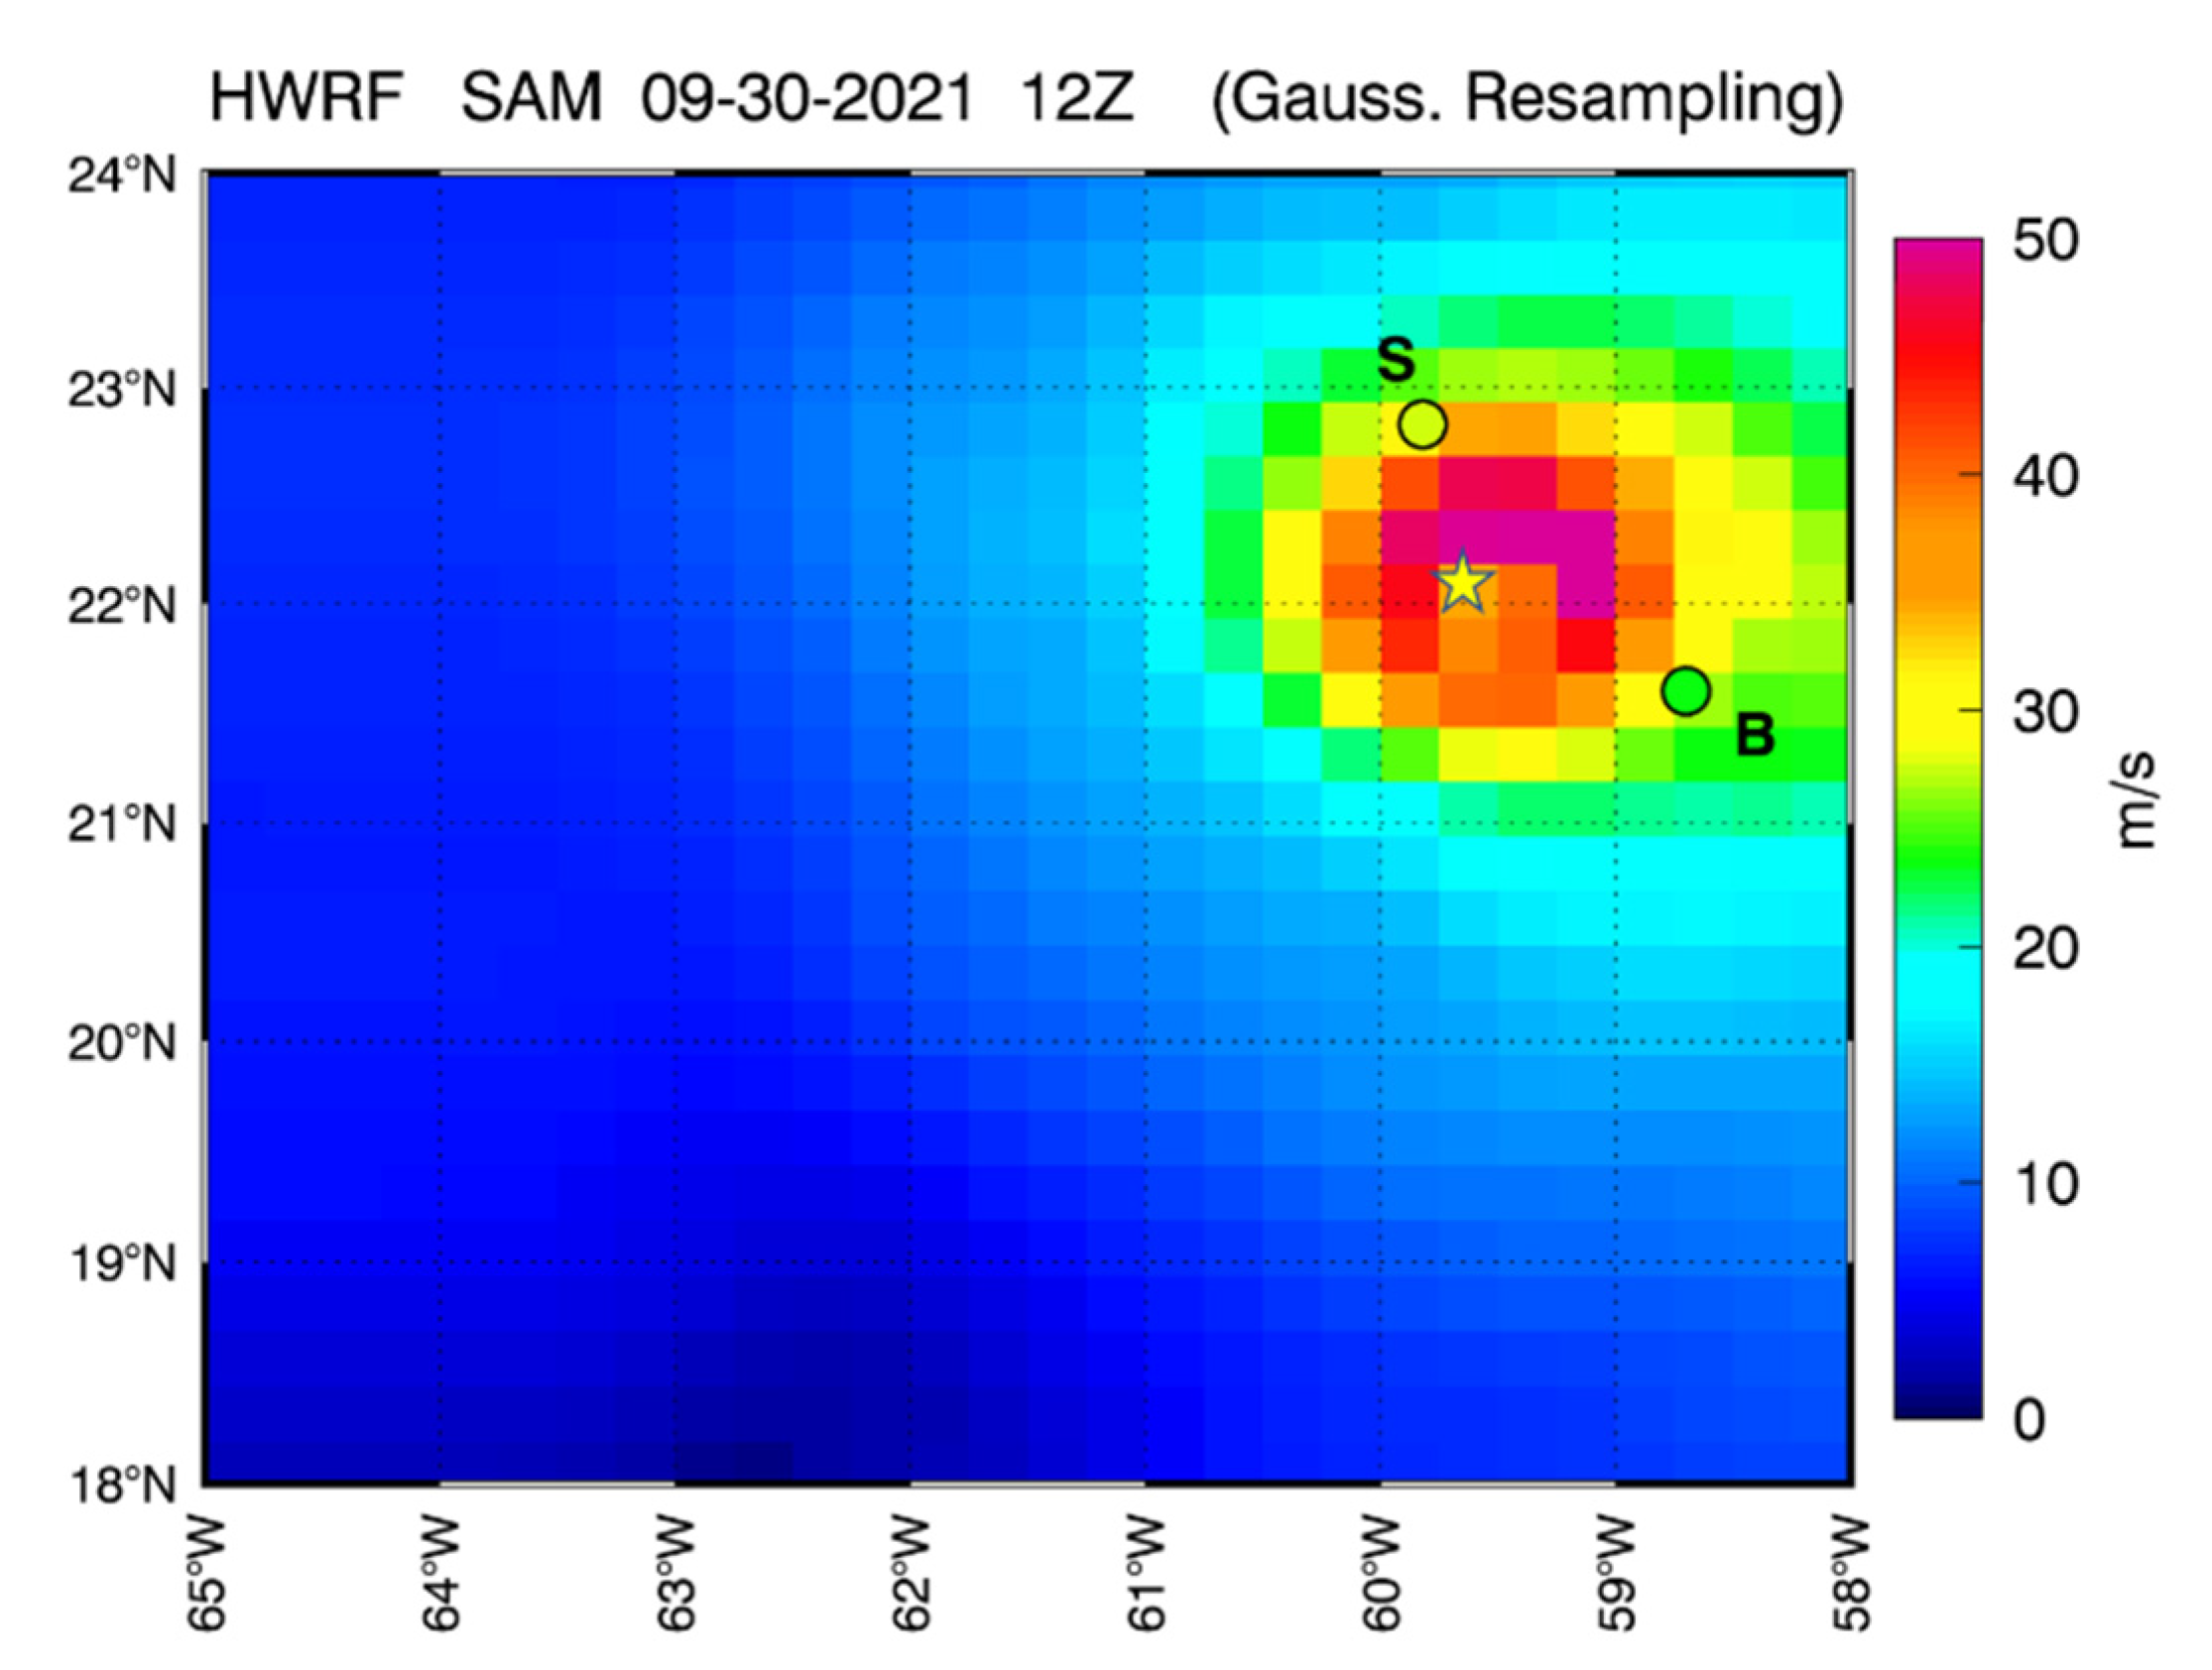
Figure 11.
(a) Longitudinal (S-N) and (b) latitudinal (W-E) cross-sections of the wind field on 30 September 2021, passing through the center of the storm, for the SAR pass at 09:58 UTC, the HWRF at 12 UTC, and SMAP at 10:25 UTC. Solid lines refer to high-resolution wind fields, while the dashed lines refer to resampled SAR (red) and HWRF (yellow) wind to match the lower resolution SMAP winds (blue).
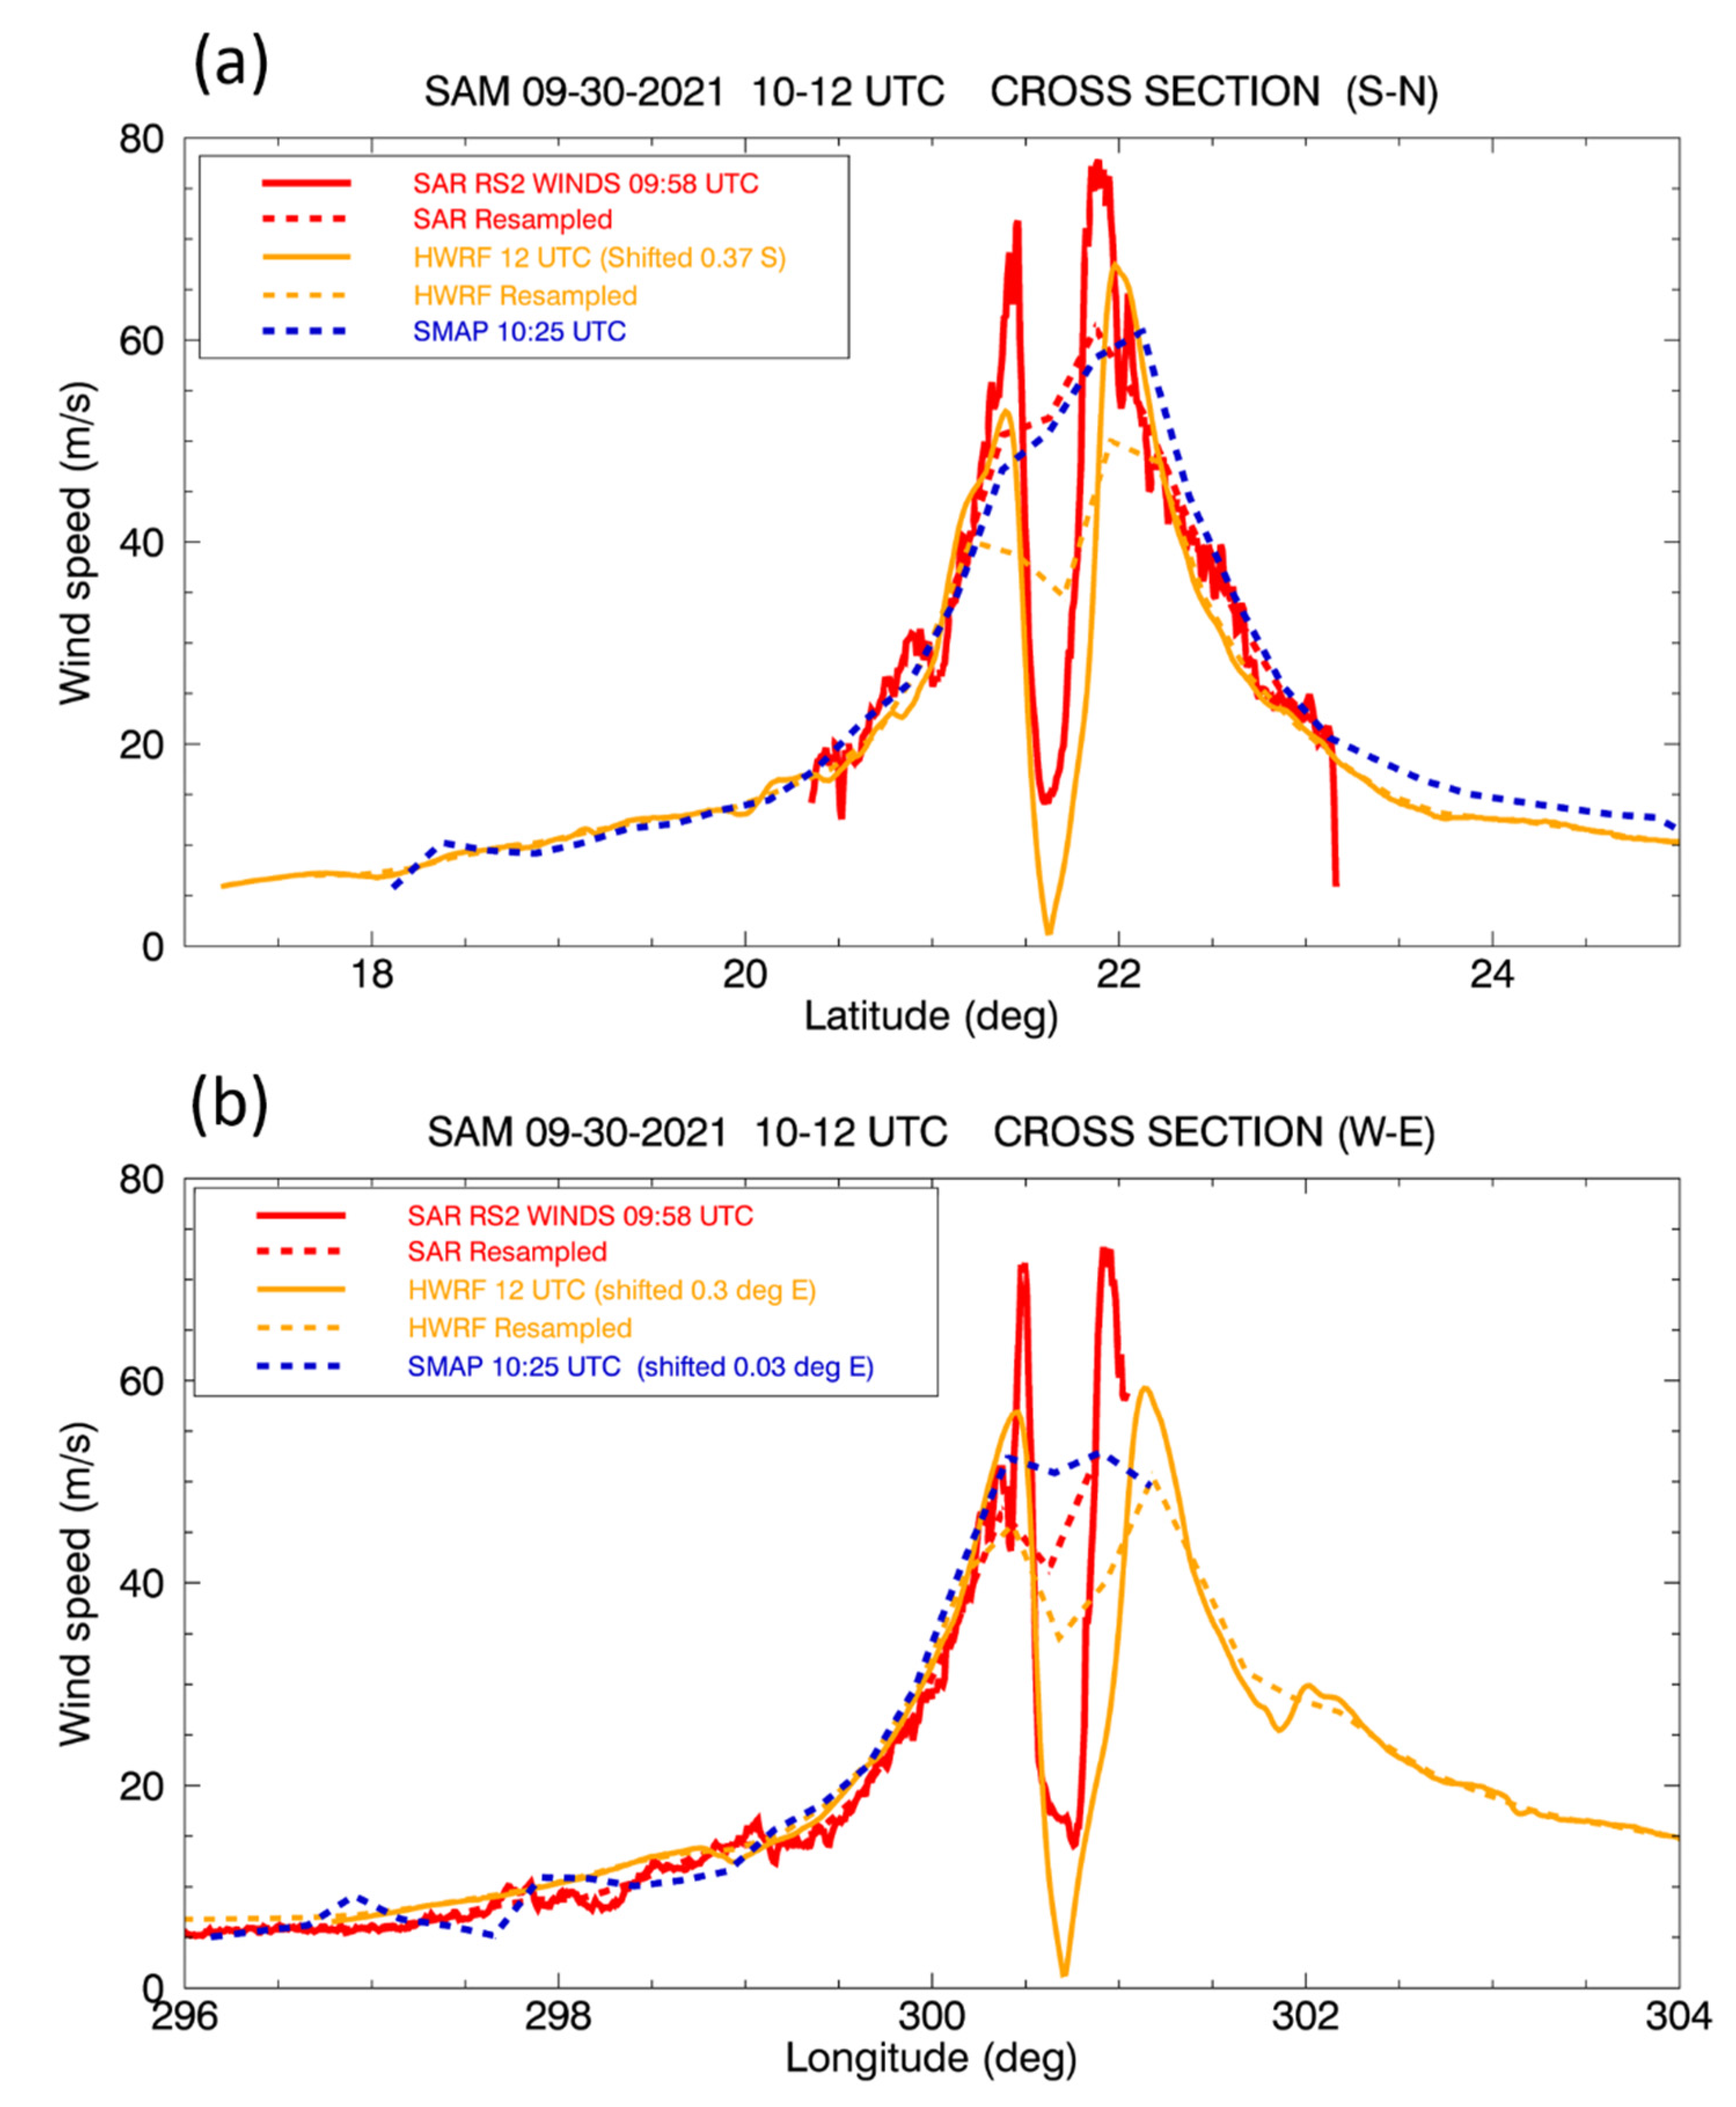
Figure 12.
Scatterplot of the SD-1045 winds, adjusted to 10 m using the COARE 3.5 algorithm, colocated with the satellite winds within a 25 km grid box and within 5 min. The following satellite data were used in this figure, limited to the day for which SD was in the core of Hurricane Sam, 30 September 2021: SAR RS2, SMAP, AMSR2 TC-winds and ASCAT (-B and -C). The statistics for bias, standard deviation and correlation coefficient include only wind observations above 10 m/s. The comparison with SAR is performed using 1 min SD observations, while 10 min SD wind averages were used for comparisons with all the other satellites to take into account the larger spatial scales of those measurements.
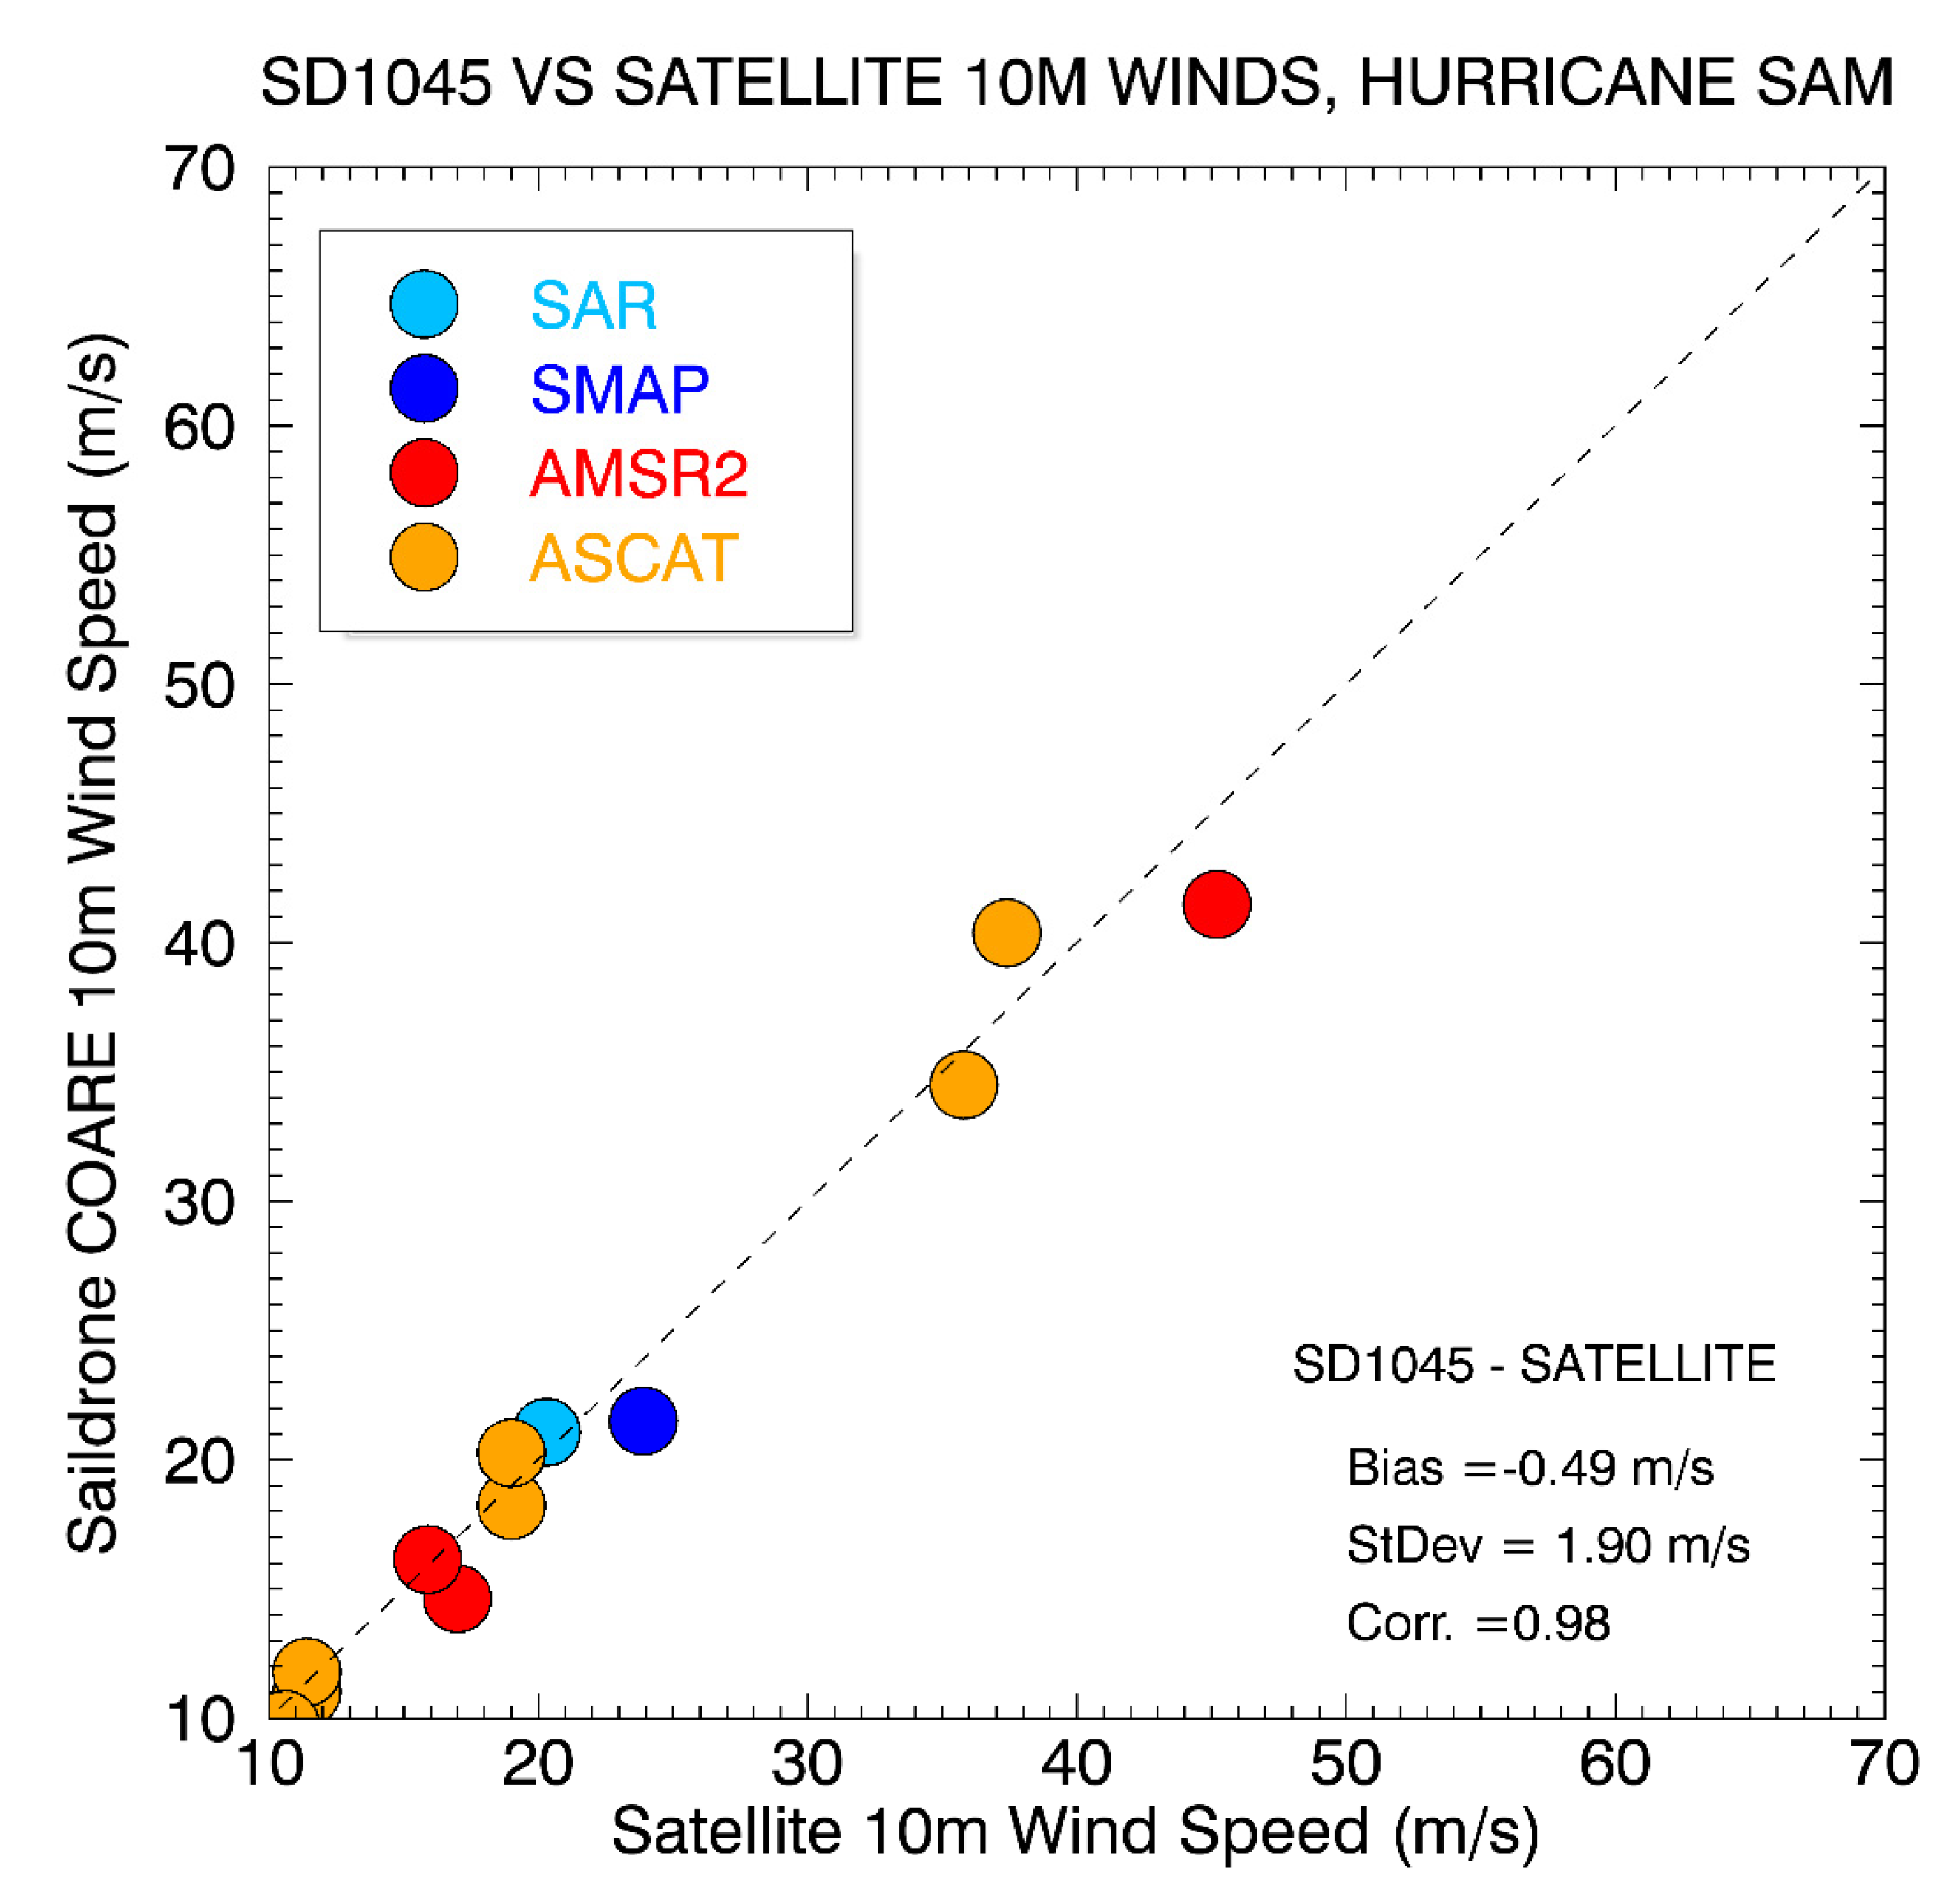
Figure 13.
Surface (10 m) wind/sea level pressure relationship within Hurricane Sam on 30 September 2021, as in the HWRF model (gray squares), the SD-1045 1-min SLP and wind observations adjusted to 10 m using COARE (cyan squares), and the buoy 41044 10-min SLP/wind observations (magenta squares). Overlaid are the satellite 10 m winds colocated with the SD SLP measurements.

Table 1.
Observing properties of the satellite sensors and algorithms. Note that SMAP and AMSR2 have lower resolutions of about 40 km, but they are oversampled, allowing a gridding of 25 km.
Table 1.
Observing properties of the satellite sensors and algorithms. Note that SMAP and AMSR2 have lower resolutions of about 40 km, but they are oversampled, allowing a gridding of 25 km.
| Sensor | Spatial Resolution (Gridding) | Range | Equivalent to: |
|---|---|---|---|
| SMAP | 40 km (25 km) | 10–70 m/s | 10 min sustained |
| AMSR2 (TC-winds) | 40–50 km (25 km) | 10–70 m/s | 10 min sustained |
| ASCAT | 25 km (25 km) | 0–35 m/s; reduced sensitivity above | 10 min sustained |
| SAR | 3 km | 0–70 m/s | 1 min sustained |
Publisher’s Note: MDPI stays neutral with regard to jurisdictional claims in published maps and institutional affiliations. |
© 2022 by the authors. Licensee MDPI, Basel, Switzerland. This article is an open access article distributed under the terms and conditions of the Creative Commons Attribution (CC BY) license (https://creativecommons.org/licenses/by/4.0/).
Share and Cite
MDPI and ACS Style
Ricciardulli, L.; Foltz, G.R.; Manaster, A.; Meissner, T. Assessment of Saildrone Extreme Wind Measurements in Hurricane Sam Using MW Satellite Sensors. Remote Sens. 2022, 14, 2726. https://doi.org/10.3390/rs14122726
AMA Style
Ricciardulli L, Foltz GR, Manaster A, Meissner T. Assessment of Saildrone Extreme Wind Measurements in Hurricane Sam Using MW Satellite Sensors. Remote Sensing. 2022; 14(12):2726. https://doi.org/10.3390/rs14122726
Chicago/Turabian StyleRicciardulli, Lucrezia, Gregory R. Foltz, Andrew Manaster, and Thomas Meissner. 2022. "Assessment of Saildrone Extreme Wind Measurements in Hurricane Sam Using MW Satellite Sensors" Remote Sensing 14, no. 12: 2726. https://doi.org/10.3390/rs14122726
Note that from the first issue of 2016, this journal uses article numbers instead of page numbers. See further details here.