
Climate Drivers of Pine Shoot Beetle Outbreak Dynamics in Southwest China
by
 , , and
Linfeng Yu
1, 
Zhongyi Zhan
2,
Quan Zhou
2,
Bingtao Gao
2,
Lili Ren
2,
Huaguo Huang
3 and
and
Youqing Luo
2,* 1
School of Ecology and Nature Conservation, Beijing Forestry University, Beijing 100083, China
2
Key Laboratory for Forest Pest Control, College for Forestry, Beijing Forestry University, Beijing 100083, China
3
Key Laboratory for Silviculture and Conservation of Ministry of Education, Beijing Forestry University, Beijing 100083, China
*
Author to whom correspondence should be addressed.
Remote Sens. 2022, 14(12), 2728; https://doi.org/10.3390/rs14122728
Submission received: 21 April 2022
/
Revised: 31 May 2022
/
Accepted: 5 June 2022
/
Published: 7 June 2022
Abstract
:Outbreaks of pine shoot beetles (Tomicus spp.) have caused widespread tree mortality in Southwest China. However, the understanding of the role of climatic drivers in pine shoot beetle outbreaks is limited. This study aimed to characterize the relationships between climate variables and pine shoot beetle outbreaks in the forests of Yunnan pine (Pinus yunnanensis Franch) in Southwest China. The pine shoot beetle-infested total area from 2000 to 2017 was extracted from multi-data Landsat images and obtained from field survey plots. A temporal prediction model was developed by partial least squares regression. The results indicated that multi consecutive year droughts was the strongest predictor, as such a condition greatly reduced the tree resistance to the beetles. The beetle-infested total area increased with spring temperature, associated with a higher success rate of trunk colonization and accelerated larval development. Warmer temperatures and longer solar radiation duration promoted flight activity during the trunk transfer to the shoot period and allowed the completion of sister broods. Multi consecutive year droughts combined with the warmer temperatures and higher solar radiation duration could provide favorable conditions for shoot beetle outbreaks. Generally, identifying the climate variables that drive pine shoot beetle outbreaks could help improve current strategies for outbreak control.
1. Introduction
Pine shoot beetles (Tomicus yunnanensis Kirkendall and Faccoli, and Tomicus minor Hartig) are considered the most destructive insects of coniferous forests in Southwest China. Their primary host is the Yunnan pine (Pinus yunnanensis Franch), a keystone species in Southwest China that plays an important role in water and soil protection. The Yunnan pine covers approximately five million hectares of the land surface in Yunnan Province, accounting for 52% of the forest area [1,2,3]. Millions of trees were killed during pine shoot beetle outbreaks in Southwest China during the 2000s. In addition, pine shoot beetles continued to spread over nearby districts in recent years, resulting in serious economic losses [4,5,6].
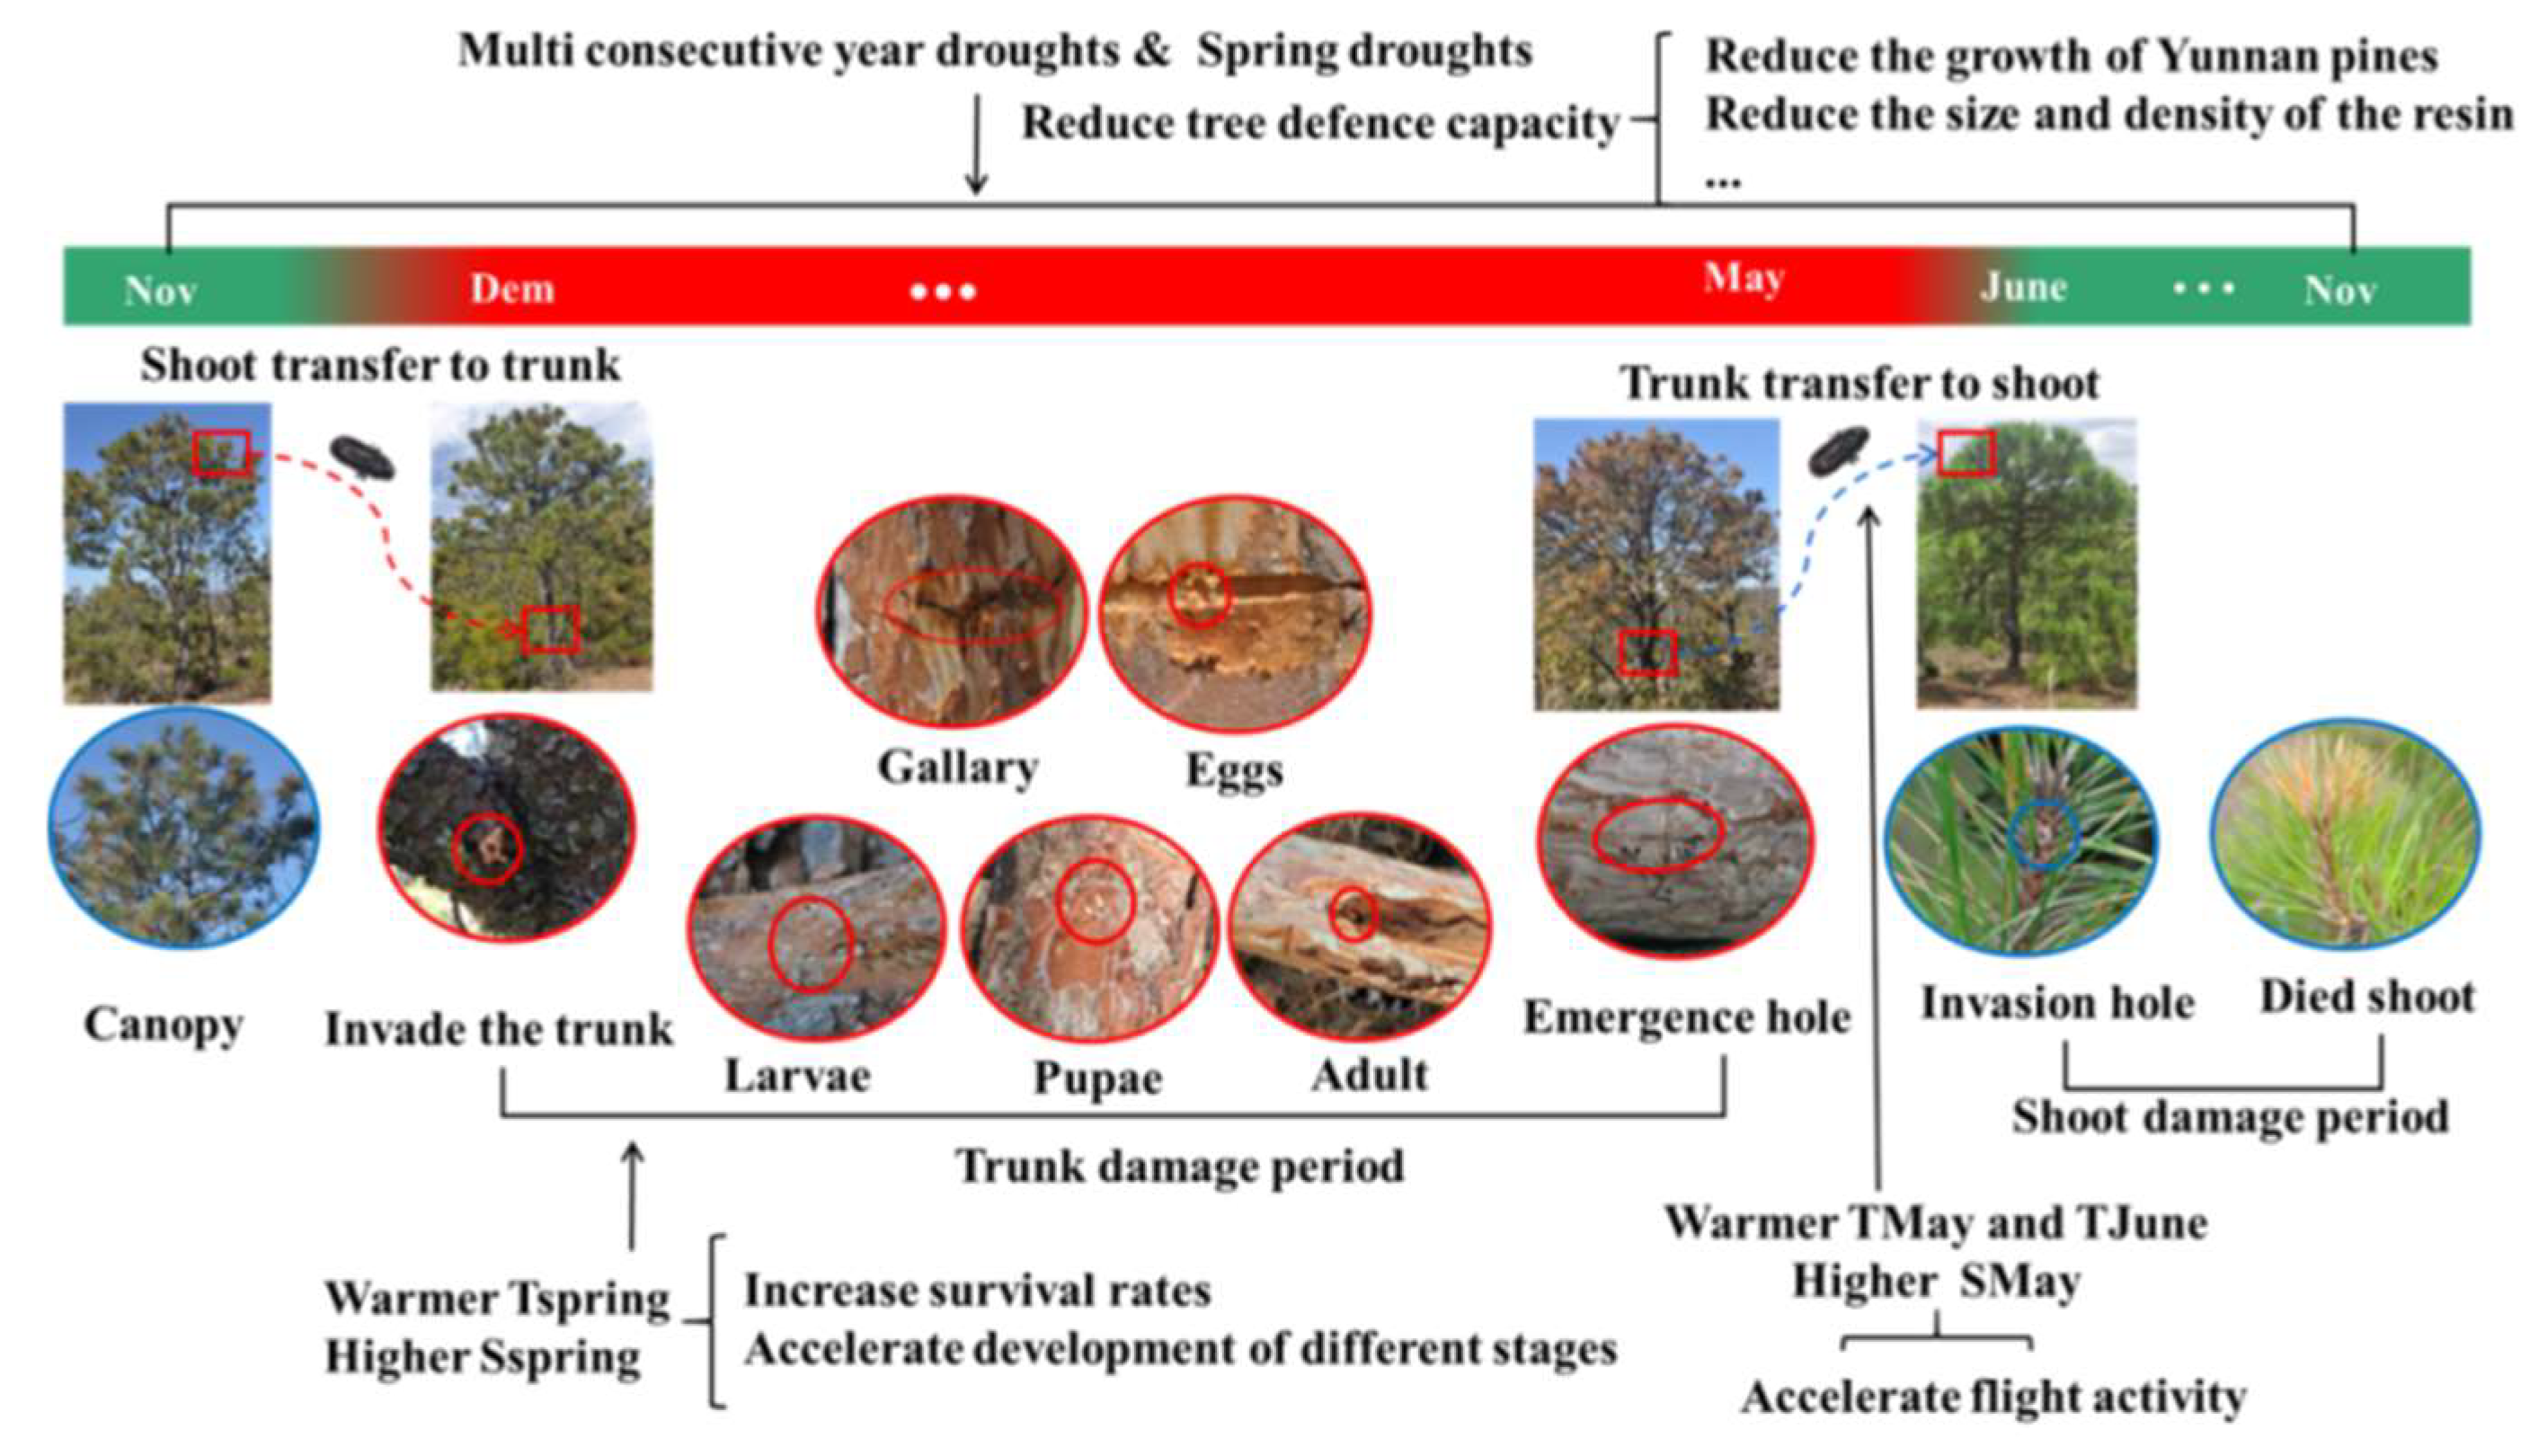
The life cycle of pine shoot beetles in Southwest China has been well characterized by several bioecological studies [4,7,8,9,10,11,12,13]. In principle, pine shoot beetles cause two different kinds of damage in different periods: shoot feeding and trunk attacks. During shoot damage periods, the newly adults emerged from trunks and fly to the crowns of nearby pines in early May, and feed inside the shoots from May to November to become sexually mature. Shoots damaged by the beetles eventually die. In the shoot transfer to trunk periods, mature pine shoot beetles prefer hosts with high shoot damage ratios to lay eggs, as extensive shoot feeding by adult beetles can make the trees susceptible to trunk attacks [14]. Some pine shoot beetles have the habit of sister breeding. Sexually mature adults move towards the trunk to lay eggs in early November. Then, adult beetles re-emerge in late December and fly to the pine crowns to feed in the shoots, followed by the initiation of a sister brood in March of the following year. The life cycle from egg hatching to adult emergent are all under bark during trunk damage periods. In Yunnan, the two Tomicus species can co-occur in the same pine tree [12,13]. Gallery construction and larval feeding disrupt the flow of nutrients within the phloem tissue and weakens or kills the hosts.
Beetles are among the most important biotic disturbance agents affecting forest ecosystems [15,16,17,18,19,20]. Although the factors driving recent outbreaks of beetles are complex, climate change is a major driver of beetle outbreaks [21,22,23,24,25,26,27]. Climate change facilitates the temporal and spatial dynamics of beetles in several ways. Temperature can directly affect the development time, metabolism, emergence synchronicity, and mortality of beetles [28,29,30,31,32,33,34,35]. Warmer temperatures in the growing season affect the reproduction and dispersal of beetles [36,37], enabling beetles to complete the first generation earlier and potentially a second generation [38]. The increase in winter temperature will also reduce the winter beetle mortality [39,40,41]. Many studies have shown that drought has driven historical bark beetle outbreaks [42,43,44,45]. The impacts of drought on beetle dynamics are reflected in the host tree, because the defense mechanism of trees may be damaged under drought conditions, especially extreme drought conditions. Drought stress may make host trees more susceptible to beetle infestation in several ways. For instance, by preventing pine trees from producing enough resin to resist the attack of beetles [46,47,48,49,50]. Drought stress also reduced the phloem thickness of trees, which has been shown to be positively correlated with beetle spawning [51]. The warmer and drier conditions associated with future climate change are thus expected to increase the severity of beetle outbreaks in coniferous forests [45,52].
The scientific literature on the relationship between the beetle and climate mainly focused on bark beetles, such as Dendroctonus ponderosae, Ips typographus, Orthotomicus erosus, etc. (e.g., [23,53,54,55,56]). Although Tomicus species (Coleoptera, Scolytidae) are important pests of pine forests in Europe [57,58,59], the United States [60,61,62], Asia [4], etc., little is known about how different climatic factors affect outbreaks of Tomicus species. In Europe, Horn et al. [63] found that T. destruens prefers warmer temperatures, whereas T. piniperda prefers colder climates. A few researchers have studied the effect of temperature on the development of Tomicus spp. [4,57,64,65,66]. To our knowledge, no study to date has examined the relationships between climate changes and outbreaks of T. yunnanensis and T. minor in China based on time-series data. Given that forest damage induced by pine shoot beetles has increased markedly during previous decades throughout Southwest China, there is a pressing need to understand the relative importance of various climate variables in driving outbreaks of these significant biotic disturbance agents.
Here, we characterized pine shoot beetle outbreak dynamics by analyzing data of beetle-infested total area extracted from multi-Landsat satellite images in Southwest China from 2000 to 2017. The objective of this study is to quantify the importance of key climate variables in driving pine shoot beetle outbreaks at a county level using partial least squares (PLS) regression. We hypothesized that (1) severe droughts, especially multi consecutive year droughts conditions, are an important predictor triggering the pine shoot beetle outbreak because of reduced host defenses, and (2) warmer temperatures and solar radiation would accelerate beetle development and promote flight activity. Detailed quantitative analyses that link the damages to Yunnan pines induced by pine shoot beetles to multiple climate variables, which will enhance our understanding of the causes of recent outbreaks and improve currently used strategies for outbreak control.
2. Materials and Methods
2.1. Study Area
Our study area was centered on Xiangyun County, Dali City, Yunnan Province, China (Figure 1a). According to the historical survey data of the local forestry bureau, there was an outbreak of pine shoot beetles in this area since 2010. The area has two seasons: the dry season (i.e., November–May) and the wet season (i.e., June–October). The average annual precipitation is 998 mm, and the average yearly temperature is 13.7 °C. The average monthly maximum and minimum temperatures are 27 °C and 3 °C (http://data.cma.cn/) (accessed on 1 January 2019). The boundary of Yunnan pine forest was extracted based on a subcompartment factor vector diagram of Xiangyun County (Figure 1c). Due to the poor soil and limited irrigation conditions, the main afforestation method of Yunnan pine is direct seeding afforestation. The forests in the study area are dominated by pure planted Yunnan pine forests and covers an area of approximately 2000 km2. A flowchart of the variable selection processes and the development of a prediction model is presented in Figure 2 below.
2.2. Response Variable
The response variable was the pine shoot beetle-infested total area, which was used as an indicator of beetle populations. The time trajectory of the beetle-infested total area was established from 2000 to 2017 via following steps.
2.2.1. Landsat Data
We used yearly Landsat imagery data from 2000 to 2017 to predict percent shoot damage ratios within a Landsat pixel. A total of 18 Landsat images (Table 1) were downloaded from the USGS GLOVIS website (http://glovis.usgs.gov) (accessed on 1 January 2019) and radiometrically normalized. The selection date and pretreatment method of Landsat images were described in a previous study [67]. Moisture stress index, MSI was chosen because previous research has shown that it is effective in detecting pine shoot beetle damage using satellite data [67]. MSI was calculated by the ratio of SWIR 1 and NIR bands. Compared with the “healthy pine” classes, the “non-healthy pine” classes have higher reflectance values in SWIR1 band and lower reflectance values in NIR band (Figure 3). We calculated the MSI anomalies, e.g., MSI’, the spectral anomaly for a given year is the difference between the multi-temporal undisturbed average (determined by the iterative process of eliminating the interference year) and the pixel value in a given year.
2.2.2. Field Data
Forty field plots (30 m × 30 m) established in November 2016 in the southeastern portion of the study area (Figure 1d) were used for model development and evaluation. We measured each tree’s shoot damage ratio (SDR) in each plot. SDR of each tree is the ratio of damaged shoots to total shoots. Plot SDR was the average SDR of all trees in the plot. The SDR was defined as the degree of damage sustained by beetle-infested forests. Plots included different degrees of damage to beetle-infested forests, and the SDR ranged from 0 to 90%. We used a Trimble GeoExplorer 3 GPS to record the geographical coordinates of each plot.
2.2.3. Statistical Modeling of Percent Shoot Damage Ratios
We developed and evaluated a regression model based on the MSI’ (independent variable) and SDR of field plots in 2016 (dependent variable) to predict the percentage of SDR induced by pine shoot beetles within a grid cell (30 m). The inversion model was detailed described in our previous study [68]. The overall mean R2 for the inversion model for the reference data (i.e., from field sample plots) vs. model predictions (i.e., from Landsat images) of SDR was 0.837. The slopes and intercepts of observed vs. predicted values (Figure 4) indicated that the model tended to slightly overestimate the SDR of healthy and slightly damaged forests (SDR range: 0–20%) and slightly underestimate the SDR of severely damaged forests (SDR range: 50–100%). Estimates of SDR for moderately damaged forests (SDR range: 20–50%) were relatively accurate. Based on the performance of the inversion model, we defined pixels with SDR >20% as beetle-infested areas and built a time series of the pine shoot beetle-infested total area from 2000 to 2017. The SDR map for 2010 was also validated by comparison with the field survey data collected by the Xiangyun County Forestry. Investigators conducted a comprehensive ground survey of all Yunnan pine forests in study area in 2010. The damaged shoots were sampled to determine whether they were damaged by pine shoot beetles. Moreover, SDR was used as an index to determine the infested area of pine forests. Finally, taking the stand class as the unit, the investigators drew the distribution map of the forests damaged by pine shoot beetles in 2010.
Field sample surveys conducted by local foresters in the study area indicated that the infested area of pine shoot beetles in Pinus yunnanensis accounts for above 95% of the total infested area of pine forest pests; the density of pine shoot beetles was much higher in beetle-infested forests than other beetle species, such as Shirahoshizo patruelis Voss and Monochamus alternatus Hope. We assumed that pine shoot beetles primarily drove recent forest disturbance. The error associated with the prediction of the pine shoot beetle-infested area will not substantially affect the results.
2.3. Explanatory Variables
We used climatic variables as independent predictors to make inferences about pine shoot beetle infestation. Daily weather data from five local weather stations (Lijiang, Dali, Jingdong, Chuxiong, and Huaping) within the study area from 1970 to 2017 were interpolated via second-order inverse distance weighting. The spatial resolution of the interpolated raster was 30 m. Daily climate data were downloaded from the China Meteorological Data Sharing Service System (http://data.cma.cn) (accessed on 10 November 2018). We averaged the values of all pixels in the study area to obtain climate variables for each day, month, and year. Climate explanatory variables were selected to analyze the relative importance of different climate drivers in affecting beetle outbreaks.
Temperature is believed to be one of the limiting factors affecting the pine shoot beetle population [7,64,65,69]. In this study, we tried to capture the effects of various temperature factors on the different life stages of pine shoot beetles. We used the following temperature variables (Table 2): (1) annual mean temperature; (2) monthly mean temperature; (3) the minimum temperature of the coldest month; (4) the minimum daily temperature of the coldest month; and (5) quarter temperature. We measured Tspring, Tsummer, Tautumn, and Twinter. According to previous studies [64,65], light intensity plays a role in the flight activities of pine shoot beetles. To explore the relationship between solar radiation and flight activity of pine shoot beetles, we also measured (1) monthly cumulative solar radiation duration; (2) quarter cumulative solar radiation duration (Sspring, Ssummer, Sautumn, and Swinter); and (3) cumulative solar radiation duration in the current year.
Drought events are thought to be an important factor triggering beetle outbreaks [42,47,70]. The effects of precipitation might be long-lasting. In this study, precipitation variables were divided into three groups (Table 2), including (1) quarter precipitation (Pspring, Psummer, Pautumn, and Pwinter); (2) annual cumulative precipitation (current-year precipitation was denoted as “P0”, previous-year precipitation was denoted as “P1” to determine whether the previous year’s precipitation was related to the current infested area); and (3) cumulative precipitation for the previous two or three years (P12 and P123, respectively), which were determined by adding the previous years together and represented multi consecutive year droughts-related host tree stress. Temperature-based drought indexes were not used to avoid correlations with thermal sums. These variables were used because they describe variation in temperature, solar radiation, and precipitation related to the pine shoot beetle phenology and physiological stress experienced by host trees [71,72]. The climate variables considered are shown in Table 2.
2.4. Statistical Analysis
We characterized the relationships between climate variables and beetle-infested total area by building a temporal prediction model for the entire study area using PLS regression analysis. This analysis was proven to be an effective method in assessing the relationship [73]. When relating the pine shoot beetle-infested total area with multiple climate variables, we will encounter the problem that climate variables are always highly correlated and it is difficult to model with traditional technology. PLS method is a regression technique that can be used effectively in these situations, where the number of independent variables greatly exceeds the number of observations and when independent variables exhibit high multicollinearity [74,75]. The problem of overfitting in the PLS model is avoided by conducting principal component analysis of several potential factors and then using the principal components to fit the regression model. PLS models were fitted using climate variables as the independent variables and beetle-infested total area as the dependent variable. The most important results of the PLS model were the variable importance projection (VIP) scores and the standardized model coefficients. The VIP values indicate the importance of independent variables in explaining changes in the dependent variable, and 1 is usually used as the threshold for identifying important variables [76]. The standardized model coefficients indicate the intensity and direction of the effect of independent variables on changes in the dependent variable [73,77]. The interpretation of the standardized model coefficients is based on the premise that warm temperatures and high solar radiation duration are positively correlated with the beetle-infested total area, and high precipitation is negatively correlated with the beetle-infested total area.
Model prediction accuracy was determined by the coefficient of determination (R2) and the mean absolute error (MAE). R2 and MAE were calculated by Equations (1) and (2), respectively:
where n represents the number of samples; represents the predicted value of sample i; represents the actual value of sample i; and represents the average of i samples.
All statistical analyses were performed in Ref. [78], and the packages pls, ggplot2, and CarData were used.
3. Results
3.1. Changes in Beetle-Infested Total Forest Area from 2000 to 2017
The area of pine shoot beetle-infested forests from 2000 to 2017 showed that the outbreak of pine shoot beetle changed from local and small attack patches to large-area infestation (Figure 5). The percent similarity between the beetle-infested forest prediction map for 2010 with the observed map of the beetle-infested area generated by the Xiangyun County Forestry Bureau reached 76.72% (Figure 6), the predicted infested area and observed infested area were all approximately 10,000 hectares, which verified the reliability of our SDR prediction model. The beetle-infested total area from 2000 to 2017 was plotted against time (Figure 7A). The result showed that the beetle-infested total area had been slowly increasing since ca 2000, and the initial mostly scattered damage turned to large-scale damage after 2010. In the following years, the damage extent continued to increase, and in 2014 reached 25,000 ha, which makes up approximately 37% of the total Yunnan pine forest area in the region, and decreased in 2015.
We characterized changes in climate variable anomalies (differences from mean values calculated from 1971 to 2000) from 2000 to 2017 (Figure 7B–L). The analysis of the annual precipitation values (Figure 7D) shows the study area experienced multiple consecutive years of extreme to exceptional drought from 2009 to 2014, with 100–200 mm precipitation reduction, nearly 20% of the average annual cumulative precipitation (998 mm per year). A more detailed analysis of Pspring (Figure 7B) shows that Pspring anomalies were −76 mm and −50 mm in 2014 and 2015, compared with 100 mm of the average Pspring, indicating that exceptional spring drought may coincide with large-scale pine shoot beetle outbreaks. Substantially increased temperatures and solar radiation duration were accompanied by severe drought conditions occurring throughout the study area. The analysis of the temperature series reveals that an increasing trend has been evident throughout 2000–2017, approximately 1 °C above average for the annual temperature from 2009 to 2014 (Figure 7L). The Tspring has also warmed more than the yearly average, with an approximate 0.5 °C to 1 °C increase in drought years (Figure 7J). It is worth noting that Tspring increased by 2 °C in 2014. In addition, above-average solar radiation duration often coincided with drought and high temperature (Figure 7F–H).
3.2. Responses of Pine Shoot Beetle Outbreaks to Climate Variation from 2000 to 2017
The PLS model built to describe pine shoot beetle infestation provided significant components that together explained 75.7% of the original variance, revealing that climatic suitability was significantly related to the infestation success. The PLS regression model provided clear insights into the responses of pine shoot beetle outbreaks to climate variables (Figure 8). The VIP values of MTMay and MTJune exceeded one (the threshold value for variable importance). Tspring, Tsummer, and Twinter were strongly related to pine shoot beetle outbreaks, whereas Coldt and Tmin, which related to winter mortality, were unimportant. The annual mean temperature had the largest VIP value among the temperature variables (1.748). Model coefficients of important temperature variables were all positive, indicating that warmer temperatures had a strong effect on pine shoot beetle outbreaks. Solar radiation duration showed similar results; MSMay, MSJune, Sspring, and Smean were positively correlated with beetle-infested total area.
For quarter precipitation variables, only Pspring was strongly related to pine shoot beetle outbreaks. The VIP of P1 (1.423) was greater than the VIP of P0 (0.886), indicating that precipitation had a lagged effect on pine shoot beetle outbreaks; P123 had the largest VIP value (2.016) among all climate variables, indicating that multi consecutive year droughts was the strongest predictor of pine shoot beetle outbreaks. Model coefficients indicated that precipitation variables were negatively related to the beetle-infested total area.
Pine shoot beetle-infested total area was the dependent variable, and the 15 important climate variables selected by the VIP were the independent variables in the PLS model (Table 3). There was a linear relationship between the measured value and the predicted value of the beetle-infested total area (Figure 9). The adjusted R2 value was 0.748, with the MAE of 2681.05 hectares, indicating that the model could be used to predict the pine shoot beetle-infested total area in the study region.
4. Discussion
The lack of historical pine shoot beetle monitoring data makes it difficult to explore the relationship between beetle outbreaks and climate factors. It is mainly due to the shortcomings of traditional field investigation methods, such as a high cost, poor timeliness, a low efficiency, and the unsuitability for a large-scale investigation. This research successfully predicted the infested forests from 2000 to 2017 using multi-date Landsat images. According to the long-term historical data of pine shoot beetle-infested total area, our study provided the first systematic assessment of the effects of precipitation, temperature, and solar radiation duration on infestations of Tomicus spp. at the county level. Many studies have predicted yearly infestations of beetles at the county level [79,80,81]. The county level is important for forecasting because management recommendations are typically implemented at the county level in China. Furthermore, the findings at this scale provide more comprehensive insights into the determinants of pine shoot beetle infestations in Southwest China.
4.1. Influence of Drought on Pine Shoot Beetle Outbreaks
We found that the large-scale outbreak was observed subsequently during or after a period of reduced precipitation spanning from 2009–2014. We compared the effect of precipitation conditions of the current year with different sets of previous years (t − 3) and found that precipitation in the previous year (P1) had a lagged effect on pine shoot beetle outbreaks. Cumulative precipitation in the previous 1–3 years (P123) was the best predictor of pine shoot beetle outbreaks, which supported our first hypothesis, and more infections were likely to develop during or after a prolonged drought, which was consistent with previous studies [56,82,83,84,85]. Sufficiently severe drought can reduce the amount of the resin ducts in pines [86,87,88], which is an important physical barrier to prevent pine shoot beetles to lay eggs and hatch larvae [4,89,90,91,92]. Pine trees under drought stress are more susceptible to pine beetles (Figure 10), because pine beetles are secondary pine pests, mainly attacking weak pine trees [57,93].
Another interesting finding is that Spring drought was strongly related to pine shoot beetle infestations in Southwest China, which is consistent with some studies [94,95] that spring drought may result in large scale outbreak of pine shoot beetles. Pine shoot beetles in Southwest China are more aggressive than those in Europe. The drought period from October to May may be one of the main factors for their reproduction in living trunks [4]. Water is the main limiting factor for the radial growth of conifers in the Yunnan and Guizhou region [96], especially affected by water conditions in spring [97,98,99]. Spring drought that contributes to water deficits would strongly reduce tree growth [100], making Yunnan pines more vulnerable to pine shoot beetle infestation.
4.2. Influence of Warmer Temperature and Higher Solar Radiation Duration on Pine Shoot Beetle Outbreaks
We selected several temperature and solar radiation variables as predictors in the regression model to explore their effects on pine shoot beetle phenology. Our results verified our second hypothesis that spring climate variables, including Tspring and Sspring, were positively and significantly associated with the beetle-infested total area. These results can be explained as follows: The main development period of pine shoot beetles from egg to adult was in spring (February–May). The oviposition rate and the rate of egg gallery construction were positively correlated with the temperature [7,64,65,69]. Furthermore, the breeding success ratio has a strong positive relation to warm spring temperature [10]; the development time of egg, larval, and pupa stages of pine shoot beetles decreased drastically with warm spring temperatures, and improved their survival rate [7,65], which strongly affected the yearly population dynamics of pine shoot beetles.
Colonization of the shoots following emergence from the trunk, which corresponds to the beginning of the shoot damage period, is a key dispersal process in pine shoot beetles. In this study, the positive effect of mean temperature on pine shoot beetle occurrence prevailed during May and June, as these months correspond to the peak flight period (Figure 10). These findings were consistent with the previous studies showing that temperature and light intensity were critically important factors affecting the flight activity and peak period of pine shoot beetles [64,65,101,102,103,104]. Most pine shoot beetles fly in the afternoon and avoid flying at night. The higher the temperature at the beginning of the flight period, the larger the number of beetles flying on that day [57,69,102,105]. In addition, phototaxis plays an important role in guiding the newly emerged adults to feed shoots during the trunk transfer to shoot period [64,102,106]. The results of our study indicated that increased solar radiation duration in May accelerated the flight behavior of pine shoot beetles.
Winter temperature was an important factor associated with pine shoot beetle mortality [65,107,108]. In our study, ColdT and Tmin had no significant effect on pine shoot beetle outbreaks, this result can be explained because there were no extreme climate changes in the winters of 2000 to 2017, such as storms or excessive low temperatures, the ColdT and Tmin were greater than −1 °C and 3 °C, respectively in our study area. The supercooling points of adults of T. yunnanensis (−15.39 ± 4.53 °C) and T. minor (−13.81 ± 3.38 °C) in the study area, indicated that adults had a sufficient cold tolerance to withstand the lowest temperatures. On the other hand, Twinter has a strong positive relation to pine shoot beetle outbreaks. Due to the warm Twinter (greater than 10 °C) in our study area, Tomicus spp. did not overwinter and can thus continue to feed on the shoots [4,93], which was different from the overwinter in the bark at the base of living pine trees in Northern China and some European countries, e.g., [57,64,65]. In addition, the reemergence rate has a positive response to temperature [69], the warm Twinter also provides an opportunity for sister broods to reduce their risk of death and complete their development during winter [4]. The propagation of pine shoot beetles can be enhanced substantially by sister broods [108,109,110], sister broods were considered to be a mechanism to avoid intraspecific competition in large-scale attacks and increased the viability of future generations [111]. Sister broods would significantly increase pine shoot beetle populations, resulting in an increased attack pressure in subsequent seasons, especially during outbreaks.
5. Conclusions
This study reveals that the climatic suitability of both host trees and pine shoot beetles explains the pine shoot beetle outbreaks in Southwest China. Our results evidence that Yunnan pine forests are more vulnerable to pine shoot beetle infestation after drought conditions prevailed in preceding years, particularly when these sites are also under warmer spring temperature and a higher solar radiation in the current year at the county level. A prediction model that incorporates multiple climate variables might be helpful for predicting infested forests damaged by pine shoot beetles. This in-depth study of climate–beetle relationships enhances our understanding of the factors affecting the success of pine shoot beetle populations at the county level. This work would help forestry managers take appropriate measures to prevent the spread of pine shoot beetles in the Yunnan pine forest.
Author Contributions
Conceptualization, L.Y. and Y.L.; methodology, L.Y. and Z.Z.; software, Q.Z. and B.G.; writing—original draft preparation, L.Y.; writing—review and editing, L.R., H.H. and Y.L. All authors wrote the manuscript. All authors have read and agreed to the published version of the manuscript.
Funding
This study was supported by Beijing’s Science and Technology Planning Project (Z201100008020001) and Major emergency science and Technology Project of National Forestry and Grassland Administration (ZD202001).
Data Availability Statement
Not applicable.
Acknowledgments
We would like to thank the Yunnan Forestry Inspection Bureau and Forestry Bureau of Xiangyun County for supporting the field experiments and data collection. We appreciate the linguistic assistance provided by TopEdit during preparation of this manuscript.
Conflicts of Interest
The authors declare no conflict of interest.
References
- Luo, F.S.; Wan, G.H.; Pi, W.L. Studies on the geographical provenance of Pinus yunnanensis I. Seeding test. Acta Bot. Yunnanica 1987, 9, 427–435. [Google Scholar]
- Jin, Z.Z.; Peng, J. Pinus yunnanensis; Yunnan Science and Technology Publishing Press: Kunming, China, 2004; pp. 5–13. [Google Scholar]
- Dai, K.J.; He, F.; Shen, Y.X.; Zhou, W.J.; Li, Y.P.; Tang, L. Advances in the research on Pinus yunnanensis forest. J. Cent. South For. Univ. 2006, 26, 138–142. [Google Scholar]
- Ye, H. On the bionomy of Tomicus piniperda (L.) (Col., Scolytidae) in the Kunming region of China. J. Appl. Entomol. 1991, 112, 366–369. [Google Scholar]
- Duan, Y. Genetic Structuration and Host Tree Preference of T. piniperda Populations in Southwestern China, with Comparison to the French Population from Scots Pine. Ph.D. Thesis, Yunnan University, Kunming, China, 2003. [Google Scholar]
- Ji, M.; Dong, X.Q.; Liu, H.P.; Li, L.S.; Xu, H.; Yang, X.P.; Li, H.R.; Ze, S.Z. Preliminary study on remote sensing detection of yunnan pine forest damaged by Tomicus piniperda. J. West China For. Sci. 2007, 36, 87–90. [Google Scholar]
- Ye, H.; Li, L.S. The distribution of Tomicus piniperda (L.) population in the crown of Yunnan pine during the shoot feeding period. Acta Entomol. Sin. 1994, 37, 311–316. [Google Scholar]
- Ye, H. Studies on the biology of Tomicus piniperda (Col., Scolytidae) in the shoot-feeding period. Acta Entomol. Sin. 1996, 39, 58–62. [Google Scholar]
- Ye, H.; Lv, J.; Lieutier, F. On the bionomics of Tomicus minor (Hartig) (Col., Scolytidae) in Yunnan Province. Acta Entomol. Sin. 2004, 47, 223–228. [Google Scholar]
- Li, L.S.; Wang, H.L.; Chai, X.S.; Wang, Y.X.; Shu, N.B.; Yang, D.S. Study on the biological characteristics of Tomicus piniperda and its damage. Yunnan For. Technol. 1997, 2, 4–10. [Google Scholar]
- Hui, Y.C.; Lieutier, F. Shoot aggregation by Tomicus piniperda L. (Coleoptera: Scolytidae). Southwest. China Ann. Sci. For. 1997, 54, 635–641. [Google Scholar]
- Langstrom, B.; Li, L.S.; Liu, H.P.; Cao, P.; Liu, H.R.; Hellqvist, C.; Lieutier, F. Shoot feeding ecology of Tomicus piniperda, and T. minor, (col. scolytidae) in southern China. J. Appl. Entomol. 2002, 126, 333–342. [Google Scholar] [CrossRef]
- Shen, S.W.; Luo, Y.Q.; Yu, L.F.; Lu, W.J.; Han, X.G.; Ren, L.L. Temporal and spatial niches of two sympatric Tomicus species pests of Pinus yunnanensis Faranch. Chin. J. Appl. Entomol. 2018, 55, 279–287. [Google Scholar]
- Lieutier, F.; Ye, H.; Yart, A. Shoot damage by Tomicus sp. (Coleoptera: Scolytidae) and effect on Pinus yunnanensis resistance to subsequent reproductive attacks in the stem. Agric. For. Entomol. 2003, 5, 227–233. [Google Scholar] [CrossRef]
- Seppälä, R. Making Forests Fit for Climate Change: A Global View of Climate-Change Impacts on Forests and People and Options for Adaptation; Development Communication, Ministry for Foreign Affairs of Finland: Helsinki, Finland, 2009. [Google Scholar]
- Littell, J.S.; Oneil, E.E.; Mckenzie, D.; Hicke, J.A.; Lutz, J.A.; Norheim, R.A.; Elsner, M.M. Forest ecosystems, disturbance, and climatic change in washington state, USA. Clim. Chang. 2010, 102, 129–158. [Google Scholar] [CrossRef] [Green Version]
- Byron, J.C.; Charles, C.R.; Robert, M.H.; Michael, A.B. Tree regeneration and future stand development after bark beetle infestation and harvesting in Colorado lodgepole pine stands. For. Ecol. Manag. 2011, 261, 2168–2175. [Google Scholar]
- Stadelmann, G.; Bugmann, H.; Wermelinger, B.; Meier, F.; Bigler, C. A predictive framework to assess spatio-temporal variability of infestations by the European spruce bark beetle. Ecography 2013, 36, 1208–1217. [Google Scholar] [CrossRef]
- Bearup, L.A.; Maxwell, R.M.; Clow, D.W.; Mccray, J.E. Hydrological effects of forest transpiration loss in bark beetle-impacted watersheds. Nat. Clim. Chang. 2014, 4, 481–486. [Google Scholar] [CrossRef]
- Kamal, J.K.G.; Chelsea, N.M.; Paula, J.F.; John, M.F. Bark beetle outbreaks alter biotic components of forested ecosystems. Bark Beetle Manag. Ecol. Clim. Chang. 2022, 227–259. [Google Scholar] [CrossRef]
- Ayres, M.P.; Lombardero, M.J. Assessing the consequences of global change for forest disturbance from herbivores and pathogens. Sci. Total Environ. 2000, 262, 263–286. [Google Scholar] [CrossRef]
- Rouault, G.; Candau, J.-N.; Lieutier, F.; Nageleisen, L.-M.; Martin, J.-C.; Warzee, N. Effects of drought and heat on forest insect populations in relation to the 2003 drought in Western Europe. Ann. For. Sci. 2006, 63, 613–624. [Google Scholar] [CrossRef]
- Bentz, B.J.; Jacques, R.; Fettig, C.J.; Matthew, H.E.; Hayes, J.L.; Hicke, J.A.; Kelsey, R.G.; Negrón, J.F.; Seybold, S.J. Climate change and bark beetles of the Western United States and Canada: Direct and indirect effects. Bioscience 2010, 60, 602–613. [Google Scholar] [CrossRef]
- Logan, J.A.; Macfarlane, W.W.; Willcox, L. Whitebark pine vulnerability to climate-driven mountain pine beetle disturbance in the Greater Yellowstone ecosystem. Ecol. Appl. 2010, 20, 895–902. [Google Scholar] [CrossRef] [PubMed]
- Anderegg, W.R.L.; Hicke, J.A.; Fisher, R.A.; Allen, C.D.; Aukema, J.; Bentz, B.J.; Hood, S.; Lichstein, J.W.; Macalady, K.; McDowell, N.G.; et al. Tree mortality from drought, insects, and their interactions in a changing climate. New Phytol. 2015, 208, 674–683. [Google Scholar] [CrossRef] [PubMed]
- Hicke, J.A.; Meddens, A.H.H.; Kolden, C.A. Recent tree mortality in the western United States from bark beetles and forest fires. For. Sci. 2016, 62, 141–153. [Google Scholar] [CrossRef]
- Kolb, T.E.; Fettig, C.J.; Ayres, M.P.; Bentz, B.J.; Hicke, J.A.; Mathiasen, R.; Stewart, J.E.; Weed, A.S. Observed and anticipated impacts of drought on forest insects and diseases in the United States. For. Ecol. Manag. 2016, 380, 321–334. [Google Scholar] [CrossRef]
- Davidson, J. The relationship between temperature and rate of development of insects at constant temperatures. J. Anim. Ecol. 1944, 13, 26–38. [Google Scholar] [CrossRef]
- Bentz, B.J.; Logan, J.A.; Amman, G.D. Temperature-dependent development of the mountain pine-beetle (Coleoptera, Scolytidae) and simulation of its phenology. Can. Entomol. 1991, 123, 1083–1094. [Google Scholar] [CrossRef] [Green Version]
- Gilbert, N.; Raworth, D. Insects and temperature—A general theory. Can. Entomol. 1996, 128, 1–13. [Google Scholar] [CrossRef]
- Gillooly, J.F.; Charnov, E.L.; West, G.B.; Savage, V.M.; Brown, J.H. Effects of size and temperature on developmental time. Nature 2002, 417, 70–73. [Google Scholar] [CrossRef]
- Chown, S.L.; Nicolson, S.W. Insect Physiological Ecology. In Mechanisms and Patterns; Oxford University Press: Oxford, UK, 2004. [Google Scholar]
- Altermatt, F. Climatic warming increases voltinism in european butterflies and moths. Proc. R. Soc. B: Biol. Sci. 2010, 277, 1281–1287. [Google Scholar] [CrossRef] [Green Version]
- Wermelinger, B.; Rigling, A.; Mathis, D.S.; Kenis, M.; Gossner, M.M. Climate change effects on trophic interactions of bark beetles in inner alpine scots pine forests. Forests 2021, 12, 136. [Google Scholar] [CrossRef]
- Robbins, Z.J.; Xu, C.; Aukema, B.H.; Buotte, P.C.; Chitra-Tarak, R.; Fettig, C.J.; Goulden, M.L.; Goodsman, D.W.; Hall, A.D.; Koven, C.D. Warming increased bark beetle-induced tree mortality by 30% during an extreme drought in California. Glob. Chang. Biol. 2022, 28, 509–523. [Google Scholar] [CrossRef]
- Dale, V.H.; Joyce, L.A.; Mcnulty, S.; Neilson, R.P.; Ayres, M.P.; Flannigan, M.D.; Hanson, P.J.; Irland, L.C.; Lugo, A.E.; Peterson, C.J. Climate change and forest disturbances climate change can affect forests by altering the frequency, intensity, duration, and timing of fire, drought, introduced species, insect and pathogen outbreaks, hurricanes, windstorms, ice storms, or landslides. Bioscience 2001, 51, 723–734. [Google Scholar] [CrossRef] [Green Version]
- Lange, H.; Økland, B.; Krokene, P. Thresholds in the life cycle of the spruce bark beetle under climate change. Inter. J. Complex Syst. 2006, 1648, 1–10. [Google Scholar]
- Wermelinger, B.; Seifert, M. Analysis of the temperature dependent development of the spruce bark beetle Ips typographus (L.) (Col., Scolytidae). J. Appl. Entomol. 1998, 122, 185–191. [Google Scholar] [CrossRef]
- Ungerer, M.J.; Ayres, M.P.; Lombardero, M.J. Climate and the northern distribution limits of Dendroctonus frontalis Zimmermann (Coleoptera: Scolytidae). J. Biogeogr. 1999, 26, 1133–1145. [Google Scholar] [CrossRef] [Green Version]
- Bale, J.S.; Masters, G.J.; Hodkinson, I.D.; Awmack, C.; Bezemer, T.M.; Brown, V.K.; Butterfield, J.; Buse, A.; Coulson, J.C.; Farrar, J.; et al. Herbivory in global climate change research: Direct effects of rising temperature on insect herbivores. Glob. Chang. Biol. 2002, 8, 1–16. [Google Scholar] [CrossRef]
- Régnière, J.; Bentz, B.J. Modeling cold tolerance in the mountain pine beetle, Dendroctonus ponderosae. Insect Physiol. 2007, 53, 559–572. [Google Scholar] [CrossRef] [PubMed]
- Raffa, K.F.; Aukema, B.H.; Erbilgin, N.; Klepzig, K.D.; Wallin, K.F. Interactions among conifer terpenoids and bark beetles across multiple levels of scale: An attempt to understand links between population patterns and physiological processes. Recent Adv. Phytochem. 2005, 39, 80–118. [Google Scholar]
- Hebertson, E.G.; Jenkins, M.J. Climate factors associated with historic spruce beetle (Coleoptera: Curculionidae) outbreaks in Utah and Colorado. Environ. Entomol. 2008, 37, 281–292. [Google Scholar] [CrossRef] [PubMed]
- Negron, J.F.; Popp, J.B. The flight periodicity, attack patterns, and life history of D. confusus confusus Swaine Coleoptera: Curculionidae: Scolytinae), the western balsam bark beetle, in north central Colorado. West. N. Am. Natural. 2009, 69, 447–458. [Google Scholar] [CrossRef]
- Hart, S.J.; Veblen, T.T.; Mietkiewicz, N.; Kulakowski, D. Negative feedbacks on bark beetle outbreaks: Widespread and severe spruce beetle infestation restricts subsequent infestation. PLoS ONE 2015, 10, e0127975. [Google Scholar] [CrossRef] [Green Version]
- Lindner, M.; Maroschek, M.; Netherer, S.; Kremer, A.; Barbati, A.; Garcia-Gonzalo, J.; Seidl, R.; Delzon, S.; Corona, P.; Kolström, M.; et al. Climate change impacts, adaptive capacity, and vulnerability of European forest ecosystems. For. Ecol. Manag. 2010, 259, 698–709. [Google Scholar] [CrossRef]
- Kane, J.M.; Kolb, T.E. Importance of resin ducts in reducing ponderosa pine mortality from bark beetle attack. Oecologia 2010, 164, 601–609. [Google Scholar] [CrossRef] [PubMed]
- Williams, A.P.; Allen, C.D.; Millar, C.I.; Swetnam, T.W.; Michaelsen, J.; Still, C.J.; Leavitt, S.W. Forest responses to increasing aridity and warmth in the southwestern united states. Proc. Natl. Acad. Sci. USA 2010, 107, 21289–21294. [Google Scholar] [CrossRef] [PubMed] [Green Version]
- Raffa, K.F.; Smalley, E.B. Interaction of pre-attack and induced monoterpene concentrations in host conifer defense against bark beetle fungal complexes. Oecologia 1995, 102, 285–295. [Google Scholar] [CrossRef]
- Kichas, N.E.; Hood, S.M.; Pederson, G.T.; Everett, R.G.; McWethy, D.B. Whitebark pine (Pinus albicaulis) growth and defense in response to mountain pine beetle outbreaks. For. Ecol. Manag. 2020, 457, 117736. [Google Scholar] [CrossRef]
- Amman, G.D.; Cole, W.E. Mountain pine beetle dynamics in lodgepole pine forests. In Part II: Population Dynamics. USDA Forest Service General Technical Report GTR-INT-145; Intermountain Forest and Range Experiment Station: Ogden, UT, USA, 1983. [Google Scholar]
- Wermelinger, B. Ecology and management of the spruce bark beetle, Ips typographus—A review of recent research. For. Ecol. Manag. 2004, 202, 67–82. [Google Scholar] [CrossRef]
- Arias, M.; Robertson, L.; Garcia, A.; Arcos, S.C.; Escuer, M.; Sanz, R.; Mansilla, J.P. Bursaphelenchus fungivorus (Nematoda: Aphelenchida) associated with Orthotomicus erosus (Coleoptera: Scolitydae) in Spain. For. Pathol. 2010, 35, 375–383. [Google Scholar] [CrossRef]
- Sangüesa-Barreda, G.; Linares, J.C.; Camarero, J.J. Reduced growth sensitivity to climate in bark-beetle infested Aleppo pines: Connecting climatic and biotic drivers of forest dieback. For. Ecol. Manag. 2015, 357, 126–137. [Google Scholar] [CrossRef] [Green Version]
- Pernek, M.; Matošević, D.; Lacković, N.; Cota, E. When a native species behaves like invasive—Bark beetle Orthotomicus erosus in the Mediterranean pine forest in Croatia. In Proceedings of the 3rd Croatian Symposium on Invasive Species/Jelaska, Zagreb, Croatia, 26–27 November 2018. [Google Scholar]
- Raffa, K.F.; Aukema, B.H.; Bentz, B.J.; Carroll, A.L.; Hicke, J.A.; Turner, M.G.; Romme, W.H. Cross-scale drivers of natural disturbances prone to anthropogenic amplification: The dynamics of bark beetle eruptions. BioScience 2008, 58, 501–517. [Google Scholar] [CrossRef] [Green Version]
- Langstrom, B. Life cycles and shoot-feeding of pine shoot beetles. Studia For. Suec. 1983, 163, 1–29. [Google Scholar]
- Schroeder, L.M.; Lindelöw, Å. Attraction of scolytids and associated beetles by different absolute amounts and proportions of α-pinene and ethanol. J. Chem. Ecol. 1989, 15, 807–817. [Google Scholar] [CrossRef]
- Schroeder, L.M. Attraction of the bark beetle Tomicus piniperda to Scots pine trees in relation to tree vigor and attack density. Entomol. Exp. Appl. 2011, 44, 53–58. [Google Scholar] [CrossRef]
- Haack, R.A.; Kucera, D. New Introduction–Common Pine Shoot Beetle, Tomicus piniperda L.; Northeastern Area; Pest Alert NATP-05–93; U.S. Department Agricultural Forest Service (USDA): Washington, DC, USA, 1993. [Google Scholar]
- Haack, R.A.; Lawrence, R.K.; Heaton, G.C. Seasonal shoot-feeding by Tomicus piniperda (Coleoptera: Scolytidae) in Michigan. Great Lakes Entomol. 2000, 33, 1–8. [Google Scholar]
- Haack, R.A.; Lawrence, R.K.; Heaton, G.C. Tomicus piniperda (Coleoptera:Scolytidae) shoot-feeding characteristics and overwintering behavior in Scots pine christmas trees. J. Econ. Entomol. 2001, 94, 422–429. [Google Scholar] [CrossRef]
- Horn, A.; Kerdelhué, C.; Lieutier, F.; Rossi, J.P. Predicting the distribution of the two bark beetles Tomicus destruens and Tomicus piniperda in Europe and the Mediterranean region. Agric. For. Entomol. 2012, 14, 358–366. [Google Scholar] [CrossRef]
- Bakke, A. Ecological studies on bark beetles (Coleoptera: Scolytidae) associated with Scots Pine (Pinus sylvestris L.) in Norway with particular reference to the influence of temperature. Medd. Nor. Skogforsok 1968, 21, 443–602. [Google Scholar]
- Salonen, K. On the life-cycle, especially on the reproduction biology of Blastopbagus piniperda, L. (Col., Scolytidae). Acta For. Fenn. 1973, 127, 1–72. [Google Scholar]
- Langstrom, B. Wind-thrown Scots pines as brood material for Tomicus piniperda and T minor. Silva Fenn. 1984, 18, 187–198. [Google Scholar]
- Yu, L.F.; Huang, J.X.; Zong, S.X.; Huang, H.G.; Luo, Y.Q. Detect shoot-beetle damages of Yunnan Pine using Landsat time-series data. Forests 2018, 9, 39. [Google Scholar] [CrossRef] [Green Version]
- Yu, L.F.; Zhan, Z.Y.; Ren, L.L.; Liu, Y.J.; Huang, H.G.; Luo, Y.Q. Effects of stand and landscape level variables on shoot damage ratios caused by shoot beetles in Southwest China. For. Ecol. Manag. 2022, 507, 120030. [Google Scholar] [CrossRef]
- Saarenmaa, H. Within-tree population dynamics models for integrated management of Tomicus piniperda (coleoptera, scolytidae). Commun. Inst. For. Fenn. 1985, 118, 40. [Google Scholar]
- Galiano, L.; Martínez-Vilalta, J.; Lloret, F. Drought-Induced Multifactor Decline of Scots Pine in the Pyrenees and Potential Vegetation Change by the Expansion of Co-occurring Oak Species. Ecosystems 2010, 13, 978–991. [Google Scholar] [CrossRef]
- Li, L.S.; Wang, H.L.; Cai, X.S.; Yang, D.S. Study on Relationship between Damage of Tomicus piniperda and Its Environment. Yunnan For. Sci. Technol. 1997, 2, 11–16. [Google Scholar]
- Huai, K.Y.; Li, L.S.; Zhou, N.; Zhu, G.S. Study on Forecasting Occurring Time of Tomicus piniperda with the Phenological Phase of Pinus yunnanensis. Yunnan For. Sci. Technol. 1997, 2, 72–77. [Google Scholar]
- Guo, L.; Dai, J.; Ranjitkar, S.; Xu, J.; Luedeling, E. Response of chestnut phenology in China to climate variation and change. Agric. For. Meteorol. 2013, 180, 164–172. [Google Scholar] [CrossRef]
- Wold, S.; Albano, C.; Dunn, W.J.; Esbensen, K.; Johansson, E. Modelling data tables by principal components and pls: Class patterns and quantitative predictive relations. Analusis 1989, 12, 477–485. [Google Scholar]
- Wehrens, R.; Mevik, B.H. The pls package: Principal component and partial least squares regression in r. J. Stat. Softw. 2007, 18, 1–24. [Google Scholar]
- Chong, I.G.; Jun, C.H. Performance of some variable selection methods when multicollinearity is present. Chemom. Intell. Lab. Syst. 2005, 78, 103–112. [Google Scholar] [CrossRef]
- Luedeling, E.; Gassner, A. Partial least squares regression for analyzing walnut phenology in California. Agric. For. Meteorol. 2012, 158–159, 43–52. [Google Scholar] [CrossRef]
- R Core Team. R: A Language and Environment for Statistical Computing; R Foundation for Statistical Computing: Vienna, Austria, 2020. [Google Scholar]
- Kramer, D. Using Cellular Automata to Model Southern Pine Beetle Regional Patterns. Ph.D. Thesis, North Carolina State University, Raleigh, NC, USA, 1993. [Google Scholar]
- Gumpertz, M.L.; Wu, C.-t.; Pye, J.M. Logistic regression for southern pine beetle outbreaks with spatial and temporal autocorrelation. For. Sci. 2000, 46, 95–107. [Google Scholar]
- Duehl, A.J.; Koch, F.H.; Hain, F.P. Southern pine beetle regional outbreaks modeled on landscape, climate and infestation history. For. Ecol. Manag. 2011, 261, 473–479. [Google Scholar] [CrossRef]
- Breshears, D.D.; Cobb, N.S.; Rich, P.M.; Price, K.P.; Meyer, C.W. Regional vegetation die-off in response to global-change-type drought. Proc. Natl. Acad. Sci. USA 2005, 102, 15144–15148. [Google Scholar] [CrossRef] [PubMed] [Green Version]
- Preisler, H.K.; Hicke, J.A.; Ager, A.A.; Hayes, J.L. Climate and weather influences on spatial temporal patterns of mountain pine beetle populations in Washington and Oregon. Ecology 2012, 93, 2421–2434. [Google Scholar] [CrossRef]
- Seidl, R.; Müller, J.; Hothorn, T.; Bässler, C.; Heurich, M.; Kautz, M. Small beetle, large-scale drivers: How regional and landscape factors affect outbreaks of the European spruce bark beetle. J. Appl. Ecol. 2015, 53, 530–540. [Google Scholar] [CrossRef]
- Buotte, P.C.; Hickem, J.A.; Preisler, H.K.; Abatzoglou, J.T.; Raffa, K.F.; Logan, J.A. Climate influences on whitebark pine mortality from mountain pine beetle in the Greater Yellowstone Ecosystem. Ecol. Appl. 2016, 26, 2505–2522. [Google Scholar] [CrossRef] [PubMed]
- Gaylord, M.L.; Kolb, T.E.; Pockman, W.T.; Plaut, J.A.; Yepez, E.A.; Macalady, A.K.; Pangle, R.E.; McDowell, N.G. Drought predisposes pinon-juniper woodlands to insect attacks and mortality. New Phytol. 2013, 198, 567–578. [Google Scholar] [CrossRef] [PubMed]
- Gaylord, M.L.; Kolb, T.E.; Wallin, K.F.; Wagner, M.R. Seasonal dynamics of tree growth, physiology, and resin defenses in a Northern Arizona Ponderosa Pine Forest. Can. J. For. Res. 2007, 37, 1173–1183. [Google Scholar] [CrossRef]
- Sala, A.; Piper, F.; Hoch, G. Physiological mechanisms of drought-induced tree mortality are far from being resolved. New Phytol. 2010, 186, 274–281. [Google Scholar] [CrossRef]
- Ye, H.; Dang, C.L. Study on the feature of the bark beetle (Blastophagus piniperdal) injuring the pine (Pinus yunnanensis). J. Yunnan Univ. 1986, 8, 218–222. [Google Scholar]
- Lieutier, F.; Garcia, J.; Yart, A. Wound reactions of Scots pine (Pinus sylvestris L.) to attacks by Tomicus piniperda L. and Ips sexdentatus Boern. (Col., Scolytidae). J. Appl. Ent. 1995, 9, 591–600. [Google Scholar] [CrossRef]
- Cao, Y.X.; Zhang, Z.; Liu, S.C.; Li, L.Z.; Li, D.M. Advances in the research on the resistance of conifer resin to pests. Chin. Bull. Entomol. 2007, 44, 804–810. [Google Scholar]
- Schroeder, L.M.; Eidmann, H.H. Gallery initiation by Tomicus piniperda (Coleoptera: Scolytidae) on scots pine trees baited with host volatiles. J. Chem. Ecol. 1987, 13, 1591–1599. [Google Scholar] [CrossRef]
- Yin, H.F.; Huang, F.S.; Li, Z.L. Economic Entomology of China (Volume 29): Coleoptera (Coleoptera); Science Press: Beijing, China, 1984. [Google Scholar]
- Wu, X.B. Analysis of Climate Factors Influencing the Outbreak of Tomicus minor Hartig in Ninghua County, Fujian Province. J. Green Sci. Technol. 2012, 7, 55–57. [Google Scholar]
- Li, Y. Causes of Tomicus piniperda, L. Disaster in Yuxi of Yunnan Province and Countermeasures of Prevention and Control. For. Resour. Manag. 2013, 3, 40–42. [Google Scholar]
- Su, J.J. Forests Response to Drought over the Yunnan-Guizhou Plateau; Lanzhou University: Lanzhou, China, 2021. [Google Scholar]
- Lévesque, M.; Rigling, A.; Bugmann, H.; Weber, P.; Brang, P. Growth response of five co-occurring conifers to drought across a wide climatic gradient in central Europe. Agric. For. Meteorol. 2014, 197, 1–12. [Google Scholar] [CrossRef]
- Chen, Y. Drought Study in the Central and Western Yunnan by Tree-Ring Proxies; Lanzhou University: Lanzhou, China, 2017. [Google Scholar]
- Yang, R.Q.; Fan, Z.X.; Li, Z.S.; Wen, Q.Z. Radial growth of Pinus yunnanensis at different elevations and their responses to climatic factors in the Yulong Snow Mountain, Northwest Yunnan, China. Acta Ecol. Sin. 2018, 38, 8983–8991. [Google Scholar]
- Wang, S.J.; Chen, Y.P.; Chen, F.; Zhang, H.L. Responses of radial growth of Pinus yunnanensis to climatic and hydrological factors at different altitudes in Western Yunnan, China. Chin. J. Appl. Ecol. 2021, 32, 3557–3566. [Google Scholar]
- Liu, H.P.; Jiang, Z.L.; Li, L.S.; Zhao, X.G.; Liang, X.Y.; Ma, S.Z.; Jiang, Y.H. Study on Forecasting the Occurring Quantity of Adults of Tomicus piniperda. Yunnan For. Sci. Technol. 1997, 2, 60–69. [Google Scholar]
- Ye, H. The influence of temperature and light on the taking-off of Tomicus piniperda. Entomol. Knowl. 2000, 37, 342–344. [Google Scholar]
- Liu, H.; Zhang, Z.; Ye, H.; Wang, H.; Clarke, S.R.; Lu, J. Response of Tomicus yunnanensis (Coleoptera: Scolytinae) to infested and uninfested Pinus yunnanensis bolts. J. Econ. Entomol. 2010, 103, 95–100. [Google Scholar] [CrossRef]
- Lü, J.; Hu, S.J.; Ma, X.Y.; Chen, J.M.; Li, Q.Q.; Ye, H. Origin and expansion of the yunnan shoot borer, Tomicus yunnanensis (Coleoptera: Scolytinae): A mixture of historical natural expansion and contemporary human-mediated relocation. PLoS ONE 2014, 9, e111940. [Google Scholar] [CrossRef] [Green Version]
- Gokturk, A. Use of pheromone traps against Tomicus piniperda and Tomicus minor in the Kazbegi National Park, Georgian Republic. Afr. J. Agr. Res. 2011, 6, 2430–2435. [Google Scholar]
- Chen, P.; Zhou, N.; Zhao, T.; Hu, G.H.; Feng, Z.W.; Li, L.S. Relationship between Stand Status of Pinus yunnanensis and Damage of Tomicus piniperda. J. Northeast. For. Univ. 2004, 32, 13–15. [Google Scholar]
- Wang, H.L.; Chen, S.W.; Wu, Y.; Pu, M.G. Preliminary studies on the bionomics and management of the pine bark beetle (Blastophagus piniperdal L.) in Kunming district, China. J. Southwest For. Coll. 1987, 2, 33–42. [Google Scholar]
- Li, L.S.; Liu, H.P.; Zhou, N.J.; Zhao, L.; Huai, K.Y.; Lang, N.J.; Wang, H.L.; Wang, H.Q. Study on the Forecasting Method for Tomicus piniperda. Yunnan For. Sci. Technol. 1997, 2, 44–56. [Google Scholar]
- Liu, H.P.; Jiang, Z.L.; Zhao, X.G.; Liang, X.Y.; Ma, S.Z.; Jiang, Y.H. Study on Forecasting the Flying Period of Adults of Tomicus piniperda. Yunnan For. Sci. Technol. 1997, 2, 70–74. [Google Scholar]
- Zhu, Z.H. Present Condition of Population Ecological Study on Tomicus piniperda of Pinus yunnanensis. Yunnan For. Sci. Technol. 2003, 1, 52–55. [Google Scholar]
- Anderbrant, O. Reemergence and second brood in the bark beetle Ips typographus. Holarct. Ecol. 1989, 12, 494–500. [Google Scholar] [CrossRef]
Figure 1.
(a) Yunnan province in China; (b) Landsat image of Xiangyun County; and (c) Yunnan pine forests in the study area. (d) Distribution of the 40 field plots in the study area.
Figure 1.
(a) Yunnan province in China; (b) Landsat image of Xiangyun County; and (c) Yunnan pine forests in the study area. (d) Distribution of the 40 field plots in the study area.

Figure 2.
Flowchart of the variable selection processes and the development of a prediction model.

Figure 3.
Reflectance values of the non-healthy pine and healthy pine based on the Landsat image.

Figure 4.
Comparison between reference (i.e., from field plots) and Landsat-predicted percent shoot damage ratios within 30-m grid cells using linear regression models. Solid line is the regression line; gray dashed line is the 1:1 line; RMSE, root mean square error. SDR: shoot damage ratio.
Figure 4.
Comparison between reference (i.e., from field plots) and Landsat-predicted percent shoot damage ratios within 30-m grid cells using linear regression models. Solid line is the regression line; gray dashed line is the 1:1 line; RMSE, root mean square error. SDR: shoot damage ratio.
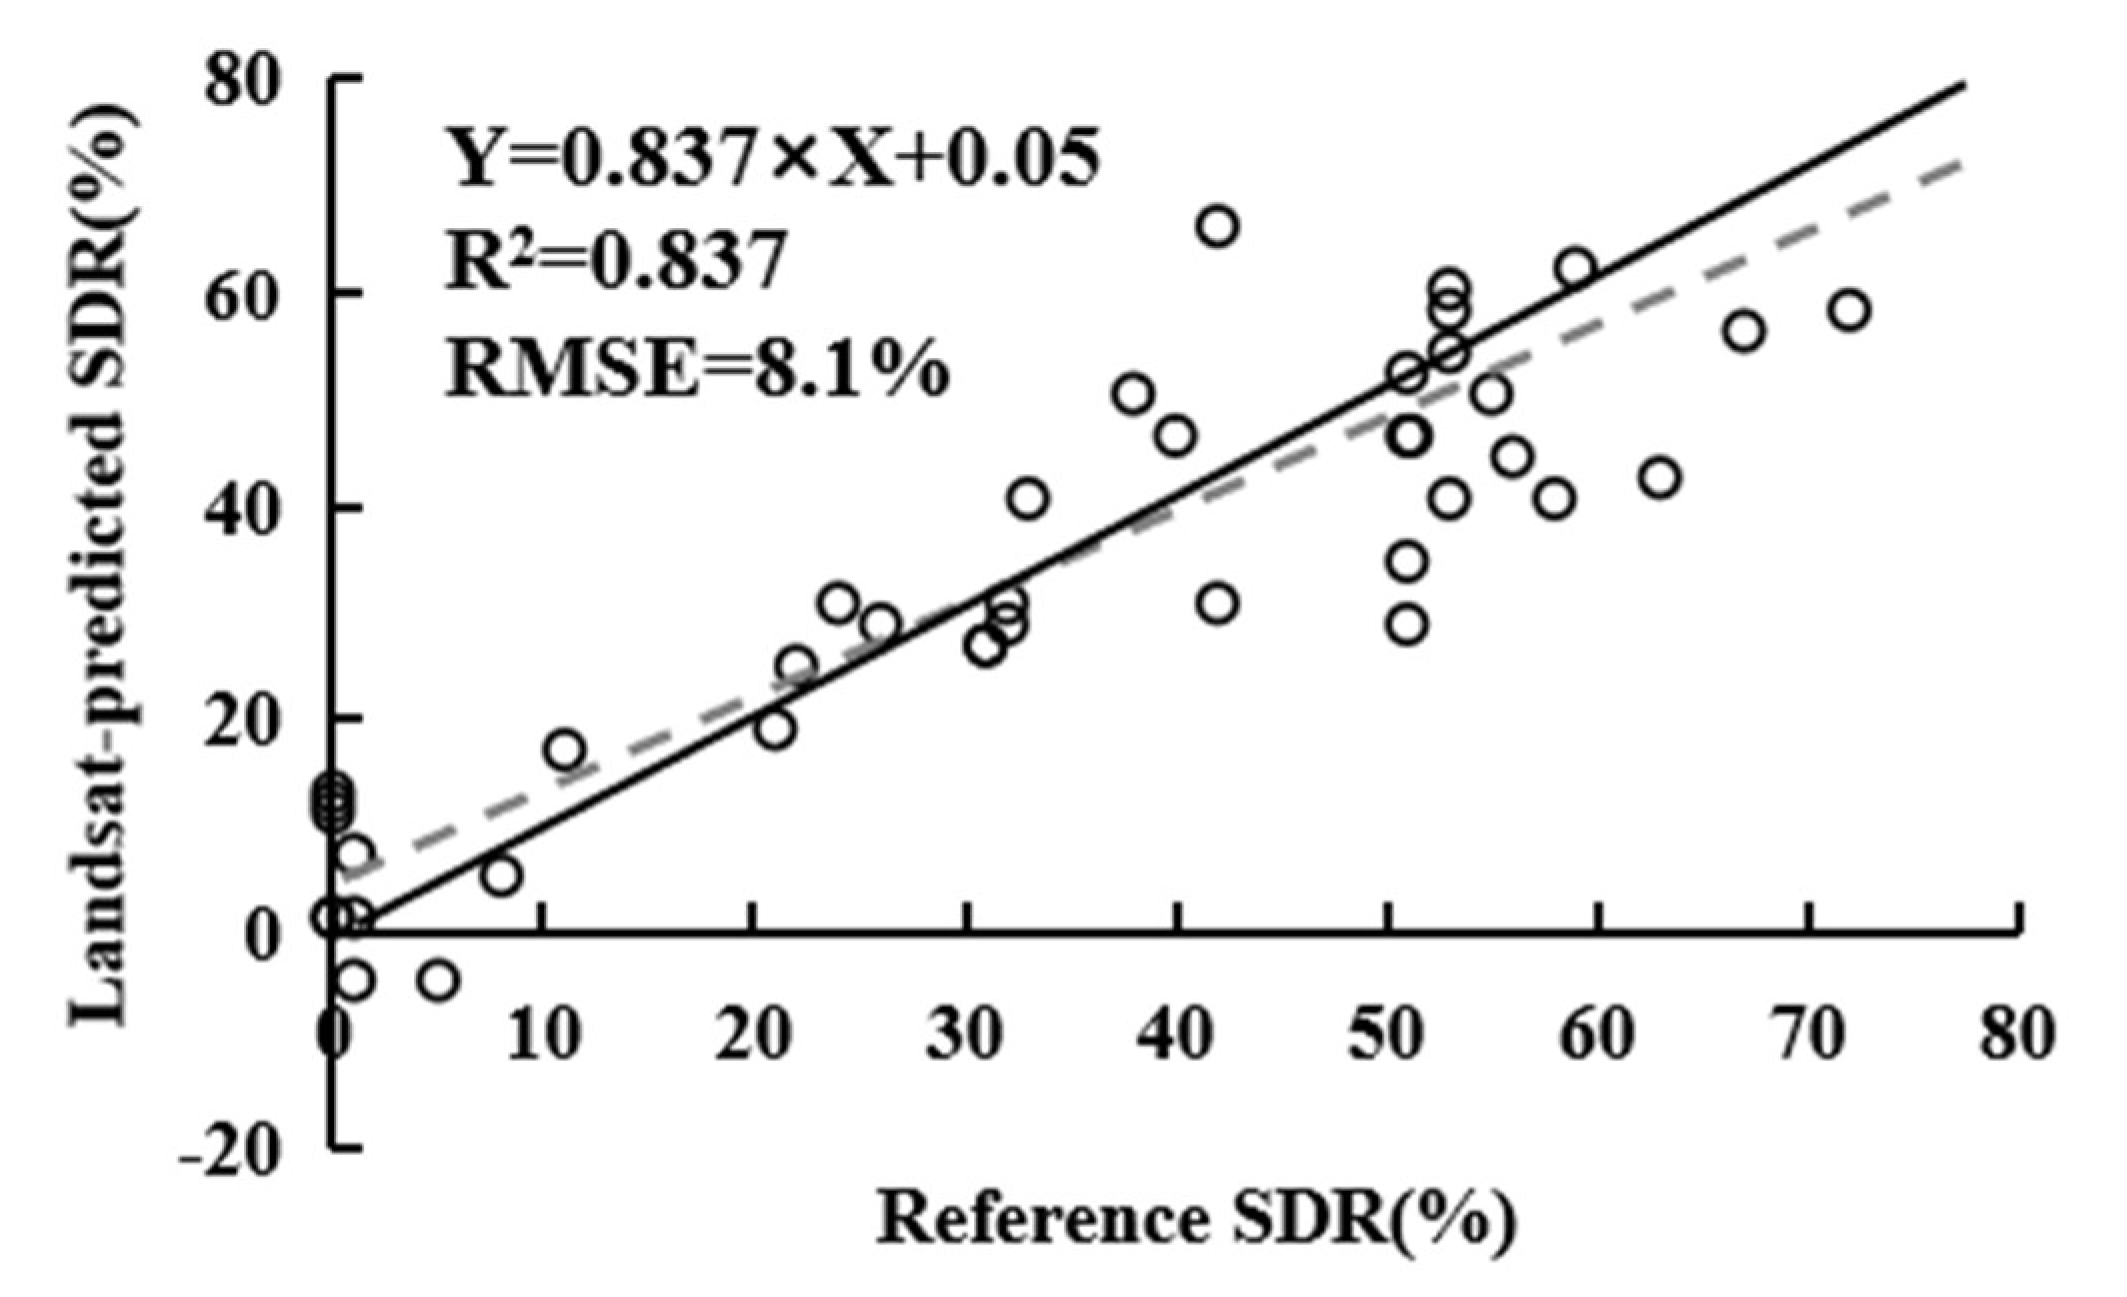
Figure 5.
Time series of Yunnan pine forests with different shoot damage ratios in the study area from 2000 to 2017.
Figure 5.
Time series of Yunnan pine forests with different shoot damage ratios in the study area from 2000 to 2017.

Figure 6.
Comparison of the predicted area (left) and observed area (right) of beetle infestation in 2010.
Figure 6.
Comparison of the predicted area (left) and observed area (right) of beetle infestation in 2010.
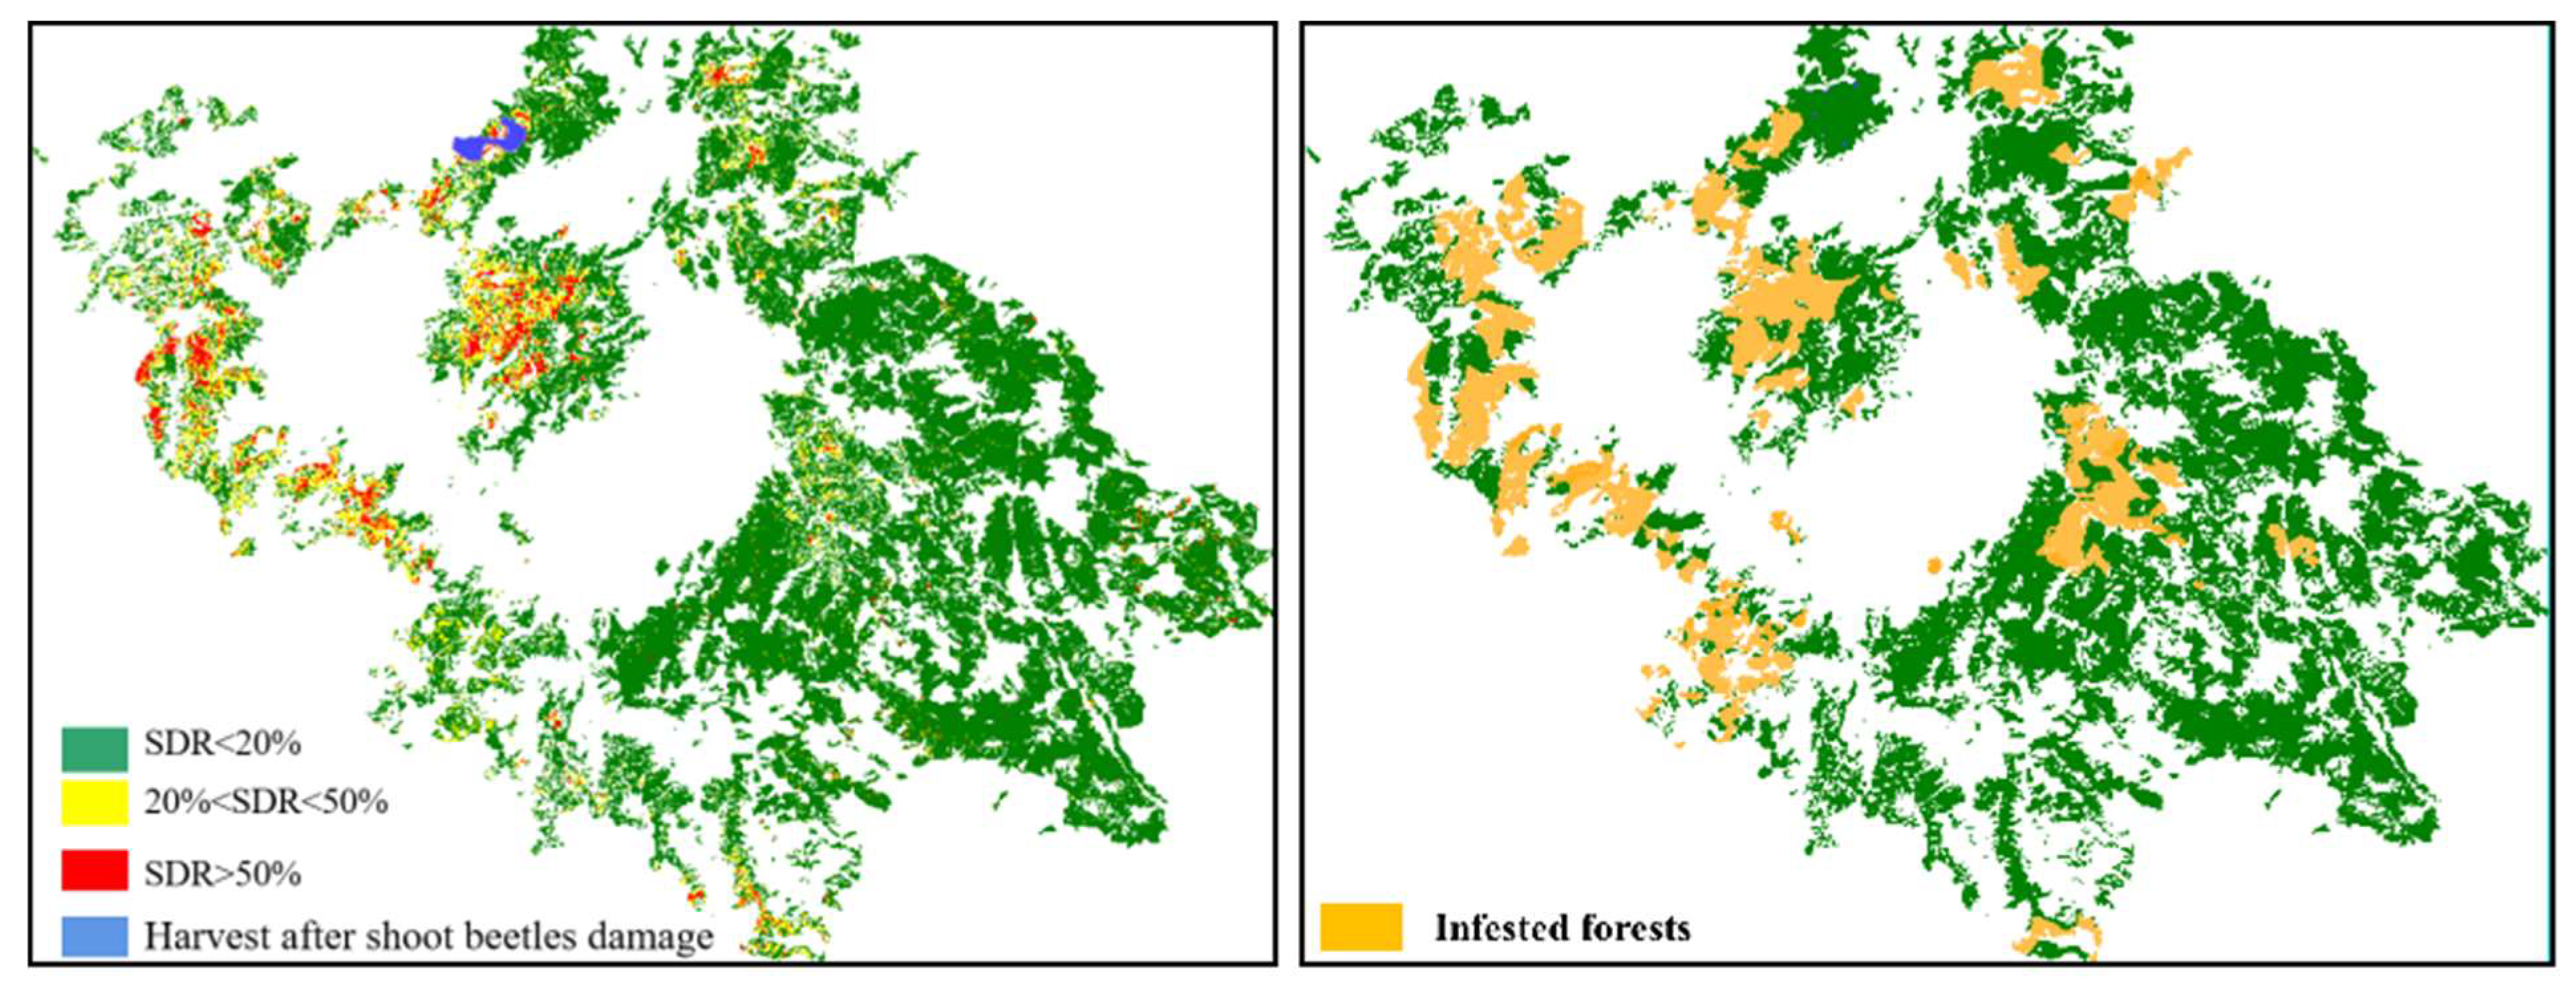
Figure 7.
Temporal changes of infested area and climate variables anomalies (differences from mean values calculated from 1971 to 2000) from 2000 to 2017. (A): Beetle-infested total area; (B): Pspring (Cumulative precipitation between March to May) anomaly; (C): Psummer (Cumulative precipitation between June to August) anomaly; (D): P0 (Cumulative precipitation in the current year (0)) anomaly; (E): P123 (Cumulative precipitation in previous 1–3 years) anomaly; (F): MSMay (Mean solar radiation duration in May) anomaly; (G): Sspring (Cumulative solar radiation duration between March to May) anomaly; (H): Smean (Annual cumulative solar radiation duration) anomaly; (I): MTMay (Mean temperature in May); MTJune (Mean temperature in June) anomaly; (J): Tspring (Mean temperature between March to May) anomaly; (K): Tsummer (Mean temperature between June to August) anomaly; and (L): Tmean (Annual mean temperature) anomaly.
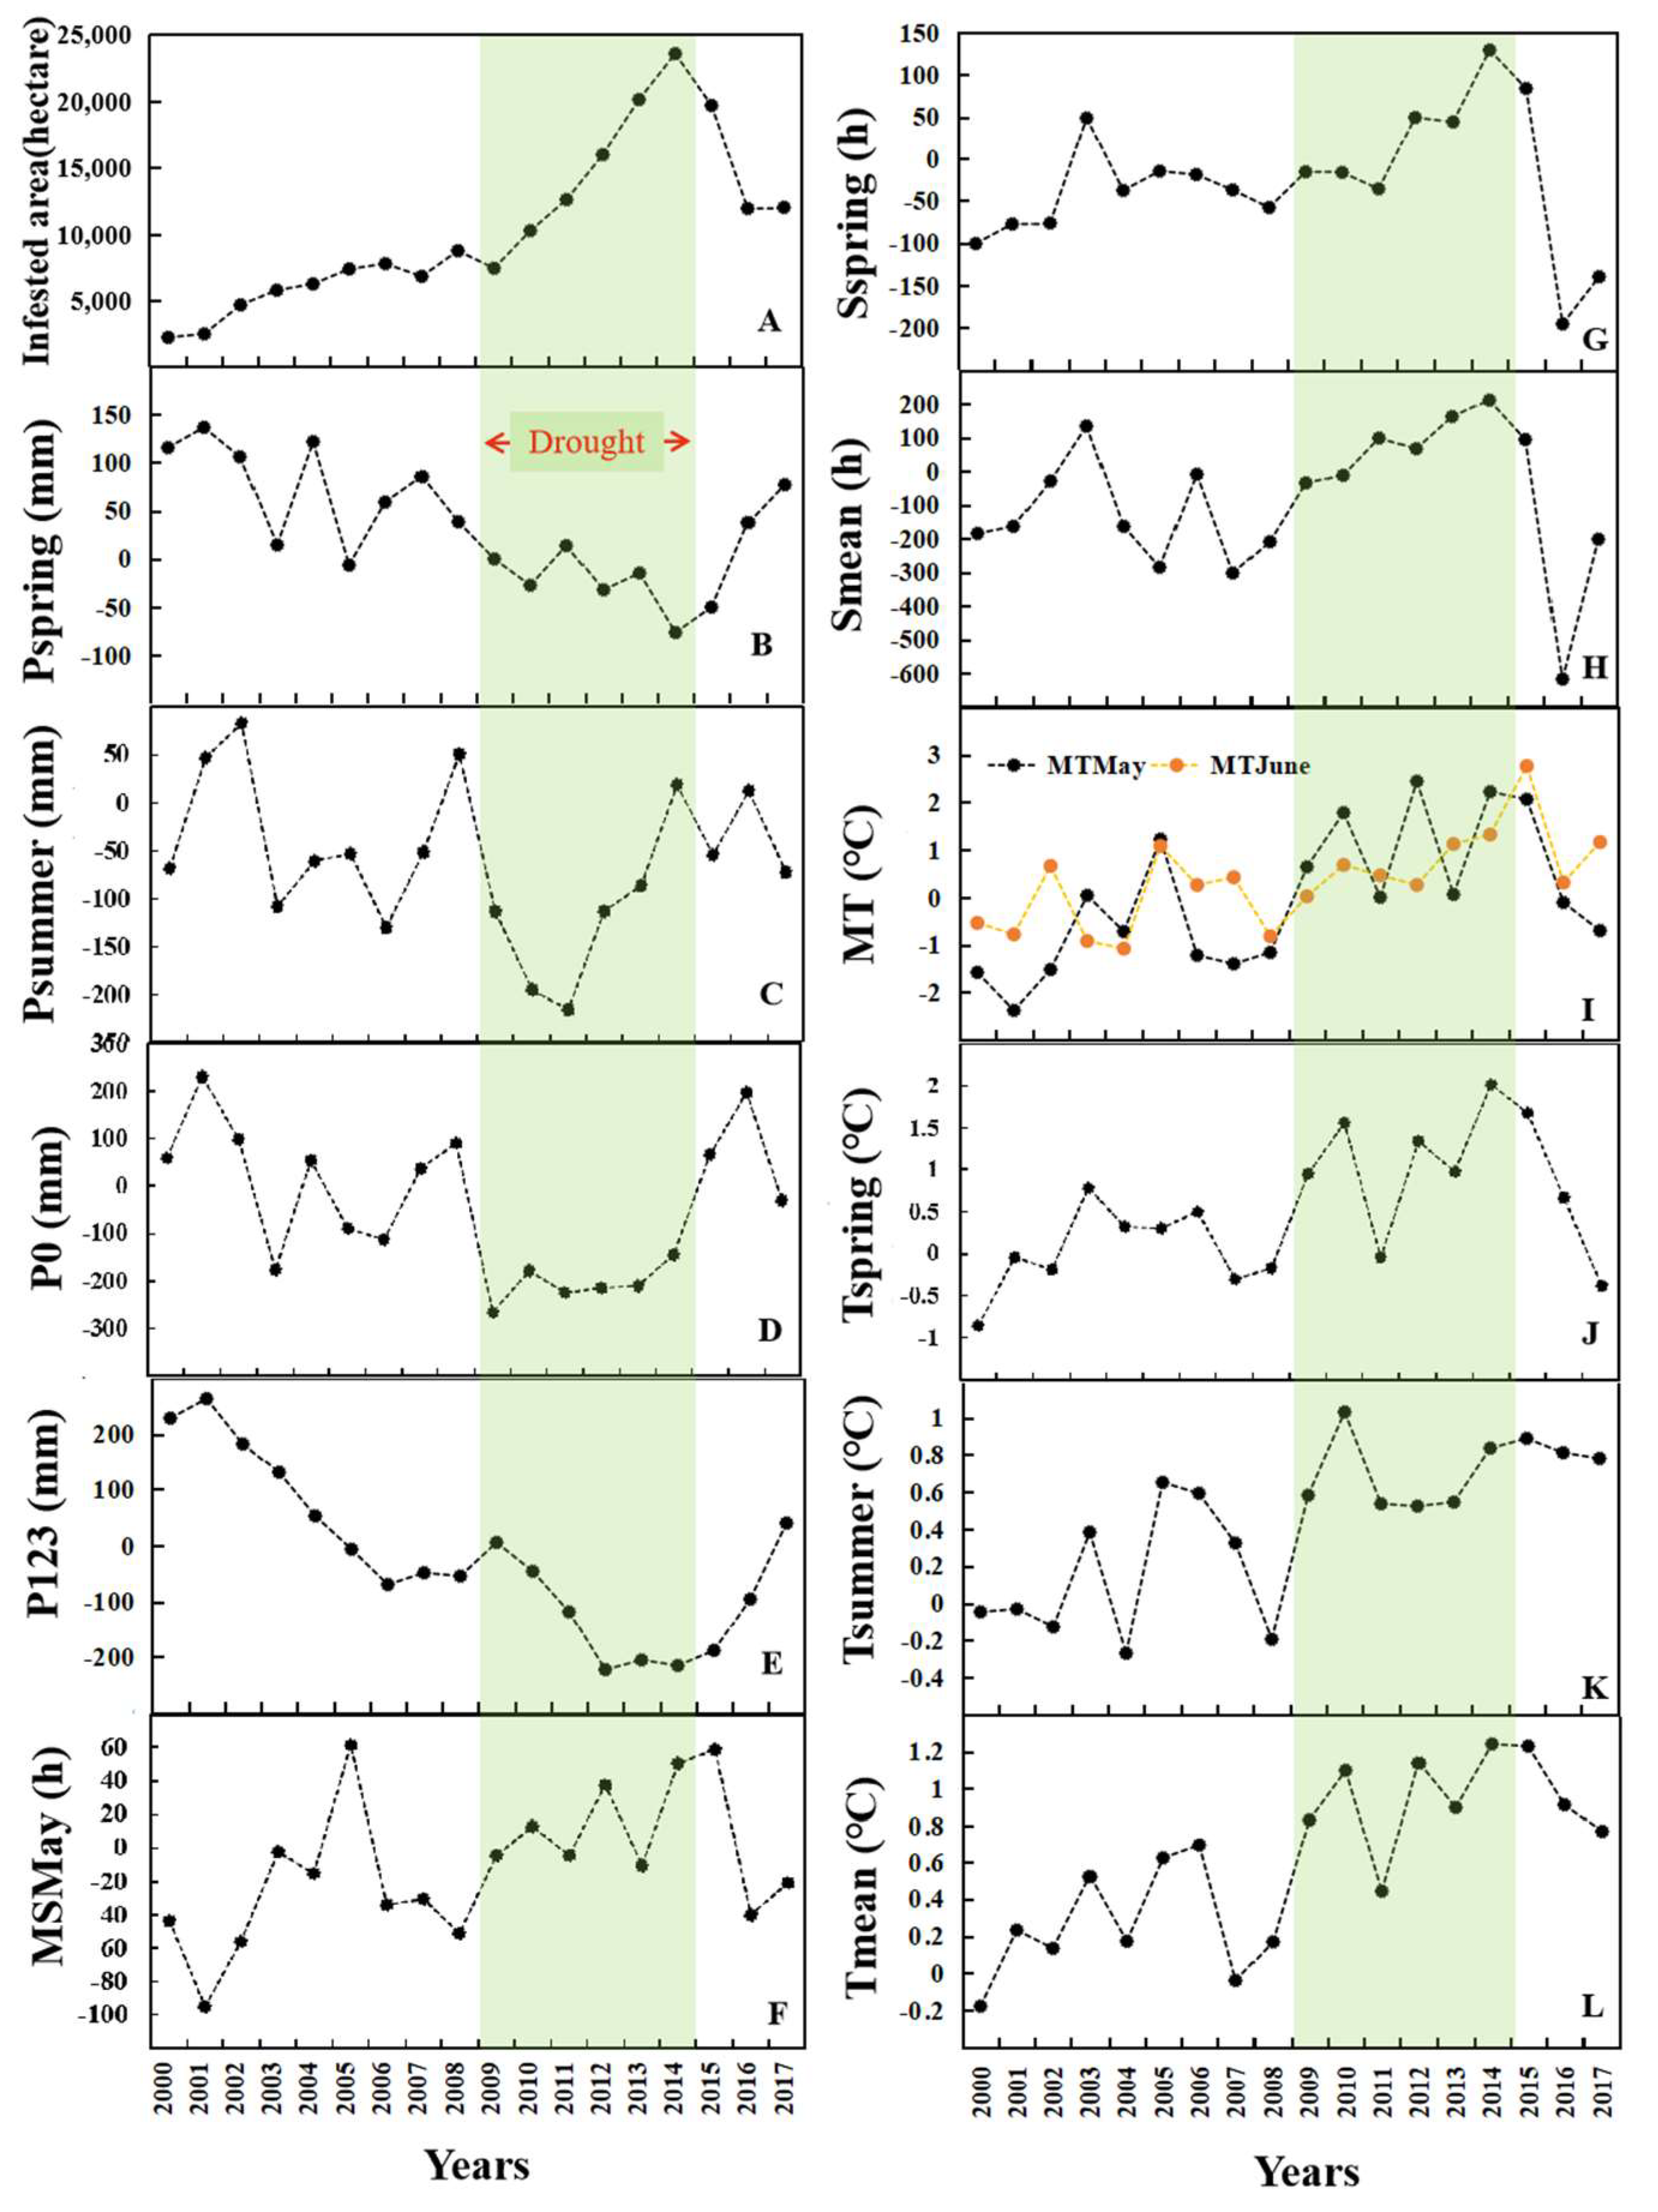
Figure 8.
Results of the partial least squares regression analysis. Blue bars (figure above) indicate that the variable importance projection (VIP) score exceeds the 1 threshold. Yellow bars (figure below) indicate positive (and important) model coefficients, whereas red bars indicate negative (and important) model coefficients, and gray bars indicate unimportant model coefficients.
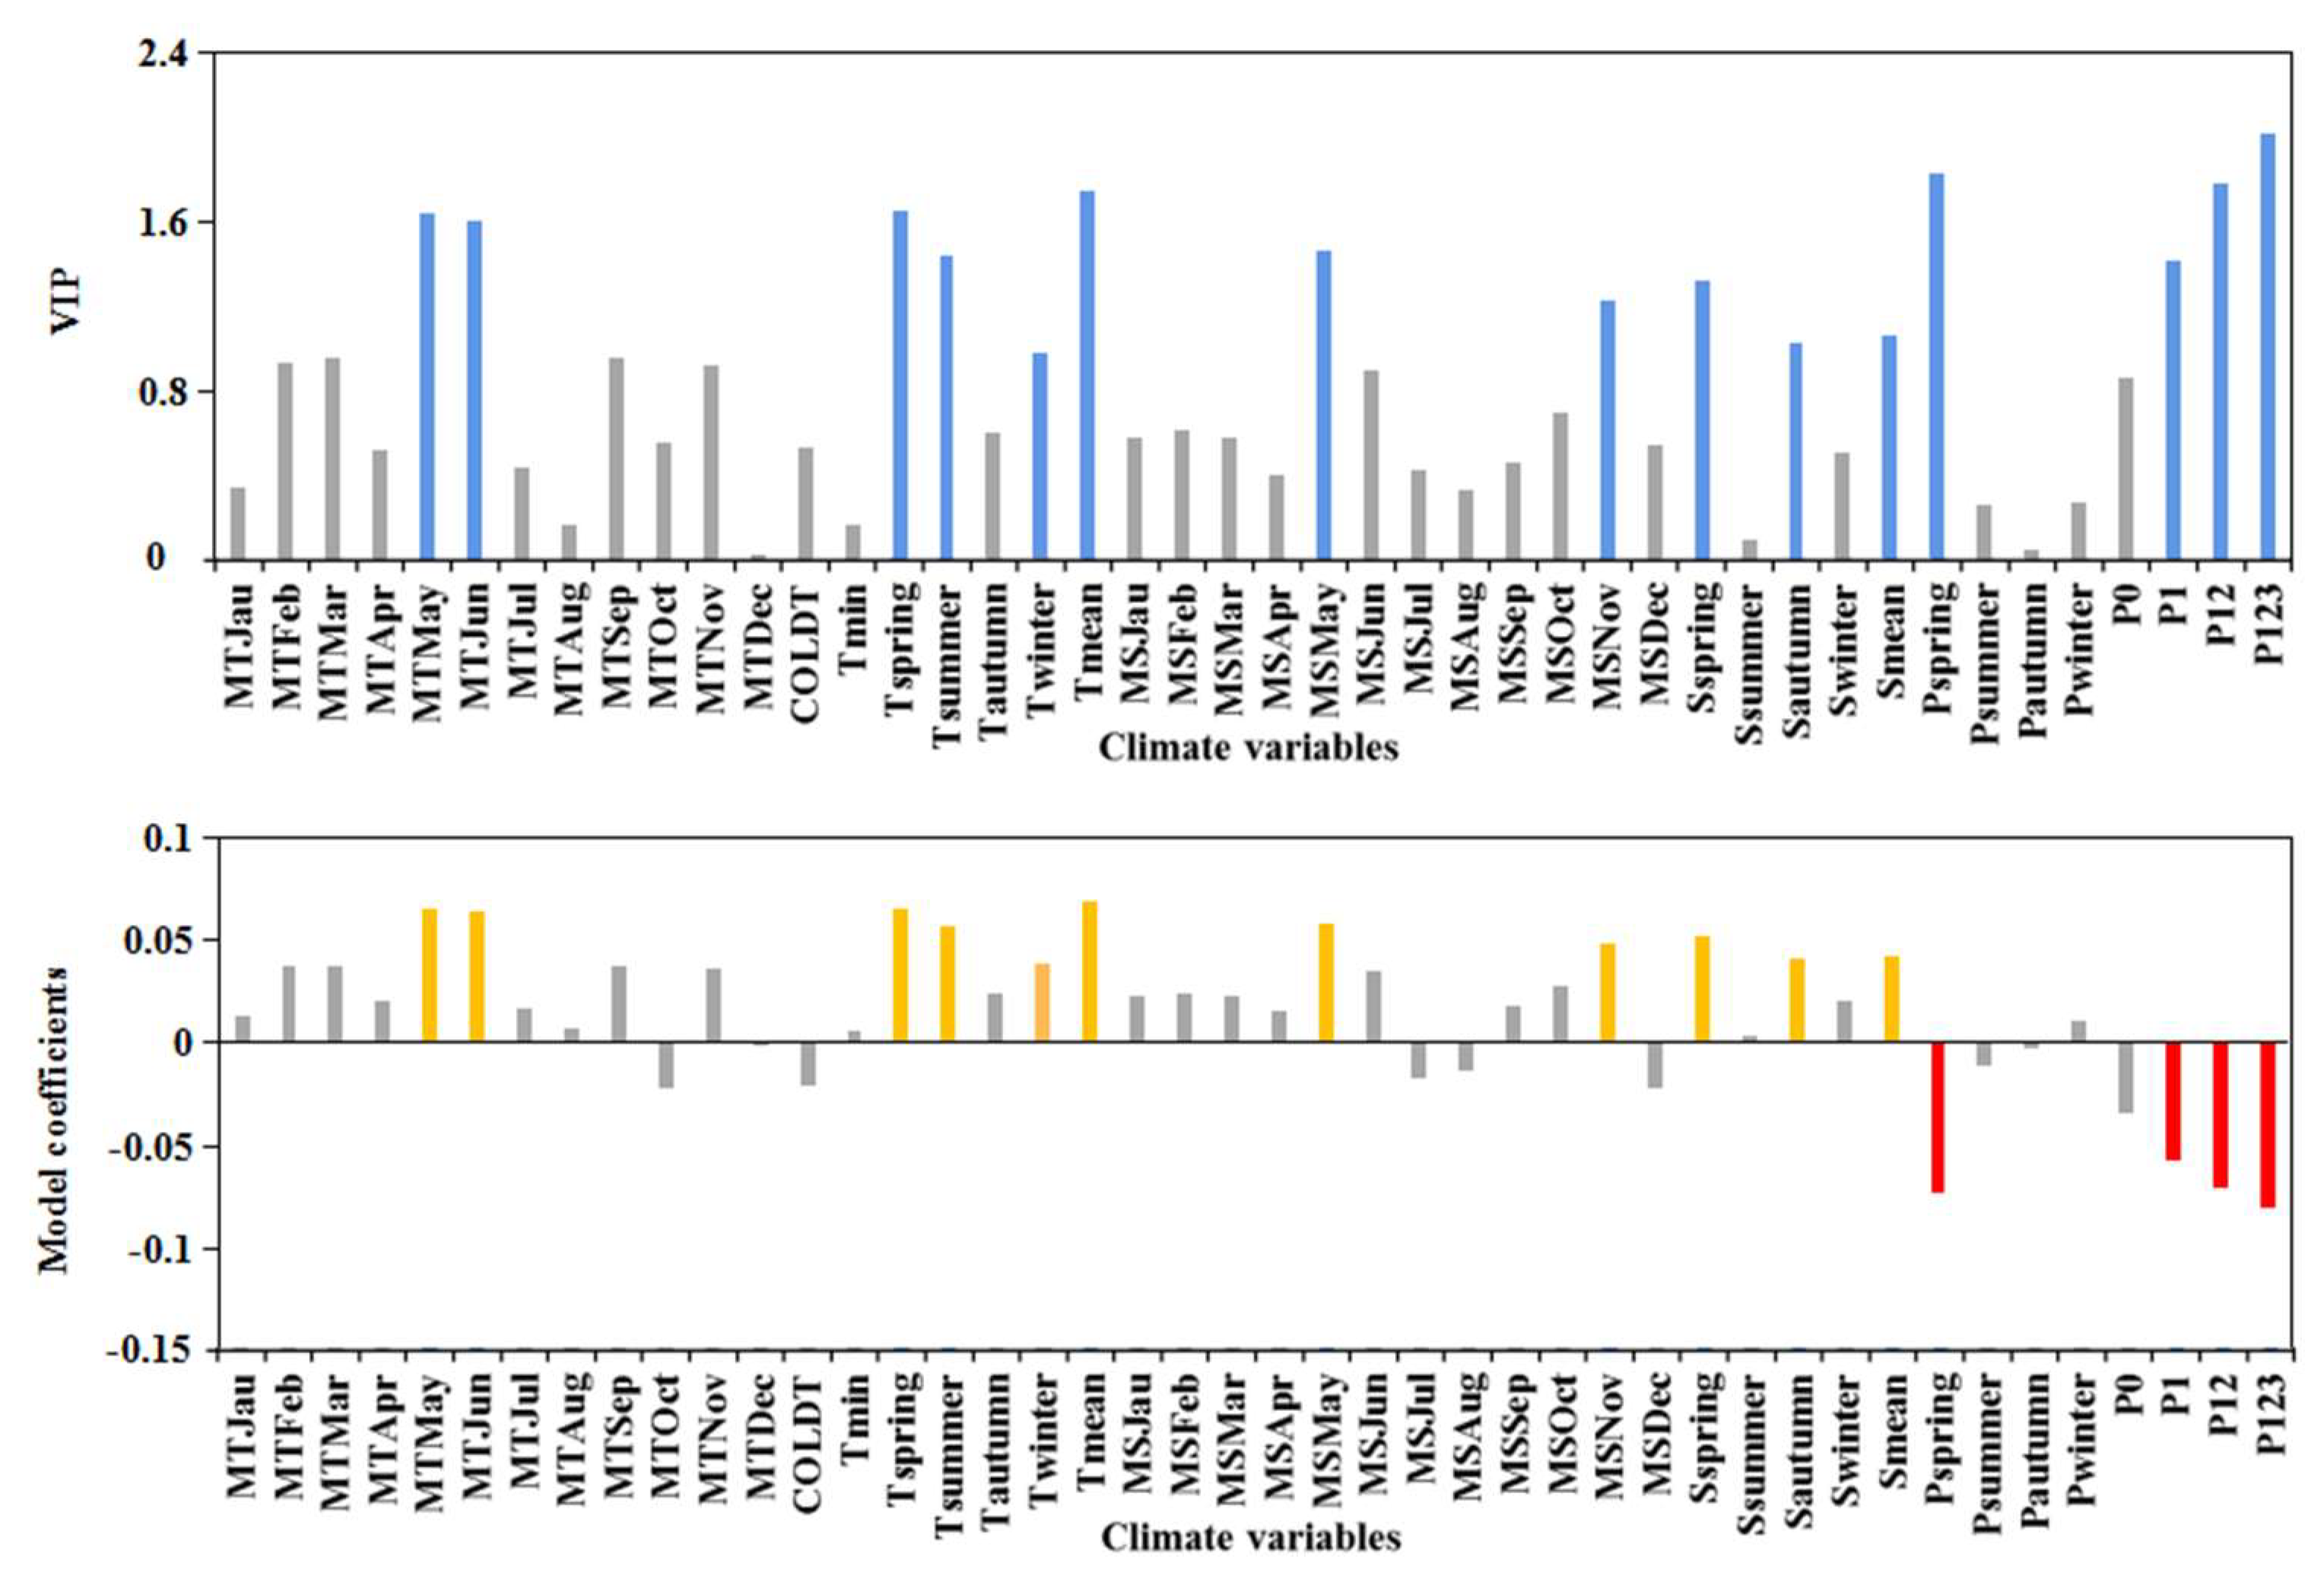
Figure 9.
Comparison between the measured and predicted beetle-infested total area using linear regression models. Dashed line is the regression line; RMSE, root mean square error.
Figure 9.
Comparison between the measured and predicted beetle-infested total area using linear regression models. Dashed line is the regression line; RMSE, root mean square error.

Figure 10.
Influence of important climate variables on pine shoot beetle outbreak; The life cycle of Tomicus spp. Red indicates the trunk damage period, and blue indicates the shoot damage period.
Figure 10.
Influence of important climate variables on pine shoot beetle outbreak; The life cycle of Tomicus spp. Red indicates the trunk damage period, and blue indicates the shoot damage period.

Table 1.
Landsat TM, ETM+, OLI images used in time series analysis.
| Year | Month/Day | Julian Day of Year | Sensor | Cloud Cover | |
|---|---|---|---|---|---|
| 1 | 2000 | November/16 | 321 | ETM+ | 6% |
| 2 | 2001 | December/05 | 339 | ETM+ | 1% |
| 3 | 2002 | December/24 | 358 | ETM+ | 0% |
| 4 | 2003 | November/17 | 321 | TM5 | 0% |
| 5 | 2004 | November/11 | 316 | ETM+ | 0% |
| 6 | 2005 | November/6 | 310 | TM5 | 0% |
| 7 | 2006 | November/17 | 321 | ETM+ | 0% |
| 8 | 2007 | November/20 | 324 | ETM+ | 0% |
| 9 | 2008 | November/14 | 319 | TM5 | 3% |
| 10 | 2009 | November/09 | 313 | ETM+ | 0% |
| 11 | 2010 | December/14 | 348 | ETM+ | 4% |
| 12 | 2011 | November/15 | 319 | ETM+ | 14% |
| 13 | 2012 | November/01 | 306 | ETM+ | 13% |
| 14 | 2013 | November/12 | 316 | OLI | 1.65% |
| 15 | 2014 | November/23 | 327 | ETM+ | 3% |
| 16 | 2015 | December/12 | 346 | ETM+ | 12% |
| 17 | 2016 | November/20 | 325 | OLI | 0% |
| 18 | 2017 | November/15 | 319 | ETM+ | 4% |
Table 2.
Description of the explanatory variables used in the PLS model of the probability of pine shoot beetle infestation of forests in Southwest China from 2000 to 2017.
Table 2.
Description of the explanatory variables used in the PLS model of the probability of pine shoot beetle infestation of forests in Southwest China from 2000 to 2017.
| Climate Variables | Description | |
|---|---|---|
| Precipitation | Pspring | Cumulative precipitation between March to May. |
| Psummer | Cumulative precipitation between June to August. | |
| Pautumn | Cumulative precipitation between September to November. | |
| Pwinter | Cumulative precipitation between December to February. | |
| P0 | Cumulative precipitation in the current year (0). | |
| P1 | Cumulative precipitation in the previous year (1). | |
| P12 | Cumulative precipitation in previous 1–2 years. | |
| P123 | Cumulative precipitation in previous 1–3 years. | |
| Temperature | MT | Monthly mean temperature. |
| Tspring | Mean temperature between March to May. | |
| Tsummer | Mean temperature between June to August. | |
| Tautumn | Mean temperature between September to November. | |
| Twinter | Mean temperature between December to February. | |
| Tmin | The minimum temperature of the coldest month. | |
| Coldt | The minimum daily temperature of the coldest month. | |
| Tmean | Annual mean temperature. | |
| Solar radiation duration | MS | Monthly solar radiation duration. |
| Sspring | Cumulative solar radiation duration between March to May. | |
| Ssummer | Cumulative solar radiation duration between June to August. | |
| Sautumn | Cumulative solar radiation duration between September to November. | |
| Swinter | Cumulative solar radiation duration between December to February. | |
| Smean | Annual cumulative solar radiation duration. | |
Table 3.
Coefficients (SE) of important climate variables based on the PLS models.
| Estimate | SE | t.Value | Pr (>|t|) | Sig | |
|---|---|---|---|---|---|
| MTMay | 0.084 | 0.015 | 5.602 | 3.1 × 10−05 | *** |
| MTJune | 0.083 | 0.026 | 3.216 | 5.1 × 10−03 | ** |
| Tspring | 0.085 | 0.021 | 4.083 | 7.7 × 10−04 | *** |
| Tsummer | 0.074 | 0.013 | 5.753 | 2.3 × 10−05 | *** |
| Twinter | 0.048 | 0.029 | 1.668 | 1.1 × 10−01 | |
| Tmean | 0.085 | 0.012 | 7.138 | 1.6 × 10−06 | *** |
| MSMay | 0.075 | 0.020 | 3.762 | 1.5 × 10−03 | *** |
| MSNov | 0.063 | 0.022 | 2.822 | 1.2 × 10−02 | * |
| Sspring | 0.068 | 0.026 | 2.590 | 1.9 × 10−02 | * |
| Sautumn | 0.053 | 0.028 | 1.873 | 7.8 × 10−02 | |
| Smean | 0.054 | 0.022 | 2.444 | 2.5 × 10−02 | * |
| Pspring | −0.094 | 0.016 | −5.827 | 2.0 × 10−05 | *** |
| P1 | −0.073 | 0.018 | −3.961 | 1.0 × 10−03 | ** |
| P12 | −0.091 | 0.019 | −4.931 | 1.2 × 10−04 | *** |
| P123 | −0.103 | 0.015 | −7.106 | 1.7 × 10−06 | *** |
Note *: Significant; **: Very significant; ***: Extremely significant.
Publisher’s Note: MDPI stays neutral with regard to jurisdictional claims in published maps and institutional affiliations. |
© 2022 by the authors. Licensee MDPI, Basel, Switzerland. This article is an open access article distributed under the terms and conditions of the Creative Commons Attribution (CC BY) license (https://creativecommons.org/licenses/by/4.0/).
Share and Cite
MDPI and ACS Style
Yu, L.; Zhan, Z.; Zhou, Q.; Gao, B.; Ren, L.; Huang, H.; Luo, Y. Climate Drivers of Pine Shoot Beetle Outbreak Dynamics in Southwest China. Remote Sens. 2022, 14, 2728. https://doi.org/10.3390/rs14122728
AMA Style
Yu L, Zhan Z, Zhou Q, Gao B, Ren L, Huang H, Luo Y. Climate Drivers of Pine Shoot Beetle Outbreak Dynamics in Southwest China. Remote Sensing. 2022; 14(12):2728. https://doi.org/10.3390/rs14122728
Chicago/Turabian StyleYu, Linfeng, Zhongyi Zhan, Quan Zhou, Bingtao Gao, Lili Ren, Huaguo Huang, and Youqing Luo. 2022. "Climate Drivers of Pine Shoot Beetle Outbreak Dynamics in Southwest China" Remote Sensing 14, no. 12: 2728. https://doi.org/10.3390/rs14122728
Note that from the first issue of 2016, this journal uses article numbers instead of page numbers. See further details here.