
Design and Experimental Evaluation of an Aerial Solution for Visual Inspection of Tunnel-like Infrastructures


Robotics and Automation Department, EURECAT, Centre Tecnològic de Catalunya, 08290 Cerdanyola del Valles, Spain
*
Author to whom correspondence should be addressed.
Remote Sens. 2022, 14(1), 195; https://doi.org/10.3390/rs14010195
Submission received: 1 December 2021
/
Revised: 28 December 2021
/
Accepted: 29 December 2021
/
Published: 2 January 2022
(This article belongs to the Special Issue Robotics and AI for Infrastructure Inspection and Monitoring)
Abstract
:Current railway tunnel inspections rely on expert operators performing a visual examination of the entire infrastructure and manually annotating encountered defects. Automatizing the inspection and maintenance task of such critical and aging infrastructures has the potential to decrease the associated costs and risks. Contributing to this aim, the present work describes an aerial robotic solution designed to perform autonomous inspections of tunnel-like infrastructures. The proposed robotic system is equipped with visual and thermal sensors and uses an inspection-driven path planning algorithm to generate a path that maximizes the quality of the gathered data in terms of photogrammetry goals while optimizing the surface coverage and the total trajectory length. The performance of the planning algorithm is demonstrated in simulation against state-of-the-art methods and a wall-following inspection trajectory. Results of a real inspection test conducted in a railway tunnel are also presented, validating the whole system operation.
1. Introduction
The aging of the existing infrastructure [1] and the increasing necessity of building new ones have set a lower limit, around 3.9%, of the GDP corresponding to EU member states for financing infrastructure-related activities [2]. Furthermore, current predictions point to a 1.2 trillion EUR annual investment being required at least up to 2030 to support the risky labor of inspection and maintenance [3].
In the last decade, multiple robotic solutions that aim to facilitate inspection and maintenance procedures have emerged [4,5,6,7]. This growing interest is fueled by the potential of maintaining the same performance of traditional methods while increasing the time and cost-efficiency of the operation and mitigating the risks. Different types of robots, such as crawlers [8], flying vehicles [9,10,11], ground robots or underwater vehicles [12], are being put forward by the research community and commercialized by several companies (e.g., Hovering Solutions (Madrid, Spain), Flyability (Lausanne, Switzerland), Kespry (Menlo Park, CA, USA), Eddyfi Technologies (Quebec, Canada)) with the objective of fulfilling the operational needs that the infrastructure maintainers have.
Focusing on tunnel-like infrastructures, the particularities of their grounds that are usually uneven, potentially wet and, as in the case of railway tunnels, contain tracks and other obstacles, limit the number of solutions that consider ground robots for the inspection task [13,14]. In contrast, the use of flying robots as an inspection tool is continuously increasing due to their capacity to easily traverse 3D space and quickly reach high and difficult to access areas [15,16,17,18,19].
Despite these advantages, the lack of Global Navigation Satellite Systems (GNSS) signals, the poor lighting conditions, the highly symmetrical environment, as well as the presence of the catenary in railway tunnels pose several challenges in terms of localization and navigation performance of an autonomous aerial vehicle. Thus, many of the current commercial solutions are either semi-autonomous or require an expert pilot to command the aircraft. Recently, a coordinated effort around the Defense Advanced Research Projects Agency (DARPA) Subterranean Challenge has pushed the limits of autonomous navigation of aerial robots in confined, tunnel-like environments [20,21,22]. Examples of this can be found in [14], where the authors combine a local and global planning strategy to autonomously navigate with both legged and aerial vehicles through a complex subterranean environment, as well as in [23], where a risk-aware planning method is proposed to account for the degradation of perception modules which occurs in long and complex missions. Despite the progress made, these works focus mainly on exploratory goals, leaving aside the inspection objectives required by infrastructure maintainers and operators.
To aid expert operators in assessing the infrastructure’s health condition, a robotic inspection must ensure that the sensor data collected is accurate and provides a sufficient level of detail. Having the infrastructure inspection in mind, the works presented in [15,24,25] use different strategies to provide meaningful data for the infrastructure maintainers. Authors in [15] equip multiple visual cameras on-board a UAV with the objective of generating panoramic images of the tunnel surface. The work presented in [24] tackles the inspection of railway tunnels by equipping their proposed aerial platform with a high-definition camera, the output of which can be used to detect surface defects. The authors of [25] presented a UAV-based system to perform close visual inspections of vessel cargo holds under a supervised autonomy paradigm. While it is true that these approaches have the main goal of the inspection of infrastructures, the first two approaches do not consider the quality of the inspection in any way, resulting in robot trajectories close to the central tunnel axis, while the last one does perform a close inspection, but it requires the supervision of an operator for the mission definition and execution.
To account for the sensors equipped on-board while also performing an autonomous flight, inspection-driven path planning algorithms can be implemented to achieve trajectories that promote information gathering. One of the most popular approaches in these cases is to solve a Next-Best-View (NBV) problem to find sensor placements that maximize a predefined utility gain. Initially proposed in [26], this method has the big advantage of using a utility gain formulation that can be easily adapted to many different tasks. For an inspection task, the gain is usually formulated as a function of the sensor information gathered at a given viewpoint. Several implementations of the NBV strategy have been proposed to solve the exploration or inspection of an unknown environment. The authors of [27] propose a receding horizon NBV scheme (RH-NVB), which builds a rapidly exploring random tree (RRT) by sampling viewing configurations and computing the information gain of each branch. Then, in an RH fashion, the first node of the best branch is executed, and the process is iterated. In large and complex environments, this method is prone to be stuck in local minima configurations. To tackle this problem, Selin et al. [28] propose using the RH-NBV strategy as a local planning strategy and combining it with a frontier exploration method used for global planning. A different strategy is used in [29], where the authors propose to keep track of the previously visited positions and use them as seeds for the RRT when the mapped environment increases and no local, high-gain viewing points are near. While the aforementioned path planning strategies succeed in avoiding local minima configurations, their focus is still on exploration tasks, leaving aside the particular needs of infrastructure inspection. The authors of [30] take it a step further and present an RRT-based information path planning strategy to achieve accurate Truncated Signed Distance Field (TSDF)-based 3D reconstructions of previously unknown environments. Their approach incorporates a measure of the 3D reconstruction accuracy directly into the information gain. Moreover, they maintain a single large RRT tree to find both local and global paths.
This paper proposes an end-to-end robotic solution meant to automatize traditional visual inspections of tunnel infrastructures. The proposed solution consists of an aerial platform equipped with a properly selected navigation and inspection payload, as well as a novel inspection path planning algorithm meant to ensure a high quality of the captured data. Several other authors present platform and system descriptions designed to work in complex, tunnel-like environments [15,16,31]. However, the systems and sensors equipped on-board tend to solve localization and mapping problems rather than focusing on the quality of the captured data, which is key to performing an accurate inspection. Here, we describe the entire process of system design, integration and validation, leading to a complete solution for tunnel inspection tasks. The inspection path planning algorithm developed for this task builds upon the strategy presented in [30], as it also employs a single, large RRT tree to mitigate local-minima situations. However, we approach the 3D reconstruction task from a photogrammetry point of view. Instead of directly using the depth sensor to obtain a 3D reconstruction of the environment, we use the on-board inspection sensors to obtain detailed and accurate information of the tunnel surface and employ photogrammetry techniques in post-processing to achieve the 3D reconstruction. Moreover, to provide meaningful and detailed information to an interested infrastructure maintainer, we put the focus of our inspection method on achieving high-definition imagery of the tunnel surface. Thus, the main objective of the robotic inspection is to ensure that the images captured during the autonomous flight are of sufficient quality to enable further post-processing steps. To tailor the inspection path planning towards this objective, the on-board inspection sensor characteristics are taken into account within the planning algorithm, and the information gain is formulated such that the inspection distance is minimized. Moreover, to increase the sampling efficiency of the planning algorithm, we exploit the geometric configuration of tunnel-like structures. Our algorithm detects the tunnel wall’s location and uses this information to automatically increase the density of the sampled sensor viewpoints in the locally explored map surrounding the walls. In this manner, the probability of detecting rich information paths not previously explored is increased. The main contributions of this paper are the following:
- This paper proposes a hardware and software selection for automated tunnel inspections that have been validated through simulation and real experiments.
- We present an inspection path planning method that focuses on the quality of the gathered sensor data by formulating the information gained in terms of the distance from which the surface is inspected.
- The planning algorithm is enhanced with an efficient sampling strategy. The tunnel wall’s location is firstly detected and then employed to increase the sampling density in the areas located nearby the tunnel surface.
The remainder of the document is structured as follows. The hardware setup, including perception sensors and inspection payload containing multiple visual and thermal cameras, is presented in Section 2. Localization, mapping, control and planning modules that enable the autonomous operation are discussed in Section 3. Section 4 evaluates the performance of the current approach against other methodologies through simulation and a real-world use case. Finally, conclusions are drawn in Section 5.
2. System Overview
Autonomous aerial inspection requires the integration of specific sensors, as well as a navigation system embedded on the flying platform to be used. Moreover, enough payload capacity from both weight and energy perspectives must be ensured. This section presents an overview of the entire system hardware composing the robotic solution proposed within this work.
2.1. The Aerial Platform
The platform chosen to perform the infrastructure inspection task is the DJI Matrice 100 quadrotor. This platform has an approximated size of 90 × 90 × 35 cm and weighs 2.43 kg when no payload is added. The size of this quadrotor makes it suitable for many different tunnel environments (e.g., railway or road tunnel, mines, big sewers), while its simple airframe can be easily customized to incorporate task-specific sensors. As the proposed inspection method aims to attain a high level of automation, we integrate on the Matrice 100 platform an Intel NUC8i7BEH mini computer with a 7th Generation Intel Core i7-8559U at 4.50 GHz, 32 GB DDR4 RAM and a 1.5TB SSD. This computer provides sufficient computational power to run the mapping and navigation modules and contains enough storage capacity to save the gathered inspection information.
2.2. Perception Sensors
The aerial platform is equipped with an Orbbec Astra depth camera to sense the tunnel environment. This camera computes a depth map of the nearby environment (up to 8 m of range) by triangulating the position of features generated by the projection of a specific infrared (IR) pattern. To track the position of the robot within the mapped environment, an Intel Realsense T265 tracking sensor is used. This lightweight sensor provides an efficient and integrated Visual Simultaneous Localization and Mapping (V-SLAM) algorithm that outputs the relative position of the robot with regards to a starting point at a frequency as high as 200 Hz. The sensor relies on the accurate detection and matching of visual features on its two fisheye cameras, which is supplemented by data from an integrated Inertial Measurement Unit (IMU). As this sensor depends on visual information of the environment, it is sensitive to different light conditions present in the tunnel environment. However, this choice is motivated by its significantly low weight (55 g) when compared to other more robust technologies, such as LiDARs. As the main objective is to design a platform suitable for high-definition imagery capture, the inspection sensors equipped on-board represent a big part of the available payload, imposing weight limitations to the remaining perception sensors.
To correct potential drifts in the z-direction, a mid-range (up to 15 m) TeraRanger Evo distance sensor is also mounted on-board. Figure 1 left shows the aerial platform with the main localization and mapping sensors. As can be observed, the camera sensors have been placed far from the body gravity center to avoid capturing the platform’s body within the camera’s field of view. The distance sensor is not visible in this figure as it is mounted on the back of the platform, pointing downwards.
2.3. Inspection Sensors
The main objective of this work is to provide an end-to-end robotic solution that could substitute the traditional visual inspection performed by human operators. To this end, the aerial platform has been equipped with four visual cameras: three IDS UI-3251LE and one high-resolution Basler acA4112-20um, as well as one FLIR Tau 640 thermal camera. Table 1 shows their main characteristics. The sensors have been selected, taking into account performance and weight aspects of the entire inspection payload. In terms of weight, due to the impossibility of equipping a gimbal stabilizer, all visual sensors have global shutters to avoid artifacts and blurry images being captured. Moreover, the sensors selected are among the lightest available, given their specifications in terms of resolution. The entire platform equipped with the navigation and inspection sensors reached a total weight of 4.2 kg and achieved an overall autonomy of 8 min of flight.
The data captured by the inspection sensors should serve two main objectives. First, it must be suitable for manual or automated defect detection on the tunnel walls and ceiling. Second, it must be post-processed and employed in photogrammetry techniques to obtain an accurate 3D reconstruction of the tunnel environment. Both objectives require that the images captured are detailed and sharp, presenting no artifacts or change in illumination. The photogrammetry methods involve a first correspondence search step that tries to match a common scene in multiple images. This requires that the captured images have a certain overlap and that multiple environment features are correctly extracted and matched. Therefore, higher-quality images will output more features that will increase the accuracy of the matching process. The same requirements are needed for the manual or automated detection of defects. Detecting structural and other types of infrastructure defects using merely visual and thermal images is an active research topic, with multiple works being published in this regard [32,33,34,35]. These techniques also benefit from the use of high-definition, detailed images, as the smaller the feature that can be identified on the image, the smaller the defect that can be detected. The early detection of the smallest defects could be of much interest for an infrastructure maintainer, as this would allow for early intervention, avoiding high repair costs once the defect is larger.
To ensure a detailed reconstruction of the environment, one of the main parameters to consider is the Ground Sampling Distance (GSD). GSD represents the distance between two adjacent pixel centers measured on the observed object. This metric indicates the level of detail that can be captured by a sensor from a certain observation distance, which, for an inspection task, translates to the smallest defect that can be detected. Assuming an inspection distance of 2 m, the GSD of each sensor can be computed as:
where is the sensor width, d is the observation or capturing distance, f is the focal length, and is the image width in pixels. Thus, for each camera, the resulting GSD is shown in Table 1.
Assuming that at least two pixels are required to detect a potential defect, the smallest defect that can be detected by the three camera types on-board the UAV is , and for the IDS, Basler and thermal cameras, respectively. As expected, the higher-resolution sensor is the one capable of detecting smaller features, and thus, smaller defects on the tunnel surface.
All the inspection sensors have been attached to a lightweight () 3D-printed structure that can be easily mounted and unmounted on the aerial platform (see Figure 1 right). The height and angle at which the sensors are placed ensure that the platform’s body is not captured within the camera’s field of view.
To obtain accurate and sufficiently illuminated visual images, we equipped the aerial robot with four shutter-synchronized LEDs pointing in each camera direction. The LEDs are powered in an energy-efficient manner with a duty cycle of ≈5% working at a frequency of along with the cameras. Hence, regardless of the existing tunnel illumination, the robot is able to perform surface inspections making sure that enough details are being captured.
3. Autonomous Inspection Methodology
This section presents an overview of the main navigation system components and a description of the approach taken in this work towards providing an autonomous end-to-end solution for tunnel inspection tasks. Figure 2 shows the main components required for this task and how they are interconnected.
3.1. Mapping Module
To map the previously unknown environment, the 3D pointcloud provided by the depth camera is used to obtain a 3D voxel map. The mapping framework used to achieve this representation is based on Voxblox [36]. Similar to other occupancy maps, Voxblox classifies each voxel as either known free, known occupied or unknown. This classification is sufficient for an exploration task, but for an inspection procedure, we are also interested in marking and keeping track of the voxels that have already been inspected or sensed by the on-board inspection sensors. Thus, we add an additional category to each voxel to mark their state as either inspected or not. The end result is a map representation that is used for both collision avoidance and the determination of inspection progress.
3.2. Localization and Drift Correction
The pose estimation provided by the Intel Realsense T265 sensor relies on a visual odometry algorithm fused with IMU data and local loop-closure capabilities. The resulting localization is prone to errors, especially in low-textured environments and long trajectories. To mitigate these errors, measures from a TeraRanger pointing downwards are used to correct the z estimation if the tunnel terrain is sufficiently flat. Otherwise, an AprilTag detector module is also implemented, which uses the visual data provided by the depth camera pointing forwards to detect tags located on the uneven tunnel floor and provide a second z estimation that can be used to correct the height measurement. These corrections can be activated or deactivated to suit the needs of any tunnel morphology.
3.3. Vehicle Control
The lack of GNSS signals in tunnel environments prevents the use of the embedded DJI N1 flight controller in position mode. Thus, a cascaded control strategy is implemented consisting of a Linear Model Predictive Controller (MPC) acting as the outer control loop and the embedded attitude N1 flight controller as the inner control loop. The linear MPC implementation is based on the work presented in [37], which gives a model of the system and the estimation of the vehicle pose and velocities, outputs attitude and vertical velocity command references to the low-level N1 controller.
To account for the specific load distribution of the aerial platform when equipped with the sensors composing the navigation and inspection payload, system identification methods have been used to derive the vehicle’s model that encompasses the low-level control response over the body dynamics.
Several flight experiments have been performed recording the response of roll, pitch, yaw-rate and vertical velocity channels to open-loop control inputs. A first-order continuous linear model of the form:
was fitted to the gathered experimental data resulting in the model parameters shown in Table 2.
3.4. Inspection Path Planning
Considering the problem of inspecting the surface of an unknown tunnel-like environment, we propose an RRT*-inspired inspection path planning algorithm. Building upon the work performed in [30], we adapt the gain formulation to optimize photogrammetry-based 3D reconstruction metrics. Moreover, the implementation enhances the sampling process with a guided strategy to increase the probability of sampling the relevant areas around the tunnel surface.
Similar to [30], we expand and maintain a single RRT* tree, which is executed in a receding horizon manner. The tree consists of nodes and edges connecting the given nodes. The root of the tree is assigned to the current position of the aerial platform, and each tree node i has an associated trajectory , which connects it to its parent node. For each sample added to the tree, a value is computed as the following:
with being the gain and the cost associated with the trajectory . The gain reflects the amount of environmental information that has been gathered by following the path to reach node i. For this application, we define as relevant environment information the number of voxels corresponding to the tunnel surface that has been sensed by the on-board inspection sensors from a close distance. The location, orientation and parameters of the cameras included in the inspection payload are considered within the planning algorithm at this step. Their field of view is discretized, and a ray-casting procedure is implemented to determine the amount of tunnel area seen by each sensor as shown in Figure 3. Thus, the gain is formulated as
where
and
with N being the number of points evaluated along the trajectory , and M being the number of occupied map voxels that intersected the cast rays for all the sensors on the inspection payload. The parameter represents the minimum distance to the tunnel wall from which it is considered that a close inspection has been performed. If the rays have been cast from a bigger distance, then no gain is associated with that voxel. If the rays intersect the tunnel surface voxels from a smaller distance and these voxels were not previously seen, then a gain of 1 is assigned. The occupied voxels corresponding to the floor of the tunnel are not considered in this case.
The cost is proportional to the length of the trajectory assigned to each node:
where is the length of the trajectory and is a constant tuning factor assigned to balance the gain and cost values. The resultant value computed for each node is used to decide which is the next-best node within the tree towards which the robot will be commanded to move in order to optimize the length and information gain of the inspection path.
As discussed, evaluating each tree node involves iterative ray-casting procedures to compute the associated information gain. This operation is computationally demanding and should be kept to a minimum level of queries. To avoid this costly operation for poor informative samples, we implement a guided sampling strategy to steer the sampling process towards the most relevant areas faster. We use the inherent tunnel geometry to first detect the location of its walls and then limit the sampling area to the tunnel bounds. The operation starts without previous knowledge of the tunnel wall’s location, only with a rough estimation of the tunnel width. Initially, the samples are drawn from a predefined bounding volume around the robot’s position. Once the drone starts moving within the environment, and the on-board sensors see both tunnel walls, the width of the search space is reduced to the actual tunnel width measured within the mapped environment. The tunnel wall’s location is constantly monitored to detect any change in the tunnel geometry, which would then trigger the resizing of the search space.
Aside from the adaptation of the search space, the probability distribution used to obtain the samples is also tuned to increase the chances of drawing high-gain samples. At first, a uniform sampling probability is assigned to the entire search space (Figure 4a). Once the robot starts moving within the environment locating the tunnel walls (Figure 4b), a weighted discrete probability is used where the weight associated, to each space interval is updated, taking into account the information gain of the samples evaluated within it. The weight of the i-th bin is updated as:
where represents the weight assigned to the bin prior to the gain evaluation, is the gain summation in Equation (5) of all samples within the bin volume i, P represents the number of bins and represents the probability weight at the next iteration.
The suggested procedure ensures that if high-gain samples have been drawn in a specific area, the probability of sampling that zone in the following iteration is increased. In this manner, the algorithm learns the relevant regions of the environment and increases the probability of drawing a sample from those areas (Figure 4c). By employing this method, the probability of drawing a sample in the middle of the tunnel is reduced as the information gathered from that area and its corresponding gain is lower than when the robot flies close the tunnel walls. However, to keep a level of exploration when performing the sampling procedure, the probability distribution is reset to a uniform distribution once a certain threshold of is reached. This is especially useful in situations in which the field of view of the mapping sensor is not large enough to capture the entire infrastructure (e.g., the robot might not be seeing both tunnel walls), for example, in very wide tunnels. In such scenarios, the weight of the interval corresponding to the area surrounding the visible tunnel wall would increase up to saturation, leading to a situation in which samples would be taken only in that area. Thus, the robot would keep inspecting one side of the tunnel without ever discovering the opposite wall. By resetting the weights, we enable a certain exploration of the entire tunnel while also accounting for changes in the tunnel geometry.
Figure 5 shows an overview of the planning algorithm. While the robot is moving towards the goal position, the RRT* tree is continuously expanded with new samples following the sampling procedure described in the previous paragraphs. The samples are evaluated as described in Equation (3), and their computed value is stored. Once the robot reaches its goal position, the trajectory towards the next-best tree node adjacent to the current robot position is commanded, and the tree is updated by changing its root to the new robot position. This process is repeated continuously until the inspection mission is stopped. This main planner loop takes 1 to execute on an Intel(R) Core(TM) i7-10610U CPU @ 1.80 GHz computer, from which 70% of the time is spent on expanding and evaluating the tree.
4. Experimental Evaluation
This section presents the results of both simulation-based and real-world environment experiments performed using the proposed methodology.
4.1. Simulation-Based Experiments
To assess the performance of the proposed inspection path planner, several experiments have been conducted using the Gazebo-based simulation environment RotorS [38]. The platform model used is the AscTec Firefly multi-rotor equipped with a visual-inertial sensor [39], which provides the 3D pointcloud of the environment. The tunnel environment simulated for these experiments corresponds to a section of a real, single-track railway tunnel located in Rome, Italy. The simulated tunnel is long and has a cross-section of . Figure 6 depicts an inside and outside view of this simulated environment.
Under these simulated tunnel conditions, the performance of the proposed inspection method is evaluated based on the number of surface voxels that are observed by the inspection sensors from a predefined sensing distance, . Moreover, we show the mean trajectory length and the distribution of observed voxels at different distance intervals. Each simulation experiment was run for exactly .
For these experiments, the four visual cameras described in Section 2.3 are considered. All rays cast from the inspection sensors and intersecting a map voxel located at a distance lower or equal to are labeled as voxels sensed. Because inspection results are strongly affected by this parameter, we assess the generated path performance under three different scenarios. Going from more restrictive to less restrictive, the parameter takes values of , and . Each of these scenarios represents different inspection quality requirements, as the closer the inspection sensors can observe the tunnel walls, the smaller the defects that can be identified using the captured data.
The inspection trajectory generated by our proposed method is compared to a constant height, wall-following trajectory and the trajectory generated by the TSDF-based 3D-reconstruction method proposed in [30]. The wall-following path is meant to mimic a potential manual flight or another inspection method in which a rail or ground vehicle equipped with several inspection sensors moves along the tunnel wall. The TSDF-based 3D reconstruction method is considered in this comparison because it indirectly steers the robot closer to the inspected infrastructure in order to minimize the TSDF-based map uncertainty.
In this case, a complete inspection of the tunnel means having inspected the area corresponding to half of the tunnel if we would slice it through its longitudinal axis. This assumption is taken here to enable a fair comparison among methods as during the entire simulation, the wall-following trajectory traverses the tunnel from one end to the other, inspecting only one of its walls.
Throughout these experiments, the system constraints and other mapping parameters have been equally applied to all methods. The same goes for the RRT* parameters that have been selected in accordance with the simulated tunnel dimensions and have been kept constant for both TSDF and our proposed method. These and other method-specific parameters are shown in Table 3. The parameters of the TSDF method are kept as given in [30] with the exception of the weight assigned to new, unknown voxels, which have increased up to a value of . This parameter tuning is required to increase the exploration component of the algorithm and achieve a comparable tunnel length being covered by all methods. Additional parameters corresponding to our proposed method are also listed in Table 3. Although the proposed path planning algorithm shows a good performance for a range of parameter values, the ones presented here were selected as a result of previous simulation experiments performed on this particular tunnel environment.
For the wall-following trajectory, the specific height and distance to the tunnel wall employed for each scenario are shown in Table 4. These parameters have been computed taking into account the characteristics of the on-board inspection sensors and the simulated tunnel geometry, ensuring that all the voxels captured by the sensor’s field of view are inspected from a close distance.
The main results of the simulation experiments are shown in Figure 7, while Figure 8 depicts an example of the inspection trajectory performed by all methods considered in this analysis. Observing the evolution of the number of voxels sensed along the entire inspection procedure, we first notice that the TSDF-based Informed-RRT* [30] method does not manage to steer the robot as close to the tunnel walls as the rest of the methods. This is especially perceptible in the scenario in which the robot had to inspect the tunnel wall from a distance lower than 1.5 m, where almost no voxels observed by the inspection payload sensors were closely inspected. Taking a closer look at the performance of this method, for the first scenario, in Figure 7c, it can be seen how the majority of voxels were observed from a distance of up to . This is justified by the fact that in [30], the optimization problem that maximizes the TSDF-based map reconstruction error gets the robot closer to the tunnel surfaces, but this distance is not directly controllable. Moreover, due to the increase of the new voxels weight parameter to promote the exploration of the tunnel, the accuracy with which the TSDF map is reconstructed is affected. All these points explain the lower performance of this method when compared to the remaining ones. A further exhaustive parameter tuning might improve its performance, although the distance to the infrastructure would still not be directly controllable.
Analyzing the performance of our proposed method, we see this is comparable and even outperforms the designed wall-following trajectory. For the more restrictive scenarios ( and ), the wall-following trajectory takes over the proposed algorithm for short times, while our approach outperforms for sufficiently long missions, managing to accurately sense more voxels. Moreover, the enhanced flexibility of our method is capable of better adapting to the tunnel curvature while also moving up and down along the tunnel wall to increase the number of voxels sensed (see Figure 8c). These factors help achieve a greater number of voxels sensed when compared to the wall-following trajectory.
Focusing on the percentage of voxels observed by the on-board inspection sensors, as it is expected, the wall-following trajectory concentrates most of the observed voxels within the required sensing distance for each scenario. In comparison, the inspection trajectory generated by our method maximizes the number of observed voxels within the required , but at the same time, observes and explores a bigger section of the tunnel wall (Figure 7c,f,i). This is consistent with the results listed in Table 5, where we can see the percentage of voxels explored by each method and for each scenario. By maintaining a constant and close distance to the wall, the area observed by the wall-following trajectory is smaller, resulting in a lower exploration of the entire tunnel structure. The method presented in [30] achieves a greater exploration of the tunnel as its trajectory maintains a bigger distance from the tunnel wall, increasing the number of voxels captured by the sensor’s field of view. However, this results in a less-accurate tunnel surface inspection. Finally, the method we propose manages to maximize the number of voxels accurately inspected, as well as maintain a level of exploration. As expected, this level of exploration is lower for the more restrictive scenarios in which the robot is required to maintain a lower distance from the tunnel walls. The direct effect of achieving a close inspection trajectory while also exploring the tunnel geometry is a higher trajectory length. For all three scenarios, our proposed method generates a higher inspection path length for the same amount of inspection time. Given the limited autonomy of aerial vehicles, this aspect is important.
4.2. Railway Tunnel Experiments
The proposed end-to-end robotic solution for tunnel-like infrastructure inspection has been tested in a single-track railway tunnel in Italy. Despite having a single track, this tunnel is high and wide, with a highly uneven floor. The rail tracks are located on one side of the tunnel, approximately higher than the rest of the floor (see Figure 9), making this tunnel configuration a challenging one for the use of any range sensor pointing in the z-direction. Thus, several April tags were placed along the longitudinal tunnel axis on the lower-level floor with the objective of correcting any z estimation error. Regardless of the existing lighting system inside the tunnel, some areas remained poorly illuminated, highlighting the need for on-board lighting sources.
In this experiment, a safety distance with respect to all nearby obstacles higher than has been set while striving to inspect the tunnel surface from a close distance (). Due to the presence of the catenary and the difficulty of accurately detecting it as an obstacle with the depth sensor, the maximum height of the robot has been limited to , close to below the cable. Likewise, the maximum velocity allowed for this operation has been configured to .
To start the autonomous inspection mission, the robot is given a goal point located from the take-off location. Once the goal is reached, the drone is commanded to return to the initial take-off point. Along the entire forward and backward trajectory, the objective is to maximize the tunnel surface inspected by the on-board sensors. Figure 10 shows several instances of such an autonomous inspection procedure. Figure 10a depicts the moment at which the drone is taking off, and the tunnel map representation is created in real-time by the on-board computer. Next, the nearby environment is sampled, and viewpoint locations are added to the RRT* tree, expanding it within the mapped environment. The next-best-view position is identified based on the value formulation presented in Section 3, and the robot is commanded to move to the next best location. The trajectory followed by the robot is marked in red (see Figure 10b). The higher informative gain of the samples located closer to the tunnel walls steers the platform’s trajectory towards that direction, as seen in Figure 10c. At this point, the tunnel wall direction has not been detected yet. As noticed, while flying towards the commanded goal closer to the right-hand side wall, the robot was unaware of the location of the opposite wall. The field of view of the equipped depth sensor was not sufficient to capture both walls of this wide tunnel environment. Once the platform follows a trajectory closer to the center of the tunnel, the presence of the opposite wall is detected. When the goal is reached, the platform returns to the take-off location while inspecting the other side of the tunnel (see Figure 10d). As the information gain obtained by inspecting the same wall decreases, a higher number of samples are taken closer to the recently discovered surface.
Figure 11 shows the number of voxels observed and their corresponding observation distance. As noticed, most of the tunnel wall surface () has been inspected from the desired inspection distance, and of the surface was sensed from a distance closer than . Due to the height limitation, the ceiling surface could not be closely mapped. Nonetheless, the commanded path included several up and down movements along the tunnel wall, increasing the level of details captured by the upper camera when the robot was flying higher.
An example of the images taken with all the inspection sensors on-board the robot is shown in Figure 12. As can be noticed, the visual and thermal data captured provides clear and accurate information on the tunnel surface, showing no blurriness from the robot motion. In the instant depicted in Figure 12, the voxels sensed from a close distance correspond to the ones captured by the sensors on the right side. The main defects encountered during the inspection mission have been thin cracks and water inlet areas. Figure 13 shows visual and thermal images capturing these defects on the tunnel walls and ceiling. The level of detail captured by the visual images enables the identification of thin concrete cracks (see Figure 13a). To check how accurate the measurements performed in these images compare with the real ones, two elements (1 and 2 depicted in Figure 13) have been measured in the real tunnel and compared with their sizes measured in the captured image. To measure these elements on the image, the distance from which the wall was observed () was obtained from the estimated robot position and used to compute the GSD. Table 6 shows these computations, as well as the real measurements and the error obtained. The measurement error of these elements is around 2%, indicating that features and defects of interest can be measured on these images with high accuracy. However, it must be noticed that these results depend on the robot position estimation and thus, the measurement error could increase during the flight if the position estimation begins to drift. Further post-processing steps involving image matching and aligning could improve the robot position estimation and remove the drift effects.
Regarding the effect of the on-board illumination system, it can be noticed how the tunnel wall images captured from a smaller distance present a constant illumination without being overexposed. Due to the height limitation imposed during the autonomous flight, the images corresponding to the tunnel ceiling are slightly underexposed due to the higher capturing distance. Nonetheless, defects, such as long cracks, can still be identified, as seen in Figure 13b. Figure 13c,d highlights several water inlet areas visible on both visual and thermal channels. Under these test conditions, no other temperature difference was noticeable on the captured thermal data.
The sample of images presented here showcases how the inspection path planner can guide the aerial platform to perform a close inspection of the tunnel surface. The raw data gathered through the inspection mission forms the basis of further post-processing steps, which can be applied to provide meaningful information to an infrastructure maintainer.
5. Conclusions and Future Work
A robotic solution capable of performing autonomous visual inspections of tunnel-like infrastructures is presented and validated in this work. The proposed aerial platform has been equipped with carefully selected visual and thermal sensors and enhanced with an on-board illumination system with the aim of capturing sharp and detailed images of the tunnel surface. To enable the platform to perform autonomous inspection procedures, a sensor-aware, informative path planning has been developed and tested both in simulated and real-tunnel environments. The simulation experiments highlighted the capacity of the proposed method to perform a close visual inspection while also exploring the previously unknown tunnel environment. Although one could think that from an inspection perspective, the ideal situation would be to get as close as possible to the objective surface, following such an inspection trajectory is not suitable for an autonomous platform with no prior information on the environment. As observed for the wall-following trajectory when the platform gets closer to the tunnel surface, its awareness of the entire environment decreases. The method proposed in this work generates trajectories that balance the inspection quality and exploration of the environment, achieving safe navigation through a previously unknown environment. This trajectory is nonetheless longer than the trajectories generated by the other two methods used within the simulation experiments as it tries to cover the entire tunnel surface from a close distance. Given the limited flight time of aerial vehicles, this leads to shorter inspection missions. Future technological developments of visual cameras could improve the total mission length by ensuring the same image quality without having to get that close to the tunnel surface.
Including the desired inspection distance within the planning algorithm results in a directly controllable inspection accuracy method. Thus, by controlling this parameter, several types of visual inspections could be performed depending on the level of precision needed. Quicker and less exhaustive inspections could be suitable for tunnels for which the health conditions have been stagnant over the years, while more accurate, and thus, slower inspections could be required for older assets that have to be closely monitored.
The autonomous inspection flight was demonstrated in a real and challenging tunnel environment. The guided, informative path planning algorithm was able to steer the platform towards the tunnel wall and achieve a close inspection. The sensor data collected from this experiment provided detailed tunnel surface information that can be further post-processed or directly used as an alternative to the traditional visual inspection method. The exploitation of these results, including their use for automatic defect detection, as well as 3D reconstruction of the tunnel environment, will be addressed in future work.
From these real experiments, some valuable lessons have been learned. First, although several measures were taken to avoid localization errors, the poorly illuminated, uneven and symmetrical tunnel environment posed a challenge for the safety of a long autonomous inspection mission. Thus, future work should concentrate on including different localization methods that do not rely on visual inputs to ensure higher robustness of the localization module in this type of environment. Secondly, the depth camera used provided enough range and field of view to safely navigate the unknown environment. However, in large and wide environments, it is not able to capture the entire infrastructure. As the inspection planning algorithm relies on the mapped environment to generate next-best-view positions, an initial exploration maneuver (e.g., turn) could be implemented to first sense the surrounding infrastructure geometry and then proceed with the inspection task. This would improve the earlier detection of both tunnel walls in wide tunnel environments and the use of the guided sampling process. A different solution would be to incorporate a wider mapping sensor, such as a LiDAR. At the time of system design, the platform’s weight limitations prevented the use of such technology. However, future developments targeting the weight reduction of these sensors could enable their use as the main mapping sensor.
Author Contributions
Conceptualization, B.B. and J.C.B.; methodology, B.B. and J.C.B.; software, B.B.; validation, B.B. and J.C.B.; formal analysis, B.B. and J.C.B.; investigation, B.B. and J.C.B.; resources, B.B. and J.C.B.; data curation, B.B.; writing—original draft preparation, B.B.; writing—review and editing, B.B. and J.C.B.; visualization, B.B.; supervision, J.C.B.; project administration, B.B. and J.C.B.; funding acquisition, J.C.B. All authors have read and agreed to the published version of the manuscript.
Funding
This work was supported by the Shift2Rail Joint Undertaking under the European Union’s Horizon 2020 research and innovation programme under grant agreement No. 826250 (Assets4Rail). This publication reflects only the authors views and the European Union is not liable for any use that may be made of the information contained therein.
Institutional Review Board Statement
Not applicable.
Informed Consent Statement
Not applicable.
Data Availability Statement
Not applicable.
Acknowledgments
The authors want to express their gratitude to Rete Ferroviaria Italiana (RFI) for making the railway tunnel available where the validation tests took place.
Conflicts of Interest
The authors declare no conflict of interest.
Abbreviations
The following abbreviations are used in this manuscript:
| DARPA | Defense Advanced Research Projects Agency |
| GDP | Gross Domestic Product |
| GNSS | Global Navigation Satellite Systems |
| GSD | Ground Sampling Distance |
| IMU | Inertial Measurement Unit |
| MPC | Model Predictive Controller |
| NBV | Next Best View |
| RH | Receding Horizon |
| RRT | Rapidly-exploring Random Tree |
| TSDF | Truncated Signed Distance Field |
| UAV | Unmanned Aerial Vehicle |
| V-SLAM | Visual Simultaneous Localization and Mapping |
References
- Horizon 2020-European Commission. Young Researchers Address Europe’s Ageing Infrastructure Challenges: Training in European Asset Health Management Project Note. 2015. Available online: https://ec.europa.eu/programmes/horizon2020/en/news/young-researchers-address-europe%E2%80%99s-ageing-infrastructure-challenges (accessed on 1 December 2021).
- OECD. Infrastructure to 2030-Telecom, Land Transport, Water and Electricity; OECD Publishing: Paris, France, 2006; p. 360. [Google Scholar] [CrossRef]
- Blaise, J.C. Why Is Maintenance a High Risk Activity? Available online: https://oshwiki.eu/wiki/Why_is_maintenance_a_high_risk_activity%3F (accessed on 30 November 2021).
- Pfändler, P.; Bodie, K.; Angst, U.; Siegwart, R. Flying corrosion inspection robot for corrosion monitoring of civil structures–First results. In Proceedings of the 5th Conference on Smart Monitoring, Assessment and Rehabilitation of Civil Structures-Program (SMAR), Potsdam, Germany, 27–29 August 2019; pp. 1–8. [Google Scholar] [CrossRef]
- Ollero, A.; Heredia, G.; Franchi, A.; Antonelli, G.; Kondak, K.; Sanfeliu, A.; Viguria, A.; Martinez-de Dios, J.R.; Pierri, F.; Cortes, J.; et al. The AEROARMS Project: Aerial Robots with Advanced Manipulation Capabilities for Inspection and Maintenance. IEEE Robot. Autom. Mag. 2018, 25, 12–23. [Google Scholar] [CrossRef] [Green Version]
- Ribas, D.; Palomeras, N.; Ridao, P.; Carreras, M.; Mallios, A. Girona 500 AUV: From Survey to Intervention. IEEE/ASME Trans. Mechatronics 2012, 17, 46–53. [Google Scholar] [CrossRef]
- Elkmann, N.; Felsch, T.; Förster, T. Robot for rotor blade inspection. In Proceedings of the 2010 1st International Conference on Applied Robotics for the Power Industry, Montreal, QC, Canada, 5–7 October 2010; pp. 1–5. [Google Scholar] [CrossRef]
- Pradalier, C.; Ouabi, O.L.; Pomarede, P.; Steckel, J. On-plate localization and mapping for an inspection robot using ultrasonic guided waves: A proof of concept. In Proceedings of the 2020 IEEE/RSJ International Conference on Intelligent Robots and Systems (IROS), Las Vegas, NV, USA, 25 October–24 January 2020; pp. 5045–5050. [Google Scholar] [CrossRef]
- Sanchez-Cuevas, P.J.; Gonzalez-Morgado, A.; Cortes, N.; Gayango, D.B.; Jimenez-Cano, A.E.; Ollero, A.; Heredia, G. Fully-Actuated Aerial Manipulator for Infrastructure Contact Inspection: Design, Modeling, Localization, and Control. Sensors 2020, 20, 4708. [Google Scholar] [CrossRef] [PubMed]
- Burri, M.; Nikolic, J.; Hürzeler, C.; Caprari, G.; Siegwart, R. Aerial service robots for visual inspection of thermal power plant boiler systems. In Proceedings of the 2012 2nd International Conference on Applied Robotics for the Power Industry (CARPI), Zurich, Switzerland, 11–13 September 2012; pp. 70–75. [Google Scholar] [CrossRef]
- Nekovář, F.; Faigl, J.; Saska, M. Multi-Tour Set Traveling Salesman Problem in Planning Power Transmission Line Inspection. IEEE Robot. Autom. Lett. 2021, 6, 6196–6203. [Google Scholar] [CrossRef]
- Speck, A.; Croux, A.; Jarrot, A.; Strunk, G.; Choi, G.; Osedach, T.P.; Gelman, A.; Salman, N.; Bodrito, T.; Vannuffelen, S.; et al. Supervised Autonomy for Advanced Perception and Hydrocarbon Leak Detection. In Proceedings of the Global Oceans 2020: Singapor–U.S. Gulf Coast, Biloxi, MS, USA, 5–30 October 2020; pp. 1–6. [Google Scholar] [CrossRef]
- Alejo, D.; Mier, G.; Marques, C.; Caballero, F.; Merino, L.; Alvito, P. SIAR: A Ground Robot Solution for Semi-autonomous Inspection of Visitable Sewers. In Advances in Robotics Research: From Lab to Market: ECHORD++: Robotic Science Supporting Innovation; Grau, A., Morel, Y., Puig-Pey, A., Cecchi, F., Eds.; Springer International Publishing: Cham, Germany, 2020; pp. 275–296. [Google Scholar] [CrossRef]
- Dang, T.; Tranzatto, M.; Khattak, S.; Mascarich, F.; Alexis, K.; Hutter, M. Graph-based subterranean exploration path planning using aerial and legged robots. J. Field Robot. 2020, 37, 1363–1388. [Google Scholar] [CrossRef]
- Özaslan, T.; Loianno, G.; Keller, J.; Taylor, C.J.; Kumar, V.; Wozencraft, J.M.; Hood, T. Autonomous Navigation and Mapping for Inspection of Penstocks and Tunnels With MAVs. IEEE Robot. Autom. Lett. 2017, 2, 1740–1747. [Google Scholar] [CrossRef]
- Mascarich, F.; Khattak, S.; Papachristos, C.; Alexis, K. A multi-modal mapping unit for autonomous exploration and mapping of underground tunnels. In Proceedings of the 2018 IEEE Aerospace Conference, Big Sky, MT, USA, 3–10 March 2018; pp. 1–7. [Google Scholar] [CrossRef]
- Chataigner, F.; Cavestany, P.; Soler, M.; Rizzo, C.; Gonzalez, J.P.; Bosch, C.; Gibert, J.; Torrente, A.; Gomez, R.; Serrano, D. ARSI: An Aerial Robot for Sewer Inspection. In Advances in Robotics Research: From Lab to Market: ECHORD++: Robotic Science Supporting Innovation; Grau, A., Morel, Y., Puig-Pey, A., Cecchi, F., Eds.; Springer International Publishing: Cham, Germany, 2020; pp. 249–274. [Google Scholar] [CrossRef]
- Mansouri, S.S.; Kanellakis, C.; Kominiak, D.; Nikolakopoulos, G. Deploying MAVs for autonomous navigation in dark underground mine environments. Robot. Auton. Syst. 2020, 126, 103472. [Google Scholar] [CrossRef]
- Kocer, B.; Tjahjowidodo, T.; Pratama, M.; Seet, G. Inspection-while-flying: An autonomous contact-based nondestructive test using UAV-tools. Autom. Constr. 2019, 106. [Google Scholar] [CrossRef]
- Rouček, T.; Pecka, M.; Čížek, P.; Petříček, T.; Bayer, J.; Šalanský, V.; Heřt, D.; Petrlík, M.; Báča, T.; Spurný, V.; et al. DARPA Subterranean Challenge: Multi-robotic Exploration of Underground Environments. In Modelling and Simulation for Autonomous Systems; Mazal, J., Fagiolini, A., Vasik, P., Eds.; Springer International Publishing: Cham, Germany, 2020; pp. 274–290. [Google Scholar]
- Hudson, N.; Talbot, F.; Cox, M.; Williams, J.; Hines, T.; Pitt, A.; Wood, B.; Frousheger, D.; Surdo, K.L.; Molnar, T.; et al. Heterogeneous Ground and Air Platforms, Homogeneous Sensing: Team CSIRO Data61’s Approach to the DARPA Subterranean Challenge. arXiv 2021, arXiv:2104.09053. [Google Scholar]
- Petráček, P.; Krátký, V.; Petrlík, M.; Báča, T.; Kratochvíl, R.; Saska, M. Large-Scale Exploration of Cave Environments by Unmanned Aerial Vehicles. IEEE Robot. Autom. Lett. 2021, 6, 7596–7603. [Google Scholar] [CrossRef]
- Agha, A.; Otsu, K.; Morrell, B.; Fan, D.D.; Thakker, R.; Santamaria-Navarro, A.; Kim, S.; Bouman, A.; Lei, X.; Edlund, J.A.; et al. NeBula: Quest for Robotic Autonomy in Challenging Environments; TEAM CoSTAR at the DARPA Subterranean Challenge. arXiv 2021, arXiv:2103.11470. [Google Scholar]
- Falcone, A.; Vaccarino, G. Primary Level UAV for Tunnel Inspection: The PLUTO Project. In Proceedings of the 2020 I-RIM Conference, Rome, Italy, 10–12 December 2020. [Google Scholar]
- Bonnin-Pascual, F.; Garcia-Fidalgo, E.; Company-Corcoles, J.P.; Ortiz, A. MUSSOL: A Micro-Uas to Survey Ship Cargo hOLds. Remote Sens. 2021, 13, 3419. [Google Scholar] [CrossRef]
- Connolly, C. The determination of next best views. In Proceedings of the 1985 IEEE International Conference on Robotics and Automation, St. Louis, MO, USA, 25–28 March 1985; Volume 2, pp. 432–435. [Google Scholar] [CrossRef]
- Bircher, A.; Kamel, M.S.; Alexis, K.; Oleynikova, H.; Siegwart, R. Receding horizon path planning for 3D exploration and surface inspection. Auton. Robot. 2018, 42, 291–306. [Google Scholar] [CrossRef]
- Selin, M.; Tiger, M.; Duberg, D.; Heintz, F.; Jensfelt, P. Efficient Autonomous Exploration Planning of Large-Scale 3-D Environments. IEEE Robot. Autom. Lett. 2019, 4, 1699–1706. [Google Scholar] [CrossRef] [Green Version]
- Witting, C.; Fehr, M.; Bähnemann, R.; Oleynikova, H.; Siegwart, R. History-Aware Autonomous Exploration in Confined Environments Using MAVs. In Proceedings of the 2018 IEEE/RSJ International Conference on Intelligent Robots and Systems (IROS), Madrid, Spain, 1–5 October 2018; pp. 1–9. [Google Scholar] [CrossRef] [Green Version]
- Schmid, L.; Pantic, M.; Khanna, R.; Ott, L.; Siegwart, R.; Nieto, J. An Efficient Sampling-Based Method for Online Informative Path Planning in Unknown Environments. IEEE Robot. Autom. Lett. 2020, 5, 1500–1507. [Google Scholar] [CrossRef] [Green Version]
- Papachristos, C.; Khattak, S.; Mascarich, F.; Dang, T.; Alexis, K. Autonomous Aerial Robotic Exploration of Subterranean Environments relying on Morphology–aware Path Planning. In Proceedings of the 2019 International Conference on Unmanned Aircraft Systems (ICUAS), Atlanta, GA, USA, 11–14 June 2019; pp. 299–305. [Google Scholar] [CrossRef]
- Li, G.; Ma, B.; He, S.; Ren, X.; Liu, Q. Automatic Tunnel Crack Detection Based on U-Net and a Convolutional Neural Network with Alternately Updated Clique. Sensors 2020, 20, 717. [Google Scholar] [CrossRef] [PubMed] [Green Version]
- Huynh, T.C. Vision-based autonomous bolt-looseness detection method for splice connections: Design, lab-scale evaluation, and field application. Autom. Constr. 2021, 124, 103591. [Google Scholar] [CrossRef]
- Kim, B.; Yuvaraj, N.; Park, H.W.; Preethaa, K.S.; Pandian, R.A.; Lee, D.E. Investigation of steel frame damage based on computer vision and deep learning. Autom. Constr. 2021, 132, 103941. [Google Scholar] [CrossRef]
- Protopapadakis, E.; Voulodimos, A.; Doulamis, A.; Doulamis, N.; Stathaki, T. Automatic crack detection for tunnel inspection using deep learning and heuristic image post-processing. Appl. Intell. 2019, 49, 2793–2806. [Google Scholar] [CrossRef]
- Oleynikova, H.; Taylor, Z.; Fehr, M.; Siegwart, R.; Nieto, J. Voxblox: Incremental 3D Euclidean Signed Distance Fields for on-board MAV planning. In Proceedings of the 2017 IEEE/RSJ International Conference on Intelligent Robots and Systems (IROS), Vancouver, BC, Canada, 24–28 September 2017. [Google Scholar] [CrossRef] [Green Version]
- Kamel, M.; Stastny, T.; Alexis, K.; Siegwart, R. Model Predictive Control for Trajectory Tracking of Unmanned Aerial Vehicles Using Robot Operating System. In Robot Operating System (ROS): The Complete Reference (Volume 2); Springer International Publishing: Cham, Germany, 2017; pp. 3–39. [Google Scholar] [CrossRef]
- Furrer, F.; Burri, M.; Achtelik, M.; Siegwart, R. RotorS—A Modular Gazebo MAV Simulator Framework. In Robot Operating System (ROS): The Complete Reference (Volume 1); Springer International Publishing: Cham, Germany, 2016; pp. 595–625. [Google Scholar] [CrossRef]
- Nikolic, J.; Rehder, J.; Burri, M.; Gohl, P.; Leutenegger, S.; Furgale, P.T.; Siegwart, R. A synchronized visual-inertial sensor system with FPGA pre-processing for accurate real-time SLAM. In Proceedings of the 2014 IEEE International Conference on Robotics and Automation (ICRA), Hong Kong, China, 31 May–5 June 2014; pp. 431–437. [Google Scholar] [CrossRef] [Green Version]
Figure 1.
Aerial platform and inspection sensors schematics. (Left): DJI Matrice 100 equipped with the Intel NUC unit, as well as the localization and mapping sensors. (Right): Schematic showing the visual and thermal camera arrangement on the 3D-printed inspection sensor support. The left and front cameras are slightly tilted upward to avoid capturing the airframe in the images.
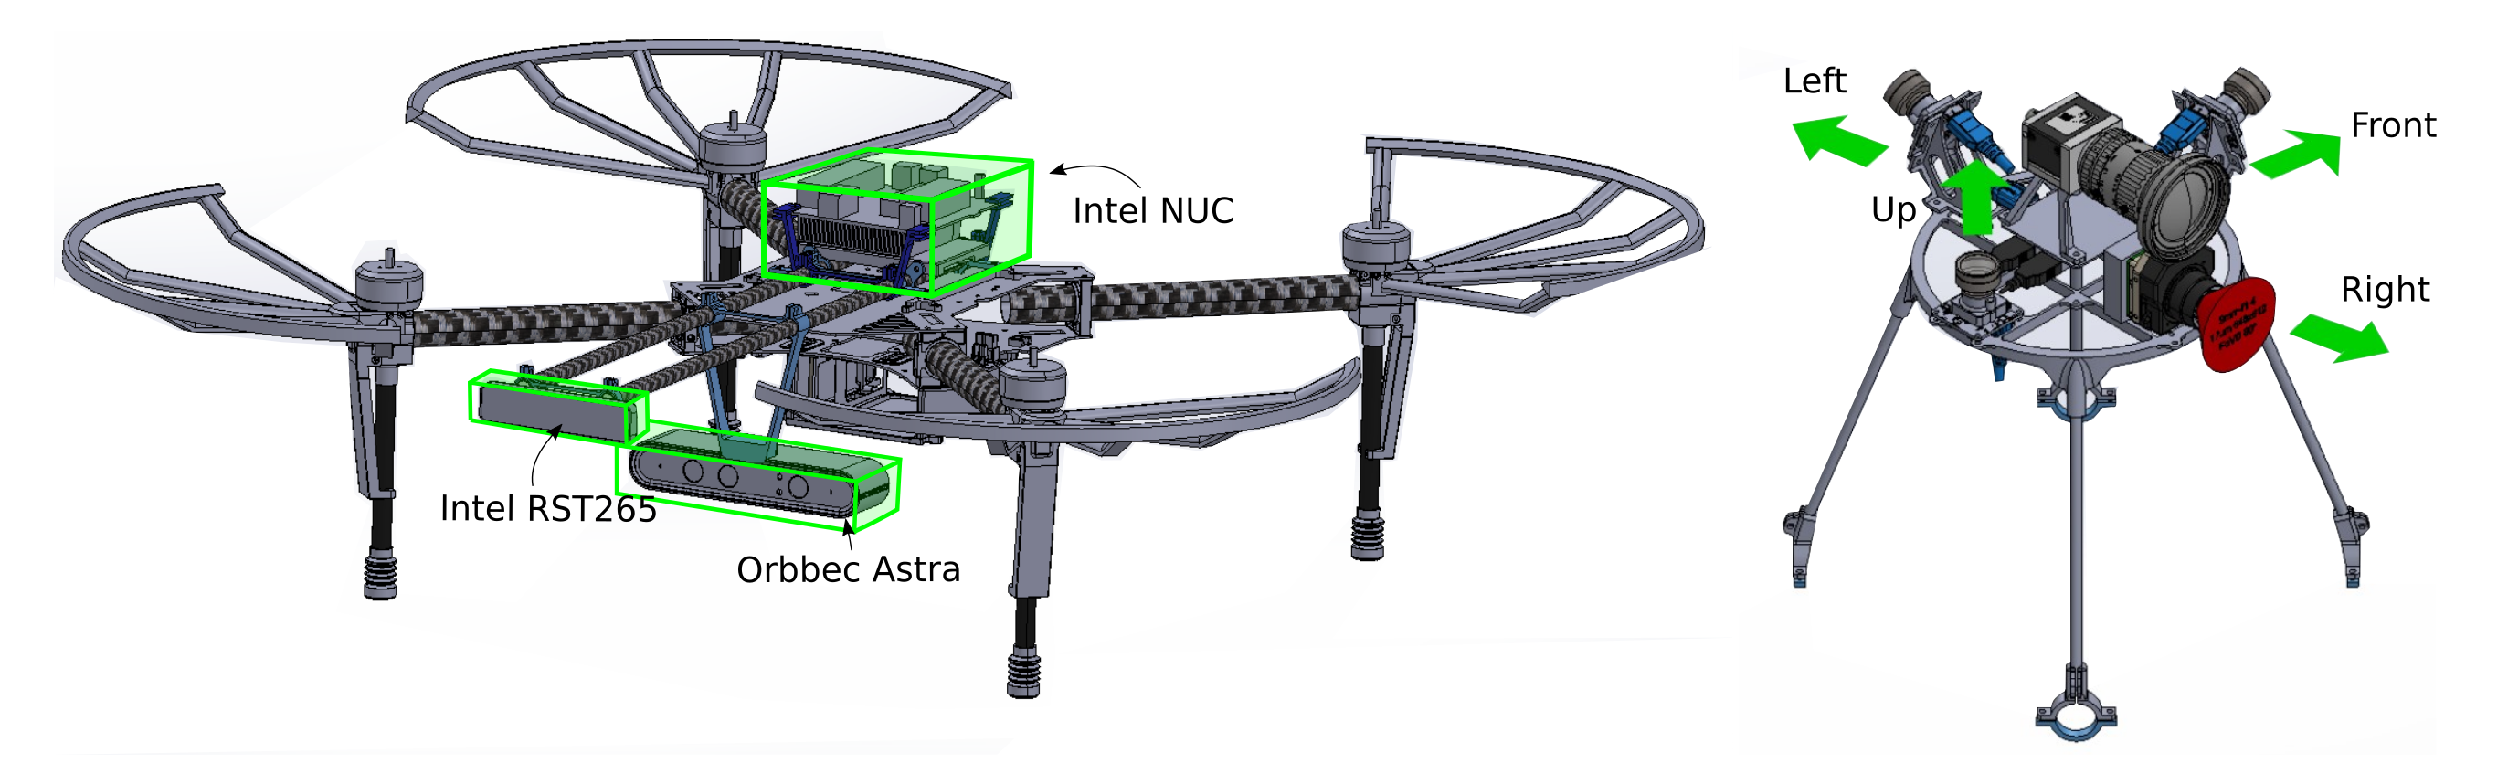
Figure 2.
Overview of the main sensors and software components composing the entire system.

Figure 3.
Visualization of the inspection sensors’ FOV, the voxels sensed by these sensors are marked in green and the explored tunnel wall in grey.
Figure 3.
Visualization of the inspection sensors’ FOV, the voxels sensed by these sensors are marked in green and the explored tunnel wall in grey.

Figure 4.
Instances of the tree expansion and execution using the guided sampling approach: (a) The tree is expanded from the current robot position in a uniform manner. (b) The samples have been evaluated, and the most informative trajectory is selected (marked in red). While the platform is moving within the environment, the tunnel walls are detected. (c) In an RH fashion, the robot moves to the first node of the best branch and samples again the search space. This time, a discrete probability distribution is applied. The weights of each discrete interval are computed based on the information gain of each sample falling in that interval.

Figure 5.
Inspection path planning overview. The tree is continuously expanded and evaluated until the robot reaches its current goal position. Then, the trajectory to the next best tree node adjacent to the robot’s position is commanded, and the tree is updated. All modules can access and are aware of the state of the tree.

Figure 6.
Inside (Left) and outside (Right) view of the simulated tunnel environment.

Figure 7.
Simulation experiment results for the three different values of . For each simulation scenario: (a,d,g) number of voxels sensed along the inspection path for the three methods compared, (b,e,h) mean length and standard deviation of the inspection trajectory, (c,f,i) mean distance distribution of all the voxels observed during the inspection. These results correspond to 10 simulation runs for each experiment.

Figure 8.
Example of executed inspection trajectories for each method in the simulated tunnel environment. Sensed voxels are marked in green. (a) Wall-following trajectory. (b) TSDF Informed RRT* [30]. (c) Proposed method.
Figure 8.
Example of executed inspection trajectories for each method in the simulated tunnel environment. Sensed voxels are marked in green. (a) Wall-following trajectory. (b) TSDF Informed RRT* [30]. (c) Proposed method.

Figure 9.
Single track railway tunnel used for the real experiments: (a) Tunnel central height, width and rail tracks height representation. (b) Aerial platform with the on-board illumination activated.
Figure 9.
Single track railway tunnel used for the real experiments: (a) Tunnel central height, width and rail tracks height representation. (b) Aerial platform with the on-board illumination activated.

Figure 10.
Instances of an autonomous inspection trajectory performed by the aerial vehicle: (a) Real-time map generation at take-off. (b) Environment sampling and movement to the first next-best-view location. The robot’s trajectory is marked in red. (c) Inspection trajectory following the tunnel wall while keeping a safe distance. (d) Return to take-off trajectory while inspecting the opposite wall.

Figure 11.
(a) Autonomous inspection path and the 3D-reconstructed voxel map together with a color indication of the distance at which each voxel has been sensed by the on-board inspection sensors. (b) Accumulated percentage of voxels detected at different observation distances.
Figure 11.
(a) Autonomous inspection path and the 3D-reconstructed voxel map together with a color indication of the distance at which each voxel has been sensed by the on-board inspection sensors. (b) Accumulated percentage of voxels detected at different observation distances.

Figure 12.
Example of images captured by all the inspection payload sensors together with a 3rd-person view of the aerial platform flying inside the railway tunnel.
Figure 12.
Example of images captured by all the inspection payload sensors together with a 3rd-person view of the aerial platform flying inside the railway tunnel.

Figure 13.
(a) Thin concrete crack visible on the tunnel wall marked in red. (b) Long ceiling concrete crack. (c) Water inlet areas marked in blue on the visual image. (d) Water inlet areas identified on the thermal image.
Figure 13.
(a) Thin concrete crack visible on the tunnel wall marked in red. (b) Long ceiling concrete crack. (c) Water inlet areas marked in blue on the visual image. (d) Water inlet areas identified on the thermal image.


Table 1.
Inspection payload sensor characteristics.
| Camera Model | |||
|---|---|---|---|
| Parameter | IDS UI-3251LE-M-GL | Basler acA4112-20 um | FLIR Tau 640 |
| Weight (g) | 32 | 344 | 70 |
| Sensor size (mm) | 7.2 × 5.4 | 14.1 × 10.3 | 10.8 × 8.1 |
| Resolution (px) | 1600 × 1200 | 4096 × 3000 | 640 × 480 |
| FoV (°) | 84 H × 68 V | 83 H × 65 V | 32 H × 26 V |
| Focal length (mm) | 4 | 8 | 19 |
| GSD @ 2 m (mm) | 2.26 | 0.86 | 1.78 |
| Orientation | Front, Left and Up | Right | Right |
Table 2.
First order model parameters for each axis.
| Roll | Pitch | Yaw-Rate | Vertical Velocity | |
|---|---|---|---|---|
| Gain k (-) | 1.097 | 0.715 | 0.988 | 0.756 |
| Time constant () | 0.144 | 0.088 | 0.172 | 0.184 |
Table 3.
Parameters used throughout the simulation experiments.
| Common Parameters | |
|---|---|
| Max. velocity | 2 |
| Max. acceleration | 1 |
| Max. yaw rate | 1.6 |
| Collision radius | 1.0 |
| Depth camera range | 6.0 |
| Depth camera FOV | 60° H × 49.5° V |
| Voxel size | 0.2 |
| RRT* parameters | |
| Max. sample distance | 4 |
| Min. sample distance | 1 |
| TSDF-based Informed RRT* method [30] | |
| Minimum impact factor | 0.01 |
| Frontier voxel weight | 1.0 |
| New voxel weight | 1.5 |
| Our proposed inspection method | |
| New voxel sensed weight () | 1.0 |
| Cost assigned to trajectory length () | 1.0 |
| Discrete probability distribution nr. intervals (I) | 50 |
| High-gain sample weight () | 1.0 |
| Reset probability distribution threshold () | 500 |
Table 4.
Wall-following trajectory parameters for the three different scenarios.
| Scenario I | Scenario II | Scenario III | |
|---|---|---|---|
| Distance to wall () | 1.12 | 1.87 | 2.62 |
| Height () | 5 | 4.5 | 4.5 |
Table 5.
Tunnel exploration percentage for all methods and scenarios.
| Method | Scenario I | Scenario II | Scenario III |
|---|---|---|---|
| Wall-following trajectory | 29.4% | 60% | 72.9% |
| TSDF Informed RRT* | 94% ± 3.1% | ||
| Ours | 77.7% ± 4.7% | 89% ± 8.1% | 94% ± 4.3% |
Table 6.
Real measurement and error corresponding to the two reference measures taken of the tunnel wall. The distance from which the image was captured, as well as the computed GSD, for the image shown in Figure 13a is also shown.
Table 6.
Real measurement and error corresponding to the two reference measures taken of the tunnel wall. The distance from which the image was captured, as well as the computed GSD, for the image shown in Figure 13a is also shown.
| Element | (m) | GSD (mm) | Real Measure (m) | Error (%) |
|---|---|---|---|---|
| (1) | 2.52 | 1.084 | 1.5 | 2.0 |
| (2) | 0.8 | 1.65 |
Publisher’s Note: MDPI stays neutral with regard to jurisdictional claims in published maps and institutional affiliations. |
© 2022 by the authors. Licensee MDPI, Basel, Switzerland. This article is an open access article distributed under the terms and conditions of the Creative Commons Attribution (CC BY) license (https://creativecommons.org/licenses/by/4.0/).
Share and Cite
MDPI and ACS Style
Bendris, B.; Cayero Becerra, J. Design and Experimental Evaluation of an Aerial Solution for Visual Inspection of Tunnel-like Infrastructures. Remote Sens. 2022, 14, 195. https://doi.org/10.3390/rs14010195
AMA Style
Bendris B, Cayero Becerra J. Design and Experimental Evaluation of an Aerial Solution for Visual Inspection of Tunnel-like Infrastructures. Remote Sensing. 2022; 14(1):195. https://doi.org/10.3390/rs14010195
Chicago/Turabian StyleBendris, Bianca, and Julián Cayero Becerra. 2022. "Design and Experimental Evaluation of an Aerial Solution for Visual Inspection of Tunnel-like Infrastructures" Remote Sensing 14, no. 1: 195. https://doi.org/10.3390/rs14010195
Note that from the first issue of 2016, this journal uses article numbers instead of page numbers. See further details here.