Worldwide Evaluation of Ozone Radiative Forcing in the UV-B Range between 1979 and 2014


1
Grupo de Óptica Atmosférica, Universidad de Valladolid, Paseo Belén 7, CP 47011 Valladolid, Spain
2
Departamento de Física, Universidad de Extremadura, CP 06006 Badajoz, Spain
3
Instituto Universitario de Investigación del Agua, Cambio Climático y Sostenibilidad (IACYS), Universidad de Extremadura, CP 06006 Badajoz, Spain
*
Author to whom correspondence should be addressed.
Remote Sens. 2020, 12(3), 436; https://doi.org/10.3390/rs12030436
Submission received: 5 December 2019
/
Revised: 22 January 2020
/
Accepted: 28 January 2020
/
Published: 29 January 2020
(This article belongs to the Special Issue Remote Sensing of Atmospheric Components and Water Vapor)
Abstract
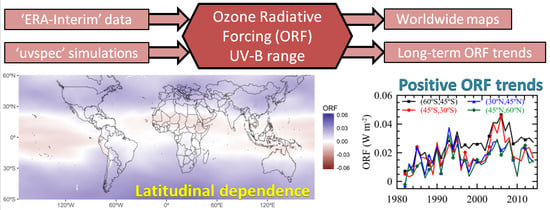
:Ultraviolet (UV) radiation plays a key role in different planetary mechanisms, thus necessitating a worldwide analysis of this solar spectrum interval. This study offers a worldwide and long-term analysis of ozone radiative forcing (ORF) in the UV-B range between 1979 and 2014. The method uses monthly total ozone column (TOC) values obtained from the ERA-Interim reanalysis data collection and radiative transfer simulations. A global mean ORF of 0.011 Wm−2 is obtained, with marked differences between mid-latitude and tropical areas. The mid-latitude belts in the Northern and Southern Hemispheres exhibit the following statistically significant ORF trends between 1982 and 2014 with respect to pre-1980 values: 0.007 Wm−2 per decade in the 60–45°S belt and around 0.004 Wm−2 per decade in the 45–30°S and 45–60°N belts. The increase observed in the net UV-B radiation levels at the troposphere might have relevant photochemical effects that impact climate change.
1. Introduction
The evolution of the atmospheric ozone layer over the last few decades has been analysed in depth because of the key role it plays in planetary climate change [1,2] as well as the shortwave and longwave radiative budget [3]. Ozone radiative forcing (ORF) is defined as the change in net radiative flux at the tropopause caused by ozone changes throughout the atmosphere [4]. The small spectral region between 280 and 320 nm (UV-B range) represents less than 2% of the entire solar extraterrestrial spectrum (280–3000 nm), but it is responsible for a significant proportion (~13%) of the shortwave ORF [5] caused by strong absorption in the Hartley band. Furthermore, UV-B radiation changes may affect tropospheric and stratospheric dynamics (e.g., planetary wave propagation) and have relevant implications such as the variation in the Arctic Oscillation pattern [6]. Additionally, UV-B variations related to ozone changes can induce substantial effects in tropospheric chemistry (e.g., a decrease in CH4 and CO growth rates), thus affecting the tropospheric radiative budget [7,8].
In this framework, the present study analyses worldwide ORF in the UV-B range over the last three decades (1979–2014) from radiative transfer simulations using the global database of total ozone column (TOC) provided by ERA-Interim reanalysis project [9] as input. Although several works have already evaluated shortwave ORF from the late 1970s onward [4,10,11,12,13], the present study should be considered as complementary since it focuses on the UV-B range that has not been evaluated globally in detail up to now. This article is thus expected to improve current understanding of the radiative effects of worldwide ozone changes and have potential implications in different fields such as atmospheric chemistry, global radiative budget, and photobiology.
2. Materials and Methods
The TOC data used in this study were obtained from the ERA-Interim reanalysis provided by the European Centre for Medium-Range Weather Forecasts (ECMWF) between 1979 and 2014. A comprehensive description of this data collection was performed by Dee et al. [9]. Daily and monthly TOC values were obtained by averaging the 6 h data in a fixed grid of 1.5°. The reliability of this collection has been evidenced by such authors as Dragani [14], who obtained a deviation of ±5 Dobson units (DUs) from the reference ground-based values (about ±3%).
The net (down minus up) UV-B fluxes at the tropopause were simulated under cloud- and aerosol-free conditions by the uvspec model included in the libRadtran 1.7 software package [15]. The accuracy of UV simulations when using this model has been shown to yield excellent results in both cloud-free and overcast conditions [16]. Several lookup tables (LUTs) have been created with this model in order to easily obtain hourly net UV-B values as a function of geographical position and atmospheric parameters. The geographical coordinates (latitude/longitude) determine the use of different atmospheric models (tropical, mid-latitudes summer/winter, subarctic summer/winter, and U.S. Standard) [15] with different vertical profiles of temperature, pressure, and density of gases used as input in the simulations. One LUT is evaluated for each of these six atmospheric models. The net UV-B levels, outputs of the simulations, were obtained at the corresponding tropopause height of each atmospheric profile used in the simulations. Tropopause height is calculated as the lowest height at which the temperature lapse rate reaches 2 K km−1. In each LUT, solar zenith angle (SZA) values ranged between 0° and 90° at 2° steps, while TOC values ranged from 100 to 500 DU at 20 DU steps. Furthermore, 18 surface albedo types were selected to cover all of the types over the Earth using the classification provided by the International Geosphere Biosphere Programme (IGBP). Other general inputs were extraterrestrial irradiance taken from Gueymard [17], DIScrete ORdinate Radiative Transfer solver version ’c’ used with eight streams (see ftp://climate1.gsfc.nasa.gov/wiscombe/Multiple_Scatt/), and cloud- and aerosol-free conditions were considered in all simulations. Hence, monthly UV-B radiation values were computed with the six LUTs as follows: firstly, the right atmospheric model was selected taking into account the geographical coordinates, which also determine the surface albedo value attributed by an IGBP map; secondly, in order to reduce the required computation time, the monthly mean of TOC from ERA-Interim reanalysis for each grid point was considered; and finally, all of the hourly average SZAs for an “average day” of the month considered were used in the calculations. Further details about the options used in the simulations are described by the libRadtran user’s guide (www.libradtran.org/doc/libRadtran.pdf).
Ozone radiative forcing is evaluated as the difference of net UV-B simulations at the tropopause level in all the grid points of the reanalysis data for two different time periods, assuming all atmospheric constituents to be invariable except the TOC. In order to minimize the impact of possible extreme TOC data in the years selected, the average of the UV-B simulated values corresponding to three consecutive years was used rather than just one particular year. Three different periods, which included one leap year, were selected in the calculations—per1: 1979–1981 (background period), per2: 1994–1996 (middle period), and per3: 2012–2014 (present-day period). It can be assumed that the ozone layer during the background period was only weakly affected by ozone-depleting substances, while the middle period was selected in order to analyse the well-documented stabilization and incipient recovery of TOC values after the mid-1990s [18]. The ORF was evaluated in each pair of periods following the scheme
ORF2-1 = (UVnet)per2 − (UVnet)per1,
ORF3-2 = (UVnet)per3 − (UVnet)per2,
ORF3-1 = (UVnet)per3 − (UVnet)per1
To better understand the changes in UV levels in the different periods, the relative changes between these periods were also evaluated following ((UVnet)X − (UVnet)Y)/(UVnet)Y, where X and Y are the corresponding per1, per2, and per3 in the ORF evaluations. These results are presented in the Supplementary Material (Figure S1).
3. Results
3.1. Ozone Radiative Forcing in Three Different Periods
The three periods analysed in this paper distinguished between two different evolutions. Figure 1a shows the radiative changes observed between the background and middle periods (ORF2-1, Equation (1)). The entire grid showed positive ORF2-1 values below 0.06 Wm−2 with a mean (± one standard deviation) global value of 0.017 ± 0.008 Wm−2, indicating a clear decline in TOC values worldwide until the mid-1990s (i.e., less ozone implies greater UV-B radiation levels reaching the troposphere/surface system). Some areas were highlighted by a slightly greater change in ozone forcing. For instance, the Antarctica region showed the strongest change, concurring with the ozone depletion observed in this area [19]. This change implies that net UV-B fluxes at the tropopause height increased by up to 15–20% in this area (see Figure S1a). Other continental and ocean areas, such as Europe–Atlantic–US, Asia, South America, and Africa, also exhibited notable changes in the ORF. No (or only a weak) long-term decline in TOC around the equatorial region was observed in accordance with the discussion of the halogen-induced ozone loss trends by Shepherd et al. [20]. These ORF changes were due to increases in net UV-B fluxes at the tropopause height of up to 10% in some areas of the world compared to those values in the background period.
This situation was reverted when the ORF was determined between per2 (middle) and per3 (present-day) periods (ORF3-2, Equation (2)). Figure 1b shows that almost the whole planet experienced negative ORF values, with a mean global value of −0.005 ± 0.006 W m−2. Hence, net UV-B radiation levels at the tropopause were lower in the 2010s than in the 1990s. This decrease presents “minimum” values of −5% in Antarctica (see Figure S1b). It should be noted that the Southern Hemisphere showed weaker, even positive, ORF values between 30° and 60°S. Hence, ozone recovery was by no means spatially uniform, and there were regions under the influence of a persistent slight depletion of the ozone column (with a slight increase in UV levels at the tropopause of below 5%). Overall, the observed trends in TOC since 1996 were stable in different latitudinal belts [21] and were in line with the findings of ORF3-2 presented in this study.
The net radiative change between the background and present-day periods, given by Equation (3) (ORF3-1), exhibited a clear latitudinal pattern (see Figure 1c). The equatorial region was identified by the observation of negative ORF values below 0.03 Wm−2 in absolute terms. Hence, this area showed a lower impact of the ozone depletion phenomenon, even with a small over-recovery of the ozone layer compared to pre-1980 values, and leading to a slight decrease in net UV-B radiation levels at the tropopause. In contrast, the area beyond the Tropics of Cancer and Capricorn has evidenced a decline in atmospheric ozone and the consequent increase in UV-B radiation levels, exceeding 0.03 Wm−2 in certain areas. The relative increase in net UV-B levels at the tropopause can present values of >10% in some areas of the world, although again the maximum increase, around 15–20%, was observed in Antarctica (see Figure S1c). Hence, global mean ORF3-1 showed a value of 0.011 ± 0.0012 Wm−2 as a result of the balance between positive and negative contributions associated with this latitudinal behaviour.
3.2. Long-Term Trends of Ozone Radiative Forcing
For a better understanding of how ORF has evolved over the last three decades, the ORF was also obtained as the difference between each particular year from 1982 and the background period (1979–1981, per1). Several latitudinal belts in the Northern and Southern Hemispheres were averaged each 15° to obtain the ORF temporal trend between 1982 and 2014. Figure 2 shows the yearly ORF values in the 60–45°S, 45–30°S, 30–45°N, and 45–60°N areas. The results for the four belts in the equatorial region (30°N–30°S) were not statistically significant (large p values) and were not shown in this study for the sake of brevity. Figure 2 highlights the similarities and discrepancies over the planet as a whole. The ORF evolution in the first 15 years seemed to be similar, with some maxima and minima occurring at the same time (e.g., 1985, 1990, 1991, 1993, and 1994). Global phenomena affecting the whole planet may lie behind this behaviour. Bodeker et al. [22] described the TOC anomaly in 1985 observed in Southern Hemisphere sites as being due to the influence of the quasi-biennial oscillation (QBO), which affected transport mechanisms. This dynamic effect was supported in this study with ORF values above 0.02 Wm−2, although it was also visible in the 30–45°N belt. However, this was not in line with the increase in mean ozone mass for this year observed by Bodeker et al. [23] over a wider northern area (between 30°N and 60°N). The dynamic features of 1985 were also found in 1997 and 2006 [22]. These latter years presented a clearer separation between northern and southern areas when ORF values were analysed.
As regards the Northern Hemisphere, the cold winters of 1999, 2002, and 2004 were characterized by Arctic ozone losses [24,25,26]. These years presented an increase in ORF values compared to the previous years, which was visible in the 30–60°N area.
Stratospheric aerosols injected by volcanic eruptions presented clear fingerprints in the TOC evolution [27]. The effects, caused by the large amount of sulphate aerosols in the atmosphere, can last several years after the eruption and enhance the difference between the Northern and Southern Hemispheres. Previous studies analysing the impact of the two major eruptions (El Chichón, 1982, in Mexico; Mt. Pinatubo, 1991, in the Philippines) reported a stratospheric ozone decline in the Northern Hemisphere [28,29,30,31] and also in the troposphere [32], whereas the Southern Hemisphere showed no ozone deficit [33]. Ozone loss can, thus, be counteracted by enhanced ozone global transport [34,35]. The fingerprints of volcanic eruptions were also evident in ORF evolution, albeit for the years following the volcanic eruptions, which was in line with the TOC changes after these eruptions [30,31,36]. Hence, the increased ORF values in the 1982-1983 and 1991–1993 periods at all latitudes, including tropical regions, can be understood by the ozone-induced effects of the El Chichón and Pinatubo eruptions.
The year 2010 was notable for an ORF value close to zero for middle and high latitudes in the Northern Hemisphere (i.e., large TOC similar to the background period). This particular year exhibited the coexistence of a persistent negative phase of the North Atlantic Oscillation (NAO) and an easterly wind-shear phase of the QBO [37,38], which caused large TOC values in the Northern Hemisphere and a large number of events with high TOC values (minihighs) at many ground-based sites [39]. These conditions led to ORF values below 0.005 Wm−2 in the northern middle and high latitudes. The year 2011 exhibited a different pattern, with weak stratospheric wave activity and a strong, positive phase of the Arctic Oscillation [40,41], which caused lower TOC levels than in 2010 [42]. This effect led to an increase in ORF values up to 0.02 Wm−2 in the 30–60°N belt in 2011.
Other differences were also observed between Northern and Southern Hemispheres. For instance, in 1987, northern areas exhibited greater ORF values than southern areas (i.e., a greater decline in TOC values). After the mid-1990s, the differences between the two hemispheres intensified, and ORF values for the southern mid-latitudes (60–30°S) were, in general, greater than those for the northern belts. In particular, the highest ORF values were recorded between 2004 and 2009, with values around 0.04 Wm−2 for the Southern Hemisphere. In the period 1996–2002, the 60–45°S area still displayed an ORF of over 0.02 Wm−2, while other parts of the globe presented ORF values around 0.01 Wm−2 since TOC values were close to the background period. For instance, the greatest stratospheric warming observed in the South Pole was in 2002 and caused higher TOC values during winter and spring [24], and this was noticeable in this study with the smallest ORF value (around 0.02 Wm−2) since 1991 for the 60–45°S belt.
Weak planetary wave activity led to a relatively colder stratosphere as well as one of the largest and deepest Antarctic ozone holes in 2006 [43]. This effect was visible in the ORF data with the maximum value (~0.045 Wm−2) for the Southern mid-latitudes (30–60°S) analysed in this study.
Long-term trends of yearly ORF values were evaluated with the Sen and Mann–Kendall tests [44,45]. The results are summarized in Table 1. As can be seen from Figure 2, the 60–45°S belt showed the greatest increase in ORF values, with a rate of 0.007 Wm−2 (27.4%) per decade (with a significance level of 100%). Positive rates were also obtained by models related to changes in tropospheric chemistry [46,47]. Rates of about 0.004 Wm−2 (22–26%) per decade were obtained for the other areas, with a similar ORF evolution being obtained over the last few decades. All the trends obtained for ORF were in line with the findings reported by Weber et al. [21] for total ozone in different latitudinal belts in the period 1979–2016. These authors also proved the contribution to ozone temporal rates of various factors such as solar cycle and QBO, among others. The increases in net UV-B radiation levels reaching the troposphere in middle and high latitudes of both hemispheres might have relevant photochemical effects on this layer, such as the acceleration of certain key photolysis rates [48], affecting its oxidation capacity and, consequently, with potential effects over the control of the removal processes of certain greenhouse gases, such as methane [7].
4. Conclusions
Radiation changes due to changes in ozone content were investigated in this study. Ozone radiative forcing for aerosol- and cloud-free conditions was evaluated worldwide considering a background period (1979–1981) as reference. Overall, the mid-latitude areas of both hemispheres showed a decrease in the ozone column from the background period to the present day, which sparked an increase in net UV-B radiation at the tropopause of between 0.03 and 0.06 Wm−2 for most areas. Tropical latitudes showed a different evolution, with a slight increase in TOC and consequent decrease in net UV-B radiation levels of up to −0.04 Wm−2. Hence, global mean ORF reached a value of 0.011 Wm−2. The impact of global scale phenomena affecting TOC values also controlled ORF changes on a year-to-year scale. The mid-latitude 30–45° and 45–60° belts in the Northern and Southern Hemispheres exhibited a positive ORF trend between 1982 and 2014, with the largest trend being 0.007 Wm−2 (27%) per decade for the 45–60°S belt. This value indicates the noncomplete recovery of TOC levels in this southern sector compared to pre-1980 values. In contrast, northern areas presented low ORF values (usually <0.02 Wm−2), indicating similar TOC values in the 2010s to those found in the 1979–1981 period, probably resulting from the successful implementation of the Montreal Protocol in 1989 and subsequent agreements, which limited the injection of chlorine and bromine compounds into the atmosphere. Further investigation is needed to determine the long-term UV solar radiation changes due to ozone under more real sky conditions, including the effects of clouds and aerosols.
Supplementary Materials
The following are available online at https://www.mdpi.com/2072-4292/12/3/436/s1, Figure S1: UV change (%): (a) ((UVnet)per2 − (UVnet)per1)/(UVnet)per1; (b) ((UVnet)per3 − (UVnet)per2)/(UVnet)per2; and (c) ((UVnet)per3 − UVnet)per1)/(UVnet)per1. The periods are per1: 1979–1981 (background period), per2: 1994–1996 (middle period), and per3: 2012–2014 (present-day period).
Author Contributions
D.M.: conceptualization, software, analysis, writing; M.A.: conceptualization, methodology, analysis, writing. All authors have read and agreed to the published version of the manuscript.
Funding
This research was funded by the Spanish Ministry of Science, Innovation and Universities: ePOLAAR project, grant number RTI2018-097864-B-I00.
Acknowledgments
ERA-Interim data were provided by the European Centre for Medium-Range Weather Forecasts (ECMWF).
Conflicts of Interest
The authors declare no conflict of interest.
References
- Solomon, S. Stratospheric ozone depletion: A review of concepts and history. Rev. Geophys. 1999, 37, 275–316. [Google Scholar] [CrossRef]
- Pienitz, R.; Vincent, W.F. Effect of climate change relative to ozone depletion on UV exposure in subarctic lakes. Nature 2000, 404, 484–487. [Google Scholar] [CrossRef] [PubMed]
- McFarlane, N. Connections between stratospheric ozone and climate: Radiative forcing, climate variability, and change. Atmos. Ocean 2008, 46, 139–158. [Google Scholar] [CrossRef] [Green Version]
- Ramaswamy, V.; Boucher, O.; Haigh, J.; Hauglustaine, D.; Haywood, J.; Myhre, G.; Nakajima, T.; Shi, G.Y.; Solomon, S. Radiative forcing of climate change. In Climate Change 2001: The Scientific Basis, Contribution of Working Group I to the Third Assessment Report of the Intergovernmental Panel on Climate Change (IPCC); Houghton, J.T., Ding, Y., Griggs, D.J., Noguer, M., van der Linden, P.J., Da, X., Maskell, K., MJohnson, C.A., Eds.; Cambridge University Press: Cambridge, UK; New York, NY, USA, 2001. [Google Scholar]
- Antón, M.; Mateos, D. Shortwave radiative forcing due to long-term changes of total ozone column over the Iberian Peninsula. Atmos. Environ. 2013, 81, 532–537. [Google Scholar] [CrossRef]
- Shindell, D.T.; Schmidt, G.A.; Miller, R.L.; Rind, D. Northern Hemisphere winter climate response to greenhouse gas, ozone, solar, and volcanic forcing. J. Geophys. Res. Atmos. 2001, 106, 7193–7210. [Google Scholar] [CrossRef] [Green Version]
- Bekki, S.K.; Law, K.; Pyle, J. Effect of ozone depletion on atmospheric methane and carbon monoxide concentrations. Nature 1994, 371, 595–597. [Google Scholar] [CrossRef]
- Tourpali, K.; Schuurmans, C.J.E.; van Dorland, R.; Steil, B.; Brühl, C. Stratospheric and tropospheric response to enhanced solar UV radiation: A model study. Geophys. Res. Lett. 2003, 30, 1–4. [Google Scholar] [CrossRef] [Green Version]
- Dee, D.P.; Uppala, S.M.; Simmons, A.J.; Berrisford, P.; Poli, P.; Kobayashi, S.; Andrae, U.; Balmaseda, M.A.; Balsamo, G.; Bauer, P.; et al. The ERA-Interim reanalysis: configuration and performance of the data assimilation system. Q. J. R. Meteorol. Soc. 2011, 137, 553–597. [Google Scholar] [CrossRef]
- Kiehl, J.T.; Schneider, T.L.; Portmann, R.W.; Solomon, S. Climate forcing due to tropospheric and stratospheric ozone. J. Geophys. Res. Atmos. 1999, 104, 31239–31254. [Google Scholar] [CrossRef]
- Gauss, M.; Myhre, G.; Isaksen, I.S.A.; Grewe, V.; Pitari, G.; Wild, O.; Collins, W.J.; Dentener, F.J.; Ellingsen, K.; Gohar, L.K.; et al. Radiative forcing since preindustrial times due to ozone change in the troposphere and the lower stratosphere. Atmos. Chem. Phys. 2006, 6, 575–599. [Google Scholar] [CrossRef] [Green Version]
- Forster, P.; Ramaswamy, V.; Artaxo, P.M.; Berntsen, T.; Betts, R.; Fahey, D.W.; Haywood, J.; Lean, J.; Lowe, D.C.; Myhre, G.; et al. Changes in atmospheric constituents and in radiative forcing. In Climate Change 2007: The Physical Science Basis. Contribution of Working Group I to the Fourth Assessment Report of the Intergovernmental Panel on Climate Change; Solomon, S., Qin, D., Manning, M., Chen, Z., Marquis, M., Averyt, K.B., Tignor, M., Miller, H.L., Eds.; Cambridge University Press: Cambridge, UK; New York, NY, USA, 2007. [Google Scholar]
- Cionni, I.; Eyring, V.; Lamarque, J.F.; Randel, W.J.; Stevenson, D.S.; Wu, F.; Bodeker, G.E.; Shepherd, T.G.; Shindell, D.T.; Waugh, D.W. Ozone database in support of CMIP5 simulations: Results and corresponding radiative forcing. Atmos. Chem. Phys. 2011, 11, 11267–11292. [Google Scholar] [CrossRef] [Green Version]
- Dragini, R. On the quality of the era-interim ozone reanalyses: Comparisons with satellite data. Q. J. R. Meteorol. Soc. 2011, 137, 1312–1326. [Google Scholar] [CrossRef]
- Mayer, B.; Kylling, A. The libRadtran software package for radiative transfer calculations—Description and examples of use. Atmos. Chem. Phys. 2005, 5, 1855–1877. [Google Scholar] [CrossRef] [Green Version]
- Mateos, D.; Pace, G.; Meloni, D.; Bilbao, J.; di Sarra, A.; de Miguel, A.; Casasanta, G.; Min, Q. Observed influence of liquid cloud microphysical properties on ultraviolet surface radiation. J. Geophys. Res. Atmos. 2014, 119, 2429–2440. [Google Scholar] [CrossRef]
- Gueymard, C.A. The sun’s total and spectral irradiance for solar energy applications and solar radiation models. Sol. Energy 2004, 76, 423–453. [Google Scholar] [CrossRef]
- Weatherhead, E.C.; Andersen, S.B. The search for signs of recovery of the ozone layer. Nature 2006, 441, 39–45. [Google Scholar] [CrossRef]
- Solomon, S.; Portmann, R.W.; Sasaki, T.; Hofmann, D.J.; Thompson, D.W.J. Four decades of ozonesonde measurements over Antarctica. J. Geophys. Res. Atmos. 2005, 110, D21311. [Google Scholar] [CrossRef] [Green Version]
- Shepherd, T.G.; Plummer, D.A.; Scinocca, J.F.; Hegglin, M.I.; Fioletov, V.E.; Reader, M.C.; Remsberg, E.; von Clarmann, T.; Wang, H.J. Reconciliation of halogen-induced ozone loss with the total-column ozone record. Nat. Geosci. 2014, 7, 443–449. [Google Scholar] [CrossRef] [Green Version]
- Weber, M.; Coldewey-Egbers, M.; Fioletov, V.E.; Frith, S.M.; Wild, J.D.; Burrows, J.P.; Long, C.S.; Loyola, D. Total ozone trends from 1979 to 2016 derived from five merged observational datasets – the emergence into ozone recovery. Atmos. Chem. Phys. 2018, 18, 2097–2117. [Google Scholar] [CrossRef] [Green Version]
- Bodeker, G.E.; Garny, H.; Smale, D.; Dameris, M.; Deckert, R. The 1985 Southern Hemisphere mid-latitude total column ozone anomaly. Atmos. Chem. Phys. 2007, 7, 5625–5637. [Google Scholar] [CrossRef] [Green Version]
- Bodeker, G.E.; Connor, B.J.; Liley, J.B.; Matthews, W.A. The global mass of ozone: 1978–1998. Geophys. Res. Lett. 2001, 28, 2819–2822. [Google Scholar] [CrossRef]
- Sinnhuber, B.M.; Weber, M.; Amankwah, A.; Burrows, J.P. Total Ozone during the Unusual Antarctic Winter of 2002. Geophys. Res. Lett. 2003, 30, 1580–1584. [Google Scholar] [CrossRef] [Green Version]
- Feng, W.; Chipperfield, M.P.; Davies, S.; Sen, B.; Toon, G.; Blavier, J.F.; Webster, C.R.; Volk, C.M.; Ulanosvky, A.; Ravegnani, F.; et al. Three-dimensional model study of the Arctic ozone loss in 2002/2003 and comparison with 1999/2000 and 2003/2004. Atmos. Chem. Phys. 2005, 5, 139–152. [Google Scholar] [CrossRef] [Green Version]
- Feng, W.; Chipperfield, M.P.; Davies, S.; von der Gathen, P.; Kyrö, E.; Volk, C.M.; Ulanovsky, A.; Belyaev, G. Large chemical ozone loss in 2004/2005 Arctic winter/spring. Geophys. Res. Lett. 2007, 34, L09803. [Google Scholar] [CrossRef]
- Hofmann, D.J.; Solomon, S. Ozone destruction through heterogeneous chemistry following the eruption of El Chichón. J. Geophys. Res. 1989, 94, 5029–5041. [Google Scholar] [CrossRef]
- Randel, W.J.; Wu, F.; Russell, J.M., III; Waters, J.W.; Froidevaux, L. Ozone and temperature changes in the stratosphere following the eruption of Mount Pinatubo. J. Geophys. Res. 1995, 100, 16753–16764. [Google Scholar] [CrossRef]
- Solomon, S.; Portmann, R.W.; Garcia, R.R.; Thomason, L.W.; Poole, L.R.; McCormick, M.P. The role of aerosol variations in anthropogenic ozone depletion at northern midlatitudes. J. Geophys. Res. Atmos. 1996, 101, 6713–6727. [Google Scholar] [CrossRef]
- Chehade, W.; Weber, M.; Burrows, J.P. Total ozone trends and variability during 1979–2012 from merged data sets of various satellites. Atmos. Chem. Phys. 2014, 14, 7059–7074. [Google Scholar] [CrossRef] [Green Version]
- Román, R.; Bilbao, J.; de Miguel, A. Uncertainty of different atmospheric ozone retrievals and its effect on temporal trends and radiative transfer simulations in the Iberian Peninsula. J. Geophys. Res. Atmos. 2014, 119, 4690–4708. [Google Scholar] [CrossRef]
- Tang, Q.; Hess, P.G.; Brown-Steiner, B.; Kinnison, D.E. Tropospheric ozone decrease due to the MountPinatubo eruption: Reduced stratospheric influx. Geophys. Res. Lett. 2013, 40, 5553–5558. [Google Scholar] [CrossRef]
- Fioletov, V.E.; Bodeker, G.E.; Miller, A.J.; McPeters, R.D.; Stolarski, R. Global and zonal total ozone variations estimated from ground-based and satellite measurements: 1964–2000. J. Geophys. Res. 2002, 107, 4647. [Google Scholar] [CrossRef] [Green Version]
- Schnadt Poberaj, C.; Staehelin, J.; Brunner, D. Missing stratospheric ozone decrease at Southern Hemisphere middle latitudes after Mt. Pinatubo: A dynamical perspective. J. Atmos. Sci. 2011, 68, 1922–1945. [Google Scholar] [CrossRef]
- Aquila, V.; Oman, L.D.; Stolarski, R.; Douglass, A.R.; Newman, P.A. The Response of Ozone and Nitrogen Dioxide to the Eruption of Mt. Pinatubo at Southern and Northern Midlatitudes. J. Atmos. Sci. 2013, 70, 894–900. [Google Scholar] [CrossRef]
- Ward, P.L. The effects of volcano-induced ozone depletion on short-lived climate forcing in the Arctic. In Proceedings of the 2012 Fall Meeting, AGU, San Francisco, CA, USA, 3–7 December 2012. Abstract C53C-0852. [Google Scholar]
- Steinbrecht, W.; Köhler, U.; Claude, H.; Weber, M.; Burrows, J.P.; van der A, R.J. Very high ozone columns at northern mid-latitudes in 2010. Geophys. Res. Lett. 2011, 38, L06803. [Google Scholar] [CrossRef]
- Ossó, A.; Sola, Y.; Bech, J.; Lorente, J. Evidence for the influence of the North Atlantic Oscillation on the total ozone column at northern low latitudes and midlatitudes during winter and summer seasons. J. Geophys. Res. 2011, 116, D24122. [Google Scholar] [CrossRef] [Green Version]
- Mateos, D.; Antón, M.; Sáenz, G.; Bañón, M.; Vilaplana, J.M.; García, J.A. Evaluation of extreme ozone events over the Iberian Peninsula from Brewer spectrophotometers in the 2000s. Atmos. Res. 2016, 169, 248–254. [Google Scholar] [CrossRef]
- Arnone, E.; Castelli, E.; Papandrea, E.; Carlotti, M.; Dinelli, M.M. Extreme ozone depletion in the 2010–2011 Arctic winter stratosphere as observed by MIPAS/ENVISAT using a 2-D tomographic approach. Atmos. Chem. Phys. 2012, 12, 9149–9165. [Google Scholar] [CrossRef] [Green Version]
- Adams, C.; Strong, K.; Zhao, X.; Bassford, M.R.; Chipperfield, M.P.; Daffer, W.; Drummond, J.R.; Farahani, E.E.; Feng, W.; Fraser, A.; et al. Severe 2011 ozone depletion assessed with 11 years of ozone, NO2, and OClO measurements at 80°N. Geophys. Res. Lett. 2012, 39, L05806. [Google Scholar] [CrossRef] [Green Version]
- Krzyscin, J.W. Extreme ozone loss over the Northern Hemisphere high latitudes in the early 2011. Tellus B Chem. Phys. Meteorol. 2012, 64, 17347. [Google Scholar] [CrossRef]
- Cracknell, A.P.; Varotsos, C.A. The Antarctic 2006 ozone hole. Int. J. Remote Sens. 2007, 28, 1–2. [Google Scholar] [CrossRef]
- Sen, P.K. Estimates of the Regression Coefficient Based on Kendall’s Tau. J. Am. Stat. Assoc. 1968, 63, 1379–1389. [Google Scholar] [CrossRef]
- Yue, S.; Pilon, P.; Phinney, B.; Cavadias, C. The influence of autocorrelation on the ability to detect trend in hydrological series. Hydrol. Process. 2002, 16, 1807–1829. [Google Scholar] [CrossRef]
- Newsome, B.; Evans, M. Impact of uncertainties in inorganic chemical rate constants on tropospheric composition and ozone radiative forcing. Atmos. Chem. Phys. 2017, 17, 14333–14352. [Google Scholar] [CrossRef] [Green Version]
- Myhre, G.; Aas, W.; Cherian, R.; Collins, W.; Faluvegi, G.; Flanner, M.; Forster, P.; Hodnebrog, Ø.; Klimont, Z.; Lund, M.T.; et al. Multi-model simulations of aerosol and ozone radiative forcing due to anthropogenic emission changes during the period 1990–2015. Atmos. Chem. Phys. 2017, 17, 2709–2720. [Google Scholar] [CrossRef] [Green Version]
- Tang, X.; Madronich, S.; Wallington, T.; Calamari, D. Changes in tropospheric composition and air quality. J. Photochem. Photobiol. B Biol. 1998, 46, 83–95. [Google Scholar] [CrossRef]
Figure 1.
Ozone radiative forcing (ORF; in W m−2) for three different periods: (a) ORF2-1 between 1979–1981 and 1994–1996, (b) ORF3-2 between 1994–1996 and 2012–2014, and (c) ORF3-1 between 1979–1981 and 2012–2014. See Equations (1)–(3).
Figure 1.
Ozone radiative forcing (ORF; in W m−2) for three different periods: (a) ORF2-1 between 1979–1981 and 1994–1996, (b) ORF3-2 between 1994–1996 and 2012–2014, and (c) ORF3-1 between 1979–1981 and 2012–2014. See Equations (1)–(3).

Figure 2.
Evolution of yearly ORF in the UV-B range at four latitudinal bands.


Table 1.
ORF trends between 1982 and 2014 (considering 1979–1981 as a reference) in four different latitudinal belts. Statistically significant trends are highlighted in bold.
Table 1.
ORF trends between 1982 and 2014 (considering 1979–1981 as a reference) in four different latitudinal belts. Statistically significant trends are highlighted in bold.
| Latitudinal Band | Trend (W m−2 per decade) | Relative Trend (% per decade) | p-Value | 95% Confidence Interval (W m−2 per decade) |
|---|---|---|---|---|
| 60–45°S | 0.0070 | 27.4% | <0.001 | [0.0040, 0.0100] |
| 45–30°S | 0.0043 | 22.6% | 0.026 | [0.0007, 0.0070] |
| 30–45°N | 0.0027 | 15.6% | 0.110 | [0.0005, 0.0064] |
| 45–60°N | 0.0041 | 26.6% | 0.011 | [0.0009, 0.0070] |
© 2020 by the authors. Licensee MDPI, Basel, Switzerland. This article is an open access article distributed under the terms and conditions of the Creative Commons Attribution (CC BY) license (http://creativecommons.org/licenses/by/4.0/).
Share and Cite
MDPI and ACS Style
Mateos, D.; Antón, M. Worldwide Evaluation of Ozone Radiative Forcing in the UV-B Range between 1979 and 2014. Remote Sens. 2020, 12, 436. https://doi.org/10.3390/rs12030436
AMA Style
Mateos D, Antón M. Worldwide Evaluation of Ozone Radiative Forcing in the UV-B Range between 1979 and 2014. Remote Sensing. 2020; 12(3):436. https://doi.org/10.3390/rs12030436
Chicago/Turabian StyleMateos, David, and Manuel Antón. 2020. "Worldwide Evaluation of Ozone Radiative Forcing in the UV-B Range between 1979 and 2014" Remote Sensing 12, no. 3: 436. https://doi.org/10.3390/rs12030436
Note that from the first issue of 2016, this journal uses article numbers instead of page numbers. See further details here.