Article

Spatial Structure, Short-temporal Variability, and Dynamical Features of Small River Plumes as Observed by Aerial Drones: Case Study of the Kodor and Bzyp River Plumes

1
Shirshov Institute of Oceanology, Russian Academy of Sciences, Nakhimovskiy prospect 36, 117997 Moscow, Russia
2
Moscow Institute of Physics and Technology, Institusky lane 9, 141701 Dolgoprudny, Russia
3
Marine Research Center at Lomonosov Moscow State University, Leninskie Gory 1, 119992 Moscow, Russia
4
Institute of Ecology, Academy of Sciences of Abkhazia, Krasnomayatskaya str. 67, 384900 Sukhum, Abkhazia
*
Author to whom correspondence should be addressed.
Remote Sens. 2020, 12(18), 3079; https://doi.org/10.3390/rs12183079
Submission received: 20 August 2020 / Revised: 17 September 2020 / Accepted: 17 September 2020 / Published: 20 September 2020
(This article belongs to the Special Issue Coastal Waters Monitoring Using Remote Sensing Technology)

Abstract

:
Quadcopters can continuously observe ocean surface with high spatial resolution from relatively low altitude, albeit with certain limitations of their usage. Remote sensing from quadcopters provides unprecedented ability to study small river plumes formed in the coastal sea. The main goal of the current work is to describe structure and temporal variability of small river plumes on small spatial and temporal scales, which are limitedly covered by previous studies. We analyze optical imagery and video records acquired by quadcopters and accompanied by synchronous in situ measurements and satellite observations within the Kodor and Bzyp plumes, which are located in the northeastern part of the Black Sea. We describe extremely rapid response of these river plume to energetic rotating coastal eddies. We reveal several types of internal waves within these river plumes, measure their spatial and dynamical characteristics, and identify mechanisms of their generation. We suggest a new mechanism of formation of undulate fronts between small river plumes and ambient sea, which induces energetic lateral mixing across these fronts. The results reported in this study are addressed for the first time as previous related works were mainly limited by low spatial and/or temporal resolution of in situ measurements and satellite imagery.

Graphical Abstract

1. Introduction

Airborne remote sensing of sea surface is constantly expanding during the last ten years due to significant progress in development of aerial drones, especially low-cost quadcopters [1,2,3,4,5,6]. Many previous works used airborne data to study various marine processes including mapping of coastal topography [7,8] and bathymetry [9,10,11,12], surveying of marine flora and fauna [13,14,15,16,17,18,19,20,21,22], and monitoring of water quality and anthropogenic pollution [23,24,25,26,27,28]. Several works used airborne data to study physical properties of sea surface layer including estimation of turbulence [29] and reconstruction of surface currents [30,31]. However, applications of aerial remote sensing are still rare in physical oceanography, especially in comparison with numerous studies based on satellite remote sensing. Studies of river plumes provide a good example of this situation. Hundreds of related works were based on high-resolution [32,33], medium-resolution [34,35,36,37], and low-resolution [38,39,40] optical satellite data, satellite-derived temperature [41,42,43], salinity [4,5,6,7,8,9,10,11,12,13,14,15,16,17,18,19,20,21,22,23,24,25,26,27,28,29,30,31,32,33,34,35,36,37,38,39,40,41,42,43,44,45,46], and roughness [47,48,49] of sea surface. On the other hand, only several studies used airborne remote sensing to study river plumes [25,26,50,51,52,53]. Moreover, we are not aware of any study, which specifically addressed structure, variability, and dynamical features of small plumes using aerial remote sensing data. This point provides the main motivation of the current work.
General aspects of the structure and dynamics of river plumes as well as their regional features were addressed in many previous studies. Nevertheless, these works were mostly focused on large river plumes, while small rivers plumes received relatively little attention. However, small rivers play an important role in global land-ocean fluxes of fluvial water and suspended and dissolved sediments [54,55,56]. Small rivers form buoyant plumes that have small spatial scales and, therefore, small residence time of freshened water, which is equal to hours and days, due to relatively low volume of river discharge and its intense mixing with ambient sea [57]. Dissipation of freshened water as a result of mixing of a small plume with subjacent saline sea limitedly influences ambient sea and does not result in accumulation of freshwater in adjacent sea area. As a result, small plumes are characterized by sharp salinity and, therefore, density gradients at their boundaries with ambient sea. This feature is not typical for large river plumes and results in significant differences in spreading and mixing between small plumes and large plumes. Sharp vertical density gradient at the bottom boundary of a small plume hinders vertical energy transfer between a small river plume and subjacent sea [57]. This feature strongly affects spreading dynamics of a small plume due to the following reasons. First, the majority of wind energy transferred to sea remains in a small plume, because the vertical momentum flux diminishes at the density gradient between a plume and subjacent sea. Therefore, wind stress is concentrated in a shallow freshened surface layer that causes higher motion velocity and more quick response of dynamics of a small plume to variability of wind forcing, as compared to ambient sea [58,59]. It results in wind-driven dynamics of small plumes, which is characterized by very energetic short-temporal variability of their positions, shapes, and areas [60,61,62,63,64].
Study of structure and variability of small river plumes at small spatial and temporal scales is essential for understanding the fate of freshwater discharge from small rivers to sea and the related transport of suspended and dissolved river-borne constituents. However, high short-temporal variability of small plumes and their small vertical sizes inhibit precise in situ measurements of their thermohaline and dynamical characteristics [57]. Satellite remote sensing also does not provide the necessary spatial resolution and temporal coverage for small river plumes. As a result, many important aspects of structure, variability, and dynamics of small river plumes at small spatial and temporal scales remain unstudied.
Quadcopters are especially efficient in observation of small river plumes because they can continuously observe sea surface with high spatial resolution from relatively low altitude. Quadcopters can be used during overcast sky when optical satellite instruments cannot observe sea surface. The main drawback of their usage is relatively short duration of continuous operation (less than several hours), limited weight of carried instruments, and inability of their operation during strong wind, rain, snow, low temperature, and other inappropriate weather conditions. Despite these limitations, usage of quadcopters provides unprecedented ability to study structure of small river plumes, detect and measure their short-temporal variability, and register various dynamical features of these plumes. Therefore, the main goal of the current work is to describe structure and temporal variability of small river plumes on small spatial (from meters to hundreds of meters) and temporal (from minutes to hours) scales, which are limitedly covered by in situ measurements and satellite imagery and remain almost unaddressed by the previous studies.
In this work we use aerial remote sensing supported by synchronous in situ measurements and satellite observations to study small river plumes formed in the northeastern part of the Black Sea. We show that usage of aerial drones, first, strongly enhances in situ and satellite observations of structure and variability of small plumes, second, provides ability to perform accurate, continuous, and high-resolution measurements of their spatial characteristics and current velocity fields, and, finally, significantly improves operational organization of field measurements. Owing to continuous and high-resolution aerial remote sensing, we report several novel results about spatial structure, short-temporal variability, and dynamical features of small river plumes. These results include strongly inhomogeneous structures of small river plumes manifested by complex and dynamically active internal frontal zones; undulate (lobe-cleft) form of a sharp front between a small river plume and ambient sea; energetic lateral mixing across this front caused by its baroclinic instability; internal waves generated by river discharge near a river estuary and propagating within the inner plume; and internal waves generated by vortex circulation of river plume and propagating within the outer plume. The obtained results reveal significant differences in structure, variability, and dynamics between small plumes and large plumes.
The paper is organized as follows. Section 2 provides the detailed information about the aerial, in situ, and satellite data, as well as the processing methods used in this study. The results derived from aerial observations of small river plumes supported by in situ measurements and satellite observations are described in Section 3. Section 4 focuses on discussion and interpretation of the revealed features of spatial structure, short-temporal variability, and dynamics of small river plumes. The summary and conclusions are given in Section 5.

2. Data and Methods

2.1. Study Area

In this work, we focused on the Kodor and Bzyp river plumes formed in the northeastern part of the Black Sea (Figure 1). These rivers were chosen as the case sites due to the following reasons. First, these rivers have high concentrations of suspended sediments (300-500 g/m3 in the Kodor River and 100-300 g/m3 in the Bzyp River) [65], therefore, the turbid Kodor and Bzyp plumes can be effectively detected by optical aerial and satellite imagery. Second, the Kodor and Bzyp rivers are relatively small, their catchment areas are 2000 and 1500 km2, respectively, and their average annual discharges are approximately 130 and 120 m3/s, respectively [65]. As a result, the Kodor and Bzyp plumes are small enough to be observed by aerial remote sensing from relatively small altitude (< 200 m). However, both rivers are mountainous with large mean basin altitudes (> 1500 m) and slopes (> 0.02‰), as well as high drainage density (> 0.8 1/km). Therefore, during spring freshet and short-term rain-induced floods the runoffs from the Kodor and Bzyp rivers dramatically increase by 1-2 orders of magnitude. Third, despite their relatively small spatial extents, the Kodor and Bzyp plumes are the largest plumes in the study area. As a result, structure and dynamics of these plumes are not influenced by interaction with other river plumes. Fourth, the Kodor and Bzyp rivers have different mouth morphologies that affect the structure of their plumes. The majority of the Bzyp River runoff inflows to sea from the main river channel, however, a small side-channel is formed during high discharge periods. The Kodor River inflows to sea from three large river channels, which form the Kodor Delta. The mouths of these deltaic branches are located along the 2 km long segment of the coastline. Finally, wind, cloud, and rain conditions in the study area are favorable for aerial and satellite observations of the river plumes during the majority of the year.
The continental shelf at the study area is very steep and narrow. The distance between the coastline and the 500 m isobath is less than 10 km near the Kodor and Bzyp mouths (Figure 1). The main coastline features at the study area are large capes, namely the Iskuria and Pitsunda capes, located to the south from the Kodor and Bzyp deltas, respectively (Figure 1). The local sea circulation from surface to the depth of 200–250 m is governed by alongshore currents due to the current system cyclonically circulating along the continental slope, which is generally referred to as the Black Sea Rim Current [66,67]. Sea surface circulation in the study region is also influenced by nearshore anticyclonic eddies, which are regularly formed between the main flow of the Rim Current and the coast owing to baroclinic instability caused by wind forcing and coastal topography [68,69,70]. Tidal circulation at the study area is very low and tidal amplitudes are less than 6 cm [71,72]. Salinity in the coastal sea, which is not influenced by river discharge, is 17–18 [67,73].

2.2. Aerial, In Situ, and Satellite Data

Aerial observations of the Kodor and Bzyp plumes were performed by a quadcopter (DJI Phantom 4 Pro) equipped with a 12 MP/4K video camera. Aerial observations of the plumes were supported by ship-borne in situ measurements of salinity, temperature, turbidity, and current velocity within the plumes and the adjacent sea. The size of this quadcopter is small enough to be launched from and landed on a small boat. It provides opportunity for a quadcopter operator to be onboard the research vessel and to effectively coordinate synchronous in situ measurements and water sampling. Aerial observations and in situ measurements of the Kodor plume were conducted on 1–2 September 2018 and 1–3 April 2019, while aerial observations and in situ measurements of the Bzyp plume were performed on 31 May–1 June 2019. Below we provide the protocols of these aerial surveys according to the scheme suggested by Doukari et al. [74].
The quadcopter was flying over coastal sea areas adjacent to the Kodor and Bzyp river mouths. The take-off and landing spot was located on a vessel/boat that provided opportunity to perform flights at different areas of the plumes without any limitations on their distance to the seashore. The distance between the quadcopter and the research vessel/boat did not exceed 1 km. Quadcopter shooting altitude depended on the spatial scale of the sensing sea surface process and varied from 10–30 m for the small-scale frontal circulation to 150–200 m for detection of plume position and area. Weather conditions during the field surveys were favorable for usage of the quadcopter. Wind forcing during the flights was moderate (< 8 m/s), air temperature varied between 15 and 30° C, and air humidity varied between 60% and 90%. The flights were conducted during no-rain conditions from morning to evening. In case of clear sky conditions, sun glint strongly affected the quality of the aerial data during the daytime. Wave heights were < 0.5 m during the flights.
In situ measurements performed in the study areas were the following. Continuous salinity and temperature measurements in the surface sea layer (0.5–1 m depth) were performed along the ship tracks using a shipboard pump-through system equipped by a conductivity-temperature-depth (CTD) instrument (Yellow Springs Instrument 6600 V2) [62,75]. Vertical measurements of salinity, temperature, and turbidity were performed using a CTD-instrument (Sea-Bird Electronics SBE 911plus) at 0.2 m spatial resolution. Vertical measurements of current velocity were performed using an acoustic Doppler current profiler (ADCP) (Teledyne RDI Workhorse Sentinel) and a CTD-ADCP-instrument (Aanderaa SeaGuard RCM). Vertical profiling was performed from sea surface to the depth of 10 m or to seafloor in shallow areas. The positions of individual in situ measurements are given in Section 3. Wind forcing during the field measurements was measured by a compact weather station (Gill GMX200) with temporal resolution of 1 minute. The weather station was mounted at the height of 10 m at a pier on a distance of 30 m from the coastline (Figure 1).
The Kodor and Bzyp plumes were also studied using Sentinel-2 Multispectral Instrument (MSI) data collected in 2017–2019. The Sentinel-2 Level-1C products were downloaded from the Copernicus Open Access Hub (https://scihub.copernicus.eu/) (Supplementary Materials). Atmospheric correction was applied to these products using Sen2Cor module version 2.2.1 within the Sentinel-2 Toolbox (S2TBX), Sentinel Application Platform (SNAP) version 5.0.7.

2.3. Processing of Aerial Data

In this study we used an optical flow algorithm to reconstruct velocity fields in the sea surface layer from quadcopter video records [76,77]. The main principle of optical flow algorithms used for calculation of motion from two consecutive pictures is the following. It was assumed that for each point x (i.e., pixel) on both frames a certain signal intensity property I (i.e., brightness) was conserved:
I ( x , t ) = I ( x + Δ x , t + Δ t )
By linearizing the intensity of the second frame with respect to the intensity of the first frame a gradient constraint equation is obtained in the following way:
I ( x , t ) · u + I t ( x , t ) = 0
where I = ( I x , I y ) is the spatial partial derivatives of intensity, u = d x / dt is the velocity, and I t is the temporal derivative of intensity. The derivatives I and I t can be directly calculated, while the 2D velocity field u is unknown. Therefore, Equation (1) requires an additional constraint and it is assumed that the displacement Δ x is constant in any small neighborhood, i.e., we search for a displacement that minimizes the constraint error:
E ( x ) = x g ( x ) ( I ( x , t ) · u + I t ( x , t ) ) 2
where g ( x ) is a weight function. Thus, minimization of E ( x ) with respect to u provides an additional condition for Equation (2). The resulting vector field u ˜ calculated from Equations (2) and (3) is regarded as an optical flow estimate. In this work, we used the Farneback weight function [78] freely available in the OpenCV computer vision library (https://opencv.org/). This algorithm approximates a neighborhood of a pixel in each pair of frames by a quadratic polynomial function applying the polynomial expansion transform. Therefore, a constraint equation is based on a polynomial approximation of the given signal. On the assumption of small variability of a displacement field, the algorithm minimizes quadratic error of the constraint and calculates the optical flow estimation.
The estimation of surface velocity fields in the study region was performed in two stages. First, we applied the optical flow algorithm with large prescribed sizes of pixel neighborhoods for the reconstruction of motion of distinct plume boundaries and fronts. Second, we reconstructed motion within the river plume using the optical flow algorithm with a reduced neighborhood size. Spatial scale of motion, which is intended to be reconstructed, positively correlates with optimal size of a pixel neighborhood. An algorithm with a small pixel neighborhood more accurately reconstructs small-scale motion, but shows lower quality for large motion patterns, as compared to an algorithm with a large pixel neighborhood. The overall neighborhood size was prescribed according to spatial scales of ocean surface features (e.g., river plume fronts), in which motion is expected to be detected by an optical flow algorithm. Thus, the optimal neighborhood size intended to reconstruct the large-scale motion of river plumes should be equal to the width of distinct plume boundaries and fronts. In this study, the large size of a pixel neighborhood was prescribed equal to 30 m, while the small size of a pixel neighborhood was set equal to 1 m. In case of application of this algorithm to other regions, we suggest prescribing neighborhood sizes equal to relevant spatial scales of the considered ocean surface features.
Due to high resolution of the video camera used and continuous video recording, the optical flow algorithm efficiently detected motion of the distinct frontal zones within the river plumes, as well as motion of foam and floating litter accumulated at these fronts which is indicative of the circulation patterns at the frontal zones. As a result, the reconstructed surface velocity fields showed good accordance with visually inspected shifts of the frontal zones, foam, and floating litter at the video records. Stable positioning of a quadcopter is important for precise motion detection at sea surface. Moderate wind speed during the field surveys did not negatively affect the quality of the obtained aerial data. However, strong wind forcing during camera shooting can hinder accurate reconstruction of surface velocity fields. Sun glint is another important issue that can impede motion detection at aerial video records. Intensity of the sun glint depends on solar elevation angle, camera shooting angle and direction; therefore, it can be reduced by correct selection of quadcopter altitude and position. Usage of polarizing filters for quadcopter camera can reduce glint from water surface, however, its efficiency strongly depends on camera shooting angle.

3. Results

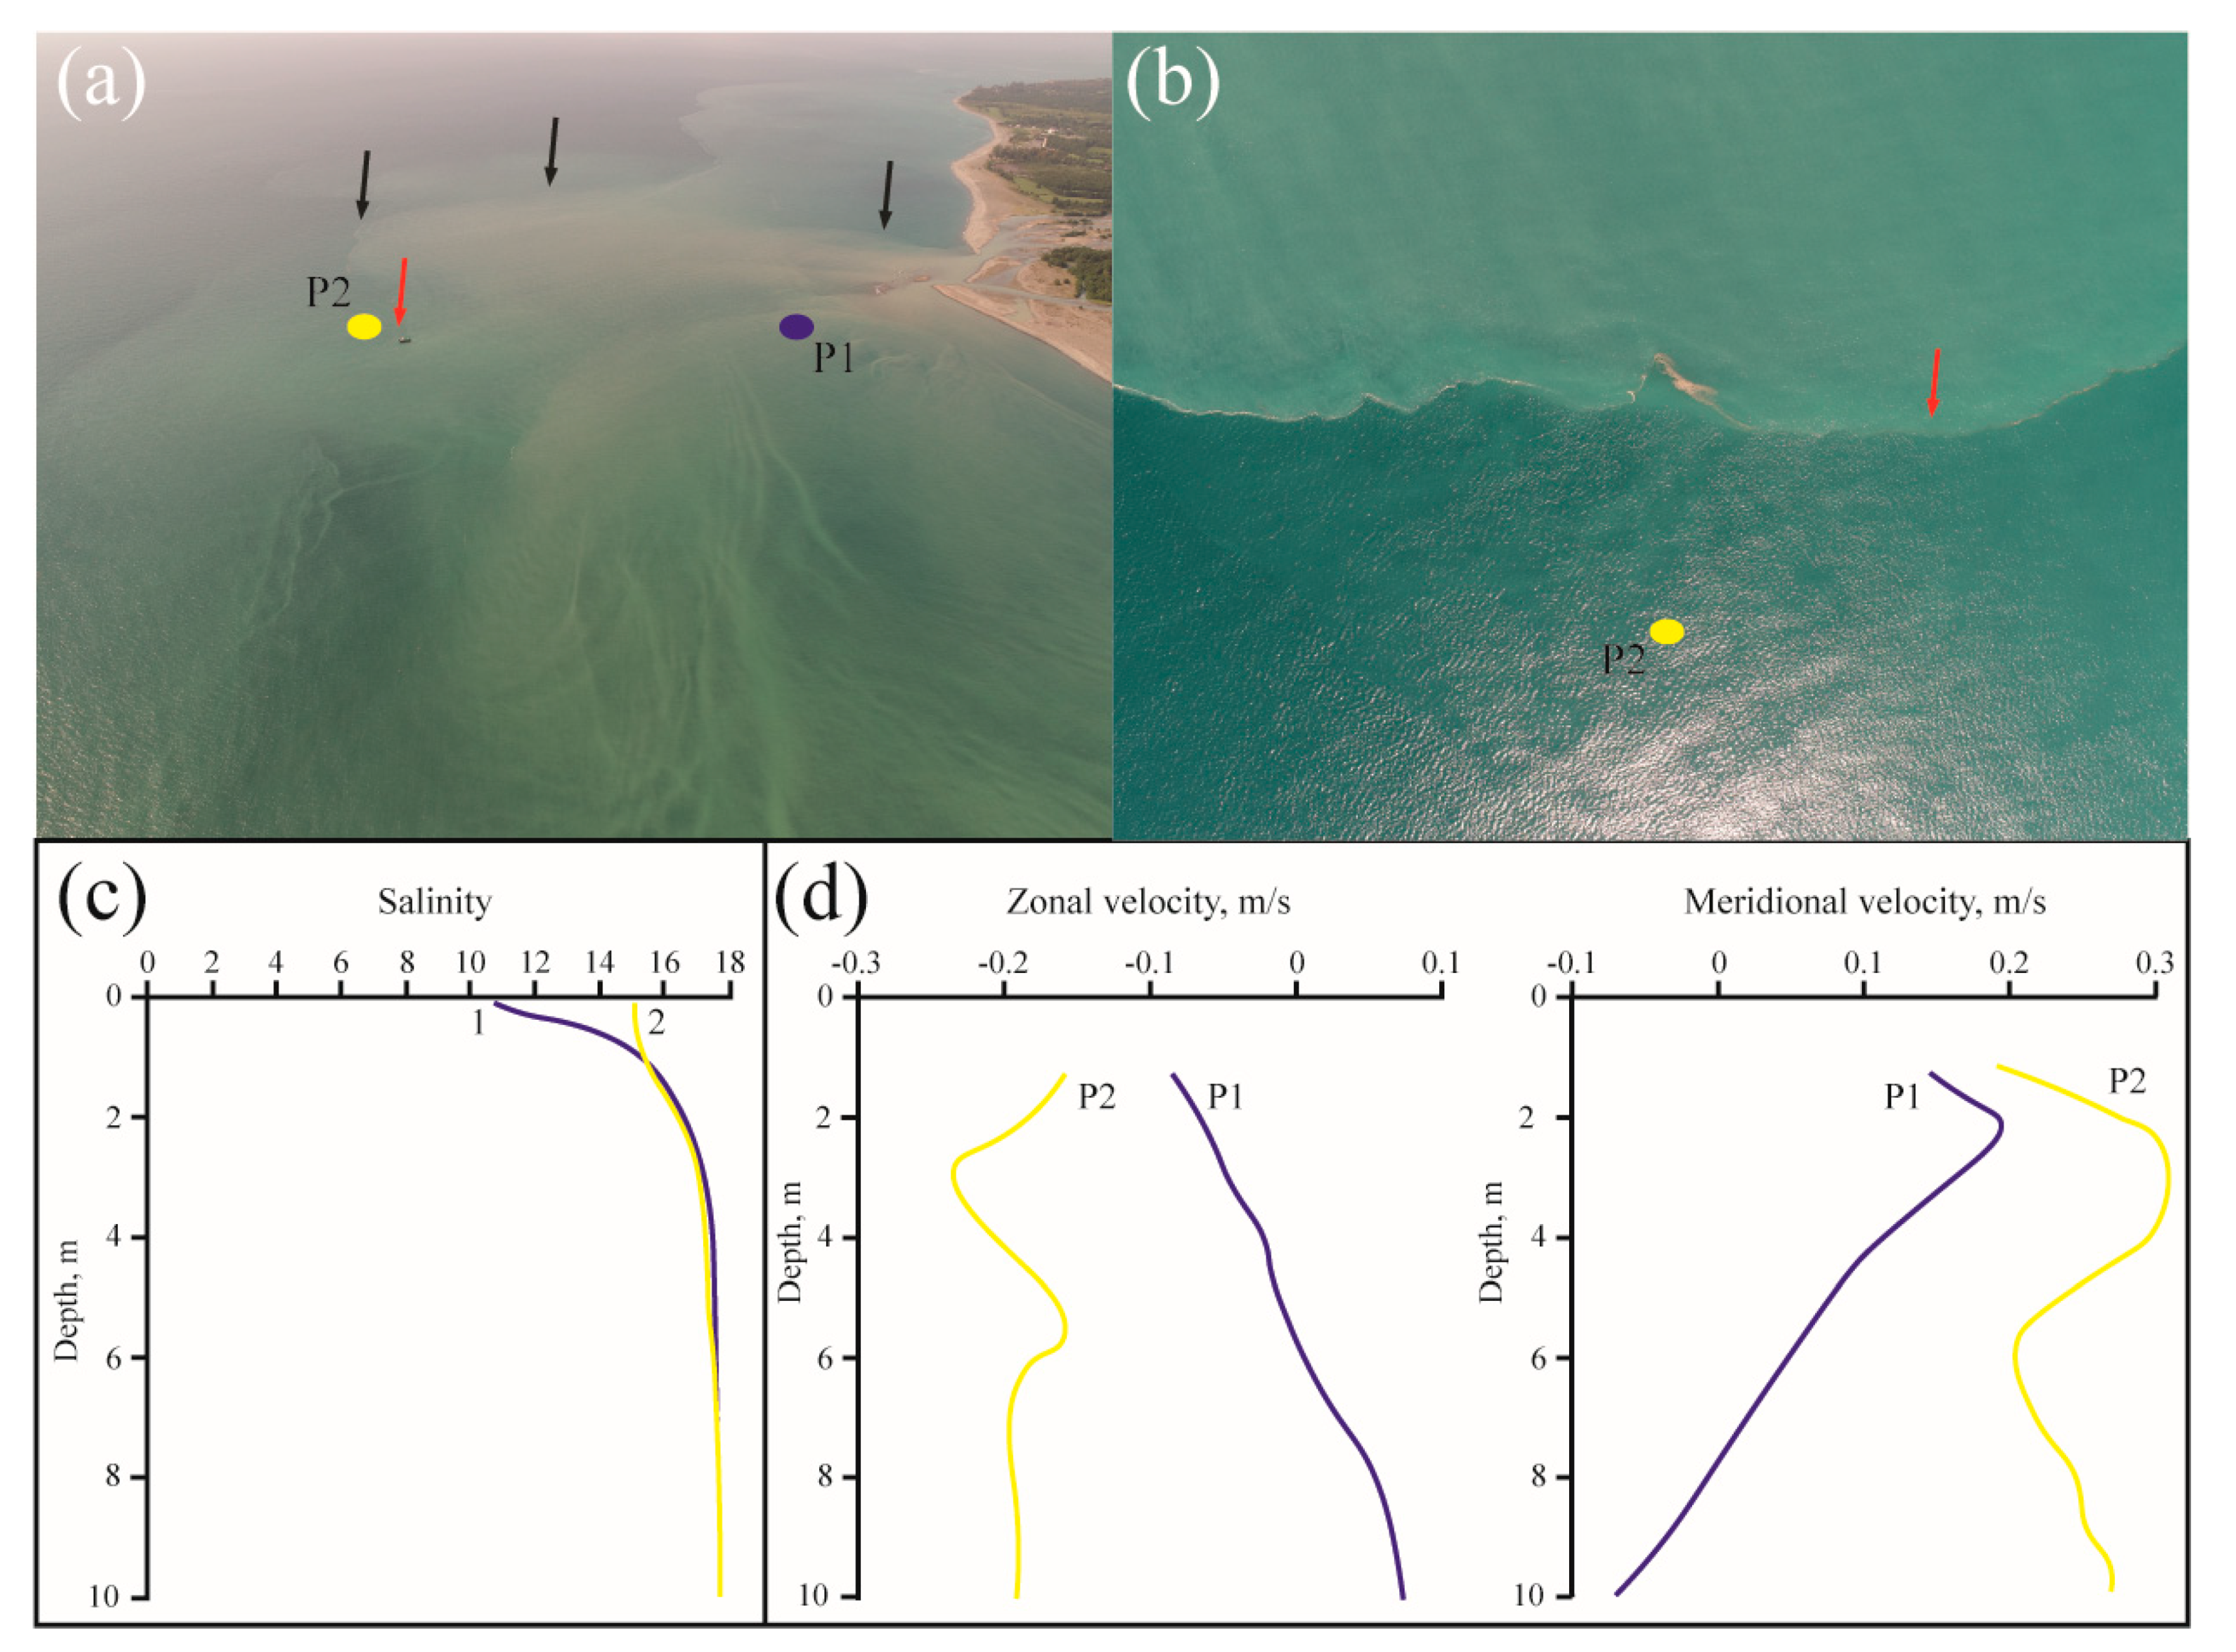
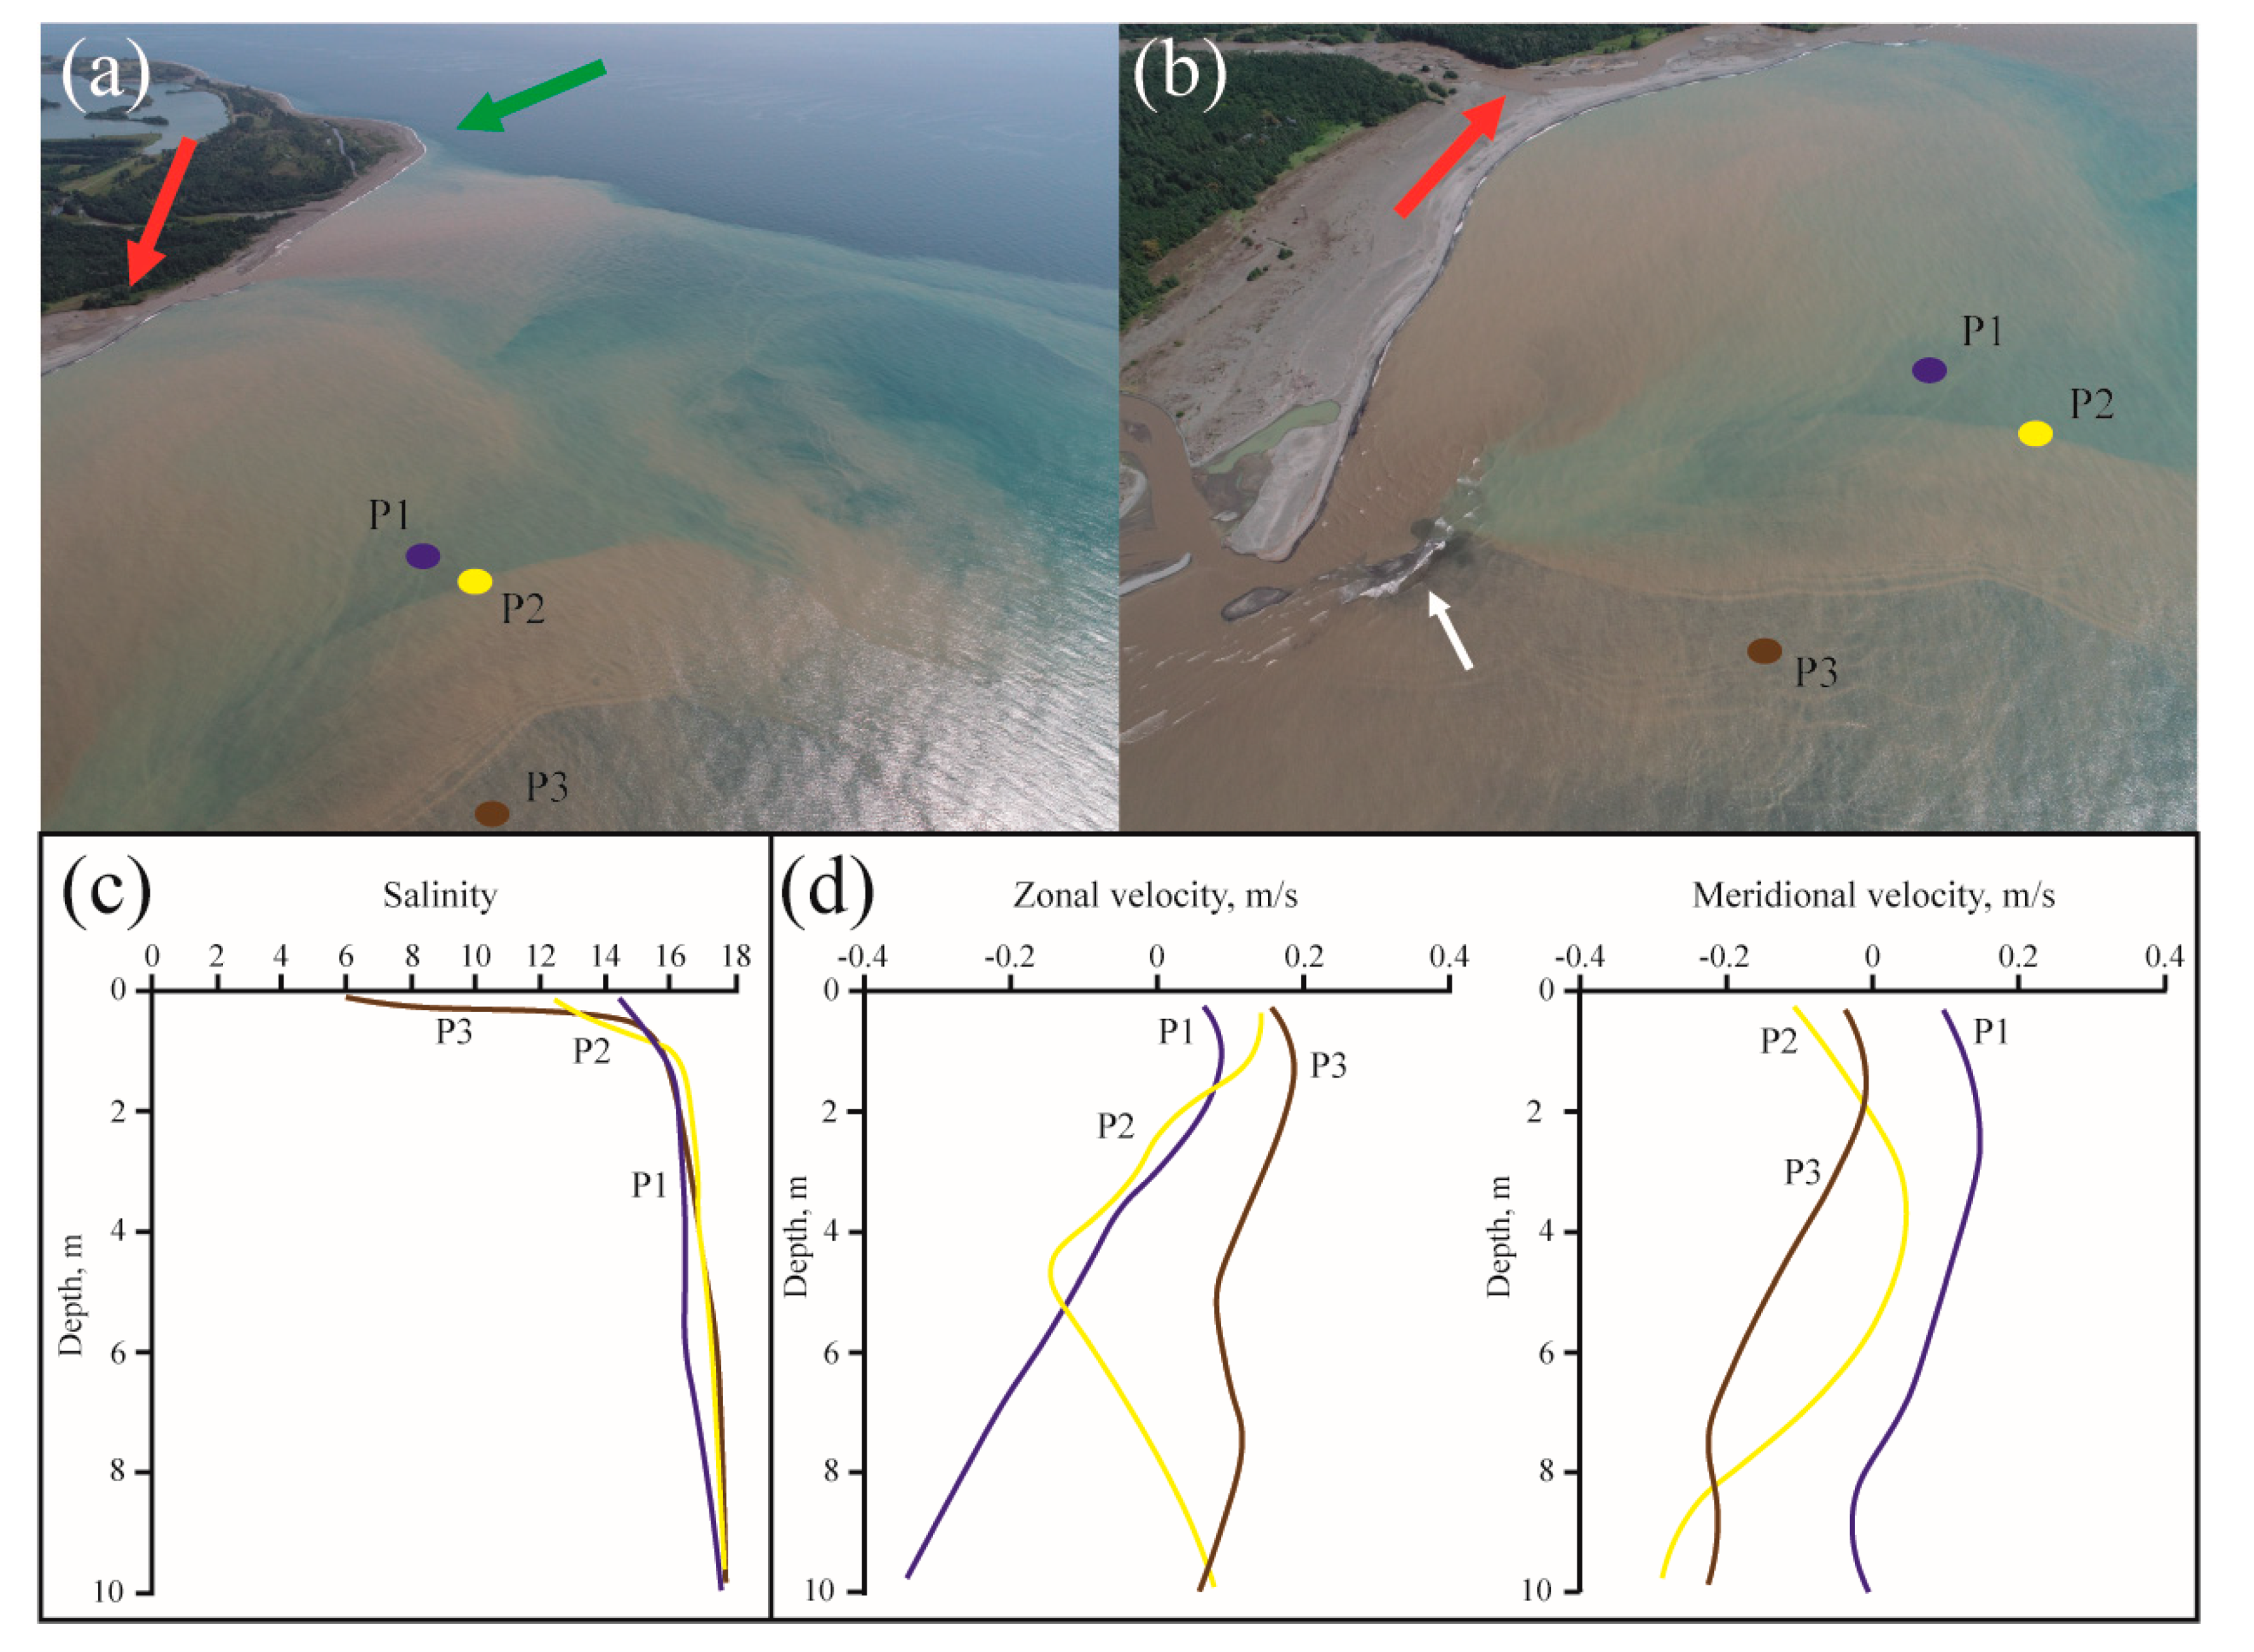
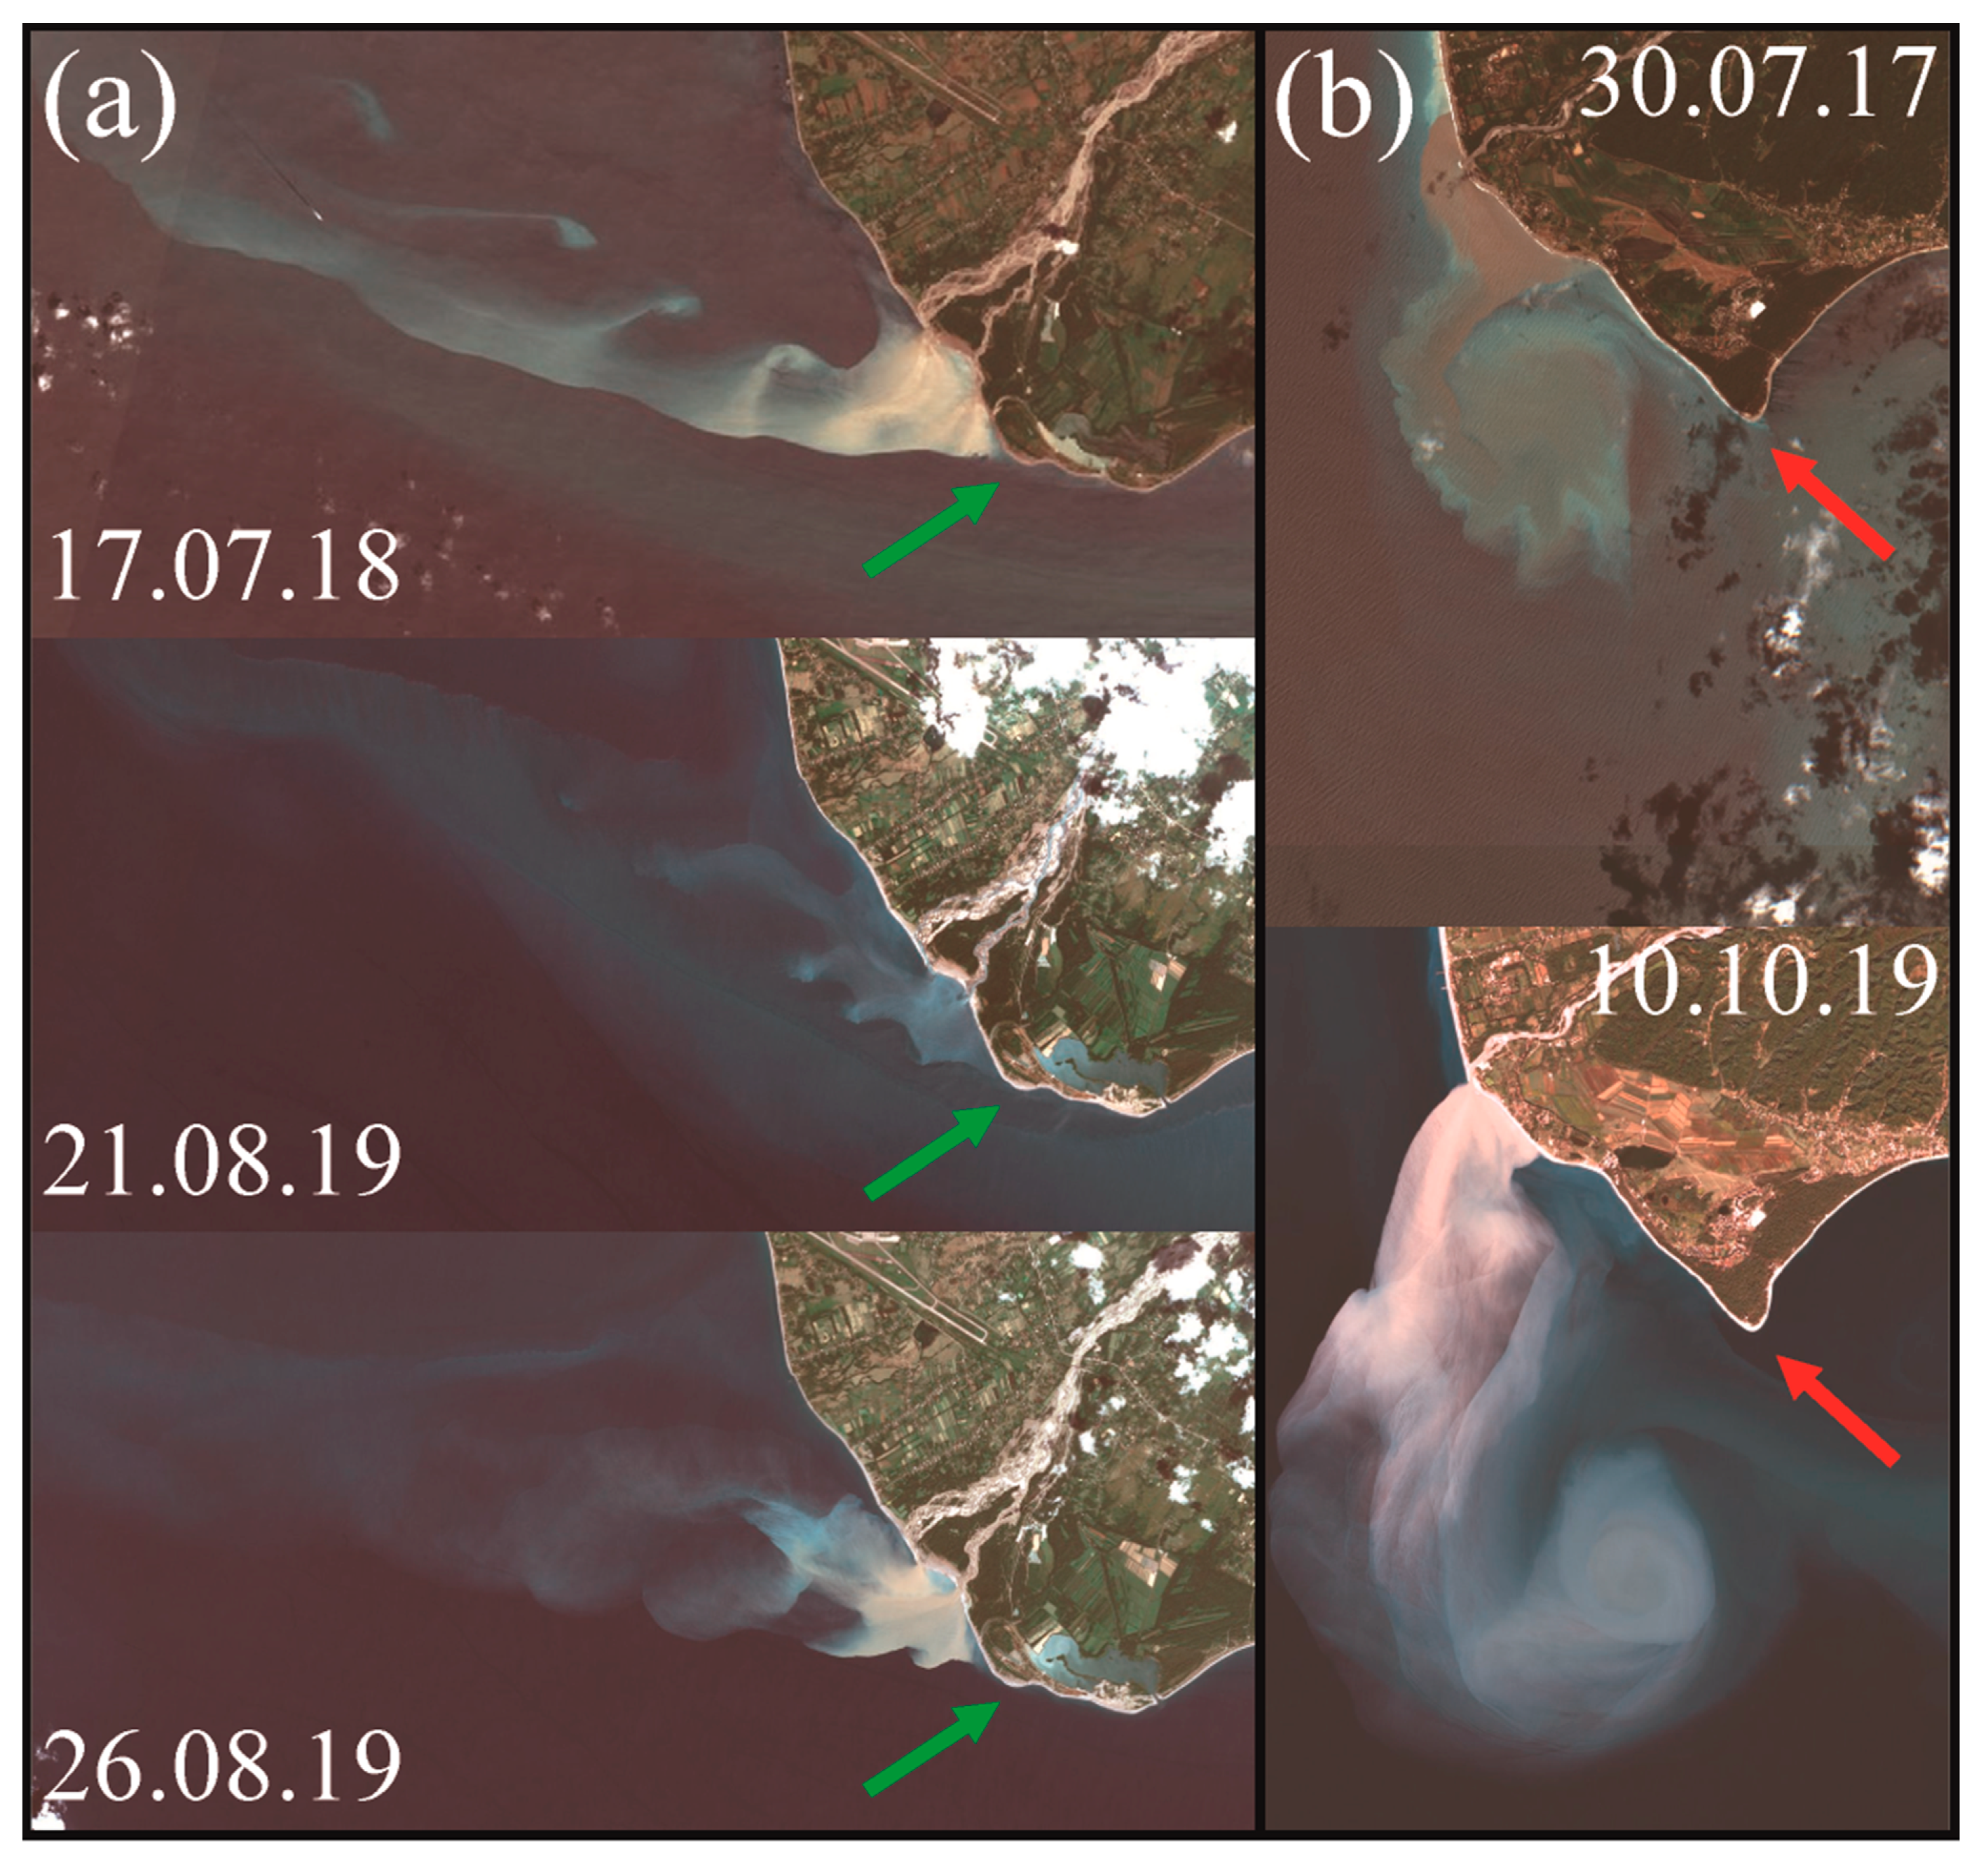
3.1. Spatial Structure and Short-temporal Variability of the Kodor and Bzyp Plumes

The field surveys were performed during spring freshet at the Bzyp River (260 m3/s) on 31 May–1 June 2019; during drought period at the Kodor River (40 m3/s) on 1–3 April 2019; and during flash flooding period at the Kodor River (80–150 m3/s) on 31 August–2 September 2018. Wind forcing was moderate during these field surveys. Average and maximal wind speed registered at weather station in the study regions were 3.1 and 7.6 m/s during 31 August–2 September 2018; 2.4 and 6.2 m/s during 1–3 April 2019; and 2.9 and 5.6 m/s during 31 May–1 June 2019.
Vertical salinity measurements in the study areas revealed that these low-saline plumes are shallow (< 5 m depth) and have distinct vertical salinity gradients with the ambient saline sea. Due to elevated concentrations of terrigenous suspended sediments in the Kodor and Bzyp rivers [65], turbidity within the Kodor and Bzyp plumes was significantly larger than in the ambient sea and showed good correlation with reduced salinity (Figure 2). The Pearson correlation coefficients (r) between salinity and turbidity are equal to −0.87 and −0.71 for the Kodor and Bzyp plumes respectively with p-values equal to 0.0000. These high absolute values of the correlation coefficients at low p-values indicate that the observed relations between salinity and turbidity within the Kodor and Bzyp plumes (low salinity and high turbidity), on the one hand, and the ambient sea water (high salinity and low turbidity), on the other hand, are statistically significant. As a result, surface turbidity structures of the Kodor and Bzyp plumes observed by optical remote sensing are indicative of surface salinity structures of these plumes.
Aerial remote sensing and satellite imagery showed that the alongshore extents of turbid surface water associated with the considered river plumes during low discharge conditions are 1−5 km. The obtained estimates were consistent with salinity measurements at the study area. However, flooding discharge results in abrupt expanding of these plumes, their extents and areas can exceed 20 km and 50 km2, respectively. Aerial and satellite images, surface salinity distribution, and vertical salinity profiles obtained on 31 August 2018 in the coastal area adjacent to the Kodor Delta are illustrative of spatial scales, as well as horizontal and vertical structure of the Kodor plume (Figure 3).
Aerial observations and in situ measurements revealed strongly inhomogeneous salinity and turbidity structure of the Kodor plume manifested by complex and dynamically active frontal zones within the plume (Figure 4, Figure 5 and Figure 6). In particular, surface salinity showed no dependence on the distance to the mouths of the deltaic branches that is regarded typical for river plumes [79,80,81], especially in numerical modeling studies [82,83,84,85]. This inhomogeneous structure is formed due to impact of several different processes including the formation of the Kodor plume by several spatially distributed sources, the large inter-day river discharge variability in response to sporadic rain events, and the bathymetric features that influence spreading of the plume.
The Kodor River inflows to sea from three deltaic branches with different discharge rates. As a result, all three branches form individual river plumes that merge and coalesce into the common Kodor plume. These three river plumes have different structure, spatial characteristics, and dynamics, therefore, they interact as individual water masses and form stable frontal zones observed by aerial imagery (Figure 4a) [86,87,88]. In situ measurements performed on 2 September, 2018 revealed sharp salinity gradient at the frontal zone between the river plumes formed by the northern and the central deltaic branches of the Kodor River. Surface salinity along the transect that crossed this frontal zone abruptly decreased from 14 to 8–10 on a distance of 5 m (Figure 4b).
The discharge of the Kodor River shows quick response to precipitation events that is common for small mountainous rivers with small and steep watershed basins. Frequent rains at the mountainous northeastern coast of the Black Sea cause high inter-day variability of the discharge rate of the Kodor River [65,89]. As a result, the area of the Kodor plume can significantly change during less than one day that was observed on 31 August–2 September 2018 during the field survey. Heavy rain that occurred during 6 hours at night on 31 August–1 September (according to the local weather station measurements) caused increase of the river discharge from 80 to 150 m3/s during several hours. The area of the Kodor plume doubled from 31 August to 1 September in response to the flash flood. Wind direction during 31 August–1 September was stable (southwestern), while wind speed slightly increased from 2–3 m/s to 4–5 m/s. Then river discharge steadily decreased to pre-flooding conditions, which were registered on 2 September, while wind direction changed to eastern and wind velocity decreased to 3–4 m/s. In situ measurements and aerial remote sensing performed on 2 September, i.e., shortly after the flood, observed, first, the large residual plume that was formed on 1 September during the flooding event and did not dissipate yet and, second, the emergent plume that was formed on 2 September after the decrease of river discharge rate (Figure 5). These plumes had different spatial scales, structures, thermohaline, and dynamical characteristics. As a result, similarly to the river plumes formed by different deltaic branches, the residual and the emergent plumes interacted as individual water masses and formed complex frontal zones within the common Kodor plume.
Interaction between the Kodor plume and the seafloor at the shallow zones is the third process that induces inhomogeneous structure of this plume. Aerial imagery detected the area of reduced turbidity formed behind the shoal, which is located in front of the northern deltaic branch (Figure 6). This low-turbid zone contrasted especially with the surrounding turbid river plume during the flooding discharge on 1 September 2018. In situ measurements showed that surface salinity at this low-turbid zone (15) was significantly greater than at the adjacent turbid part of the plume (12.5–13) (Figure 6c). Surface circulation also differed in these two parts of the plume. The northward flow (10 cm/s) was observed in the low-turbid zone, while the southeastward flow (20 cm/s) dominated in the adjacent turbid part (Figure 6d). The formation of this zone is caused by the interaction of the inflowing river jet with seafloor at the shoal that induces deceleration of the jet and its increased mixing with saline and low-turbid sea water. The stable front bounding this low-turbid and high-saline zone inside the plume was observed on a distance of up to 1 km from the shoal.

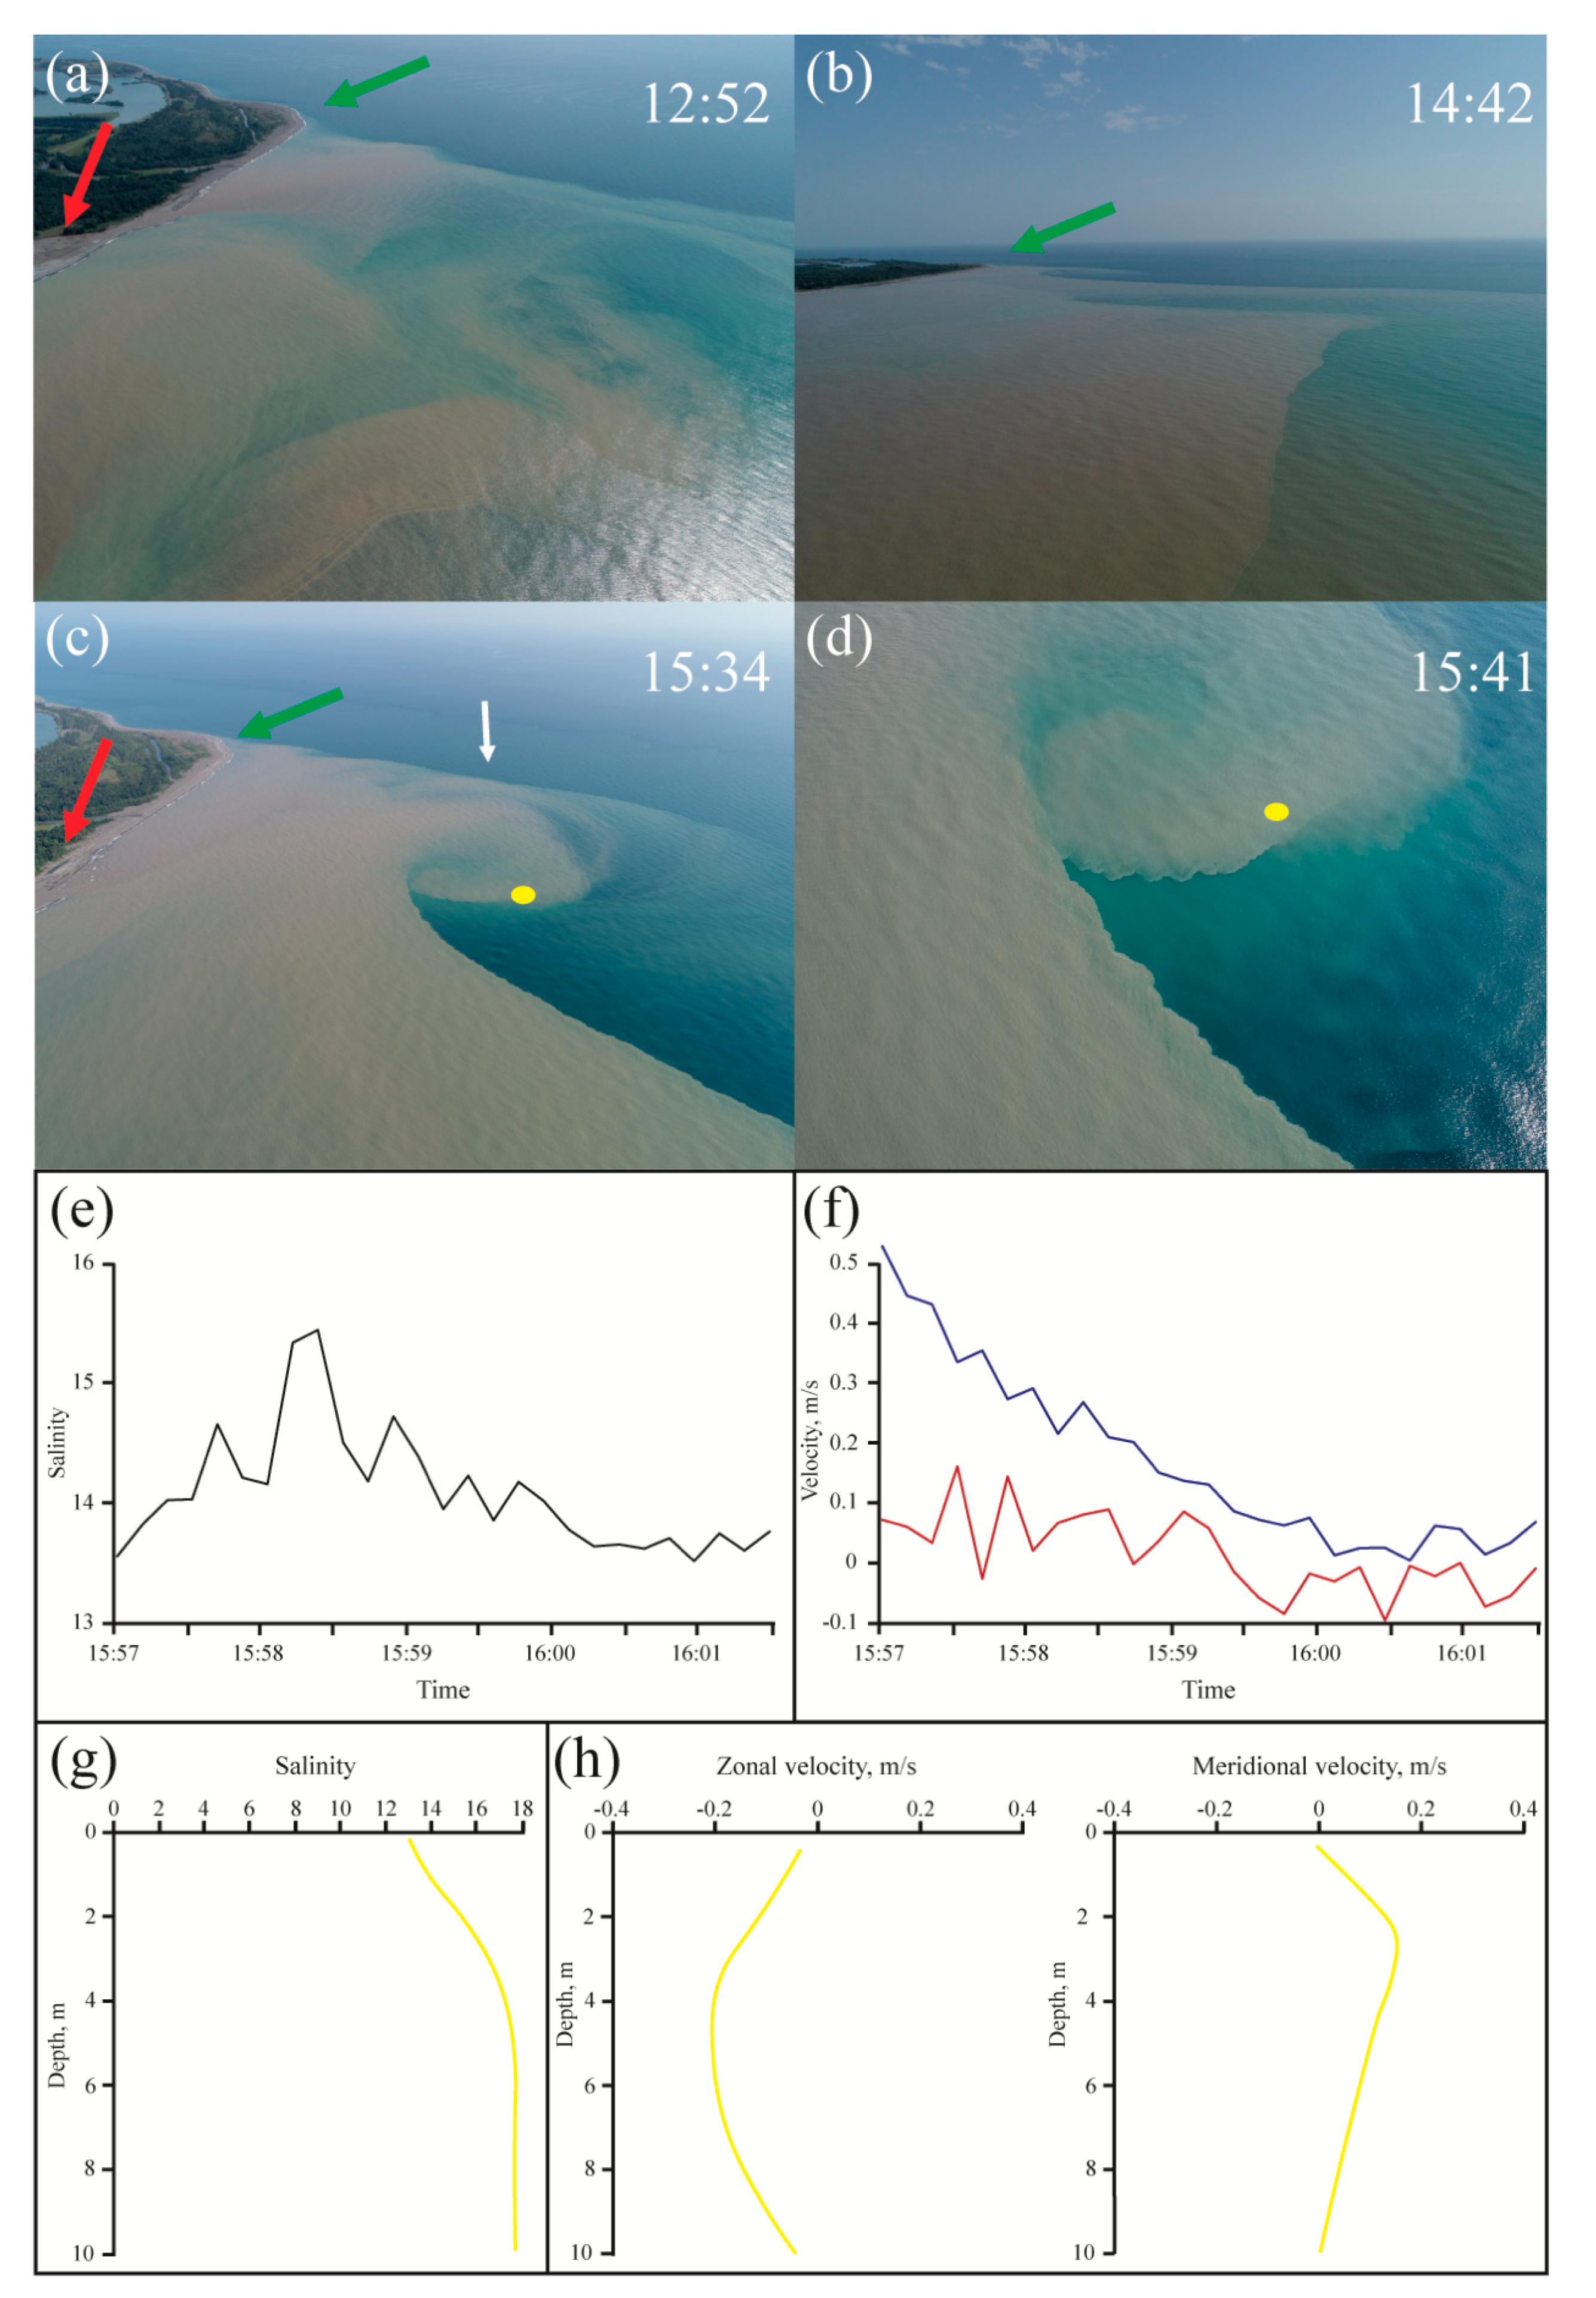
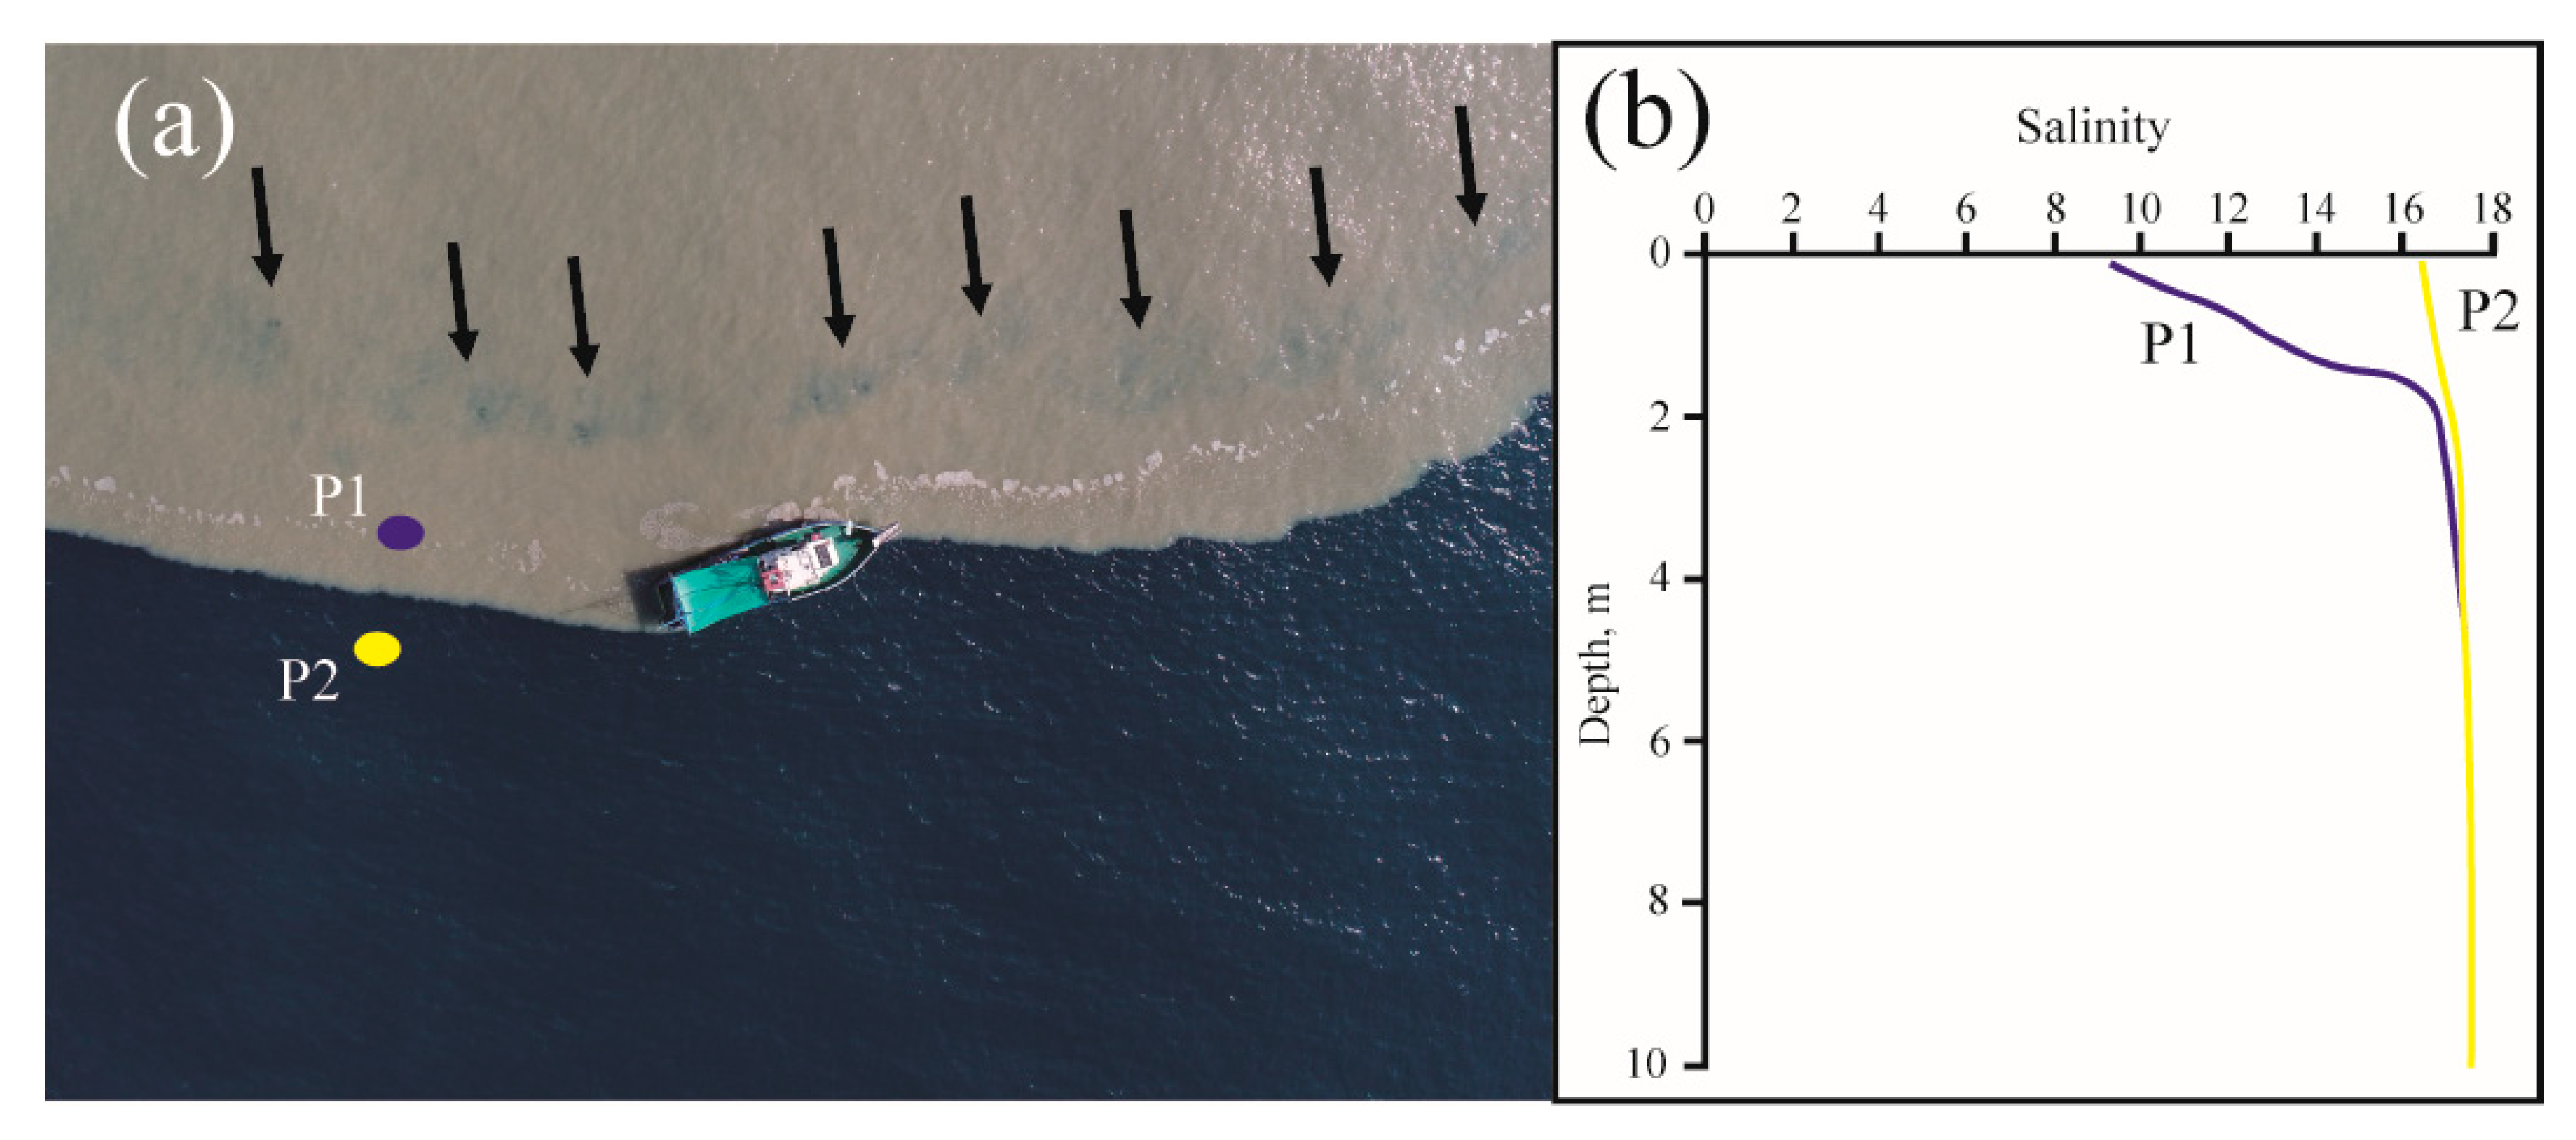
3.2. Dynamical Features of the Kodor and Bzyp Plumes

Using aerial remote sensing we detected several dynamical features of the Kodor and Bzyp plumes and measured their spatial characteristics. Based on the surface velocity data reconstructed from the aerial video records, we studied dynamical characteristics of these features and analyzed their physical background. Aerial remote sensing detected a swirling eddy within the Kodor plume on 1 September 2018 (Figure 7). This eddy was formed at the southern part of the emergent plume at its border with the residual plume near the Iskuria Cape. The aerial image of this part of the plume acquired at 12:52 (Figure 7a) showed inhomogeneous structure of the emergent plume without any eddy. The distinct border between the emergent and the residual plumes was stretched from the Iskuria Cape in the northwestern direction. The beginning of formation of the eddy was registered at 14:42 (Figure 7b), then at 15:34 the well-developed eddy was observed (Figure 7c,d). The diameter of the eddy was approximately 500 m, it was rotating in an anticyclonic direction, while its center was moving at an angle of approximately 30° across the border of the emergent plume. Processing of the video record of this eddy provided estimations of velocity of its movement (0.9 m/s) and rotation (0.4 m/s). The aerial observations performed at 16:16 did not show any surface manifestations of the eddy at the study area; therefore, we presume that it shifted off the observation area during less than an hour. Wind conditions were stable during the considered period, wind speed did not exceed 3.5 m/s.
In situ thermohaline and velocity measurements were performed within the eddy at 15:57–16:01 (Figure 7e,f). They included continuous measurements at a depth of 0.7–0.8 m for 4.5 minutes followed by vertical profiling from surface to the depth of 13 m. Note that the measurements were performed at the stable point, while the eddy was moving. As a result, the performed measurements registered salinity and velocity in different parts of the eddy while it was passing the point of measurements. The intense northward flow (55 cm/s) registered in the surface layer at the beginning of the measurements steadily dissipated to <10 cm/s during the first stage of the measurements (Figure 7f). The eastward velocity component was slightly positive during the first two minutes of the measurements (6 cm/s on average with the peak value of 16 cm/s) and then changed to slightly negative (−5 cm/s on average with the peak value of −11 cm/s). It was accompanied by significant variability of salinity that increased from 13.5 to 15.5 during the first 1.5 min of the measurements and then decreased to 13.5 (Figure 7e). The observed variability of velocity and salinity in the surface layer confirms northward propagation and anticyclonic rotation of this eddy observed at aerial video (Supplementary Materials). However, the movement and rotation velocities registered by in situ measurements were twice less than those reconstructed from the aerial video. This difference is caused by the fact that in situ measurements were performed not at the central part of the eddy, but at its periphery. The observed variability of salinity in the surface layer was caused by intrusion of saline water from the ambient sea to the plume induced by the rotation of the eddy (Figure 7d). Vertical profiles of salinity and velocity measured at 16:02, i.e., after the measurements in the surface layer, registered strong northwestward flow in the subjacent saline sea (Figure 7g,h). Its maximal velocity (15–25 cm/s) was observed immediately beneath the plume at depths of 3–5 m, then velocity decreased to 10–15 cm/s at depths of 8–9 m and to <5 cm/s at depths of 10–13 m. This northwestward flow (20–30 cm/s) was also registered along the Iskuria Cape at the previous day that confirms the presence of the northwestward jet behind the Iskuria Cape which is presumed to generate the observed eddy.
Interaction between sub-mesoscale eddies and the Kodor plume was also observed by satellite imagery. The chains of small anticyclonic eddies (300–500 m in diameter) formed behind the Iskuria Cape and interacting with the Kodor plume were registered on 17 July 2018, 21 August 2019, and 26 August 2019 (Figure 8a). Positions, sizes, and shapes of four to five subsequent eddies within these chains indicate that these chains were periodically generated near the Iskuria Cape and propagated in the northwestward direction shortly before the periods of satellite observations. While tracks of the eddies were crossing the Kodor plume, the turbid plume water was twisted into the eddies, which made them visible at satellite imagery. After these eddies propagated off the plume the trapped turbid water remained connected with the plume that illustrated difference in trajectories and velocities of the eddies and the wind-driven far-field part of the plume (Figure 8a).
Satellite images acquired during the periods of field measurements at the Kodor plume did not register interactions between the eddies and the plume due to episodic character of these features, i.e., eddies do not constantly form and propagate at the study area. Therefore, the satellite images presented in Figure 8 are not synchronous with the field surveys. However, sizes and anticyclonic rotation in the northwestward direction were similar for eddies detected at the Kodor plume by aerial and satellite remote sensing. As a result, we presume that we observe the same process and, therefore, can jointly analyze its spatial and temporal characteristics obtained from aerial and satellite measurements. Satellite imagery also observed eddies formed behind the Pitsunda Cape and interacting with the Bzyp plume on 30 July 2017 and 10 October 2019 (Figure 8b). However, in contrast to the eddies registered within the Kodor plume, these eddies were individual, i.e., did not form chains. Moreover, these eddies were much larger (2-4 km in diameter) and were rotating in cyclonic direction. Satellite images acquired during the periods of field measurement at the Bzyp plume also did not register interactions between eddies with the Bzyp plume.
Satellite image acquired on 10 October 2019 detected packets of internal waves emerging from the rotating eddy and propagating within the Bzyp plume (Figure 9b). Aerial observations on 1 September 2018 also detected a packet of internal waves that emerged from the eddy and was propagating within the outer part of the plume towards the open sea (Figure 10a). Note that the aerial imagery of the Kodor plume (Figure 9a) and the satellite imagery of the Bzyp plume (Figure 9b) are not synchronized and show different river plumes at different dates. Aerial and satellite images acquired during the period of field measurements at the Bzyp plume did not register internal waves within the Bzyp plume. Therefore, in Figure 9 we show airborne images of internal waves at the Kodor plume and satellite images of internal waves at the Bzyp plume.
Despite a large difference in coverage and spatial resolution of the aerial and satellite imagery presented in Figure 9, they both distinctly demonstrate propagation of internal waves within the river plumes. Satellite remote sensing has wide spatial coverage and provides information about spatial characteristics of wave packets at different parts of the plumes (Figure 9b). Distances between the wave packets observed at Sentinel-2 satellite images varied from 30 to 150–200 m, while lengths of the wave packets were up to 5-6 km. Satellite images demonstrated that dozens of internal waves were generated within the plume around the rotating eddy. On the other hand, airborne remote sensing provided opportunity to detect individual internal waves with high spatial resolution and to register their velocities (Figure 9a). High-resolution aerial imagery detected that the distances between the individual waves within the wave packet in the Kodor plume were 2–4 m. The length of the wave packet front was approximately 200 m. The number of waves within the wave packet varied from 12 at its northern part to 3 at its southern periphery. Processing of high-resolution video records revealed that velocity of the wave packet was equal to 0.21 m/s.
Aerial remote sensing also detected multiple packets of low-frequency internal waves that propagated within the Kodor plume towards the coast on 2 September 2018 (Figure 10). These packets consisted of 5–15 waves that were stretched along the coast, albeit had complex shapes not related to the shapes of the plume front or the coastline. Distances between individual waves varied from 5 to 70 m in the observed wave packets. Frontal length of these packets varied from ~100 m (Figure 10a) to 2–3 km (Figure 10b), while their speeds were 10–15 cm/s. Wind speed during this period was 2–3 m/s.
Osadchiev [33] described a mechanism of generation of internal waves in small river plumes as a result of rapid deceleration of an inflowing river jet and formation of a hydraulic jump in vicinity of a river mouth. These internal waves propagate offshore and are regularly observed by satellite imagery in many coastal regions in the World [33,90,91]. Using aerial remote sensing we recorded generation and propagation of these internal waves from the mouth of the side-channel of the Bzyp River on 1 July 2019 (Figure 11a). The internal waves were generated at a distance of 40–50 m from the river mouth every 19 seconds on average, i.e., 29 individual waves were generated during a 9-min long video recording of this area. The distances between the waves decreased from 8–10 m near the river mouth to 1–2 m at the distance of 500 m from the river mouth. Wave velocities were equal to 0.27–0.31 m/s. Moderate (2–3 m/s) northern wind was registered during the considered period.
Aerial observations of internal waves in the Bzyp plume described above were supported by in situ salinity and turbidity measurements performed from a flat-bottomed boat with shallow draft to minimize the boat-induced mixing of sea surface layer (Figure 11). Measurements included 15 surface-to-bottom profiles continuously performed from a free-drifting boat starting at the generation area of the internal waves at the distance of 10 m from the river mouth and finishing 90 m far from the starting point (Figure 11a). The obtained data revealed large difference in vertical salinity structure of the Bzyp plume inside and outside this generation area of internal waves. The first half of the hydrological transect was located at the area of formation of the hydraulic jump as a result of abrupt deceleration of the inflowing river jet (Figure 11b). Similarly to the hydraulic jump observed and described by Osadchiev [33] at the inflowing jet of the Mzymta River, we registered anomalously deep penetration of low-saline water at the generation area of the internal waves in the Bzyp plume. Low-saline water (10–14) was observed from surface to the depth of 3–4 m along 0–5 m and 25–35 m of the transect. Vertical salinity structure within this part of the plume was unstable with multiple overturns (reverse salinity difference was up to 1 at vertical distance of 0.1 m) and large salinity gradients. Vertical salinity structure of the Bzyp plume between the areas of the hydraulic jumps, i.e., along the 5–25 m of the transect, showed relatively homogenous salinity (14.5–16) from surface to bottom, albeit it was much higher than within the areas of hydraulic jumps.
Outside the generation area of the internal waves, i.e., along the 35–90 m of the transect, surface salinity was relatively homogenous (14.5–15.5) and vertical salinity structure was stable. Vertical salinity gradient outside the generation area of internal waves was two orders of magnitude less than the largest values registered in the hydraulic jumps. However, salinity measurements did not cover top 0.5 m of the surface layer, where presumably was located the salinity gradient. Vertical turbidity structure, however, did not show large difference inside and outside the generation area of the internal waves (Figure 11c). The turbid layer was observed from surface to the depth of 1–1.5 m along the first part of the transect and then its depth steadily decreased to 0.5 m. This feature shows that salinity and turbidity structure of a river plume can be significantly different in areas of very intense advection and turbulent mixing.

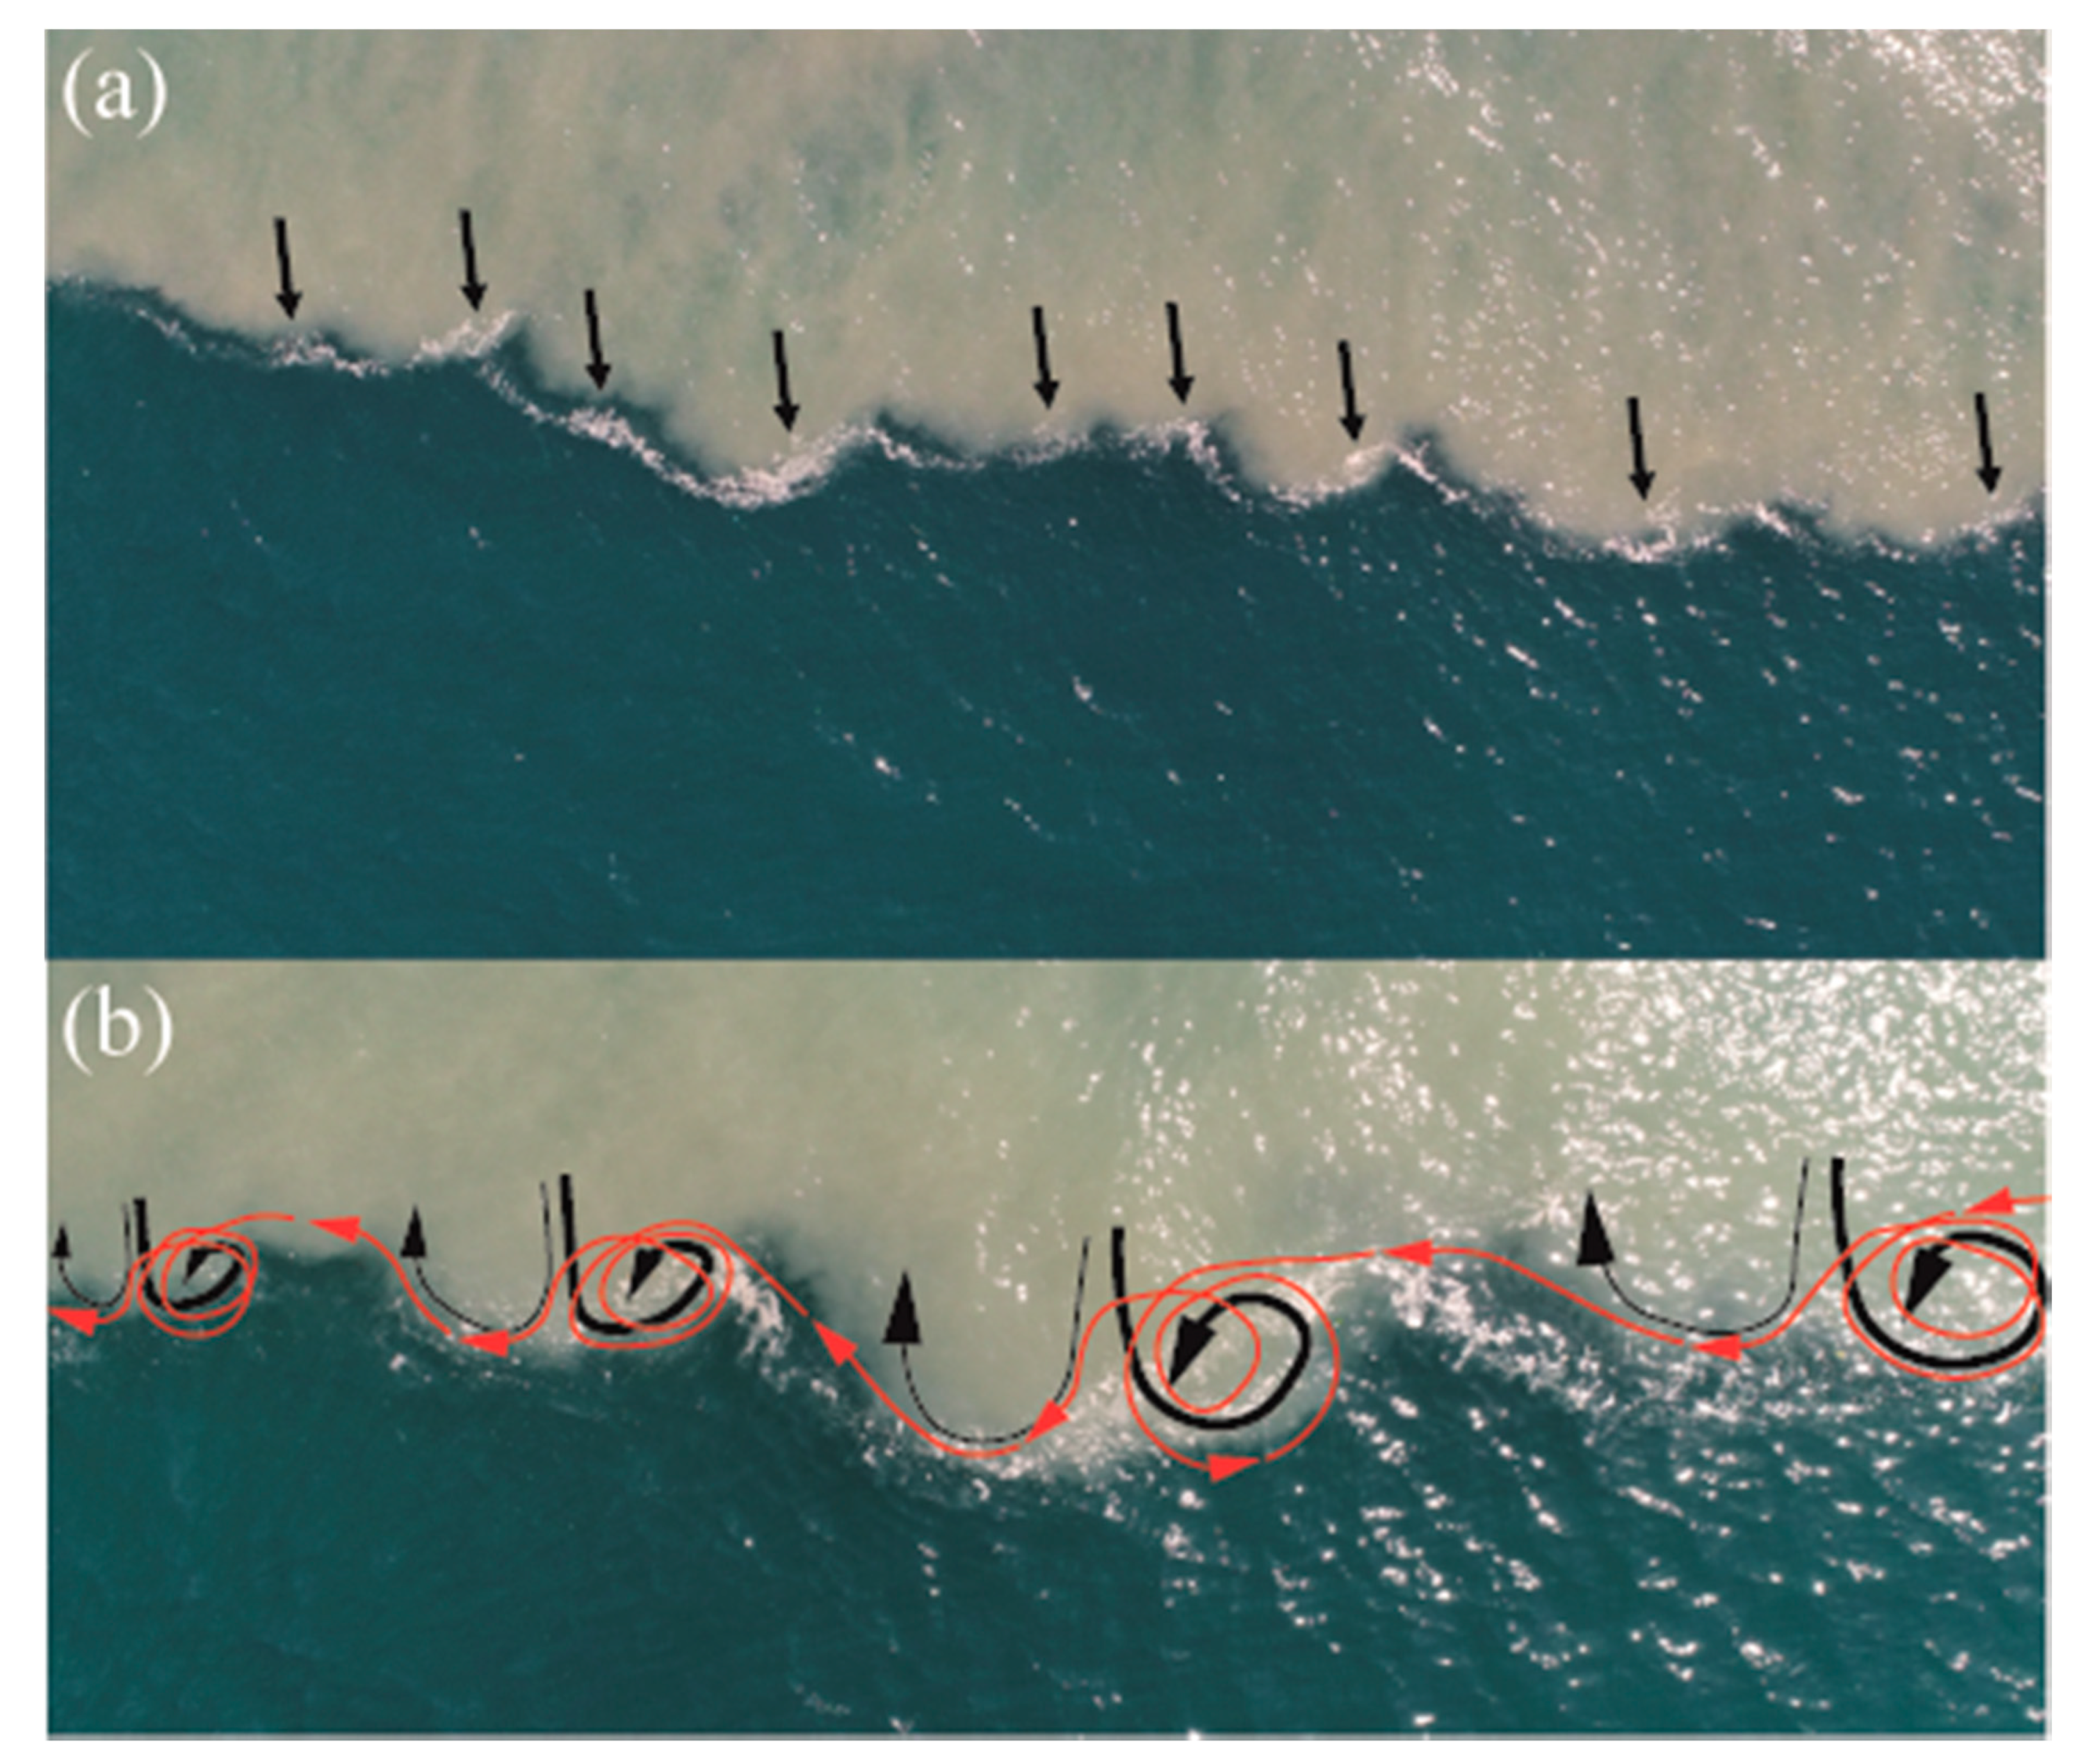
3.3. Undulate Borders of the Kodor and Bzyp plumes

Aerial remote sensing of the Kodor and Bzyp plumes showed undulate structure of long segments of their outer borders manifested by alternation of specific convex and concave segments. These segments are 2–10 m long and up to 2 m wide and hereafter are referred as “lobes” and “clefts” [52,53]. Aerial images of the undulate fronts observed at the Kodor plume border on 1 September, 2018 and at the Bzyp plume border on 1 June 2019 are shown in Figure 12. This lobe-cleft structure was registered only at sharp and narrow frontal zones formed between the emerging plume, on the one hand, and the residual plume or the ambient sea, on the other hand. Lobes and clefts were absent at diffuse fronts, i.e., wide and low-gradient fronts that contour the outer parts of the plumes, which experience intense mixing with the ambient sea. In particular, these undulate fronts commonly extended from the river mouths and bounded the inflowing river jets, i.e., near-field parts of the plumes. These fronts were not observed in the far-field parts of the plumes and in the coastal surf zone during periods of active wave breaking due to intense mixing (Figure 12).
We observed significant short-temporal variability of the undulate fronts induced by the following recurrent process (Figure 13). Once a lobe is formed, it starts to increase seaward. Ballooning of neighboring lobes results in their coalescence and the subsequent merging. At the same time the cleft between these lobes is steadily decreasing and transforms into a spot of saline sea (with area of 0.1–0.5 m2) isolated from the ambient sea, i.e., trapped by the merged lobes within the plume (Figure 13). The merged lobes and the trapped saline sea area finally dissipate, and then the process of formation of new lobes at this part of the plume front restarts. The continuous recurrent process of formation of lobes, their merging, and subsequent dissipationwas observed along the undulate fronts of the Kodor and Bzyp plumes. Residual time of an individual lobe, i.e., from its formation to dissipation, was 1–2 min.
Due to convergence of surface currents at sharp plume fronts [92], foam and floating litter commonly accumulate at the undulate fronts of the plumes (Figure 13a and Figure 14a). Using optical flow processing of aerial video records, we detected motion of foam and floating litter and reconstructed surface circulation along the undulate fronts of the Kodor and Bzyp plumes (Figure 14). The circulation structure within the lobes consists of pairs of cyclonic and anticyclonic vortices that form, balloon, merge, and dissipate with the lobes (black lines in Figure 14b). The trajectories of foam and floating litter revealed that cyclonic vortices are significantly more prominent and intense, as compared to anticyclonic vortices. Foam and floating litter are mainly accumulated within cyclonic eddies, i.e., in the right parts of the lobes if we look from the sea towards the plume (Figure 14a). Foam and floating litter are rotated by cyclonic eddies within the right parts of the lobes during the majority of time of aerial observations. Once a parcel of foam or floating litter is advected off a cyclonic eddy and enters an anticyclonic eddy in the left part of the lobe, it is transported to the outer part of the lobe and then is trapped by the cyclonic eddy in the neighboring (leftward) lobe (red lines in Figure 14b). As a result, these parcels are skipping leftward between the right parts of lobes. Therefore, foam and floating litter are steadily transported to the left along the plume border. The observed large intensity of cyclonic circulation within the lobes, as compared to anticyclonic circulation, is presumed to have the same background as the dominance of cyclonic spirals at satellite images of sea surface caused by differences between the rotary characteristics of cyclonic and anticyclonic eddies in the sea [93].
We presume that the undulate structure of the sharp plume borders is formed due to baroclinic instability between the plumes and the ambient sea. The pressure gradient force across the front is equal to
g Δ ρ ρ s e a h x
where g is the gravity acceleration, Δρ is the density difference between the plume and the ambient sea, ρsea is the density of the sea, h is the depth of the plume, and x is the cross-front direction. In situ measurements performed at the undulate fronts showed that surface salinity abruptly increased across these fronts (2–3 m wide) from 10–12 inside the Kodor plume to 17 outside the Kodor plume (Figure 15b) and from 8–10 inside the Bzyp plume to 16–17 outside the Bzyp plume. The depth of the Kodor plume at the narrow frontal zone was 2 m (Figure 15b), the depth of the Bzyp plume was 4 m. As a result, the values of pressure gradient across these frontal zones calculated from Equation (4) are equal to 0.05 and 0.1 m/s2 for the Kodor and Bzyp plumes, respectively.
This large pressure gradient observed across the plume fronts is the source of potential energy that induces formation of lobes and clefts as follows. Small perturbation of a sharp frontal zone and the subsequent formation of a local convex segment cause increase of local length of the front and, therefore, increase of the cross-front advection induced by the pressure gradient. It results in ballooning of the lobe till it coalesces and merges with the neighboring lobe. Merging of two lobes accompanied by trapping of a spot of saline sea water and its subsequent mixing with the plume water cause a reduction of local salinity anomaly and, therefore, a decrease of local pressure gradient. It hinders formation of a lobe at this segment of the plume, while new lobes are formed at the adjacent segments of the plume front. Therefore, baroclinic instability causes formation, merging, and dissipation of the observed lobe-cleft structures and influences mixing between the river plumes and the ambient sea.
Aerial imagery detected the 3–4 m wide stripe of low-turbid water within the Kodor plume located at the distance of 10–20 m from the undulate border and stretched along this border (Figure 15a). We presume that this low-turbid stripe is formed as a result of continuous trapping of spots of saline sea water by merging lobes. Horner–Devine et al. [53] assumed that the lobe-cleft structure is formed by subsurface vortexes that are propagating from the inner part of the plume towards its border with the ambient sea. However, aerial video records showed stable position and shape of this stripe that evidences absence of any subsurface vortexes described by Horner–Devine et al. [53].

4. Discussion

In this study, we obtained several important results about structure, short-temporal variability, and dynamics of small river plumes. First, we revealed strongly inhomogeneous structure of small plumes manifested by multiple frontal zones between different parts of the plumes. These parts have different structures and dynamical characteristics and interact as individual water masses. Second, we reported fast motion of small plumes caused by interaction with coastal eddies. Third, we observed generation and propagation of different types of internal waves within small plumes. Forth, we described formation of lobe-cleft structures at sharp borders of small plumes and reported intense lateral mixing across these fronts caused by their baroclinic instability. The results listed above are important for understanding spreading and mixing of small plumes, however, they are addressed for the first time as previous related works were mainly limited by low spatial and/or temporal resolution of in situ measurements and satellite imagery. Below we provide physical interpretation of these features observed at the Kodor and Bzyp plumes and discuss importance of their study at other small plumes in the World Ocean.
In general, river plumes are regarded as “smooth” water masses without internal fronts and sharp gradients. This approach is widely used in analytical and numerical modeling studies focused on river plumes, including the fundamental and highly cited papers [82,83,84,85,94,95,96]. Many relevant studies based on in situ and satellite data confirmed that this approach provides realistic results for buoyant plumes formed by large rivers plumes which internal structures indeed are characterized by steady changes of salinity and other characteristics. In this work, we present the results of aerial remote sensing of the Kodor and Bzyp plumes supported by in situ measurements that provide an evidence of strongly inhomogeneous internal structure of small plumes. This structure is manifested by complex internal frontal zones and sharp salinity and turbidity gradients within small plumes. These gradients and frontal zones strongly modify circulation within the plumes, in particular, they hinder cross-frontal advection within the plumes and separate them into semi-isolated, but interacting structures. Therefore, identification and study of the processes that govern formation of frontal zones within small plumes is important for understanding of spreading and mixing of freshwater discharge in the sea and the related transport of river-borne suspended and dissolved material.
The Kodor River inflows to the Black Sea from multiple deltaic branches and forms several river plumes. These plumes are closely located; they interact as individual water masses and coalesce into the common Kodor plume. Interaction, collision, and coalescence of buoyant plumes formed by rivers, which estuaries are located in close proximity, were addressed in several previous studies [86,87,88,97,98,99]. Similar processes occur within plumes formed by freshwater discharge from multiple deltaic branches, as was observed for the Kodor plume. Moreover, generally distances between deltaic branches within one deltaic system are smaller than distances between estuaries of neighboring rivers. As a result, interactions between neighboring plumes formed by different rivers generally occur only during high discharge periods [86], while similar interactions between plumes formed by different deltaic branches is a permanent or almost permanent process at many World regions. However, despite a large number of deltaic rivers inflowing to the World Ocean, we are aware of only one related study that was focused on the interaction between the buoyant plumes formed by different deltaic branches of the Pearl River Delta [100].
The Kodor River has very large intra-day and synoptic variability of discharge rate due to morphology and weather conditions at its drainage basin. This variability of discharge rate induces variability of spatial extents of the Kodor plume and residence time of freshened water within the plume. As a result, the Kodor plume formed during high discharge can have different spatial and thermohaline characteristics from those formed during low discharge. In case of abrupt decrease of river discharge rate, the relatively large and mixed residual plume (formed during high discharge period) interacts with the small and freshened emergent plume (formed during the subsequent low discharge period). We report distinct frontal zones and differences in dynamics between the residual and the emergent parts of the Kodor plume. Several previous studies addressed response of river plumes to variable discharge rates [101,102,103,104,105,106,107], but limited attention was paid to interaction between parts of an individual river plume formed during different discharge conditions [108]. This feature can strongly affect spreading and mixing of freshwater discharge from small rivers in many World regions and should be considered in the related studies.
Several studies addressed interaction between coastal bathymetry and bottom-advected river plumes, which occupy the whole water column from surface to seafloor and, therefore, experience intense bottom friction [109,110,111]. In these numerical studies, river plumes were spreading over sea areas with idealized bathymetry, which was steadily sloping in the cross-shore direction and was homogenous in the alongshore direction. Influence of realistic bottom topography on surface-advected river plumes was described by Korotenko et al. [112]. Bottom-generated turbulent mixing induced by coastal circulation penetrates upward and reaches surface layer over shallow zones, therefore, increased local mixing of river plumes occurs at these zones. We presume that a similar mechanism induced intensified mixing of the Kodor plume over the shoal revealed by aerial imagery and in situ measurements. Moreover, we observed that the intense flow of the Kodor plume over this small shoal results in formation of large area within the plume with elevated salinity, which is bounded by the distinct frontal zone. We are not aware of any work describing this effect at river plumes, however, it can be typical for many small plumes with small vertical scales flowing over bathymetric features.
In this study, we address several important dynamical features of small river plumes. Aerial remote sensing revealed a quick motion of the Kodor plume border (~0.5–1 m/s) entrained by the rotating coastal eddy. Such extremely rapid response of a river plume to coastal sea circulation has not been reported before, to the extent of our knowledge. The previous studies showed that general spreading patterns of small plumes are governed by wind forcing, while the impact of ambient circulation was regarded as negligible [113,114,115]. We demonstrate that energetic features of coastal circulation, e.g., eddies, can induce high velocity motion of plume fronts and, therefore, influence dynamics of a small plume, albeit locally and during short-term periods.
The rotating eddy generated high-frequency internal waves that were propagating within the Kodor plume and dissipated at its border with the ambient sea. Aerial remote sensing also observed multiple long internal waves propagating within the Kodor plume towards the coast, as well as generation of high-frequency internal waves near the mouth of the Bzyp River and their propagation within the Bzyp plume towards the open sea. Internal waves are common features of river plumes in non-tidal seas and their surface manifestations observed by satellite imagery were reported in several previous studies [116,117]. These internal waves can significantly affect mixing of small plumes with subjacent saline sea [33]. In this study, we demonstrate the efficiency of aerial remote sensing in observations of surface manifestations of internal waves, and the ability of aerial remote sensing (in contrast to satellite observations) to measure their spatial and dynamical characteristics and to identify mechanisms of their generation.
Finally, in this study, we address the undulate structure of the sharp borders of the Kodor and Bzyp plumes that were previously observed and reported at other small plumes [52,53,118,119]. Horner–Devine and Chickadel [53] associated formation of the lobe-cleft structures observed at the Merrimack plume with subsurface vortexes that were propagating from the inner part of the plume towards its border with saline sea. Based on processing of aerial video records, we reconstruct surface circulation at the undulate fronts of the Kodor and Bzyp plume and detected similar vortexes within the lobes. However, we observed absence of vortexes outside the frontal zones, i.e., no vortexes were propagating from the inner parts of the plume towards their borders. On the opposite, we observed the recurrent process of formation, merging, and dissipation of lobes, that was not described before. Based on these results, we suggest an alternative mechanism of formation of the undulate fronts caused by baroclinic instability between the plume and the ambient sea and ballooning of local convex segments of the frontal zone in response to its small perturbations. This mechanism is in a good agreement with the reconstructed vortex circulation within the lobes and explains absence of vortexes in the inner parts of the plumes. We reveal intense transport of saline sea water across the undulate plume border as a result of merging of lobes and mechanical trapping of spots of saline sea inside the plume. It can be an important mechanism of mixing between the plume and the saline sea and should be considered together with shear-induced mixing of the plume and the subjacent sea. Satellite imagery reveals that undulate frontal zones are, therefore, the related mixing mechanism are typical for many small plumes in the World. Therefore, study of this mechanism is important in context of transformation and dissipation of freshwater discharge in the sea.

5. Conclusions

In this work, we focused on small buoyant plumes formed by the Kodor and Bzyp rivers located at the northeastern part of the Black Sea. We used quadcopters equipped with video camera to perform aerial remote sensing of these river plumes, which was accompanied by synchronous in situ measurements in the sea. Using an optical flow approach, we reconstructed surface velocity fields within these plumes from the obtained aerial video records. Based on aerial imagery and video records, the reconstructed surface currents, as well as in situ salinity, turbidity, and velocity measurements, we obtained new insights into spatial structure, short-temporal variability, and dynamical features of small river plumes, which are not typical for plumes formed by large rivers.
Based on the obtained aerial and in situ data, we address several different issues, including the methodology and value of the aerial observations of small river plumes, the differences between small and large plumes, the influence of multiple freshwater sources on the structure of a small plume, the influence of bathymetry features on the structure of a small plume, the interaction between small plumes and coastal circulation, the presence of internal waves in river plumes, and the presence of small-scale instabilities along the plume front boundary. The main results obtained in this study are the following. We describe strongly inhomogeneous structure of small plumes, as compared to large plumes. We suggest a new mechanism of mixing of a small plume with ambient sea as a result of baroclinic instability at its outer boundary. We describe internal waves formed within near- and far-filed parts of small plumes, which can strongly influence its mixing with ambient sea. These results are important for understanding the fate of freshwater discharge from small rivers and the related transport of suspended and dissolved river-borne constituents in many coastal sea areas in the World Ocean.
Usage of quadcopters provides ability to perform low-cost aerial remote sensing of coastal sea areas and continuously observe surface manifestations of many coastal processes. In this study, we demonstrate its efficiency in observations of small river plumes characterized by high color contrast with ambient sea, energetic motion, and high short-temporal variability. Aerial imagery can be used for visual detection and tracking of many other processes at small spatial (from meters to kilometers) and temporal (from seconds to hours) scales, which are visible neither from shipboard nor satellite imagery. Spatial scales and motion speeds of the observed processes can be reconstructed from aerial imagery and video records (Supplementary Materials). Therefore, aerial drones can provide quantitative measurements of distances and velocities at sea surface. Finally, aerial remote sensing can be very useful for operational organization of in situ measurements during field surveys, in particular, for selection of places for water sampling and hydrological measurements according to real-time position of the observed sea surface processes. As a result, future studies based on imagery and video records of ocean surface acquired from aerial drones (considering certain important limitations of their usage) and supported by in situ measurements hold promise to significantly improve understanding of various upper ocean features and dynamics.

Supplementary Materials

The aerial images and video records are publicly available at https://doi.org/10.5281/zenodo.3901896. The Sentinel-2 Level-1C products were downloaded from the Copernicus Open Access Hub https://scihub.copernicus.eu/.

Author Contributions

Conceptualization, A.O.; measurements, A.O., A.B., R.S., and R.Z.; formal analysis, A.O.; investigation, A.O., A.B., R.S., R.Z., and R.D.; writing, A.O., A.B., R.S., R.Z., and R.D. All authors have read and agreed to the published version of the manuscript.

Funding

This research was funded by the Ministry of Science and Higher Education of Russia, theme 0149-2019-0003 (collecting and processing of in situ data), the Russian Science Foundation, research project 18-17-00156 (collecting and processing of aerial imagery, study of spreading of river plumes) and the Russian Ministry of Science and Higher Education, research project 14.W03.31.0006 (study of submesoscale dynamics of river plumes).

Acknowledgments

The authors are grateful to the editor Melissa Zhu and five anonymous reviewers for their comments and recommendations that served to improve the article.

Conflicts of Interest

The authors declare no conflict of interest.

References

  1. Klemas, V.V. Airborne remote sensing of coastal features and processes: An overview. J. Coast. Res. 2013, 29, 239–255. [Google Scholar] [CrossRef]
  2. Holman, R.; Haller, M.C. Remote sensing of the nearshore. Annu. Rev. Mar. Sci. 2013, 5, 95–113. [Google Scholar] [CrossRef] [PubMed] [Green Version]
  3. Colomina, I.; Molina, P. Unmanned aerial systems for photogrammetry and remote sensing: A review. ISPRS J. Photogramm. 2014, 92, 79–97. [Google Scholar] [CrossRef] [Green Version]
  4. Klemas, V.V. Coastal and environmental remote sensing from unmanned aerial vehicles: An overview. J. Coast. Res. 2015, 31, 1260–1267. [Google Scholar] [CrossRef] [Green Version]
  5. Floreano, D.; Wood, R.J. Science, technology and the future of small autonomous drones. Nature 2015, 521, 460–466. [Google Scholar] [CrossRef] [Green Version]
  6. El Mahrad, B.; Newton, A.; Icely, J.D.; Kacimi, I.; Abalansa, S.; Snoussi, M. Contribution of remote sensing technologies to a holistic coastal and marine environmental management framework: A review. Remote Sens. 2020, 12, 2313. [Google Scholar] [CrossRef]
  7. Casella, E.; Rovere, A.; Pedroncini, A.; Stark, C.P.; Casella, M.; Ferrari, M.; Firpo, M. Drones as tools for monitoring beach topography changes in the Ligurian Sea (NW Mediterranean). Geo-Mar. Lett. 2016, 36, 151–163. [Google Scholar] [CrossRef]
  8. Topouzelis, K.; Papakonstantinou, A.; Doukari, M. Coastline change detection using unmanned aerial vehicles and image processing techniques. Fresenius Environ. Bull. 2017, 26, 5564–5571. [Google Scholar]
  9. Holman, R.A.; Holland, K.T.; Lalejini, D.M.; Spansel, S.D. Surf zone characterization from Unmanned Aerial Vehicle imagery. Ocean Dyn. 2011, 61, 1927–1935. [Google Scholar] [CrossRef]
  10. Turner, I.L.; Harley, M.D.; Drummond, C.D. UAVs for coastal surveying. Coast. Eng. 2016, 114, 19–24. [Google Scholar] [CrossRef]
  11. Papakonstantinou, A.; Topouzelis, K.; Pavlogeorgatos, G. Coastline zones identification and 3D coastal mapping using UAV spatial data. ISPRS Int. J. Geo-Inf. 2016, 5, 75. [Google Scholar] [CrossRef] [Green Version]
  12. Holman, R.A.; Brodie, K.L.; Spore, N.J. Surf zone characterization using a small quadcopter: Technical issues and procedures. IEEE Trans. Geosci. Remote Sens. 2017, 9, 2017–2027. [Google Scholar] [CrossRef]
  13. Ventura, D.; Bruno, M.; Lasinio, G.J.; Belluscio, A.; Ardizzone, G. A low-cost drone based application for identifying and mapping of coastal fish nursery grounds. Estuar. Coast. Shelf Sci. 2016, 171, 85–98. [Google Scholar] [CrossRef]
  14. Hodgson, A.; Kelly, N.; Peel, D. Unmanned aerial vehicles (UAVs) for surveying Marine Fauna: A dugong case study. PLoS ONE 2013, 8, e79556. [Google Scholar] [CrossRef] [Green Version]
  15. Burns, J.; Delparte, D.; Gates, R. Takabayashi Integrating structure-from-motion photogrammetry with geospatial software as a novel technique for quantifying 3D ecological characteristics of coral reefs. PeerJ 2015, 3, e1077. [Google Scholar] [CrossRef]
  16. Casella, E.; Collin, A.; Harris, D.; Ferse, S.; Bejarano, S.; Parravicini, V.; Hench, J.L.; Rovere, A. Mapping coral reefs using consumer-grade drones and structure from motion photogrammetry techniques. Coral Reefs 2017, 36, 269–275. [Google Scholar] [CrossRef]
  17. Fiori, L.; Doshi, A.; Martinez, E.; Orams, M.B.; Bollard-Breen, B. The use of unmanned aerial systems in marine mammal research. Remote Sens. 2017, 9, 543. [Google Scholar] [CrossRef] [Green Version]
  18. Murfitt, S.L.; Allan, B.M.; Bellgrove, A.; Rattray, A.; Young, M.A.; Ierodiaconou, D. Applications of unmanned aerial vehicles in intertidal reef monitoring. Sci. Rep. 2017, 7, 10259. [Google Scholar] [CrossRef] [Green Version]
  19. Torres, L.G.; Nieukirk, S.L.; Lemos, L.; Chandler, T.E. Drone up! Quantifying whale behavior from a new perspective improves observational capacity. Front. Mar. Sci. 2018, 5, 319. [Google Scholar] [CrossRef] [Green Version]
  20. Papakonstantinou, A.; Stamati, C.; Topouzelis, K. Comparison of true-color and multispectral unmanned aerial systems imagery for marine habitat mapping using object-based image analysis. Remote Sens. 2020, 12, 554. [Google Scholar] [CrossRef] [Green Version]
  21. Provost, E.J.; Butcher, P.A.; Coleman, M.A.; Kelaher, B.P. Assessing the viability of small aerial drones to quantify recreational fishers. Fish Manag. Ecol. 2020, 1–7. [Google Scholar] [CrossRef]
  22. Fallati, L.; Saponari, L.; Savini, A.; Marchese, F.; Corselli, C.; Galli, P. Multi-Temporal UAV Data and object-based image analysis (OBIA) for estimation of substrate changes in a post-bleaching scenario on a maldivian reef. Remote Sens. 2020, 12, 2093. [Google Scholar] [CrossRef]
  23. Hakvoort, H.; de Haan, J.; Jordans, R.; Vos, R.; Peters, S.; Rijkeboer, M. Towards airborne remote sensing of water quality in The Netherlands—validation and error analysis. ISPRS J. Photogramm. Remote Sens. 2002, 57, 171–183. [Google Scholar] [CrossRef]
  24. Klemas, V. Tracking oil slicks and predicting their trajectories using remote sensors and models: Case studies of the Sea Princess and Deepwater Horizon oil spills. J. Coast. Res. 2010, 26, 789–797. [Google Scholar] [CrossRef] [Green Version]
  25. Svejkovsky, J.; Nezlin, N.P.; Mustain, N.M.; Kum, J.B. Tracking stormwater discharge plumes and water quality of the Tijuana River with multispectral aerial imagery. Estuar. Coast. Shelf Sci. 2010, 87, 387–398. [Google Scholar] [CrossRef]
  26. Androulidakis, Y.; Kourafalou, V.; Ozgokmen, T.; Garcia-Pineda, O.; Lund, B.; Le Henaff, M.; Hu, C.; Haus, B.K.; Novelli, G.; Guigand, C.; et al. Influence of river-induced fronts on hydrocarbon transport: A multiplatform observational study. J. Geophys. Res. Oceans 2018, 123, 3259–3285. [Google Scholar] [CrossRef] [Green Version]
  27. Garaba, S.P.; Dierssen, H.M. An airborne remote sensing case study of synthetic hydrocarbon detection using short wave infrared absorption features identified from marine-harvested macro-and microplastics. Remote Sens. Environ. 2018, 205, 224–235. [Google Scholar] [CrossRef]
  28. Fallati, L.; Polidori, A.; Salvatore, C.; Saponari, L.; Savini, A.; Galli, P. Anthropogenic Marine Debris assessment with Unmanned Aerial Vehicle imagery and deep learning: A case study along the beaches of the Republic of Maldives. Sci. Total Environ. 2019, 693, 133581. [Google Scholar] [CrossRef]
  29. Savelyev, I.; Miller, W.D.; Sletten, M.; Smith, G.B.; Savidge, D.K.; Frick, G.; Menk, S.; Moore, T.; De Paolo, T.; Terrill, E.J.; et al. Airborne remote sensing of the upper ocean turbulence during CASPER-East. Remote Sens. 2018, 10, 1224. [Google Scholar] [CrossRef] [Green Version]
  30. Stresser, M.; Carrasco, R.; Horstmann, J. Video-based estimation of surface currents using a low-cost quadcopter. IEEE Geosci. Remote Sens. Lett. 2017, 14, 2027–2031. [Google Scholar] [CrossRef] [Green Version]
  31. Jung, D.; Lee, J.S.; Baek, J.Y.; Nam, J.; Jo, Y.H.; Song, K.M.; Cheong, Y.I. High temporal and spatial resolutions of sea surface current from low-altitude remote sensing. J. Coast. Res. 2019, 90, 282–288. [Google Scholar] [CrossRef]
  32. Ouillon, S.; Forget, P.; Froidefond, J.M.; Naudin, J.J. Estimating suspended matter concentrations from SPOT data and from field measurements in the Rhône river plume. Mar. Technol. Soc. J. 1997, 31, 15. [Google Scholar]
  33. Osadchiev, A.A. Small mountainous rivers generate high-frequency internal waves in coastal ocean. Sci. Rep. 2018, 8, 16609. [Google Scholar] [CrossRef] [PubMed]
  34. Devlin, M.J.; McKinna, L.W.; Alvarez-Romero, J.G.; Petus, C.; Abott, B.; Harkness, P.; Brodie, J. Mapping the pollutants in surface riverine flood plume waters in the Great Barrier Reef, Australia. Mar. Poll. Bull. 2012, 65, 224–235. [Google Scholar] [CrossRef] [PubMed]
  35. Brando, V.E.; Braga, F.; Zaggia, L.; Giardino, C.; Bresciani, M.; Matta, E.; Bellafiore, D.; Ferrarin, C.; Maicu, F.; Benetazzo, A.; et al. High-resolution satellite turbidity and sea surface temperature observations of river plume interactions during a significant flood event. Ocean Sci. 2015, 11, 909. [Google Scholar] [CrossRef] [Green Version]
  36. Nezlin, N.P.; DiGiacomo, P.M. Satellite ocean color observations of stormwater runoff plumes along the San Pedro Shelf (southern California) during 1997 to 2003. Continent. Shelf Res. 2005, 25, 1692–1711. [Google Scholar] [CrossRef]
  37. Osadchiev, A.A.; Sedakov, R.O. Spreading dynamics of small river plumes off the northeastern coast of the Black Sea observed by Landsat 8 and Sentinel-2. Remote Sens. Environ. 2019, 221, 522–533. [Google Scholar] [CrossRef]
  38. Nezlin, N.P.; DiGiacomo, P.M.; Stein, E.D.; Ackerman, D. Stormwater runoff plumes observed by SeaWiFS radiometer in the Southern California Bight. Remote Sens. Environ. 2005, 98, 494–510. [Google Scholar] [CrossRef]
  39. Constantin, S.; Doxaran, D.; Constantinescu, Ș. Estimation of water turbidity and analysis of its spatio-temporal variability in the Danube River plume (Black Sea) using MODIS satellite data. Cont. Shelf Res. 2016, 112, 14–30. [Google Scholar] [CrossRef]
  40. Gangloff, A.; Verney, R.; Doxaran, D.; Ody, A.; Estournel, C. Investigating Rhône River plume (Gulf of Lions, France) dynamics using metrics analysis from the MERIS 300m Ocean Color archive (2002–2012). Cont. Shelf Res. 2017, 144, 98–111. [Google Scholar] [CrossRef] [Green Version]
  41. Warrick, J.A.; Mertes, L.A.; Washburn, L.; Siegel, D.A. A conceptual model for river water and sediment dispersal in the Santa Barbara Channel, California. Cont. Shelf Res. 2004, 24, 2029–2043. [Google Scholar] [CrossRef]
  42. Lihan, T.; Saitoh, S.I.; Iida, T.; Hirawake, T.; Iida, K. Satellite-measured temporal and spatial variability of the Tokachi River plume. Estuar. Coast. Shelf Sci. 2008, 78, 237–249. [Google Scholar] [CrossRef]
  43. Jiang, L.; Yan, X.H.; Klemas, V. Remote sensing for the identification of coastal plumes: Case studies of Delaware Bay. Int. J. Remote Sens. 2009, 30, 2033–2048. [Google Scholar] [CrossRef]
  44. Grodsky, S.A.; Reverdin, G.; Carton, J.A.; Coles, V.J. Year-to-year salinity changes in the Amazon plume: Contrasting 2011 and 2012 Aquarius/SACD and SMOS satellite data. Remote Sens. Environ. 2014, 140, 14–22. [Google Scholar] [CrossRef]
  45. Reul, N.; Quilfen, Y.; Chapron, B.; Fournier, S.; Kudryavtsev, V.; Sabia, R. Multisensor observations of the Amazon-Orinoco river plume interactions with hurricanes. J. Geophys. Res. Oceans 2014, 119, 8271–8295. [Google Scholar] [CrossRef] [Green Version]
  46. Korosov, A.; Counillon, F.; Johannessen, J.A. Monitoring the spreading of the A mazon freshwater plume by MODIS, SMOS, A quarius, and TOPAZ. J. Geophys. Res. Oceans 2015, 120, 268–283. [Google Scholar] [CrossRef]
  47. Hessner, K.; Rubino, A.; Brandt, P.; Alpers, W. The Rhine outflow plume studied by the analysis of synthetic aperture radar data and numerical simulations. J. Phys. Oceanogr. 2001, 31, 3030–3044. [Google Scholar] [CrossRef] [Green Version]
  48. DiGiacomo, P.M.; Washburn, L.; Holt, B.; Jones, B.H. Coastal pollution hazards in southern California observed by SAR imagery: Stormwater plumes, wastewater plumes, and natural hydrocarbon seeps. Mar. Poll. Bull. 2004, 49, 1013–1024. [Google Scholar] [CrossRef]
  49. Zheng, Q.; Clemente-Colón, P.; Yan, X.H.; Liu, W.T.; Huang, N.E. Satellite synthetic aperture radar detection of Delaware Bay plumes: Jet-like feature analysis. J. Geophys. Res. Oceans 2004, 109, C03031. [Google Scholar] [CrossRef]
  50. Perez, T.; Wesson, J.; Burrage, D. Airborne remote sensing of the Rio de la Plata plume using STARRS. Sea Technol. 2006, 47, 31–34. [Google Scholar]
  51. Burrage, D.; Wesson, J.; Martinez, C.; Perez, T.; Moller, O., Jr.; Piola, A. Patos Lagoon outflow within the Río de la Plata plume using an airborne salinity mapper: Observing an embedded plume. Cont. Shelf Res. 2008, 28, 1625–1638. [Google Scholar] [CrossRef]
  52. Horner-Devine, A.; Chickadel, C.C.; MacDonald, D. Coherent structures and mixing at a river plume front. In Coherent Flow Structures in Geophysical Flows at the Earth’s Surface; Venditti, J., Best, J.L., Church, M., Hardy, R.J., Eds.; Wiley: Chichester, UK, 2013; pp. 359–369. [Google Scholar] [CrossRef]
  53. Horner-Devine, A.R.; Chickadel, C.C. Lobe-cleft instability in the buoyant gravity current generated by estuarine outflow. Geophys. Res. Lett. 2017, 44, 5001–5007. [Google Scholar] [CrossRef]
  54. Milliman, J.D.; Syvitski, J.P.M. Geomorphic-tectonic control of sediment discharge to the ocean: The importance of small mountainous rivers. J. Geol. 1992, 100, 525–544. [Google Scholar] [CrossRef]
  55. Milliman, J.D.; Farnsworth, K.L.; Albertin, C.S. Flux and fate of fluvial sediments leaving large islands in the East Indies. J. Sea Res. 1999, 41, 97–107. [Google Scholar] [CrossRef]
  56. Milliman, J.D.; Lin, S.W.; Kao, S.J.; Liu, J.P.; Liu, C.S.; Chiu, J.K.; Lin, Y.C. Short-term changes in seafloor character due to flood-derived hyperpycnal discharge: Typhoon Mindulle, Taiwan, July 2004. Geology 2007, 35, 779–782. [Google Scholar] [CrossRef] [Green Version]
  57. Osadchiev, A.A.; Zavialov, P.O. Structure and dynamics of plumes generated by small rivers. In Estuaries and Coastal Zones—Dynamics and Response to Environmental Changes; Pan, J., Ed.; IntechOpen: London, UK, 2019. [Google Scholar] [CrossRef] [Green Version]
  58. Korotkina, О. A.; Zavialov, P.O.; Osadchiev, А. A. Submesoscale variability of the current and wind fields in the coastal region of Sochi. Oceanology 2011, 51, 745–754. [Google Scholar] [CrossRef]
  59. Korotkina, О. A.; Zavialov, P.O.; Osadchiev, А. A. Synoptic variability of currents in the coastal waters of Sochi. Oceanology 2014, 54, 545–556. [Google Scholar] [CrossRef]
  60. Xia, M.; Xie, L.; Pietrafesa, L.J. Winds and the orientation of a coastal plane estuary plume. Geophys. Res. Lett. 2010, 37, L19601. [Google Scholar] [CrossRef] [Green Version]
  61. Xia, M.; Xie, L.; Pietrafesa, L.J.; Whitney, M.M. The ideal response of a Gulf of Mexico estuary plume to wind forcing: Its connection with salt flux and a Lagrangian view. J. Geophys. Res. Oceans 2011, 116, C8. [Google Scholar] [CrossRef]
  62. Zavialov, P.O.; Makkaveev, P.N.; Konovalov, B.V.; Osadchiev, A.A.; Khlebopashev, P.V.; Pelevin, V.V.; Grabovskiy, A.B.; Izhitskiy, A.S.; Goncharenko, I.V.; Soloviev, D.M.; et al. Hydrophysical and hydrochemical characteristics of the sea areas adjacent to the estuaries of small rivers if the Russian coast of the Black Sea. Oceanology 2014, 54, 265–280. [Google Scholar] [CrossRef]
  63. Osadchiev, A.A. A method for quantifying freshwater discharge rates from satellite observations and Lagrangian numerical modeling of river plumes. Environ. Res. Lett. 2015, 10, 085009. [Google Scholar] [CrossRef] [Green Version]
  64. Osadchiev, A.A. Estimation of river discharge based on remote sensing of a river plume. In Proceedings of the SPIE Remote Sensing, Toulouse, France, 14 October 2015. [Google Scholar] [CrossRef]
  65. Jaoshvili, S. The rivers of the Black Sea; Chomeriki, I., Gigineishvili, G., Kordzadze, A., Eds.; Technical Report No. 71; European Environmental Agency: Copenhagen, Denmark, 2002. [Google Scholar]
  66. Korotaev, G.; Oguz, T.; Nikiforov, A.; Koblinsky, C. Seasonal, interannual, and mesoscale variability of the Black Sea upper layer circulation derived from altimeter data. J. Geophys. Res. 2003, 108, 3122. [Google Scholar] [CrossRef]
  67. Ivanov, V.A.; Belokopytov, V.N. Oceanography of the Black Sea; ECOSY-Gidrofizika: Sevastopol, Ukraine, 2013. [Google Scholar]
  68. Ginzburg, A.I.; Kostianoy, A.G.; Krivosheya, V.G.; Nezlin, N.P.; Soloviev, D.M.; Stanichny, S.V.; Yakubenko, V.G. Mesoscale eddies and related processes in the northeastern Black Sea. J. Mar. Syst. 2002, 32, 71–90. [Google Scholar] [CrossRef]
  69. Zatsepin, A.G.; Ginzburg, A.I.; Kostianoy, A.G.; Kremenetskiy, V.V.; Krivosheya, V.G.; Poulain, P.-M.; Stanichny, S.V. Observation of Black Sea mesoscale eddies and associated horizontal mixing. J. Geophys. Res. 2003, 108, 1–27. [Google Scholar] [CrossRef]
  70. Kubryakov, A.A.; Stanichny, S.V. Seasonal and interannual variability of the Black Sea eddies and its dependence on characteristics of the large-scale circulation. Deep Sea Res. 2015, 97, 80–91. [Google Scholar] [CrossRef]
  71. Medvedev, I.P.; Rabinovich, A.B.; Kulikov, E.A. Tides in three enclosed basins: The Baltic, Black, and Caspian seas. Front. Mar. Sci. 2016, 3, 46. [Google Scholar] [CrossRef] [Green Version]
  72. Medvedev, I.P. Tides in the Black Sea: Observations and numerical modelling. Pure Appl. Geophys. 2018, 175, 1951–1969. [Google Scholar] [CrossRef]
  73. Podymov, O.I.; Zatsepin, A.G. Seasonal anomalies of water salinity in the Gelendzhik region of the Black Sea according to shipborne monitoring data. Oceanology 2016, 56, 342–354. [Google Scholar] [CrossRef]
  74. Doukari, M.; Batsaris, M.; Papakonstantinou, A.; Topouzelis, K. A protocol for aerial survey in coastal areas using UAS. Remote Sens. 2019, 11, 1913. [Google Scholar] [CrossRef] [Green Version]
  75. Zavialov, P.O.; Izhitskiy, A.S.; Osadchiev, A.A.; Pelevin, V.V.; Grabovskiy, A.B. The structure of thermohaline and bio-optical fields in the surface layer of the Kara Sea in September 2011. Oceanology 2015, 55, 461–471. [Google Scholar] [CrossRef]
  76. Baker, S.; Scharstein, D.; Lewis, J.; Roth, S.; Black, M.; Szeliski, R. A database and evaluation methodology for optical flow. Int. J. Comp. Vis. 2011, 92, 1–31. [Google Scholar] [CrossRef] [Green Version]
  77. Fortun, D.; Bouthemy, P.; Kervrann, C. Optical flow modeling and computation: A survey. Comput. Vis. Image Underst. 2015, 134, 1–21. [Google Scholar] [CrossRef] [Green Version]
  78. Farneback, G. Two-frame motion estimation based on polynomial expansion. In Proceedings of the 13th Scandinavian Conference on Image Analysis, Halmstad, Sweden, 29 June–2 July 2003; Bigun, J., Gustavsson, T., Eds.; Springer: Berlin/Heidelberg, Germany. [Google Scholar] [CrossRef] [Green Version]
  79. O’Donnell, J.; Ackleson, S.G.; Levine, E.R. On the spatial scales of a river plume. J. Geophys. Res. Oceans 2008, 113, C4. [Google Scholar] [CrossRef] [Green Version]
  80. Horner-Devine, A.R.; Hetland, R.D.; MacDonald, D.G. Mixing and transport in coastal river plumes. Ann. Rev. Mar. Sci. 2015, 47, 569–594. [Google Scholar] [CrossRef]
  81. Zavialov, P.O.; Pelevin, V.V.; Belyaev, N.A.; Izhitskiy, A.S.; Konovalov, B.V.; Krementskiy, V.V.; Goncharenko, I.V.; Osadchiev, A.A.; Soloviev, D.M.; Garcia, C.A.E.; et al. High resolution LiDAR measurements reveal fine internal structure and variability of sediment-carrying coastal plume. Estuar. Coast. Shelf Sci. 2018, 205, 40–45. [Google Scholar] [CrossRef]
  82. Yankovsky, A.E.; Chapman, D.C. A simple theory for the fate of buoyant coastal discharges. J. Phys. Oceanogr. 1997, 27, 1386–1401. [Google Scholar] [CrossRef] [Green Version]
  83. Fong, D.A.; Geyer, W.R. The alongshore transport of freshwater in a surface-trapped river plume. J. Phys. Oceanogr. 2002, 32, 957–972. [Google Scholar] [CrossRef]
  84. Whitney, M.M.; Garvine, R.W. Wind influence on a coastal buoyant outflow. J. Geophys. Res. 2005, 110, C03014. [Google Scholar] [CrossRef]
  85. Choi, B.-J.; Wilkin, J.L. The effect of wind on the dispersal of the Hudson River plume. J. Phys. Oceanogr. 2007, 37, 1878–1897. [Google Scholar] [CrossRef]
  86. Warrick, J.A.; Farnsworth, K.L. Coastal river plumes: Collisions and coalescence. Prog. Oceanogr. 2017, 151, 245–260. [Google Scholar] [CrossRef]
  87. Osadchiev, A.A.; Korshenko, E.A. Small river plumes off the north-eastern coast of the Black Sea under average climatic and flooding discharge. Ocean Sci. 2017, 13, 465–482. [Google Scholar] [CrossRef] [Green Version]
  88. Osadchiev, A.A.; Sedakov, R.O. Reconstruction of ocean surface currents using near simultaneous satellite imagery. In Proceedings of the International Geosciences and Remote Sensing Symposium, Yokohama, Japan, 28 July–2 August 2019; IEEE: New York, NY, USA. [Google Scholar] [CrossRef]
  89. Alexeevsky, N.I.; Magritsky, D.V.; Koltermann, K.P.; Krylenko, I.N.; Toropov, P.A. Causes and systematics of inundations of the Krasnodar territory on the Russian Black Sea coast. Nat. Hazard. Earth Syst. 2016, 16, 1289–1308. [Google Scholar] [CrossRef] [Green Version]
  90. Marchevsky, I.K.; Osadchiev, A.A.; Popov, A.Y. Numerical modelling of high-frequency internal waves generated by river discharge in coastal ocean. In Proceedings of the 5th International Conference on Geographical Information Systems Theory, Applications and Management, Heraklion, Crete, Greece, 3–5 May 2019; Scitepress: Setubal, Portugal. [Google Scholar] [CrossRef]
  91. McPherson, R.A.; Stevens, C.L.; O’Callaghan, J.M.; Lucas, A.J.; Nash, J.D. The role of turbulence and internal waves in the structure and evolution of a near-field river plume. Ocean Sci. 2020, 16, 799–815. [Google Scholar] [CrossRef]
  92. O’Donnell, J.; Marmorino, G.O.; Trump, C.L. Convergence and downwelling at a river plume front. J. Phys. Oceanogr. 1998, 28, 1481–1495. [Google Scholar] [CrossRef]
  93. Zhurbas, V.; Väli, G.; Kuzmina, N. Rotation of floating particles in submesoscale cyclonic and anticyclonic eddies: A model study for the southeastern Baltic Sea. Ocean Sci. 2019, 15, 1691–1705. [Google Scholar] [CrossRef] [Green Version]
  94. Garvine, R.W. Estuary plumes and fronts in shelf waters: A layer model. J. Phys. Oceanogr. 1987, 17, 1877–1896. [Google Scholar] [CrossRef] [Green Version]
  95. O’Donnell, J. The formation and fate of a river plume: A numerical model. J. Phys. Oceanogr. 1990, 20, 551–569. [Google Scholar] [CrossRef]
  96. Hetland, R.D. Relating river plume structure to vertical mixing. J. of Phys. Oceanogr. 2005, 35, 1667–1688. [Google Scholar] [CrossRef]
  97. Saldias, G.S.; Sobarzo, M.; Largier, J.; Moffat, C.; Letelier, R. Seasonal variability of turbid river plumes off central Chile based on high-resolution MODIS imagery. Remote Sens. Env. 2012, 123, 220–233. [Google Scholar] [CrossRef]
  98. Saldias, G.S.; Largier, J.L.; Mendes, R.; Perez-Santos, I.; Vargas, C.A.; Sobarzo, M. Satellite-measured interannual variability of turbid river plumes off central-southern Chile: Spatial patterns and the influence of climate variability. Progr. Oceanogr. 2016, 146, 212–222. [Google Scholar] [CrossRef]
  99. Osadchiev, A.A.; Izhitskiy, A.S.; Zavialov, P.O.; Kremenetskiy, V.V.; Polukhin, A.A.; Pelevin, V.V.; Toktamysova, Z.M. Structure of the buoyant plume formed by Ob and Yenisei river discharge in the southern part of the Kara Sea during summer and autumn. J. Geophys. Res. Oceans 2017, 122, 5916–5935. [Google Scholar] [CrossRef]
  100. Gong, W.; Chen, L.; Chen, Z.; Zhang, H. Plume-to-plume interactions in the Pearl River Delta in winter. Ocean Coast. Manag. 2019, 175, 110–126. [Google Scholar] [CrossRef]
  101. Warrick, J.A.; Mertes, L.A.K.; Washburn, L.; Siegel, D.A. Dispersal forcing of southern California river plumes, based on field and remote sensing observations. Geo-Mar. Lett. 2004, 24, 46–52. [Google Scholar] [CrossRef]
  102. Osadchiev, A.A.; Korotenko, K.A.; Zavialov, P.O.; Chiang, W.-S.; Liu, C.-C. Transport and bottom accumulation of fine river sediments under typhoon conditions and associated submarine landslides: Case study of the Peinan River, Taiwan. Nat. Haz. Earth Syst. Sci. 2016, 16, 41–54. [Google Scholar] [CrossRef]
  103. Romero, L.; Siegel, D.A.; McWilliams, J.C.; Uchiyama, Y.; Jones, C. Characterizing storm water dispersion and dilution from small coastal streams. J. Geophys. Res. Oceans 2016, 121, 3926–3943. [Google Scholar] [CrossRef] [Green Version]
  104. Yankovsky, A.E.; Hickey, B.M.; Münchow, A.K. Impact of variable inflow on the dynamics of a coastal buoyant plume. J. Geophys. Res. Oceans 2001, 106, 19809–19824. [Google Scholar] [CrossRef] [Green Version]
  105. Yuan, Y.; Horner-Devine, A.R.; Avener, M.; Bevan, S. The role of periodically varying discharge on river plume structure and transport. Cont. Shelf Res. 2018, 158, 15–25. [Google Scholar] [CrossRef]
  106. Yankovsky, A.E.; Voulgaris, G. Response of a Coastal Plume Formed by Tidally Modulated Estuarine Outflow to Light Upwelling-Favorable Wind. J. Phys. Oceanogr. 2019, 49, 691–703. [Google Scholar] [CrossRef]
  107. Cole, K.L.; MacDonald, D.G.; Kakoulaki, G.; Hetland, R.D. River plume source-front connectivity. Ocean Model. 2020, 150, 101571. [Google Scholar] [CrossRef]
  108. Horner-Devine, A.R.; Jay, D.A.; Orton, P.M.; Spahna, E.Y. A conceptual model of the strongly tidal Columbia River plume. J. Mar. Syst. 2008, 78, 460–475. [Google Scholar] [CrossRef]
  109. Avicola, G.; Huq, P. Scaling analysis for the interaction between a buoyant coastal current and the continental shelf: Experiments and observations. J. Phys. Oceanogr. 2002, 32, 3233–3248. [Google Scholar] [CrossRef] [Green Version]
  110. Lentz, S.J.; Helfrich, K.R. Buoyant gravity currents along a sloping bottom in a rotating fluid. J. Fluid. Mech. 2002, 464, 251–278. [Google Scholar] [CrossRef]
  111. Pimenta, F.M.; Kirwan, A.D., Jr.; Huq, P. On the transport of buoyant coastal plumes. J. Phys. Oceanogr. 2011, 41, 620–640. [Google Scholar] [CrossRef] [Green Version]
  112. Korotenko, K.A.; Osadchiev, A.A.; Zavialov, P.O.; Kao, R.-C.; Ding, C.-F. Effects of bottom topography on dynamics of river discharges in tidal regions: Case study of twin plumes in Taiwan Strait. Ocean Sci. 2014, 10, 865–879. [Google Scholar] [CrossRef] [Green Version]
  113. Ostrander, C.E.; McManus, M.A.; DeCarlo, E.H.; Mackenzie, F.T. Temporal and spatial variability of freshwater plumes in a semi-enclosed estuarine–bay system. Estuaries Coasts 2008, 31, 192–203. [Google Scholar] [CrossRef]
  114. Osadchiev, A.A.; Zavialov, P.O. Lagrangian model for surface-advected river plume. Cont. Shelf Res. 2013, 58, 96–106. [Google Scholar] [CrossRef]
  115. Zhao, J.; Gong, W.; Shen, J. The effect of wind on the dispersal of a tropical small river plume. Front. Earth Sci. 2018, 12, 170–190. [Google Scholar] [CrossRef]
  116. Mityagina, M.I.; Lavrova, O.Y.; Karimova, S.S. Multi-sensor survey of seasonal variability in coastal eddy and internal wave signatures in the north-eastern Black Sea. Int. J. Remote Sens. 2010, 31, 4779–4790. [Google Scholar] [CrossRef]
  117. Lavrova, O.Y.; Mityagina, M.I. Satellite survey of internal waves in the Black and Caspian seas. Int. J. Remote Sens. 2017, 9, 892. [Google Scholar] [CrossRef] [Green Version]
  118. Trump, C.L.; Marmorino, G.O. Mapping small-scale along-front structure using ADCP acoustic backscatter range-bin data. Estuaries 2003, 26, 878–884. [Google Scholar] [CrossRef]
  119. Warrick, J.A.; Stevens, A.W. A buoyant plume adjacent to a headland—Observations of the Elwha River plume. Continent Shelf Res. 2011, 31, 85–97. [Google Scholar] [CrossRef]
Figure 1. Bathymetry of the study region, locations of the Iskuria and Pitsunda capes, the Bzyp and Kodor rivers, and other smaller rivers of the study region. Location of the study region at the northeastern part of the Black Sea is shown in the inset. Red boxes indicate areas of aerial observations and in situ measurements at the Bzyp and Kodor plumes. Green stars indicate locations of meteorological stations.
Remotesensing 12 03079 g001
Figure 2. Relations between salinity and turbidity (a) within the Kodor plume and the adjacent saline sea on 2–3 April 2019 and (b) within the Bzyp plume and the adjacent saline sea on 31 May 2019. Dashed red boxes indicate river plumes, transitional zones, and ambient saline sea. Red lines indicate regression lines. The Pearson correlations coefficients (r) with p-values, which indicate statistical significance of the observed relations, are given above the diagrams.
Remotesensing 12 03079 g002
Figure 3. (a) surface salinity distribution, (b) vertical salinity profiles, (c) aerial image (acquisition time 13:29), and (d) Sentinel-2 ocean color composite of the Kodor plume from 31 August 2018. Color dots indicate locations of vertical salinity measurements (1, blue—near the river mouth; 2, yellow—near the plume border, and 3, brown—at the ambient saline sea). Red arrows indicate location of the central deltaic branch of the Kodor River, green arrows indicate location of the Iskuria Cape. The red swirl at panel (a) indicates location of the eddy detected on 1 September, 2018 (see Figures 7–9). The red wave line at panel (a) indicates location of the undulate (lobe-cleft) plume border detected on 1 September 2018 (see Figures 12–15).
Remotesensing 12 03079 g003
Figure 4. (a) aerial image, (b) vertical salinity, and (c) velocity profiles at the frontal zone between river plumes formed by the northern and central deltaic branches of the Kodor River on 1 September, 2018. Colored dots indicate locations of vertical salinity (P1, blue—the northern plume; P2, yellow—the central plume) and velocity (P3, brown—the northern plume; P4, green—the central plume) measurements. The red arrow in panel (a) indicates location of the central deltaic branch of the Kodor River.
Remotesensing 12 03079 g004
Figure 5. (a,b) aerial images, (c) vertical salinity, and (d) velocity profiles at the frontal zone between the emergent and the residual parts of the Kodor plume on 2 September 2018. Colored dots indicate locations of vertical salinity and velocity measurements (P1, blue—the emergent plume; P2, yellow—the residual plume). Arrows in panels (a) and (b) indicate distinct frontal zones between the emergent and the residual parts of the Kodor plume. Red arrows in panels (a) and (b) point at the same segment of the frontal zone where in situ measurements were performed.
Remotesensing 12 03079 g005
Figure 6. (a,b) aerial images, (c) vertical salinity, and (d) velocity profiles at the frontal zone of the Kodor plume formed behind the shoal on 1 September 2018. Colored dots indicate locations of vertical salinity and velocity measurements (P1, blue—the low-turbid zone of the plume; P2, yellow—the frontal zone; and P3, brown—the turbid part of the plume). The white arrow in panel (b) indicates location of the shoal, red arrows indicate location of the central deltaic branch of the Kodor River, and the green arrow indicates location of the Iskuria Cape.
Remotesensing 12 03079 g006
Figure 7. Aerial images of the southern part of the Kodor plume (a,b) before and (c) during interaction between the plume and the eddy acquired at (a) 12:52, (b) 14:42, (c) 15:34, and (d) 15:41 on 1 September, 2018. (e) surface salinity, (f) zonal (blue) and meridional (red) velocities measured during 15:57—16:01 and (g) vertical salinity and (h) velocity profiles measured at 16:02 within the eddy. Yellow dots in panels (c) and (d) indicate location of salinity and velocity measurements. The white arrow in panel (c) indicates location of the eddy, red arrows indicate location of the central deltaic branch of the Kodor River, and green arrows indicate location of the Iskuria Cape.
Remotesensing 12 03079 g007
Figure 8. Sentinel-2 ocean color composites (a) from 17 July 2018, 21 August 2019, and 26 August 2019 illustrating interactions between eddies and the Kodor plume and (b) from 30 July 2017 and 10 October 2019 illustrating interactions between eddies and the Bzyp plume. Green arrows indicate location of the Iskuria Cape and red arrows indicate location of the Pitsunda Cape. Note that images at panels (a) and (b) are inconsistent, i.e., they show river plumes at different dates.
Remotesensing 12 03079 g008
Figure 9. Surface manifestations of high-frequency internal waves generated by the eddies within the (a) Kodor and (b) Bzyp plumes at (a) aerial images acquired on 1 September 2018 and (b) satellite images acquired on 10 October, 2019. The central picture at panel (a) is the zoomed fragment of the left picture at panel (a) indicated by the white dashed rectangle 1. The central and right pictures at panel (b) are the zoomed fragments of the left picture at panel (b) indicated by white dashed rectangles 2 and 3, respectively. Black arrows indicate surface manifestations of internal waves.
Remotesensing 12 03079 g009
Figure 10. Aerial images of surface manifestations of low-frequency internal waves within the Kodor plume near the mouths of (a) the northern and (b) the central deltaic branches on 2 September 2018. The green arrow indicates location of the northern deltaic branch of the Kodor River and the red arrow indicates location of the central deltaic branch of the Kodor River. Black arrows indicate surface manifestations of internal waves.
Remotesensing 12 03079 g010
Figure 11. (a) aerial image of surface manifestations of internal waves propagating within the Bzyp plume off the river mouth and location of the hydrological transect (black line) on 1 July 2019 (a). Vertical (b) salinity and (c) turbidity profiles along the hydrological transect.
Remotesensing 12 03079 g011
Figure 12. Aerial images (a) of undulate fronts at the border of the Kodor plume on 1 September, 2018 and (b) at the border of the Bzyp plume on 1 June, 2019. Central and right pictures at panel (a) are the zoomed fragments of the left and central pictures at panel (a), respectively, indicated by the white dashed rectangles 1 and 2, respectively. Central and right pictures at panel (b) are the zoomed fragments of the left and central pictures at panel (b), respectively, indicated by the white dashed rectangles 3 and 4, respectively. Black arrows indicate absence of undulate fronts at the surf zone.
Remotesensing 12 03079 g012
Figure 13. (a) aerial images and (b) reconstructed shapes of the border of the Kodor plume on 1 September 2018 illustrating merging of lobes and trapping of spots of saline sea. Numbers indicate time intervals in seconds from the beginning of observations.
Remotesensing 12 03079 g013
Figure 14. (a) aerial image of the undulate border of the Kodor plume on 1 September 2018 and (b) the scheme of the reconstructed circulation within the lobes (black lines) and the transport of foam and floating litter along the plume border (red lines) (b). Black arrows in panel (a) indicate foam accumulated within cyclonic vortexes in the right parts of the lobes.
Remotesensing 12 03079 g014
Figure 15. (a) aerial image and (b) vertical salinity profiles at the undulate border of the Kodor plume on 1 September 2018. Colored dots indicate locations of vertical salinity measurements (P1, blue—the plume; P2, yellow—the ambient saline sea). Black arrows in panel (a) indicate a stripe of low-turbid water within the Kodor plume stretched along its border.
Remotesensing 12 03079 g015

