Article

The Impact of Different Ocean Tide Loading Models on GNSS Estimated Zenith Tropospheric Delay Using Precise Point Positioning Technique

1
School of Land Science and Technology, China University of Geosciences (Beijing), Beijing 100083, China
2
Aerospace Information Research Institute, Chinese Academy of Sciences, Beijing 100094, China
3
School of Electronic, Electrical and Communicating Engineering, University of Chinese Academy of Sciences, Beijing 100049, China
4
School of Environment Science and Spatial Informatics, China University of Mining and Technology, Xuzhou 221116, China
5
School of Geographical Sciences and Geomatics Engineering, Suzhou University of Science and Technology, Suzhou 215010, China
*
Author to whom correspondence should be addressed.
Remote Sens. 2020, 12(18), 3080; https://doi.org/10.3390/rs12183080
Submission received: 10 August 2020 / Revised: 16 September 2020 / Accepted: 17 September 2020 / Published: 20 September 2020
(This article belongs to the Section Atmospheric Remote Sensing)

Abstract

:
Global navigation satellite systems (GNSSs) have become an important tool to derive atmospheric products, such as the total zenith tropospheric delay (ZTD) and precipitable water vapor (PWV) for weather and climate studies. The ocean tide loading (OTL) effect is one of the primary errors that affects the accuracy of GNSS-derived ZTD/PWV, which means the study and choice of the OTL model is an important issue for high-accuracy ZTD estimation. In this study, GNSS data from 1 January 2019 to 31 January 2019 are processed using precise point positioning (PPP) at globally distributed stations. The performance of seven widely used global OTL models is assessed and their impact on the GNSS-derived ZTD is investigated by comparing them against the ZTD calculated from co-located radiosonde observations. The results indicate that the inclusion or exclusion of the OTL effect will lead to a difference in ZTD of up to 3–15 mm for island stations, and up to 1–2 mm for inland stations. The difference of the ZTD determined with different OTL models is quite small, with a root-mean-square (RMS) value below 1.5 mm at most stations. The comparison between the GNSS-derived ZTD and the radiosonde-derived ZTD indicates that the adoption of OTL models can improve the accuracy of GNSS-derived ZTD. The results also indicate that the adoption of a smaller cutoff elevation, e.g., 3° or 7°, can significantly reduce the difference between the ZTDs determined by GNSS and radiosonde, when compared against a 15° cutoff elevation. Compared to the radiosonde-derived ZTD, the RMS error of GNSS-derived ZTD is approximately 25–35 mm at a cutoff elevation of 15°, and 15–25 mm when the cutoff elevation is set to 3°.

Graphical Abstract

1. Introduction

Atmospheric products derived from the global navigation satellite system (GNSS), such as zenith tropospheric delay (ZTD) and precipitable water vapor (PWV), have been widely used in weather and climate studies [1,2,3,4,5]. Since there is a strong correlation between ZTD, height coordinates and ocean tide loading (OTL) effects during GNSS data processing, it is important to take the OTL effect into account when estimating ZTD, especially for stations located near the ocean. Otherwise, the OTL effect will map into the ZTD and station height estimates [6,7]. As suggested by previous studies, neglecting the OTL effect could lead to an error of up to 50 mm in station height estimates. Dach and Dietrich [8] pointed out that the difference between the ZTD estimated with inclusion or exclusion of the OTL model may reach up to 10 mm with a double-difference processing strategy. As suggested by the World Meteorology Organization (WMO) the threshold for using ZTD in the weather forecasting should be 15 mm [9]. Therefore, to meet this requirement and to further improve the accuracy of the GNSS-derived ZTD, it is very important to carefully investigate the impact of different data processing strategies on the estimation of the ZTD, including the OTL effects.
As the elastic response of the earth's crust to ocean tides, the OTL effect is dominated by semi-monthly periods, with amplitudes of several centimeters. Therefore, an accurate OTL model is needed in GNSS data processing to achieve a high-accuracy result for a variety of glaciological and oceanographic applications [10,11]. Several OTL models have been proposed thanks to the rapid development of satellite altimetry measuring techniques from several missions including TOPEX, Jason1, Jason2 and Grace. The main difference between different OTL models is the model construction method and the dataset adopted. For example, GOT4.7 is a global ocean tide model, with a resolution of 0.5° × 0.5°, that used the European Remote Sensing (ERS) altimetry data and the Geosat Follow-On (GFO) data in shallow and polar seas [12,13]. The Finite Element Solutions (FES) series was produced by the French tidal group. It has many versions, such as FES2014, FES2012, FES2008, FES2004, and FES99. Although FES2014, FES2012 and FES2008 have a higher accuracy and resolution than FES2004, FES2004 is the conventional model recommended by International Earth Rotation Service (IERS) conventions [14]. The FES2004 used a refined mesh with a resolution of 0.125° × 0.125°. This ocean tide model assimilated the tide gauge data, Topex/Poseidon and ERS altimetry data [15].
Because these OTL models were constructed with different data, methods and spatial resolution, their accuracy and impact on the ZTD estimation might be different in different regions. Therefore, in this study, the performance of these OTL models and their impact on the ZTD estimation at different regions was studied in detail. Although some studies have focused on the difference between GNSS-ZTDs estimated with and without OTL models [8,16,17], few have been conducted on the effect of different OTL models on the ZTD estimation with GNSS [18,19]. In addition, the aforementioned studies were all conducted using double-difference data processing strategies, and few studies have been conducted with precise point positioning (PPP) [20]. As it moves forward in the high-accuracy orbit and clock products, PPP has become an important method in ZTD estimation, since it is much more efficient and flexible compared to double-difference data processing when estimating real-time and high-rate ZTD for a large network. The International GNSS Service (IGS) final troposphere products were generated with PPP [21]. In this study, the difference of using different OTL models in GNSS-derived ZTD was studied using the PPP strategy; the difference between OTL models in different areas has also been studied.
The structure of the paper as follows. Section 2 describes the data and the adopted methodology. Section 3 provides the details on the results. Section 4 provides a discussion of this study. The main findings and conclusions are shown in Section 5.

2. Data and Methodologies

In this study, the GNSS data from 1 January 2019 to 31 January 2019 are processed using PPP at 21 globally distributed GNSS stations. To investigate the impact of the OTL effect on the stations at different regions, 21 stations which are located on islands, coastal areas or on inland areas that are far from the sea were selected. To investigate the impact of different OTL models on the estimation of ZTD, the ZTD estimated without using OTL is compared to that estimated with seven commonly used OTL models, including DUT10 [22], EOT11a [23], FES2004 [14,15,24,25,26,27], GOT4.7 [12,13], Hamtide11a [28], Nao.99b [29] and TPXO7.2 [30,31]. For the 10 GNSS stations that each have a co-located radiosonde site, their GNSS-derived ZTDs were compared to their radiosonde-derived ZTDs; more details can be found in Section 2.1. In Section 2.2, the OTL models and the method used to calculate OTL are analyzed. The ZTD calculation, as derived from either radiosonde or GNSS, is shown in Section 2.3 and Section 2.4.

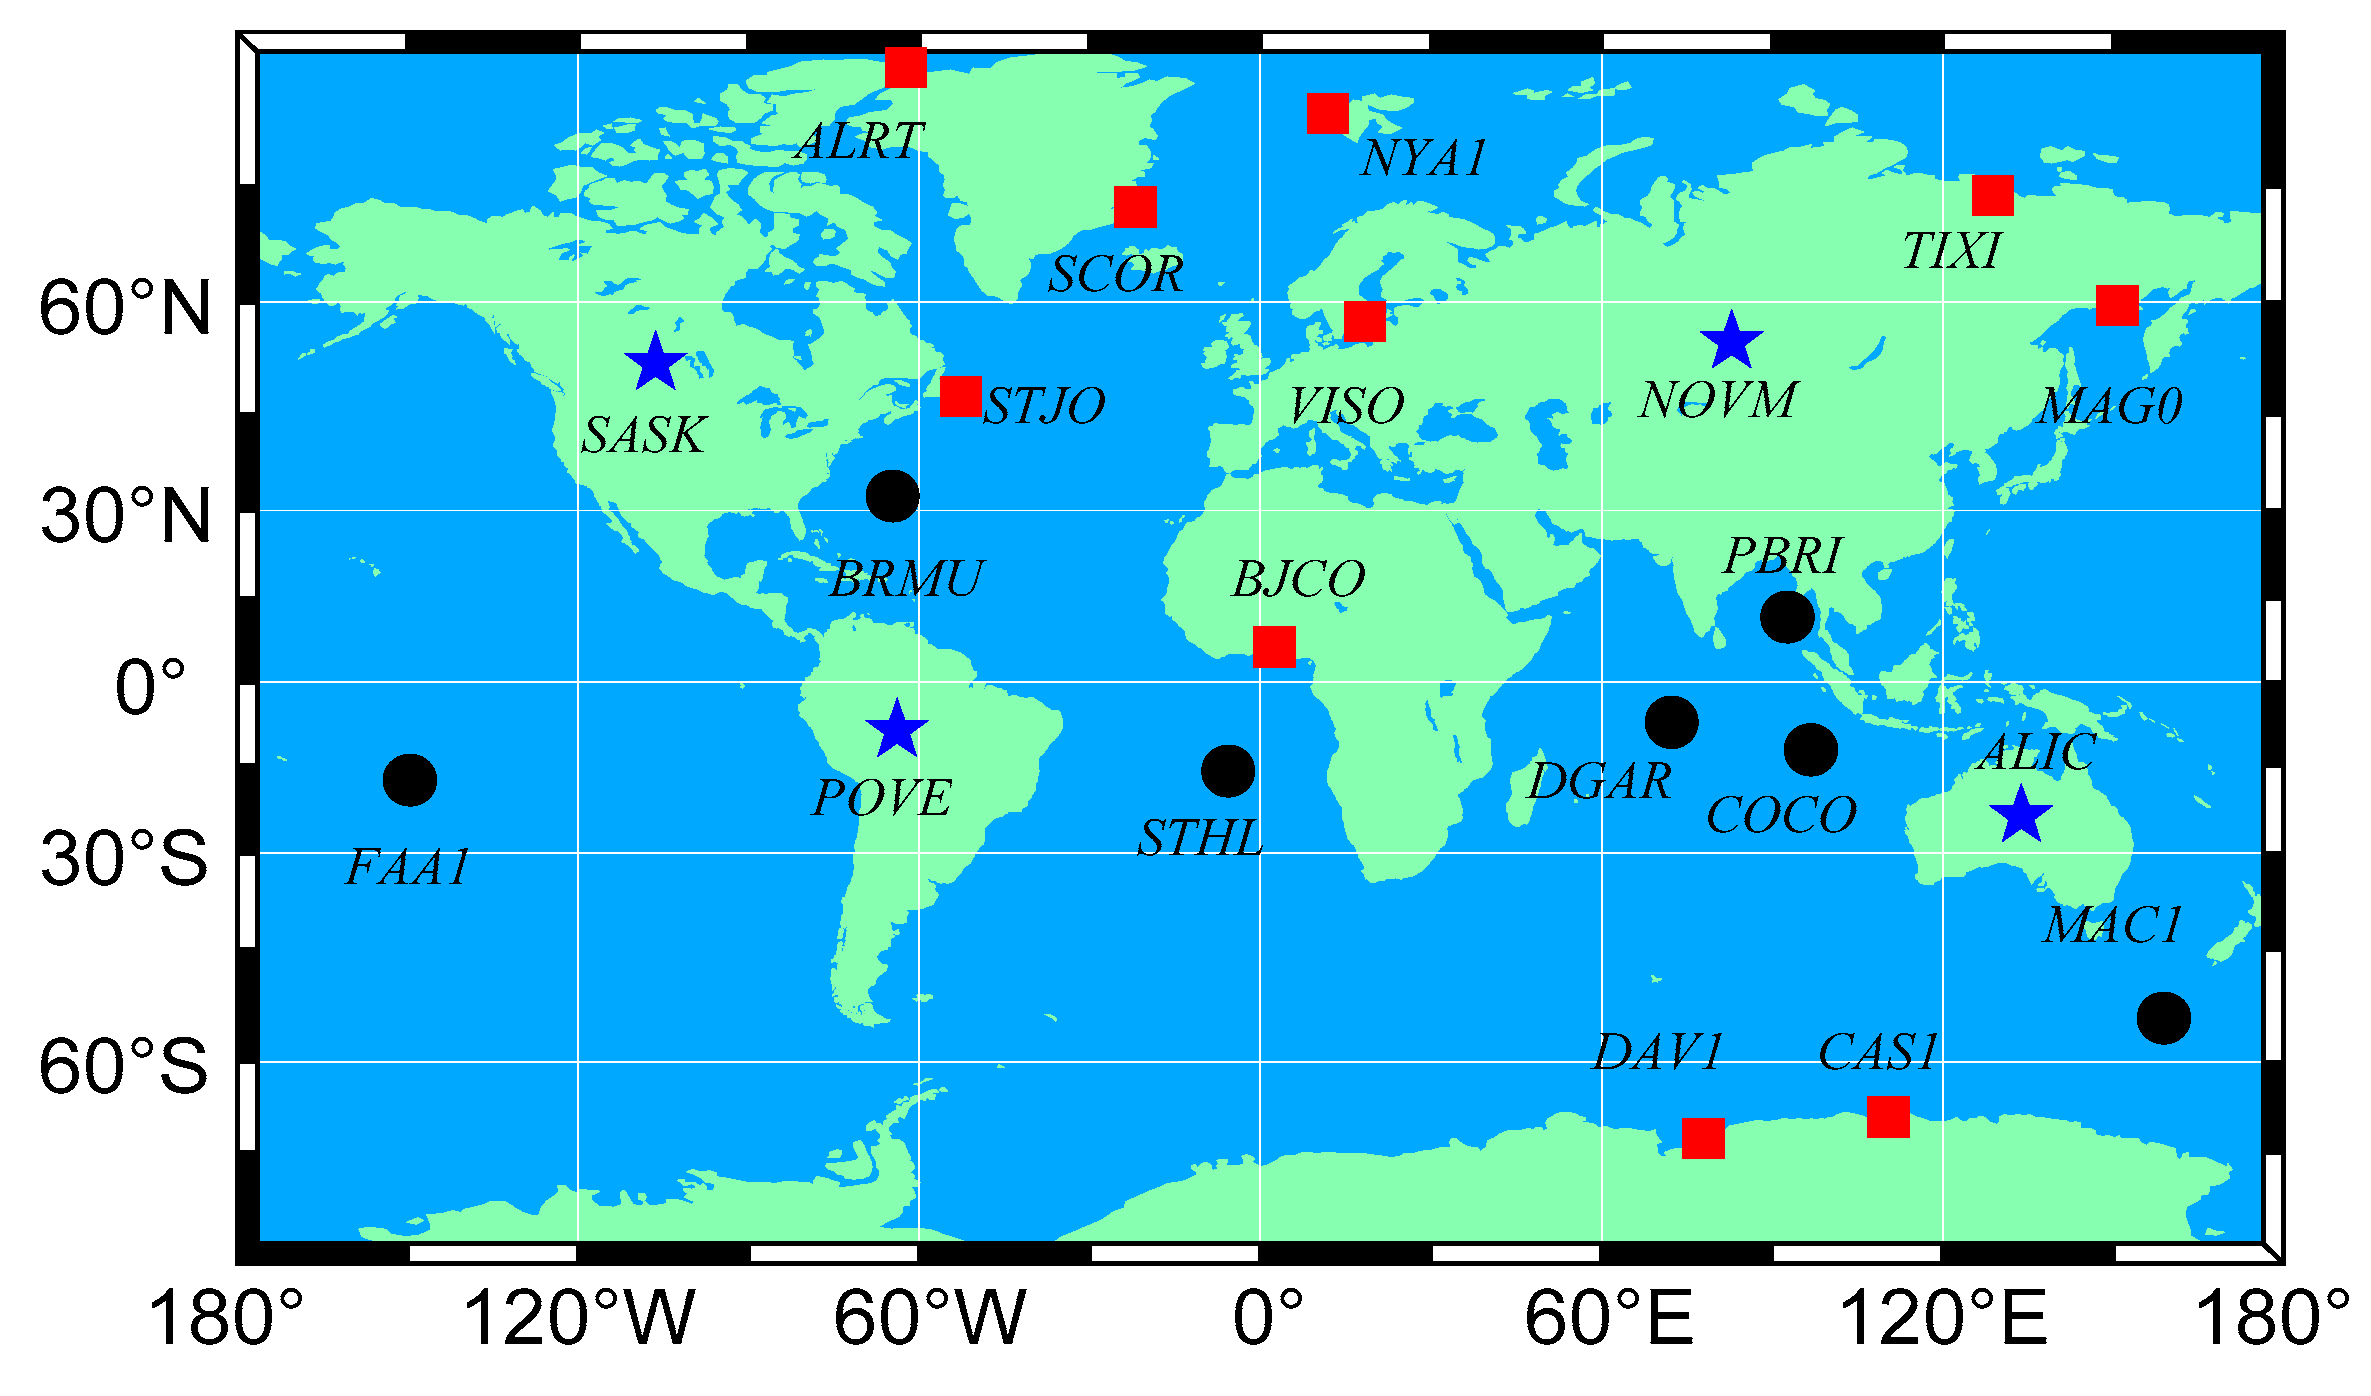
2.1. GNSS and Radiosonde Data

In this study, GNSS observations at 21 globally distributed GNSS stations, including 4 inland stations, 7 island stations, and 10 coastal stations, were taken from 1 January 2019 to 31 January 2019 and processed to analyze the impact of different OTL models on the estimation of ZTD. Figure 1 indicates the 21 globally distributed GNSS stations. Among the 21 stations, 10 stations had a co-located radiosonde site within a distance of 5 km. A comparison of the GNSS and radiosonde derived ZTD was measured at the ten co-located stations; the results are presented in Table 1. The ZTDs at these 10 radiosonde stations were calculated as references to investigate the accuracy of the GNSS-derived ZTD estimates using different OTL models.
In this study, the observations files at four stations (ALRT, PBRI, POVE, and NOVM) were downloaded from the site ftp://garner.ucsd.edu/pub/rinex/ and the others were downloaded from the site ftp://cddis.gsfc.nasa.gov/. For these 10 radiosonde stations, there are nine stations located within a distance less than 2 km from their co-located GNSS stations and one station with a distance of 3.682 km. It should be noted that, for some extreme weather conditions, this horizontal distance may result in a difference in ZTD at the GNSS site versus the nearby radiosonde site, due to the spatial variation of water vapor. However, as suggested by previous studies [32,33,34,35], it is acceptable in most cases to neglect this horizontal distance and regard these sites as co-located. The radiosonde data is provided by the Integrated Global Radiosonde Archive (IGRA) [36,37,38]. More details regarding the GNSS data processing and ZTD calculation with radiosonde data can be found in the following subsections.

2.2. OTL Models

Most global ocean tide models provide 11 main tidal constituents to reflect the variations in sea surface height [16,39]. The accuracy of the OTL value at a GNSS site calculated with an OTL model is mainly dependent on the accuracy of the adopted OTL and its spatial resolution. As shown in Table 2, a comparison between the different OTL models is presented. The accuracy of an OTL model is normally lower in a coastal area than in an inland area because the complex environment in the coastal area makes it very difficult to obtain high-accuracy satellite altimetry data for model construction [40].
Equation (1) provides a method to compute the OTL by Farrell [42]. It uses an ocean tide model and a Green’s function, written as:
L ( φ , λ ) = ρ Ω G ( α ) h ( φ , λ ) d S
where φ and λ are the latitude and longitude, respectively; ρ and Ω represent the mean density of ocean water and the domain of integration, respectively; h and d S are the elevation and surface area of sea surface, respectively; ( φ , λ ) and ( φ , λ ) are the estimation point and loading point, respectively; α represents the angular distance and L is the displacement vector which can be calculated with SPOTL software [43]. G denotes the Green’s function, which can be calculated using Equation (2):
G ( α ) = g ( a ) m E n = 2 ( 2 h n ( n + 1 ) k n ) P n ( cos α )
where m E and g ( a ) are the mass and gravitational acceleration of the Earth, respectively; h n and k n represent the Love numbers of loading which were determined by Farrell; and P n denotes the Legendre function. Regarding the Green’s function, there is a small difference in the use of different Green’s functions to calculate the OTL. Generally, the difference between the OTL values calculated with different Green’s functions is less than 2% [44]. Equation (1) can be rewritten as a displacement vector of vertical, north-south, and east-west components at a grid point and at the epoch t, as [45]:
L ( φ , λ , t ) = [ L V ( φ , λ , t ) L N S ( φ , λ , t ) L E W ( φ , λ , t ) ] = P = 1 n [ L V ( φ , λ ) L N S ( φ , λ ) L E W ( φ , λ ) ] [ cos ( ω i t + φ i δ i V ) cos ( ω i t + φ i δ i N S ) cos ( ω i t + φ i δ i E W ) ]
where ω i and φ i represent the frequency and astronomical argument of the different tidal constituents, respectively; L V ( φ , λ ) , L N S ( φ , λ ) , are the amplitudes; δ i V , δ i N S , δ i E W represent the Greenwich phase lags; and n is the number of main tidal constituents.

2.3. ZTD Calculation with Radiosonde

The radiosonde observations were used to calculate the ZTD as a reference for assessing the accuracy of the GNSS-estimated ZTD and the effect of different OTL models on the ZTD estimation with GNSS. As shown in Table 1, all of the GNSS stations and their co-located radiosonde sites were within 5 km of each other and had a height difference under 50 m. The ZTD was estimated as the integral of refractivity through the atmosphere in the zenith direction and Equation (4) was used to determine the refractivity with observations at each pressure level. Refractivity is written as [32]:
N = K 1 × P d T + K 2 × e T 2 + K 3 × e T
where N is the refractivity index; K 1 = 77.6890 K / hPa , K 2 = 22.13 K / hPa , and K 3 = 3.739 × 10 5 K / hPa are empirically determined constants; e expresses the pressure of water vapor; and T and P d are the temperature and the dry air pressure, respectively. With the refractivity determined using Equation (4), the ZTD is calculated as:
Z T D = 10 6 N d h i = 1 N N Δ h i
where Δ h is the height difference between the two pressure levels, and i is the pressure level.
When the GNSS site is below the radiosonde site, a vertical extrapolation procedure to extrapolate the meteorological parameters from the radiosonde height to the GNSS height is conducted to make sure that the radiosonde-derived ZTD is at the same height as the GNSS. If the GNSS site is above the radiosonde site, then the meteorology parameter at the GNSS site is interpolated with the radiosonde data at two nearest pressure levels. After this extrapolation or interpolation procedure, the ZTD at the GNSS site was calculated with Equations (4) and (5), using radiosonde observations [5].

2.4. ZTD Calculation with GNSS

Compared to the double-difference solution, PPP is a faster and more efficient means of estimating geodetic parameters such as the coordinate and tropospheric delay. The RTKLIB software is used in this study for the GNSS data processing with PPP. The latest version (V2.4.3) of RTKLIB is adopted in this study, which can be downloaded at https://github.com/tomojitakasu/RTKLIB/tree/rtklib_2.4.3 [46]. In RTKLIB, the tropospheric zenith hydro-static delay is given by the Saastamoinen model. In regards to the mapping function, both the Neill mapping function (NMF) and global mapping function (GMF) [47,48] are available. As suggested by previous studies, although the Vienna mapping functions (VMF) have a better performance than the others, the difference among these commonly used mapping functions is quite small [49]. The gradient model parameters for the north and east are estimated together with the ZTD with the form proposed by Macmillan [50]. RTKLIB employs an extended Kalman filter (EKF) to estimate coordinates, ZTD and other parameters. The ZTD results estimated during the convergence period were removed in the following study. In this study, the IGS final products, including the satellite orbits and clock, and the earth rotation and differential code bias (DCB) [51], were used for the estimation of ZTD. Since RTKLIB does not support the inclusion of an atmospheric pressure loading model, that effect was not considered in this study. As suggested by previous studies [52], a random walk stochastic model is used; the constraint of ZTD is set to 20 mm / ( h ) and the standard deviation of the carrier phase bias in the process noise is 10 4 cycle / ( s ) . The processing strategies in Table 3 were adopted in this study.

3. Results

The effects of different OTL models and elevation cutoffs on the ZTD estimates were studied in this section. In Section 3.1, the magnitudes and variations of the OTL effects are studied at a global scale. In Section 3.2, the GNSS-derived ZTD using the seven OTL models and calculated without OTL models in different regions are compared. In Section 3.3, the difference between the GNSS-derived ZTD and the co-located radiosonde data calculated ZTD are investigated and the impact of the elevation cutoff on the estimation of ZTD is also studied.

3.1. Temporal and Spatial Characteristics of the OTL Models

Before investigating the impact of different OTL models on the estimation of ZTD, the temporal and spatial characteristics of the OTL models were investigated. In this study, SPOTL software was used to compute the magnitudes of the site displacements due to OTL effects on model grids, and then bilinear interpolation was adopted to calculate the magnitude of the OTL effect at any specific site. ZTD estimation is mainly influenced by the OTL effects in the vertical direction; those effects have a magnitude and variation that are much larger than the corresponding values in the horizontal direction. As shown in Figure 2, the magnitudes of the OTL effect in the vertical direction exhibit an obvious variation with location and time during January 2019, with a maximum value of around 60 mm. The OTL effect in the coastal region is larger than in the inland area, which only has a magnitude smaller than 10 mm. It can be seen in Figure 2 that there is an obvious semi-monthly variation of OTL effects.
Figure 3, Figure 4 and Figure 5 show the time series of the vertical displacements caused by the OTL effects at three GNSS sites from 1 January 2019 to 31 January 2019. The NOVM station in Figure 3 is an inland station located in Novosibirsk, Russia; the BRMU station in Figure 4 is an island station located on Bermuda island, United Kingdom; and the NYA1 is a coastal station located on Svalbard, Norway. As shown in Figure 3, Figure 4 and Figure 5, it can be seen that the magnitudes of the OTL effects are much greater at the coastal and island stations than they are at the inland stations. The variation of the vertical displacements due to the OTL effect at the inland NOVM station is between −4 and 4 mm, while at the BRMU station it is mostly from −30 to 30 mm, with the largest displacement of −40.61 mm. At the coastal station NYA1, the vertical displacement was approximately between −15 and 15 mm, with the largest displacement of −17.71 mm.
To investigate the differences among the OTL models, the widely used FES2004 model was used as the reference to calculate the difference between FES2004 and the other OTL models in the calculation of OTL effect corrections at the aforementioned three stations. As shown in Figure 6 and Figure 7, the biggest difference between each OTL model was found at the island station BRMU, with a root-mean-square (RMS) error of around 4–5 mm and a maximum value of around 10 mm. The OTL models show good agreement with each other at the inland station NOVM, with an RMS error of about 1 mm. The RMS error at the coastal station NYA1 was about 3 mm and an obvious temporal variation can be seen in the differences between OTL models at this station. In addition, the EOT11a model is in better agreement with the FES2004 model than the other models.

3.2. GNSS-Derived ZTD

GNSS-derived ZTDs were calculated at 21 stations using the PPP data processing strategy with or without the OTL models. Figure 8 and Figure 9 show the difference between the ZTDs calculated with different OTL models and without OTL models. As shown in Figure 8, the RMS of differences between ZTDs calculated with and without OTL models for the island and coastal stations is between 3–15 mm at most stations. The largest difference was found at the island station FAA1, with an RMS error of about 30 mm. For the inland stations, the differences between the ZTD determined with and without the OTL models were relatively small, with an RMS error of 1–2 mm.
As shown in Figure 9, the ZTDs calculated with different OTL models show slight differences. To further investigate the impact of the different OTL models on the estimation of ZTD, a comparison between the ZTD calculated with the commonly used FES2004 model and other models was conducted. Figure 10 and Figure 11 show that the largest difference between each OTL model was found at coastal stations, with an RMS error of about 0.5–1.5 mm. The OTL models show good agreement with each other at the inland stations, with an RMS error of about 0.1–0.2 mm. The RMS error at the island stations was about 0.5–1 mm. In addition, the difference shows a twice-monthly variation at the BRMU station.

3.3. Radiosonde

To further investigate the impact of the OTL models on the accuracy of the GNSS-derived ZTDs, the radiosonde data at 10 stations co-located with GNSS stations were used to calculate the ZTDs, which were used as a reference in this study. More details regarding the 10 radiosonde and GNSS stations are listed in Table 1. The ZTDs derived from radiosonde data were used as the reference to evaluate the accuracy of the GNSS-derived ZTDs. As presented in Table 4, the ZTDs derived from different OTL models show a good agreement with the radiosonde-derived ZTD, and all have a better agreement than the ZTD derived without the OTL models. For example, at the BRMU station, the RMS error of the GNSS-ZTD derived without the OTL model was 25.68 mm and it decreased to about 19 mm when an OTL model was used during data processing.
It should be noted that the cutoff elevation adopted in the above data processing was 10°. As there is a large correlation between height, ZTD and OTL displacement, it may be useful to lower the elevation cutoff to reduce their correlation and increase the accuracy of the GNSS-derived ZTD. In this study, the GNSS-derived ZTD was calculated with 6 cut-off angles, i.e., 3°, 5°, 7°, 10°, 12° and 15°. Results for each were compared and the ZTDs derived from them were compared with radiosonde data. Figure 12 shows the RMS error between the GNSS-derived ZTD with different cut-off elevations and radiosonde-derived ZTDs. The results show that the RMS error of the GNSS-derived ZTDs decreases when the cutoff elevation is lower. For example, the GNSS-derived ZTDs had the smallest RMS error at the cutoff elevation of 7°, and the largest RMS error at 15° at the NOVM station. For the BRMU station and NYA1 station, the best agreement between the ZTD calculated with GNSS and that calculated with radiosonde is found at the elevation of 3° or 7°. The RMS error of GNSS-ZTD was approximately 28 mm at a cutoff elevation of 15° and only 20 mm at the cutoff elevation of 3° at the BRMU station. This improvement can be found for the experiments with all of the studied OTL models.
Figure 13 shows the RMS differences between the GNSS-derived ZTD and the radiosonde-derived ZTD at 10 stations with six cutoff angles using the FES2004 model. The results indicated that the adoption of a smaller cutoff elevation, e.g., 3° or 7°, significantly reduces the difference between the ZTDs determined with GNSS versus radiosonde, compared with using a 15° cutoff elevation. Compared to the radiosonde-derived ZTD, the RMS error of the GNSS-derived ZTD was approximately 25–35 mm at a cutoff elevation of 15°, and only 15–25 mm with a cutoff elevation of 3° at all stations. At the inland station, POVE, the RMS error was reduced from 25 mm to 10 mm when the cutoff elevation changed from 15° to 7°.

4. Discussion

GNSS has become an established technique for atmospheric remote sensing in the last decade. With the development of high-accuracy IGS products, including the orbits and clocks, PPP has been widely used to retrieve the ZTD because it is much more efficient and faster than the double-difference method. Since there is a strong correlation among ZTD, height coordinates and OTL effects during GNSS data processing, it is important to take the OTL effect into account when estimating ZTD with PPP, especially for stations located near the ocean. Otherwise, the OTL effect will map into the ZTD and station height estimation results.
In this study, GNSS data from 1 January 2019 to 31 January 2019 are processed using PPP at globally distributed stations. The performance of seven ocean tide models was assessed and their impact on the GNSS-derived ZTD was investigated by comparing them against the ZTD calculated from co-located radiosonde observations. As shown in Figure 8 and Figure 9, the RMS error of the differences between ZTD calculated with and without OTL models is about 3–15 mm at the most island and coastal stations. The largest difference was found at the island station FAA1, which had an RMS error of about 30 mm. For inland stations, the differences between the ZTD determined with and without OTL models were relatively small, with an RMS of 1–2 mm. This means that in the estimation of ZTD with GNSS, the ocean tide models must be considered when the GNSS station is located on an island or in a coastal area. The differences of the ZTDs determined with different OTL models are shown in Figure 10 and Figure 11, and they are seen to be quite small. The largest difference between each OTL model was found at coastal stations, with an RMS of about 0.5–1.5 mm. The OTL models show a good agreement with each other at the inland station, with an RMS error of the differences of about 0.1–0.2 mm and 0.5–1 mm at most island stations. The OTL has semi-annual periods, so the OTL effect on the ZTD estimation might be different in different seasons. These seasonal impacts of the OTL effects on the ZTD estimation need to be investigated with a longer period of data.
To further investigate the impact of OTL models on the accuracy of the estimated ZTD with GNSS, radiosonde data at 10 co-located stations were used to calculate ZTDs, which were used as a reference. The comparison results presented in Table 4 show that the RMS error of the differences between ZTD determined with GNSS versus radiosonde is 10–30 mm at all stations. The ZTDs derived from different OTL models show a good agreement and all have a better agreement with the radiosonde-derived ZTD than the ZTD derived without OTL models. The comparison between the ZTD determined with different cutoff elevations shows that the adoption of a lower cutoff elevation (e.g., 3° or 7°) significantly improves the accuracy of the ZTD compared with a 15° cutoff elevation, as shown in Figure 12 and Figure 13. The RMS error of GNSS-derived ZTD was approximately 25–35 mm at a cutoff elevation of 15°, and only 15–25 mm with a cutoff elevation of 3°, at all stations. For example at the inland station POVE, the RMS error was reduced from 25 mm to 10 mm when the cutoff elevation changed from 15° to 7°; at the island station BRMU, the RMS error was reduced from 35 mm to 20 mm when the cutoff elevation changed from 15° to 3°.

5. Conclusions

In this study, the impact of the OTL models on the estimation of GNSS-ZTD with PPP has been comprehensively studied. The results indicate that the vertical OTL displacement is very large in the coastal and island regions and the omission of the OTL effect will lead to a difference of about 3–15 mm in the GNSS-derived ZTD with the PPP at the coastal and island stations. Therefore, an optimal OTL model must be used in the estimation of ZTD with the GNSS PPP technique, especially for the coastal and island stations. The comparison between different OTL models indicated that the vertical displacement calculated using different OTL models can reach 10 mm at island stations, while for inland stations the difference is only about 1–2 mm. The study also indicates that the difference between the ZTDs derived from different OTL models is quite small and the inclusion of an OTL model in the GNSS data processing will improve the accuracy of the ZTD estimation. With the radiosonde-derived ZTD as a reference, the accuracy of GNSS-derived ZTDs was studied with different cutoff elevations and the results show that the RMS error is approximately 25–35 mm at a cutoff elevation of 15°, while the RMS error was only 15–25 mm with a cutoff elevation of 3° at all stations. Therefore, a low cutoff elevation (e.g., 3° or 7°) is helpful in reducing the RMS error of the ZTD estimates and thus is recommended when estimating ZTD with GNSS.

Author Contributions

Conceptualization, J.Z.; methodology, J.Z. and X.W.; validation, J.Z. and X.W.; formal analysis, J.Z. and X.W.; resources, X.W., C.Q., S.Z., H.L. and L.L.; software, J.Z. and X.W.; writing—original draft preparation, J.Z. and X.W.; writing—review and editing, X.W., S.L., and Z.L.; supervision, X.W. and Z.L; funding acquisition, J.Z., X.W. and S.L. All authors have read and agreed to the published version of the manuscript.

Funding

This project is funded by the Strategic Priority Research Program of the Chinese Academy of Sciences (No. XDA17010304), China Natural Science Funds (Nos. 41904033, 41674043, 41704038, 41730109), the CAS Pioneer Hundred Talents Program, National Key Research and Development Plan (No. 2016YFB0501405), the Natural Science Foundation of Shandong province (No. ZR2019MD005), the National Key Research Program of China “Collaborative Precision Positioning Project” (No. 2016YFB0501900), the Beijing Nova Program (xx2017042), the National High Technology Research and Development Program of China (No. 2015AA124101), and the Young Top-Notch Talents Team Program of Beijing Excellent Talents Founding (No.2017000021223ZK13).

Acknowledgments

The authors would like to thank the IGS for providing precise GPS data and the National Climate Data Center for providing the Integrated Global Radiosonde Archive.

Conflicts of Interest

The authors declare no conflict of interest.

References

  1. Li, X.; Dick, G.; Ge, M.; Heise, S.; Wickert, J.; Bender, M. Real-time GPS sensing of atmospheric water vapor: Precise point positioning with orbit, clock, and phase delay corrections. Geophys. Res. Lett. 2014, 41, 10. [Google Scholar] [CrossRef] [Green Version]
  2. Singh, D.; Ghosh, J.K.; Kashyap, D. Precipitable water vapor estimation in India from GPS-derived zenith delays using radiosonde data. Meteorol. Atmos. Phys. 2014, 123, 3–4. [Google Scholar] [CrossRef]
  3. Wang, H.; Wei, M.; Li, G.; Zhou, S.; Zeng, Q. Analysis of precipitable water vapor from GPS measurements in Chengdu region: Distribution and evolution characteristics in autumn. Adv. Space Res. 2013, 52, 4. [Google Scholar] [CrossRef] [Green Version]
  4. Means, J.D.; Cayan, D. Precipitable Water from GPS Zenith Delays Using North American Regional Reanalysis Meteorology. J. Atmos. Ocean. Technol. 2013, 30, 3. [Google Scholar] [CrossRef]
  5. Wang, X.; Zhang, K.; Wu, S.; Fan, S.; Cheng, Y. Water vapor-weighted mean temperature and its impact on the determination of precipitable water vapor and its linear trend. J. Geophys. Res. Atmos. 2016, 121, 833–852. [Google Scholar] [CrossRef]
  6. Dragert, H.; James, T.S.; Lambert, A. Ocean loading corrections for continuous GPS: A case study at the Canadian coastal site Holberg. Geophys. Res. Lett. 2000, 27, 14. [Google Scholar] [CrossRef]
  7. Luo, X. GPS Stochastic Modelling: Signal Quality Measures and ARMA Processes; Springer: New York, NY, USA, 2013; p. 78. [Google Scholar]
  8. Dach, R.; Dietrich, R. Influence of the ocean loading effect on GPS derived precipitable water vapor. Geophys. Res. Lett. 2000, 27, 18. [Google Scholar] [CrossRef]
  9. De Haan, S. National/Regional Operational Procedures of GPS Water Vapour Networks and Agreed International Procedures; KNMI: De Bilt, The Netherlands, 2006; p. 20. [Google Scholar]
  10. Kim, T.H.; Shibuya, K.; Doi, K.; Aoyama, Y.; Hayakawa, H. Validation of global ocean tide models using the superconducting gravimeter data at Syowa Station, Antarctica, and in situ tide gauge and bottom-pressure observations. Polar Sci. 2010, 5, 1. [Google Scholar] [CrossRef] [Green Version]
  11. Padman, L.; Erofeeva, S.Y.; Fricker, H.A. Improving Antarctic tide models by assimilation of ICESat laser altimetry over ice shelves. Geophys. Res. Lett. 2008, 35, 22. [Google Scholar] [CrossRef] [Green Version]
  12. Ray, R.A. Global ocean tide model from Topex/Poseidon altimetry: GOT 99.2. NASA Tech Memo. 1999, 58, 209478. [Google Scholar]
  13. Egbert, G.D.; Ray, R.D. Deviation of Long-Period Tides from Equilibrium: Kinematics and Geostrophy. J. Phys. Oceanogr. 2003, 33, 822–839. [Google Scholar] [CrossRef] [Green Version]
  14. Lei, J.; Li, F.; Zhang, S.; Ke, H.; Zhang, Q.; Li, W. Accuracy Assessment of Recent Global Ocean Tide Models around Antarctica. ISPRS Int. Arch. Photogramm. Remote Sens. Spat. Inf. Sci. 2017, 42, 1521. [Google Scholar] [CrossRef] [Green Version]
  15. Lyard, F.; Lefevre, F.; Letellier, T.; Francis, O. Modelling the global ocean tides: Modern insights from FES2004. Ocean. Dyn. 2006, 56, 5–6. [Google Scholar] [CrossRef]
  16. Urschl, C.; Dach, R.; Hugentobler, U.; Schaer, S.; Beutler, G. Validating ocean tide loading models using GPS. J. Geod. 2005, 78, 10. [Google Scholar] [CrossRef] [Green Version]
  17. Jin, S.; Wu, Y.; Heinkelmann, R.; Park, J. Diurnal and semidiurnal atmospheric tides observed by co-located GPS and VLBI measurements. J. Atmos. Sol.-Terr. Phys. 2008, 70, 1366–1372. [Google Scholar] [CrossRef]
  18. Gokhan, G.; Jin, S. Evaluation of ocean tide loading effects on GPS-Estimated precipitable water vapour in Turkey. Geod. Geodyn. 2016, 7, 1. [Google Scholar] [CrossRef] [Green Version]
  19. Gurbuz, G.; Jin, S.; Mekik, C. Effects of ocean tide models on GNSS-estimated ZTD and PWV in Turkey. Int. Arch. Photogramm. Remote Sens. Spat. Inf. Sci. 2015, 40, 255. [Google Scholar] [CrossRef] [Green Version]
  20. Yuan, Y.; Zhang, K.; Rohm, W.; Choy, S.; Norman, R.; Wang, C.S. Real-Time retrieval of precipitable water vapor from GPS precise point positioning. Geophys. Res. Atmos. 2014, 119, 10044–10057. [Google Scholar] [CrossRef]
  21. Villiger, A.; Dach, R. International GNSS Service Technical Report 2018 (IGS Annual Report). IGS Cent. Bur. Univ. Bern. 2019. [Google Scholar] [CrossRef]
  22. Cheng, Y.; Andersen, O.B. Improvement in global ocean tide model in shallow water regions. In OST-ST Meeting on Altimetry for Oceans and Hydrology; Technical University of Denmark: Lyngby, Denmark, 2010; Poster, SV.1-68 45. [Google Scholar]
  23. Savcenko, R.; Bosch, W. EOT11a—Empirical Ocean Tide Model From Multi-Mission Satellite Altimetry; Report 89; Deutsches Geodätisches Forschungsinstitut: München, Germany, 2012. [Google Scholar]
  24. Le Provost, C.; Genco, M.; Lyard, F.; Vincent, P.; Canceil, P. Spectroscopy of the world ocean tides from a finite element hydrodynamic model. J. Geophys. Res. Ocean. . 1994, 99, 24777–24797. [Google Scholar] [CrossRef]
  25. Le Provost, C.; Lyard, F.; Molines, J.; Genco, M.; Rabilloud, F. A hydrodynamic ocean tide model improved by assimilating a satellite altimeter-derived data set. J. Geophys. Res. Ocean. 1998, 103, 5513–5529. [Google Scholar] [CrossRef]
  26. Lefèvre, F.; Lyard, F.; Provost, C.L. FES98: A new global tide finite element solution independent of altimetry. Geophys. Res. Lett. 2000, 27, 17. [Google Scholar] [CrossRef]
  27. Lefevre, F.; Lyard, F.; Provost, C.L.; Schrama, E.J. FES99: A Global Tide Finite Element Solution Assimilating Tide Gauge and Altimetric Information. J. Atmos. Ocean. Technol. 2002, 19, 1345–1356. [Google Scholar] [CrossRef]
  28. Taguchi, E.; Stammer, D.; Zahel, W. Inferring deep ocean tidal energy dissipation from the global high-resolution data-assimilative HAMTIDE model. J. Geophys. Res. 2014, 119, 4573–4592. [Google Scholar] [CrossRef]
  29. Matsumoto, K.; Takanezawa, T.; Ooe, M. Ocean Tide Models Developed by Assimilating TOPEX/POSEIDON Altimeter Data into Hydrodynamical Model: A Global Model and a Regional Model around Japan. J. Oceanogr. 2000, 56, 5. [Google Scholar] [CrossRef]
  30. Egbert, G.D.; Bennett, A.F.; Foreman, M.G.G. TOPEX/POSEIDON tides estimated using a global inverse model. J. Geophys. Res. Ocean. 1994, 99, 24821–24852. [Google Scholar] [CrossRef] [Green Version]
  31. Egbert, G.D.; Erofeeva, S.Y. Efficient Inverse Modeling of Barotropic Ocean Tides. J. Atmos. Ocean. Technol. 2002, 19, 183–204. [Google Scholar] [CrossRef] [Green Version]
  32. Zhang, Q.; Ye, J.; Zhang, S.; Han, F. Precipitable water vapor retrieval and analysis by multiple data sources: Ground-based GNSS, radio occultation, radiosonde, microwave satellite, and NWP reanalysis data. J. Sens. 2018, 2018, 1–13. [Google Scholar] [CrossRef]
  33. Liang, H.; Cao, Y.; Wan, X.; Xu, Z.; Wang, H.; Hu, H. Meteorological applications of precipitable water vapor measurements retrieved by the national GNSS network of China. Geod. Geodyn. 2015, 6, 135–142. [Google Scholar] [CrossRef] [Green Version]
  34. Grejnerbrzezinska, D.A. GPS-PWV estimation and validation with radiosonde data and numerical weather prediction model in Antarctica. Gps Solut. 2013, 17, 29–39. [Google Scholar]
  35. Zhao, Q.; Yao, Y.; Yao, W.; Zhang, S. GNSS-derived PWV and comparison with radiosonde and ECMWF ERAInterim data over mainland China. J. Atmos. Solar Terr. Phys. 2019, 182, 85–92. [Google Scholar] [CrossRef]
  36. Wang, X.; Zhang, K.; Wu, S.; Li, Z.; Cheng, Y.; Li, L.; Yuan, H. The correlation between GNSS-derived precipitable water vapor and sea surface temperature and its responses to El Niño–Southern Oscillation. Remote Sens. Environ. 2018, 216, 1–12. [Google Scholar] [CrossRef]
  37. Durre, I.; Vose, R.S.; Wuertz, D.B. Overview of the integrated global radiosonde archive. J. Clim. 2006, 19, 53–68. [Google Scholar] [CrossRef] [Green Version]
  38. Haase, J.S.; Vedel, H.; Ge, M.; Calais, E. GPS zenith tropospheric delay (ZTD) variability in the Mediterranean. Pergamon 2001, 26, 6–8. [Google Scholar] [CrossRef]
  39. Lambeck, K. Geophysical Geodesy: The Slow Deformations of the Earth; Oxford University Press: Oxford, UK, 1988; p. 710. [Google Scholar]
  40. Shum, C.K.; Woodworth, P.L.; Andersen, O.B.; Egbert, G.D.; Francis, O.; King, C.; Klosko, S.M.; Le Provost, C.; Li, X.; Molines, J.M.; et al. Accuracy assesment of recent ocean tide models. Geophys. Res. Lett. 1997, 102, 25173–25194. [Google Scholar] [CrossRef]
  41. Melachroinos, S.A.; Biancale, R.; Llubes, M.; Perosanz, F.; Lyard, F.; Vergnolle, M.; Bouin, M.-N.; Masson, F.; Nicolas, J.; Morel, L. Ocean tide loading (OTL) displacements from global and local grids: comparisons to GPS estimates over the shelf of Brittany, France. J. Geod. 2008, 82, 357–371. [Google Scholar] [CrossRef]
  42. Farrell, W. Deformation of the Earth by surface loads. Rev. Geophys. 1972, 10, 761–797. [Google Scholar] [CrossRef]
  43. Agnew, D.C. SPOTL: Some Programs for Ocean-Tide Loading. Scripps Institution of Oceanography. SIO Ref. Ser. 1996, 96, 35. [Google Scholar]
  44. Francis, O.; Mazzega, P. Global charts of ocean tide loading effects. J. Geophys. Res. Ocean. 1990, 95, 11411–11424. [Google Scholar] [CrossRef]
  45. Seidelmann, P.K. Explanatory Supplement to the Astronomical Almanac; University Science Books: Herndon, VA, USA, 1992. [Google Scholar]
  46. Takasu, T.; Yasuda, A. Development of the low-cost RTK-GPS receiver with an open source program package RTKLIB. In Proceedings of the International symposium on GPS/GNSS, Jeju, Korea, 4–6 November 2009; pp. 4–6. [Google Scholar]
  47. Niell, A. Global mapping functions for the atmosphere delay at radio wavelengths. J. Geophys. Res. Solid Earth 1996, 101, 3227–3246. [Google Scholar] [CrossRef]
  48. Böhm, J.; Niell, A.; Tregoning, P.; Schuh, H. Global Mapping Function (GMF): A new empirical mapping function based on numerical weather model data. Geophys. Res. Lett. 2006, 33, 7. [Google Scholar] [CrossRef] [Green Version]
  49. Qiu, C.; Wang, X.; Li, Z.; Zhang, S.; Li, H.; Zhang, J.; Yuan, H. The Performance of Different Mapping Functions and Gradient Models in the Determination of Slant Tropospheric Delay. Remote Sens. 2020, 12, 130. [Google Scholar] [CrossRef] [Green Version]
  50. MacMillan, D. Atmospheric gradients from very long baseline interferometry observations. Geophys. Res. Lett. 1995, 22, 1041–1044. [Google Scholar] [CrossRef]
  51. Li, X.; Ge, M.; Dai, X.; Ren, X.; Fritsche, M.; Wickert, J.; Schuh, H. Accuracy and reliability of multi-GNSS real-time precise positioning: GPS, GLONASS, BeiDou, and Galileo. J. Geod. 2015, 89, 607–635. [Google Scholar] [CrossRef]
  52. Mohammed, J.; Moore, T.; Hill, C.; Bingley, R.M. Alternative Strategy for Estimating Zenith Tropospheric Delay from Precise Point Positioning. In Proceedings of the 2020 IEEE/ION Position, Location and Navigation Symposium (PLANS), Portland, OR, USA, 20–23 April 2020; pp. 247–258. [Google Scholar]
Figure 1. The distribution of the global navigation satellite system (GNSS) stations: four inland sites (blue star), seven island sites (black points), and ten coastal sites (red squares).
Remotesensing 12 03080 g001
Figure 2. The vertical displacement caused by the ocean tide loading (OTL) effect in global regions at 12:00 on different dates: (a) 5 January 2019, (b) 10 January 2019, (c) 15 January 2019, (d) 20 January 2019, (e) 25 January 2019, and (f) 30 January 2019.
Remotesensing 12 03080 g002
Figure 3. The magnitudes of the vertical OTL displacements at the inland station NOVM (Novosibirsk, Russia), determined using different OTL models: (a) DUT10, (b) EOT11a, (c) FES2004, (d) GOT4.7, (e) Hamtide11a, (f) Nao.99b and (g) TPXO7.2.
Remotesensing 12 03080 g003
Figure 4. The magnitudes of vertical OTL displacement at the island station BRMU (Bermuda island, United Kingdom), determined using different OTL models: (a) DUT10, (b) EOT11a, (c) FES2004, (d) GOT4.7, (e) Hamtide11a, (f) Nao.99b and (g) TPXO7.2.
Remotesensing 12 03080 g004
Figure 5. The magnitudes of vertical OTL displacement in the coastal areas of station NYA1 (Svalbard, Norway), determined using different OTL models: (a) DUT10, (b) EOT11a, (c) FES2004, (d) GOT4.7, (e) Hamtide11a, (f) Nao.99b and (g) TPXO7.2.
Remotesensing 12 03080 g005
Figure 6. The difference of vertical OTL displacements between the FES2004 model (as reference) and other OTL models at the (a) NOVM station, (b) BRMU station, and (c) NYA1 station.
Remotesensing 12 03080 g006
Figure 7. The root-mean-square (RMS) value and maximum value of the differences between the vertical OTL displacement from the FES2004 model (as reference) and other OTL models at the (a) NOVM station, (b) BRMU station, and (c) NYA1 station.
Remotesensing 12 03080 g007
Figure 8. The RMS errors of the differences between the zenith tropospheric delays (ZTDs) calculated with the inclusion or exclusion of the OTL model at (a) inland, (b) island and (c) coastal areas.
Remotesensing 12 03080 g008
Figure 9. The difference of the ZTD calculated with inclusion or exclusion of the OTL models at the (a) NOVM station, (b) BRMU station, and (c) NYA1 station.
Remotesensing 12 03080 g009
Figure 10. The RMS error of differences between ZTDs calculated using the FES2004 ocean tide model (as reference) and the other OTL models at (a) inland, (b) island and (c) coastal areas.
Remotesensing 12 03080 g010
Figure 11. The difference of the ZTD calculated with the FES2004 model (as reference) and other OTL models at the (a) BRMU station, (b) NYA1 station, and (c) NOVM station.
Remotesensing 12 03080 g011
Figure 12. The RMS differences between the GNSS-derived ZTD and radiosonde stations with six cut-off angles and different OTL models at the (a) NOVM station, (b) BRMU station, and (c) NYA1 station.
Remotesensing 12 03080 g012
Figure 13. The RMS differences between the GNSS-derived ZTD and the radiosonde-derived ZTD at 10 stations with six cutoff elevations using the FES2004 model at (a) inland, (b) island, and (c) coastal areas.
Remotesensing 12 03080 g013
Table 1. GNSS stations and their co-located radiosonde stations.
GNSS SiteRadiosonde SiteDistance(km)PositionGNSS Height(m)Radiosonde Height (m)
ALRT710820.652coastal78.12377.39
NYA1010041.746coastal84.23767.80
SCOR043390.589coastal128.5126.22
TIXI218240.762coastal47.0670.83
PBRI433333.682island−22.58316.72
MAC1949980.919island−6.797−12.79
BRMU780161.531island−11.6261.99
FAA1919380.844island12.0524.82
POVE828241.111inland119.562114.09
NOVM296340.608inland150.139106.69
Table 2. Summary of ocean tide models [41].
ModelResolutionTide Model TypeCoverage
GOT4.70.5° × 0.5°H + T/P + ERSGlobal
NAO. 99 b0.5° × 0.5°H + T/PGlobal
DUT100.125° × 0.125°H + T/P + Jason − ½ + ERS + T/GGlobal
EOT11a0.125° × 0.125°H + T/P + Jason − ½ + ERS + EnvisatGlobal
FES20040.125° × 0.125°H + T/P + T/G + ERSGlobal
Hamtide.2011a0.125° × 0.125°H + T/P + Jason − 1/2Global
TPXO7.20.25° × 0.25°H + T/P + T/G + ERSGlobal
H represents the hydrodynamic model; ERS is the ERS altimetry data; T/G is the tide gauge data; T/P is the TOPEX/Poseidon altimetry data.
Table 3. Data processing strategies with precise point positioning (PPP).
ItemStrategies
FrequenciesGPS L1 and L2 dual-frequency
Filter TypeSmoother combined solution with forward and backward filter solutions
Elevation cutoff angle10°
Ocean TidesDUT10, EOT11a, FES2004, GOT4.7, Hamtide11a, Nao.99b, and TPXO7.2
Satellite Ephemeris, Clock
and Earth Rotation Parameters
IGS final products
IonosphereIonosphere-free linear combination
with dual-frequency
TroposphereEstimate ZTD and horizontal
gradient parameters
Mapping functionNMF
Receiver phase centerPCO and PCV values from igs14.atx
Satellite phase centerPCO and PCV values from igs14.atx
Phase-windup effectModel corrected
ZTD temporal resolution30 s
Gradient parameters temporal resolution30 s
Integer Ambiguity ResolutionContinuously static integer ambiguities are estimated
Table 4. The statistic presented in this table is the difference between the GNSS-derived ZTD and the ZTD derived from the co-located radiosonde station (as a reference), for GNSS stations with a co-located radiosonde station, with comparisons across OTL models.
StationDUT10EOT11aFES2004GOT4.7Hamtide11aNao. 99bTPXO7.2Without OTL
RmsBiasRmsBiasRmsBiasRmsBiasRmsBiasRmsBiasRmsBiasRmsBias
ALRT20.1812.7520.1912.7820.1912.7720.2012.8320.1912.7813.398.5120.2112.8420.3212.93
BRMU19.67−10.9319.64−10.9119.59−10.7819.59−11.0019.60−10.9019.54−10.8619.72−11.0825.68−15.48
FAA123.85−11.9423.86−11.9423.88−11.9623.75−11.7323.83−11.8523.83−11.8423.85−11.9025.00−12.65
MAC119.99−16.0819.95−16.0019.96−16.0219.91−15.9919.87−15.9119.86−15.9019.98−16.0421.79−17.33
NOVM22.6616.8122.6716.8222.6916.8522.6516.8122.6816.8322.6316.8022.6516.8023.3217.32
NYA120.6714.2820.7314.3420.7514.3820.5814.2220.5414.1420.6414.2820.5114.1320.8614.23
PBRI28.68−24.6628.86−24.8828.75−24.6828.80−24.7828.69−24.6228.78−24.7028.97−24.8832.56−29.32
SCOR27.1026.4827.0526.4327.0526.4426.9626.3426.9926.3627.1126.5026.9426.3128.0727.53
TIXI26.9020.6726.9320.6726.9420.6926.9520.7126.9120.6626.8720.6426.8920.6428.0622.02
POVE15.56−9.5715.57−9.5915.56−9.5815.59−9.6115.55−9.5415.57−9.5815.56−9.5715.62−8.66

