Monitoring and Detecting Archaeological Features with Multi-Frequency Polarimetric Analysis


1
RHEA Group c/o ESA/ESRIN, Largo Galileo Galilei 1, 00044 Frascati, Italy
2
RSAC c/o ESA/ESRIN, Largo Galileo Galilei 1, 00044 Frascati, Italy
3
Grupo de Investigación Microgeodesia Jaén (PAIDI RNM-282), Universidad de Jaén, Campus Las Lagunillas s/n, 23071 Jaén, Spain
*
Author to whom correspondence should be addressed.
Remote Sens. 2020, 12(1), 1; https://doi.org/10.3390/rs12010001
Submission received: 31 October 2019
/
Revised: 5 December 2019
/
Accepted: 12 December 2019
/
Published: 18 December 2019
(This article belongs to the Special Issue Selected Papers from the Polarimetric Interferometric SAR Workshop 2019)
Abstract
:In remote sensing for archaeology, an unequivocal method capable of automatic detection of archaeological features still does not exists. Applications of Synthetic Aperture Radar (SAR) remote sensing for archaeology mainly focus on high spatial resolution SAR sensors, which allow the recognition of structures of small dimension and give information of the surface topography of sites. In this study we investigated the potential of combined dual and fully polarized SAR data and performed polarimetric multi-frequency and multi-incidence angle analysis of C-band Sentinel-1, L-band Advanced Land Observing Satellite Phased Array type L-band Synthetic Aperture Radar (ALOS PALSAR) and of C-band Radar Satellite-2 (RADARSAT-2) datasets for the detection of surface and subsurface archaeological structures over the United Nations Educational, Scientific and Cultural Organization (UNESCO) site of Gebel Barkal (Sudan). While PALSAR offers a good historical reference, Sentinel-1 time series provide recent and systematic monitoring opportunities. RADARSAT-2 polarimetric data have been specifically acquired in 2012/2013, and have been scheduled to achieve a multi-temporal observation of the archaeological area under study. This work demonstrated how to exploit a complex but significant dataset composed of SAR full polarimetric and dual polarimetric acquisitions, with the purpose of identifying the most suitable earth observation technique for the preservation and identification of archaeological features. The scientific potential of the illustrated analysis fits perfectly with the current delicate needs of cultural heritage; such analysis demonstrates how multi-temporal and multi-data cultural heritage monitoring can be applied not only for documentation purposes, but can be addressed especially to those areas exposed to threats of different nature that require a constant and prompt intervention plans.

1. Introduction
The integration of a very specific and technical topic like SAR remote sensing with a humanistic field of research like archaeology can be considered an interesting challenge [1]. Besides the already proven capabilities of optical remote sensing for cultural heritage [2], SAR applications for archaeology [3] make these two scientific fields converge in a productive and non-invasive collaboration [4,5], ideally made of archaeologists and scientists, both of whom require specific knowledge. This synergy of humanistic and technological fields offers great opportunities for worldwide heritage mapping and consciousness.
1.1. Context of the Study
Use of satellite synthetic aperture radar in archaeology provides a new and powerful tool in the study of cultural heritage, especially thanks to the possibility to extract, in specific cases, information about ancient complexes behind the contemporary landscape [6].
The very first applications of Synthetic Aperture Radar (SAR) for archaeology date back to the 1980s, when the first shuttle imaging SAR SIR-A allowed NASA researchers to identify unknown paleo-channels under the desert sand in Northern Sudan and Southern Egypt, a discovery that lead to implications in the geo-archaeology of prehistoric environments of the Sahara [1]. Although SAR data exploitation for archaeology is still in an experimental stage, it offers a great potential for applications ranging from the detection of ancient features and sites [7], the reconstruction of former landscape, the monitoring and the preservation of cultural landscapes [5]. The main features of SAR systems—Sun and weather independent acquisitions, the capability to penetrate ground (especially in dry environments and at given wavelengths), as well as the possibility to derive information on the dielectric properties of the target—make SAR a potential and powerful world heritage investigation tool. Moreover, satellite data can be useful in monitoring remotely unreachable (natural constraints) or inaccessible (politic and logistic situations) heritage areas.
In this study, a polarimetric multi-frequency analysis of L-band Advanced Land Observing Satellite Phased Array type L-band Synthetic Aperture Radar (ALOS PALSAR), C-band Radar Satellite-2 (RADARSAT-2) and C-band Sentinel-1 datasets was performed for the detection of surface and subsurface archaeological features of Gebel Barkal archaeological site (Sudan), inscribed in the United Nations Educational, Scientific and Cultural Organization (UNESCO) World Heritage List since 2003. The polarimetric sensor PALSAR ceased operation in 2011, therefore data acquired by this satellite can be considered “historic”, even though quite recent. Acquisitions from RADARSAT-2 have been specifically scheduled and acquired for the area of interest in order to enrich the data collection with multi-temporal and multi-frequency dataset. In addition to SAR polarimetric historical acquisitions, we used recent (since 2016 up to 2019) dual-pol radar data from Sentinel-1 to derive backscatter intensity and investigate the capabilities of Sentinel-1 to detect and monitor subsurface archeological features.
The motivation of this study was to apply the aforementioned techniques for archaeological site characterization from the polarimetric point of view, and at the same time, investigate the capability to detect buried archaeological remains. In particular, the application of such techniques can be useful for the study and preservation of heritage areas presenting specific natural and anthropic conditions; dry environments such as desert, uncontrolled urban expansion phenomena, or areas not accessible due to political instability. Moreover, this approach can constitute a preventative analysis for digging decision making, especially when excavations cannot be carried out for a series of institutional and topographic reasons.
1.2. Study Area—the UNESCO Site of Gebel Barkal (Sudan)
Archaeological sites of Gebel Barkal and the Napatan region are located in the Northern Sudan, in the province of Meroe. Since 2003, these sites are inscribed in the World Heritage List, covering a property of 183ha and a buffer zone of 47ha, this last one still not definitively established (Figure 1). Gebel Barkal and the sites of the Napatan region represent the exceptional example of the Napato-Meroitic (Kushite) civilization that prevailed in the Nile Valley from the 9th Century BC to the Christianization of the country in the 6th Century [8]. The area expresses outstanding universal value and holds a high degree of intactness—archaeological structures in the area are very slightly affected by modern urban extensions.
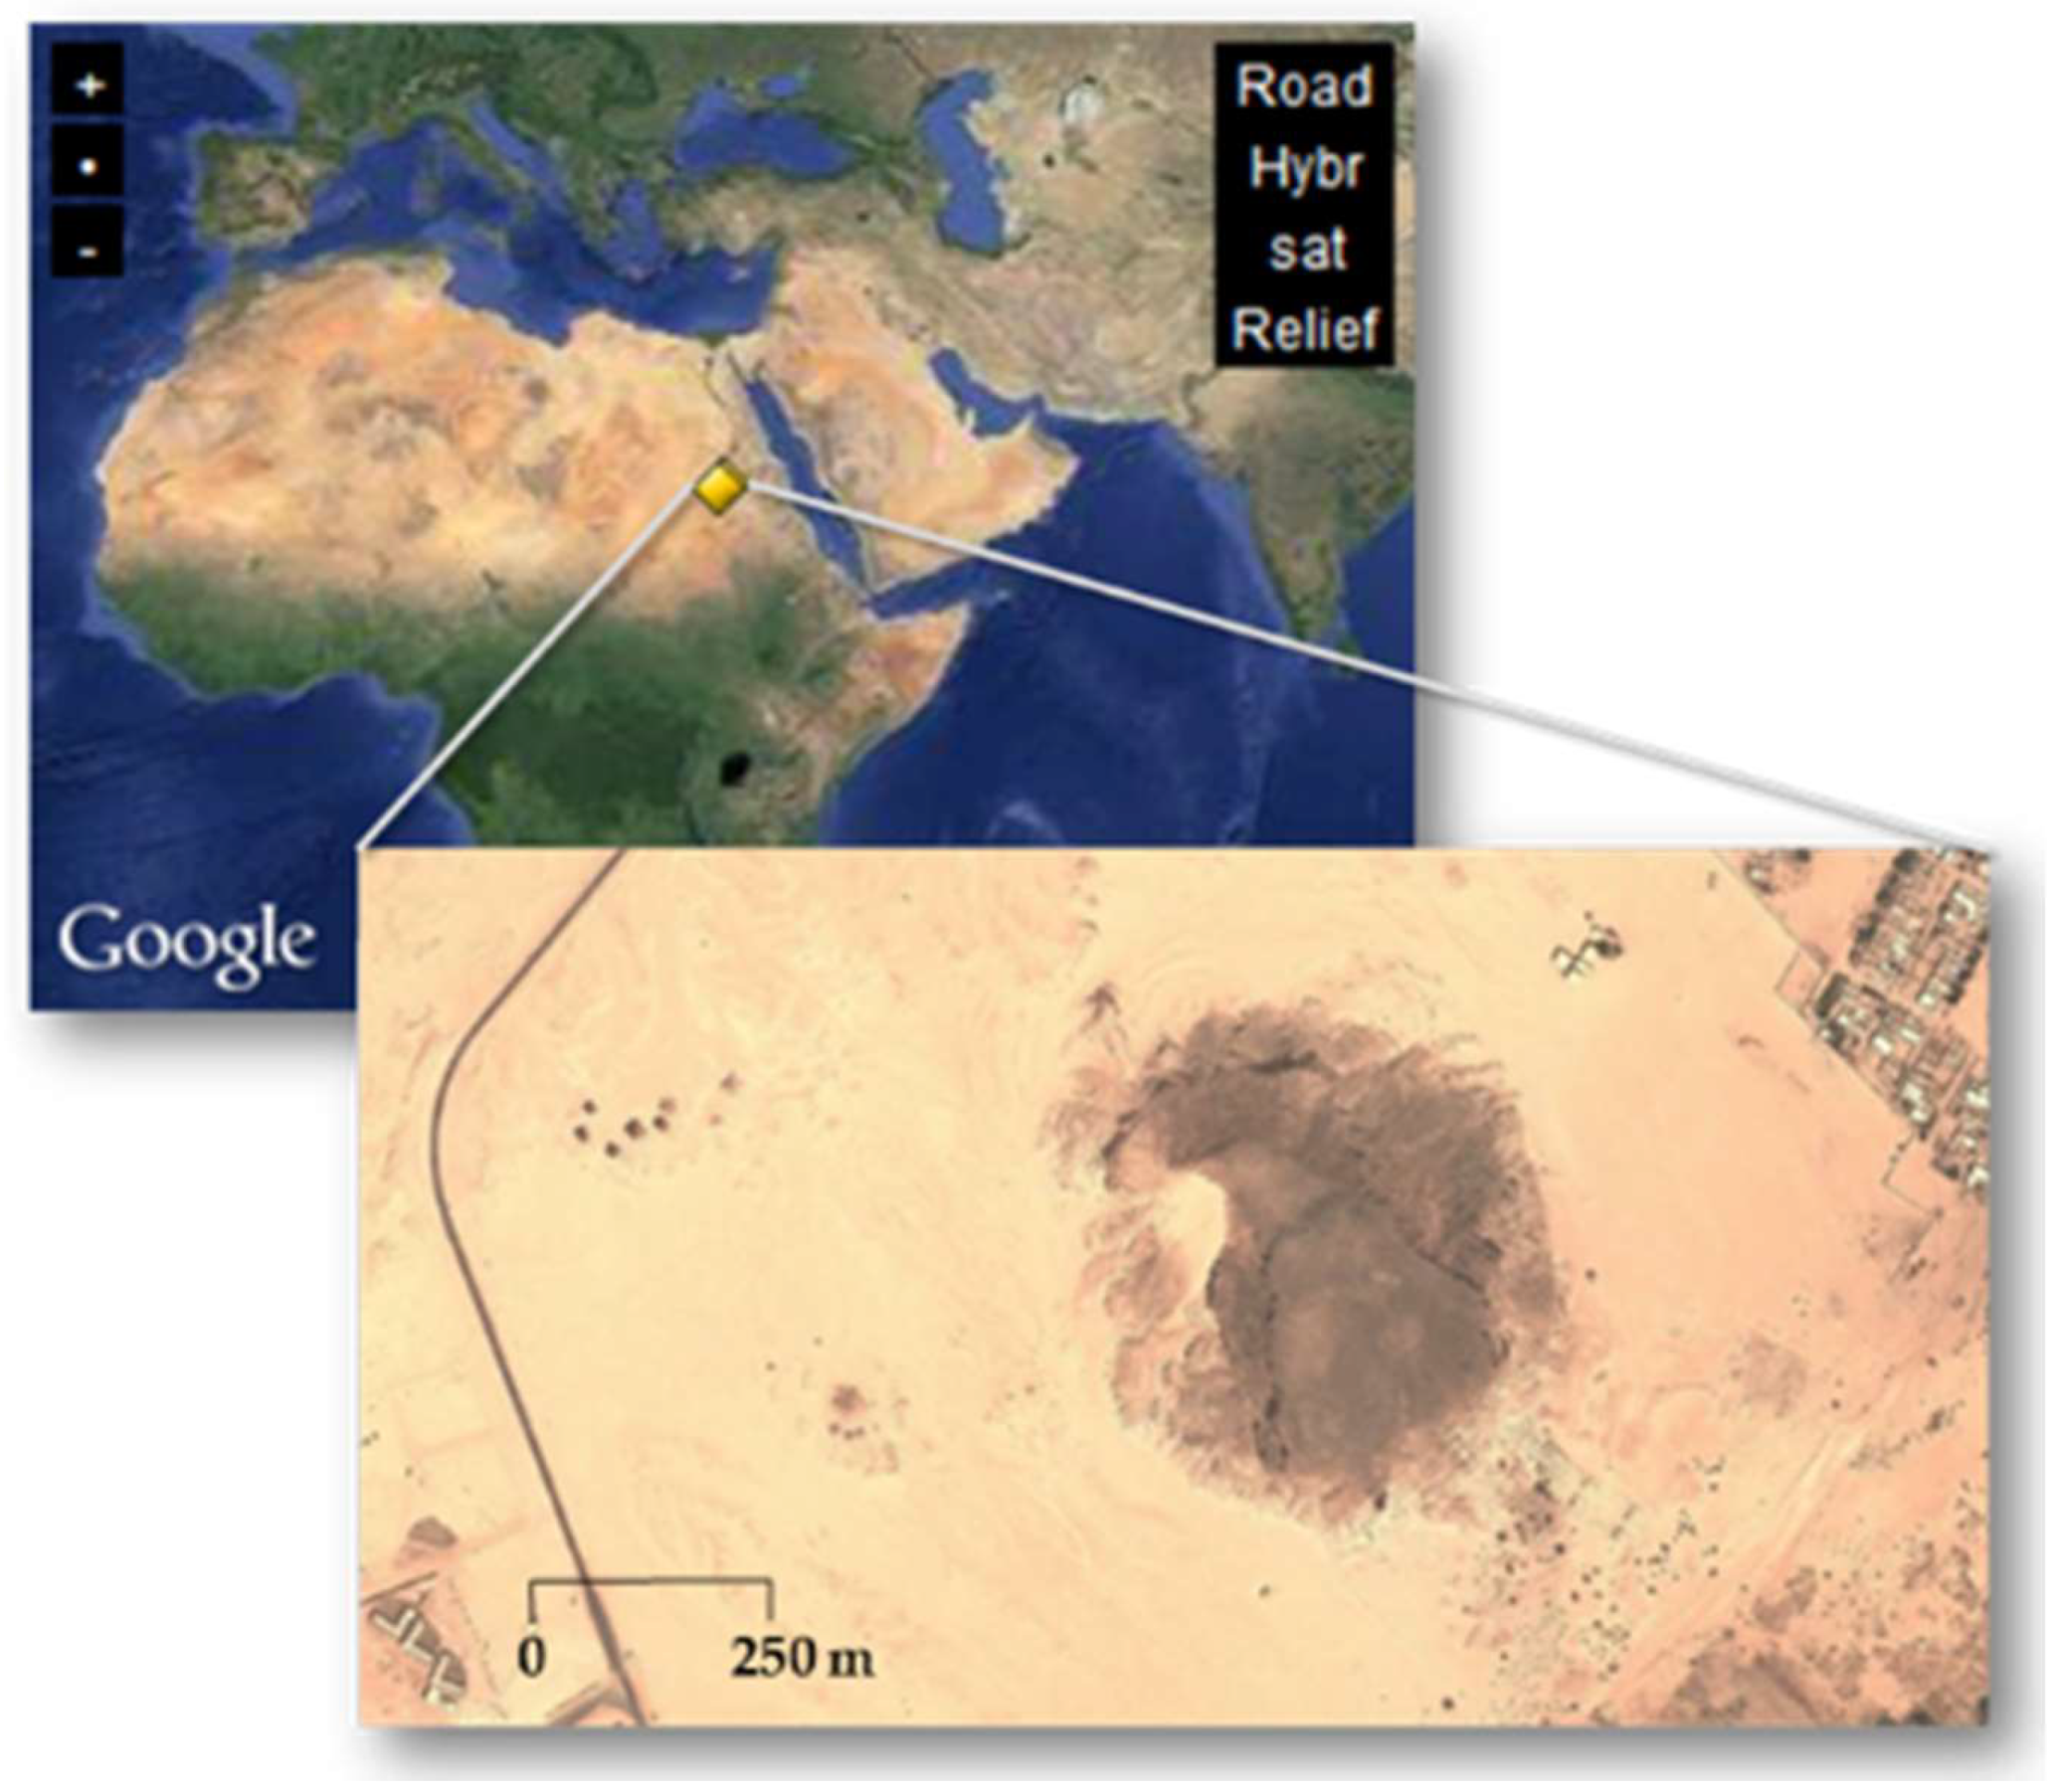
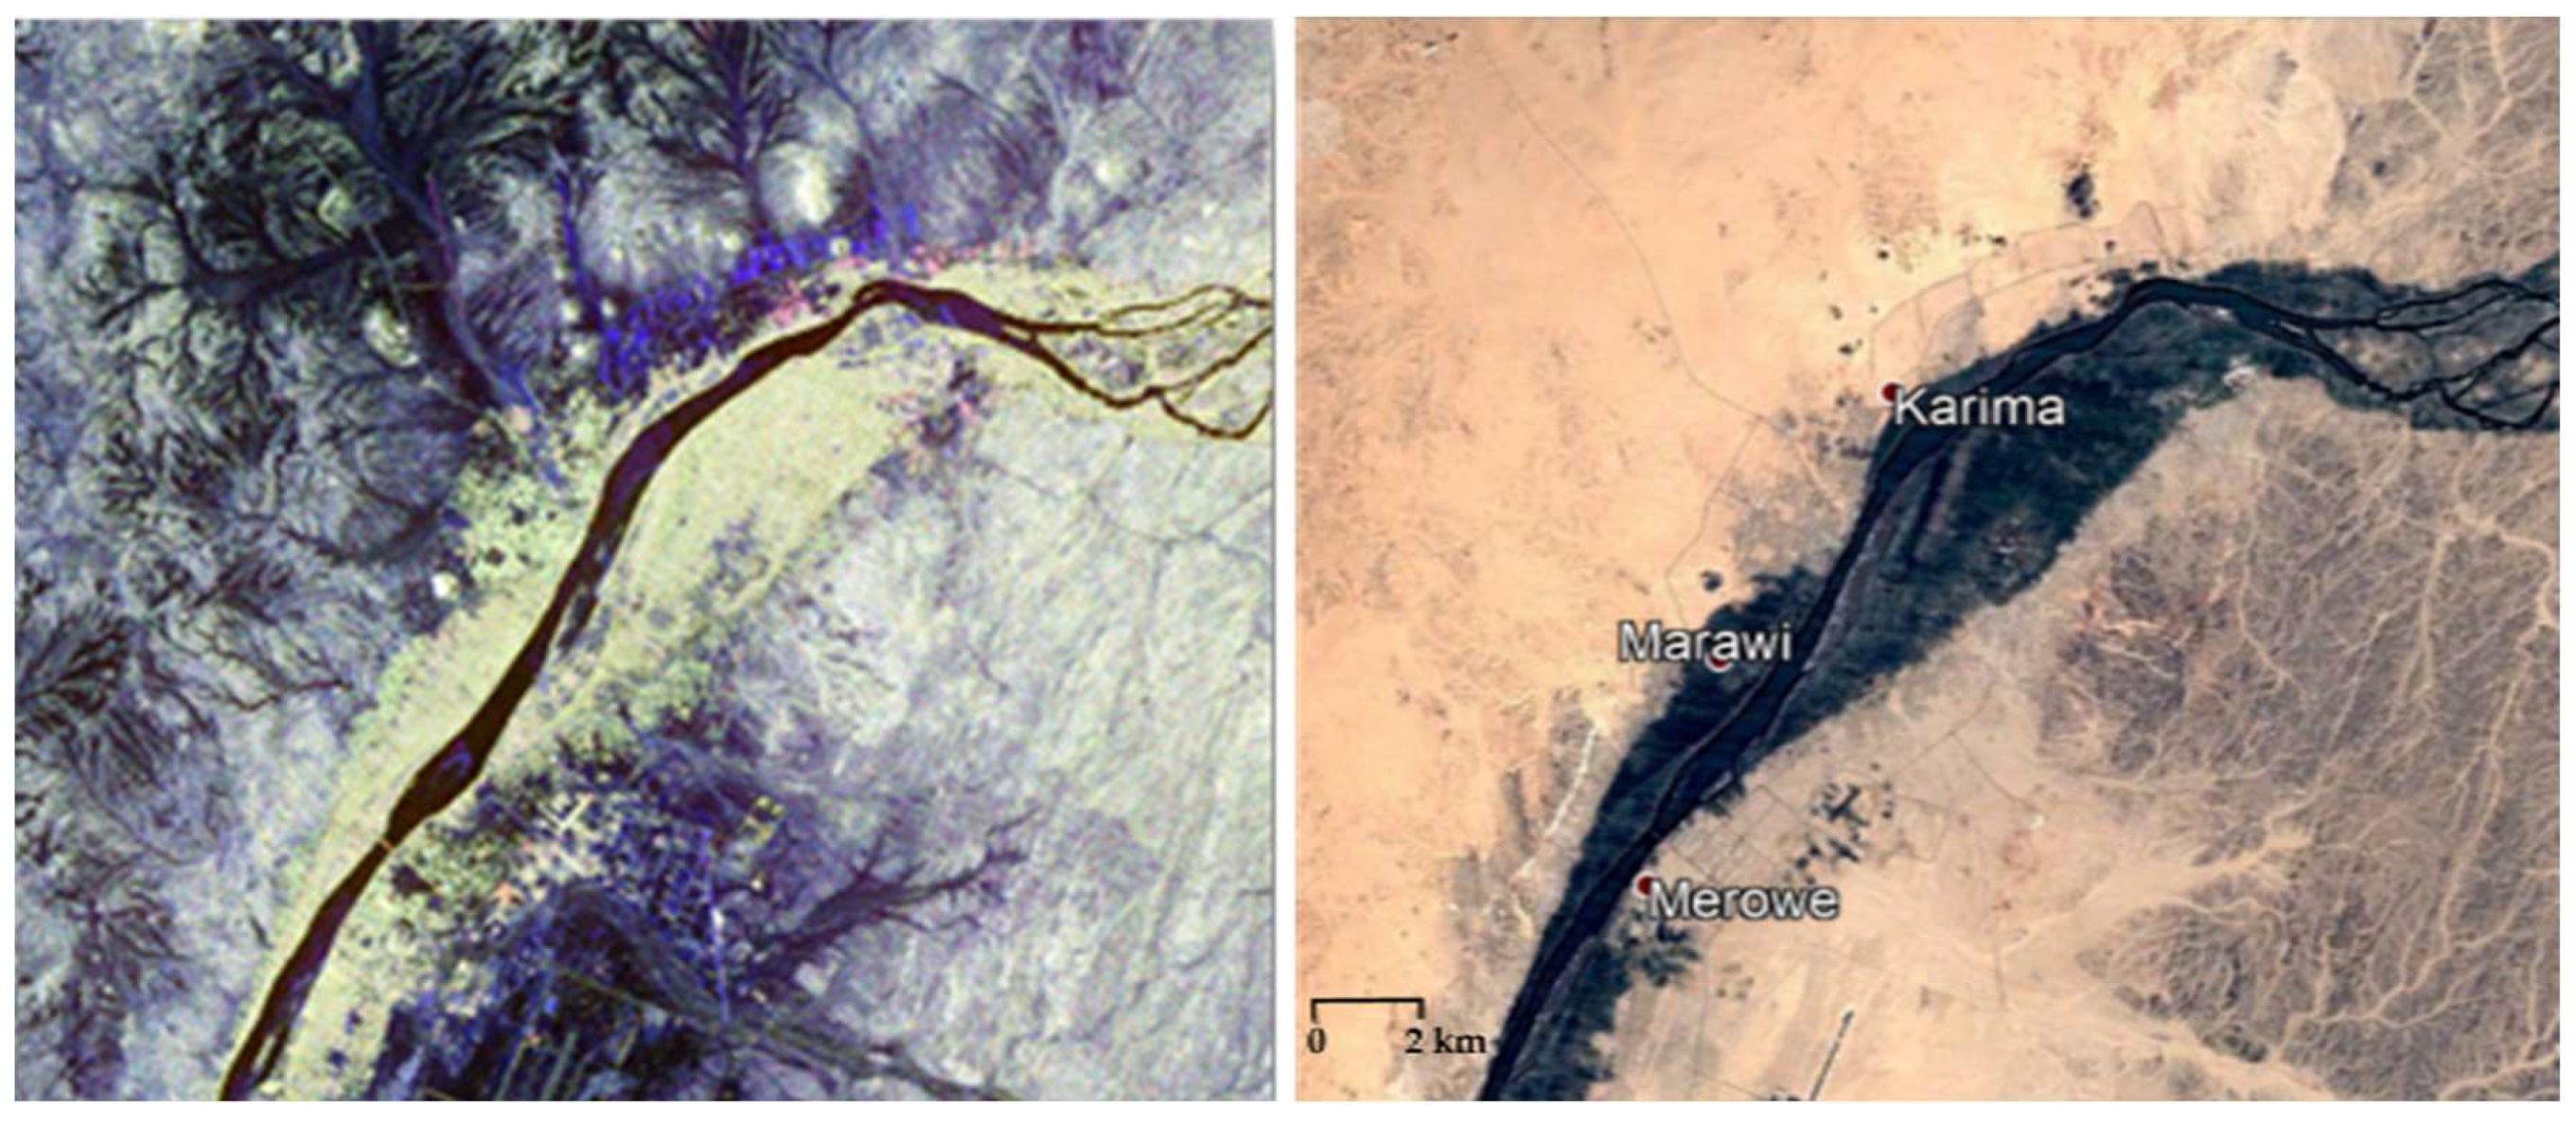
Gebel Barkal (18°32′N, 31°49′E, WGS84) constitutes one of the five Napatan (900 to 270 BC) and Meroitic (270 BC to 350 AD) archaeological sites located on both sides of the Nile river in an arid area considered part of Nubia (Sudan). The sites (Gebel Barkal-Djébel Barkal, Kurru-El-Kourrou, Nuri-Nouri, Sanam and Zuma-Zouma) stretch over more than 60 km along the river (Figure 2). Gebel Barkal is the modern Arabic name of a lone sandstone hill rising on the SW edge of Karima, about 365 km N/NW of Khartoum and 23 km downstream from the Merowe Dam at the fourth cataract of the Nile [8].
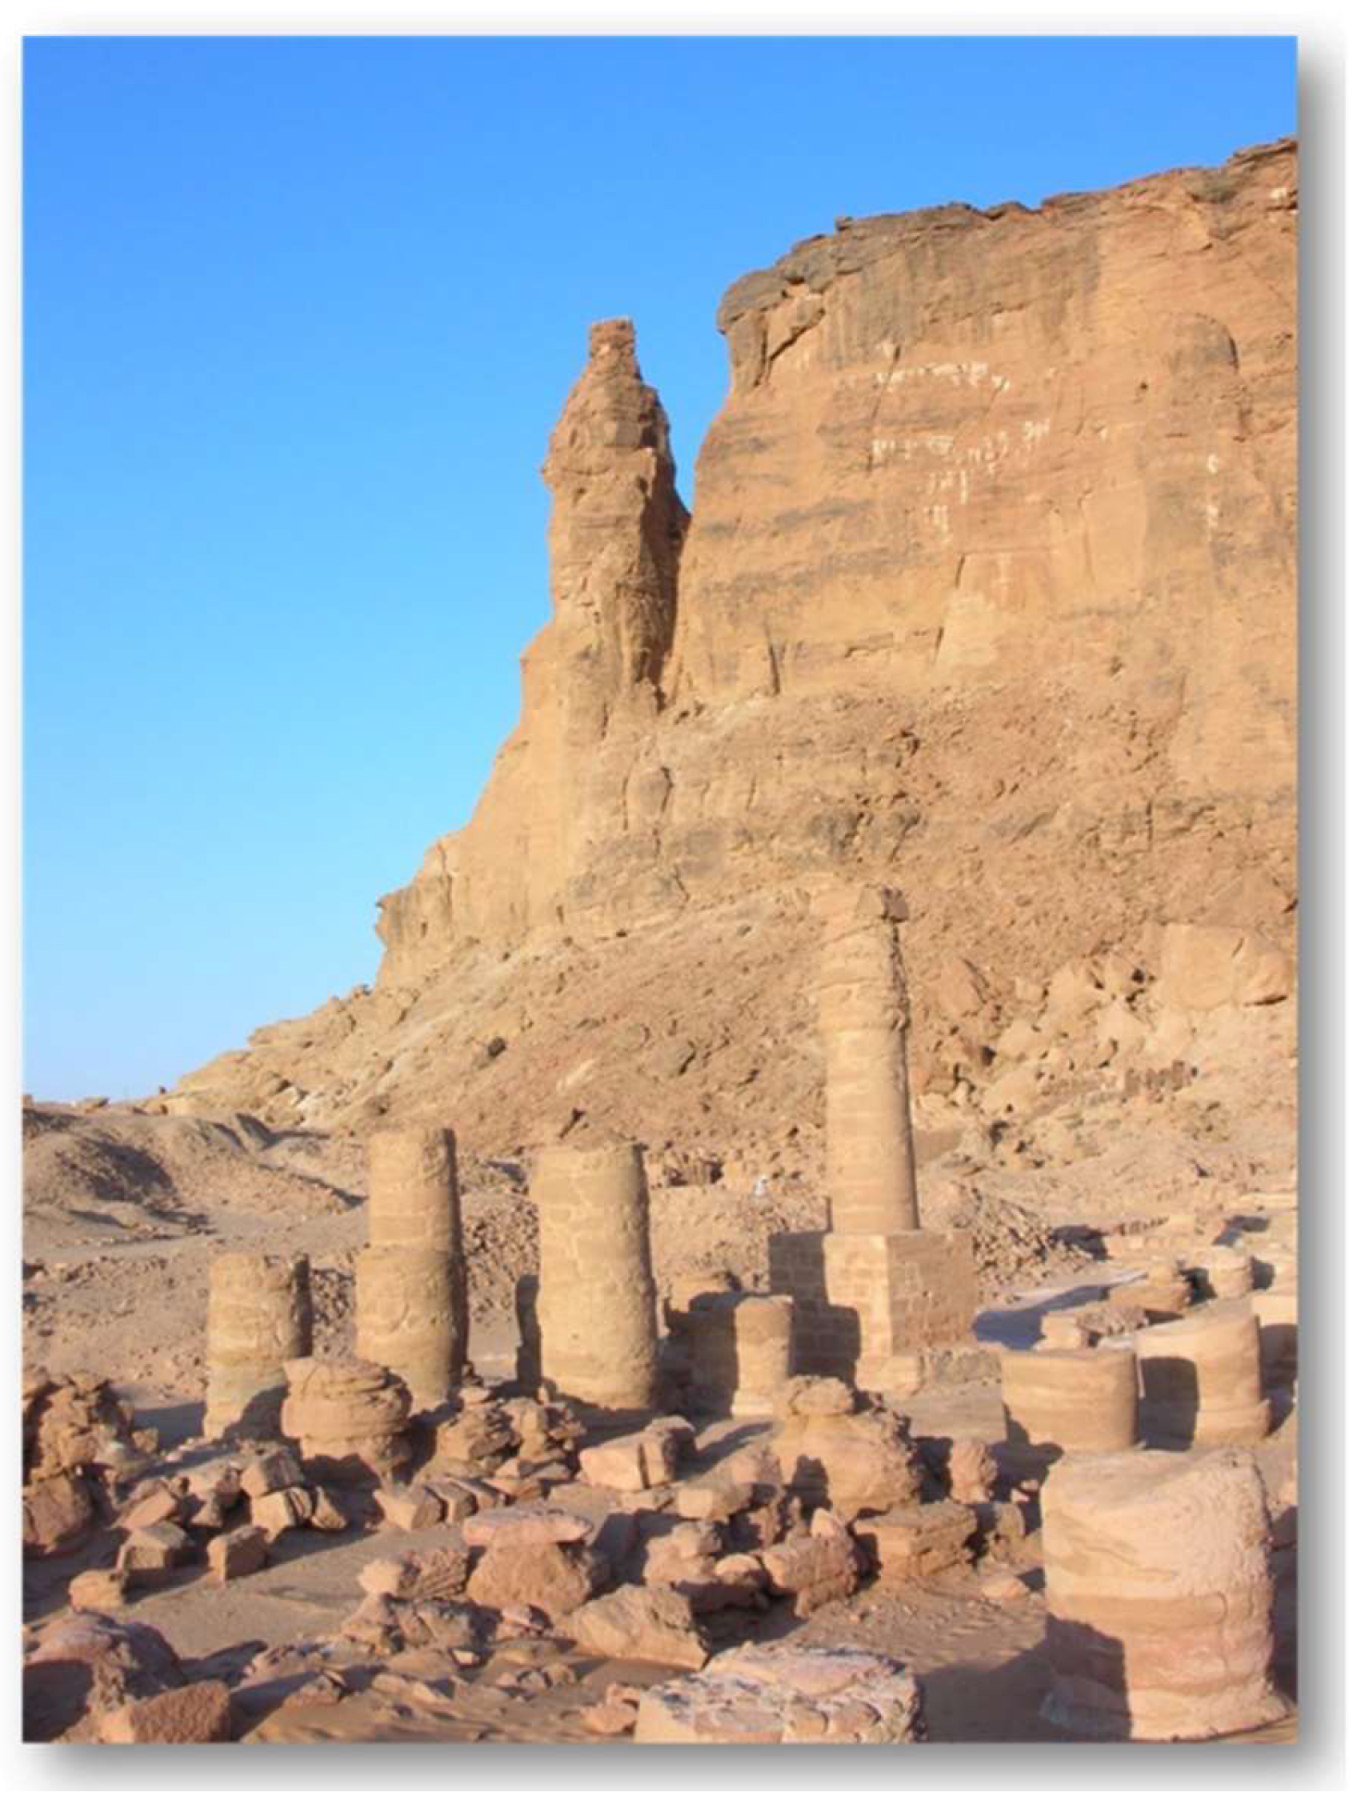
Since antiquity, the hill of Gebel Barkal has been strongly associated with religious traditions and local folklore. Excavations and surveys of the hill and its surroundings revealed nine temples, all at the foot of the hill and facing the Nile, palaces, administrative structures, pyramids and other kinds of tombs. The largest temple, whose remains are shown in Figure 3, is that dedicated to the god Amun [9].
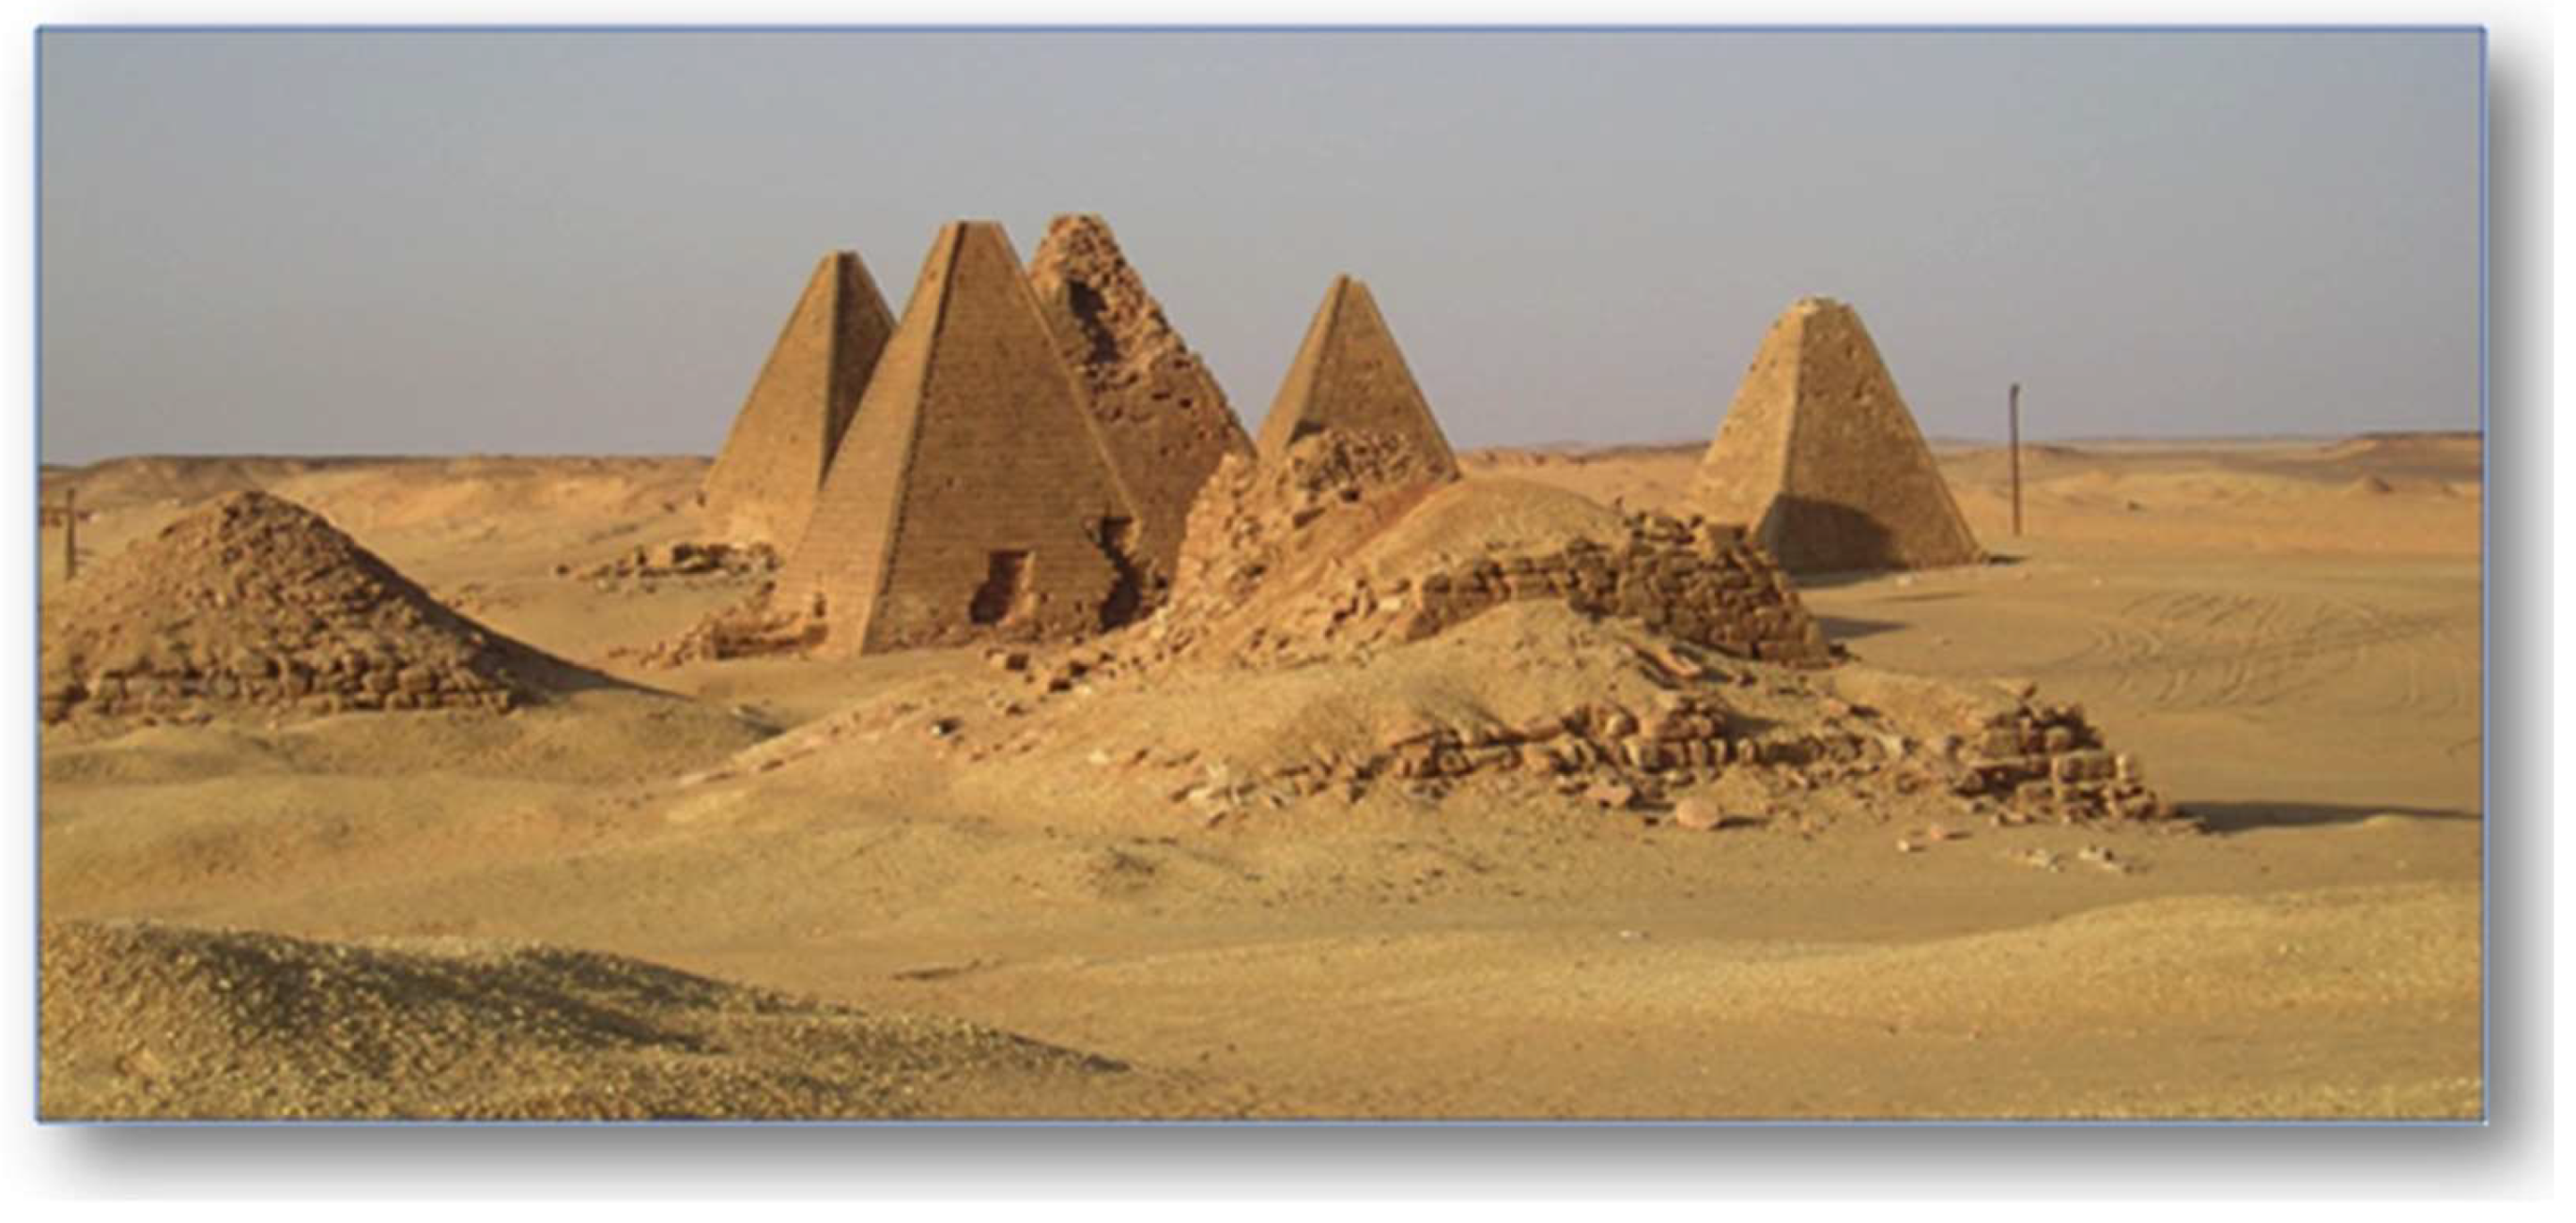
Unlike the temples, which are built from stone, many of the palaces were made from earthen, sun-dried bricks, very sensitive material, presenting low weather-resistance. Pyramids and tombs are unique in their typology and building technique, still preserving their original shape and height, being also part of the special desert border landscape. The field of pyramids constitutes the necropolis, part of the royal Napatan-Meroïtic cemetery (Figure 4).
Many differences exist between Napatan pyramids and the well-known Egyptian ones, like distinctive construction styles (Napatan pyramids are maximum 30m high presenting different stone-finishing technique), as well as different purposes [8].
The Gebel Barkal site presents a vast archaeological area that has been neither excavated nor studied [10]. Archaeological excavations at Gebel Barkal revealed human activity dating back to the 3rd millennium BC. Although Gebel Barkal pyramids are the best preserved royal funerary monuments in Sudan, temples and palaces are in very poor conditions due to a very soft nature of the building stone, to the severity of the local environment (floods and sandstorms), and to the long-term looting of the site by local villagers seeking cut stone blocks for use in the lining of the graves of the Muslim cemetery immediately to the west of the temples.
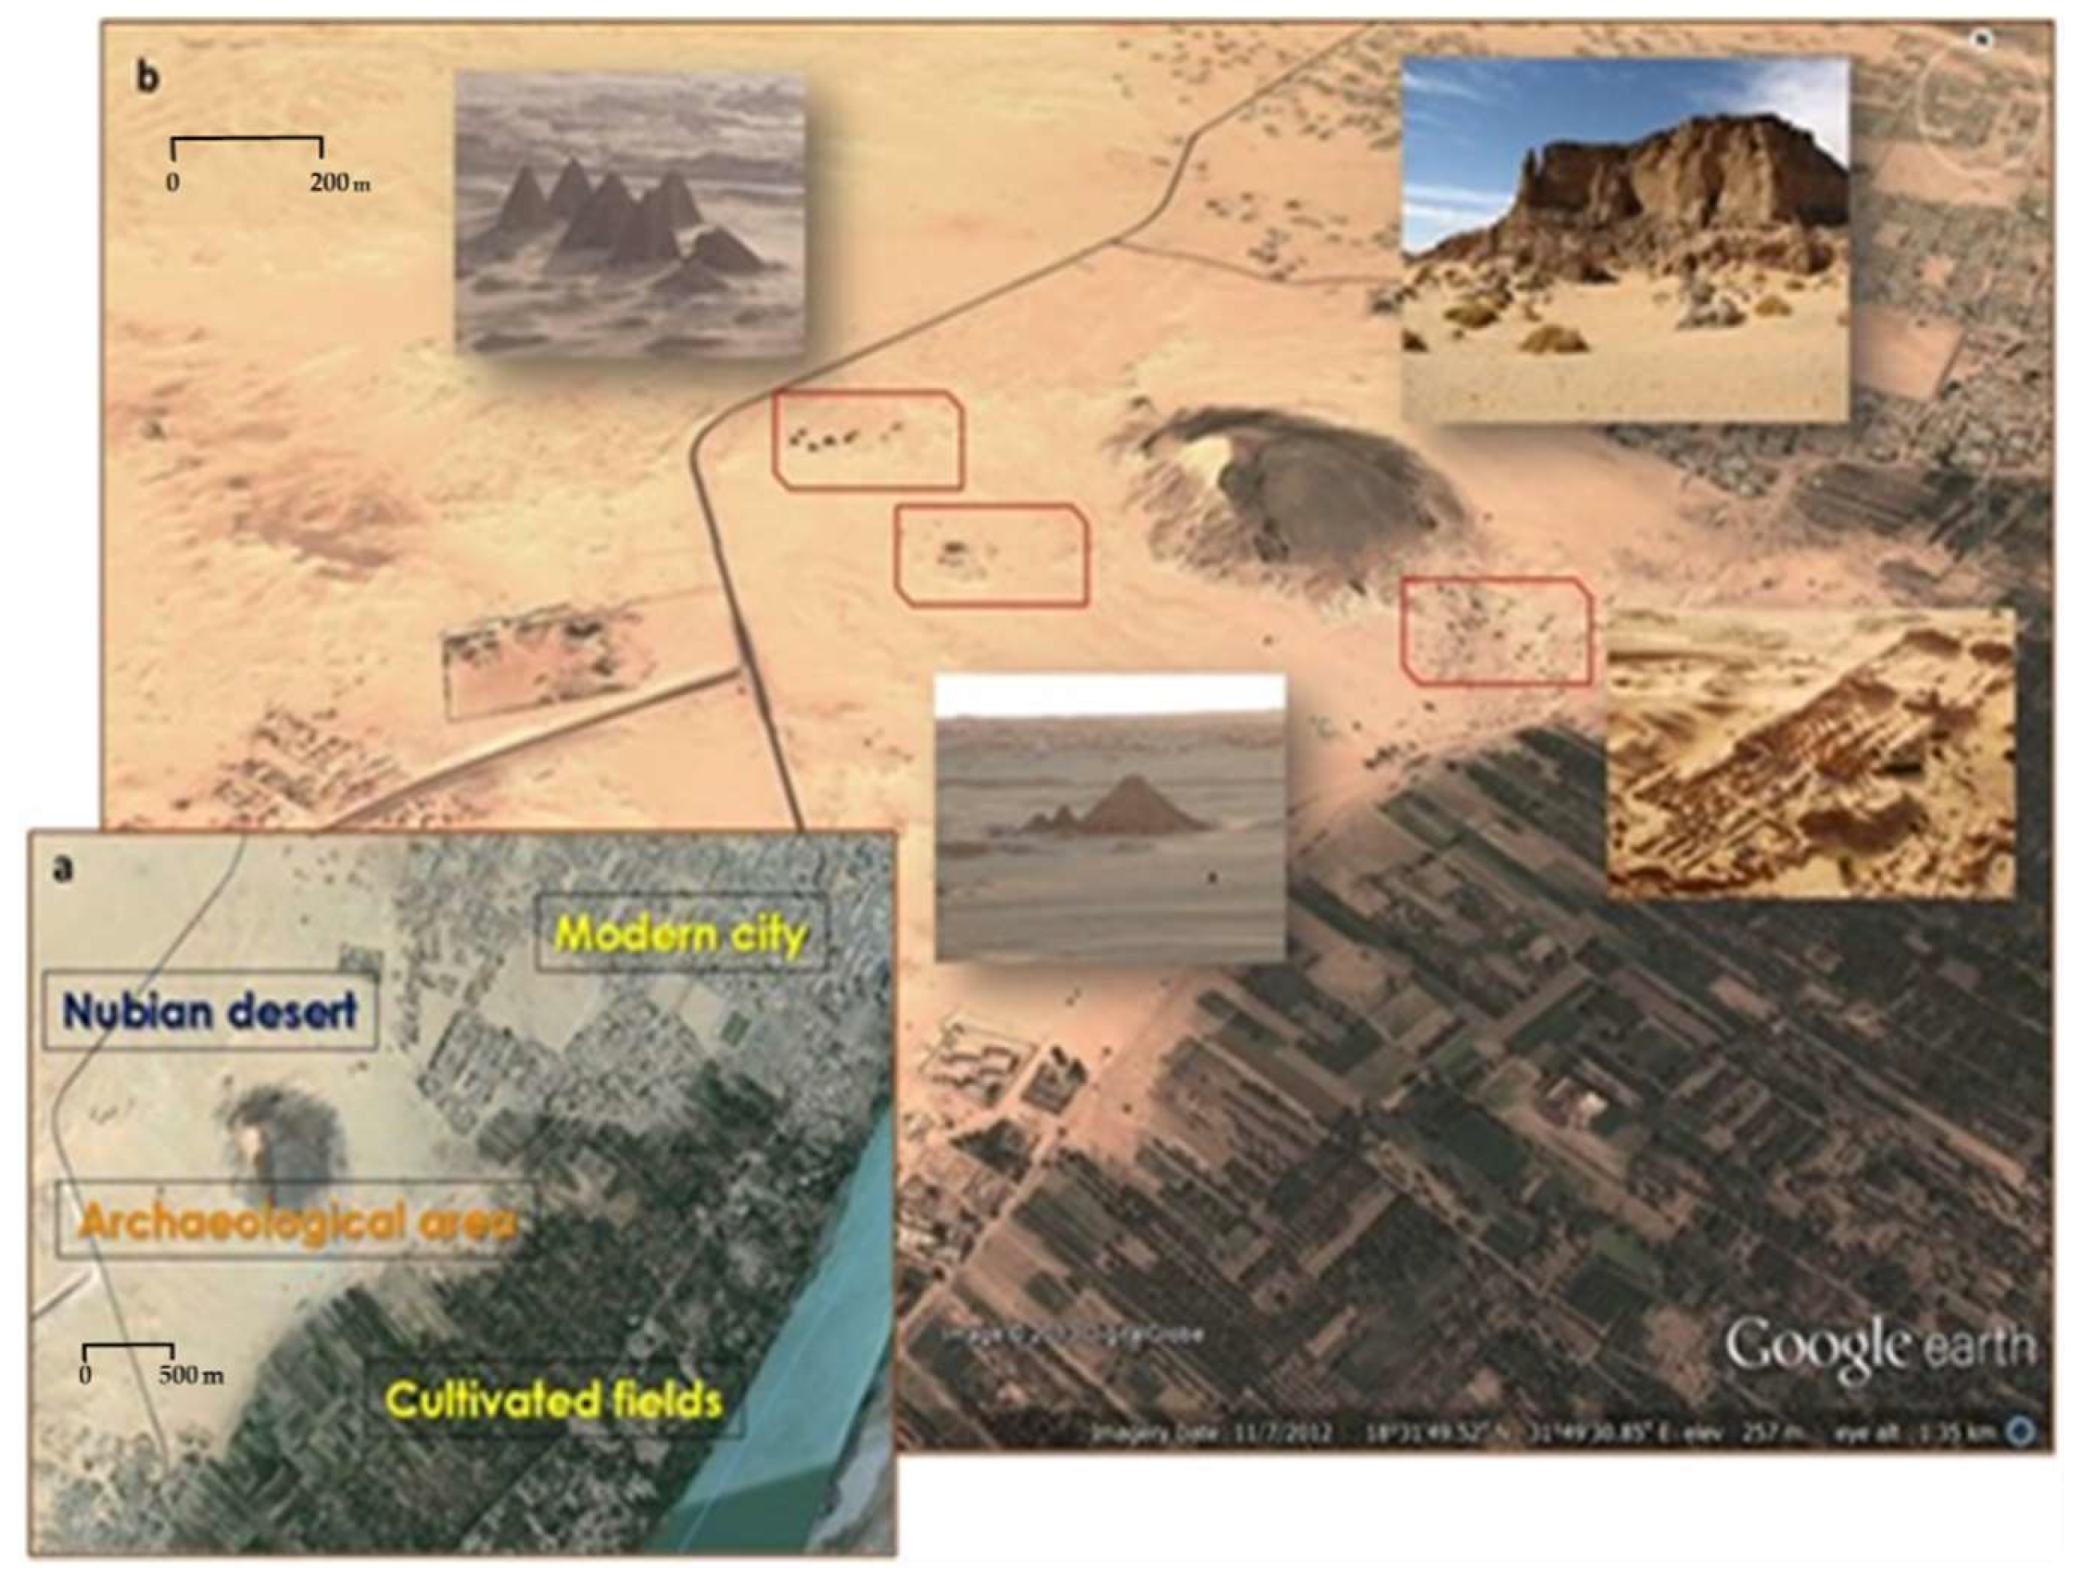
The central archaeological area of Gebel Barkal expands for about 3 square km without being affected by natural or artificial constraints. Beyond this limits, several archaeological remains have been localized both in the urban area of Karima, the modern city located at NE of the archaeological zone, and along the palm cultivation belt that follows the west bank of Nile river (Figure 5a). The archaeologists think that many of the ancient structures have to be still unearthed. Actually, some of these structures are periodically uncovered due to the strong winds originating from Nubian desert.
Concerning the archaeological evidence, Gebel Barkal is characterized by two major necropolises constituted by two groups of royal pyramids in the N-W and central parts of the site. In the southern part, it presents well-known surface palaces and remains of temples (Figure 5b), partially visible and regularly investigated thanks to the missions of international archaeological excavations. The unique relevant morphologic element is constituted by the jebel, the “Holy Mountain” rising for about 100 meters from the flat desert surface.
1.3. Geology and Geomorphology
The Sudan plain consists of dark clays and partially of red and brown sands, and is so flat that railways have been laid on it for dozens of miles without embankments or cuttings. Apart from some well-known mountainous chains, the Sudan plain is only occasionally broken by isolated “jebels” which rise sharply from the flat surface. In particular, the part of Sudan relevant to Nubia is divided in zones called Nile cataracts (first, second, third, fourth, fifth, and sixth).
Unlike other cataracts, the land between the third and fourth cataracts, where the archaeological site of Gebel Barkal is located, is the most fertile part of Nubia. It is a sandstone region geologically and topographically similar to Lower Nubia, but it has in addition two fairly sizable basins where the river regularly overflows its banks during the flood season. This region was always, and remains today, the most populous part of Nubia [11]. In the area of Gebel Barkal, during ground penetrating radar campaigns, carried out for excavation missions, layers of historical activities of Nile flooding have arisen, demonstrating how the river flow activity influenced also the ancient urban organization. This characteristic makes the precise topographic reconstruction of the ancient environment more complex.
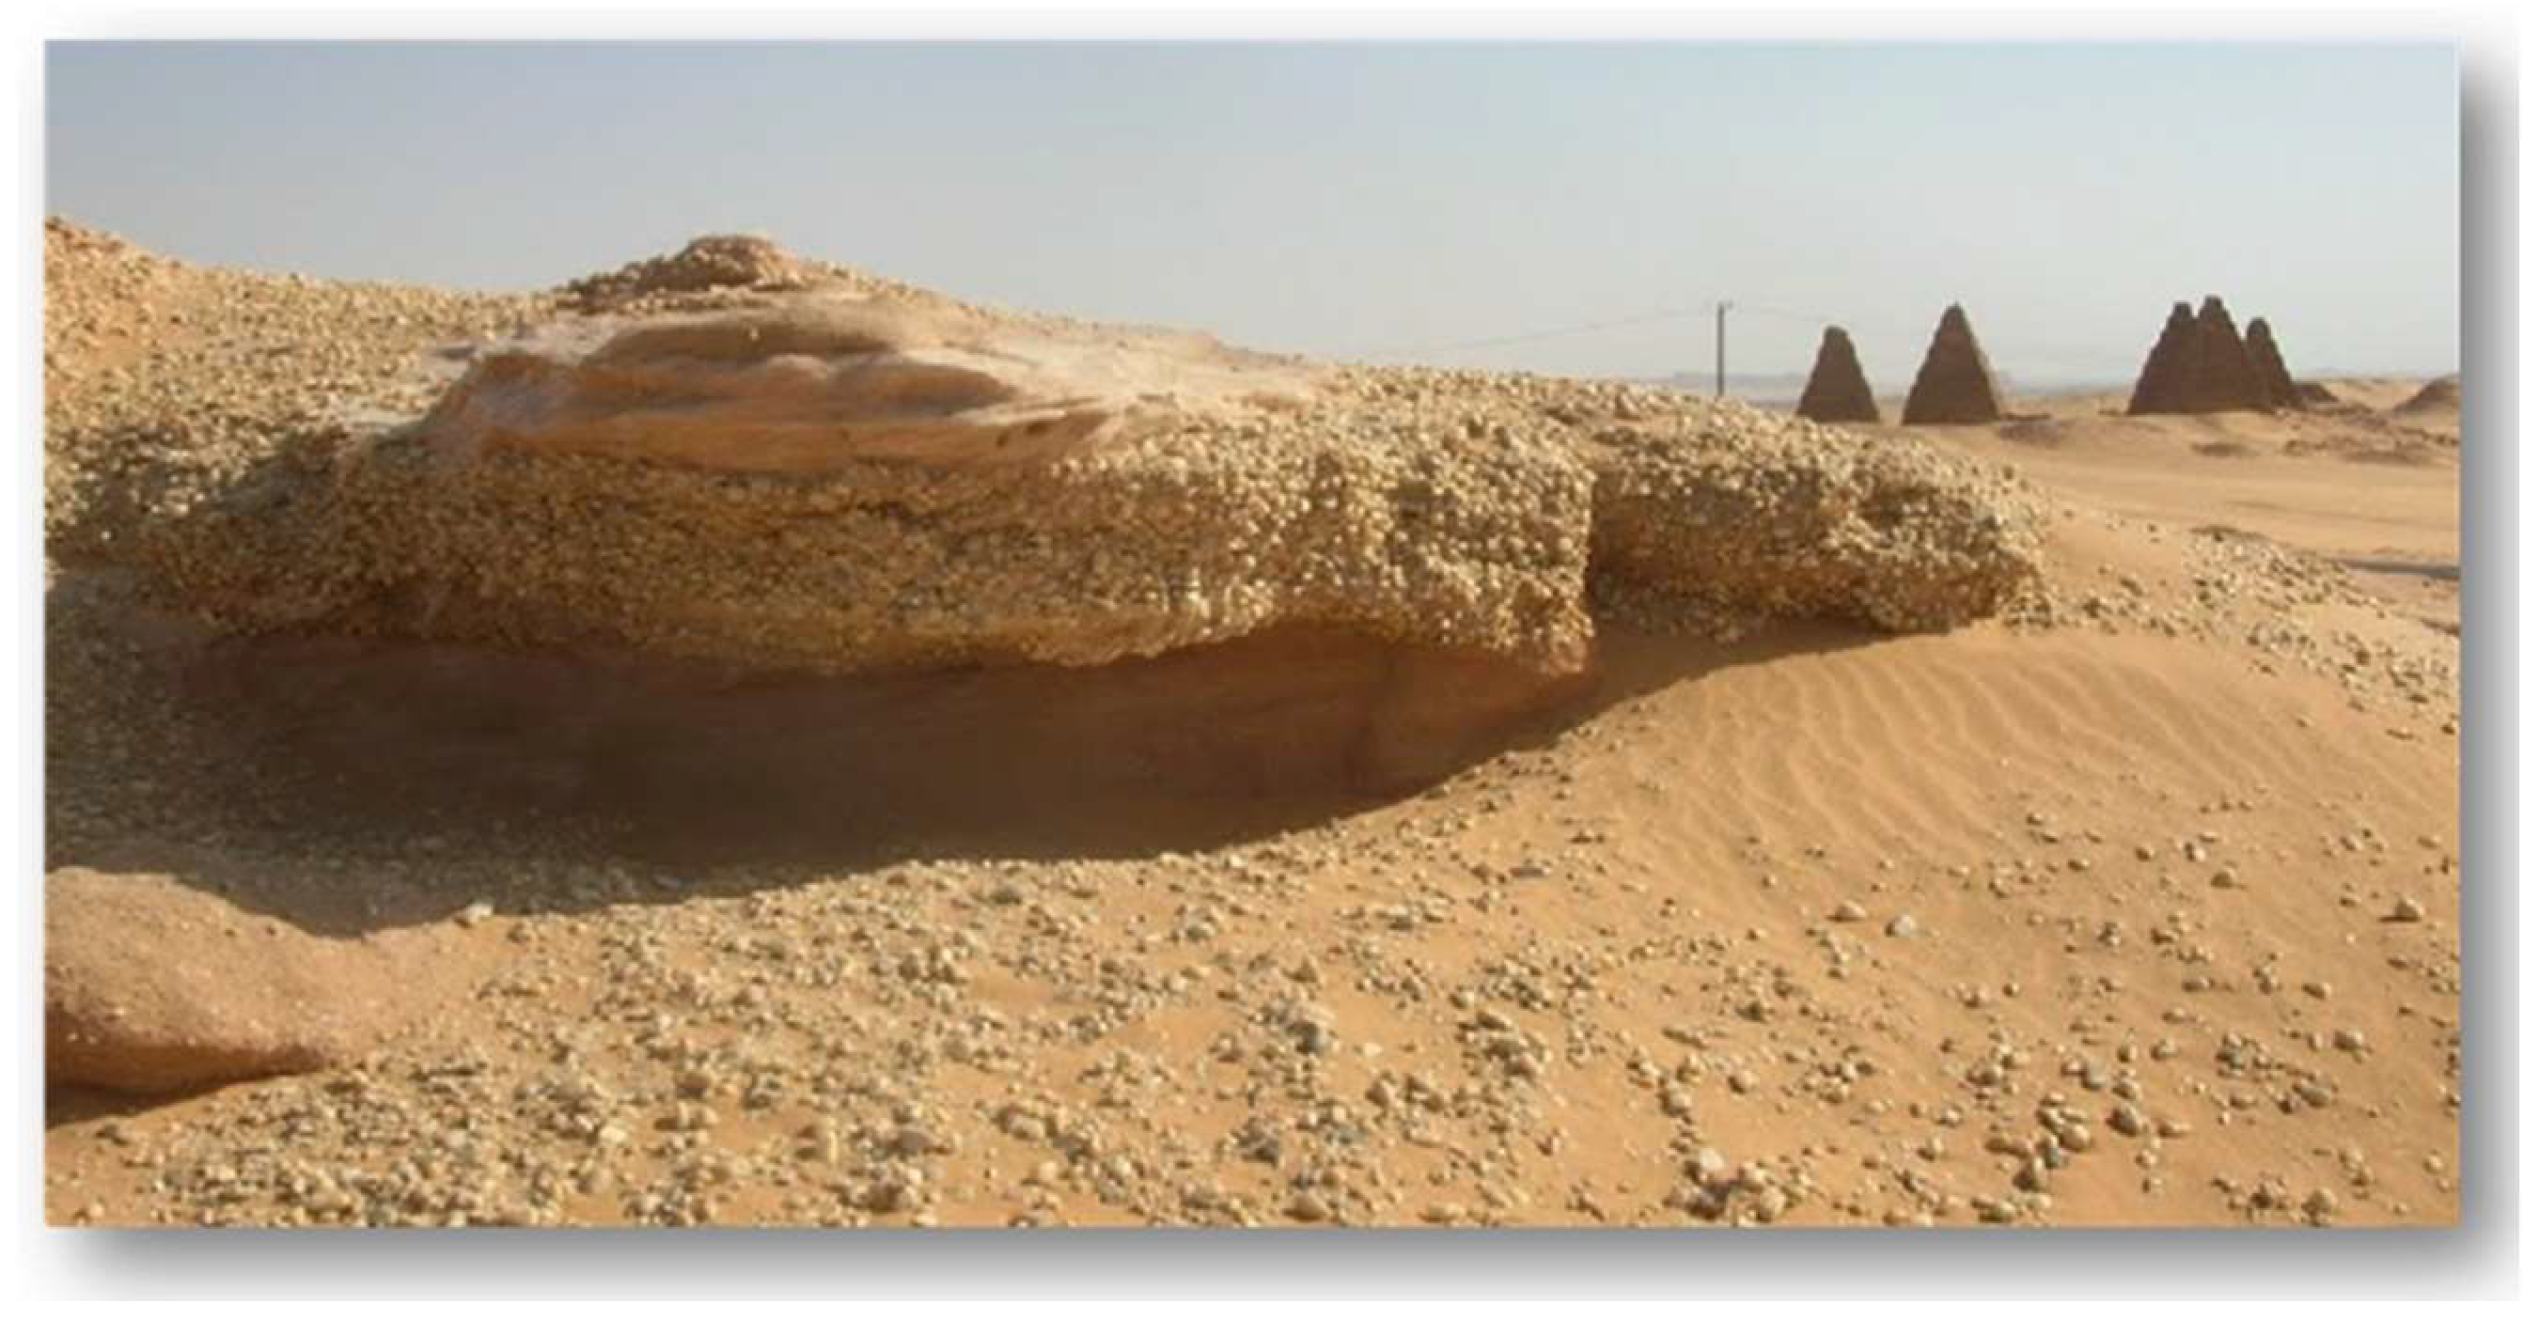
Layers of sand are mixed with pebble conglomerate and smoothed rocks, whose surface portions are shaped by strong winds and sand storms (Figure 6). The activity of atmospheric agents also determines the current shape of the archaeological structures and represents a threat to their conservation. Although the mud-brick pyramids of the royal cemetery are well preserved, some of them show noticeable signs of erosion effects.
The area under study is arid-European Space Agency’s (ESA’s) Soil Moisture Ocean Salinity (SMOS) and National Aeronautics and Space Administration (NASA)’s Soil Moisture Active Passive (SMAP) data confirmed that the area is not affected by the significant soil moisture variations that could influence radar signal.
2. Materials and Methods
The full-pol data used in this study are data from L-band ALOS PALSAR L and C-band RADARSAT-2. The first dataset has been chosen due to the capabilities of L-band microwaves to penetrate the dry sand. Dry sand can be considered as an isotropic homogeneous random medium in which the backscatter coefficient can be attributed to two main scattering mechanisms; surface scattering from sand-air interface and volume scattering from sand particles. In low frequencies, with wavelengths larger than the root mean square (RMS) of the surface roughness the electromagnetic wave propagates through the sand [12] and can scatter from the underlying bedrock or buried structures. The approximate formula (1) for the depth of radar wave penetration through the volume medium shows the relation between radar wavelength and the relative complex dielectric constant. represents the maximum depth within a medium that can contribute to the backscattering coefficient, is radar wavelength and represent real and imaginary part of the dielectric permittivity.
According to (1), the penetration depth of radar signal is directly proportional to the wavelength, therefore in theory the longer SAR wavelength we use, the greater the number of underground structures that could be detected. This phenomenon has been analyzed in several papers; Stewart et al. [13] used multitemporal speckle filtered PALSAR-2 backscatter intensity in the extraction of buried Bronze Age structures in the area of North Sinai. In [14] the authors used ALOS/PALSAR data to detect and characterize geometric targets hidden under sand deposits in the Western Desert of Egypt, and in [15] the penetration capabilities of L and C band were explored.
Although it would be expected that the shorter radar wavelengths are not useful in archeological studies due to the fact that the shorter wavelengths are not penetrating the ground, there are also some studies where TerraSAR-X data (X-band SAR) were used to detect superficial and buried structures [16], proving that in certain conditions X-band waves can penetrate the soil to some extent.
In our study we selected C-band RADARSAT-2 as a trade-off in terms of the wavelength and spatial resolution. An additional advantage of RADARSAT-2 was the possibility to select the incidence angle for acquisitions. It is known that the backscattering can vary with incidence angles, therefore the selection of the most appropriate incidence angle is very important for precise target recognition. As an example, Elachi and Granger [17] found that the discrimination of paleo-drainage features was possible only with wider incidence angle configurations (wider than 50°).
For this study RADARSAT-2 data were acquired in a compatible configuration mode (27.6°) compared to ALOS PALSAR (26.7° and 23.10°) in order to allow comparison of scattering mechanisms in multiple frequencies without the influence of varying incidence angle.
ALOS PALSAR data were provided by the European Space Agency (ESA) and RADARSAT-2 data were provided by the Geographic Information System (Scientific Interest Group) BreTel (Bretagne Télédetection) [18]. All images were processed with PolSARpro software [19]. Concerning optical dataset, the available Korea Multi-Purpose Satellite - 2 (KOMPSAT) -2 image (ESA) and Google Earth acquisitions were integrated with a Quickbird image derived from the previous cartographic study over Gebel Barkal conducted by L. Perotti in 2005 [20].
Additionally, to the full-pol data we integrated a brief analysis of large time series of Copernicus Sentinel-1 data (C-band) from the last 4 years (2016–2019) in order to analyze the backscattering response over the whole archeological area and specific features and anomalies detected through polarimetric analysis.
Table 1 lists the acquisition dates of the polarimetric datasets of ALOS PALSAR and RADARSAT-2 used in this study, while Table 2 shows the summary of the Copernicus SENTINEL-1 data characteristics.
2.1. Polarimetric Decomposition Theory
SAR polarimetry is the science of acquiring and analyzing the polarisation state of an electromagnetic field, the shape and orientation of the electric field vector [21]. Wave polarisation together with the relative phase and amplitude differences between differently polarized waves can provide information about the scattering mechanisms related to particular objects [21]. Polarimetric decompositions attempt to express the radar backscatter from an object as a combination of scattering responses from a number of simpler objects with known backscatter characteristics (plane, sphere etc.) or to specify dominating scattering mechanisms such as single, double or volume scattering. By analyzing the single bounce (rough and flat surfaces), the double bounce (corner reflectors) and the volume scattering (vegetation) backscattering of fully polarized waves, a major amount of information related to the geometry and the geophysical properties of the target can be derived [21]. The next paragraphs describe and illustrate some of the most significant polarimetric descriptors that were analyzed in this research; the Pauli Decomposition and the Yamaguchi 4 Components Decomposition.
2.1.1. Pauli Decomposition
Pauli decomposition constitutes one of the first polarimetric descriptors that visualizes polarimetric information coded as colors. This decomposition expresses the scattering S matrix as the complex sum of the Pauli matrices (2), where an elementary scattering mechanism is associated for each basis matrix, with:
where a, b, c, and d are all complex and are given by (3)
The application of the Pauli decomposition to deterministic targets may be considered the coherent composition of four scattering mechanisms: the first being single scattering from a plane surface (single or odd-bounce scattering), the second being diplane scattering (double or even-bounce scattering), the third corresponding to volume scattering (random scattering) or oriented target scattering, and the final element being all the antisymmetric components of the scattering S matrix [21]. In the monostatic case, where SHV = SVH, the Pauli matrix basis can be reduced to the three first matrices, leading to d = 0.
Consequently, an Red-Green-Blue (RGB) image can be formed (Figure 7) with the intensities |a|2, |b|2 and |c|2, which correspond to clear physical scattering mechanisms: respectively single bounce (4), double bounce (5), and volume scattering/oriented target (6), as explained in [21], and are identified with the diagonal components of the [T] coherence matrix, as follows:
The resulting false color image (Figure 7 left) can be used, from a qualitative point of view, to interpret the physical information related to the scattering mechanisms that occur in each pixel. Comparing left and right images from Figure 7, it is possible to describe the backscatter mechanisms obtained using the Pauli decomposition. Green color identifies areas with volume scattering/oriented target as a main mechanism. This relates to some of the inhabited areas mixed with vegetation. Yellow color identifies areas with higher double bounce and volume backscatter response and corresponds to field/agriculture areas, while red color exhibits areas with the double bounce as a main backscattering mechanism—present for cities/villages and inhabited areas. Areas visible in blue color have predominance of single bounce. The latter is mostly present for flat surfaces like desert areas.
2.1.2. Yamaguchi 4 Components Decomposition
In order to describe the Yamaguchi 4 Components decomposition, it is necessary to start from the Freeman model-based decomposition.
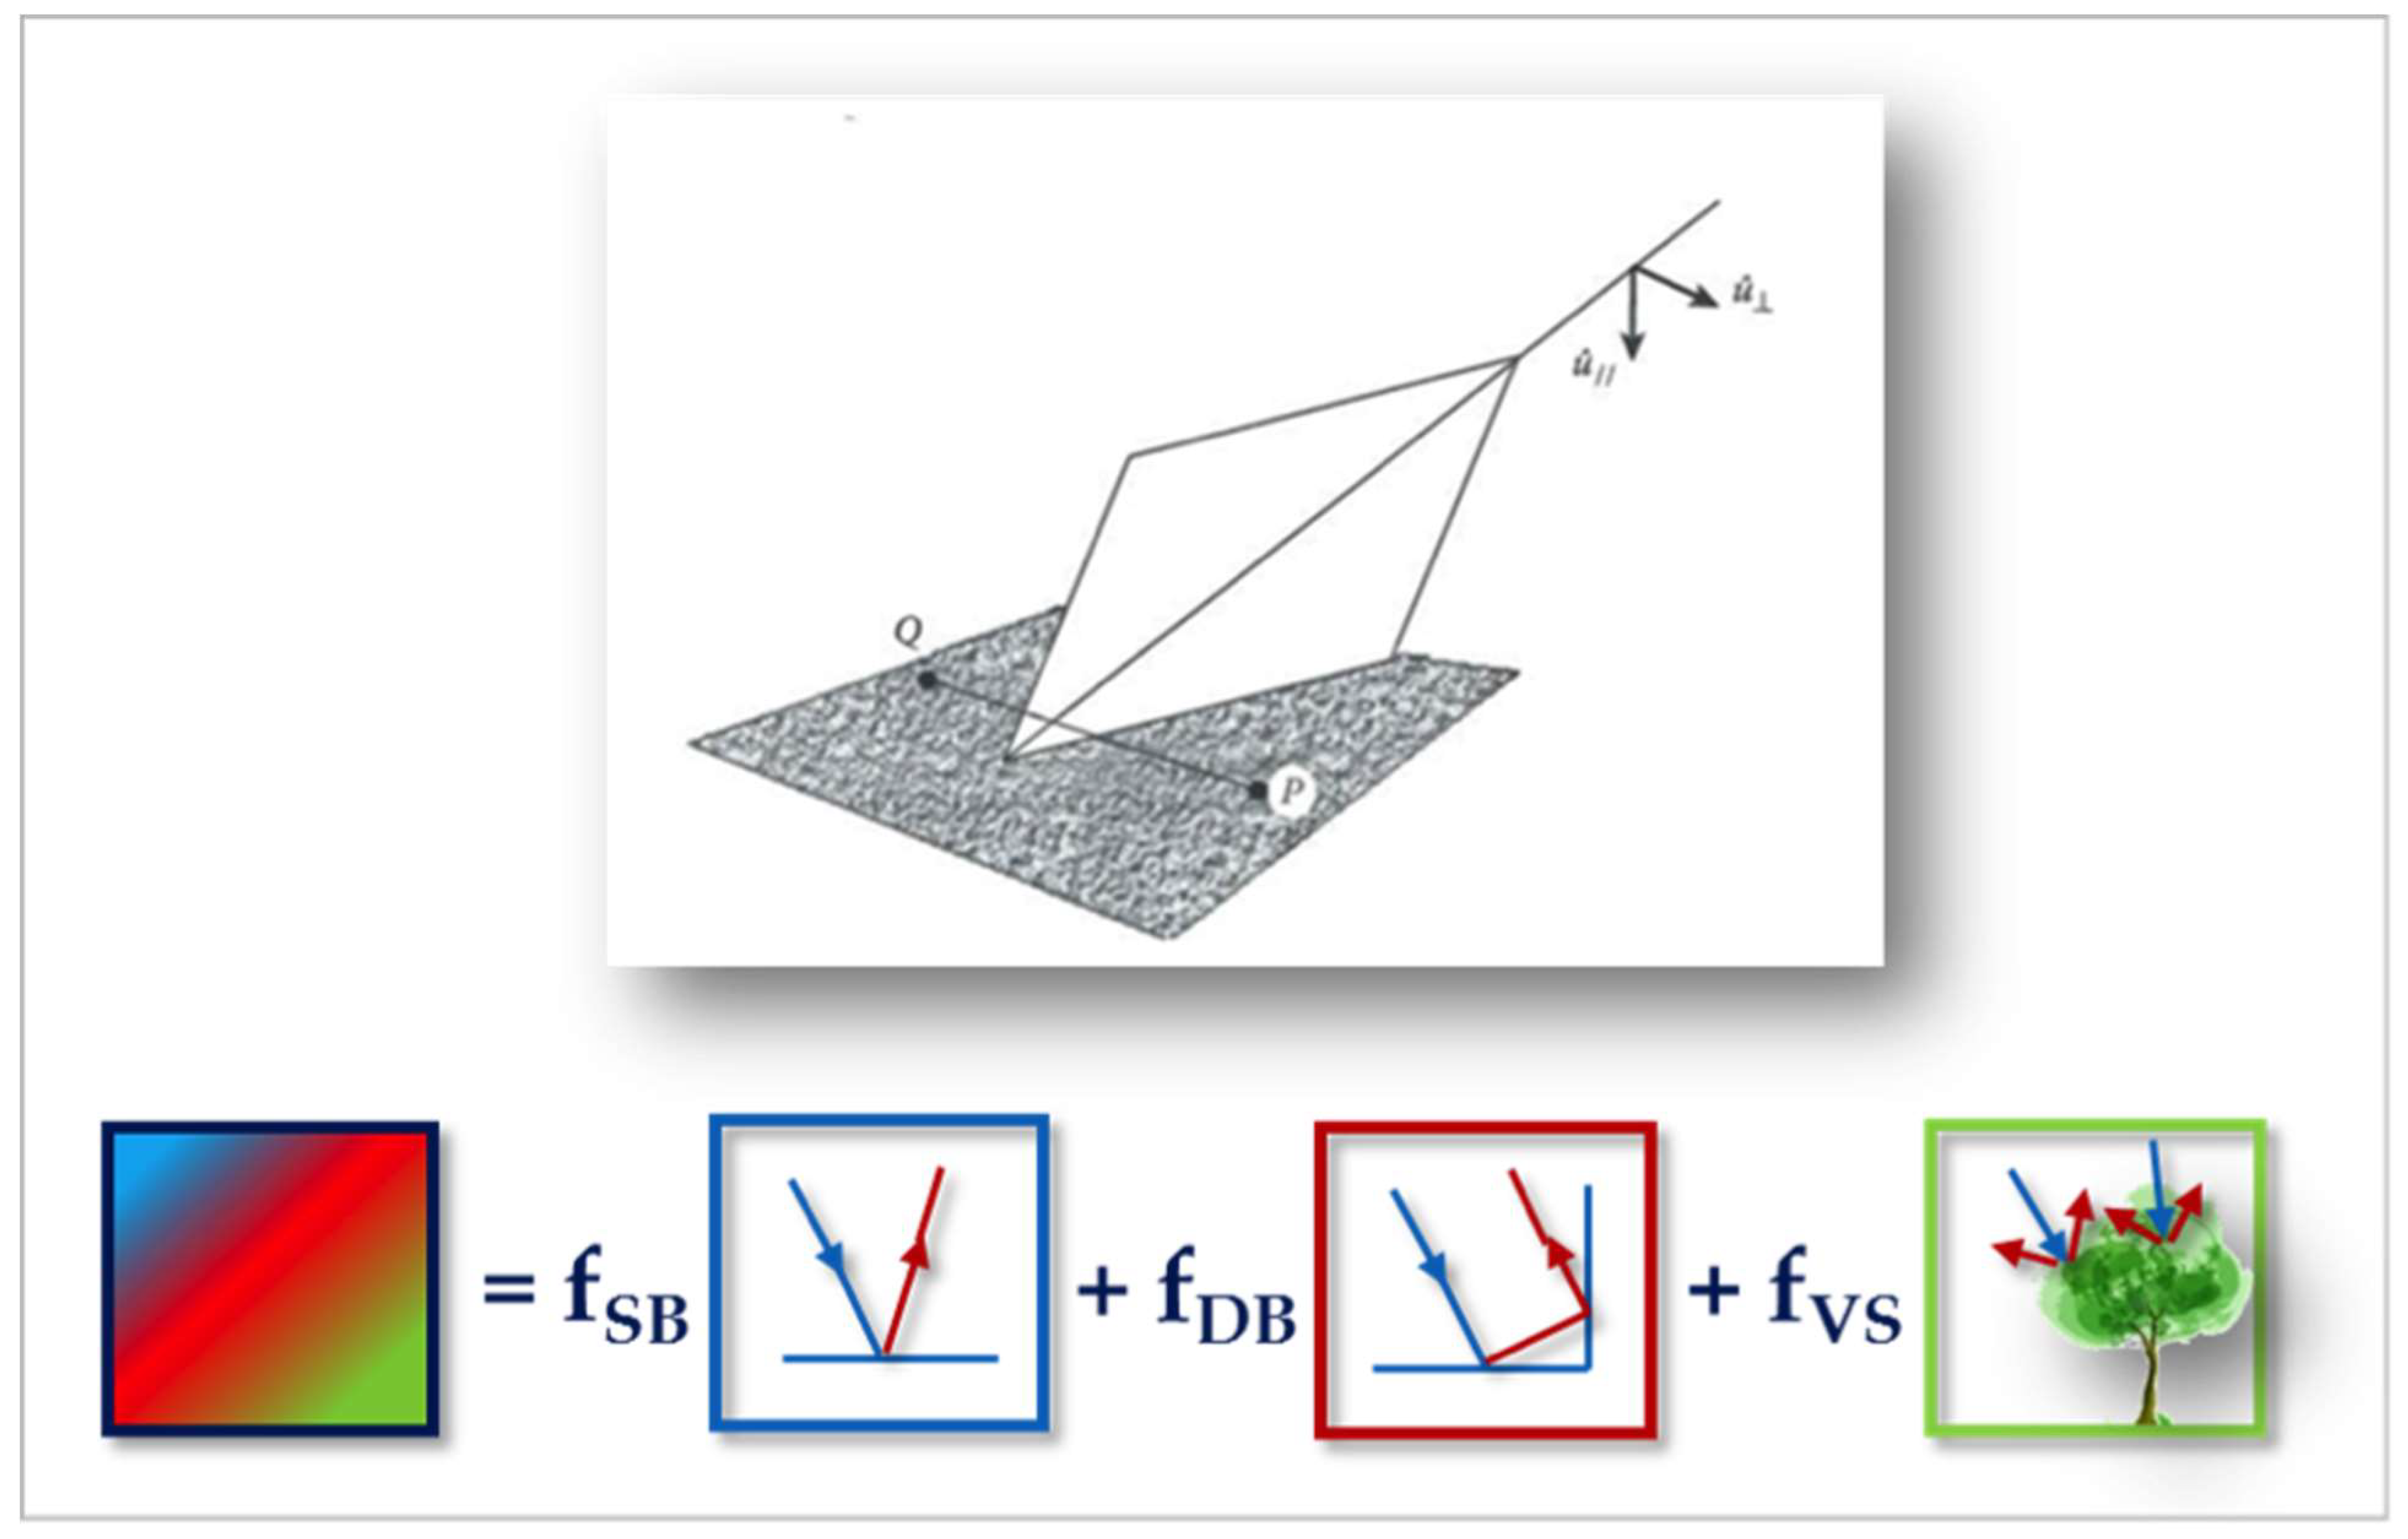
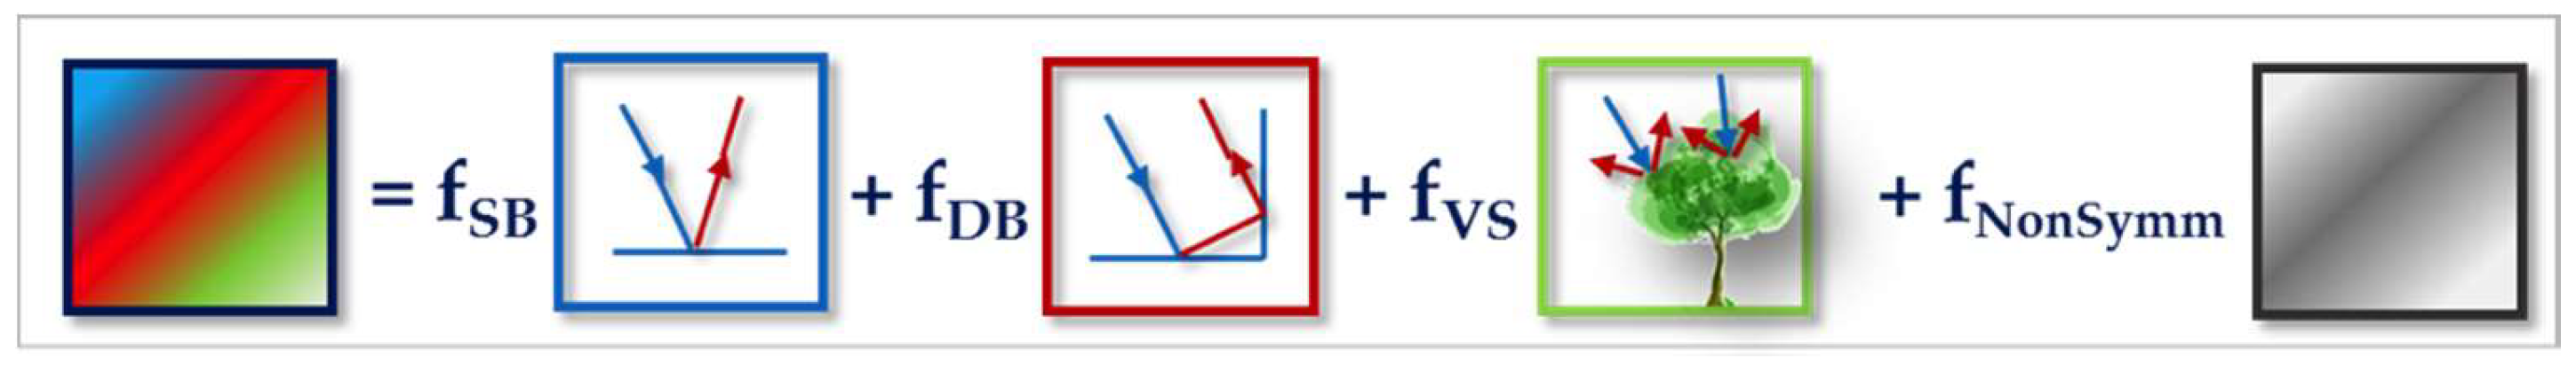
The Freeman-Durden decomposition is a technique for fitting a physically based, three-component scattering mechanism model to the polarimetric SAR observations without utilizing any ground truth measurements [22,23]. The mechanisms are canopy scatter from a cloud of randomly oriented dipoles, even- or double-bounce scatter from a pair of orthogonal surfaces with different dielectric constants, and Bragg scatter from a moderately rough surface. This three-component scattering power model can be applied successfully to decompose SAR observations under the reflection symmetry condition (Figure 8).
The Freeman-Durden model-fitting approach has the advantage that it is based on the physics of radar scattering, not a purely mathematical construct. This model can be used to determine to first order what are the dominant scattering mechanisms that give rise to observed backscatter in polarimetric SAR data. Red color corresponds to man-made built-up, green to volume scattering, being the typical mechanism of areas containing vegetation, trees, or fields, while blue corresponds to single bounce mechanism, such water bodies and flat surfaces.
While this decomposition can always be applied, it contains one important assumption which limits its applicability: the reflection symmetry that is not always valid [21]. Scattering symmetry assumptions about the distribution of the scatterers lead to a simplification of the scattering problem and allow quantitative conclusions about their scattering behavior. If the scattering matrix S for a target is known, then the scattering matrix of its mirrored or rotated image in certain symmetrical configurations can be immediately derived [21].
Considering a distributed target that has reflection symmetry in the plane normal to the line-of-sight, whenever there is a contribution from a point P there will always be a corresponding contribution from its image at point Q (Figure 8).
It is possible to find some areas in an SAR image for which the reflection symmetry condition does not hold, like in urban areas. Based on the 3-component scattering model approach, Yamaguchi et al. proposed, in 2005, a 4-component scattering model by introducing an additional term corresponding to non-reflection symmetric cases [21]. In order to accommodate the decomposition scheme for the more general scattering case encountered in complicated geometric scattering structures, the fourth component introduced is equivalent to a helix scattering power. This helix scattering power term appears in heterogeneous areas (complicated shape targets or man-made structures) whereas disappears for almost all naturally distributed scattering (Figure 9).
This decomposition results in an RGB image where the red channel corresponds to the double-bounce scattering, the green channel corresponds to volume scattering and the blue channel corresponds to single-bounce scattering. The fourth scattering mechanism, helix, can be considered in a separate channel.
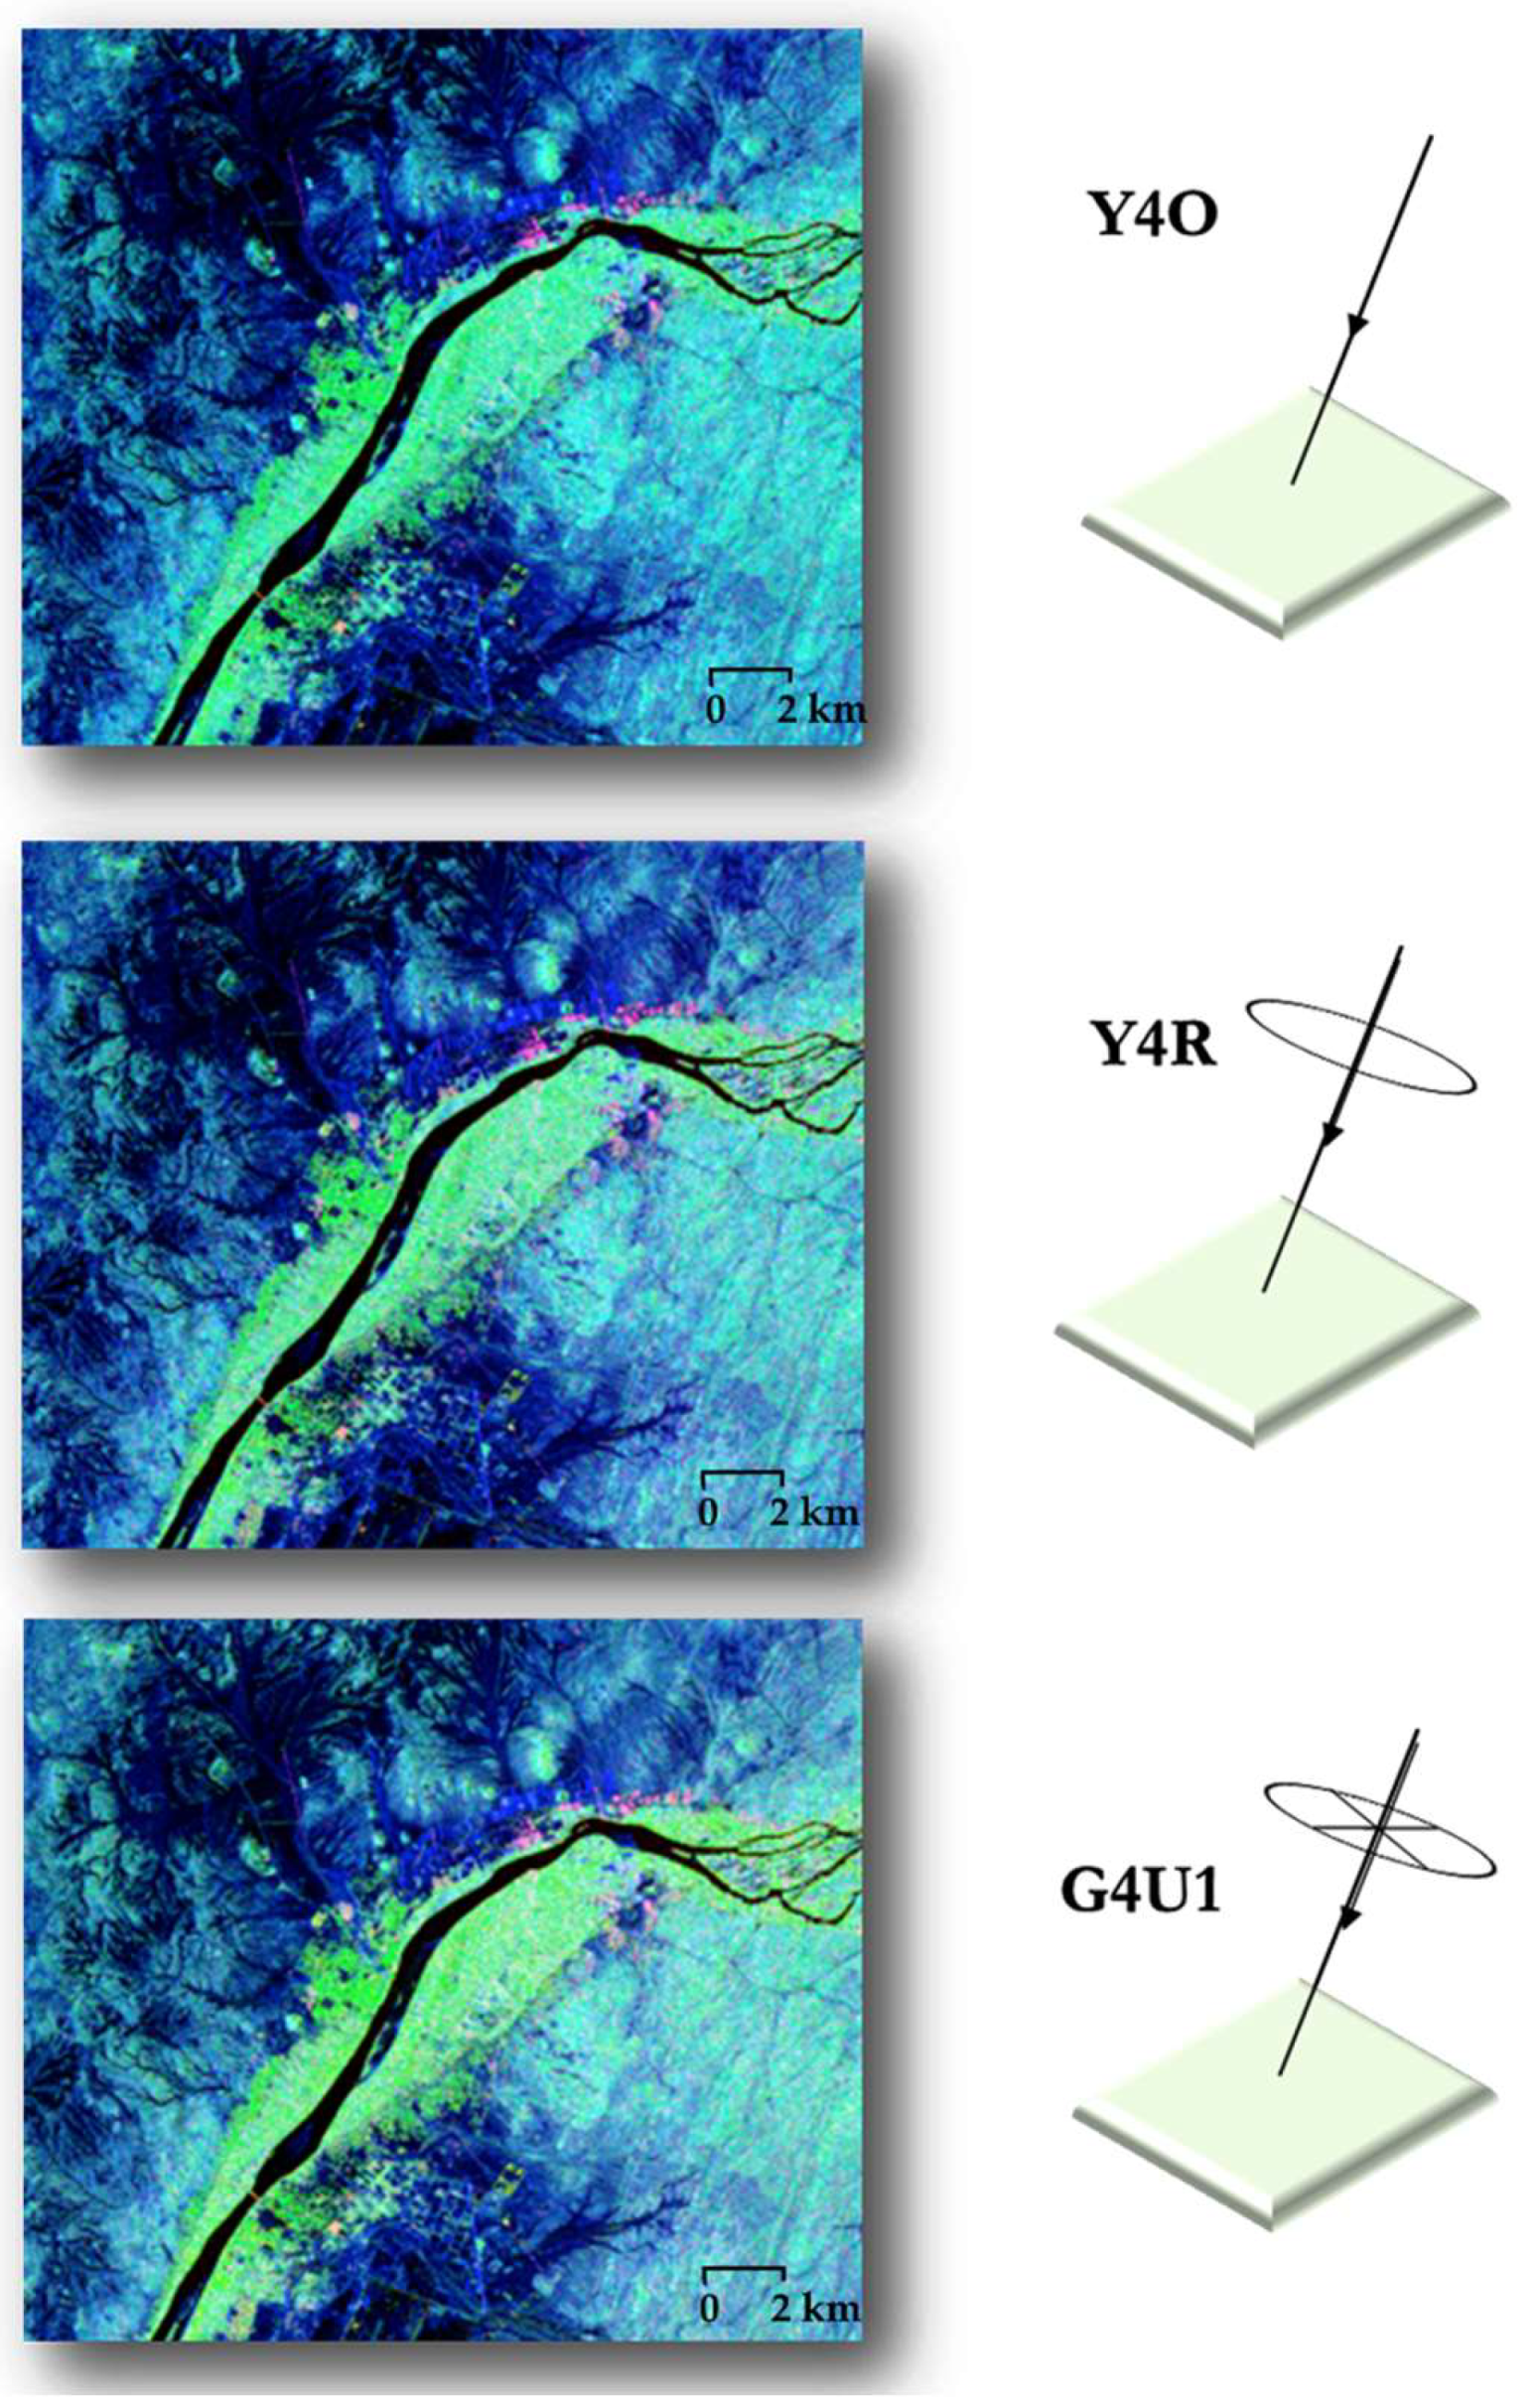
The decomposition allows an interpretation of the physics behind the colors represented in three resulting RGB decompositions: Yamaguchi4 Y4O, Yamaguchi4 Y4R and Yamaguchi4 G4U1 (Figure 10). The Yamaguchi Y4O (Figure 10, top) represents the classical decomposition of the three above mentioned, in which the oriented targets present a volume scattering contribution and urban areas appears still saturated [24]. Applying a de-orientation for each pixel, Yamaguchi defines the second decomposition: Y4R, in which case a wave rotation is applied along the radar line of sight (Figure 10, middle), resulting in a better distinction of urban areas (double bounce) [24].
The last step in the development of Yamaguchi decomposition is then represented by the Yamaguchi G4U1 descriptor. Redefining the Freeman model, in which the asymmetry coming from different kind of forest trees was not contemplated (trees are represented by 3 different models), Yamaguchi includes different kind of responses for different kind of targets applying a complex rotation matrix, equivalent to a polarimetric basis change along the line of sight of the radar (Figure 10, bottom) [24]. A detailed description of the features visible in Figure 10 has been presented in the following paragraph.
2.2. Polarimetric Analysis
ALOS PALSAR Level 1.1 data used in this study are complex data in the slant range coordinate, for which range compression and 1 look azimuth compression are performed. As a first step, prior to any other subsequent operation, PolSARpro polarimetric software calibrates the data when extracting the S and/or T matrices from the original polarimetric dataset. Due to the rectangular shape of pixels in the Single Look Complex (SLC) data, additional pre-processing using the multi-look operator available in PolSARpro was performed with a window of 5 pixels in row and 1 in column, thus transforming the product into a more familiar geometric visualization. In a following step a Pauli coherent decomposition (R: |HH−VV|; G: |HV|; B: |HH+VV|) was derived.
At this stage of our processing chain, a first physical interpretation of the Pauli decomposition was possible from a qualitative point of view. As a following step, the T3 coherence matrix containing information about the interaction between waves and targets was extracted, thus performing a removal of the random phase contained in the scattering matrix S [21]. Subsequently, several polarimetric decompositions were applied, in order to investigate the target backscatter and to understand which polarimetric decomposition exposes the presence of archaeological structures. The resulting polarimetric descriptors were georeferenced (UTM WGS84) using the KOMPSAT-2 optical imagery as master image. The geocoding processes between ALOS PALSAR and optical data was performed using the ground control points (GCPs), paying attention to the creation of a homogeneous cloud of points over all area of the archaeological site. Several difficulties were encountered, not only due to the lack of reference optical data, for which only one optical image was available, but also because the KOMPSAT-2 image presented important environmental and topographic changes in the area not easily traceable in SAR data and vice versa. In fact, in a period of 3 years (2006/2009), period covering the acquisitions of PALSAR and KOMPSAT-2, the construction of highways and infrastructures close to the site boundaries changed the overall environment, with a consequent lack of correspondence of reference elements between optical and SAR data.
The RADARSAT-2 polarimetric analysis was performed on four higher spatial resolution polarimetric RADARSAT-2 images (θ = 27.06°), specifically acquired in 2012 and 2013 (April, November, January, July). In order to preserve the spatial resolution as much as possible, a different processing chain, with respect to the one used for ALOS data, was applied on RADARSAT-2 data. After T3 matrix extraction, the T3 elements were directly georeferenced with optical data.
The georeferenced T3 matrix was at this point imported again into PolSARpro, where it was processed to perform polarimetric decompositions, providing, as a result, already georeferenced polarimetric decompositions outputs. The georeferenced polarimetric outputs were then multilooked applying a sliding window of 3 × 3 (pixels are merged 3 by 3), in order to reduce the speckle effects and preserve as much as possible the spatial resolution. In the frame of the multi-frequency analysis, the same polarimetric descriptors analyzed in PALSAR images were selected and examined for the four RADARSAT-2 27.6° incidence angle acquisitions, starting with the same qualitative analysis carried out on ALOS PALSAR data in order to derive a first overview of the scattering mechanisms.
2.3. Dual Polarisation Time Series Analysis
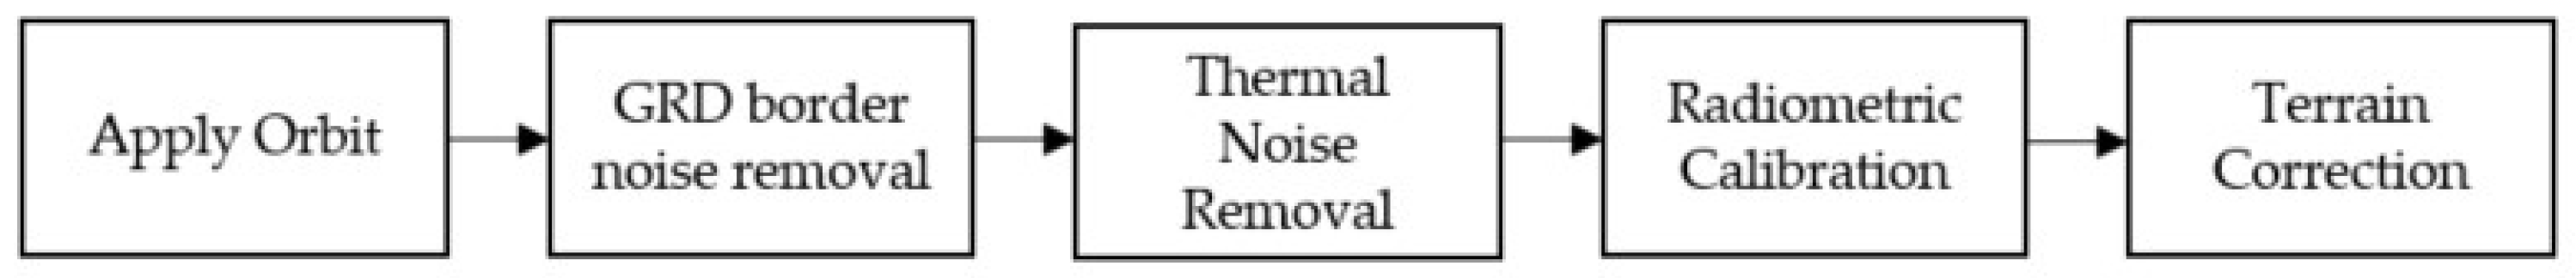
In most of the works mentioned in previous sections, the studies were conducted on just one or a few SAR images. Here, we propose to integrate the analysis of backscatter intensity for large stack C-band Sentinel-1 ground range detected (GRD) scenes acquired between January 2016 and October 2019—in total 85 scenes. Although Sentinel-1 data are not full polarimetric data, the use of large time series significantly increased the temporal sampling of the data, allowing us to understand the behavior of the backscatter signal for the identified target and even allowing us to compare with the signal coming from other targets. The scenes were acquired in interferometric wide (IW) mode of Sentinel-1 in descending pass. The analysis of backscatter time series was performed in Google Earth Engine (GEE) [25]. Sentinel-1 radar data collection in GEE consists of Level-1 ground range detected scenes pre-processed to backscatter coefficient . in decibels. The diagram in Figure 11 lists the pre-processing steps applied to Sentinel-1 scenes in GEE.
3. Results
3.1. ALOS PALSAR Polarimetric Analysis
Following the workflow described in Section 2.2, via comparison of the information, it was possible to derive an initial hint of the different types of scattering mechanisms present over the archaeological structures. The Pauli RGB image presented the sum of all the backscattering contributions coming from the illuminated targets. It provided a first knowledge about the three principal scattering mechanisms of single bounce, double bounce and volume scattering. By overlapping SAR Pauli RGB decompositions with optical imagery (Figure 2), the pieces of archaeological evidence was located and, together with them, some well-defined scattering mechanisms were identified.
By analyzing SAR Pauli image and Kompsat-2 data, it was noticed that the major contribution was given by the larger archaeological structures, as well as by urban and agricultural areas. Unfortunately, due to the insufficient spatial resolution of PALSAR data, it was only possible to identify the major structures, and for this reason, the ALOS PALSAR investigation has been focused in the field of pyramids in the western area of the site.
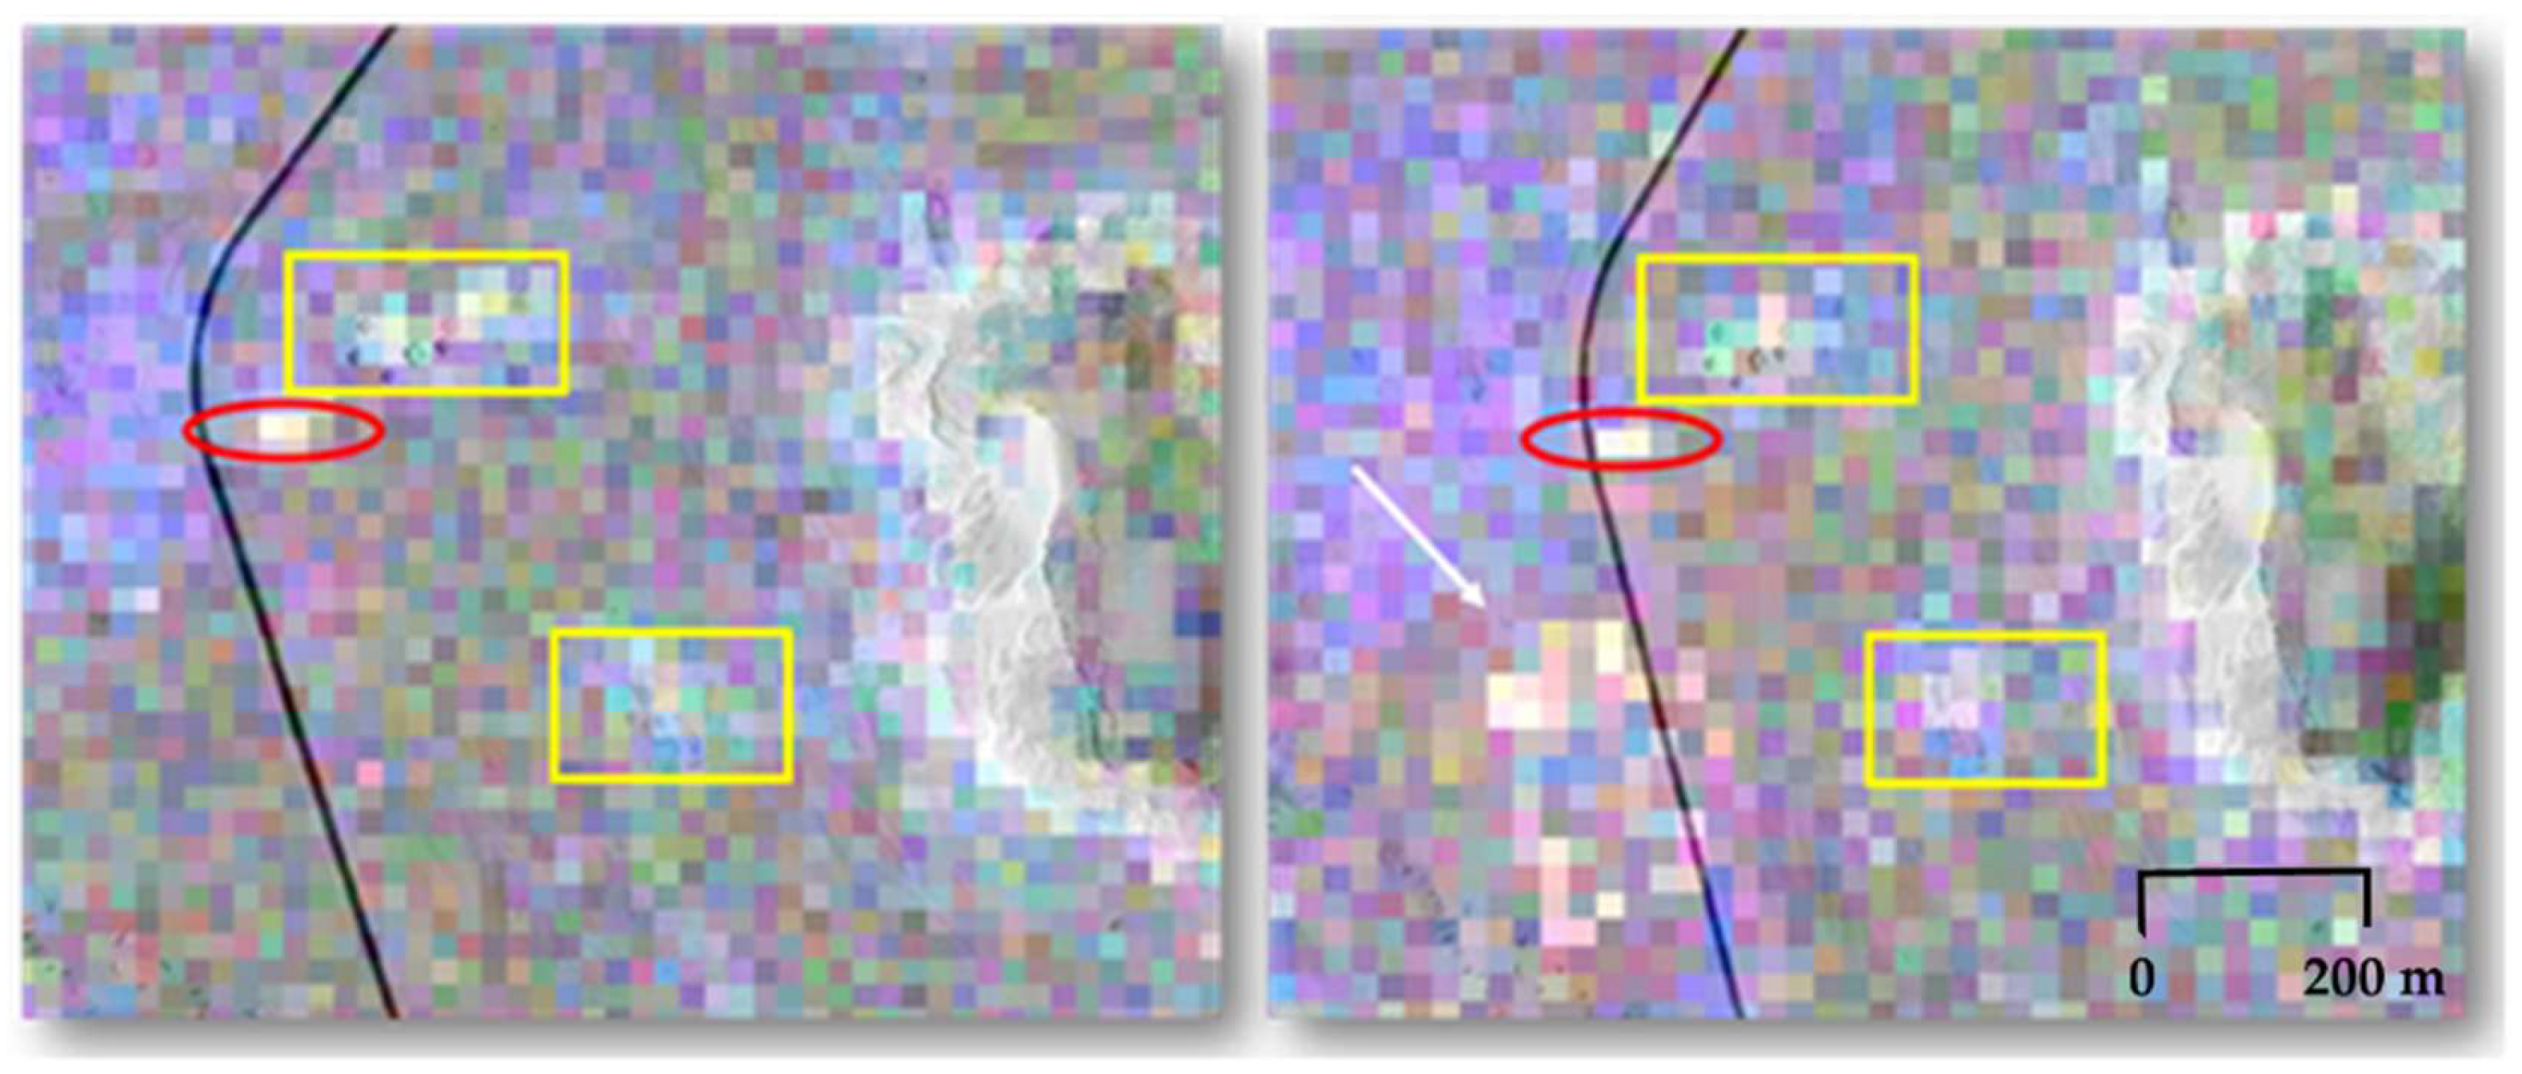
In Figure 12, we can easily distinguish the two groups of royal pyramids (yellow squares), and in the image acquired in 2009, the modern infrastructure close to the site (white arrow, right image). However, a third backscattering ‘anomaly’ has been identified close to the NW group of pyramids (Figure 12, red ellipse). The qualitative analysis performed by observing satellite optical data (KOMPSAT-2 and Google Earth acquisitions) revealed that there was no surface structure in the area where this backscatter anomaly was detected. Moreover, the available cartographic materials, dating back to 1995, did not seem to record archaeological evidence at that point.
In order to investigate the possible influence of sand humidity on radar wave penetration and possible absorption/loss of the signal we consulted archives of Weather Online [26]. In both dates of ALOS acquisitions and in the period directly preceding the acquisitions there was no precipitation event, thus the sand was dry and we can conclude that the humidity did not have direct influence on the radar response and couldn’t cause this type of anomaly.
Once this first qualitative analysis was completed, additional polarimetric descriptors were analyzed in order to understand and validate the nature of the scattering mechanisms upon the already known archeological structures, the general morphology surrounding them, and upon the area identified in the qualitative analysis.
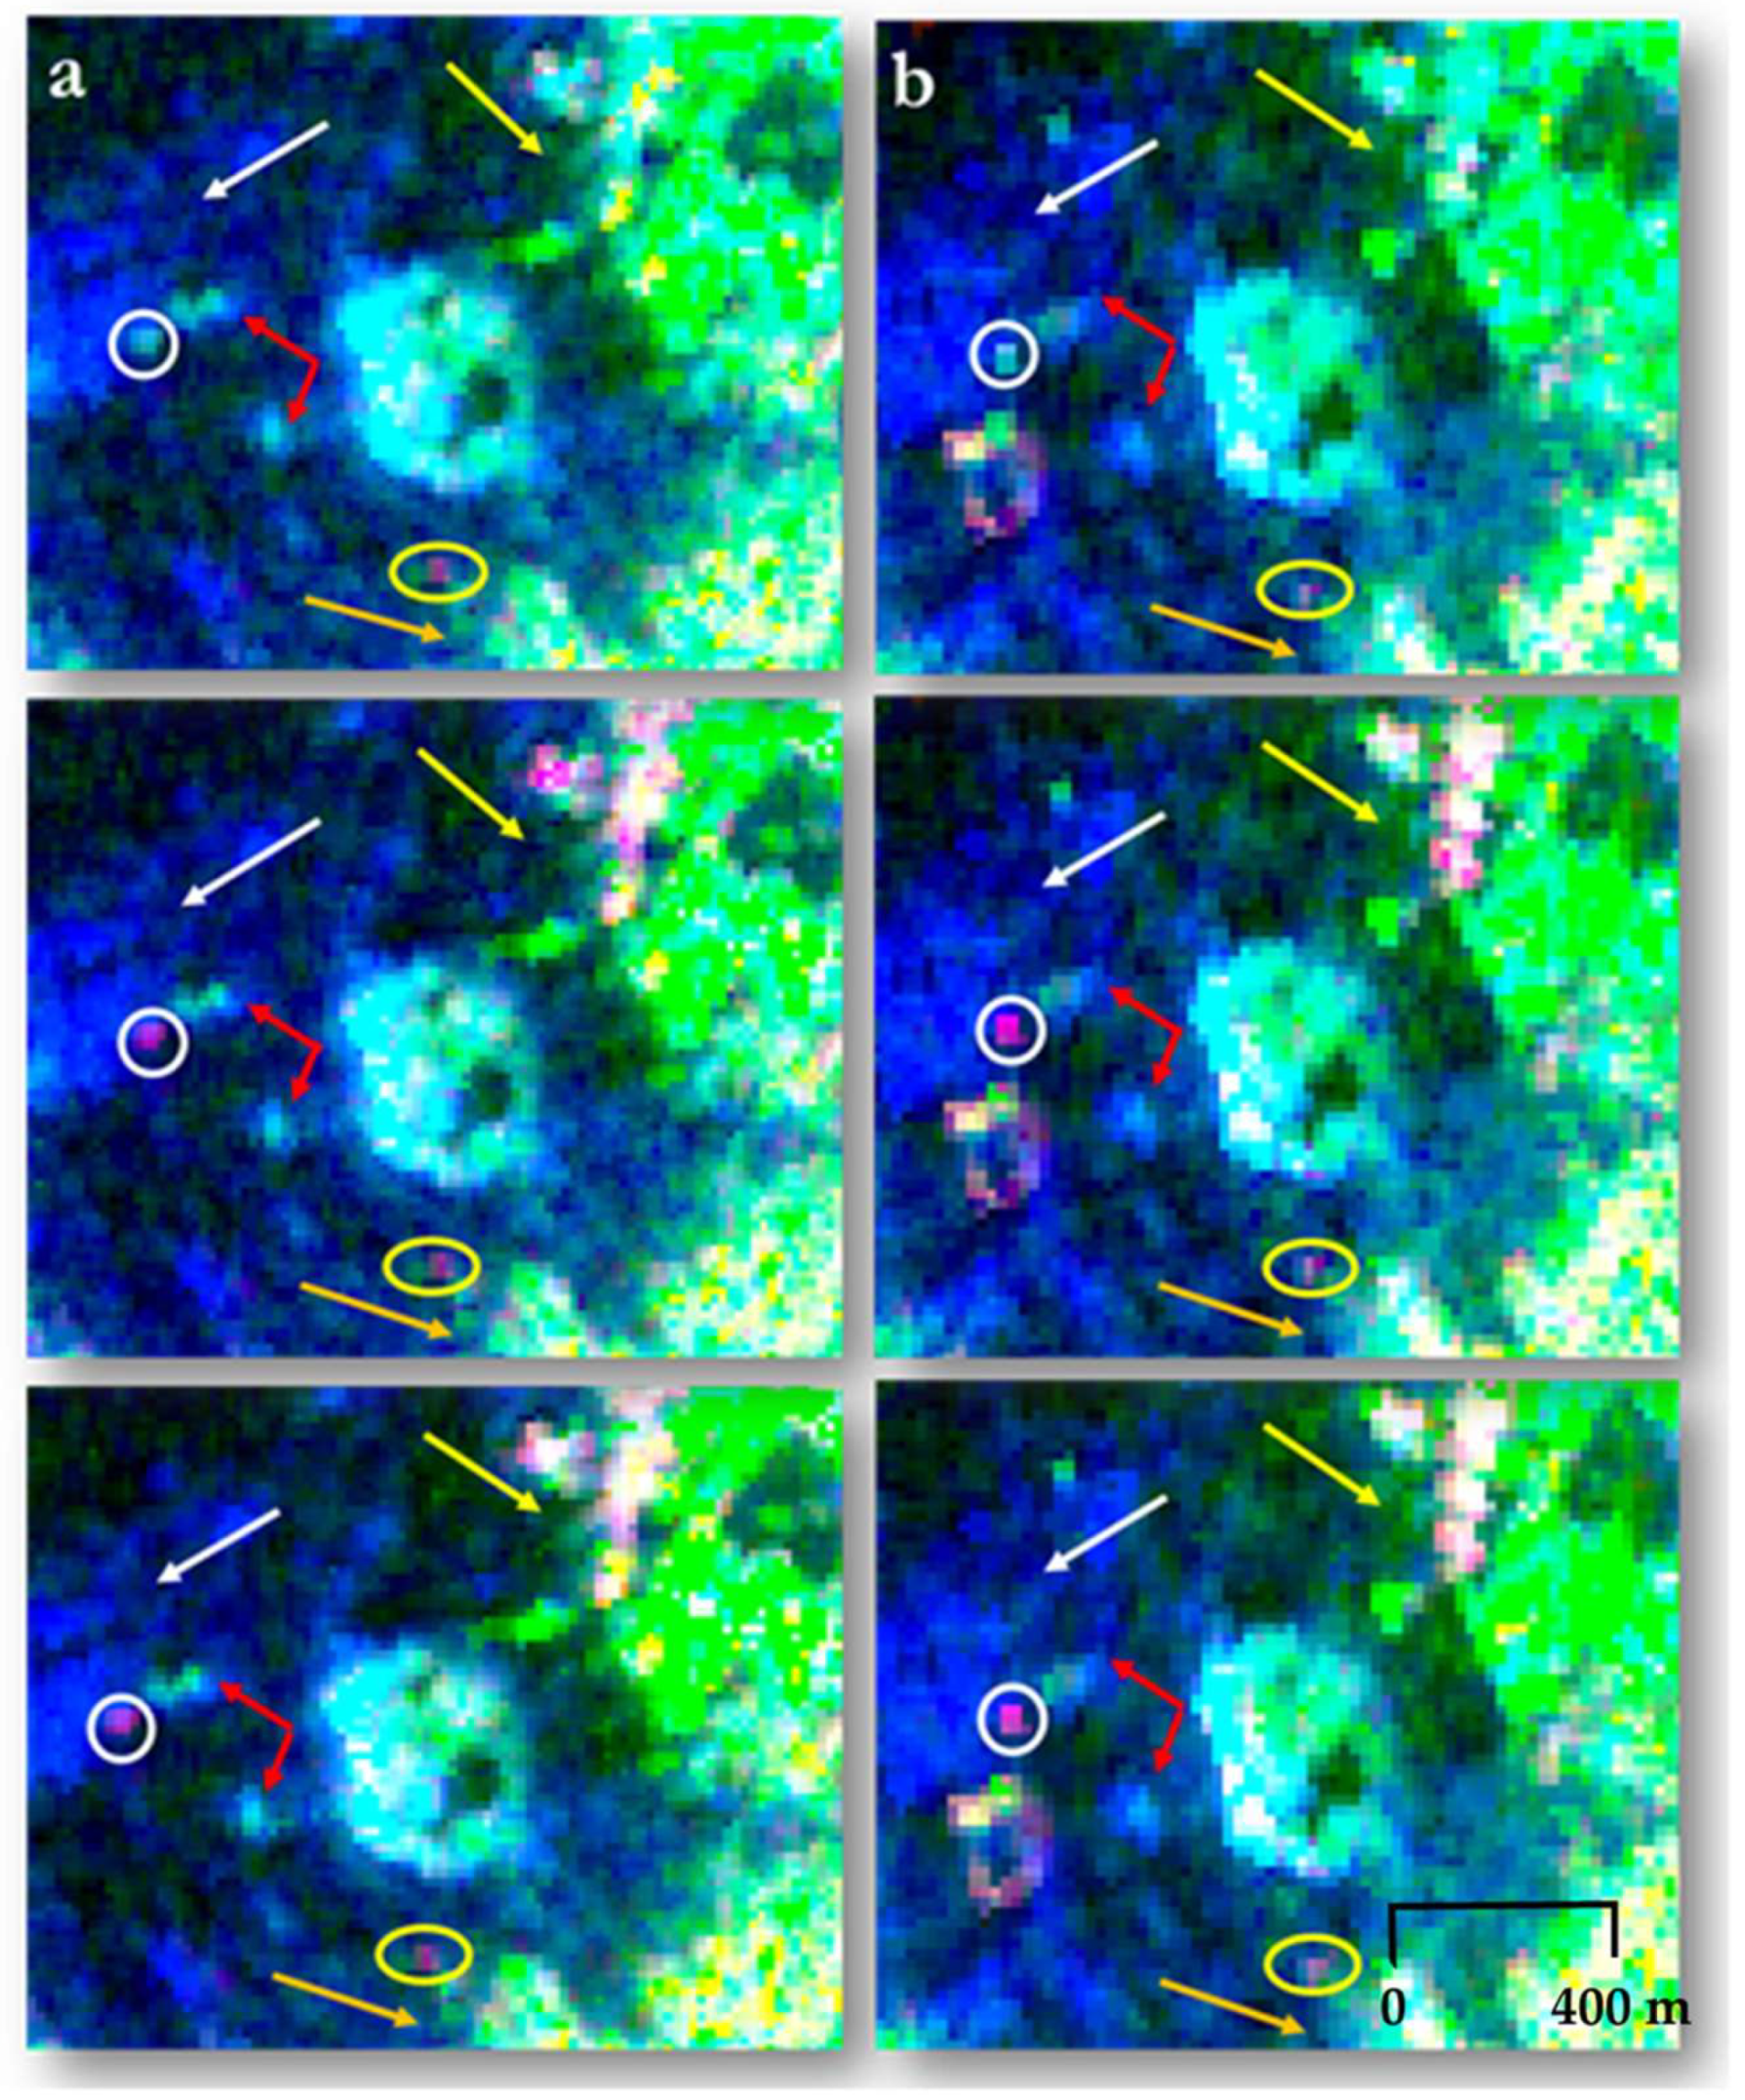
Among the several polarimetric decompositions analyzed, the Yamaguchi 4-component decomposition [24] turned out to be the most meaningful one for the purpose of the present research. Yamaguchi decomposition starts from the assumption that in nature reflection with symmetric conditions is not very common, as previously stated by Freeman decomposition [22]. Due to the presence of urban and cultivated areas where symmetry conditions are not valid, Yamaguchi 4-component decomposition was performed with a sliding window of 3 × 3 (Figure 13). This decomposition, shown in Figure 13, produced an RGB image where the red channel corresponds to the double bounce scattering, the green channel corresponds to volume scattering and the blue channel corresponds to single bounce scattering. This allowed an interpretation of the physics behind the color representation that can be linked to the most common classes of backscattering (urban areas, vegetated areas, and surface).
By observing the RGB image of the three Yamaguchi decomposition descriptors, more detailed scattering mechanism discrimination was noticed in Yamaguchi_G4U1 (Figure 13, bottom). In this decomposition, it can be noticed that a part of the city of Karima presented a double bounce mechanism (yellow arrow), typical for buildings, while in Yamaguchi_Y4O (Figure 13, top) the backscattering coming from the city was volume scattering, typical for vegetation. This effect was present mainly due to the orientation of buildings. In fact, in this kind of decomposition, vegetated and urban areas were still presenting a similar contribution. What we noticed is that the cultivated area in the southern part of the Jebel presented volume scattering (Figure 13, orange arrow) as well as the major part of the buildings in Karima in the NE part of the image. In addition, the two groups of royal pyramids (Figure 13, red arrow), as well as the Jebel itself, were represented as a combination of single bounce and volume scattering contribution. Following the same consideration, in the area close to the NW group of Pyramids the strong backscattering visible in this area is represented by double bounce mechanism in Yamaguchi_ Y4R and Yamaguchi_G4U1 (Figure 13, middle, bottom), generally more representative for urban areas, while it appears as a combination of single bounce and volume scattering in Yamaguchi_Y4O (Figure 13, top). White arrows in Figure 13 refer to the rocky topography of the area, which presented a similar behavior in both ALOS acquisitions and in the three Yamaguchi RGB images.
In order to deepen the analysis of Yamaguchi_G4U1 decomposition, in which the archaeological and topographic features seemed to be better discriminated, the single channels relating to different scattering mechanisms were investigated. The recognition of the strong backscatter in the single channels was not as straightforward as in the qualitative study carried out on the RGB images. For this reason, we used the latitude and longitude coordinates of the area of interest (18°32′15″N 31°49′14″E WGS84) in order to locate and verify as precisely as possible the correspondence of the well-defined scattering mechanism between SAR data products.
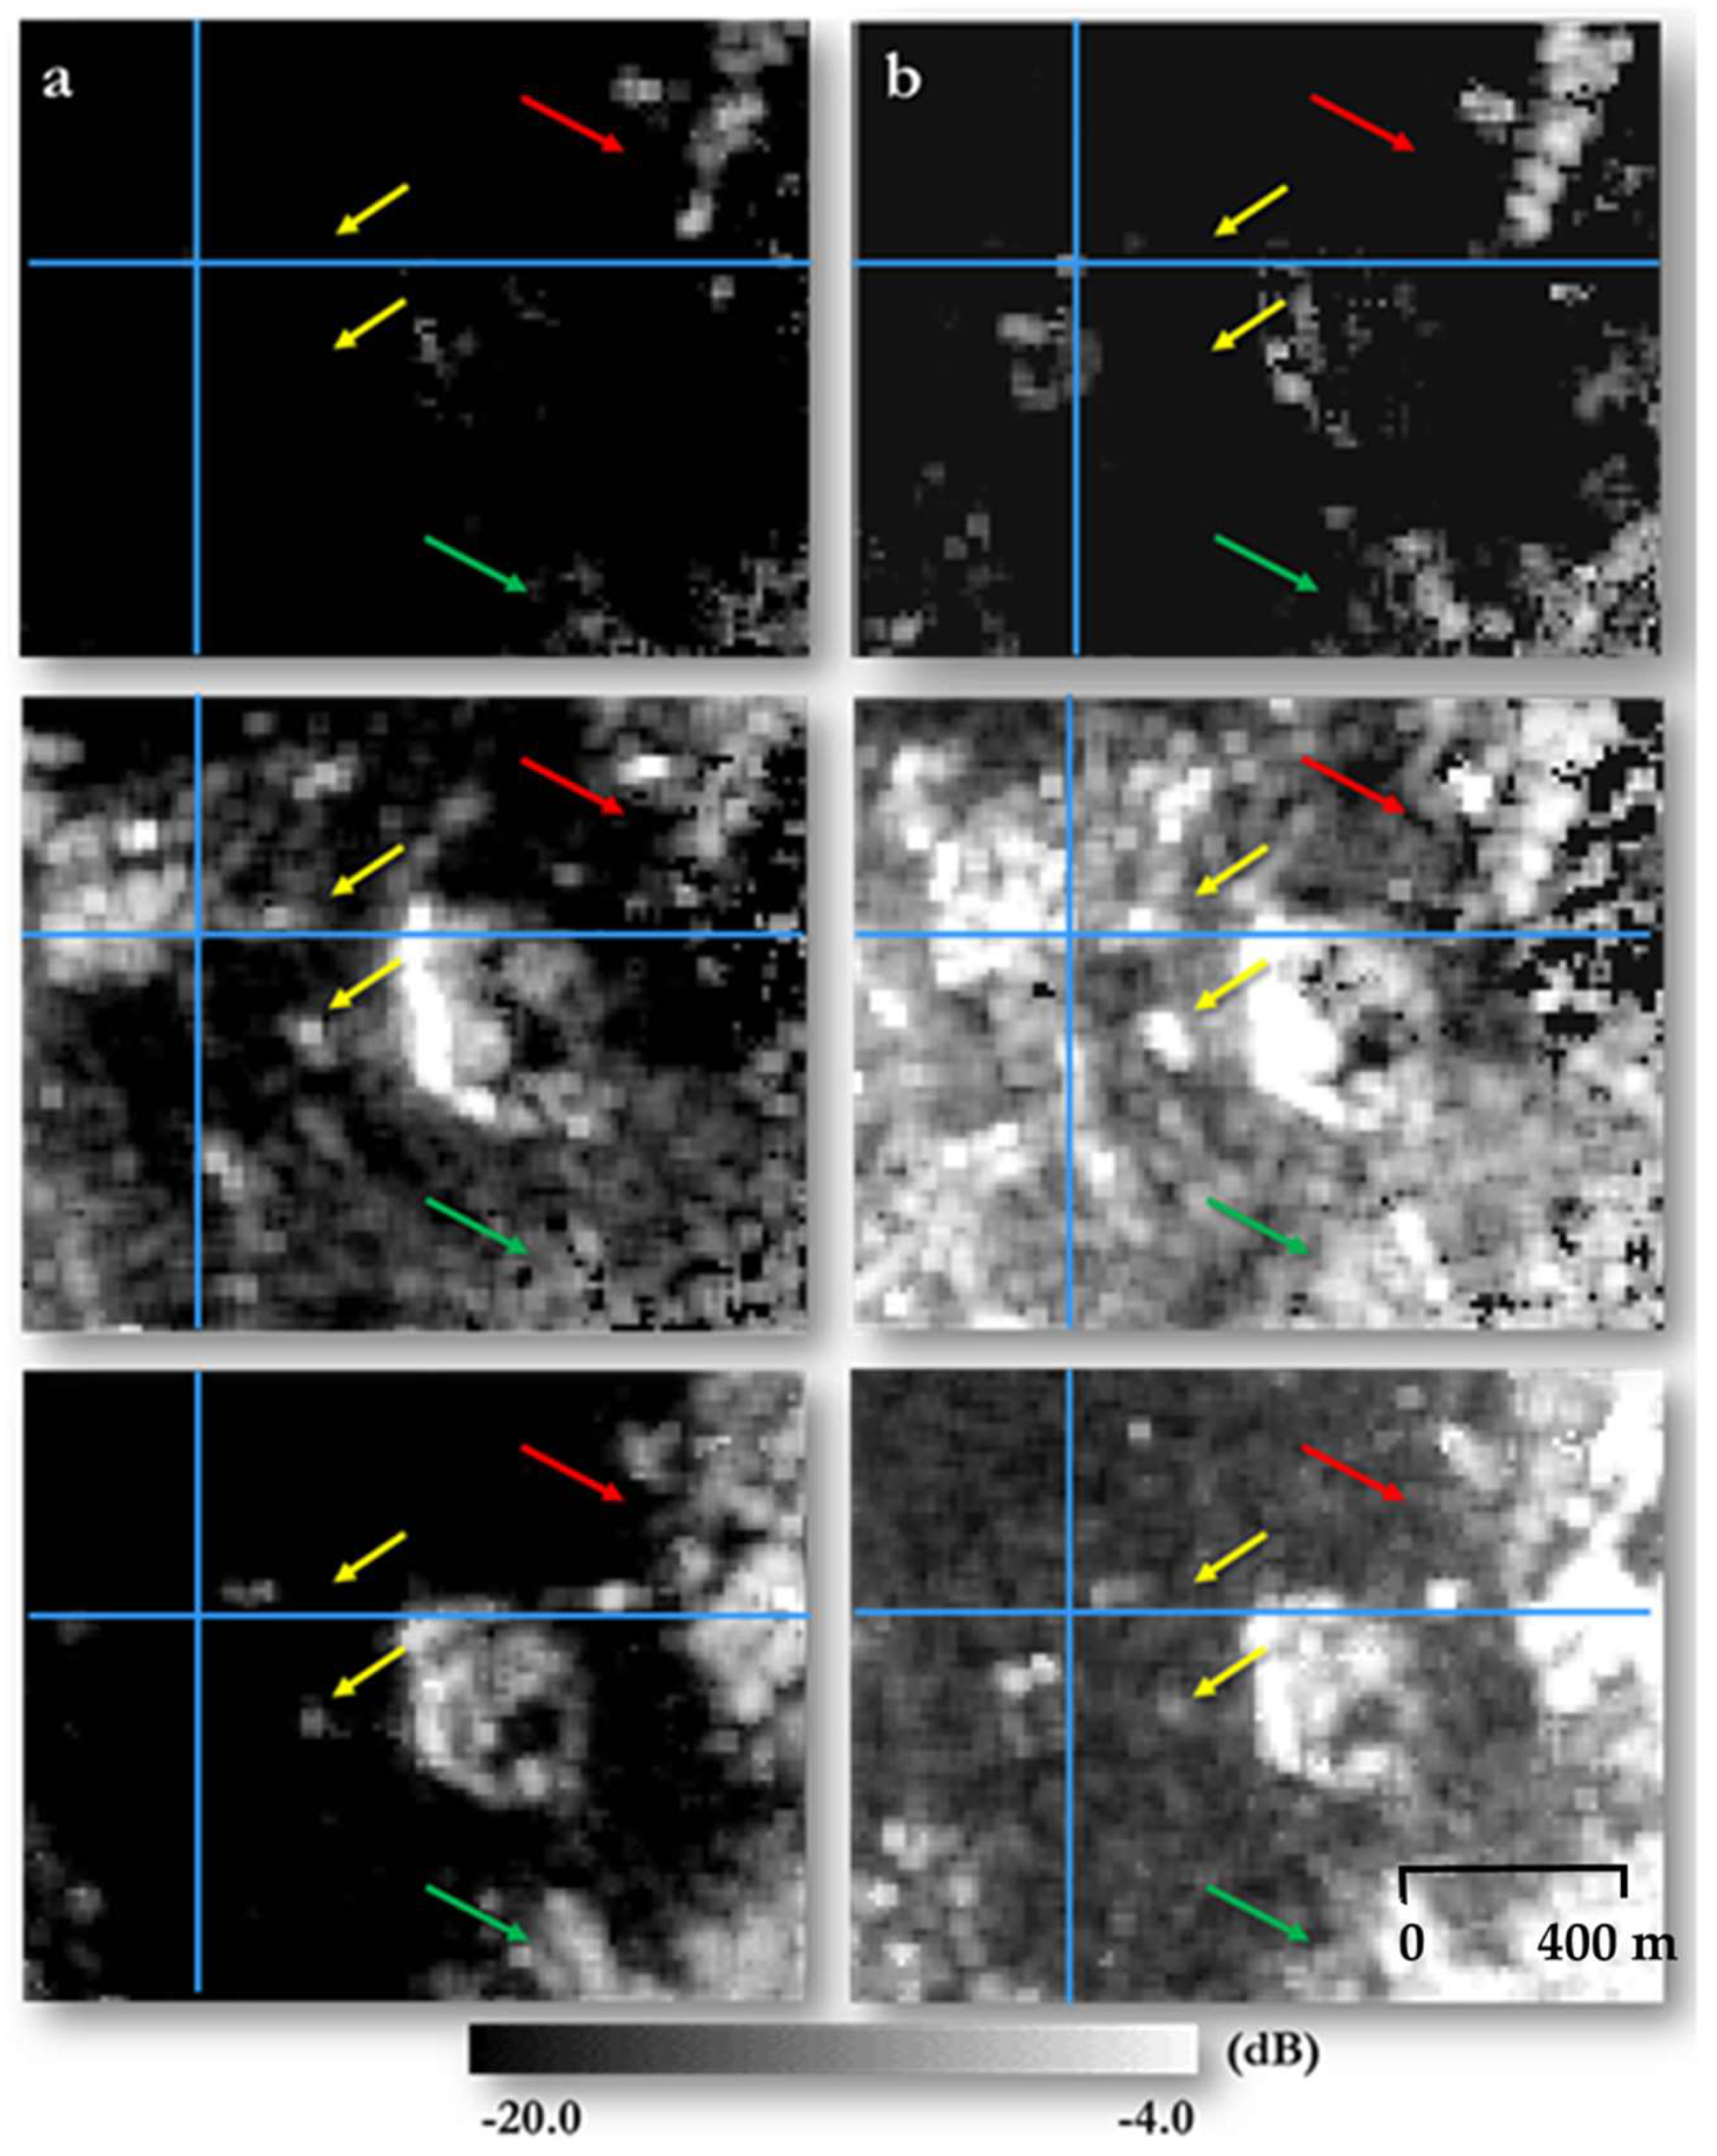
In Figure 14, Yamaguchi decomposition channels corresponding to the double bounce (top), single bounce (middle), and volume scattering mechanisms (bottom) for the two PALSAR acquisitions are shown. By identifying the latitude/longitude position of the backscattering noticed in the RGB images illustrated above, it was possible to note the amplitude values recorded in that point for each channel of the same polarimetric decomposition in the two PALSAR acquisitions (Table 3). As a result, the strong backscattering was identified as having high contribution of single bounce and a low contribution of double bounce which was recorded only for this target, while it was not detected in volume scattering channel (Figure 14, blue cross). Comparing this response to both archaeological and urban features, what arises from a wider analysis is that the urban area of Karima (Figure 14, red arrows), as well as the palm plantations following the Nile river in the southern part of the site (green arrows), present different major contributions than the one observed for the target analyzed, that is, a volume scattering mechanism.
This kind of response is typical for vegetated areas, however it may also appear in the cities due to the specific orientation of buildings. In the longitudinal SW/NE portion of the city, in the northern part of the images the main backscattering mechanism detected was double and single bounce, as could be expected for buildings and their roofs (red arrows). The two groups of royal pyramids, due to their orientation with respect to the incidence angle of the electromagnetic wave, exhibit some contribution of the volume scattering, but with the major contribution of the single bounce.
As mentioned before, the scattering mechanism detected close to the NW group of pyramids was characterized by the major single bounce scattering with a lower contribution of the double bounce. This target presents, however, the same principal scattering mechanism as the one coming from surface archaeological structures and from the light surrounding morphology, but is distinguished by a double bounce backscatter contribution that was not recorded for either existing archaeological features or for topographic elements.
As we know, low frequency L-band wavelength present a deep penetration capability in very dry environments, as in the case of Gebel Barkal. Therefore, all abovementioned considerations led to the assumption that the detected target might be placed under the surface, thus not visible in KOMPSAT-2 and Google Earth acquisitions, as well as in the available cartographic materials. In order to verify or confute this hypothesis, four RADARSAT-2 imagery acquired with a similar incidence angle of ALOS PALSAR data were further analyzed. The results from this analysis are presented in the following section.
3.2. RADARSAT-2 Polarimetric Analysis
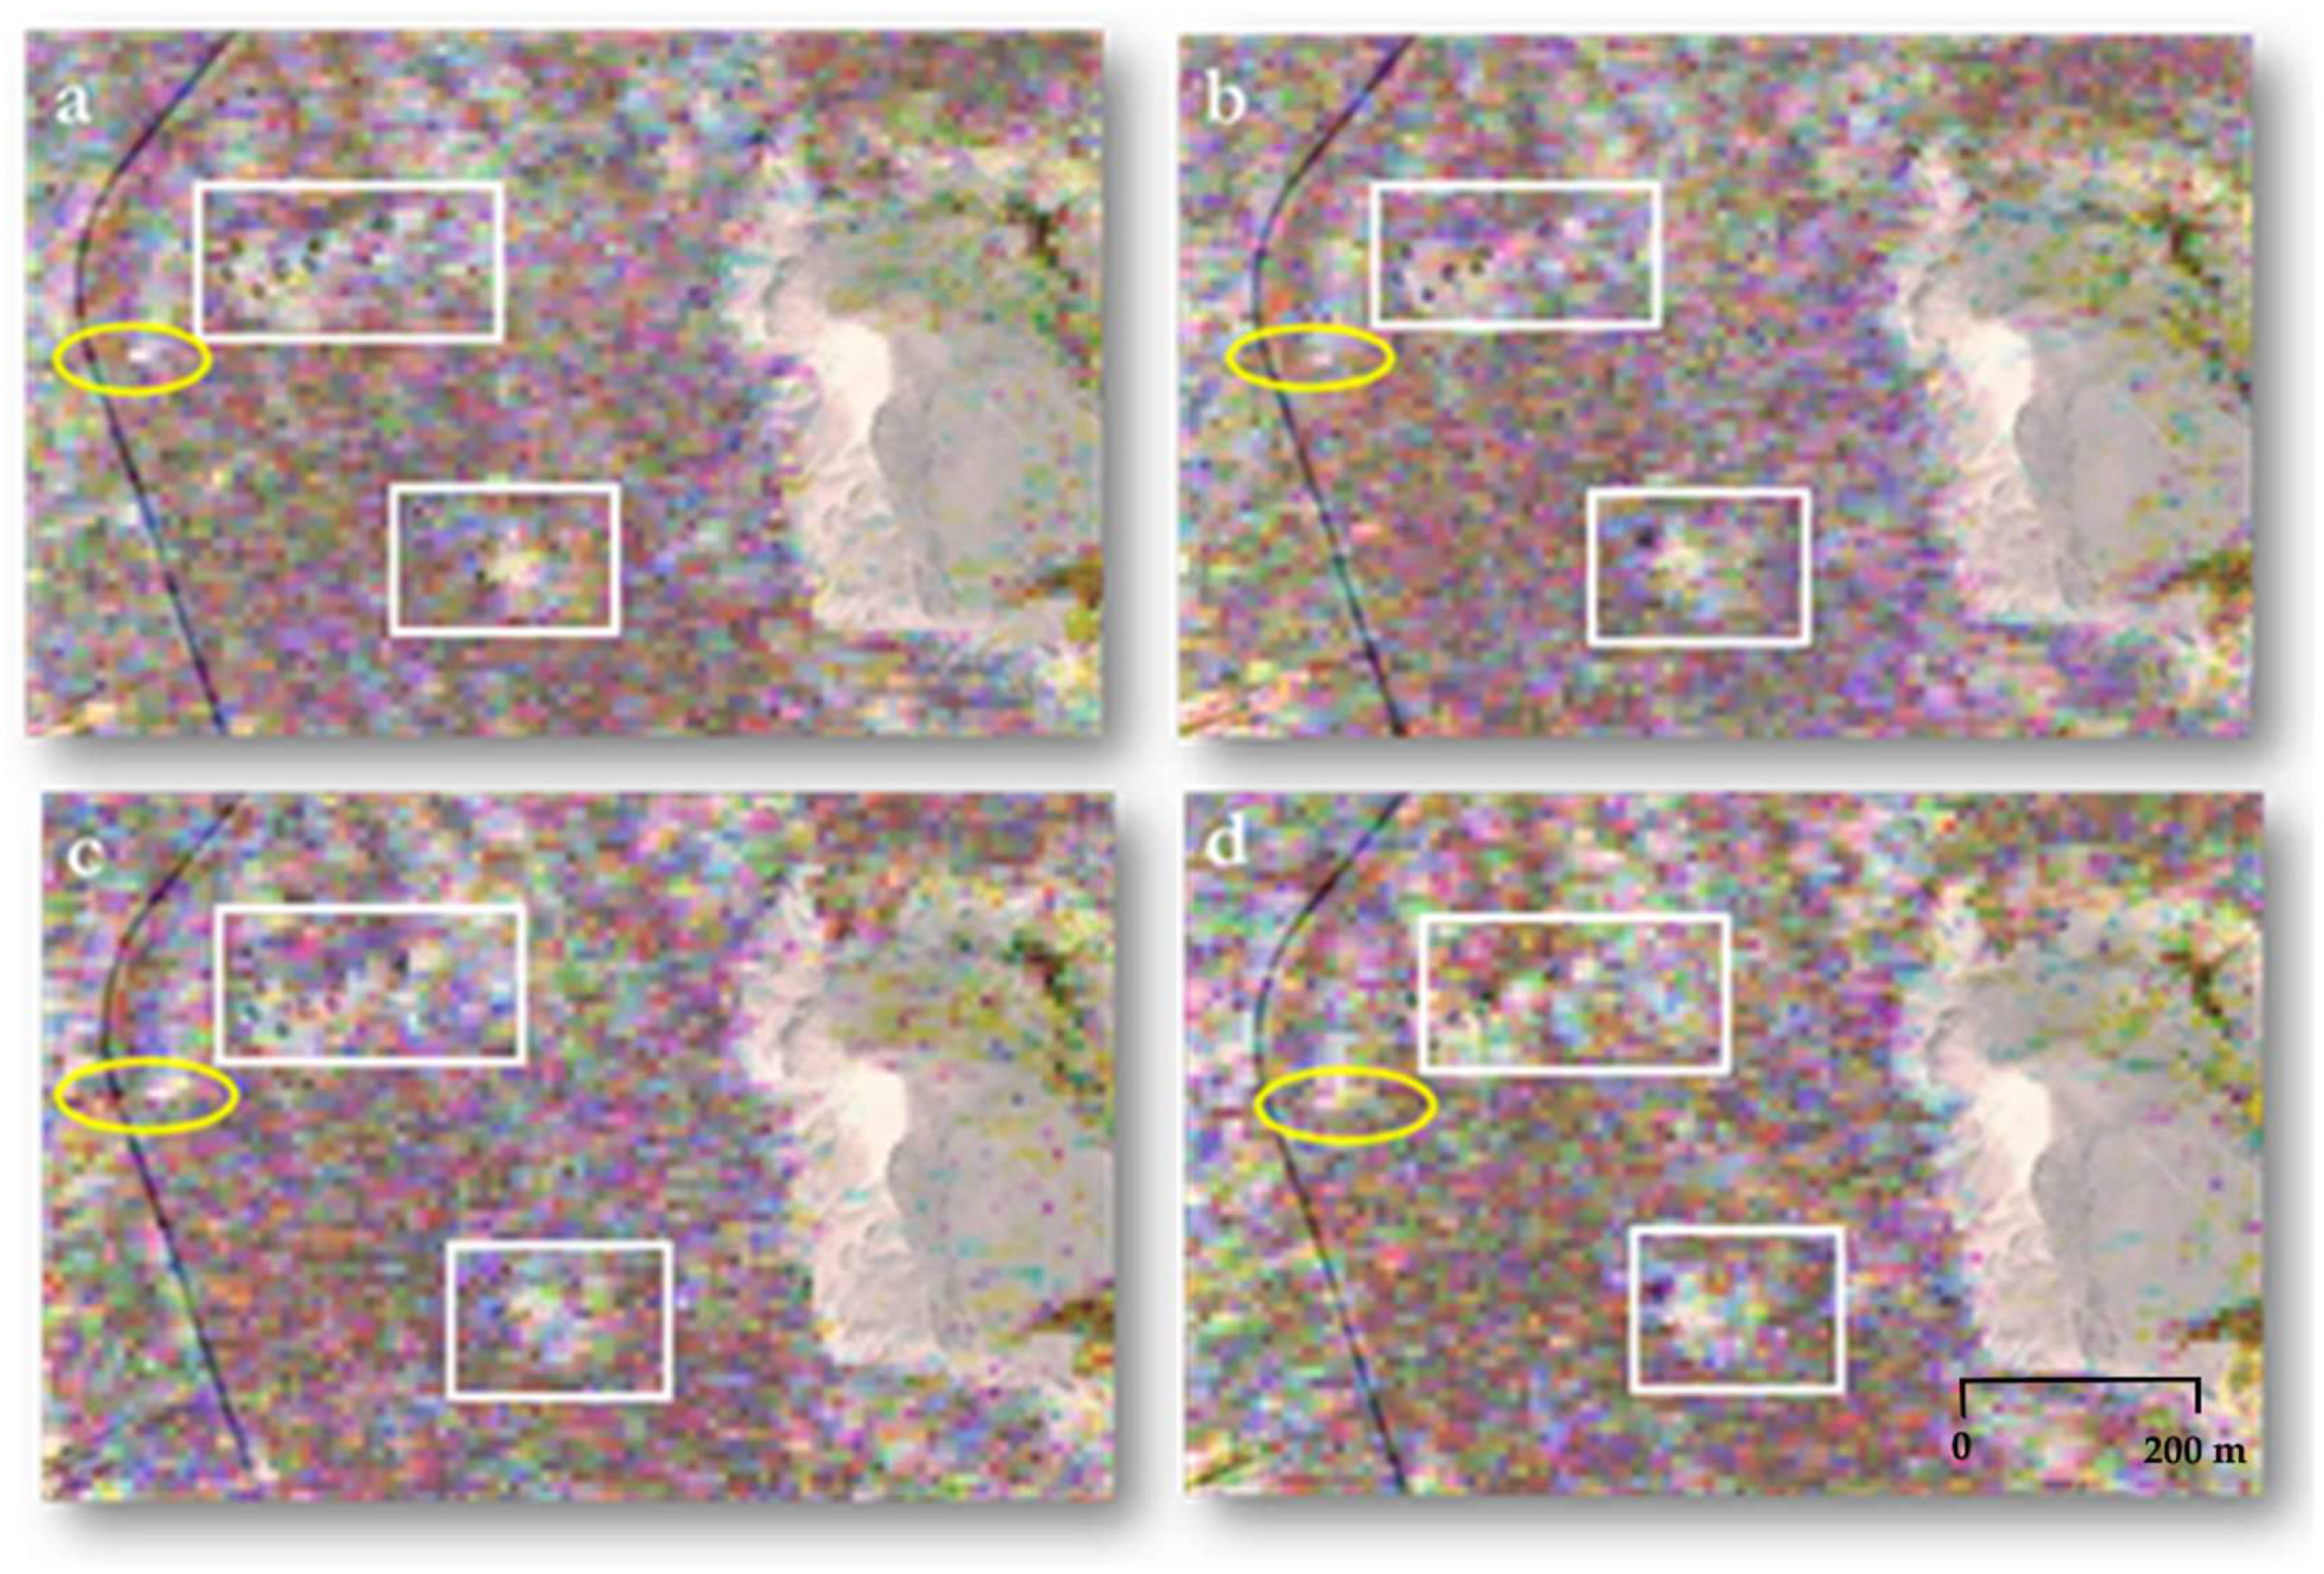
Similarly, to what was done for ALOS data (Section 3.1) we wanted to obtain an overall visualization of the different types of scattering mechanisms appearing over the archaeological structures, the surrounding morphology, and the vegetated and urban areas in RADARSAT data. For this purpose the RADARSAT-2 polarimetric Pauli RGB decomposition was overlaid with one of the available Google Earth acquisitions (November, 2012), for a first crossed qualitative analysis (Figure 15).
By observing the four C-band Pauli RGB decomposition images, each of them overlaid with the Google Earth acquisition, we noticed that the archaeological structures and the morphology of the site were more easily recognizable thanks to the higher spatial resolution of RADARSAT-2.
However, the higher spatial resolution posed a problem of less clear backscattering discrimination compared to what was observed in ALOS PALSAR data, highlighting a more detailed distribution of backscattering in the urban area and in the surface morphology to which C-band is more sensitive. Nevertheless, well-localized backscattering (Figure 15, yellow ellipse) was detected in the area close to the NW group of royal pyramids (Figure 15, white squares), confirming, at a first level analysis, the persistence of an important scattering mechanisms in the same area identified in ALOS PALSAR data (Figure 12, red ellipse).
Considering the absence of surface archaeological structures recorded in the cartographic sources and in optical data, also in this case we looked at the meteorological information regarding precipitation. In fact, a C-band target detection in that point could be easily affected by even light precipitations or by a contrast of humidity in the soil. Thanks to the archives of WeatherOnline, as previously, the absence of precipitations and a very low percentage of humidity was noted in the days of the acquisitions and days directly preceding them. This again confirmed dryness of the sand in the area [26].
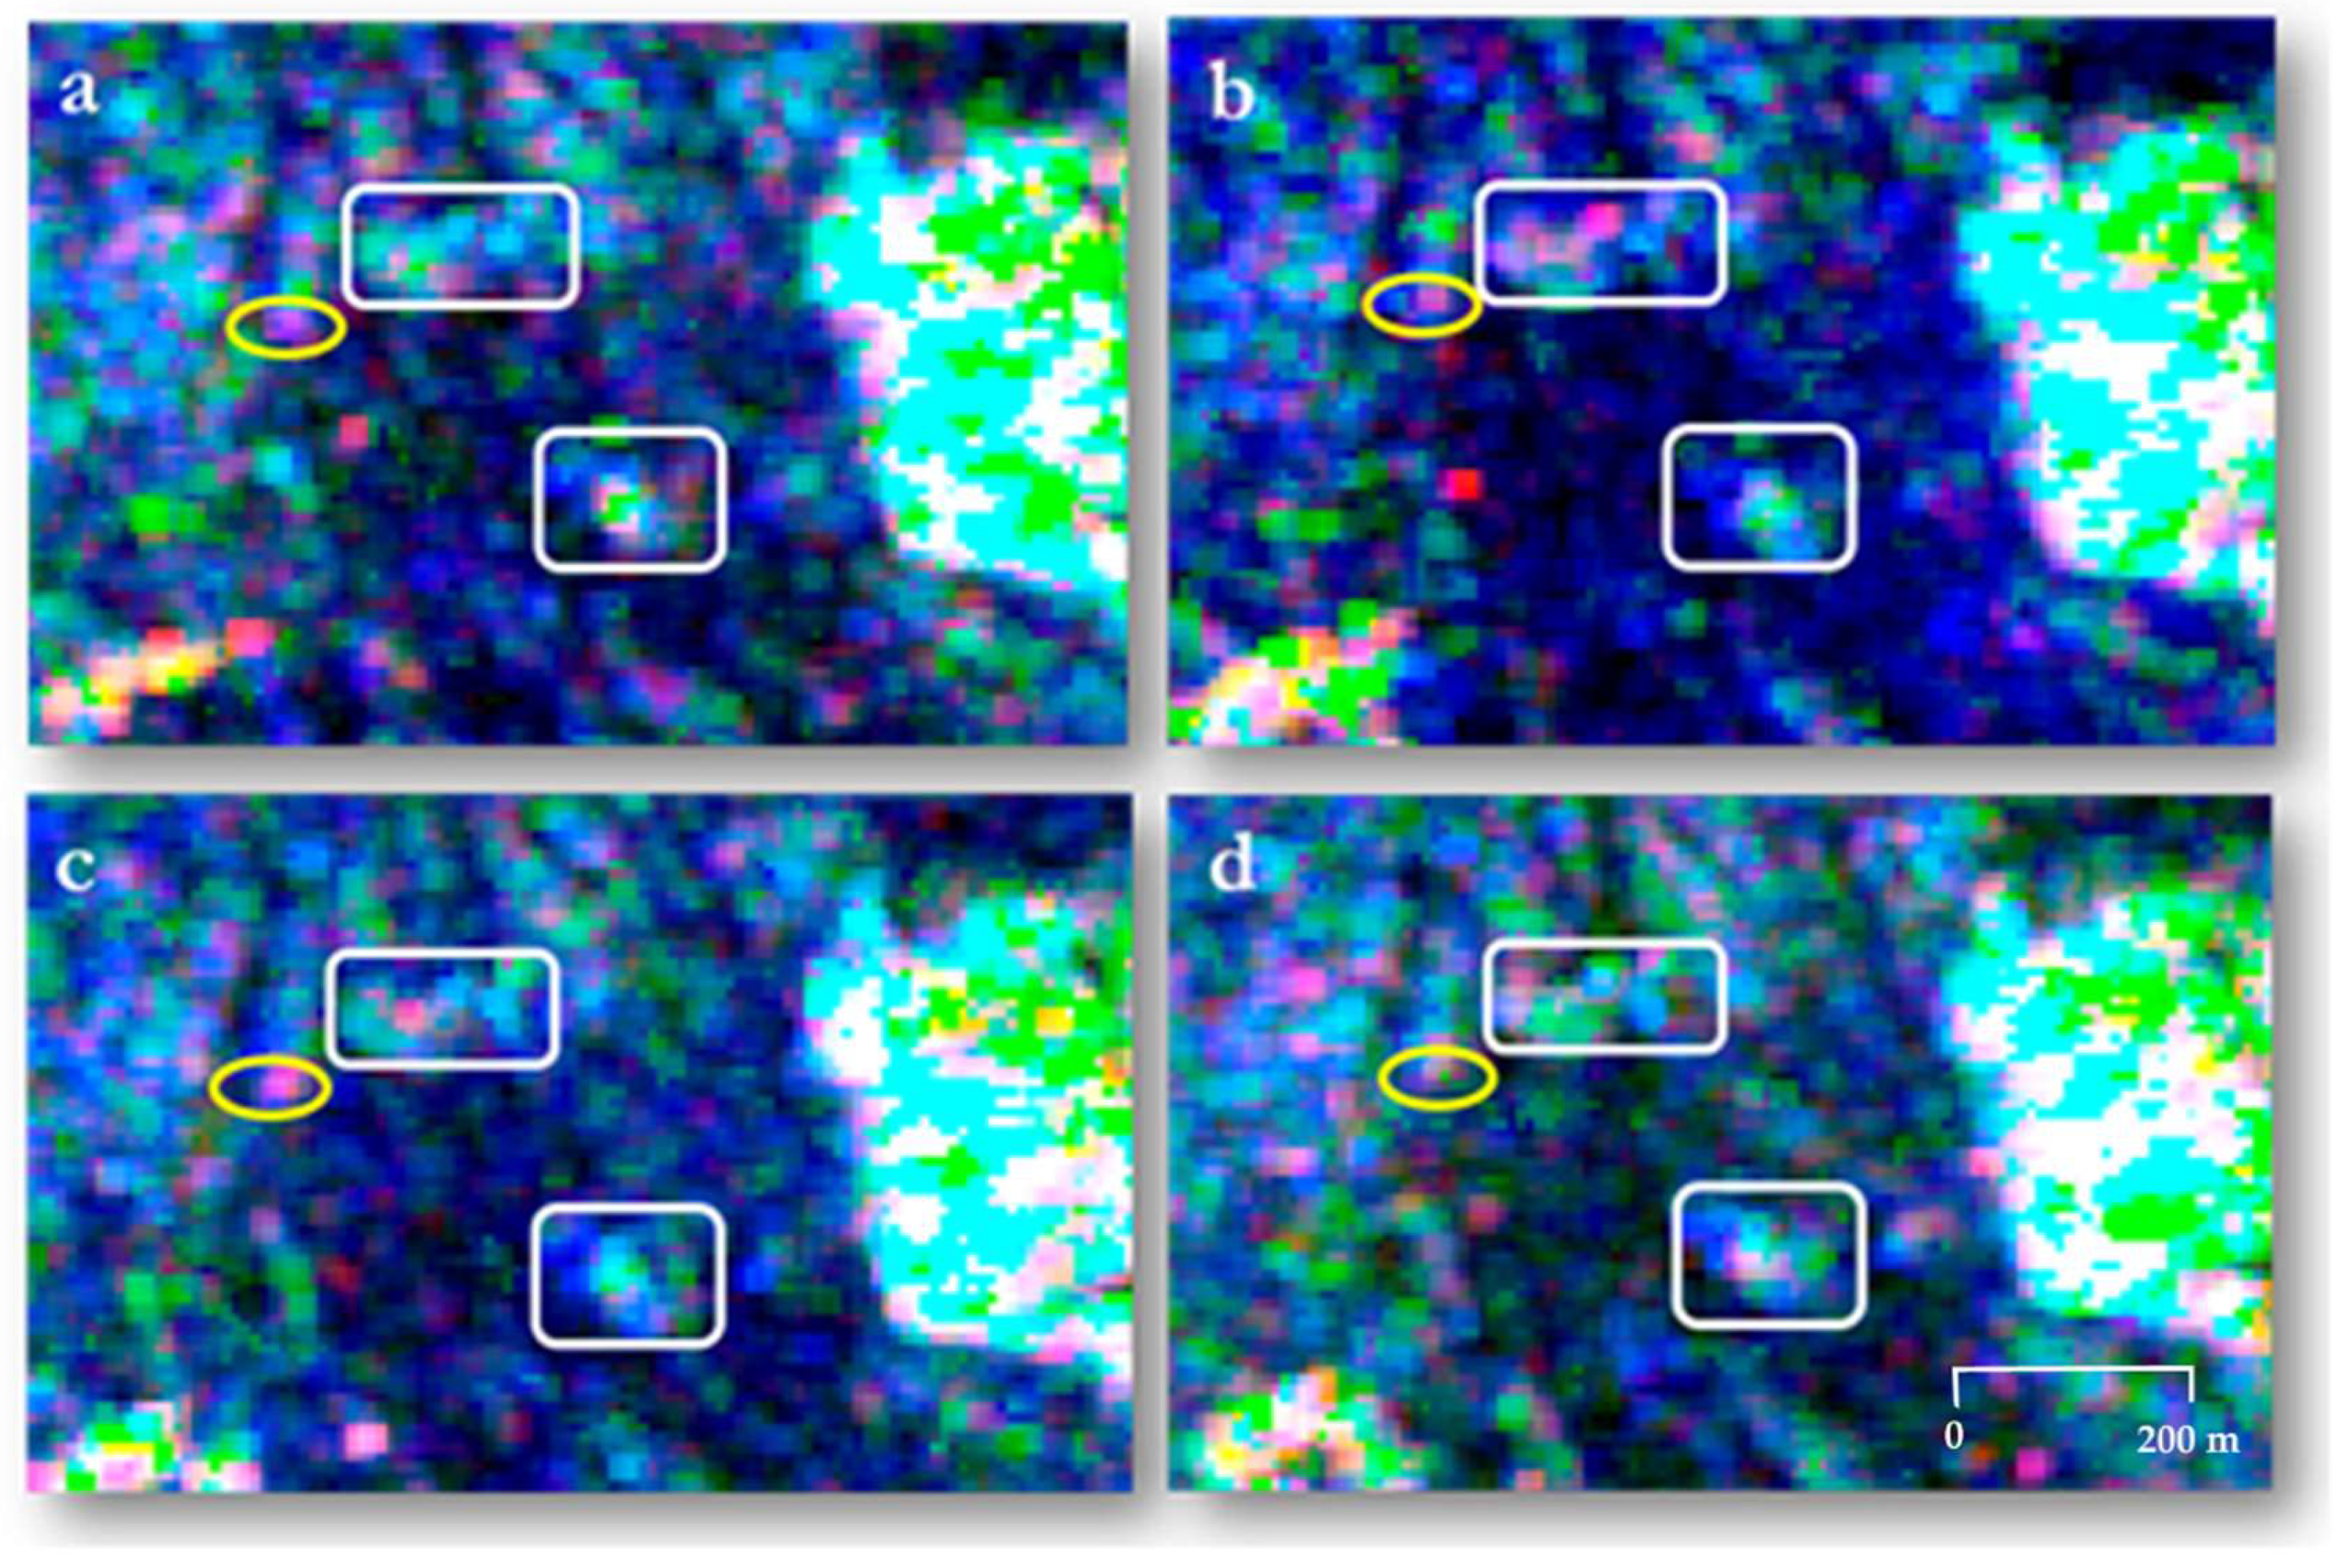
In order to observe the backscattering behavior of targets analyzed, and to compare it with the backscattering noticed in the ALOS PALSAR data, the Yamaguchi G4U1 decomposition was performed.
This polarimetric descriptor showed, also in RADARSAT-2 case, a significant amount of information for detection of archaeological structures (Figure 16).
The overall observation of the Yamaguchi decomposition RGB images lead to a similar conclusion derived for ALOS PALSAR data (Figure 13). In fact, both the palm cultivations in the southern part of the site and the urban area of Karima presented strong volume scattering, due to the orientation of buildings in the central part of the city. Observations made for modern buildings of Karima were not valid concerning the royal pyramids’ backscattering (Figure 16, white squares), for which a contribution of all the scattering mechanisms was observed, with a higher percentage of single bounce mechanism.
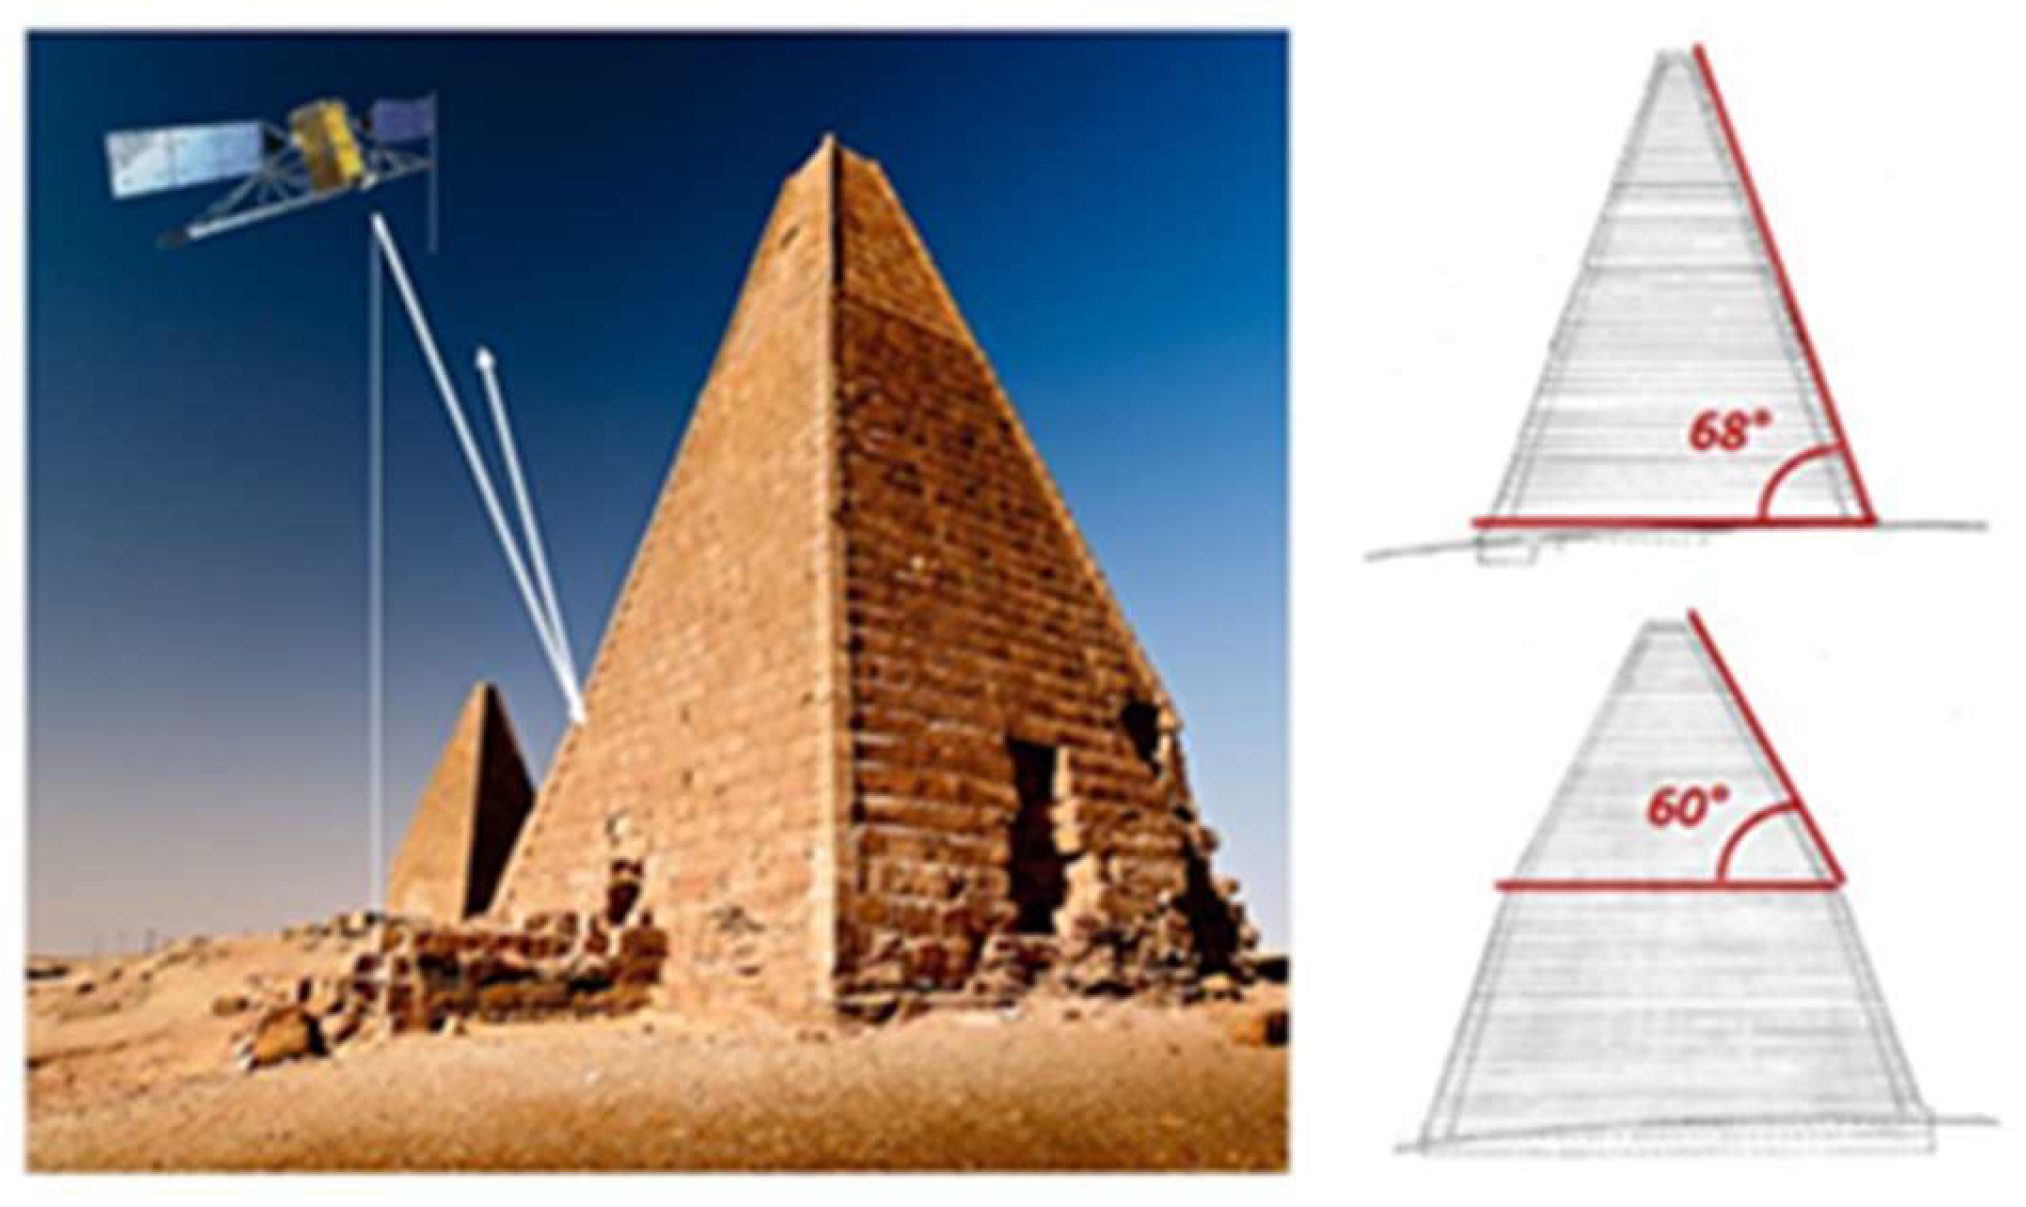
Indeed, being C-band more sensitive to the surface characteristics, the sum of all the contributions can be caused not only by varying walls’ inclination presented by the two royal cemeteries, but also by the reciprocal orientation of pyramids. The orientation varies for each pyramid, resulting in differently oriented walls with respect to the incident wave. In a deeper analysis, it was possible to notice how the recorded single bounce backscattering from pyramids was related to the inclination of the pyramids’ walls, varying from 68° to 60° (Figure 17). Moreover, the C-band sensitivity to surface characteristics generated also single bounce scattering mechanism with some double bounce contributions coming from the morphology of the site.
Analyzing the strong backscatter individuated in Pauli RGB and in Yamaguchi G4U1 decomposition RGB images, the nature of the scattering contributions was investigated in each channel of Yamaguchi G4U1 decomposition (Figure 18).
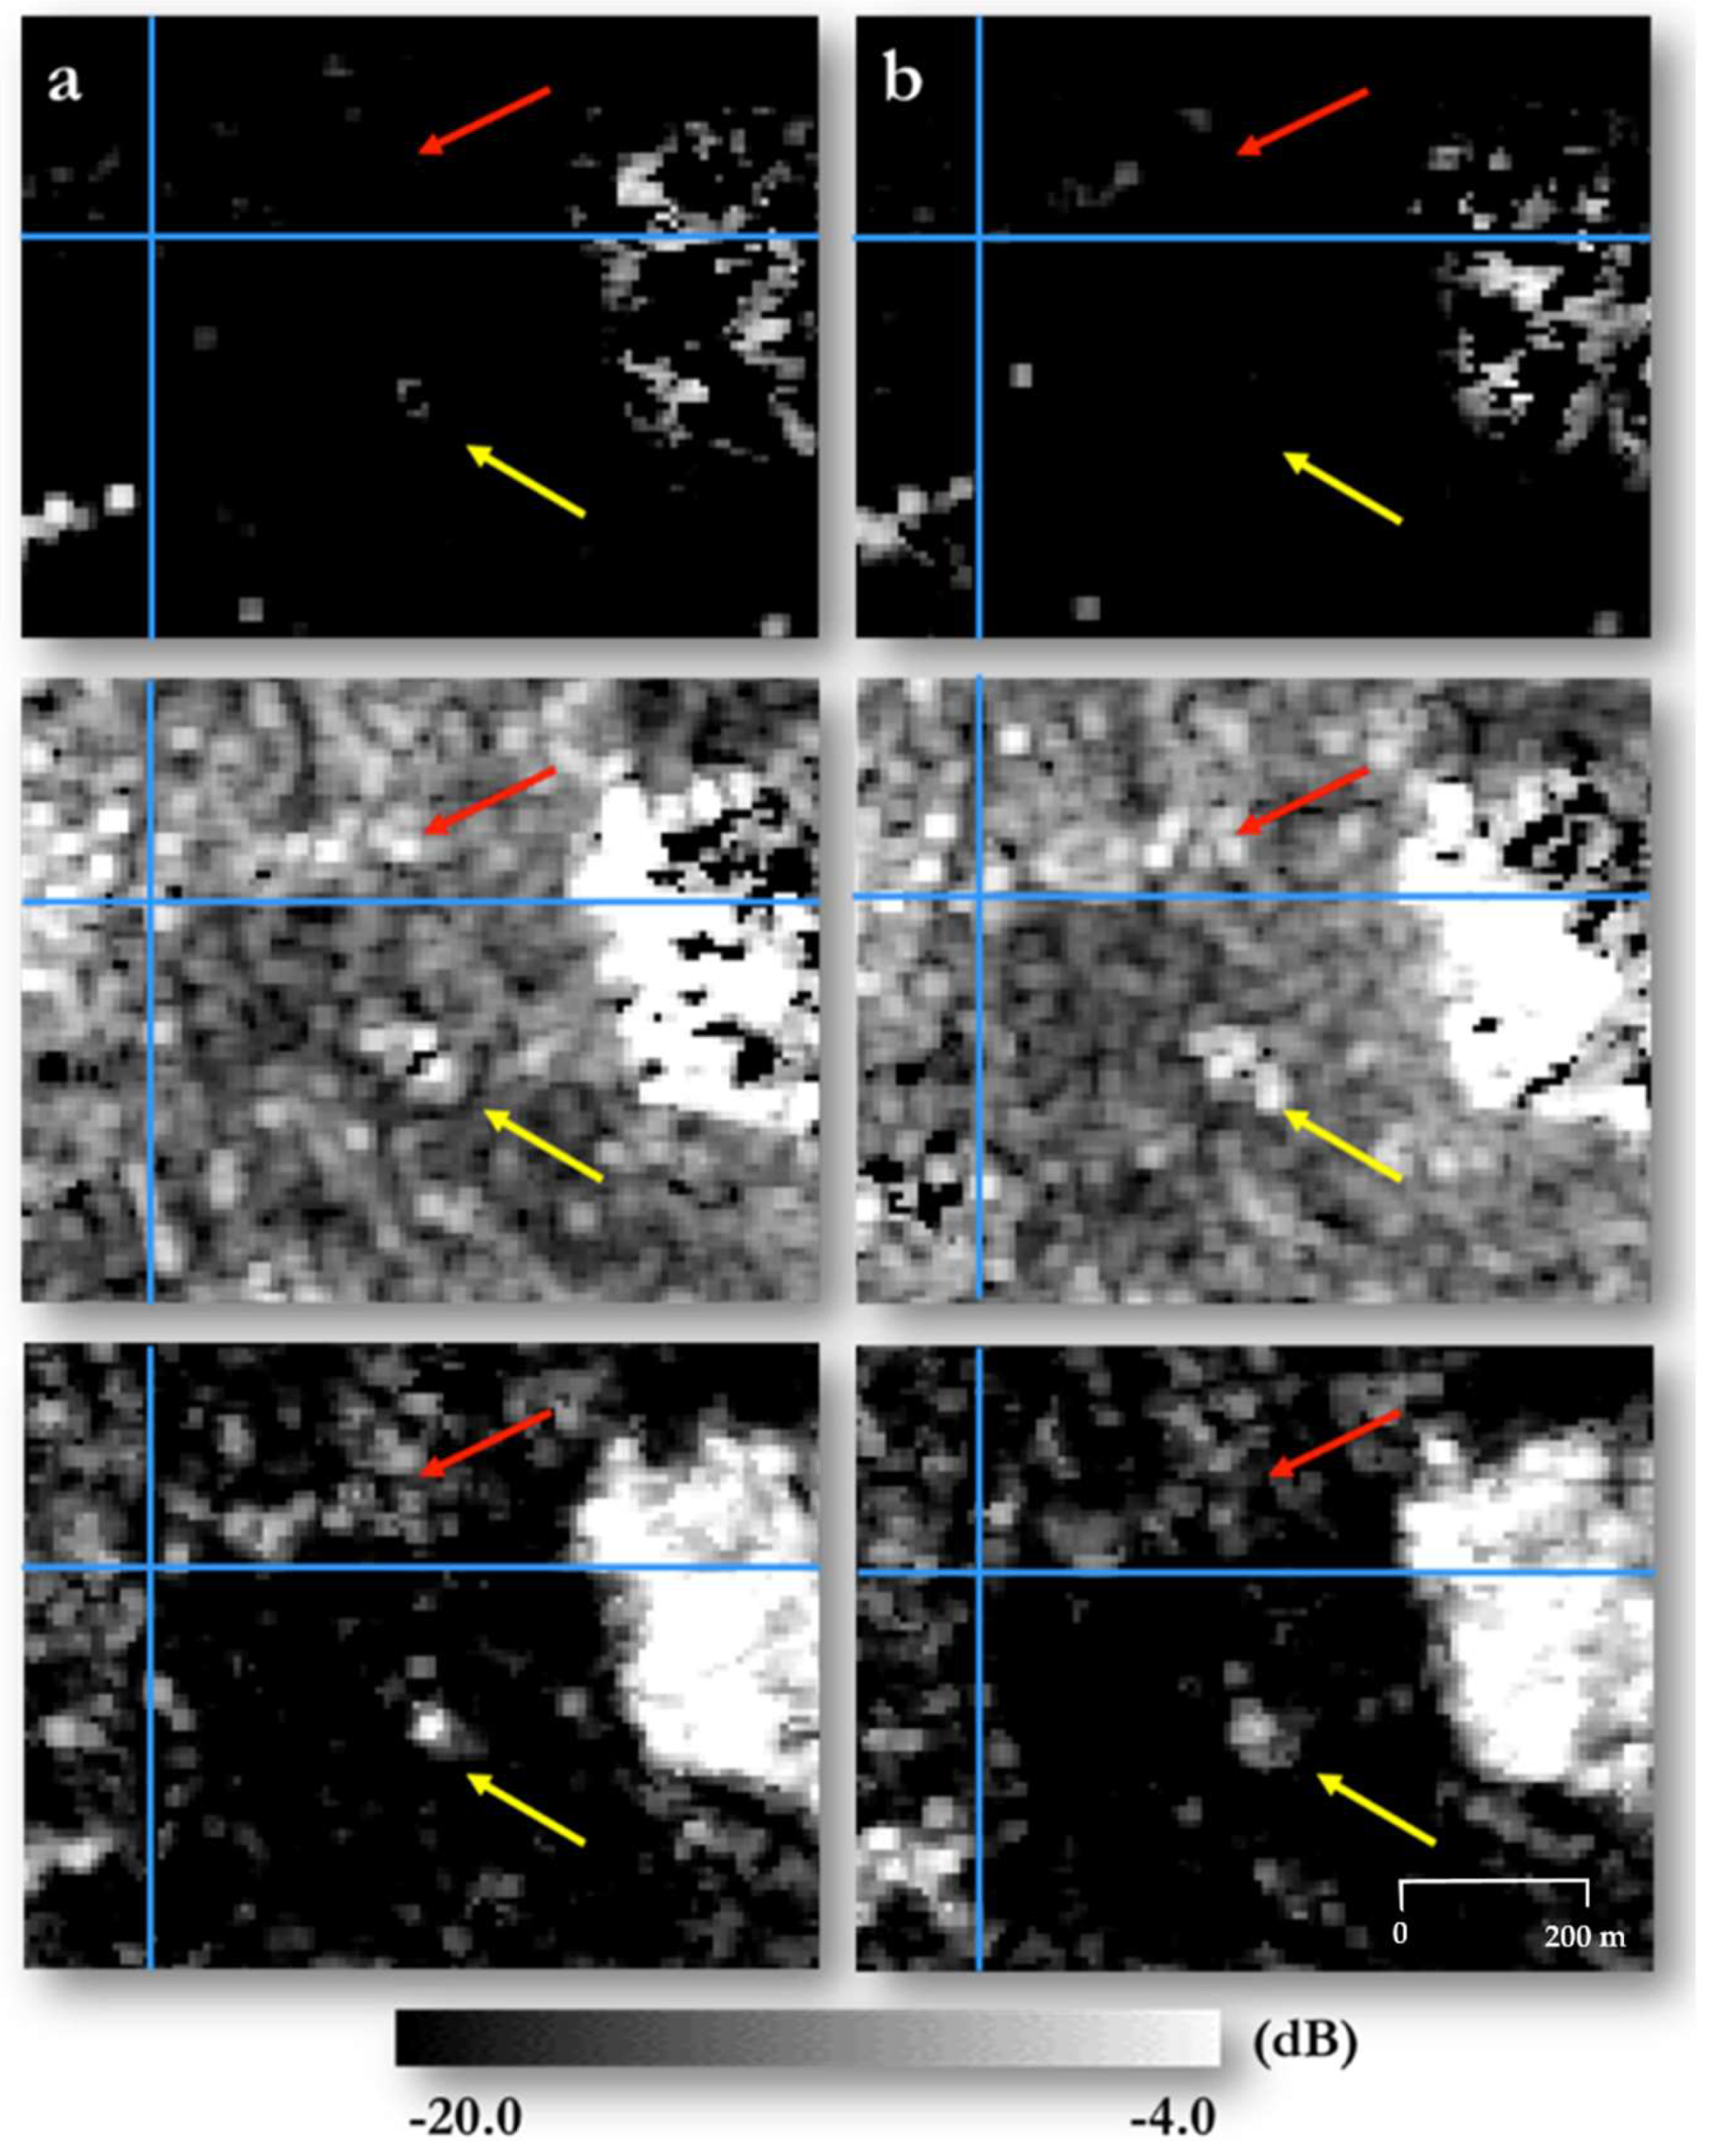
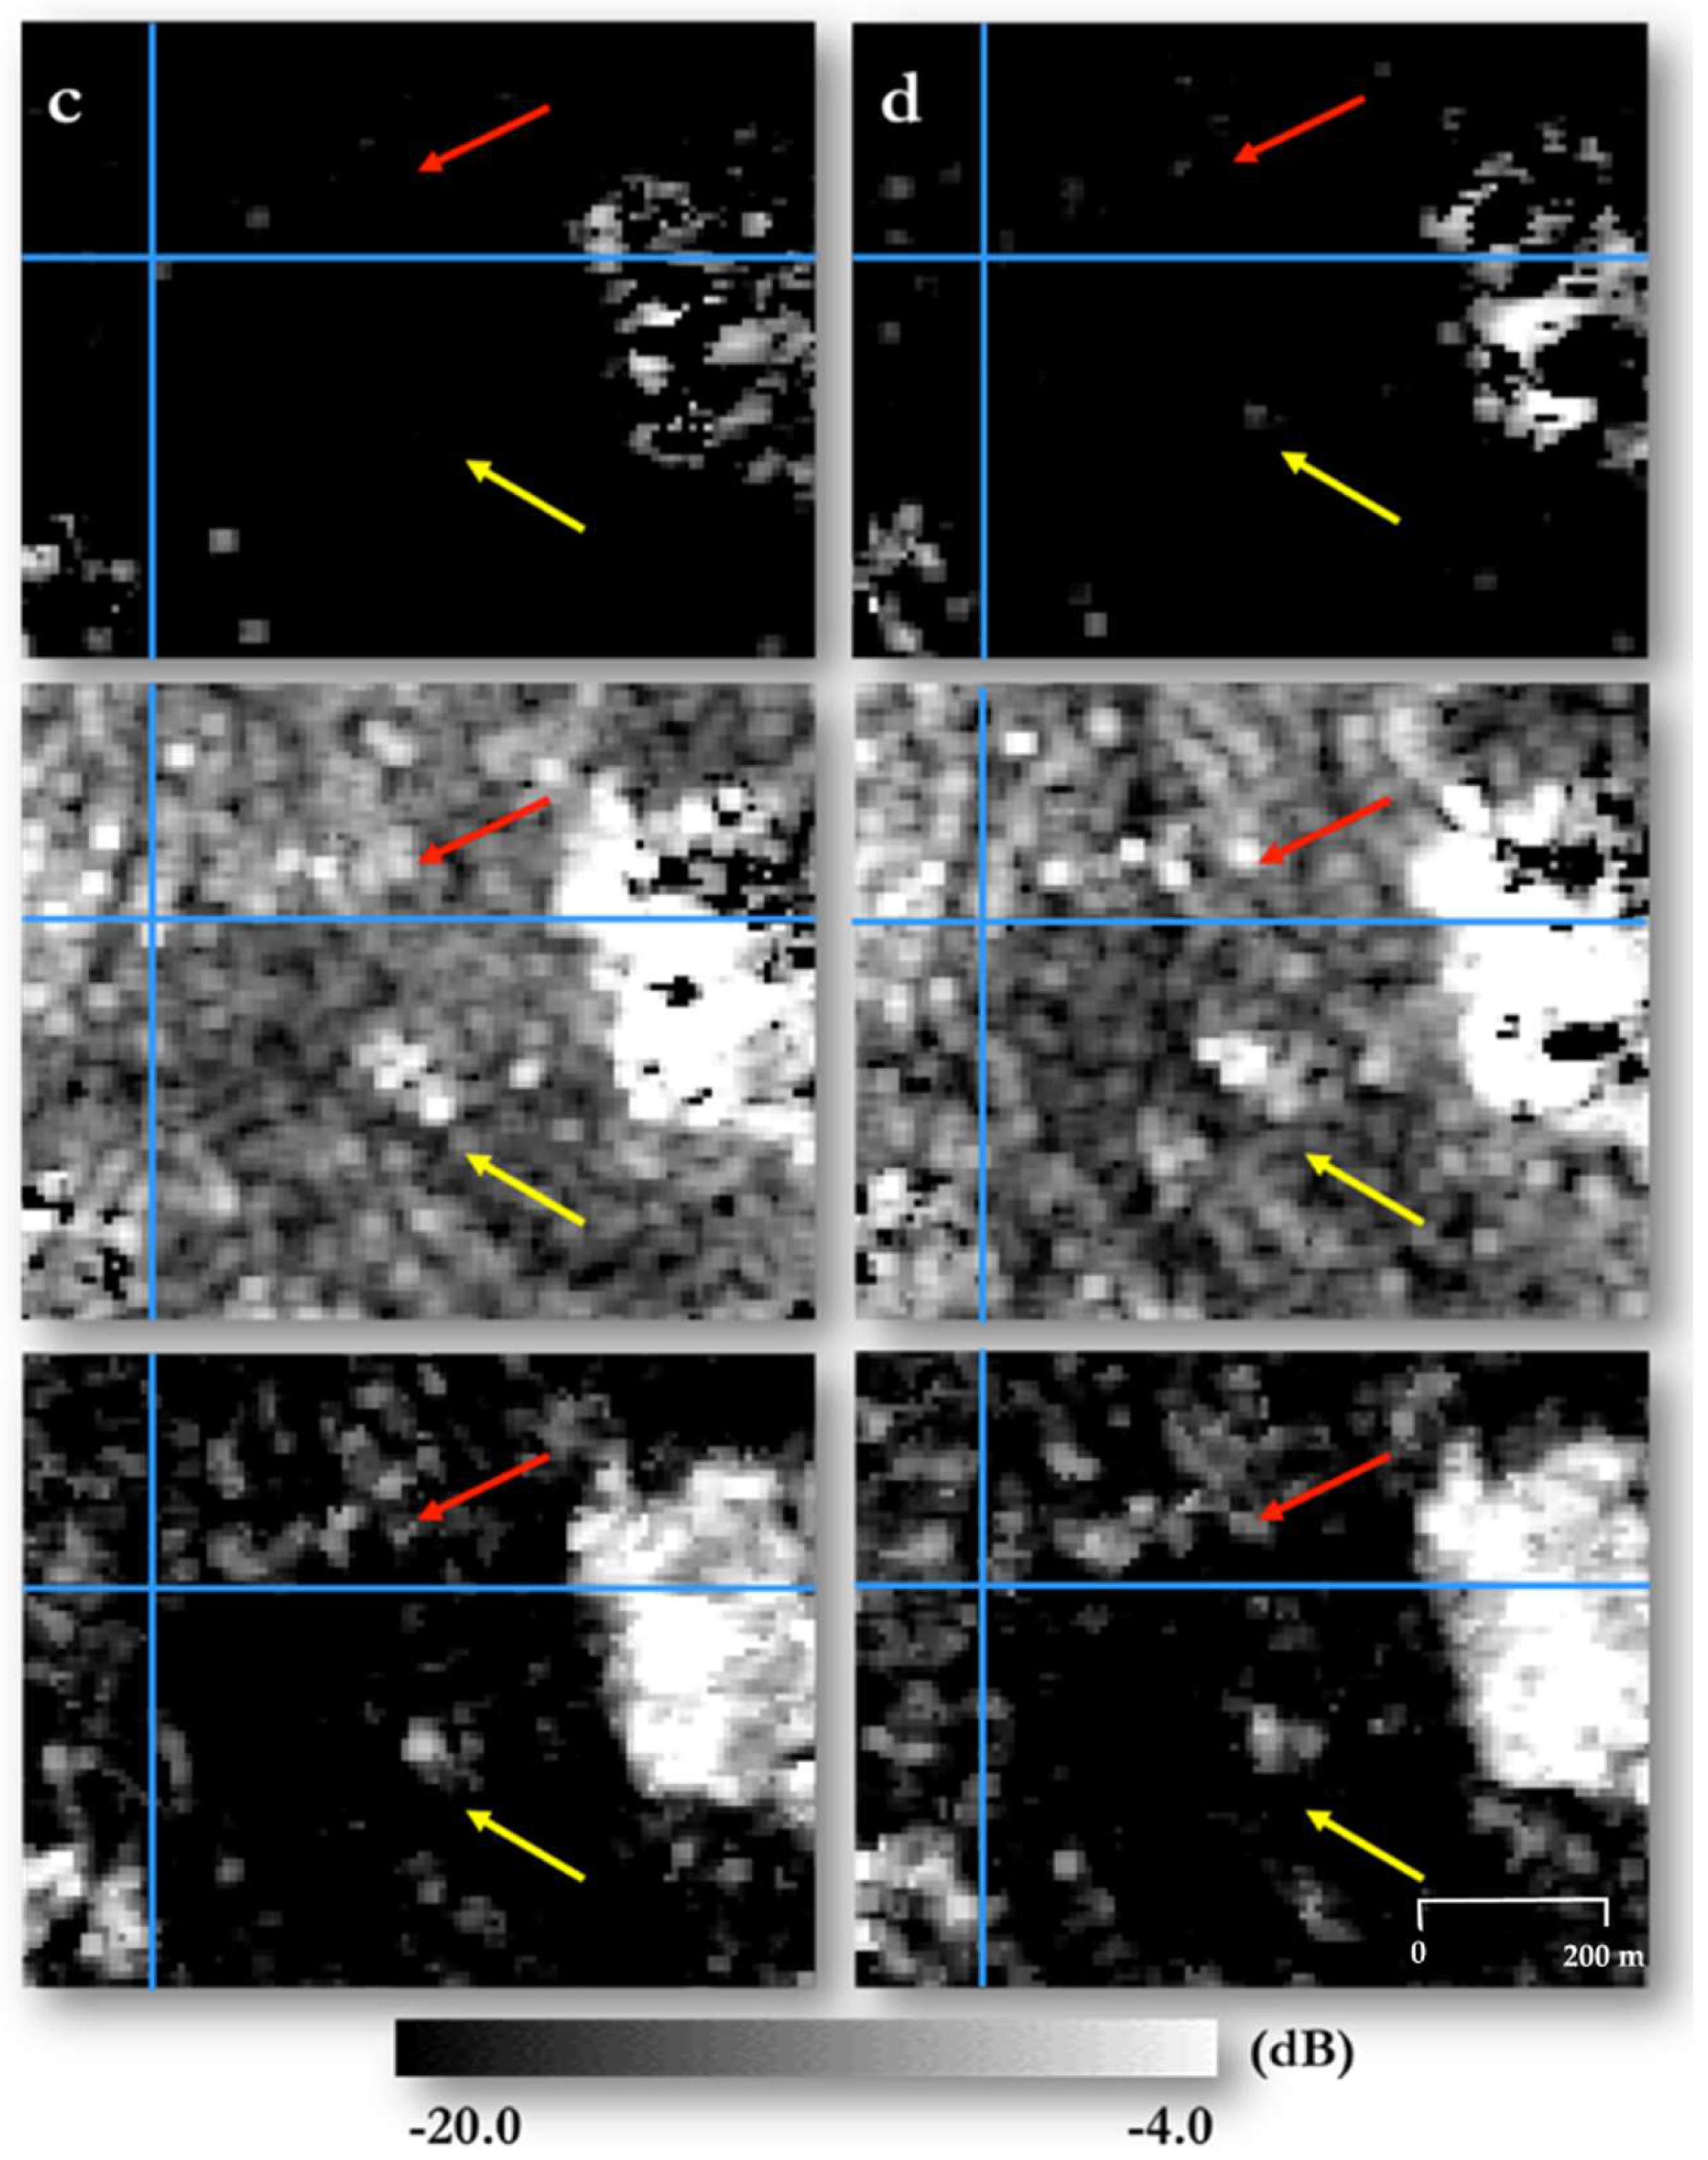
In particular, the single channels of the decomposition were analyzed for each RADARSAT-2 acquisition to understand if the typology of the noticed backscattering, apparently recorded in Yamaguchi G4U1 RGB image as a double bounce, could also be due to other scattering contributions. The exact location of the backscattering was indicated, once again, by latitude and longitude coordinates (Figure 18, blue cross). In addition, the backscattering coming from the NW group of pyramids (Figure 18, red arrow) and the central royal cemetery (Figure 18, yellow arrow) was analyzed, as well as the scattering contribution coming from the surrounding morphology.
Once the strong backscattering was localized in all the four RADARSAT-2 acquisitions, the corresponding amplitude values of each Yamaguchi_G4U1 decomposition channel were examined. As reported in Table 4, concerning the strong backscattering close to the NW group of pyramids (Figure 18, red arrow), a high value of single bounce scattering has been registered, with a low contribution of double bounce and a lower contribution of volume scattering.
By comparing these values to the ones recorded in ALOS PALSAR data, a strong response in the single bounce mechanism was identified in both SAR datasets, as well as a low contribution of double bounce, which however, seemed not to be recorded for the morphology of the site in each RADARSAT-2 acquisitions.
In fact, being C-band more sensitive to the surface topography, several surface scatterers have been detected also in the surrounding portion of the site, in which the L-band seemed not to record any backscatter. By comparing the recorded backscattering close to the NW group of pyramids to that of the surface archaeological structures, we noticed that amplitude values related to the pyramids present the same percentage of scattering contributions, with an exception for volume scattering contribution that was higher for the central group of pyramids (yellow arrow) due to their orientation.
Considering the acquisition time of multi-frequency dataset composed by ALOS PALSAR and RADARSAT-2 data, the persistence of the target was noted over seven years (2006–2013) in the same area.
In the cartographic documentation derived from UNESCO reports on the analyzed area, no surface archaeological evidence was registered in the point corresponding to the strong backscattering noticed in ALOS PALSAR data (Figure 13). It has to be remembered that the morphology of the site is composed of sand and sand-stone rocks, which show backscattering similar to the one noticed close to NW group of royal pyramids. This was particularly evident in the qualitative analysis of RADARSAT-2 data (Figure 15).
Nevertheless, supposing this backscattering was due to the sandstone topography of the site, we could expect to have the same responses for all the morphological evidences in the area. This could be true when observing RADARSAT-2 imagery, in which higher spatial resolution allowed discriminating several strong backscattering signals related to the morphology of the site, as well as the scattering mechanism close to the pyramids (Figure 15). However, this was not confirmed in ALOS PALSAR data, in which we did not noticed specific backscatter related to the morphological surface evidence (Figure 13).
Moreover, it is important to consider, from a technical point of view, the typology of polarimetric acquisitions selected for this analysis: different frequency and similar incidence angle configurations. In fact, being respectively a 26.20°/23.10° (ALOS PALSAR) and 27.06° (RADARSAT-2) incidence angle, we can assume that ALOS PALSAR L-band wave deeply penetrated sand detecting a target in the ground, as reported in both acquisitions, while RADARSAT-2 C-band lightly penetrated sand, demonstrating a higher sensitivity to the general morphology of the site.
Considering the absence of meteorological events that could affect wave interaction with targets on each acquisition date, it is important to point out that using the higher frequency RADARSAT-2 C-band it was still possible to discriminate this point target, despite the lower penetration capability of the C-band and thanks to the narrow observation incidence angle.
3.3. Sentinel-1 Multi-Temporal Backscatter Analysis
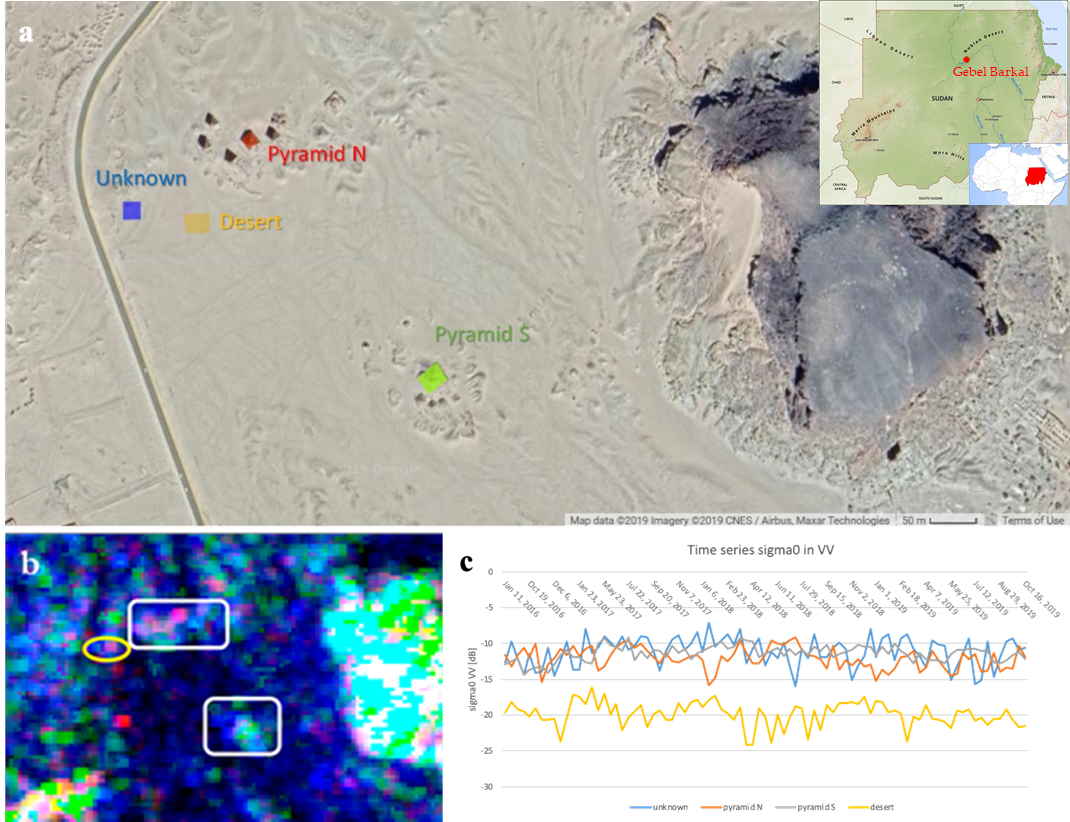
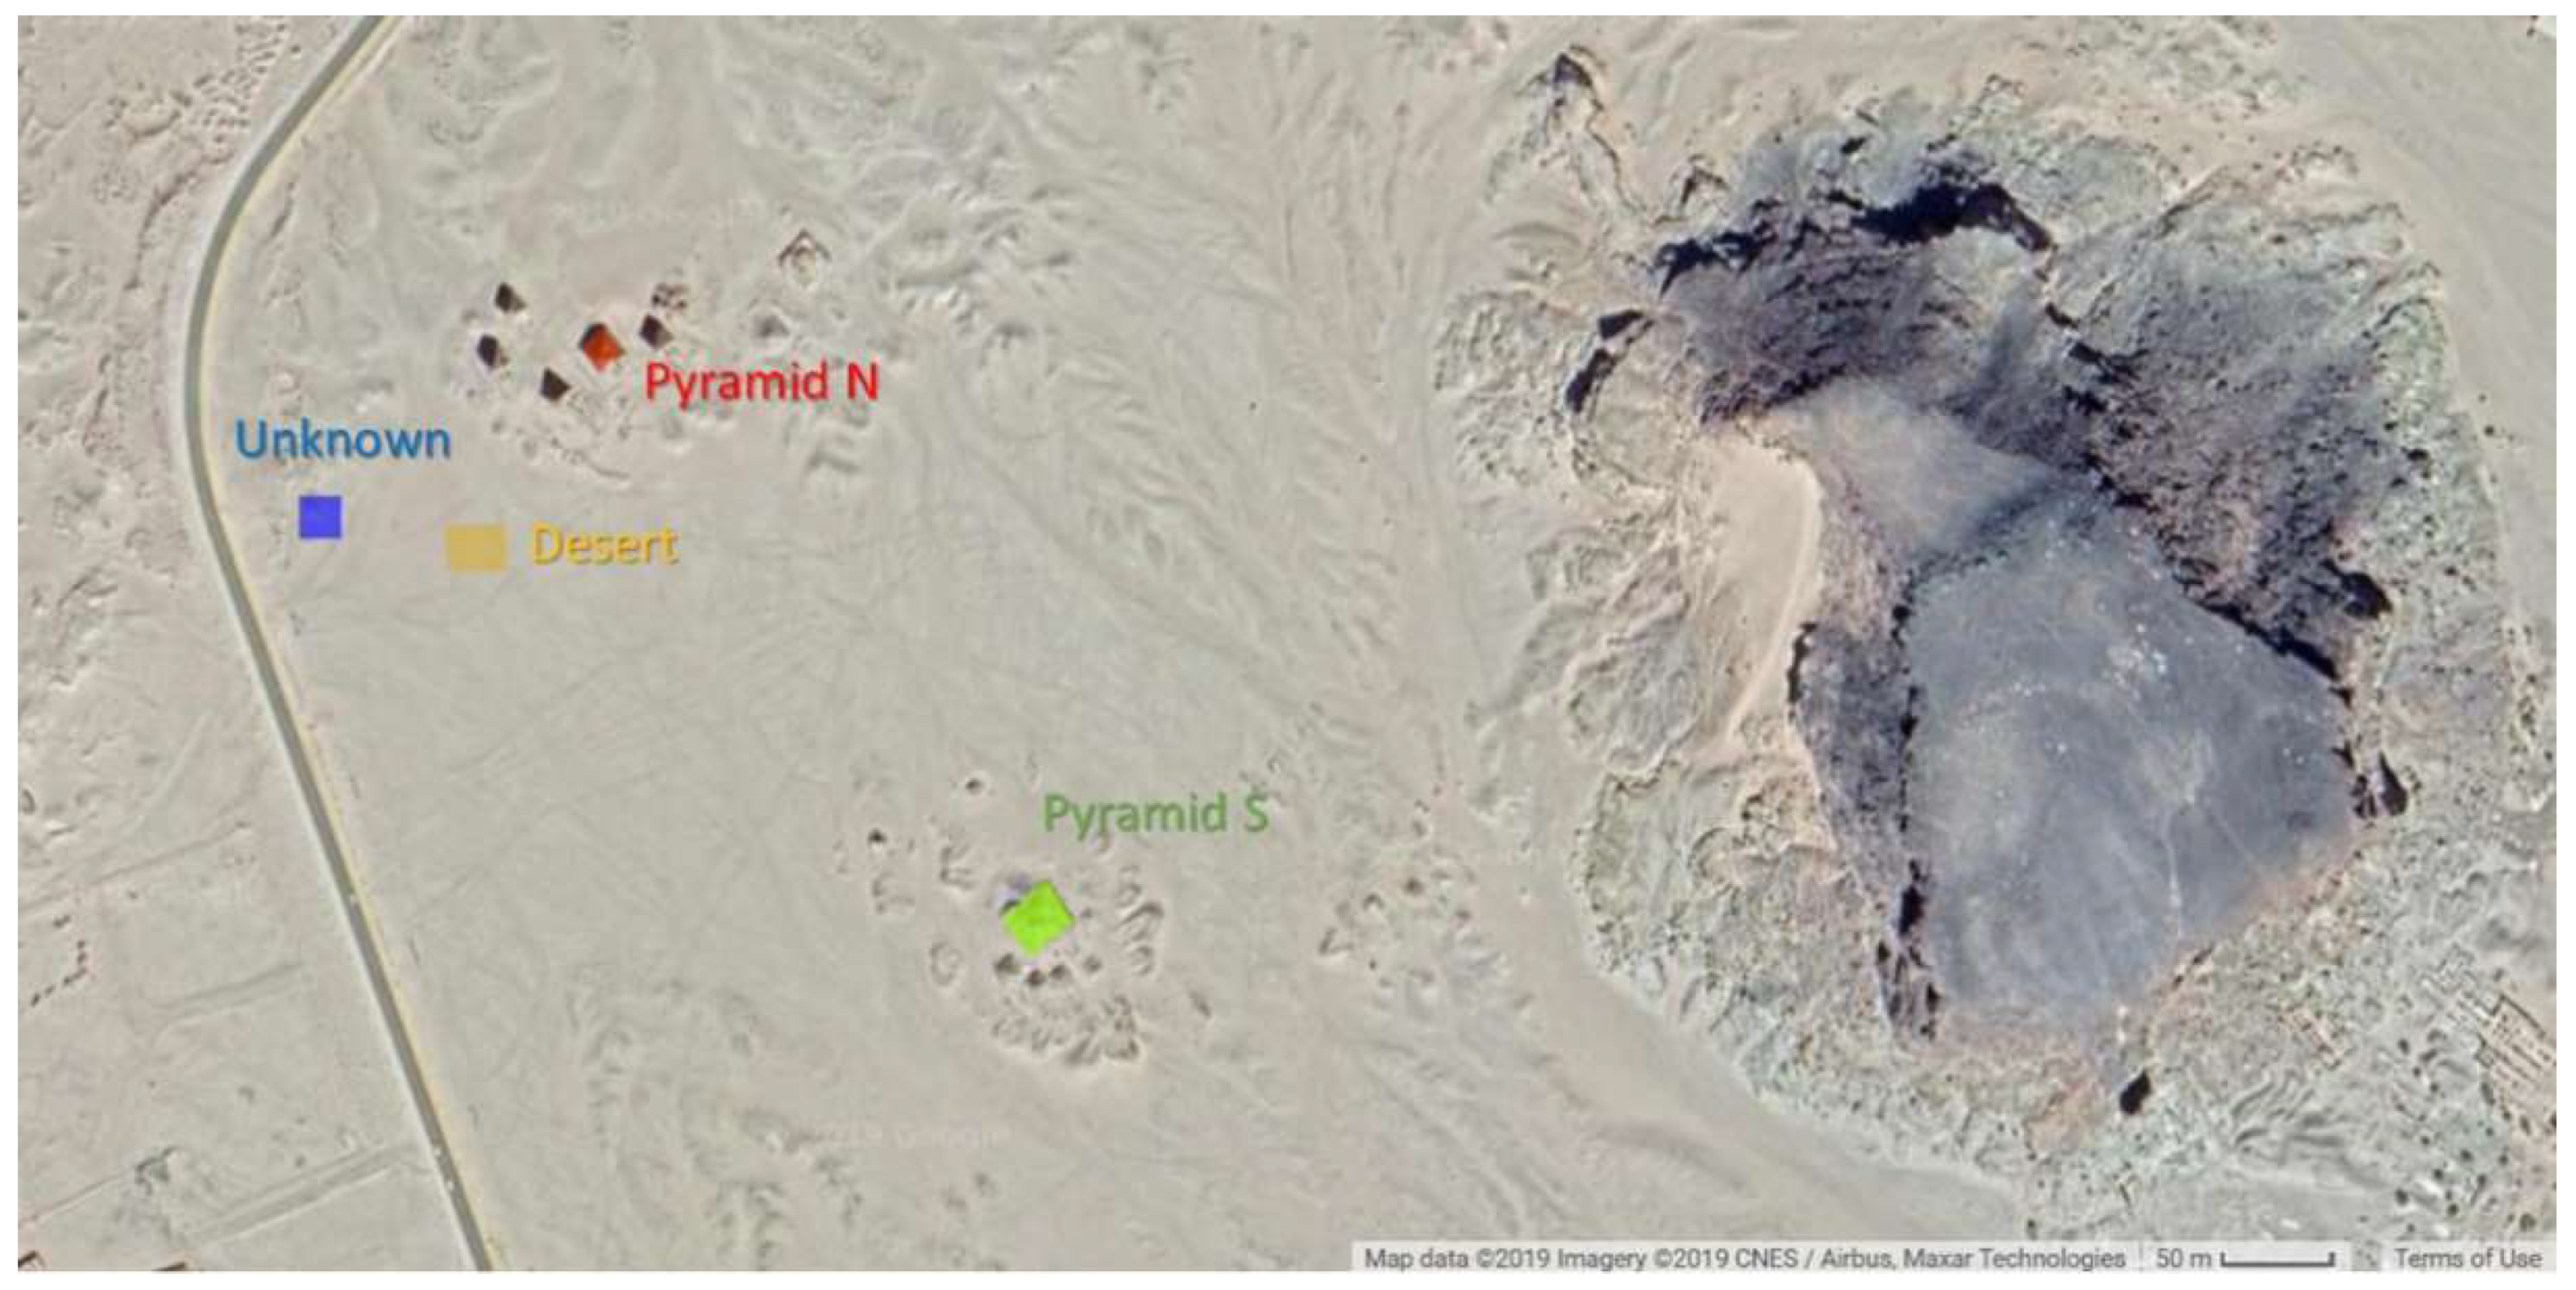
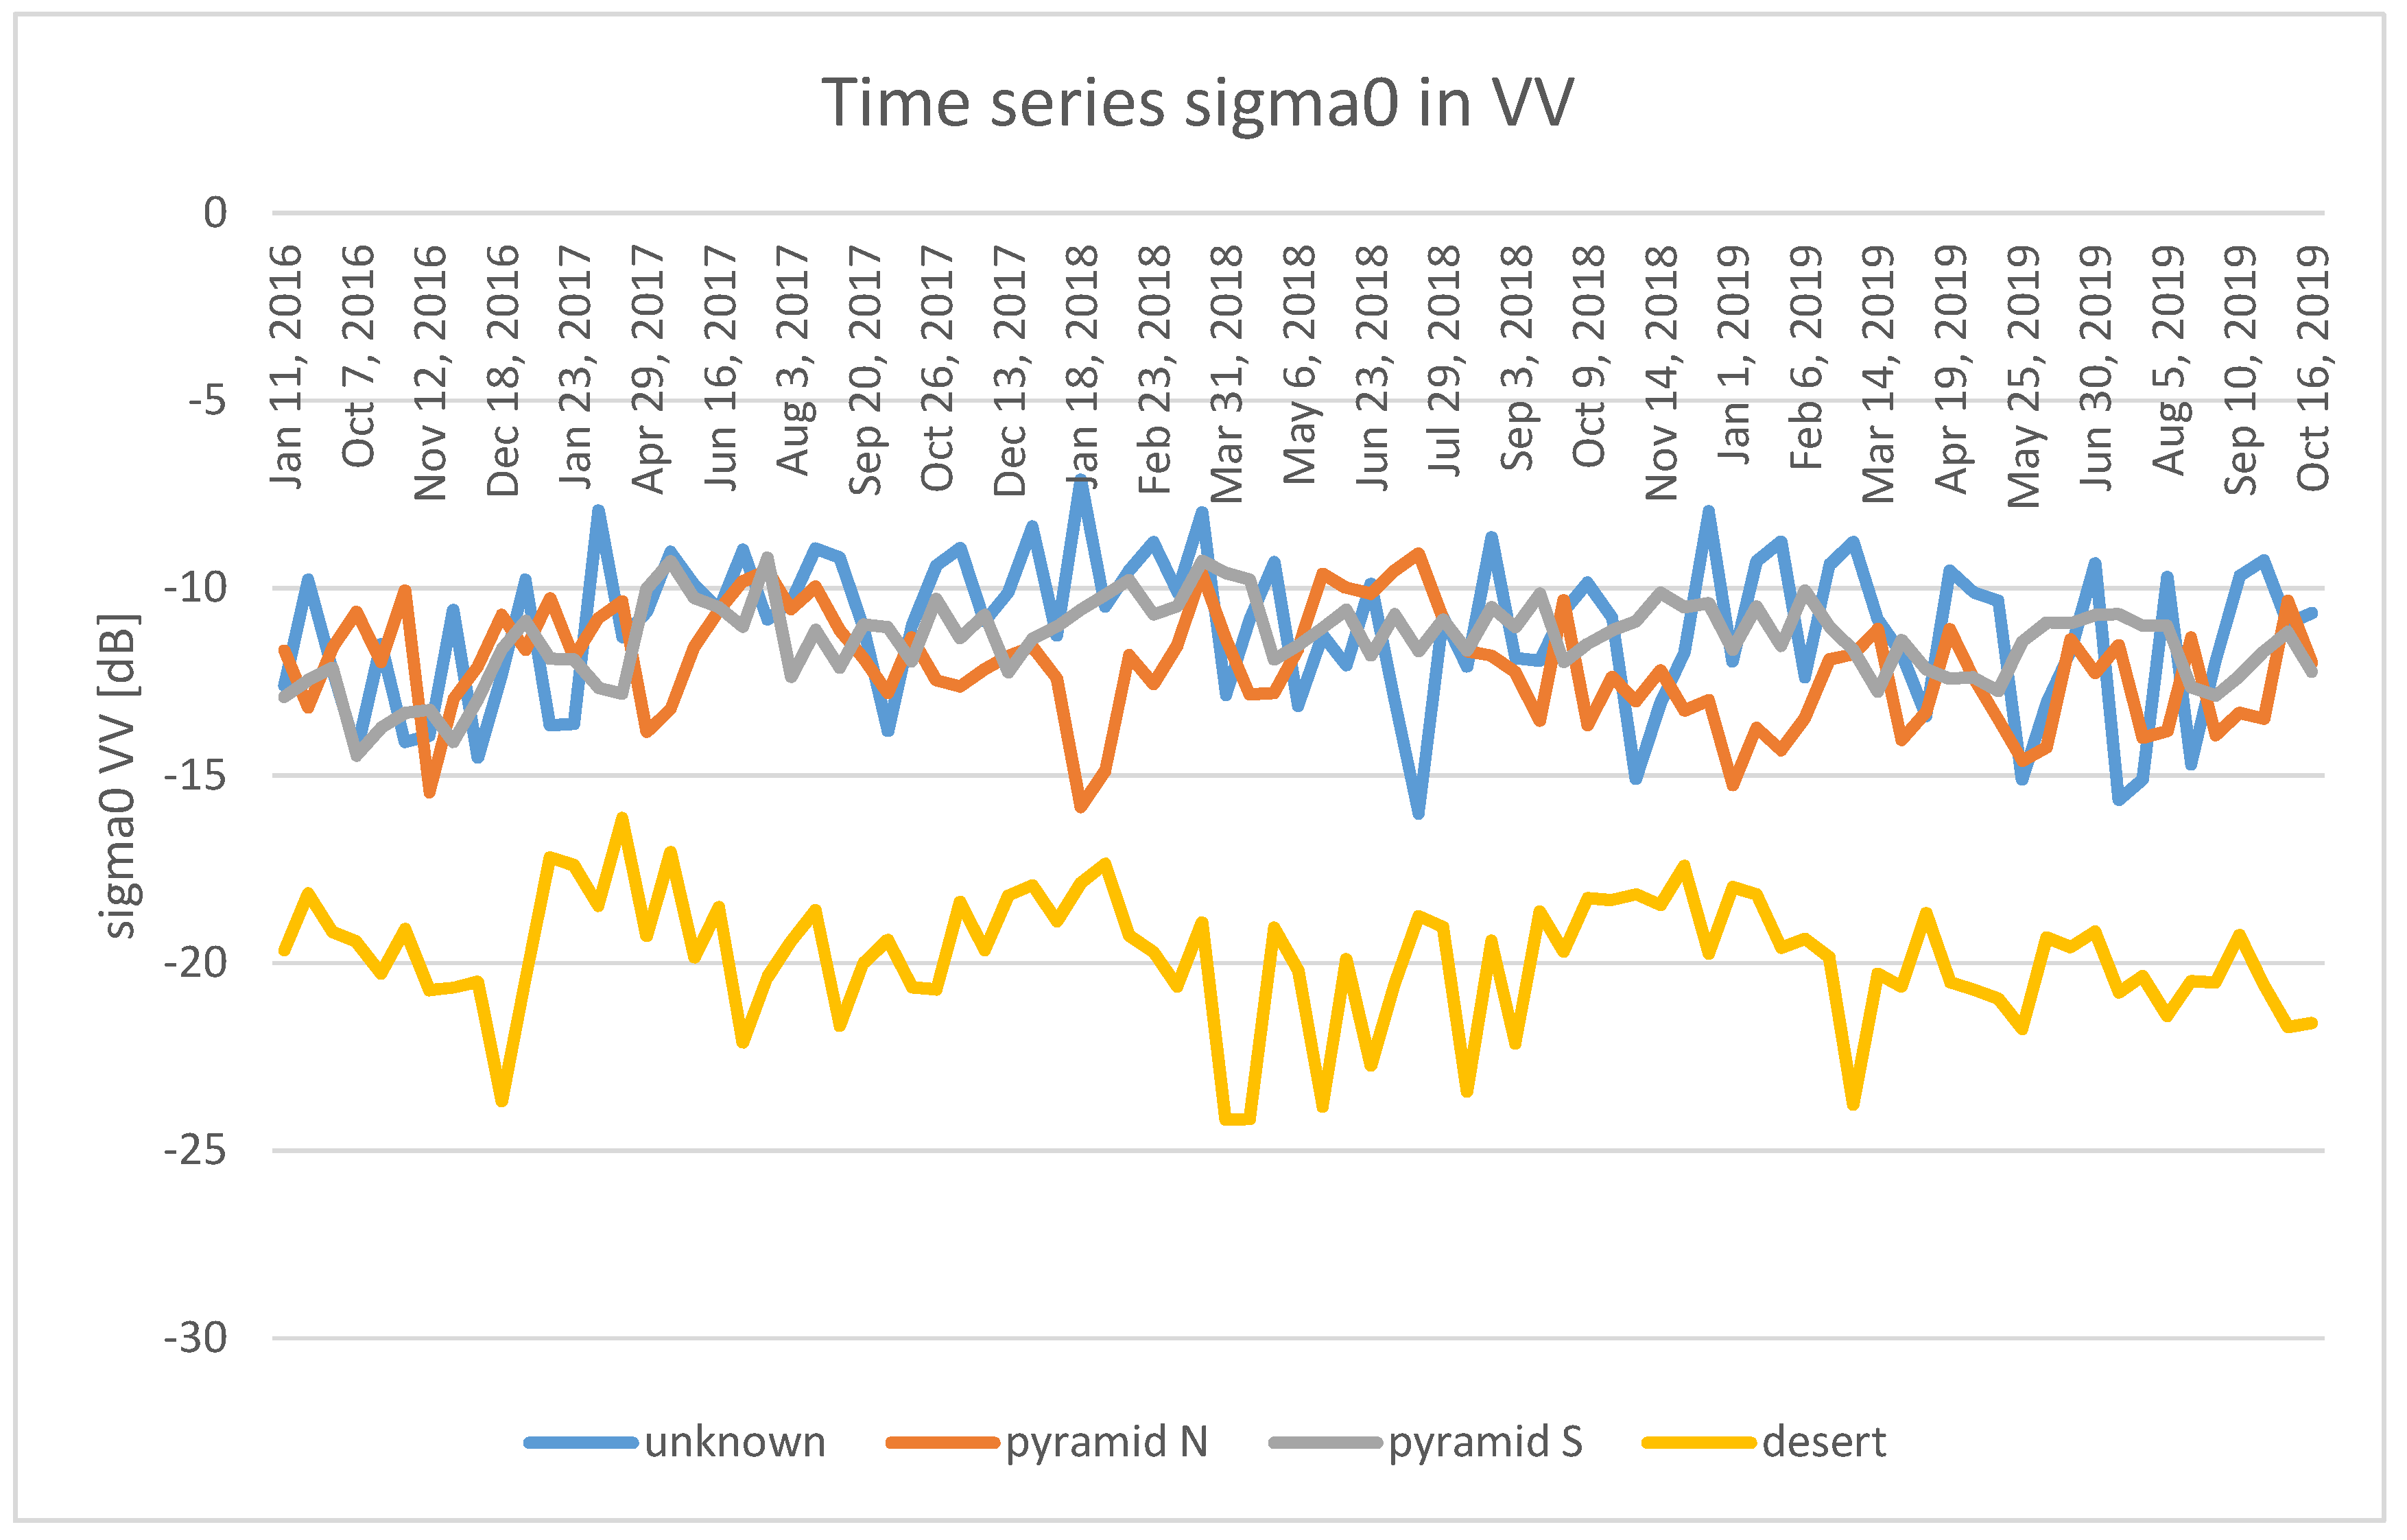
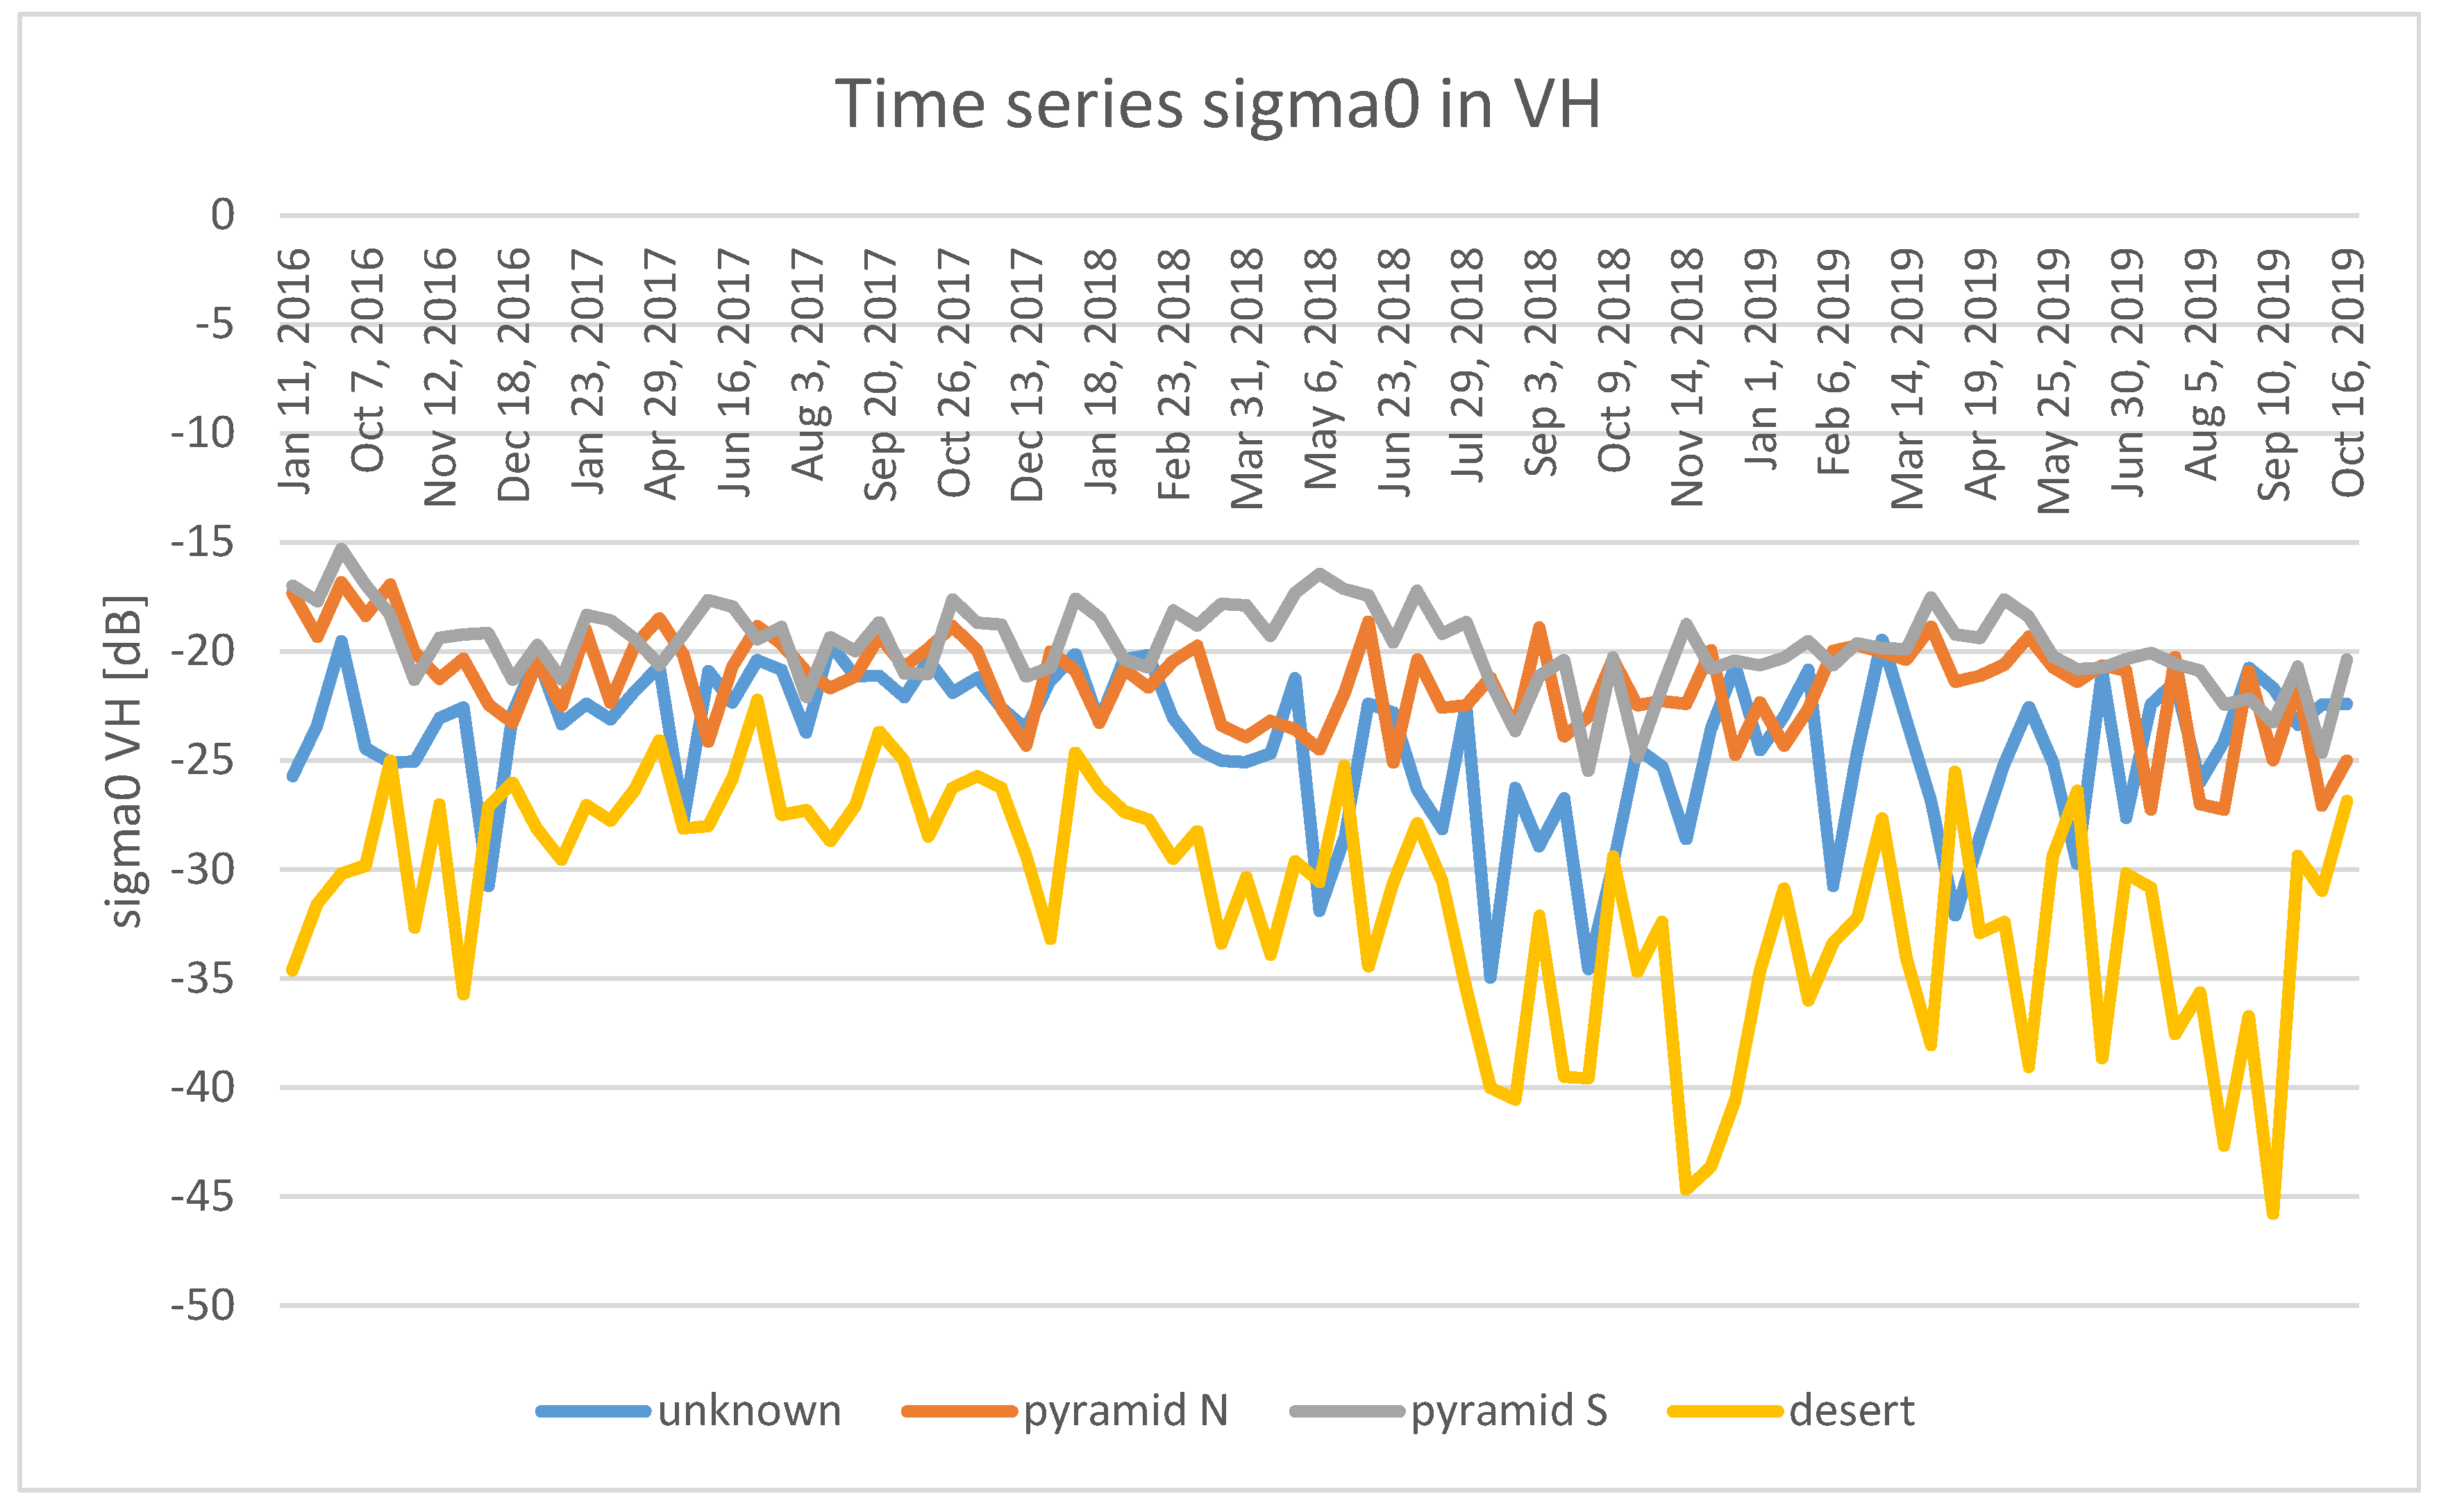
The backscatter analysis for the time series of Sentinel-1 images was performed for selected regions of interest (ROIs), as shown in Figure 19. The four ROIs used in this study were: northern and southern pyramid groups (pyramids N and pyramids S), desert and the “unknown” area, corresponding to the strong backscatter identified in the polarimetric analysis. Figure 20 and Figure 21 show the evolution radar backscatter values () in time for ROIs.
The backscatter sigma0 in VV channel (radar signal transmitted and received in Vertical-Vertical polarization) of the unknown target has a very similar temporal variation compared to the one from pyramids. That means that our target (not visible in surface) is able to return as much power as the pyramids (in surface) nearby. Signal level and its variation are similar for the unknown target and the two pyramids N and S.
Regarding the backscatter signal in the VH channel (radar signal transmitted and received in Vertical-Horizontal polarizations respectively) (see Figure 21), our unknown target reports values not as much similar to the pyramids as per the VV channel, but closer to the sandy desert. A possible explanation could be that our unknown target is buried, hence the sand attenuates the power received in the VH channel more than in the VV channel. Still our unknown target shows values slightly lower than the ones measured on the pyramids N and S and higher than the values measured over the desert area.
4. Discussion
The traditional, and still most reliable, validation method for archaeology is represented by ground truth surveys. Unfortunately, this is not always feasible due to local political and logistic constraints or specific permissions that should be conceded only by local institutions, and many World Heritage sites still needed to be monitored and protected all over the world. The case of Gebel Barkal archaeological area is an exceptional one. Since antiquity, it has been considered a sacred place to be preserved, where many international and local institutions, as well as universities, have had the opportunity to work onsite for excavations and topographic surveys.
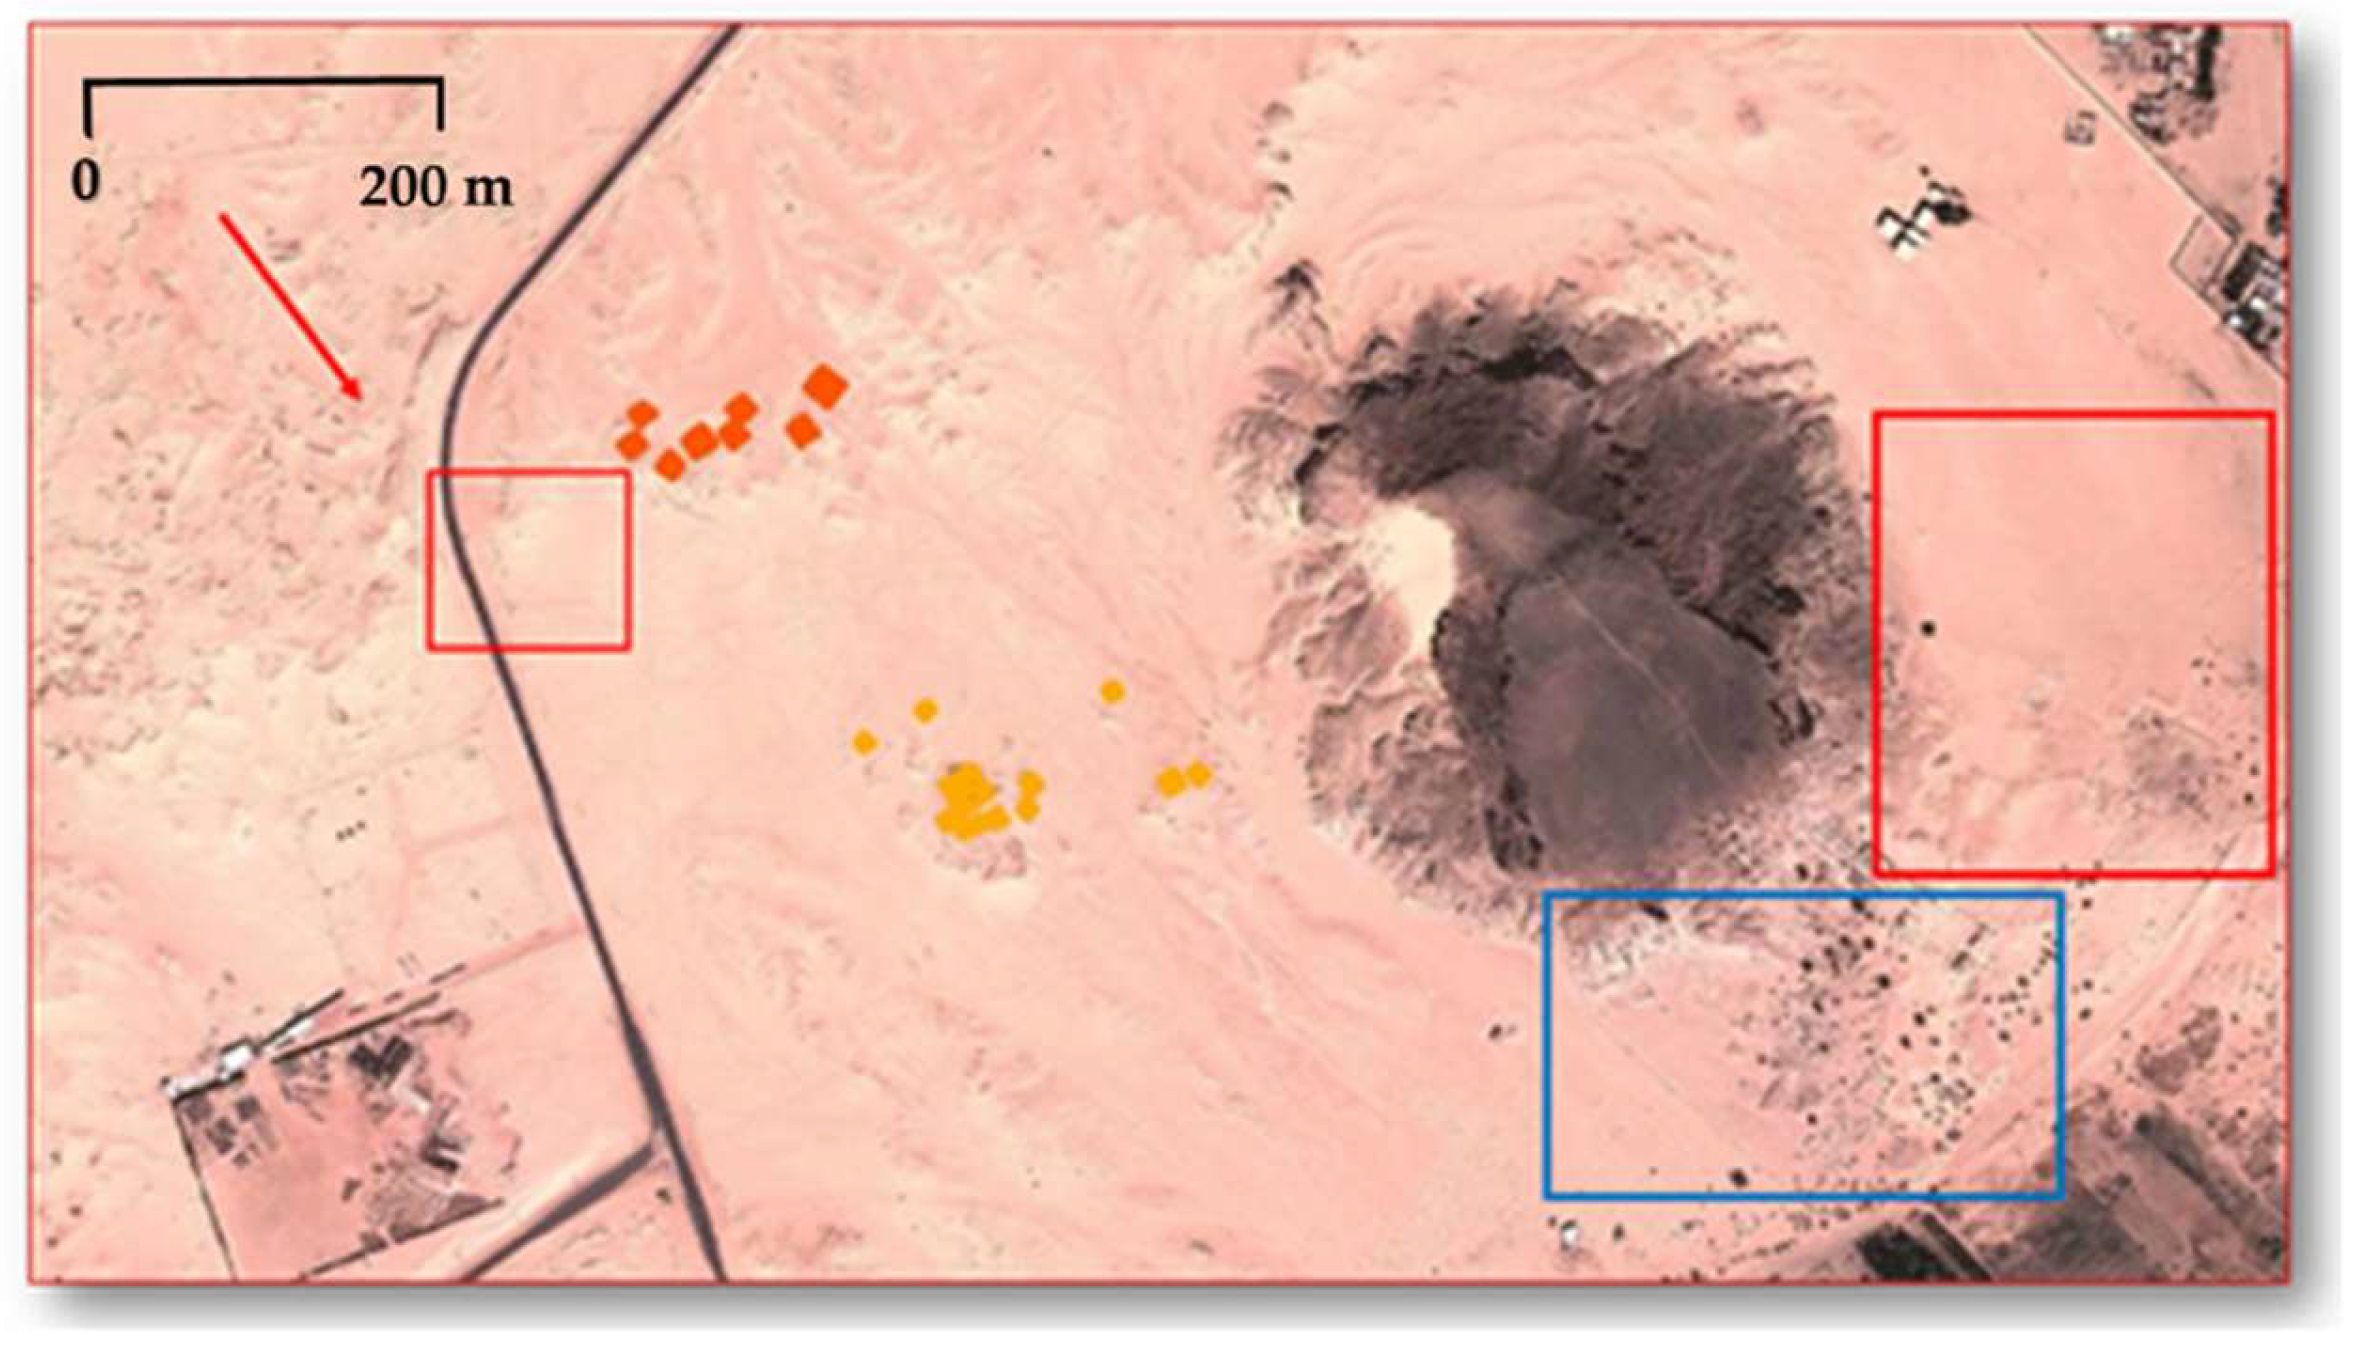
The most recent ground truth campaign we dispose of for the validation of the results obtained, is a ground truth campaign carried out in the frame of the November-December 2013 expedition held by Prof. E. Ciampini (University of Venice, Italy). A layout showing the area of the anomaly was provided to archaeologists, in order to assess the robustness of the results obtained from the polarimetric analysis (Figure 22).
Unfortunately, it is not possible to dispose a more recent ground truth campaign that can provide additional information on the current status of the archaeological area, and to validate what has been highlighted with the Sentinel-1 analysis.
The layout used by archaeologists in 2013 illustrated the area of the anomaly in a red square close to the NW group of pyramids, indicated by a red arrow. In the red square close to the Gebel we indicated the area of Italian excavations, while the blue square is the concession given to other international institutions. Based on the layout, Prof. E. Ciampini performed surface recognition by taking some photographs and analyzing the presence of archaeological finds in the surface stratum. Due to special permissions ruling the digging concessions and to local authority regulation, only a general survey of the area was carried out. In fact, it was possible to perform a closer surface investigation, although some photographs of the area give an overall idea of the kind of morphology and topography of the site.
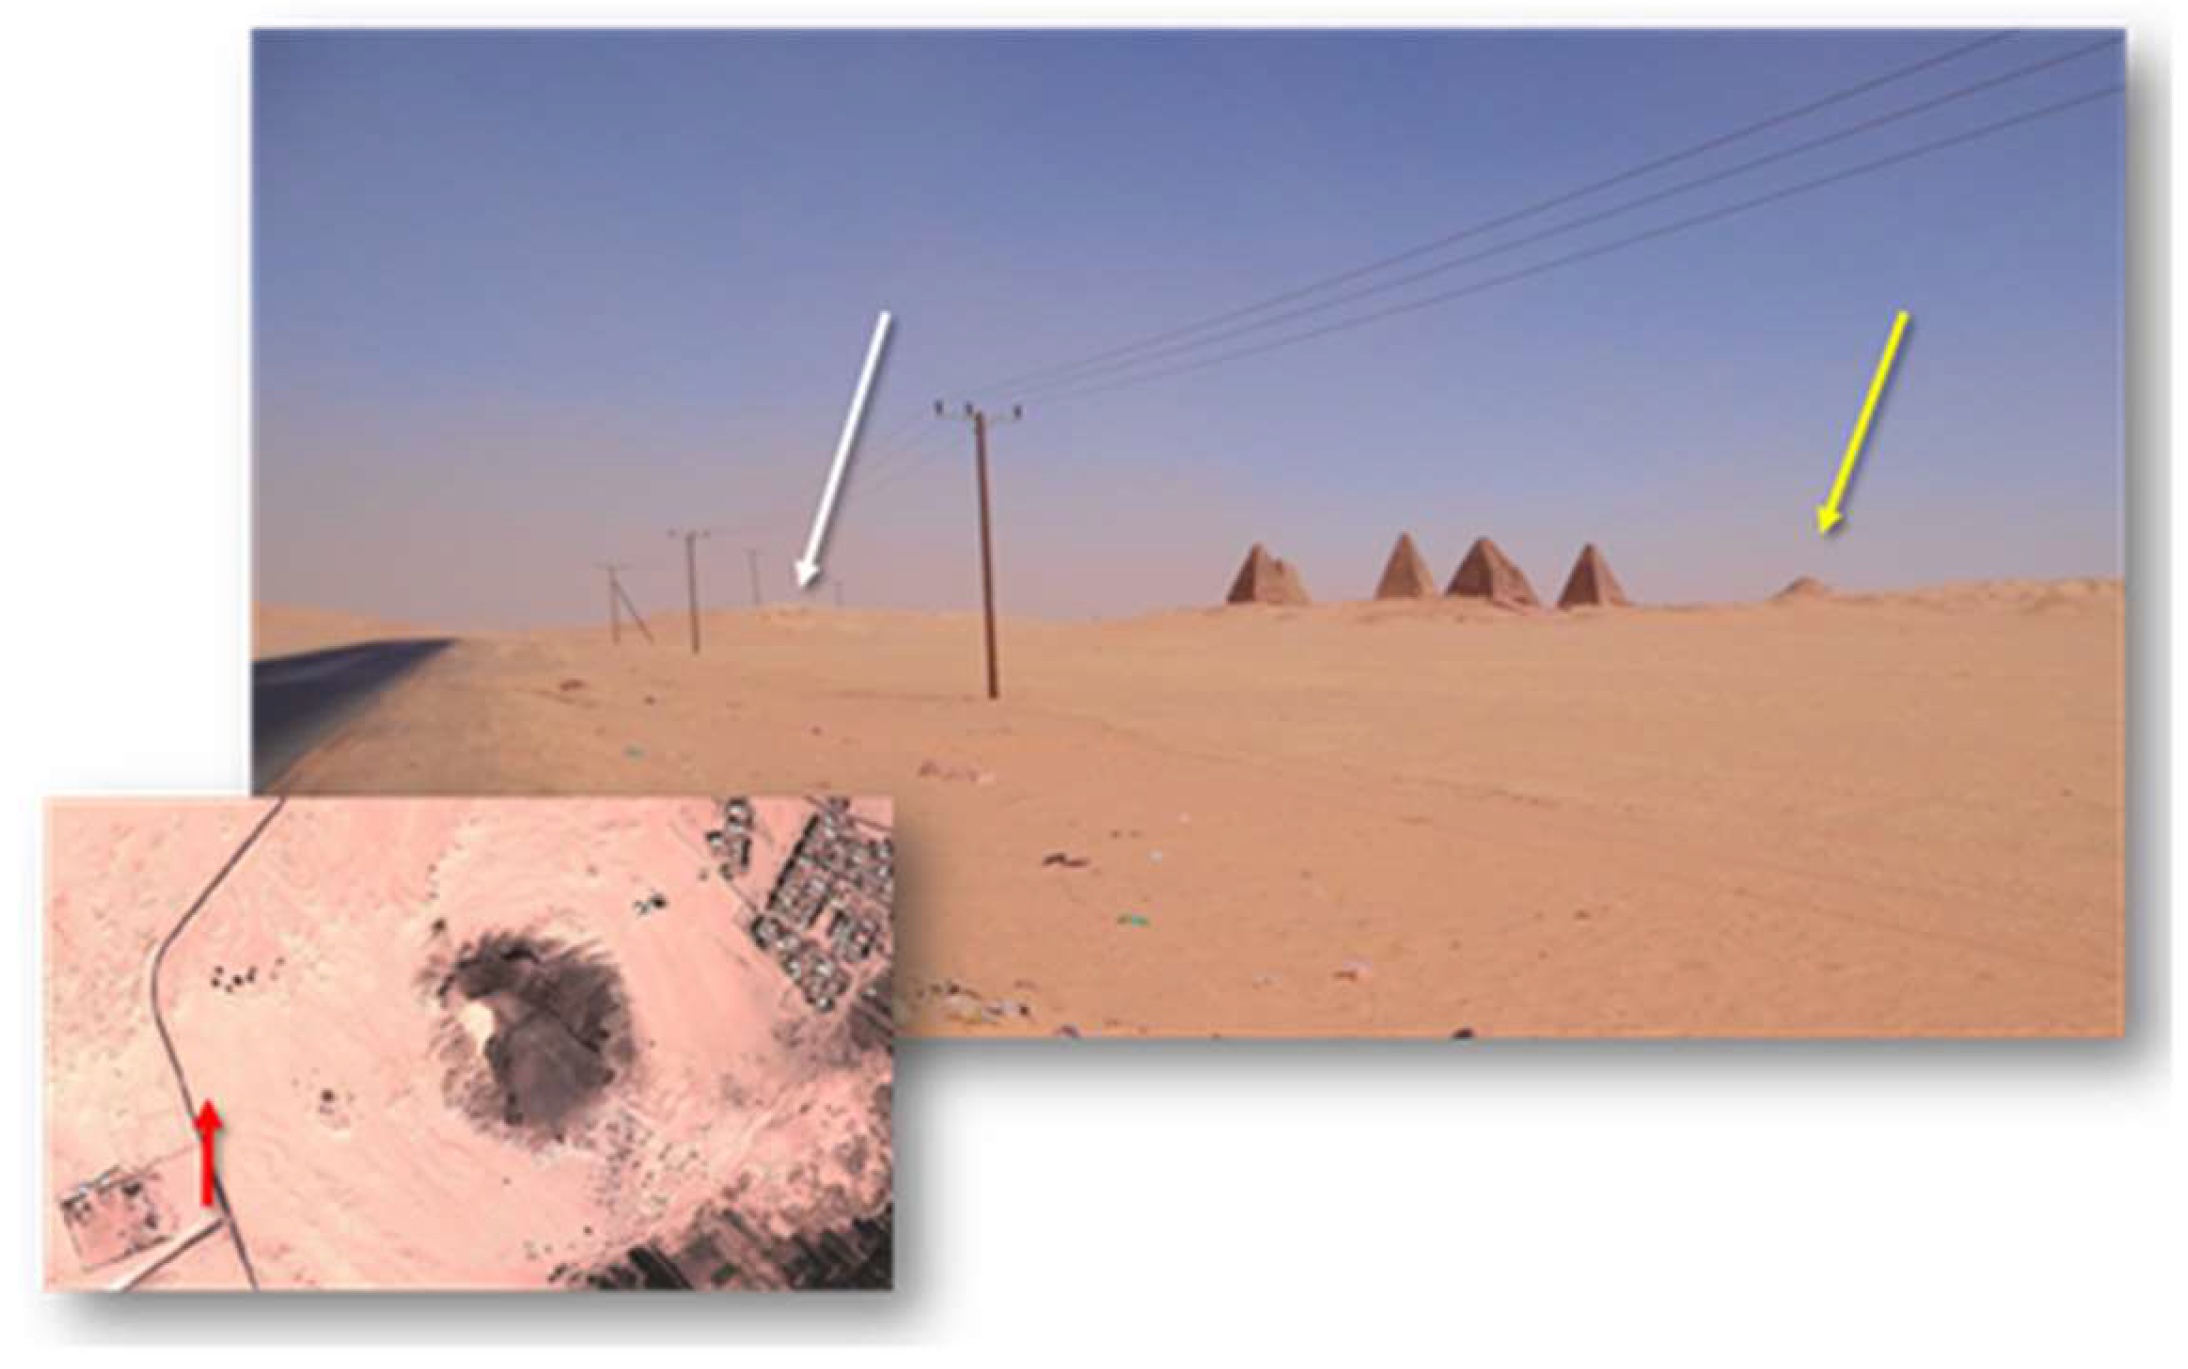
The picture in Figure 23, taken from the Southern part of the investigated area (red arrow), shows a wide view of the Royal Cemetery and of the area in which the anomaly detected by SAR polarimetric data has been noticed (white arrow). Unfortunately, lack of access to the site, closer view and more detailed pictures, it was complicated to define if some surface archaeological findings can be related to the presence of an archaeological feature in the ground. Moreover, it was evident that the morphology could influence the backscattering from that point. Nevertheless, what is important to remember is that the very soft building material of Gebel Barkal pyramids is heavily exposed to the severity of the local environment, thus creating the mounds of stones and sand visible as topographic reliefs (Figure 23, yellow arrow).
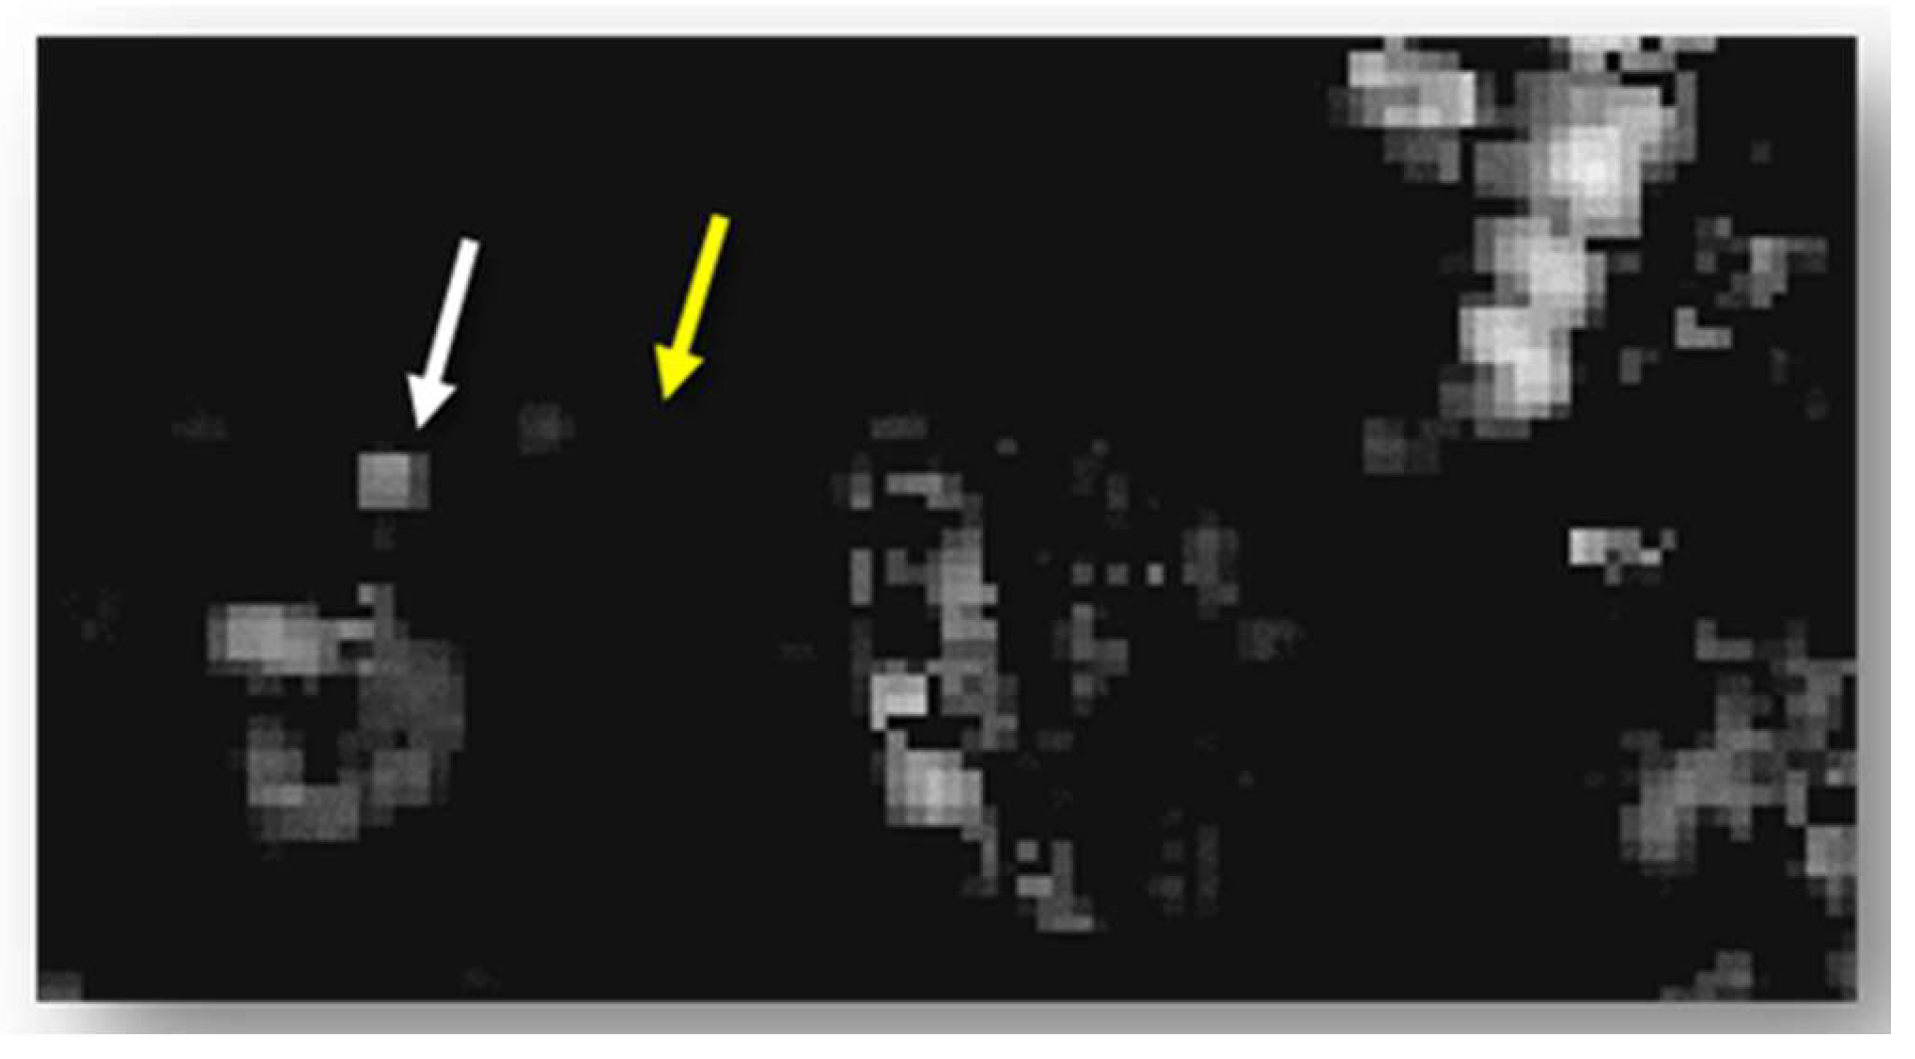
Still, the amplitude values observed for the unknown target (Figure 24, white arrow) were higher than the ones recorded for the morphological features (Figure 24, yellow arrow).
In order to validate all the results obtained through the multi-sensor analysis presented in this study, a new ground truth campaign will be proposed in the frame of future missions at the Gebel Barkal site.
5. Conclusions and Outlooks
The work described in this article inserts its contribution in the growing field of new technologies applied to traditional archaeological investigation. Aerial photography and photointerpretation knowledge have deeply influenced archaeological research, becoming the principal scientific investigation tools and then converging as the analysis of very high spatial resolution optical satellite images.
The use of SAR satellite data for archaeological investigations has been explored more and more in recent years, despite some initial limitations:
- -
- General complexity of data analysis and interpretation
- -
- Need of a specific technical knowledge for archaeologists
- -
- Inexistence of an automatic procedure designated to the recognition and extraction of archaeological features
- -
- Lack of visual communication between the well-known aerial photographs or optical data and SAR satellite data.
This work demonstrated how to use a complex but significant dataset composed of SAR full polarimetric and dual polarimetric acquisitions, with the purpose of identifying the most suitable earth observation technique for the identification of archaeological features in the UNESCO site of Gebel Barkal (Sudan).
The multi-frequency analysis between the two SAR polarimetric sensors ALOS PALSAR (L-band, central frequency: 1.25 GHz) and RADARSAT-2 (C-band, central frequency: 5.405 GHz), was carried out on data presenting a similar incidence angle configuration, 23.10°/26.7° and 27.6° respectively. In the polarimetric dataset used in this study, the persistence in time (2006/2013) of the unknown target detected in the SAR polarimetric images was confirmed, while any kind of surface archaeological feature was present in cartographical materials and optical images. The climate information relative to the acquisition dates did not report any precipitation phenomena, thus not affecting the wave interaction with soil.
What appears to be very interesting was the different contribution that ALOS PALSAR 26° acquisitions and RADARSAT-2 27° acquisitions gave to the observation of the archaeological area. Taking into account the fact that C-band is more sensitive to surface characteristics, and thanks to the higher spatial resolution provided, a more detailed visualisation of the overall scattering mechanisms was possible. On the other hand, it was difficult to distinguish the backscattering coming from the target identified in ALOS data. However, supposing the backscattering was due to the sand-stone topography of the site, we could have expected the same responses for all of the morphological evidence in the area, not only in RADARSAT-2 data, but also in ALOS PALSAR acquisitions, where the backscattering was, on the contrary, very well recognizable.
These considerations lead the study to assume that the ALOS PALSAR L-band deeply penetrated sand detecting a target in the ground, while RADARSAT-2 C-band lightly penetrated sand, detecting the same target, despite its lower penetration capabilities but thanks to the steeper observation incidence angle.
Including the analysis done with Sentinel-1 data together with the polarimetric analysis, we extend the capabilities of monitoring archaeological sites, almost in Near-Real Time (NRT), being very important for remote sites, or sites located in conflict zones. From our analysis done using the Sentinel-1 data we can conclude that the unknown target detected is a feature able to scatter as much signal as big objects present on the surface (in the VV channel), such as pyramids N and S, but in the VH channel the scattered signal is lower than the one from the objects visible on the surface, but higher than the signal reflected by sandy desert, as could be expected from a sandy-covered target.
The present research offers its original and challenging contribution to scientific non-invasive archaeological investigation, which represents, today, a very intense field with wide application. The scientific potential of the illustrated analysis fits perfectly with the current delicate needs of cultural heritage; such analysis demonstrates how multi-temporal and multi-data cultural heritage monitoring can be applied not only for documentation purposes, but can be addressed especially to those areas exposed to threats of different natures that require a constant and prompt intervention plans.
The next steps in this study will involve a wider multi-frequency and multi-incidence analysis with recent SAR polarimetric ALOS-2, which provides a flexible incidence angle configuration selection, a higher spatial resolution (10 m in the full-pol mode) compared to ALOS PALSAR, at the same wavelength (L-band), thus granting the same penetration capabilities in the ground. The multi-frequency approach will be expanded also to the X-band wavelength, already available with TerraSAR-X and Constellation of Small Satellites for Mediterranean basin Observation (COSMO Sky-Med) sensors. These last sensors provide a very high sensitivity to surface topography and a very high spatial resolution (up to 1 m) for archaeological investigation. A further and interesting study the two sensors can support, beyond the multi-frequency point of view, might be the evaluation of the different kind of information derivable from dual-polarimetric acquisitions compared to full-polarimetric acquisitions, with different and similar incidence angle observation modes.
Author Contributions
Conceptualization, J.P.; methodology, J.P.; J.M.D.B.; M.F.; software, J.M.D.B.; formal analysis, J.P.; investigation, J.P.; J.M.D.B.; M.F.; data curation, J.P.; writing—original draft preparation, J.P., M.F.; writing—review and editing, J.P.; M.F. and J.M.D.B.; visualization, J.P.; M.F. and J.M.D.B. supervision, J.P. All authors have read and agreed to the published version of the manuscript.
Funding
This research received no external funding.
Acknowledgments
Authors want to acknowledge the provisioning of the satellite data, i.e. ALOS PALSAR data, provided by the European Space Agency (ESA) and RADARSAT-2 data, provided by the GIS (Scientific Interest Group) BreTel (Bretagne Télédetection), the available KOMPSAT-2 image (ESA) and Google Earth acquisitions and a Quickbird image derived from the previous cartographic study conducted by L. Perotti in 2005 [19]. Additionally, this work contains modified Copernicus Sentinel-1 data [2016–2019]. Finally, special thanks to Eric Pottier for all the comments, guidance and support provided during all the period of this research.
Conflicts of Interest
The authors declare no conflict of interest.
References
- El-Baz, F.; Robinson, C.A.; Al-Saud, T.S.M. SAR images in geoarchaeology of Eastern Sahara. In Remote Sensing in Archaeology; Wisemann, J., El Baz, F., Eds.; Springer: Berlin, Germany, 2007; pp. 47–70. [Google Scholar]
- Blom, R.; Clapp, N.; Zarins, J.; Hedges, G. Space technology and the discovery of the lost city of Ubar. In Proceedings of the IEEE Aerospace Conference, Snowmass, CO, USA, 13–13 February 1997. [Google Scholar]
- Xinqiao, L.; Huadong, G.; Yun, S. Detection of the Great Wall using SIR-C data in north-western China. In Proceedings of the 1997 IEEE International Geoscience and Remote Sensing Symposium Proceedings. Remote Sensing—A Scientific Vision for Sustainable Development, Singapore, 3–8 August 1997. [Google Scholar]
- Moore, E.; Freeman, T.; Hensley, S. Spaceborne and airborne SAR at Angkor. Introducing new technology to the ancient site. In Remote Sensing in Archaeology; Wiseman, J., El Baz, F., Eds.; Springer: Berlin, Germany, 2007; pp. 185–216. ISBN 10-0-387-44615-X. [Google Scholar]
- Cigna, F.; Tapete, D.; Lasaponara, R.; Masini, N. Amplitude change detection with ENVISAT ASAR to Image the Cultural Landscape of the Nazca region, Peru. In Archaeological Prospection; Wiley Online Library: Hoboken, NJ, USA, 2013; Volume 20, pp. 117–131. [Google Scholar] [CrossRef]
- Masini, N.; Lasaponara, R. Satellite Synthetic Aperture Radar in Archaeology and Cultural Landscape: An Overview. In Archaeological Prospection; Wiley Online Library: Hoboken, NJ, USA, 2013; Volume 20. [Google Scholar] [CrossRef]
- Stewart, C.; Eliezer, O.; Cohen Sasson, E. Satellite Remote Sensing Analysis of the Qasrawet Archaeological Site in North Sinai. Remote Sens. 2018, 10, 1090. [Google Scholar] [CrossRef] [Green Version]
- UNESCO. Djebel Barkal and the Sites of the Napatan Region, Description. Available online: http://whc.unesco.org/en/list/1073/ (accessed on 20 October 2019).
- Kendall, T.K. Napatan Temples: A Case Study from Gebel Barkal. The Mythological Nubian Origin of Egyptian Kingship and the Formation of the Napatan State. In Proceedings of the 10th International Conference of Nubian Studies, Rome, Italy, 9–14 September 2002. [Google Scholar]
- Société des Culture Nubiennes—Archaeological Site—Gebel Barkal. Available online: http://nubie-international.fr/accueil.php?a=page163010 (accessed on 20 October 2019).
- Worrall, G.A. A simple introduction to the geology of the Sudan. In Sudan Notes and Records; University of Khartoum: Khartoum, Sudan, 1957; Volume 38, pp. 2–9. [Google Scholar]
- Ulaby, T.; Moore, K.; Fung, K. Microwave Remote Sensing. In Microwave Remote Sensing Fundamentals and Radiometry; Artech House: Norwood, MA, USA, 1981; Volume 1. [Google Scholar]
- Stewart, C.; Montanaro, R.; Sala, M.; Riccardi, P. Feature Extraction in the North Sinai Desert Using Spaceborne Synthetic Aperture Radar: Potential Archaeological Applications. Remote Sens. 2016, 8, 825. [Google Scholar] [CrossRef] [Green Version]
- Gaber, A.; Koch, M.; Griesh, M.H.; Sato, M.; El-Baz, F. Near-surface imaging of a buried foundation in the Western Desert, Egypt, using space-borne and ground penetrating radar. J. Archaeol. Sci. 2013, 40, 1946–1955. [Google Scholar] [CrossRef]
- Chen, F.; Masini, N.; Liu, J.; You, J.; Lasaponara, R. Multi-frequency satellite radar imaging of cultural heritage: The case studies of the Yumen Frontier Pass and Niya ruins in the Western Regions of the Silk Road Corridor. Int. J. Digit. Earth 2016, 9, 1224–1241. [Google Scholar] [CrossRef]
- Linck, R.; Busche, T.; Buckreuss, S.; Fassbinder, J.W.; Seren, S. Possibilities of Archaeological Prospection by High-resolution X-band Satellite Radar—A Case Study from Syria. Archaeol. Prospect. 2013, 20, 97–108. [Google Scholar] [CrossRef]
- Elachi, C.; Granger, J. Spaceborne imaging radars probe “in depth”. IEEE Spectr. 1982, 19, 24–29. [Google Scholar] [CrossRef]
- GIS Bretel Bretagne Télédétection. Available online: http://recherche.telecom-bretagne.eu/bretel (accessed on 10 February 2014).
- PolSARpro Software. Available online: http://earth.eo.esa.int/polsarpro/ (accessed on 20 January 2017).
- Borgogno Mondino, E.; Perotti, L.; Piras, M. High resolution satellite images for archaeological applications: The Karima case study (Nubia region, Sudan). Eur. J. Remote Sens. 2012, 45, 243–259. [Google Scholar] [CrossRef] [Green Version]
- Lee, J.S.; Pottier, E. Polarimetric Radar Imaging: From Basics to Applications; Taylor & Francis Group: Boca Raton, FL, USA, 2009; ISBN 978-1-4200-5497-2. [Google Scholar]
- Freeman, A.; Durden, S. A three-component scattering model to describe polarimetric SAR data. In Proceedings of the SPIE Conference Radar Polarimetry, San Diego, CA, USA, 19–21 July 1992; Volume SPIE-1748, pp. 213–225. [Google Scholar]
- Freeman, A.; Durden, S.L. A Three-Component Scattering Model for Polarimetric SAR Data. IEEE Trans. Geosci. Remote Sens. 1998, 36. [Google Scholar] [CrossRef] [Green Version]
- Singh, J.; Yamaguchi, Y.; Park, S.E. General four-component scattering power decomposition with unitary transformation of coherency matrix. IEEE Trans. Geosci. Remote Sens. 2013, 51. [Google Scholar] [CrossRef]
- Gorelick, N.; Hancher, M.; Dixon, M.; Ilyushchenko, S.; Thau, D.; Moore, R. Google Earth Engine: Planetary-scale geospatial analysis for everyone. Remote Sens. Environ. 2017, 202, 18–27. [Google Scholar] [CrossRef]
- Weather Online, Karima, History. Available online: http://www.weatheronline.co.uk (accessed on 3 June 2019).
Figure 1.
Gebel Barkal archaeological site © Google Earth.

Figure 2.
Gebel Barkal and the sites of the Napatan region © UNESCO.

Figure 3.
The Holy Mountain and the temple of Amun (B1500). © Max Farrar.

Figure 4.
Pyramids at Gebel Barkal (Courtesy of L. Perotti).

Figure 5.
Archaeological area of Gebel Barkal, Sudan: wide view (a) and arcaheological area (b).

Figure 6.
Erosion pebble conglomerate © Max Farrar.

Figure 7.
Left image illustrates the Pauli decomposition RGB image: |Shh + Svv| |Shh − Svv| |Shv|. Right image shows the Google Earth image available for 2006.
Figure 7.
Left image illustrates the Pauli decomposition RGB image: |Shh + Svv| |Shh − Svv| |Shv|. Right image shows the Google Earth image available for 2006.

Figure 8.
Model-based Freeman decomposition. fSB, fDB and fvs represent Freeman-Durden components for single bounce, double bounce and volume scattering respectively, represented in blue, red and green colors. Plane is contained in normal direction to the line-of-sight of the satellite.
Figure 8.
Model-based Freeman decomposition. fSB, fDB and fvs represent Freeman-Durden components for single bounce, double bounce and volume scattering respectively, represented in blue, red and green colors. Plane is contained in normal direction to the line-of-sight of the satellite.

Figure 9.
Model-based Yamaguchi 4 component decomposition.

Figure 10.
Yamaguchi Y4O (top), Yamaguchi Y4R (middle) and Yamaguchi G4U1 (bottom) decomposition RGB images.
Figure 10.
Yamaguchi Y4O (top), Yamaguchi Y4R (middle) and Yamaguchi G4U1 (bottom) decomposition RGB images.

Figure 11.
Diagram listing pre-processing steps of ground range detected (GRD) scenes in Google Earth Engine (GEE).
Figure 11.
Diagram listing pre-processing steps of ground range detected (GRD) scenes in Google Earth Engine (GEE).

Figure 12.
ALOS PALSAR Pauli RGB (left: 2006; rigth: 2009) and KOMPSAT-2 overlay.

Figure 13.
ALOS PALSAR Yamaguchi RGB images ((a): 2006; (b): 2009). Top, middle and bottom figures correspond to Y4O, Y4R and GU41 Yamaguchi decomposition respectively.
Figure 13.
ALOS PALSAR Yamaguchi RGB images ((a): 2006; (b): 2009). Top, middle and bottom figures correspond to Y4O, Y4R and GU41 Yamaguchi decomposition respectively.

Figure 14.
G4U1 decomposition single channels 2006 (a) and 2009 (b) acquisitions. Double bounce (top); single bounce (middle); volume scattering (bottom).
Figure 14.
G4U1 decomposition single channels 2006 (a) and 2009 (b) acquisitions. Double bounce (top); single bounce (middle); volume scattering (bottom).

Figure 15.
Pauli RGB decomposition ((a): 04/2012, (b): 11/2012, (c): 01/2013, (d): 07/2013) overlaid with Google Earth image (11/2012).
Figure 15.
Pauli RGB decomposition ((a): 04/2012, (b): 11/2012, (c): 01/2013, (d): 07/2013) overlaid with Google Earth image (11/2012).

Figure 16.
Yamaguchi G4U1 decomposition RGB image ((a): 2012/04/28, (b): 2012/11/06, (c): 2013/01/17, (d): 2013/07/07).
Figure 16.
Yamaguchi G4U1 decomposition RGB image ((a): 2012/04/28, (b): 2012/11/06, (c): 2013/01/17, (d): 2013/07/07).

Figure 17.
Incident wave on the pyramids.

Figure 18.
Yamaguchi G4U1 decomposition: double bounce (top), single bounce (middle) and volume scattering (bottom) for each acquisition date: 04/2012 (a), 11/2012 (b), 01/2013 (c), 07/2013 (d).
Figure 18.
Yamaguchi G4U1 decomposition: double bounce (top), single bounce (middle) and volume scattering (bottom) for each acquisition date: 04/2012 (a), 11/2012 (b), 01/2013 (c), 07/2013 (d).


Figure 19.
Regions of interest (ROIs) in the archaeological area of Jebel Barkal.

Figure 20.
Radar backscatter values ( in VV) evolution for ROIs.

Figure 21.
Radar backscatter values () evolution for ROIs.

Figure 22.
Layout performed in the GIS project with the representation of excavations areas and the anomaly.
Figure 22.
Layout performed in the GIS project with the representation of excavations areas and the anomaly.

Figure 23.
Gebel Barkal investigated area. Courtesy of E. Ciampini (Dec, 2013).

Figure 24.
Yamaguchi decomposition. High amplitude values recorded for the anomaly (white arrow).


Table 1.
Acquisition dates of the polarimetric data from ALOS PALSAR and RADARSAT-2.
| ALOS PALSAR | RADARSAT-2 |
|---|---|
| 2006/08/14 | 2012/04/28 |
| 2012/11/06 | |
| 2009/11/05 | 2013/01/17 |
| 2013/07/04 |
Table 2.
Characteristics of the dual polarisation data from SENTINEL-1 A/B.
| SENTINEL-1 | |
|---|---|
| Start date | 11/01/2016 |
| Stop date | 16/10/2019 |
| Orbit path | descending |
| Track | 94 |
| Incident angle [degrees] | 35.5 |
| Number of images | 85 |
Table 3.
Yamaguchi 4 components decomposition single channels amplitude values.
| Date | θ | G4U1_Dbl | G4U1_Odd | G4U1_Vol |
|---|---|---|---|---|
| 2006/08/14 | 26.70° | −16.99 dB | −10.97 dB | −20 dB |
| 2009/11/05 | 23.10° | −13.01 dB | −6.77 dB | −16.99 dB |
Table 4.
Yamaguchi G4U1 decomposition single channels amplitude values.
| Date | θ | G4U1_Dbl | G4U1_Odd | G4U1_Vol |
|---|---|---|---|---|
| 2012/04/28 | 27.6° | −16.99 dB | −4.97 dB | −20 dB |
| 2012/11/06 | 27.6° | −16.99 dB | −8.24 dB | −20 dB |
| 2013/01/17 | 27.6° | −15.23 dB | −5.68 dB | −20 dB |
| 2013/07/04 | 27.6° | −16.99 dB | −8.54 dB | −16.99 dB |
© 2019 by the authors. Licensee MDPI, Basel, Switzerland. This article is an open access article distributed under the terms and conditions of the Creative Commons Attribution (CC BY) license (http://creativecommons.org/licenses/by/4.0/).
Share and Cite
MDPI and ACS Style
Patruno, J.; Fitrzyk, M.; Delgado Blasco, J.M. Monitoring and Detecting Archaeological Features with Multi-Frequency Polarimetric Analysis. Remote Sens. 2020, 12, 1. https://doi.org/10.3390/rs12010001
AMA Style
Patruno J, Fitrzyk M, Delgado Blasco JM. Monitoring and Detecting Archaeological Features with Multi-Frequency Polarimetric Analysis. Remote Sensing. 2020; 12(1):1. https://doi.org/10.3390/rs12010001
Chicago/Turabian StylePatruno, Jolanda, Magdalena Fitrzyk, and Jose Manuel Delgado Blasco. 2020. "Monitoring and Detecting Archaeological Features with Multi-Frequency Polarimetric Analysis" Remote Sensing 12, no. 1: 1. https://doi.org/10.3390/rs12010001
Note that from the first issue of 2016, this journal uses article numbers instead of page numbers. See further details here.