Ground and Volume Decomposition as a Proxy for AGB from P-Band SAR Data


1
Aresys, Via Flumendosa 16, 20132 Milan, Italy
2
Dipartimento di Elettronica Informazione e Bioingegneria, Politecnico di Milano, 20133 Milan, Italy
*
Author to whom correspondence should be addressed.
Remote Sens. 2020, 12(2), 240; https://doi.org/10.3390/rs12020240
Submission received: 30 October 2019
/
Revised: 3 January 2020
/
Accepted: 7 January 2020
/
Published: 10 January 2020
(This article belongs to the Special Issue Selected Papers from the Polarimetric Interferometric SAR Workshop 2019)
Abstract
:In this work, the role of volume scattering obtained from ground and volume decomposition of P-band synthetic aperture radar (SAR) data as a proxy for biomass is investigated. The analysis here presented originates from the BIOMASS L2 activities, part of which were focused on strengthening the physical foundations of the SAR-based retrieval of forest above-ground biomass (AGB). A critical analysis of the observed strong correlation between tomographic intensity and AGB is done in order to propose simplified AGB proxies to be used during the interferometric phase of BIOMASS. In particular, the aim is to discuss whether, and to what extent, volume scattering obtained from ground/volume decomposition can provide a reasonable alternative to tomography. To do this, both are tested on P-band data collected at Paracou during the TropiSAR campaign and cross-validated against in-situ AGB measurements. Results indicate that volume backscattered power as obtained by ground/volume decomposition is weakly correlated to AGB, notwithstanding different solutions for volume scattering are tested, and support the conclusion that forest structure actually plays a non-negligible role in AGB retrieval in dense tropical forests.

1. Introduction
The retrieval of biomass and forest characteristics from remote sensing data is one of the main topics of interest within the remote-sensing community, especially in this moment due to pressing concerns about climate change and pollution [1]. Forests have a major role in the carbon cycle, as they act as a sink for approximately one-third of one-third of CO coming from the combustion of fossil fuels. Human activities such as land use and deforestation have a negative impact due to the consequent release of carbon into the atmosphere.
Since in-situ measurements of biomass and forest characteristics involve costly procedures and have limited spatial and temporal coverage by definition, significant efforts were made over the last decades to design and test remote-sensing techniques to this aim. Among the classic and well consolidated approaches, light detection and ranging (LiDAR) sensors are typically flown from airborne platforms over forests, collecting both digital terrain model (DTM) and canopy height model (CHM) data [2]. From CHM and tree information such as wood density and above ground biomass (AGB in Mg/ha=t/ha) can then be estimated through empirical allometric equations [3]. Various studies propose combining forest height estimation from LiDAR with other earth observation (EO) measurements, i.e., optical and microwave imagery [4]. In many recent studies, time series of synthetic aperture radar (SAR) data are analyzed to estimate biomass and its change over time from radar backscatter, for instance [5]. Based on the scientific evidence from local campaigns, dedicated spaceborne missions have been designed by space agencies in response to the urgent need of monitoring the health status of the forests of our planet: Global Ecosystem Dynamics Investigation Lidar (GEDI) from NASA [6], already operational, the forthcoming NASA-ISRO Synthetic Aperture Radar (NISAR) [7], and the forthcoming European Space Agency (ESA) BIOMASS [8].
SAR, in particular, is a very interesting option for forest monitoring compared to LiDAR and optical, being an active sensor with all-weather day and night operating capabilities. Local studies were conducted at different frequency bands in order to assess potential for biomass and height retrieval and notable results were obtained both at higher and lower frequencies. At higher frequencies, inversion schemes from single pass interferometry combined with the use of LiDAR DTM were designed to retrieve forest parameters according to simple scattering models like the random volume over ground (RVoG) [9,10,11]. AGB is subsequently estimated by regressing a combination of retrieved parameters. The necessity of combination of more parameters for regression and integration with other sources such as LiDAR is motivated both by the complexity of forest structure and limited penetration of higher frequencies into the medium. For this reason terrain scattering contributions are often very limited, except when there are canopy gaps, and LiDAR DTM is used to compensate the ground interferometric phase so that forest height can be correctly estimated with respect to ground. Lower frequencies, on the converse, suffer less from attenuation and can capture more easily the entire forest structure so that direct inversion of SAR backscatter can be attempted. Among the main methodologies tested: Polarimetric power index of some form accounting for topographic correction was regressed against reference data using a power law [12,13]; a physics-based approach based on a semi-empirical scattering model [14], accounting for direct surface scattering, double bounce between tree and ground, and volume scattering. The main cons in these methods were the limited set of topographic and environmental conditions for which they were valid and the need of a substantial amount of reference data to train them.
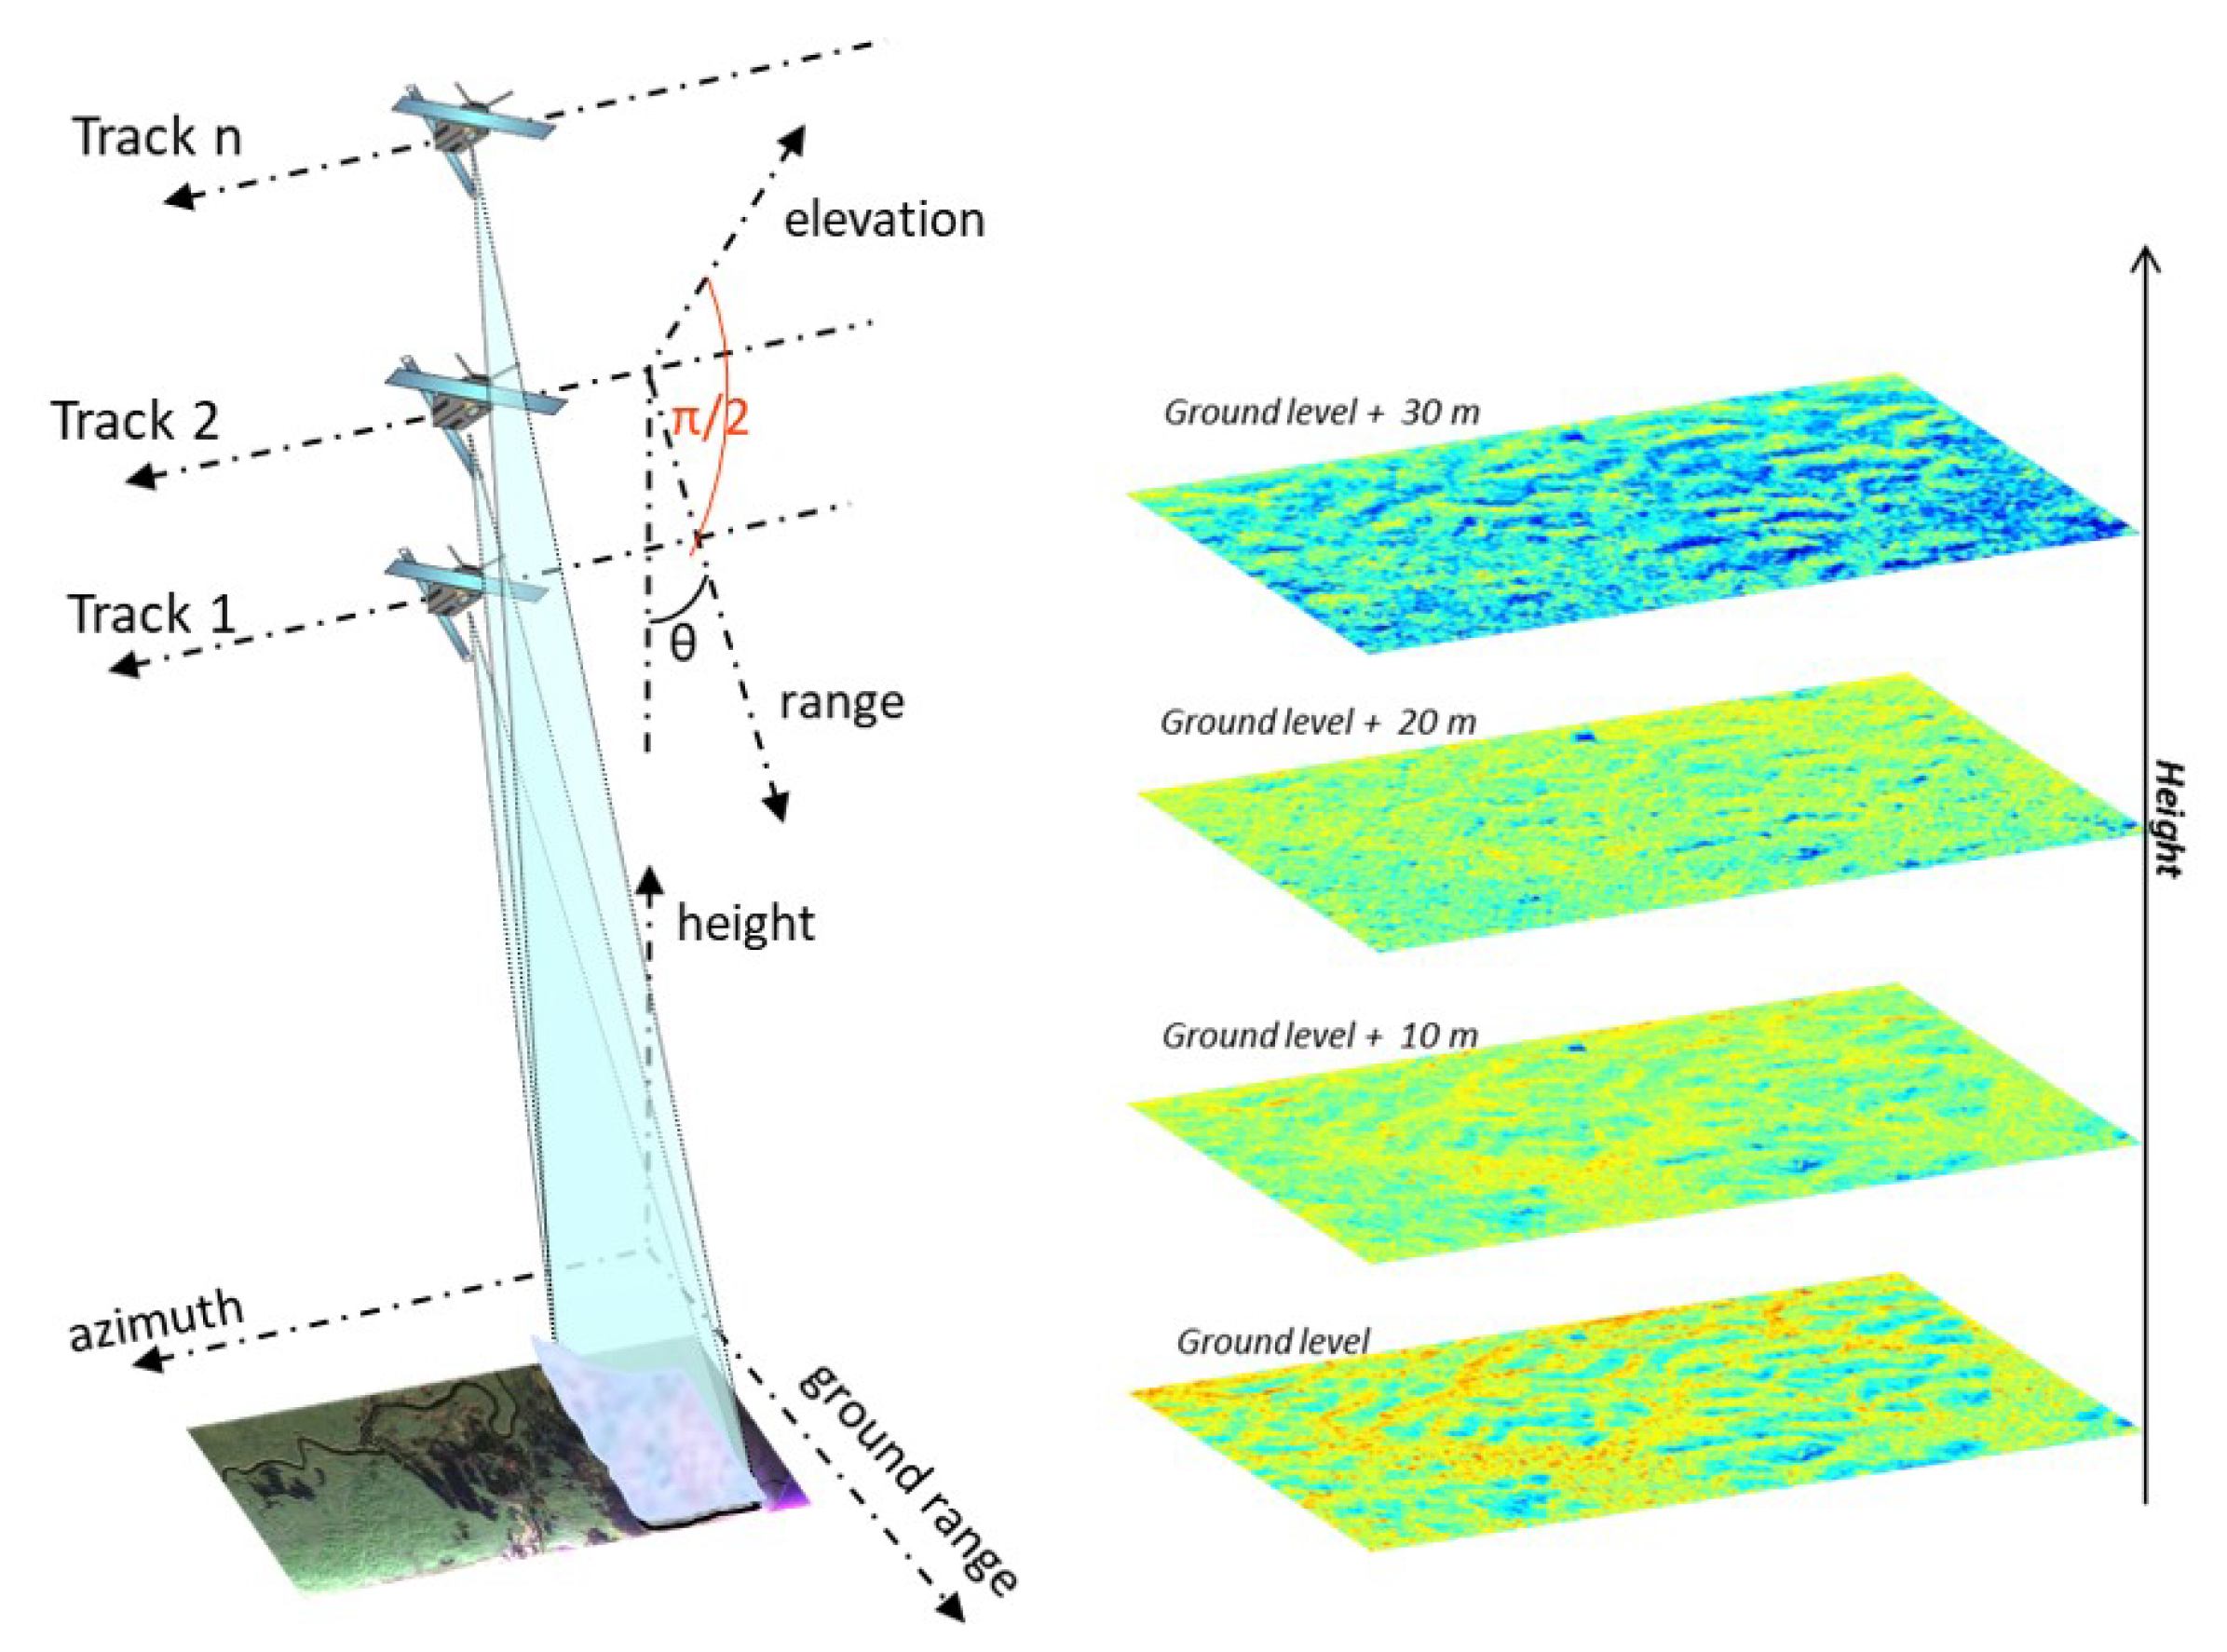
SAR tomography (TomoSAR) is an extension of standard SAR imaging from 2D to 3D. By coherently combining several acquisitions of the same area with slightly different viewing direction in elevation (or equivalently separated by an interferometric baseline), a synthetic antenna in the elevation direction is formed as well as in azimuth [15]. The acquisitions must be phase calibrated, i.e., all the platform inaccuracies and atmospheric disturbances must be compensated for the phase of the data to correspond just to the geometric sensor-to-target distance [16]. The knowledge of precise terrain topography allows focusing the signal at a specific height with respect to the terrain rather than in an absolute reference, resulting in the generation of intensity maps associated with a specific height inside the vegetation layer [16]. Precise DTM can be estimated from multi-baseline data themselves thanks to the long wavelength [17]. An example of tomographic focusing is shown in Figure 1.
TomoSAR will be one the main innovations characterizing the BIOMASS mission, allowing the ability to single out returns from different layers of the forest canopy. The BIOMASS tomographic phase [18] will provide the first global coverage during the first 14 months of operations, by collecting seven ascending and seven descending passes with 3-days repeat pass time, designed to maintain coherency at P-band [19]. Thanks to the long wavelength of about 70 cm it will be possible not only to characterize electromagnetic interactions of radar waves with the forest structure and generate AGB maps over tropical biomes, but also to generate a global map of terrain topography below the vegetation layer (DTM) [17] and subsurface features [20,21]. Previous studies reported that a TomoSAR intensity of 30 m canopy layer in dense tropical forests is strongly correlated to AGB [22,23,24], whereas the ground scattering alone is poorly correlated to biomass. In particular, the correlation between P-band tomographic intensity maps and AGB (available from in-situ surveys) was studied for the two tropical sites of Paracou and Nourages, in French Guiana [22,23]. Results from those studies clearly indicate that:
- 2D SAR intensity is poorly correlated to AGB;
- TomoSAR intensity at 0 m is poorly and negatively correlated to AGB;
- TomoSAR intensity at 15 m is poorly correlated with AGB;
- TomoSAR intensity at 30 m is highly correlated to AGB and follows a log-linear relation for AGB values from 250 to 450 t/ha.
The relation between TomoSAR intensity at 30 m and AGB becomes more and more accurate by aggregating plots at a larger scale. The correlation coefficient is defined as:
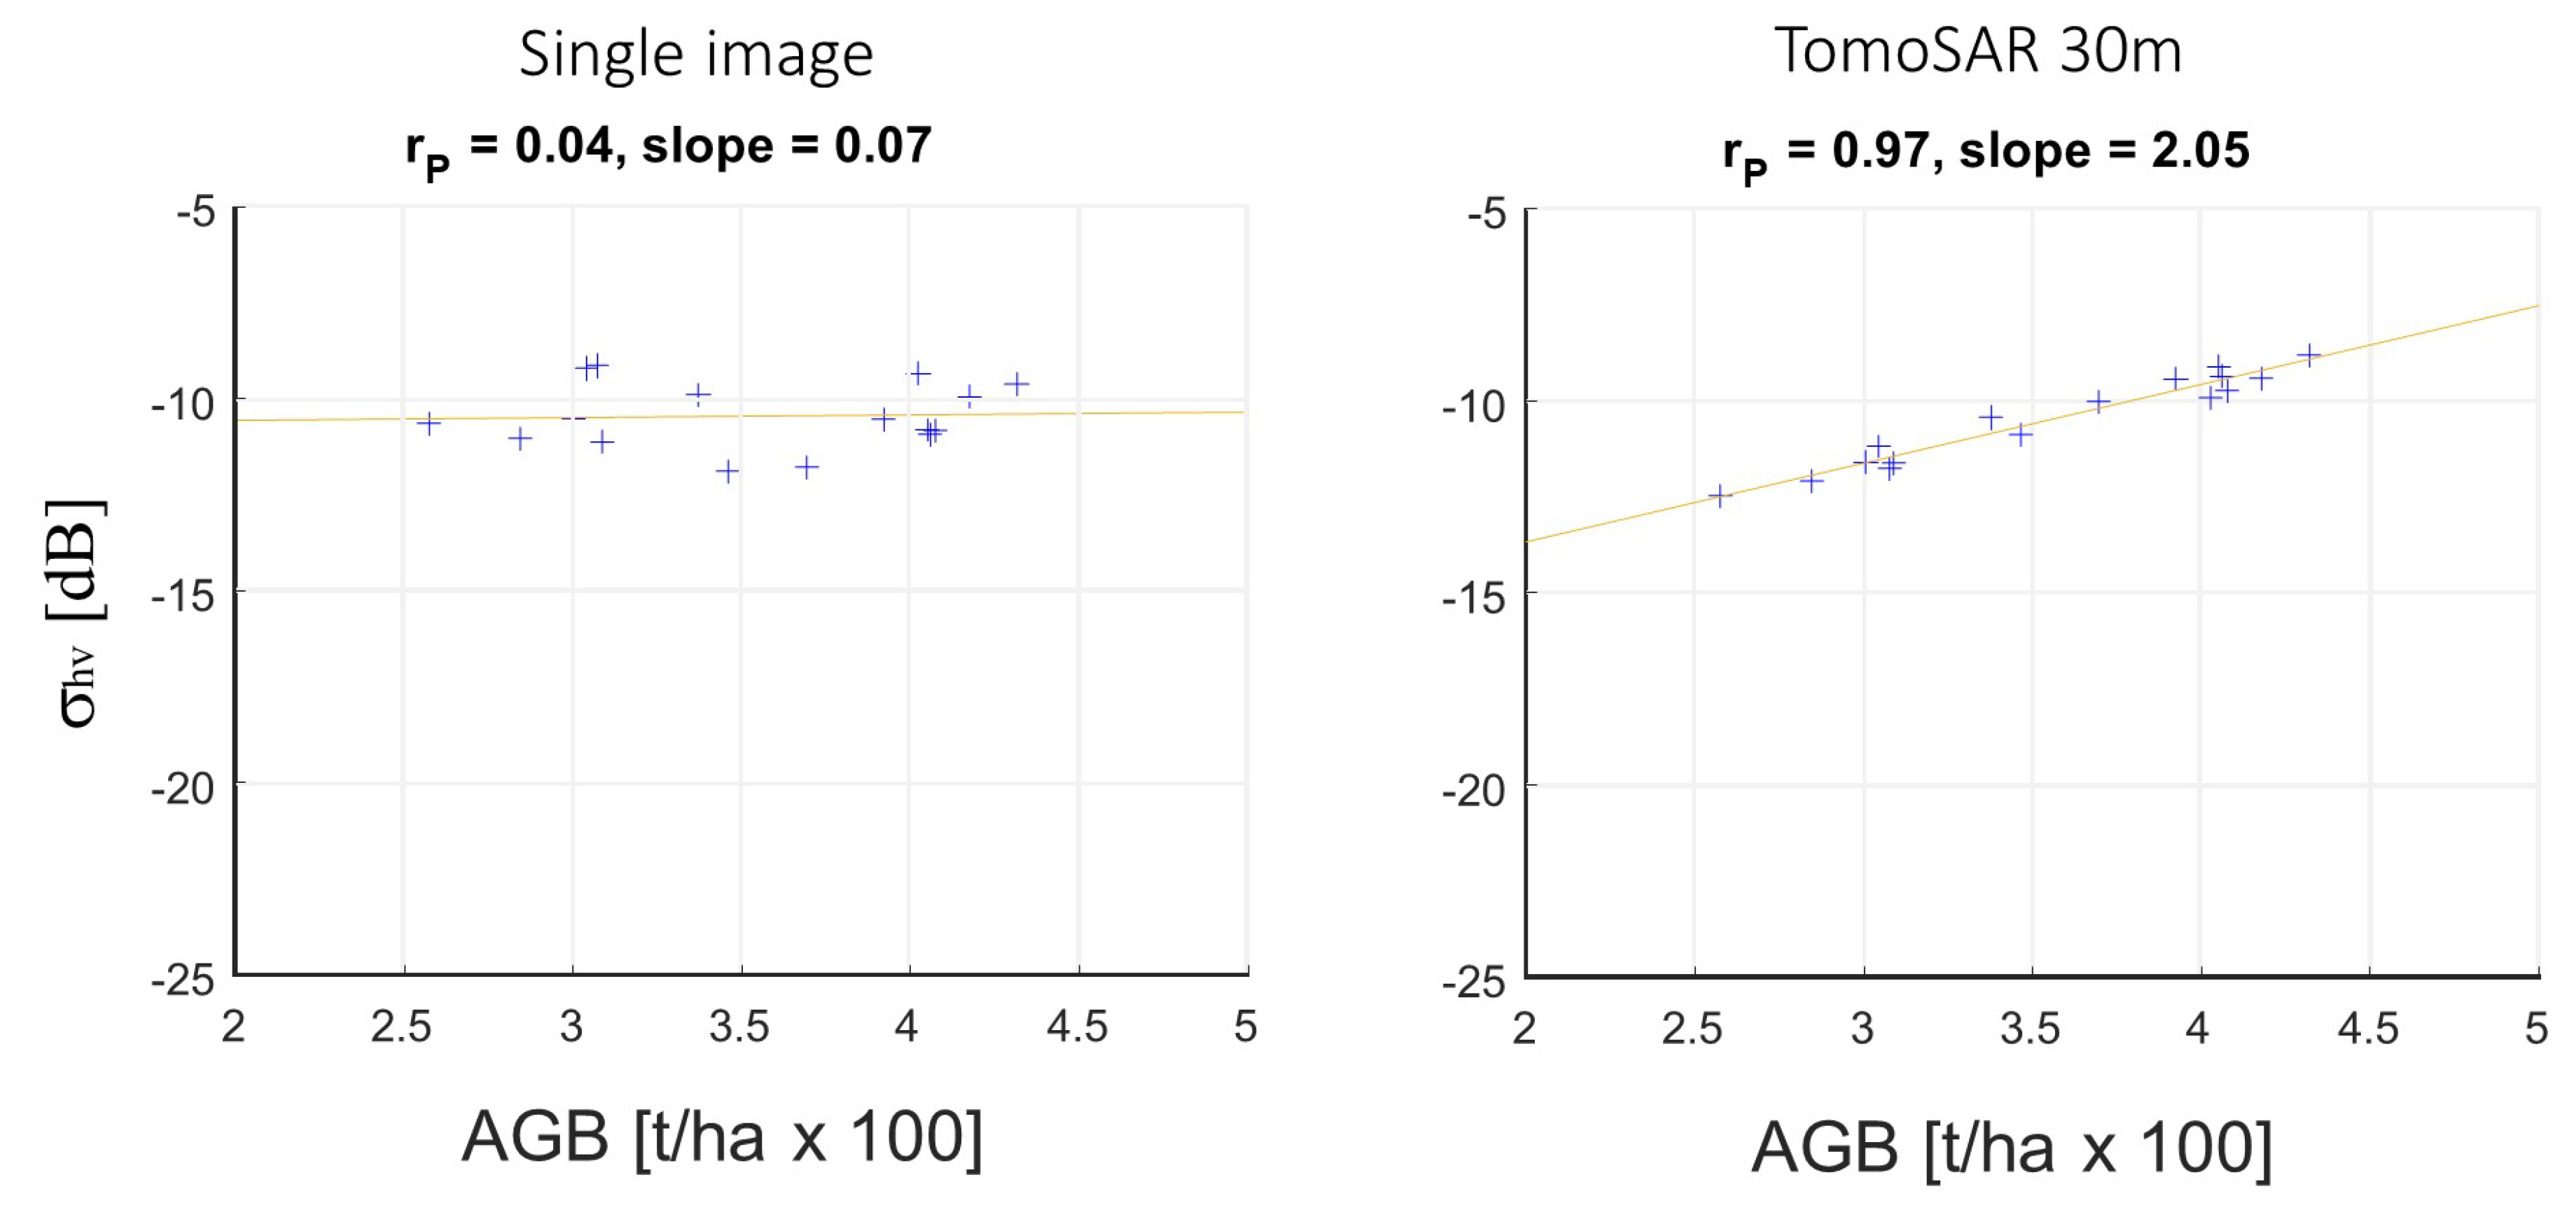
where the symbol represents the average, being the backscatter. = 0.97 for plot sizes of about 6 ha, as shown in Figure 2 for the HV channel, which is the most sensitive to volumetric contributions.
Correlation between tomographic intensity at 30 m and AGB gave the same results also in the African tropical forests of Lope, Rabi, and Mondah [24]. All the results obtained so far at five tropical forest sites in South America and equatorial Africa clearly indicate that tomographic intensity at 30 m is dramatically more correlated with AGB than 2D SAR intensity. The observed sensitivity expressed as was found to be about 50 Mg/ha per dB across the range of AGB values from about 200 to 500 t/ha. These findings are supported by recent ecological studies in dense tropical forests revealing that: Correlation between AGB and the area occupied at different heights by large trees (as derived from LiDAR) is maximal at a height of about 30 m [25]; about one-third of the total volume tends to be concentrated at the same height above the ground [26]. These results are further confirmed by the prediction obtained with the TROLL ecological model that for dense tropical forests the fraction of biomass contained between 20 m and 40 m accounts for about 35% to 40% of the total AGB. This relation is stable over a large range of AGB values from 250 to 700 t/ha [27]. It has to be remarked however that the relevance of the layer of vegetation around 30 m holds for dense tropical forests. In other types of forests with completely different structure this is likely not true anymore, as the most representative layer height may be different [24,28].
The positive relation between the 30 m layer and AGB is also explained due to the vertical resolution determined by the total baseline aperture. If sufficient (such is the case of Paracou data, having a vertical resolution of about 20 m), by focusing on the canopy layer, TomoSAR gives good rejection of ground scattering (terrain scattering and tree-terrain double bounce). This is determined by a complex set of factors other than forest biomass like local terrain slope, soil moisture, presence of nearby trees, and understory (especially at Paracou, power returning from the ground layer is strongly determined by multiple scattering from vegetation-to-ground interactions). In the absence of specific knowledge about local terrain and vegetation features, complex modeling and extensive reference data would be required for these factors to be related to AGB in an operational context [14,29].
During the main interferometric phase of the duration of about 5 years [24], however, BIOMASS will collect only three ascending and three descending passes to provide global coverage with ground/volume decomposition polarimetric–interferometric techniques (PolInSAR) [30,31]. The rationale of ground/volume decomposition based on single baseline polarimetric and interferometric data is very well known in literature: The assumption of random volume over ground (RVoG) model [32] allows linking the variation of the interferometric coherence with polarization to the physical parameters associated with ground and volume scattering, which include forest height, extinction, as well as to the total backscattered power associated with ground-only and volume-only scattering. The performance of such a decomposition is in principle quite robust to interferometric height of ambiguity variations and topographic slopes, conditional on the residual non-volumetric decorrelation contributions and number of looks used for estimation [33].
In this work the role of volume scattering obtained from P-band interferometric SAR as a proxy for retrieving AGB is investigated. Results here presented originate from the BIOMASS L2 study [34], aimed at defining and implementing the tomographic and interferometric processors of the BIOMASS mission. Part of the activities of the study were focused on strengthening the physical basis of SAR-based retrieval of forest above ground biomass. Critical analysis of the observed strong correlation between tomographic intensity and AGB is done in order to discuss whether, and to what extent, ground/volume decomposition can provide a reasonable alternative to tomography during the interferometric phase of BIOMASS. To do this, both are tested based on the P-band data collected at the forest site of Paracou, French Guiana, during the TropiSAR campaign, and cross-validated against in-situ AGB measurements in terms of correlation and sensitivity of the retrievals.
2. Paracou Data
The analysis is carried out in Paracou, South America from TropiSAR data [12], for which reliable and representative in-situ measurements were available. Paracou in French Guiana (5 18’ N, 52 55’ W) is characterized by a mostly hilly topography and high AGB range with a mean value of 345 t/ha (with a dispersion of 73 t/ha). According to the forest census of all trees with diameter at breast height (DBH) of >10 cm, Paracou is a lowland moist forest with 140–200 species per hectare.
The acquisition campaign took place between August and September 2009 and the processed data stack comprises six full-polarimetric acquisitions acquired on 24 August 2009 and separated by an approximately constant vertical baseline of 15 m. P-band SAR data were collected by ONERA airborne system SETHI with a bandwidth of 335–460 MHz and the resolution is about 1 m in slant range and 1.245 m in azimuth direction. The trajectory flown is lower than the reference line (3962 m) with a vertical shift of 15, 30, 45, 60, and 75 m, respectively. The resulting Fourier vertical resolution is about 20 m, the forest height ranges from 20 m to over 40 m with the average value being about 28 m, whereas height of ambiguity is always above twice the forest height.
In-situ surveys provided 16 aggregated ground plots, one of which having size 25 ha, the rest being 6.25 ha. The AGB data were estimated converting the measured dimensions (DBH, total tree height, and wood density) into AGB for each tree with allometric equations. All individual trees with a diameter of >10 cm have been measured. TropiSAR data including in-situ data are available through the ESA EOPI portal (http://eopi.esa.int).
3. Methodology
3.1. Model-Based Analysis of Tomographic Intensities
From an electromagnetic point of view the observed loss of sensitivity of tomographic intensities below 30 m to AGB could be explained by an extinction factor, leading to formulate the hypothesis that all tomographic intensities (except at ground level) could provide information about AGB once attenuation is properly compensated for. To test this hypothesis the following simplified model of backscatter as a function of height z for each range-azimuth pixel can be assumed:
where represents the Dirac delta-function. The model parameters are: , the ground backscattering coefficient (including surface and double-bounce scattering); the volumetric backscattering coefficient for the vegetation layer in m; , the forest top height; , the local incidence angle; , the one-way wave extinction. The main assumption of this model is that both and are locally homogeneous, which is consistent with the RVoG model [30,35]. This model can be inverted from the observed tomographic intensities, which allows studying the correlation of each parameter to AGB.
3.2. Ground/Volume Decomposition
The goal of ground/volume decomposition is to retrieve the physical properties associated with total volume scattering, i.e., without any height-dependent cancellation effect. Since P-band suffer less from attenuation and can capture more easily the entire forest structure than higher frequencies, it is interesting to study the correlation of total volume scattering to AGB. The concept of ground/volume decomposition is based on the assumption that the set of all correlations obtained from polarimetric and interferometric data can be modeled as:
where:
- is the expected correlation between the SLC (single look complex) image in pass n and polarization and the SLC image in pass m and polarization ;
- and are the polarimetric correlations of ground and volume scattering in polarizations and polarization ;
- and are the interferometric coherences of ground and volume scattering in passes n and m.
Based on Equation (3), ground/volume decomposition can be implemented in two ways:
- by casting the problem into an algebraic point of view, which leads to the algebraic synthesis technique [35].
These two approaches lead to different results if more than two interferometric passes are employed, in which case the algebraic synthesis implements more algebraic constraints. However, in the single-baseline case the algebraic synthesis provides the same results as PolInSAR (up to differences related to algorithm implementation) [35,36]. As this section is focused on the use of single-baseline data, no longer distinction is made between these two approaches.
A fundamental aspect of the ground/volume decomposition problem is that multiple solutions are possible, meaning that different combinations of ground and volume coherences and polarimetric correlations exist that result in exactly the same correlation between any SLC data pair [35,36]. However, different solutions correspond to different physical properties in terms of vertical structure and polarimetric signature of ground and volume scattering, which provide further constraints to identify a unique solution. For single baseline data, a simple geometrical representation of the solutions is provided by considering the geometrical locus of the interferometric coherence of ground and volume scattering in the complex plane [30,31,35]. An example is provided in Figure 3.
To understand the physical properties of different solutions it is important to recall that the algebraic structure of model Equation (3) implies interdependence between the interferometric coherence of a scattering mechanism and the polarimetric correlations of the other up to a scaling factor. In particular, it can be shown that increasing the coherence magnitude of ground scattering is equivalent to increasing the polarimetric entropy of volume scattering, and vice versa. As in [35,36], four characteristic solutions are identified by considering the inner and outer ends of the two segments in Figure 3. The physical features of these four solutions are:
- Outer ground solution: point-like ground structure and high entropy volume polarimetry;
- Inner ground solution: distributed ground structure and low/medium entropy volume;
- Outer volume solution: point-like volume structure and high entropy ground polarimetry;
- Inner volume solution: distributed volume structure and low/medium entropy ground polarimetry.
The outer ground solution is quite often retained in the literature [33], as it corresponds to two physically-based assumptions, i.e., ground scattering is geometrically localized at a specific elevation, and volume scattering is highly entropic. The inner ground solution implies instead distributed ground structure and low entropy volume scattering, which is not physically justified. The outer volume solution is not physically justified either, since volume scattering is supposed to be distributed along elevation, and ground scattering should not be highly entropic. The inner volume solution is physically justified, and often retained in the literature [33].
4. Results
4.1. Tomography
The role of Equation (2) was tested by evaluating the correlation of different model parameters with in-situ AGB (Table 1). is estimated from data so as to have a number of independent looks >100. Note that radiometric quantities are always expressed using HV sigma naught, which was obtained by considering local terrain slope in ground range [12].
The parameters that provide the best correlation with AGB are forest height (correlation = 0.62, sensitivity = 42 t/ha per m defined as ) and the product between forest height and volumetric backscattering (correlation = 0.76, sensitivity = 86 t/ha per dB), which represent the integrated volume backscatter without extinction. Interestingly, the total volume backscatter (with extinction) is observed not to be significantly correlated with AGB (correlation = 0.19, sensitivity = 400 t/ha per dB). This clearly confirms expectation that wave extinction (and forest height) has to be accounted for when evaluating backscattering from the vegetation. Nonetheless, none of the parameters tested in Table 1 was observed to provide the same level of correlation and sensitivity as 30 m tomographic intensity (correlation = 0.97, sensitivity = 50 t/ha per dB).
4.2. Ground/Volume Decomposition
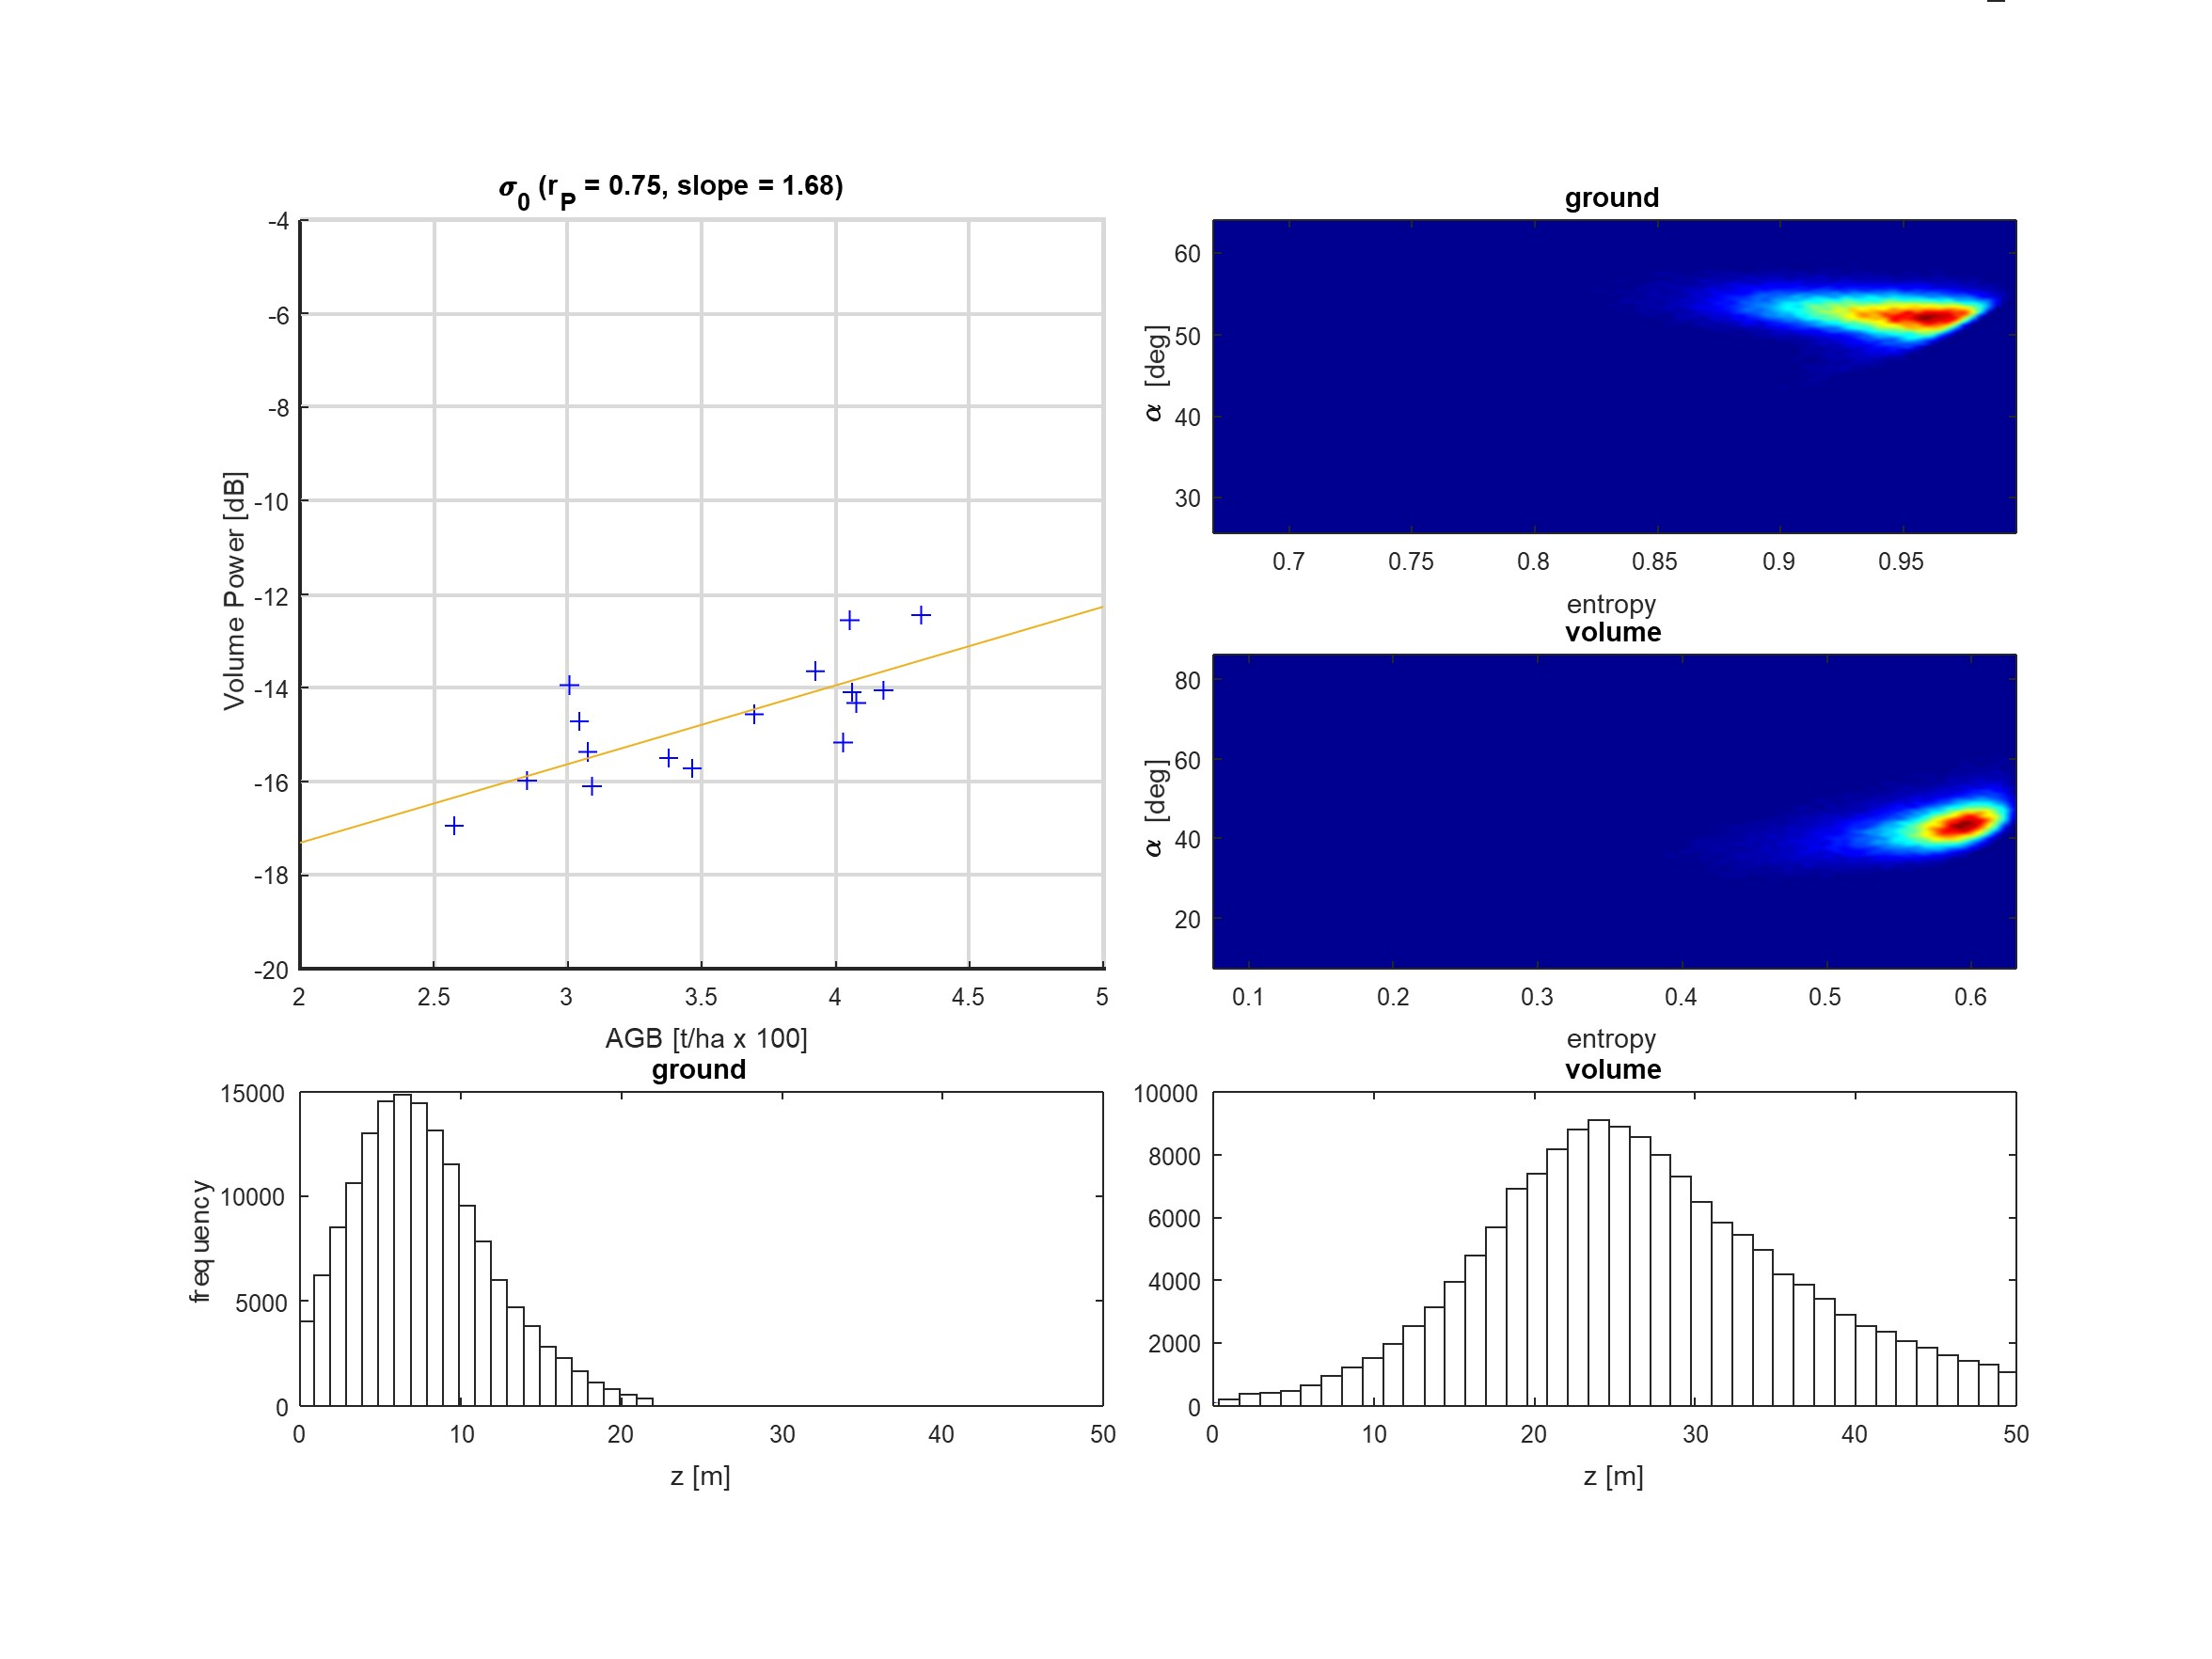
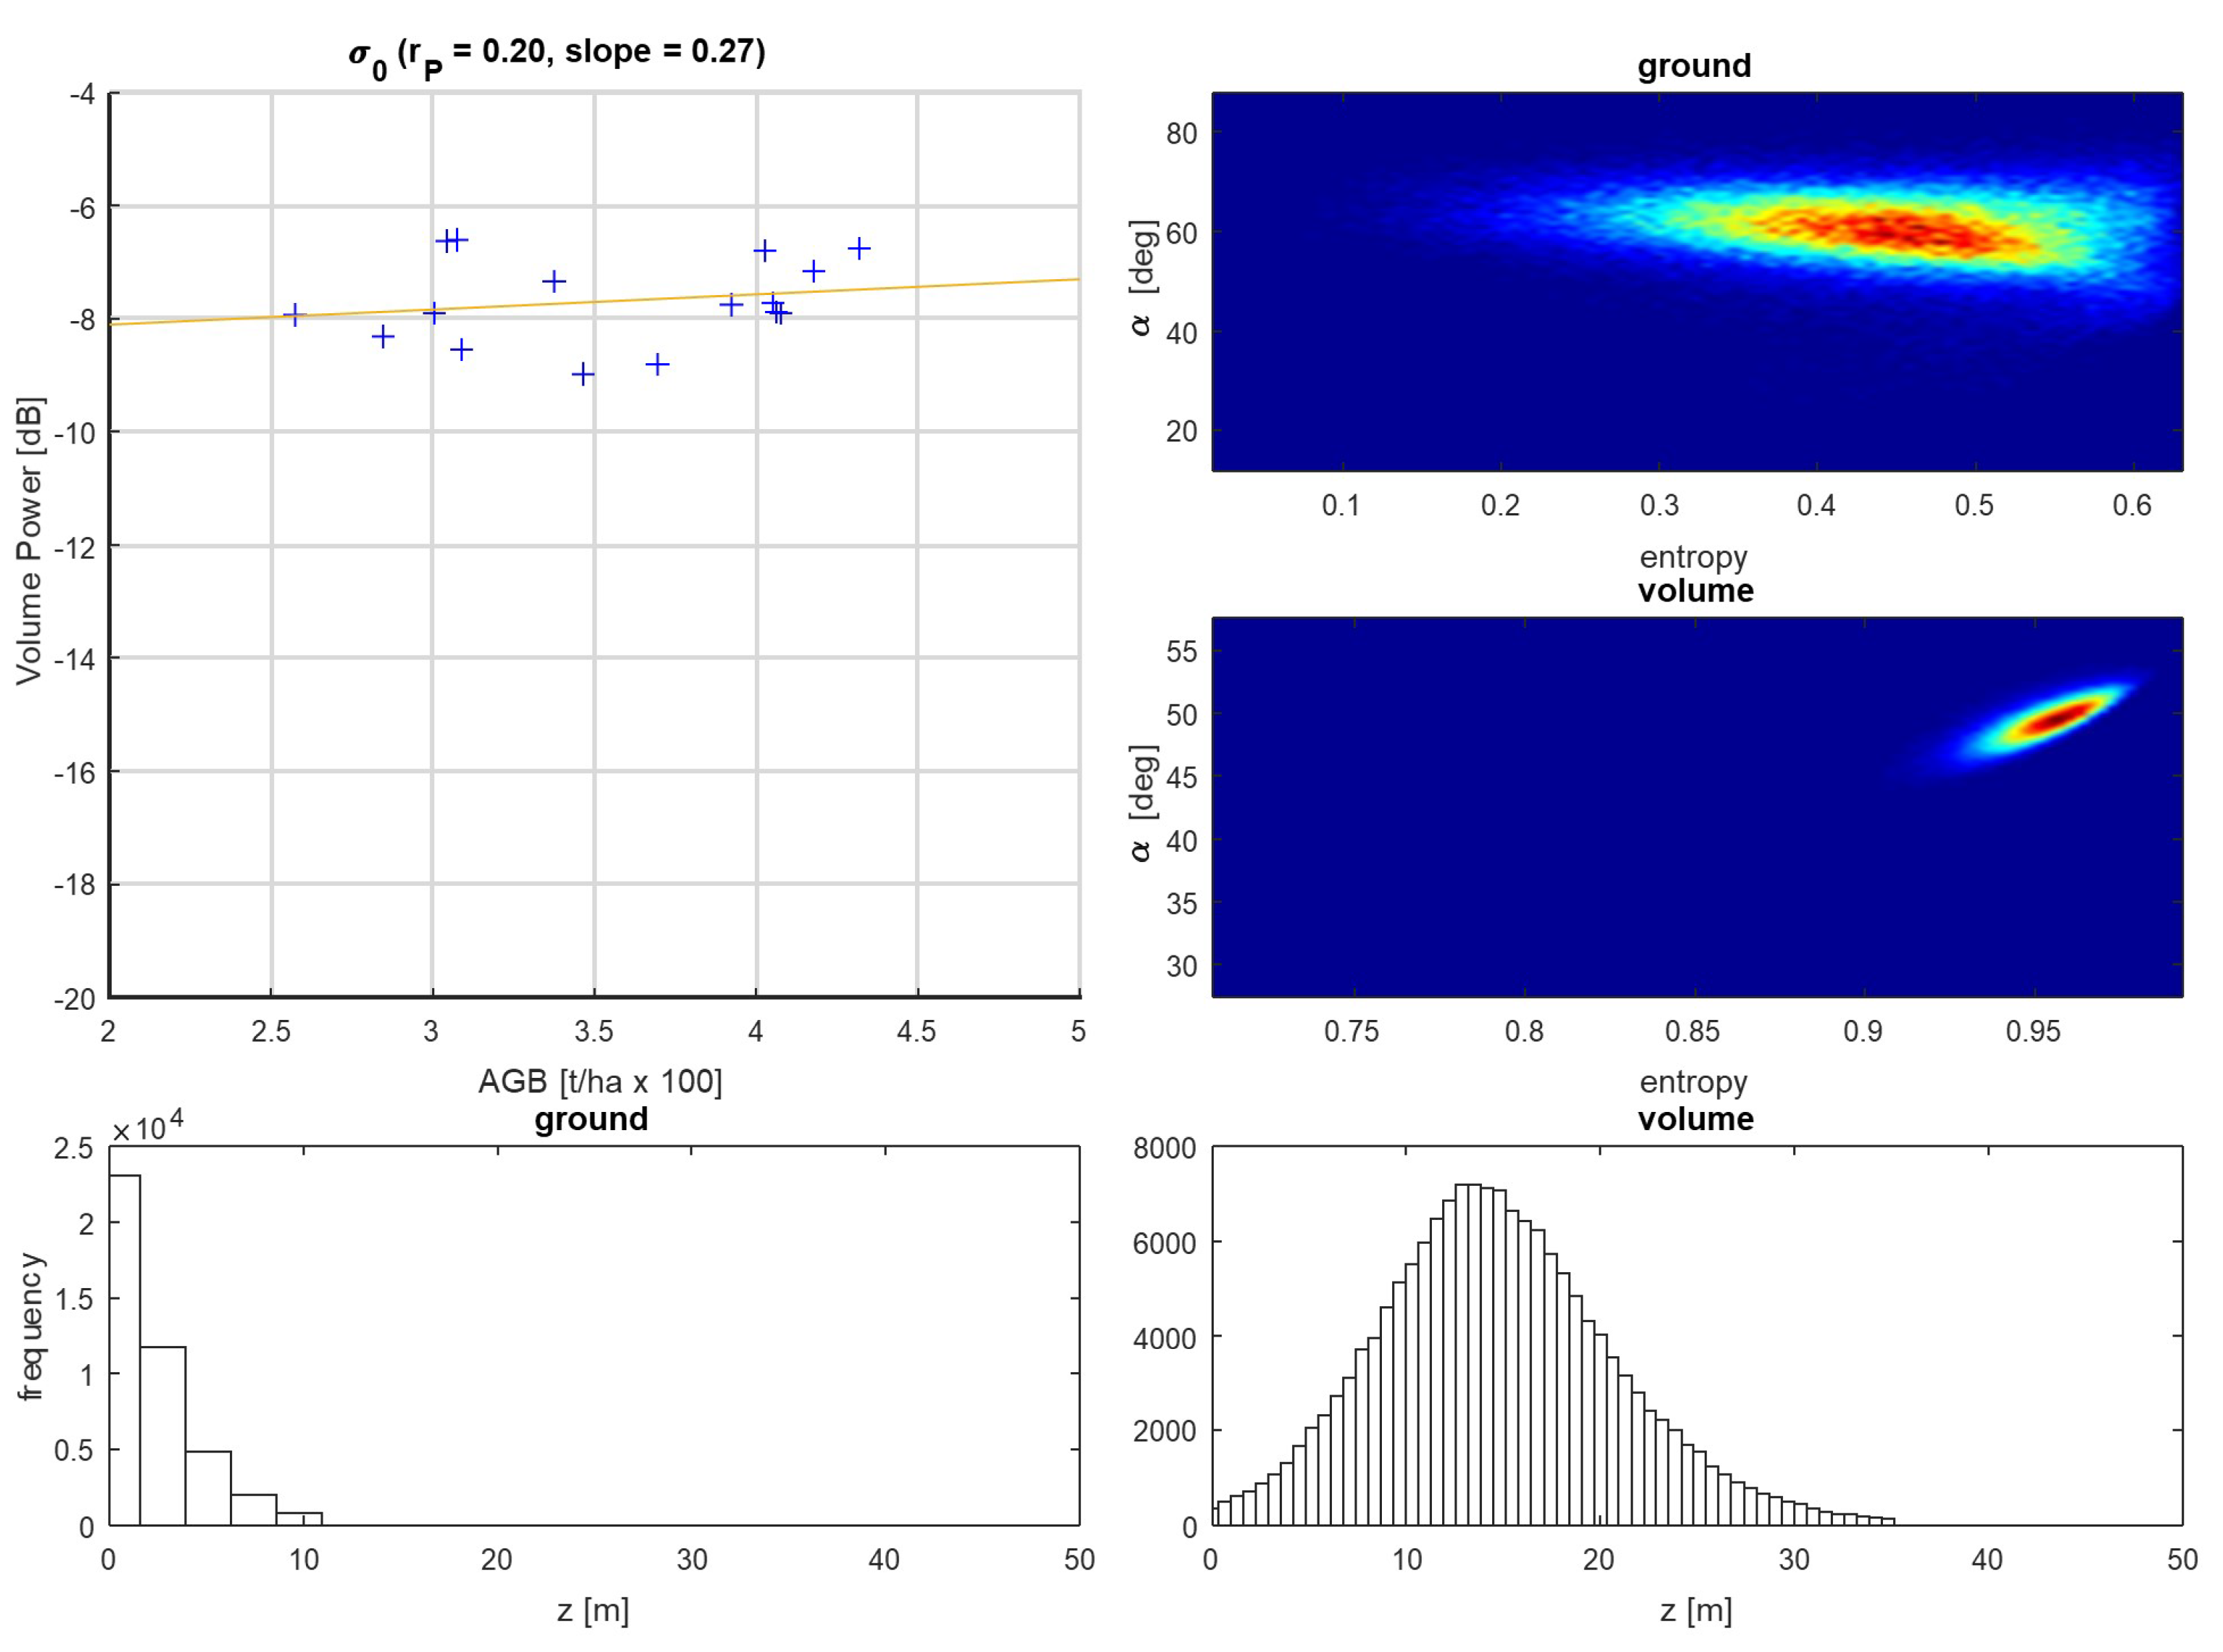
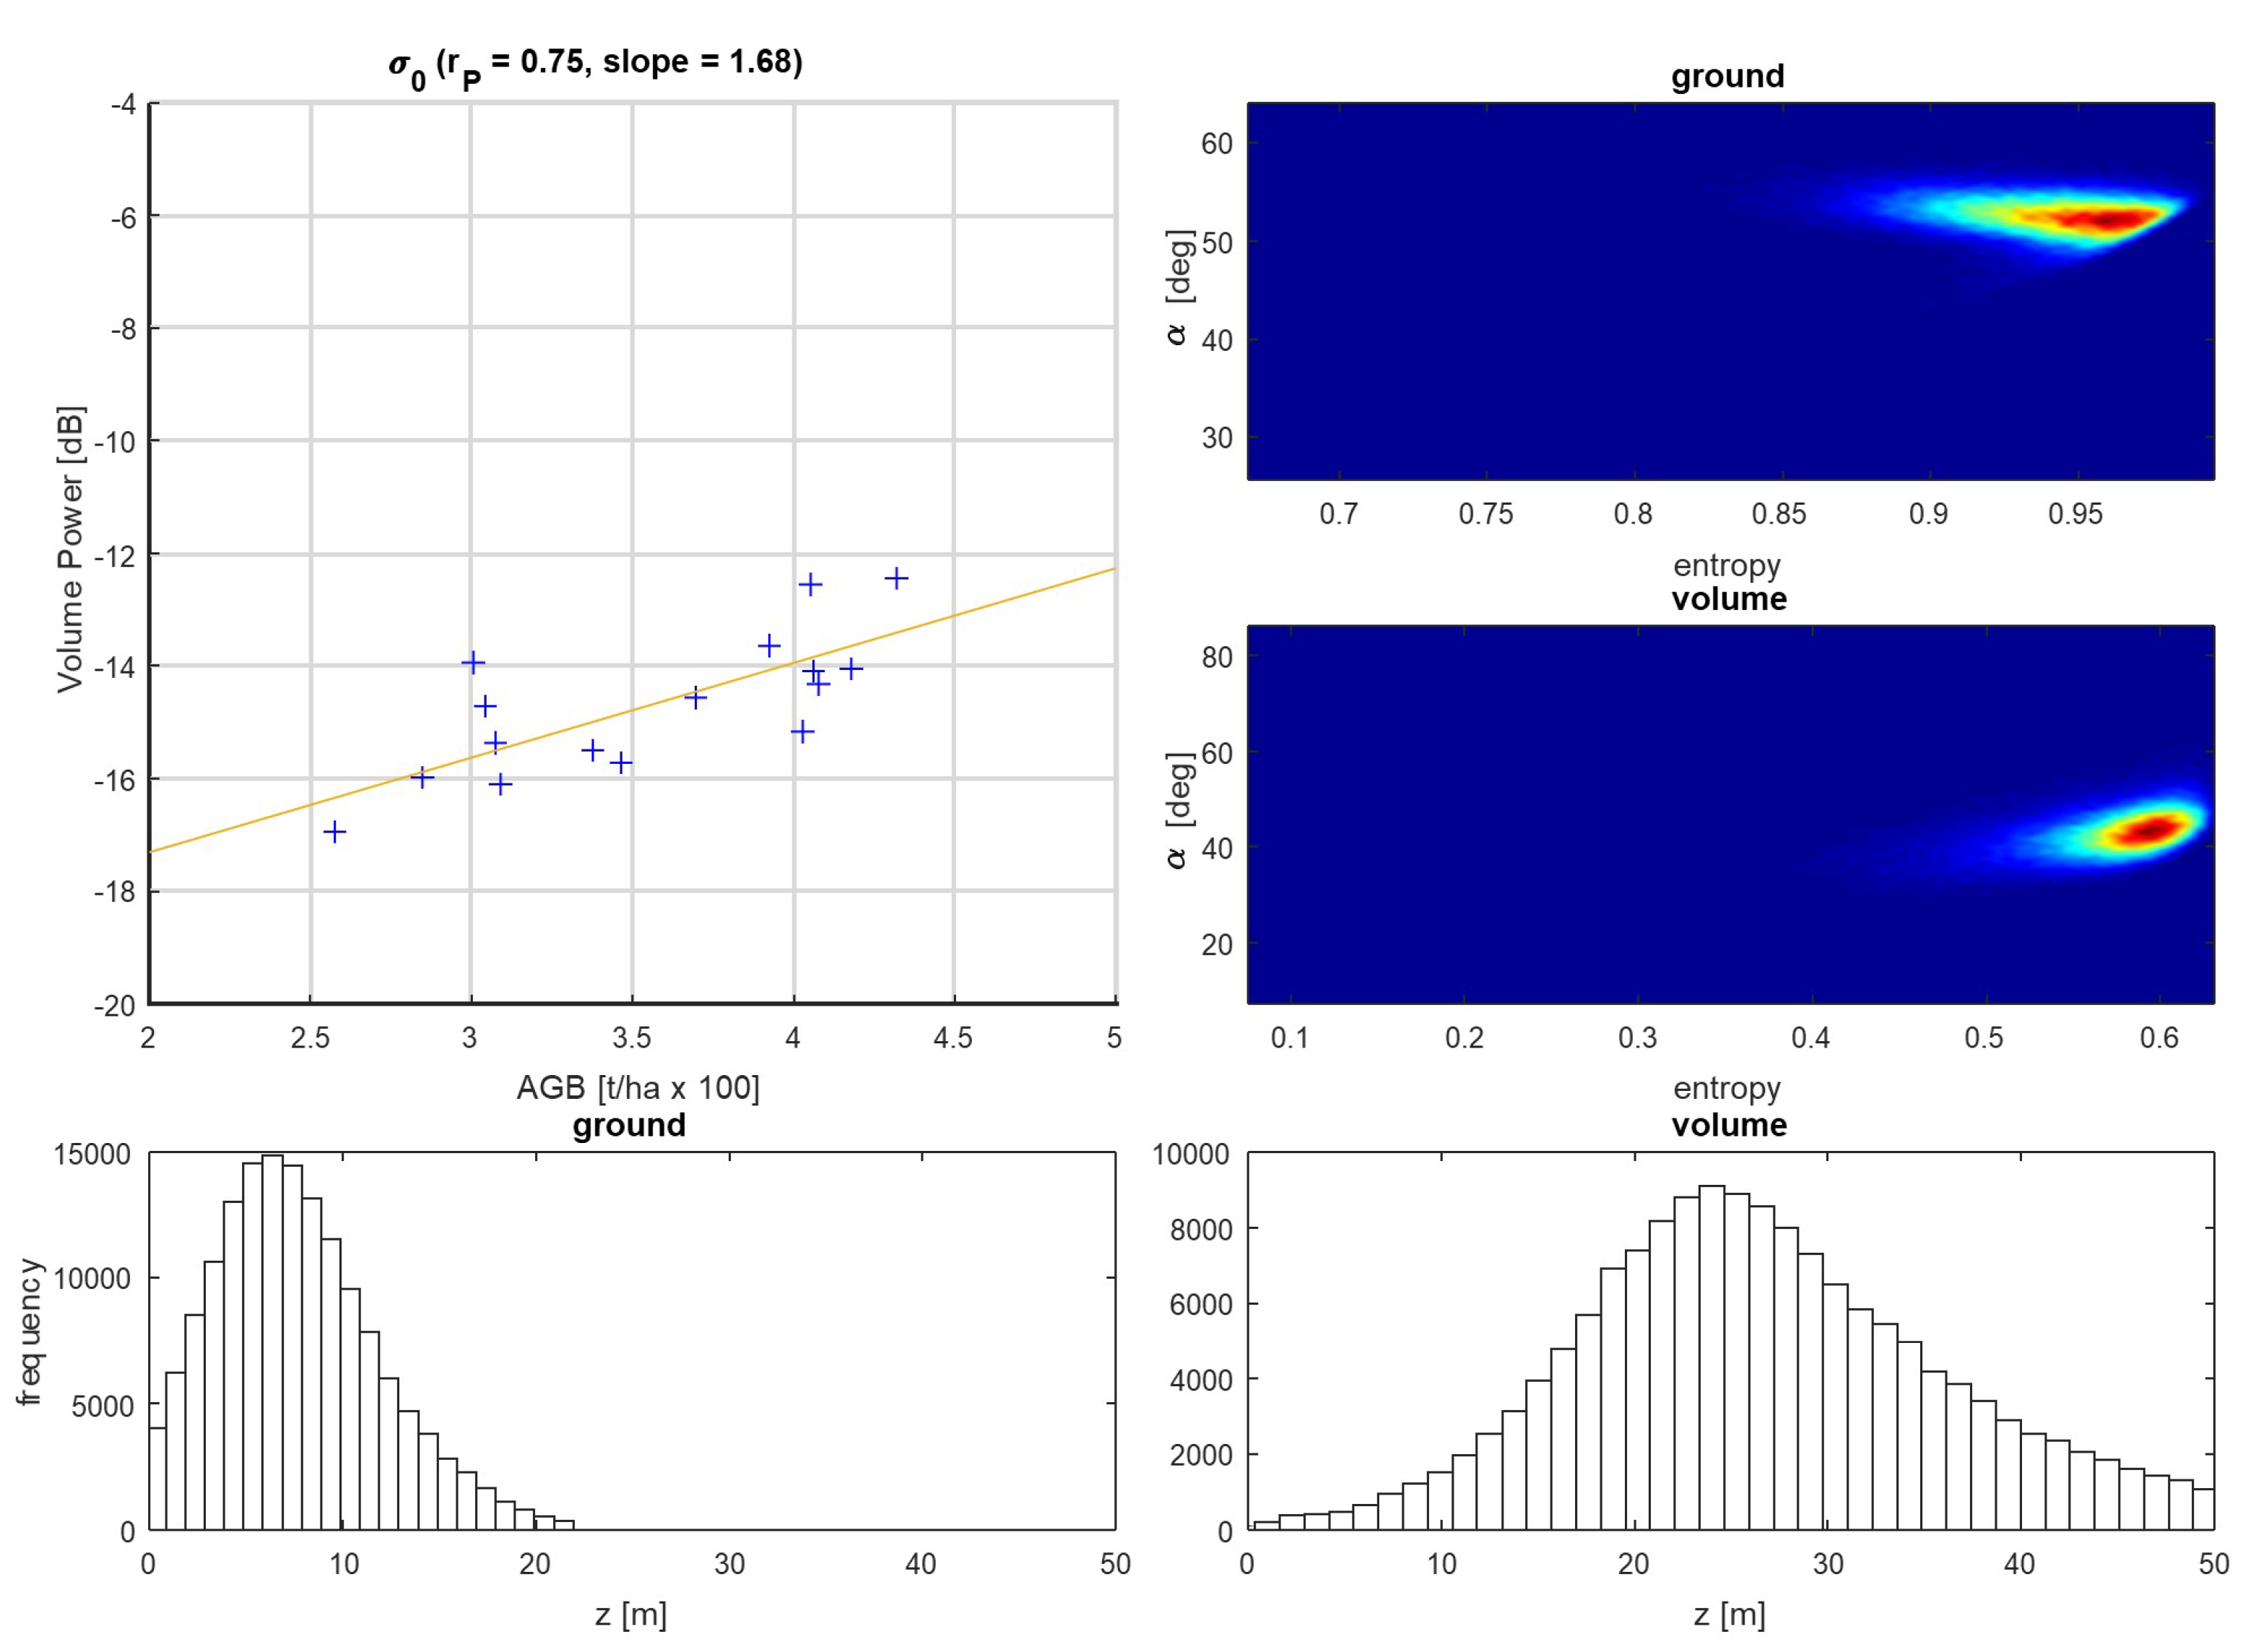
The aim of this section is to discuss whether the information about total volume backscatter, as derived by ground/volume decomposition, can be used as a proxy for AGB, and eventually suggest new directions for further research. The analysis reported here is carried out on the same forest site of Paracou, and performance is evaluated in terms of correlation and sensitivity to in-situ AGB provided by total volume backscatter. Total volume backscatter is retrieved at HV polarization by considering the four different solutions discussed in the previous section. Ground/volume decomposition is implemented in all cases by choosing an image pair with height of ambiguity approximately twice the 30 m canopy layer. Polarimetric–interferometric correlation is estimated from data so as to have a number of independent looks >100. Results are summarized in Table 2 in terms of vertical structure, polarimetric signatures, and correlation and sensitivity of the resulting volume backscatter (HV) with respect to AGB. A more detailed presentation of the results is shown in Figure 4 for the Outer/Inner solution and in Figure 5 for the Inner/Outer solution, where the scatterplot between in-situ AGB and volume backscattering, analysis of ground and volume polarimetric signatures in the alpha/entropy plane and histograms of the interferometric phase center of ground and volume scattering are shown. Phase center is computed as , with and is the interferometric wavenumber corresponding to the selected baseline [16]. Polarimetric signatures in the alpha/entropy plane are computed according to [37].
Limiting the analysis to the resulting vertical structures and polarimetric signatures, the results in Table 2 are more or less expected, as they are perfectly consistent with the theoretical predictions discussed in the previous section. Perhaps surprising is that a meaningful correlation to AGB is only observed by characterizing ground scattering as a volumetric target. Moreover, the best performance in terms of correlation and sensitivity, attaining similar values to integrated volume backscatter without extinction from previous tomographic analysis, is obtained by characterizing ground scattering as a volumetric target and volume scattering as a point-like target. To check the statistical consistency of the solution a t-test was run on the linear fit in Figure 5. Although the standard error amounts to 20% of the estimated slope, the corresponding p-value is 0.0008, meaning that the estimate is statistically significant.
5. Discussion and Conclusions
In this paper, we evaluated whether the information about total volume backscatter, as derived by ground/volume decomposition, is correlated to AGB. A fundamental aspect of the ground/volume decomposition problem is that multiple solutions are possible, meaning that different combinations of ground and volume coherences and polarimetric correlations exist that result in exactly the same correlation between any SLC data pair [35,36]. Different solutions correspond to different physical properties, which lead to different estimations of total volume backscatter.
The analysis consisted of retrieving total volume backscatter from four different solutions for ground and volume scattering, and by assessing the performance in terms of correlation and sensitivity to in-situ AGB. Meaningful correlation to AGB was only observed by characterizing ground scattering as a volumetric target. Moreover, the best performance in terms of correlation and sensitivity was obtained by characterizing ground scattering as a volumetric target and volume scattering as a point-like target. This may look puzzling from the physical point of view, as the solution that provides the best performance is definitely not supported by physical models.
An immediate conclusion that follows from this analysis is that total volume backscatter alone does not provide consistent AGB retrieval. Once this is accepted, all the results within Section 4.2 can be explained in a clear manner, consistent with the analyses carried out in Section 4.1 using SAR Tomography. Indeed:
- It was shown that total volume backscatter, as extracted from the observed tomographic intensities, does not correlate with AGB, unless it is corrected by accounting for wave extinction and forest height. Most interestingly, very similar results in terms of correlation and sensitivity with respect to AGB were obtained by retrieving (uncorrected) total volume backscatter by tomography or by ground/volume decomposition when assuming a physically-based solution. Accordingly, we found actually no reason why the total volume backscatter should correlate with AGB;
- Removing ground scattering is not sufficient to ensure a strong correlation between Radar intensities and forest AGB: volume structure does matter. Admitting that ground rejection is a sufficient condition for AGB retrieval would contradict experimental observations, in that: any tomographic layer should provide the same sensitivity to AGB; the classical solution of the ground/volume decomposition problem should be the one that provides the best sensitivity to AGB;
- Tomography appears to bring the most complete information about AGB in dense tropical forests, not only because of rejection of ground scattering, but also by virtue of its capability to single out the returns from different layers within the vegetation. Characterizing ground scattering as a volumetric target and volume scattering as a point-like target results in scattering from the midcanopy to be mostly ascribed to ground scattering, whereas volume scattering mainly accounts for the main and upper canopy layer. Accordingly, although this solution is not physical, it approximates as much as possible the layering capabilities of SAR tomography, which improves correlation and sensitivity with respect to AGB. It is worth noting that this solution is not guaranteed in presence of temporal decorrelation or in case of multiple baselines as the range of permitted interferometric coherence of ground and volume scattering in the complex plane shrink from the outer boundaries toward the true ground and volume coherences [36].
To conclude, although the unphysical solution could prove to be of practical use during the BIOMASS interferometric phase, further research is needed to better understand if and how ground/volume decomposition should be employed. In particular, forest height, and in principle wave extinction, can be produced in the interferometric phase by PolInSAR inversion. These two parameters could then be used to routinely correct the total backscatter power, so as to provide a closer link to AGB with a strong physical basis. A similar approach was tested in [9] for forest height, where estimates of extinction obtained over dense forested areas are used to routinely correct height estimates over the entire scenario. The dataset used for carrying out the analysis in this paper was limited to 16 ground plots. Although the estimate is statistically significant, more extensive datasets might be available in the future for further validation.
The necessity of combining forest parameters in order to describe the complexity of forest scenario highlighted in the present study agrees also with other SAR studies, where reference information is integrated into the backscatter inversion at P-band [12,13,14] or where multiple forest parameters estimated from single pass interferometry at X-band are combined for AGB regression [10,11]. An interesting option for future studies is represented by the synergy between LiDAR and ground/volume decomposition as the 3D structure from LiDAR can be used as a-priori information for inversion [38].
References
Author Contributions
Conceptualization: S.T., M.M.d., and F.B.; data curation: S.T., M.M.d., and F.B.; formal analysis: S.T., M.M.d., and F.B.; funding acquisition: S.T. and F.B.; investigation: S.T., M.M.d., and F.B.; methodology: S.T., M.M.d., and F.B.; project administration: S.T.; resources: S.T.; software: S.T., M.M.d., and F.B.; supervision: S.T.; validation: S.T., M.M.d., and F.B.; visualization: S.T., M.M.d., and F.B.; writing—original draft: F.B.; writing—review and editing: S.T., M.M.d., and F.B. All authors have read and agree to the published version of the manuscript.
Funding
This research was funded in the framework of the ESA contract 4000119231 BIOMASS L2 Implementation Study.
Acknowledgments
The authors wish to acknowledge the European Space Agency and the whole Level-2 team of the ESA BIOMASS mission for providing the framework in which this algorithm was developed.
Conflicts of Interest
The authors declare no conflict of interest.
References
- UNFCCC. Key Decisions Relevant for Reducing Emissions from Deforestation andForest Degradation in Developing Countries (REDD+); Decision Booklet REDD+, UNFCCC Secretariat: Bonn, Germany, 2016. [Google Scholar]
- Meyer, V.; Saatchi, S.S.; Chave, J.; Dalling, J.W.; Bohlman, S.; Fricker, G.A.; Robinson, C.; Neumann, M.; Hubbell, S. Detecting tropical forest biomass dynamics from repeated airborne lidar measurements. Biogeosciences 2013, 10, 5421–5438. [Google Scholar] [CrossRef] [Green Version]
- Chave, J.; Réjou-Méchain, M.; Búrquez, A.; Chidumayo, E.; Colgan, M.S.; Delitti, W.B.; Duque, A.; Eid, T.; Fearnside, P.M.; Goodman, R.C.; et al. Improved allometric models to estimate the aboveground biomass of tropical trees. Glob. Chang. Biol. 2014, 20, 3177–3190. [Google Scholar] [CrossRef] [PubMed]
- Saatchi, S.S.; Harris, N.L.; Brown, S.; Lefsky, M.; Mitchard, E.T.A.; Salas, W.; Zutta, B.R.; Buermann, W.; Lewis, S.L.; Hagen, S. Benchmark map of forest carbon stocks in tropical regions across three continents. Proc. Natl. Acad. Sci. USA 2011, 108, 9899–9904. [Google Scholar] [CrossRef] [PubMed] [Green Version]
- Santoro, M.; Beer, C.; Cartus, O.; Schmullius, C.; Shvidenko, A.; McCallum, I.; Wegmüller, U.; Wiesmann, A. Retrieval of growing stock volume in boreal forest using hyper-temporal series of Envisat ASAR ScanSAR backscatter measurements. Remote Sens. Environ. 2011, 115, 490–507. [Google Scholar] [CrossRef]
- Silva, C.A.; Saatchi, S.; Garcia, M.; Labrière, N.; Klauberg, C.; Ferraz, A.; Meyer, V.; Jeffery, K.J.; Abernethy, K.; White, L.; et al. Comparison of Small- and Large-Footprint Lidar Characterization of Tropical Forest Aboveground Structure and Biomass: A Case Study From Central Gabon. IEEE J. Sel. Top. Appl. Earth Observ. Remote Sens. 2018, 11, 3512–3526. [Google Scholar] [CrossRef] [Green Version]
- Rosen, P.; Hensley, S.; Shaffer, S.; Edelstein, W.; Kim, Y.; Kumar, R.; Misra, T.; Bhan, R.; Sagi, R. The NASA-ISRO SAR (NISAR) mission dual-band radar instrument preliminary design. In Proceedings of the 2017 IEEE International Geoscience and Remote Sensing Symposium (IGARSS), Fort Worth, TX, USA, 23–28 July 2017; pp. 3832–3835. [Google Scholar]
- ESA, ESTEC, Noordwijk. BIOMASS—Report for Mission Selection—An Earth Explorer to Observe Forest Biomass; SP-1324/1; ESA Communication Production Office: Noordwijk, The Netherlands, 2012. [Google Scholar]
- Praks, J.; Antropov, O.; Hallikainen, M.T. LIDAR-Aided SAR Interferometry Studies in Boreal Forest: Scattering Phase Center and Extinction Coefficient at X- and L-Band. IEEE Trans. Geosci. Remote Sens. 2012, 50, 3831–3843. [Google Scholar] [CrossRef]
- Treuhaft, R.; Gonçalves, F.; dos Santos, J.R.; Keller, M.; Palace, M.; Madsen, S.N.; Sullivan, F.; Graça, P.M.L.A. Tropical-Forest Biomass Estimation at X-Band From the Spaceborne TanDEM-X Interferometer. IEEE Geosci. Remote Sens. Lett. 2015, 12, 239–243. [Google Scholar] [CrossRef] [Green Version]
- Soja, M.J.; Persson, H.J.; Ulander, L.M.H. Estimation of Forest Biomass From Two-Level Model Inversion of Single-Pass InSAR Data. IEEE Trans. Geosci. Remote Sens. 2015, 53, 5083–5099. [Google Scholar] [CrossRef] [Green Version]
- Villard, L.; Le Toan, T. Relating P-Band SAR Intensity to Biomass for Tropical Dense Forests in Hilly Terrain: γ0 or t0? IEEE J. Sel. Top. Appl. Earth Observ. Remote Sens. 2015, 8, 214–223. [Google Scholar] [CrossRef]
- Soja, M.J.; Sandberg, G.; Ulander, L.M.H. Regression-Based Retrieval of Boreal Forest Biomass in Sloping Terrain Using P-Band SAR Backscatter Intensity Data. IEEE Trans. Geosci. Remote Sens. 2013, 51, 2646–2665. [Google Scholar] [CrossRef] [Green Version]
- Truong-Loi, M.L.; Saatchi, S.; Jaruwatanadilok, S. Soil Moisture Estimation Under Tropical Forests Using UHF Radar Polarimetry. IEEE Trans. Geosci. Remote Sens. 2015, 53, 1718–1727. [Google Scholar] [CrossRef]
- Reigber, A.; Moreira, A. First demonstration of airborne SAR tomography using multibaseline L-band data. IEEE Trans. Geosci. Remote Sens. 2000, 38, 2142–2152. [Google Scholar] [CrossRef]
- Tebaldini, S.; Rocca, F.; Mariotti d’Alessandro, M.; Ferro-Famil, L. Phase Calibration of Airborne Tomographic SAR Data via Phase Center Double Localization. IEEE Trans. Geosci. Remote Sens. 2016, 54, 1775–1792. [Google Scholar] [CrossRef]
- Mariotti d’Alessandro, M.; Tebaldini, S. Digital Terrain Model Retrieval in Tropical Forests Through P-Band SAR Tomography. IEEE Trans. Geosci. Remote Sens. 2019, 57, 6774–6781. [Google Scholar] [CrossRef]
- Mariotti d’Alessandro, M.; Tebaldini, S. Cross Sensor Simulation of Tomographic SAR Stacks. Remote Sens. 2019, 11, 2099. [Google Scholar] [CrossRef] [Green Version]
- Ho Tong Minh, D.; Tebaldini, S.; Rocca, F.; Le Toan, T. The Impact of Temporal Decorrelation on BIOMASS Tomography of Tropical Forests. IEEE Geosci. Remote Sens. Lett. 2015, 12, 1297–1301. [Google Scholar] [CrossRef]
- Banda, F.; Dall, J.; Tebaldini, S. Single and Multipolarimetric P-Band SAR Tomography of Subsurface Ice Structure. IEEE Trans. Geosci. Remote Sens. 2016, 54, 2832–2845. [Google Scholar] [CrossRef]
- Le, T.T.; Quegan, S.; Davidson, M.W.J.; Balzter, H.; Paillou, P.; Papathanassiou, K.; Plummer, S.; Rocca, F.; Saatchi, S.; Shugart, H.; et al. The BIOMASS mission: Mapping global forest biomass to better understand the terrestrial carbon cycle. Remote Sens. Environ. 2011, 115, 2850–2860. [Google Scholar]
- Ho Tong Minh, D.; Toan, T.L.; Rocca, F.; Tebaldini, S.; d’Alessandro, M.M.; Villard, L. Relating P-Band Synthetic Aperture Radar Tomography to Tropical Forest Biomass. IEEE Trans. Geosci. Remote Sens. 2014, 52, 967–979. [Google Scholar] [CrossRef]
- Minh, D.H.T.; Toan, T.L.; Rocca, F.; Tebaldini, S.; Villard, L.; Réjou-Méchain, M.; Phillips, O.L.; Feldpausch, T.R.; Dubois-Fernandez, P.; Scipal, K.; et al. SAR tomography for the retrieval of forest biomass and height: Cross-validation at two tropical forest sites in French Guiana. Remote Sens. Environ. 2016, 175, 138–147. [Google Scholar] [CrossRef] [Green Version]
- Quegan, S.; Toan, T.L.; Chave, J.; Dall, J.; Exbrayat, J.F.; Minh, D.; Lomas, M.; D’Alessandro, M.M.; Paillou, P.; Papathanassiou, K.; et al. The European Space Agency BIOMASS mission: Measuring forest above-ground biomass from space. Remote Sens. Environ. 2019, 227, 44–60. [Google Scholar] [CrossRef] [Green Version]
- Meyer, V.; Saatchi, S.; Clark, D.B.; Keller, M.; Vincent, G.; Ferraz, A.; Espírito-Santo, F.; d’Oliveira, M.V.N.; Kaki, D.; Chave, J. Canopy area of large trees explains aboveground biomass variations across neotropical forest landscapes. Biogeosciences 2018, 15, 3377–3390. [Google Scholar] [CrossRef] [Green Version]
- Tang, S. Quantifying Differences in Forest Structures with Quantitative Structure Models from TLS Data. Master’s Thesis, UCL, London, UK, 2017. [Google Scholar]
- Chave, J. Study of structural, successional and spatial patterns in tropical rain forests using TROLL, a spatially explicit forest model. Ecol. Model. 1999, 124, 233–254. [Google Scholar] [CrossRef]
- Blomberg, E.; Ferro-Famil, L.; Soja, M.J.; Ulander, L.M.H.; Tebaldini, S. Forest Biomass Retrieval From L-Band SAR Using Tomographic Ground Backscatter Removal. IEEE Geosci. Remote Sens. Lett. 2018, 15, 1030–1034. [Google Scholar] [CrossRef]
- D’Alessandro, M.M.; Tebaldini, S.; Rocca, F. Phenomenology of Ground Scattering in a Tropical Forest Through Polarimetric Synthetic Aperture Radar Tomography. IEEE Trans. Geosci. Remote Sens. 2013, 51, 4430–4437. [Google Scholar] [CrossRef]
- Cloude, S.R.; Papathanassiou, K.P. Three-stage inversion process for polarimetric SAR interferometry. IEE Proc. Radar Sonar Navig. 2003, 150, 125–134. [Google Scholar] [CrossRef] [Green Version]
- Papathanassiou, K.P.; Cloude, S.R. Single-baseline polarimetric SAR interferometry. IEEE Trans. Geosci. Remote Sens. 2001, 39, 2352–2363. [Google Scholar] [CrossRef] [Green Version]
- Treuhaft, R.N.; Madsen, S.N.; Moghaddam, M.; van Zyl, J.J. Vegetation characteristics and underlying topography from interferometric radar. Radio Sci. 1996, 31, 1449–1485. [Google Scholar] [CrossRef]
- Kugler, F.; Lee, S.; Hajnsek, I.; Papathanassiou, K.P. Forest Height Estimation by Means of Pol-InSAR Data Inversion: The Role of the Vertical Wavenumber. IEEE Trans. Geosci. Remote Sens. 2015, 53, 5294–5311. [Google Scholar] [CrossRef]
- Banda, F.; Giudici, D.; Quegan, S.; Scipal, K. The Retrieval Concept of the Biomass Forest Biomass Prototype Processor. In Proceedings of the IGARSS 2018—2018 IEEE International Geoscience and Remote Sensing Symposium, Valencia, Spain, 22–27 July 2018; pp. 8582–8585. [Google Scholar]
- Tebaldini, S. Algebraic Synthesis of Forest Scenarios From Multibaseline PolInSAR Data. IEEE Trans. Geosci. Remote Sens. 2009, 47, 4132–4142. [Google Scholar] [CrossRef]
- Tebaldini, S.; Rocca, F. Multibaseline Polarimetric SAR Tomography of a Boreal Forest at P- and L-Bands. IEEE Trans. Geosci. Remote Sens. 2012, 50, 232–246. [Google Scholar] [CrossRef]
- Cloude, S.R.; Pottier, E. An entropy based classification scheme for land applications of polarimetric SAR. IEEE Trans. Geosci. Remote Sens. 1997, 35, 68–78. [Google Scholar] [CrossRef]
- Choi, C.; Pardini, M.; Papathanassiou, K. A Structure-Based Framework for the Combination of GEDI and Tandem-X Measurements Over Forest Scenarios. In Proceedings of the IGARSS 2019—2019 IEEE International Geoscience and Remote Sensing Symposium, Yokohama, Japan, 28 July–2 August 2019; pp. 4488–4490. [Google Scholar] [CrossRef]
Figure 1.
Example of tomographic focusing at a specific height with respect to the terrain.

Figure 2.
Correlation between HV synthetic aperture radar (SAR) intensity and above-ground biomass (AGB) from ground plots at Paracou [22,23]. Backscatter is expressed as sigma naught, accounting for local topography [12]. Left: 2D SAR. Right: tomographic intensity at 30 m above the ground. The correlation coefficient and slope are also reported.

Figure 3.
Geometrical representation of possible solutions for ground/volume scattering decomposition based on single-baseline polarimetric–interferometric techniques (PolInSAR) data. The red and green segments represent the range of permitted interferometric coherence of ground and volume scattering in the complex plane. The four solutions at either ends of each segment are referred to as outer or inner solutions for ground and volume scattering.

Figure 4.
Outer/Inner Solution. Top left: scatterplot between in-situ AGB and volume backscattering. Top right: analysis of ground and volume polarimetric signatures in the alpha/entropy plane. Bottom: histograms of the interferometric phase center of ground and volume scattering. Phase center is computed as , with and is the interferometric wavenumber corresponding to the selected baseline [16]. Data-set: Paracou, ONERA.

Figure 5.
Inner/Outer Solution. Top left: scatterplot between in-situ AGB and volume backscattering. Top right: analysis of ground and volume polarimetric signatures in the alpha/entropy plane. Bottom: histograms of the interferometric phase center of ground and volume scattering. Phase center is computed as , with and is the interferometric wavenumber corresponding to the selected baseline [16]. Data-set: Paracou, ONERA.


Table 1.
Correlation with AGB of different parameters derived assuming the validity of Equation (2).
Table 1.
Correlation with AGB of different parameters derived assuming the validity of Equation (2).
| Parameter | Description | Unit | Correlation | Sensitivity |
|---|---|---|---|---|
| Volumetric backscattering | dB/m | 0.18 | 400 t/ha per dB/m | |
| Forest height | m | 0.62 | 42 t/ha per m | |
| Total volume backscatter (w/out extinction) | dB | 0.76 | 86 t/ha per dB | |
| Total attenuation | dB | 0.1 | 714 t/ha per dB | |
| Total volume backscatter (w extinction) | dB | 0.19 | 400 t/ha per dB | |
| Approximated tomographic intensity at 30 m | dB | 0.5 | 120 t/ha per dB |
Table 2.
Analysis of four different solutions for ground/volume scattering decomposition, in terms of vertical structure, polarimetric signatures, and correlation and sensitivity of the resulting volume backscatter (HV) with respect to AGB.
Table 2.
Analysis of four different solutions for ground/volume scattering decomposition, in terms of vertical structure, polarimetric signatures, and correlation and sensitivity of the resulting volume backscatter (HV) with respect to AGB.
| Solution (Ground/Volume) | Ground Vertical Structure | Volume Vertical Structure | Ground Polarimetry | Volume Polarimetry | Sensitivity | |
|---|---|---|---|---|---|---|
| Outer / Inner | Ground-locked pointlike target (coherence 1, phase center 0 m) | Distributed target (low coherence, phase center 13 m) | Low Entropy Multiple Scattering Events (60 < < 70 entropy 0.45) | High Entropy Vegetation Scattering (47 < < 52 entropy 0.95) | 0.20 | 370 t/ha per dB |
| Outer / Outer | Ground-locked pointlike target (coherence 1, phase center 0 m) | Point-like target within forest canopy (coherence 1, phase center 24 m) | High Entropy Vegetation Scattering (50 < < 55 entropy 0.95) | High Entropy Vegetation Scattering (47 < < 52 entropy 0.95) | 0.26 | 238 t/ha per dB |
| Inner / Outer | Distributed target (low coherence, phase center 6 m) | Point-like target within forest canopy (coherence 1, phase center 24 m) | High Entropy Vegetation Scattering (50 < < 55 entropy 0.95) | Medium Entropy Vegetation Scattering (40 < < 45 entropy 0.6) | 0.75 | 59 t/ha per dB |
| Inner / Inner | Distributed target (low coherence, phase center 6 m) | Distributed target (low coherence, phase center 13 m) | Low Entropy Multiple Scattering Events (60 < < 70 entropy 0.45) | Medium Entropy Vegetation Scattering (40 < < 45 entropy 0.6) | 0.72 | 80 t/ha per dB |
© 2020 by the authors. Licensee MDPI, Basel, Switzerland. This article is an open access article distributed under the terms and conditions of the Creative Commons Attribution (CC BY) license (http://creativecommons.org/licenses/by/4.0/).
Share and Cite
MDPI and ACS Style
Banda, F.; Mariotti d’Alessandro, M.; Tebaldini, S. Ground and Volume Decomposition as a Proxy for AGB from P-Band SAR Data. Remote Sens. 2020, 12, 240. https://doi.org/10.3390/rs12020240
AMA Style
Banda F, Mariotti d’Alessandro M, Tebaldini S. Ground and Volume Decomposition as a Proxy for AGB from P-Band SAR Data. Remote Sensing. 2020; 12(2):240. https://doi.org/10.3390/rs12020240
Chicago/Turabian StyleBanda, Francesco, Mauro Mariotti d’Alessandro, and Stefano Tebaldini. 2020. "Ground and Volume Decomposition as a Proxy for AGB from P-Band SAR Data" Remote Sensing 12, no. 2: 240. https://doi.org/10.3390/rs12020240
Note that from the first issue of 2016, this journal uses article numbers instead of page numbers. See further details here.