Long-Term Trends of Atmospheric CH4 Concentration across China from 2002 to 2016


1
International Institute for Earth System Science, Nanjing University, Nanjing 210023, China
2
School of Geography and Ocean Science, Nanjing University, Nanjing 210023, China
3
Jiangsu Center for Collaborative Innovation in Geographical Information Resource Development and Application, Nanjing 210023, China
*
Author to whom correspondence should be addressed.
Remote Sens. 2019, 11(5), 538; https://doi.org/10.3390/rs11050538
Submission received: 24 January 2019
/
Revised: 24 February 2019
/
Accepted: 27 February 2019
/
Published: 5 March 2019
(This article belongs to the Special Issue Application of Ground and Space Based Remote Sensing for Air Pollution)
Abstract
:Spatiotemporal variations of atmospheric CH4 from 2002 to 2016 across China were detected, based on the Atmospheric Infrared Sounder (AIRS) sixth-layer CH4 concentration. The CH4 concentration showed good consistency with the ground measurements of surface CH4 concentration from the World Data Centre for Greenhouse Gases (WDCGG) (R2 = 0.83, p < 0.01), indicating that the remotely-sensed CH4 reflected the spatial and temporal variations of surface CH4 concentration. Across China, three hotspots of CH4 concentration were found in northern Xinjiang, the northeast of Inner Mongolia/Heilongjiang, and the Norgay plateau in northwest Sichuan. The CH4 concentration showed obviously seasonal variations, with the maximum CH4 concentration occurring in summer, followed by the autumn, winter, and spring. Furthermore, the CH4 concentration showed significantly increasing trends across China, with the rate of increase ranging from ~0.29 to 0.62 ppb·month−1, which would bring a 0.0019~0.014 mK potential rise in surface temperature response over China. In particular, the most rapidly increasing rates occurred in the Qinghai-Tibet plateau, while relatively low rates occurred in southeast China.
1. Introduction
Methane (CH4) is one of the main greenhouse gases [1], with a contribution of 4–9% to the earth’s greenhouse effects [2,3]. Moreover, CH4 is an active chemical gas with a long life in atmosphere, which has a significant impact on the earth–atmosphere radiation budget and climate change [4]. The atmospheric CH4 concentration has increased from 720 ppbv in 1750 to 1803 ppbv in 2011, an increase of almost 150 percent over the pre-industrial level (IPCC5), reached 1834 ppb in 2015, and is still accelerating [5,6,7]. The rapid increase of CH4 was mainly caused by the imbalance of CH4 sources and sinks, since a large amount of CH4 was emitted from human activities in the industrial era [8]. Understanding the spatial and temporal variations of CH4 in the atmosphere is essential for studying climate change [9].
Natural sources account for 35% to 50% of the total sources for CH4, which mainly include wetlands, termites, and oceans [10]. The remaining sources are anthropogenic, including energy utilization, landfill, ruminants, rice paddies, and biomass burning [5,11,12]. The CH4 emissions from wetlands increased by 7% from 2003 to 2007, due to the warming in the mid-latitudes and the Arctic [13], and they have remained constant at 186 ± 24 Tg CH4 per year from 2010 to 2012 [7]. China has the largest wetlands area among Asia’s countries, which emit 1.7–10.5 Tg CH4 per year [14,15,16]. Meanwhile, the contribution of the CH4 emissions from rice cultivation to the total anthropogenic emissions decreased by 30% between 1980 and 2010. Also, the increase of CH4 emissions between 1980 and 2010 was mainly attributed to coal exploitation (70% of the total increase) which occurred mostly after 2000, followed by livestock (26%), mostly before 2000 [6,7,17,18]. CH4 emissions from livestock were reported to be ∼11.1 Tg CH4 per year [10], and the contribution of the additional +7 Tg CH4 per year came from fossil-fuel-related emissions from 2000–2006 to 2008–2012 [6,18]. In the last 20 years, there has been a rapid change in the sources of related CH4, since China has undergone one of the largest and most rapid developments of industry and agriculture [19]. The potential change in sources of CH4 emissions will greatly influence the CH4 concentration in the atmosphere. However, few studies have been conducted to evaluate the long-term spatiotemporal variations of atmospheric CH4 concentrations across China [20,21,22,23,24,25].
There are several ways to measure CH4 concentration in the atmosphere, such as by taking ground-based measurements, aircraft sampling, and space-borne remote sensing. Compared with other methods, space-borne remote sensing provides an opportunity for evaluating the spatial and temporal changes of CH4 concentration in the atmosphere on a global scale, which can effectively make up for the deficiency of near-surface monitoring measurements [26,27,28]. Several sensors provide CH4 concentrations in the atmosphere, including the Scanning Imaging Absorption Spectrometer for Atmospheric Chartography (SCIAMACHY), the Greenhouse Gas Observation Satellite (GOSAT), and the Atmospheric Infrared Sounder (AIRS). Compared with those from SCIAMACHY and GOSAT, AIRS provides the longest sequence of CH4 observations since 2002. In addition, AIRS possesses a cloud-clearing capability [29,30,31] that enables partly cloudy scenes to be retrieved, thus achieving 70% effective daily coverage. The errors of CH4 products from AIRS were basically controlled to within −1.4%~0.1%, and the root mean square ranged from 0.5% to 1.6% [32]. The AIRS retrievals have been used to analyze the distribution, evolution, and transmission of CH4 concentration in the atmosphere in China [20,21,22,23,24,25]. However, as satellite observations of atmospheric composition research in China began later, an in-depth, large-scale, long time-series analysis of the characteristics of the change in CH4 concentration in China has not been conducted.
This study aimed to analyze the spatiotemporal variations of CH4 concentration in the atmosphere over China, based on the monthly CH4 concentration retrieved from the AIRS. First, the monthly and spatial variations of CH4 products from AIRS were compared with the ground-based observations, to test whether the remotely sensed CH4 concentration were in good agreement with the surface CH4 concentration; second, the spatial distributions of CH4 concentration in China were analyzed and three hotspots are further discussed; and finally, the long-term trends of CH4 from 2002 to 2016 across China were detected, and the surface temperature responses for a 20-year timeframe were calculated, to indicate climate change.
2. Materials and Methods
2.1. Atmospheric CH4 Concentration from AIRS
AIRS was launched on 4 May, 2002 aboard the National Aeronautics and Space Administration (NASA) EOS/Aqua platform. This sensor consists of 2378 channels, covering 649–1136, 1217–1613, and 2169–2674 cm−1 at high spectral resolution (λ/λ = 1200, 0.5 cm−1) [33]. The satellite operates in a near polar, sun-synchronous orbit, with an equator crossing time of 13:30 (ascending node). The footprint of AIRS is 13 km at nadir, over a 24-h period, AIRS nominally orbits the complete globe twice per day [32]. The errors of CH4 products were basically controlled within −1.4%~0.1%, and the root mean square error (RMSE) ranged from 0.5% to 1.6% [32]. Also, as supported by using the aircraft measurements from the National Oceanic and Atmospheric Administration (NOAA), ESRL/GMD (the Global Monitoring Division at the NOAA Earth System Research Laboratory) and the campaigns INTEX-A and -B, the correlation of AIRS mid-upper tropospheric CH4 with aircraft measurements was ~0.6–0.7, and the bias and the RMSE differences were less than ±1% and 1.2%, respectively. By studying the seasonal cycles of CH4 concentration, the variation of CH4 concentration in the mid-upper troposphere of AIRS was in accordance with the results of NOAA aircraft measurements [32].
In this study, AIRS Version 6 (V6) Level 3 (L3) Standard products from September 2002 to September 2016, a total of 169 months, were adopted (http://disc.sci.gsfc.nasa.gov/). These monthly data present the CH4 volume mixing ratio, reported at 24 levels from 1000 hPa to 1.0 hPa, which are binned into 1° × 1° grid cells. AIRS data are stratified according to the characteristics of atmospheric pressure, and the strongest sensitivity of the AIRS instrument appeared at a height of 200 hPa~500 hPa in different latitudes in the Northern Hemisphere [32,34]. This is because the actual land surface is unevenly distributed with different altitudes, and no data are available in the areas with high altitudes, such as the Qinghai-Tibet plateau and the Yungui plateau at lower layers. Considering the continuous coverage of CH4 data across China, and its indication of on the ground emissions, the data of 500 hPa of AIRS are used in this study. The original AIRS CH4 data are stored in HDF format, which are then converted to raster data format. The inverse distance-weighting (IDW) method was used to fill in gaps in the original data.
2.2. Ground Measurements of CH4 Concentration
To test the representations of the spatial and temporal variations of CH4 concentration from AIRS, the ground observations of CH4 concentration were used for comparison with the remotely sensed CH4. The near-surface CH4 concentrations are from the WDCGG (http://ds.data.jma.go.jp/gmd/wdcgg/) which comes under the Global Atmosphere Watch (GAW) programme of the World Meteorological Organization (WMO). GAW is mainly responsible for long-term observations of greenhouse gases, the ozone layer, solar radiation, precipitation chemistry, aerosols, reactive gases, persistent organic pollutants, heavy metals, isotopes, meteorological elements, etc. [35,36,37]. More data observations and quality control methods are constrained. Detailed information can be found in the literature [38,39].
In this study, nine observation sites (Figure S1) located within and close to China were selected. Among them, three sites—Mt. Waliguan (WLG), Shangdianzi (SDZ), and Lulin (LLN)— are located within China, and the other six—Ulaan Uul (UUM), Tae-ahn Peninsula (TAP), Anmyeon-do (AMY), Ryori (RYO), Minamitorishima (MNM), and Pha Din (PDI)—are located around China. The monthly data available for the corresponding period of CH4 concentration were used in this study. We deleted the CH4 concentrations that seriously deviated from the main trend of the data at each site, before using in further studies. More specific information and locations are shown in Table S1.
2.3. CH4 Emissions in China from EDGAR
The gridded CH4 emissions across China were from the Emissions Database for Global Atmospheric Research (EDGAR) (http://edgar.jrc.ec.europa.eu/archived_datasets.php#ghg). The current development of EDGAR is a joint project of the European Commission Joint Research Centre and the Netherlands Environmental Assessment Agency. The new database structure can calculate emissions by country and by sector, and this includes specific technologies for fuel/treatments and emission reduction measures. In addition, to facilitate the use of EDGAR data in air pollution and climate simulations on different scales at the same time, a newly developed map was used to allocate multiple emission sources in each country by 1° × 1° grids [40,41]. The emission data from 2002 to 2012 were obtained from EDGAR v. 4.3.2. Twelve years of annual CH4 emissions data were calculated, to compare with the corresponding satellite retrievals. Furthermore, the emissions by different sectors across China in 2007 were also calculated.
2.4. Surface Temperature Data
The surface temperature data in China from 2002 to 2016 were accessed from the NOAA National Center for the Environmental Prediction of the Department of Energy (NCEP/DOE) Reanalysis 2 [42]. The dataset was an improved version of the NCEP, with temporal resolutions of 4-times per day, daily, and monthly coverage. The spatial resolution was 1° × 1° by grids, which denoted a 2 m altitude above the ground. In this paper, the monthly averaged temperatures from September 2002 to September 2016 were selected.
2.5. A Linear Trend Model with a Seasonal Component to Simulate the Trends of CH4 Concentration
To detect the long-term trends and seasonal variations in CH4 concentration from 2002 to 2016, a linear model with a seasonal component was proposed. This model has frequently been found to be useful in detecting the trends of UV radiation, total ozone, and NO2 concentration [43,44,45]:
where, represents the monthly CH4 concentration (ppb·month−1) at month i; Xi is the number of months after September 2002; is the residual unexplained by the fit function; and A, B, C, D, and E are the fit parameters.
“A + BXi” is a linear function representing the linear trend of CH4 concentrations from 2002 to 2016, where A represents the value in September 2002 and B is the change in the slope of the monthly values. “Csin (DXi + E)” represents the seasonal component of annual CH4 concentration. The seasonal component contains an amplitude C, a frequency D and a phase shift E. The fit of the frequency D leads to an expected period of one year; therefore, this fit parameter is fixed to π/6 for the final analyses. The residual Mi is the difference between the model and the measured values.
2.6. Trajectory Analysis
The Hybrid Single-Particle Lagrangian Integrated Trajectory model (HYSPLIT) was used to identify the influence of air masses on the accumulation of CH4 in the atmosphere (http://www.arl.noaa.gov/ready/hysplit4.html). The HYSPLIT model can calculate the paths of the air masses from one region to another. It documents the vector for air pollutant transport, which determines the origins of air masses and establishes source–receptor relationships [46,47]. The model calculation method is a hybrid between the Lagrangian approach, using a moving frame of reference for the advection and diffusion calculations as the trajectories or air parcels move from their initial locations, and Eulerian methodology which uses a fixed three-dimensional grid as a frame of reference to compute pollutant air concentrations. Using GDAS (global data assimilation system) meteorological data as the input, a 24 h backward trajectory was modeled at 3 km above the starting point, to analyze the mid-upper tropospheric atmospheric trajectory. We simulated the monthly back-trajectories based on four weeks in a month. In each week, we selected six back-trajectories to represent the main directions of the air-mass. Overall, we had 24 back-trajectories every month. In order to show the seasonal changes of the airflow trajectories more clearly, typical directions were chosen to denote the main back-trajectories in April, July, October, and January in 2007, which represent the air-mass in spring (March to May), summer (June to August), autumn (September to November), and winter (December to February of the next year), respectively.
2.7. Surface Temperature Response
The absolute global surface temperature change potential (AGTP) can directly reflect the impact of a certain greenhouse gas emission from the perspective of surface temperature rise [48,49]. The gas emissions (kg) over the time period multiplied by the corresponding warming potential AGTP (K·kg−1) can estimate the surface temperature response variations (ΔT) [49,50,51]. In this paper, ΔT indicates the warming potential caused by the accumulation of CH4 emissions during a 15-year time period.
where, is absolute global temperature potential of CH4, K·kg−1 and t is the 20-year time horizon; represents radiative forcing of CH4, 2.1 × 10⁻¹³ W (kg·m2)−1; α is the life cycle of CH4, 12.4 years; is climate sensitive parameters and is response times (IPCC, 2014). and are 0.631 and 0.429, respectively; and are 8.4 and 409.5, respectively; is known as an impulse radiative flux (IRF); E stands for the CH4 emission, kg·yr−1. In Equation (4): is the temperature change response, K. An annual emission (kg) is multiplied by the AGTP values to arrive at the potential of temperature change (ΔT) in a given year.
3. Results and Discussion
3.1. Comparison of the Seasonal and Spatial Variations Indicated by AIRS CH4 Concentrations Using Ground Measurements
3.1.1. Comparison of the Seasonal and Spatial Variations Indicated by AIRS CH4 Concentrations Using Ground Measurements
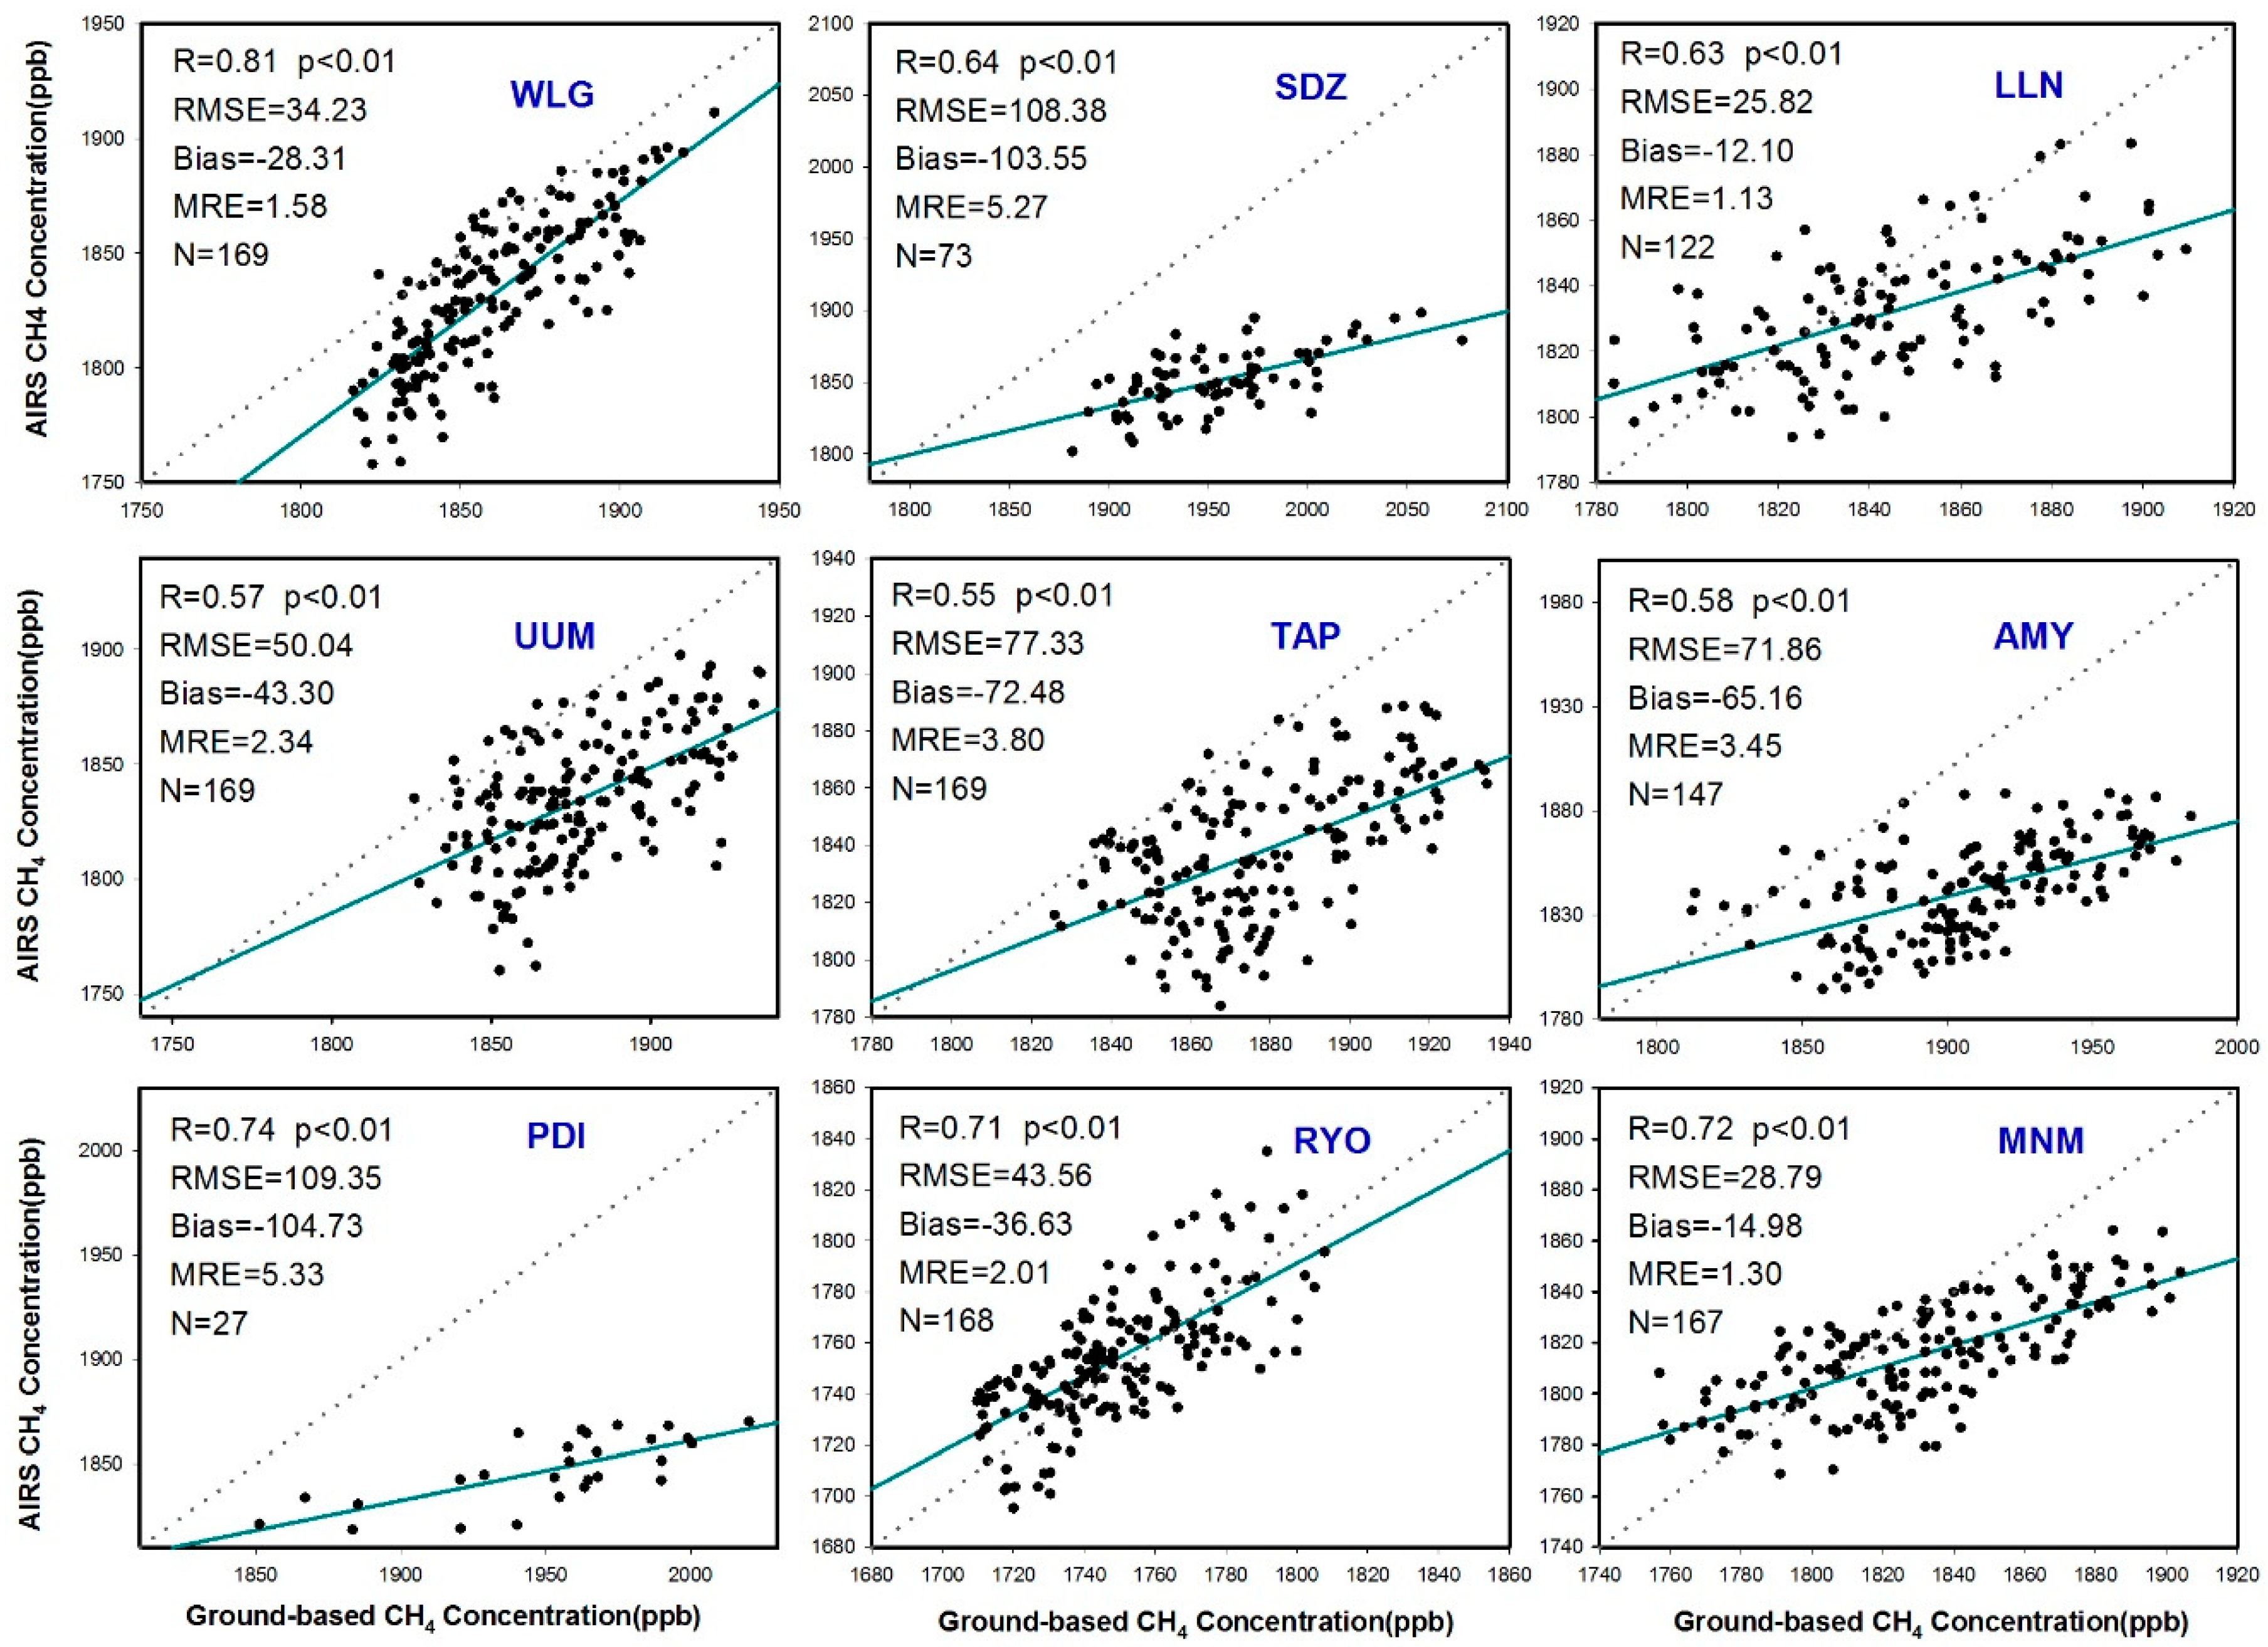
To test the sensitivity of monthly variations in AIRS CH4 concentration, the in situ CH4 concentrations collected at the nine sites from WDCGG were used [52,53]. The scatter plots of the AIRS CH4 concentration, and the ground measurements of CH4 concentration showed good consistency for each site over the long time-series, with the correlation coefficients ranging from 0.55 to 0.81 (Figure 1). However, the ground data were obviously higher than those of the satellite retrievals, since AIRS detected the CH4 concentration 3 km above the ground. The CH4 decreased with the atmospheric altitude, which meant that the CH4 concentration was higher at lower altitude. The difference in the atmospheric altitude of the two data sources resulted in higher values for AIRS concentrations. Similar results were obtained in previous studies [22,23,25].
The highest correlation coefficient was 0.81 at WLG, with the lowest monthly average deviation and RMSE. The lowest correlation coefficient was 0.55 in TAP. Although the RMSE and the bias in PDI were the highest, their correlation coefficient reached 0.74. This phenomenon might be affected by the frequent atmospheric transmission in the tropics [23]. The satellite data in SDZ were less correlated with the ground-based measurements, and the corresponding RMSE and bias were also relatively high. This is mainly because that SDZ was located in Beijing, one of the largest cities in China. The CH4 concentration at the surface level was greatly affected by human activities and land-use changes [24]. The altitudes in WLG and LLN were much higher than at other stations, as shown by the minimum monthly average deviation and the RMSE, which to some extent validated the available AIRS data. Instead of the inland sites, the CH4 concentration in MNM and RYO (near-marine) was also in better agreement with the surface measurements. Compared with the near-infrared waveband, AIRS mainly uses the thermal infrared waveband to invert the concentration of CH4 in the atmosphere, which is also less influenced by clouds and aerosols [32,34,54,55].
We should note that the RMSE in SDZ, PDI, TAP, and AMY was higher than in the other five monitoring sites. These sites with high RMSE values were located in populated areas, which had high levels of anthropogenic CH4 emissions. These emissions resulted in a high CH4 concentration at the surface level in local areas, but did not induce high concentrations in the atmosphere, since the ground CH4 was transferred into the neighboring areas [56,57].
3.1.2. Comparison of the Spatial Variations of AIRS CH4 Concentrations with Ground Measurements
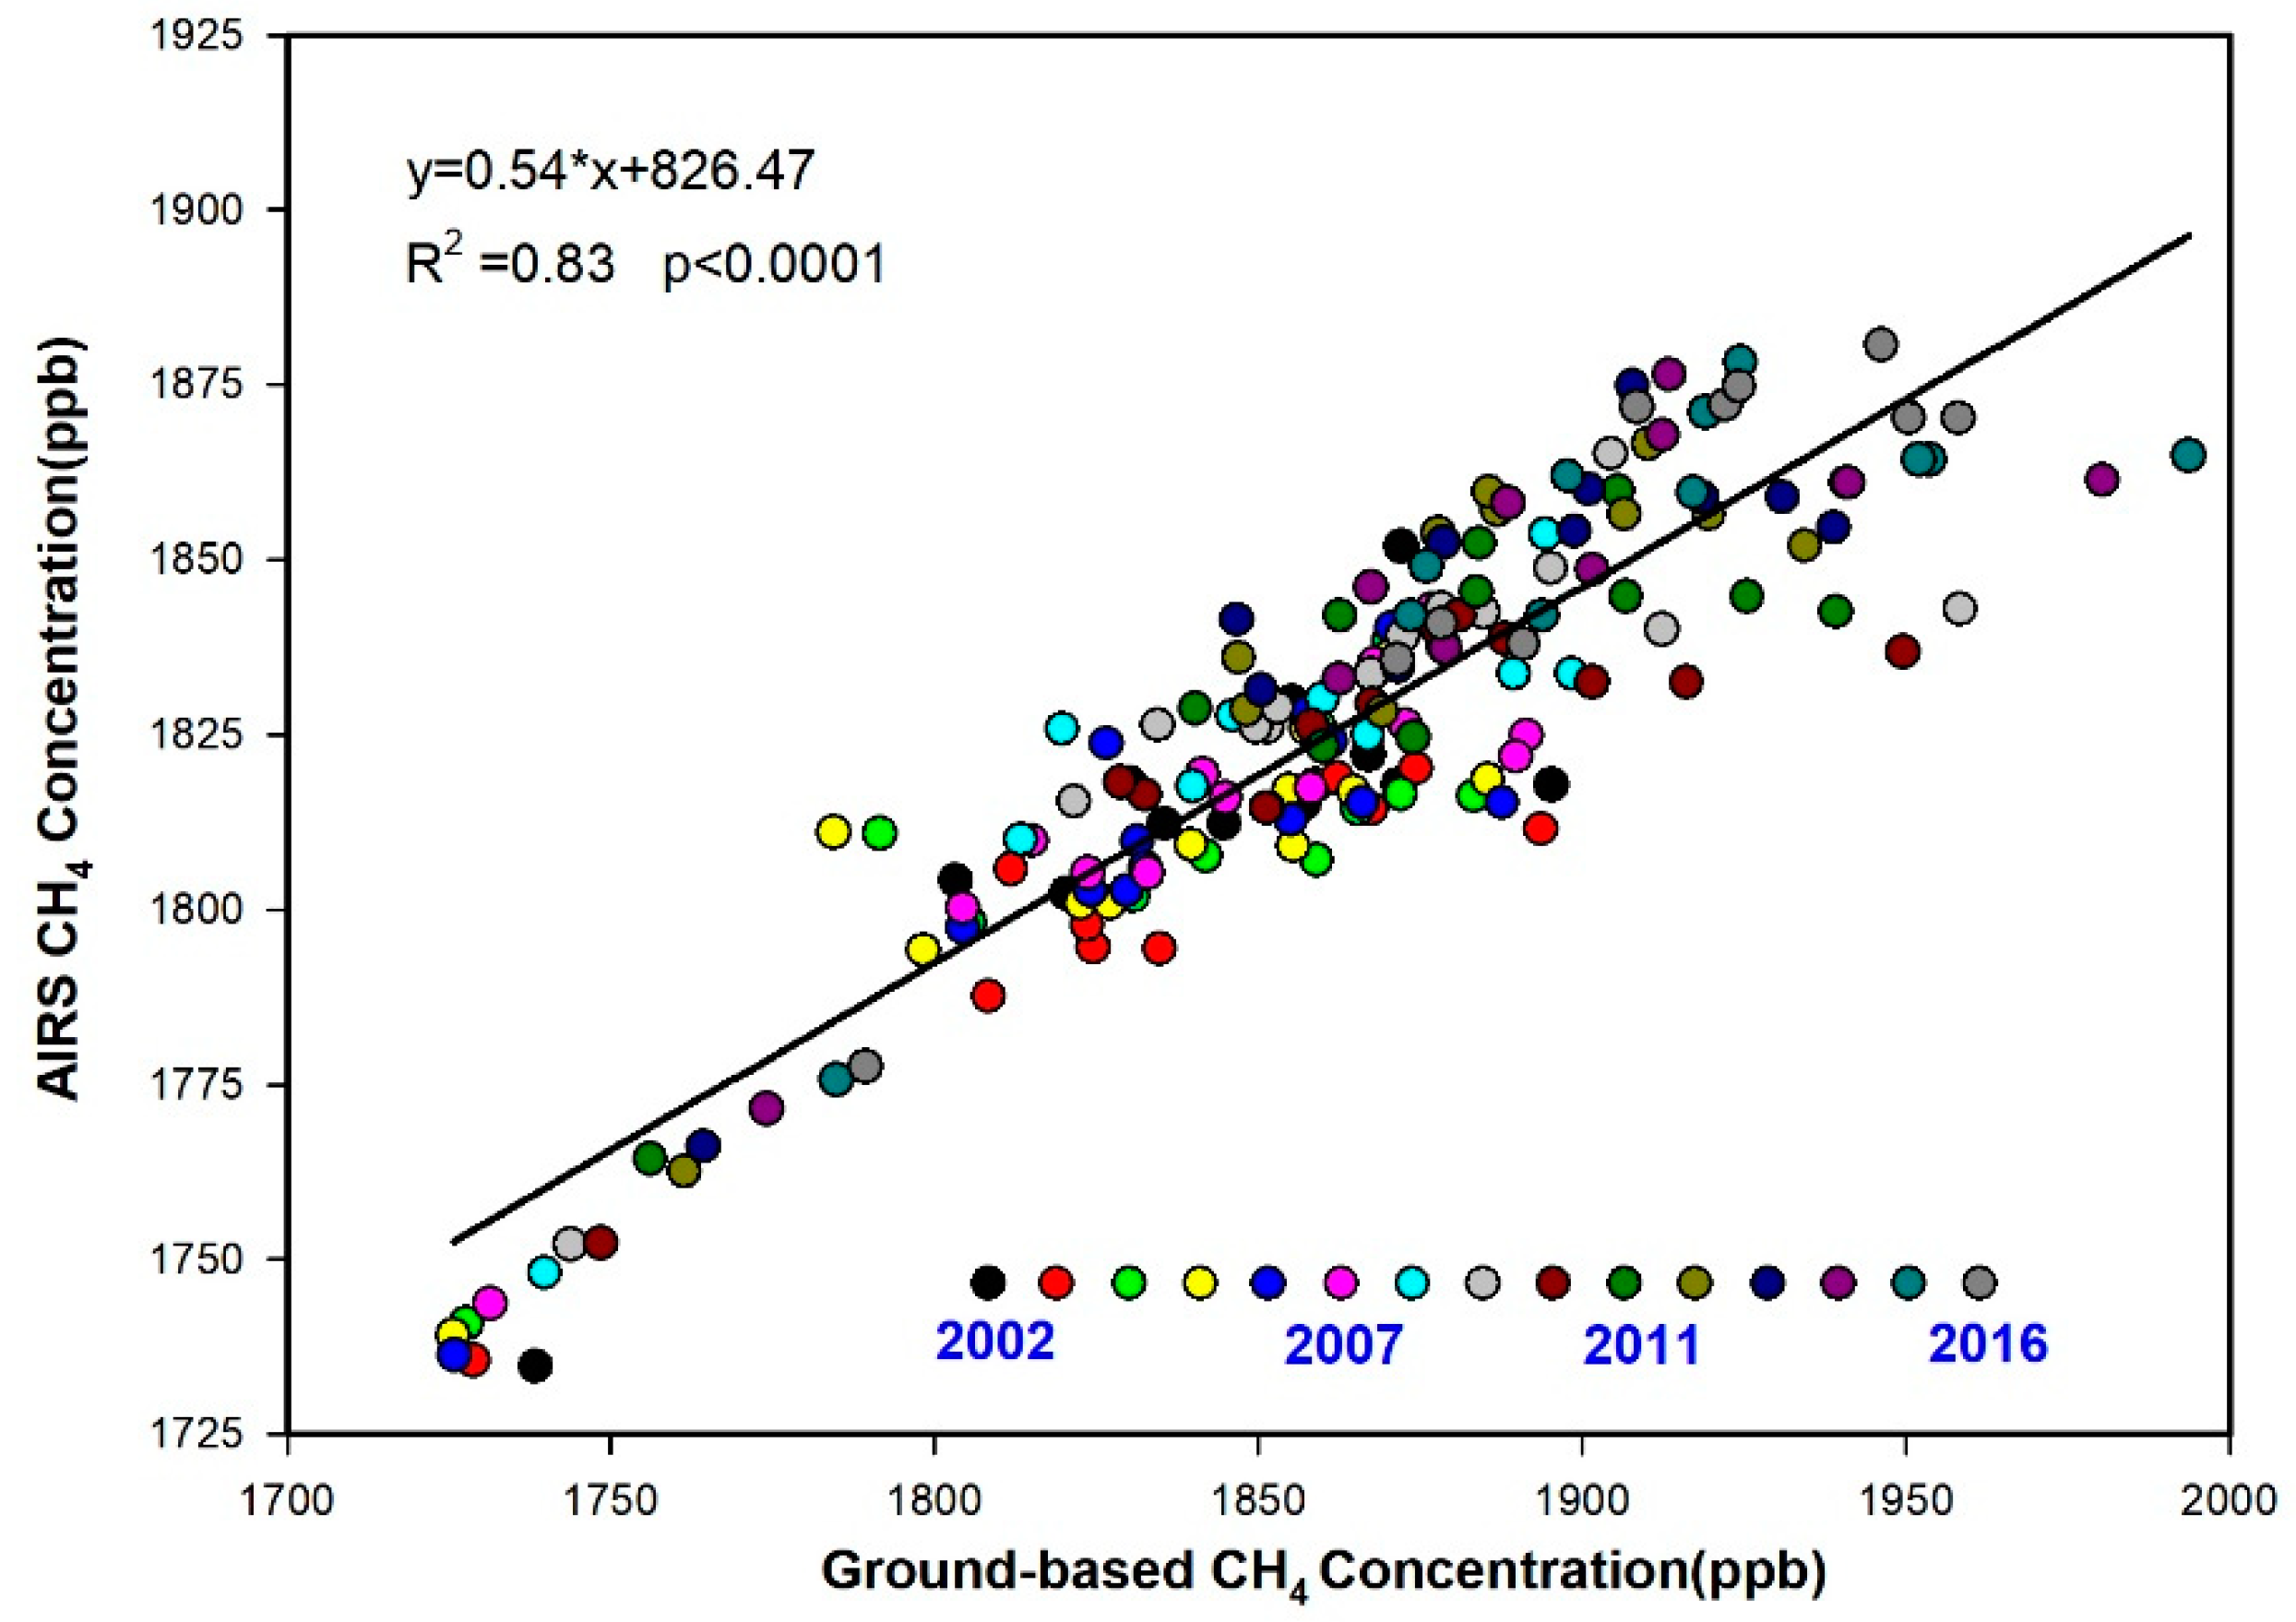
To study whether AIRS data can indicate the spatial variations of ground CH4 concentration, the averages of the annual and monthly CH4 concentrations for each year from AIRS and ground measurements at the nine sites were compared (Figure 2 and Figure S2). The annual ground measurements and the remotely sensed data also showed good consistency, with a correlation coefficient of 0.83 (p < 0.01). The consistency between the ground measurements and the AIRS CH4 data in each year showed similar results to those of the data as a whole (Figure S2), with the correlation coefficients ranging from 0.39 to 0.70. The average slope was around 1.20, indicating that the spatial variation trend of all of the stations on an annual scale was consistent, which further demonstrated that AIRS could be used to replace the near-surface data in order to study variations of trends on a large regional scale, during a long time-series.
The high correlation coefficients of the monthly and annual CH4 concentrations from AIRS and ground measurements showed that the AIRS CH4 concentration reflected the monthly and spatial variations of the near-surface CH4 concentrations and could be used in further studies. However, we should note that these ground measurements were mainly conducted at locations that had few human activities, and this good consistency between the ground CH4 concentration and the AIRS CH4 mainly indicated that AIRS CH4 concentration could reflect the monthly and spatial variations of CH4 concentrations near the ground in remote areas. Whether the AIRS CH4 concentration can reflect the spatial and temporal variations of the near-surface in well-developed areas needs to be further studied.
3.2. Spatial Variations of CH4 from AIRS over China
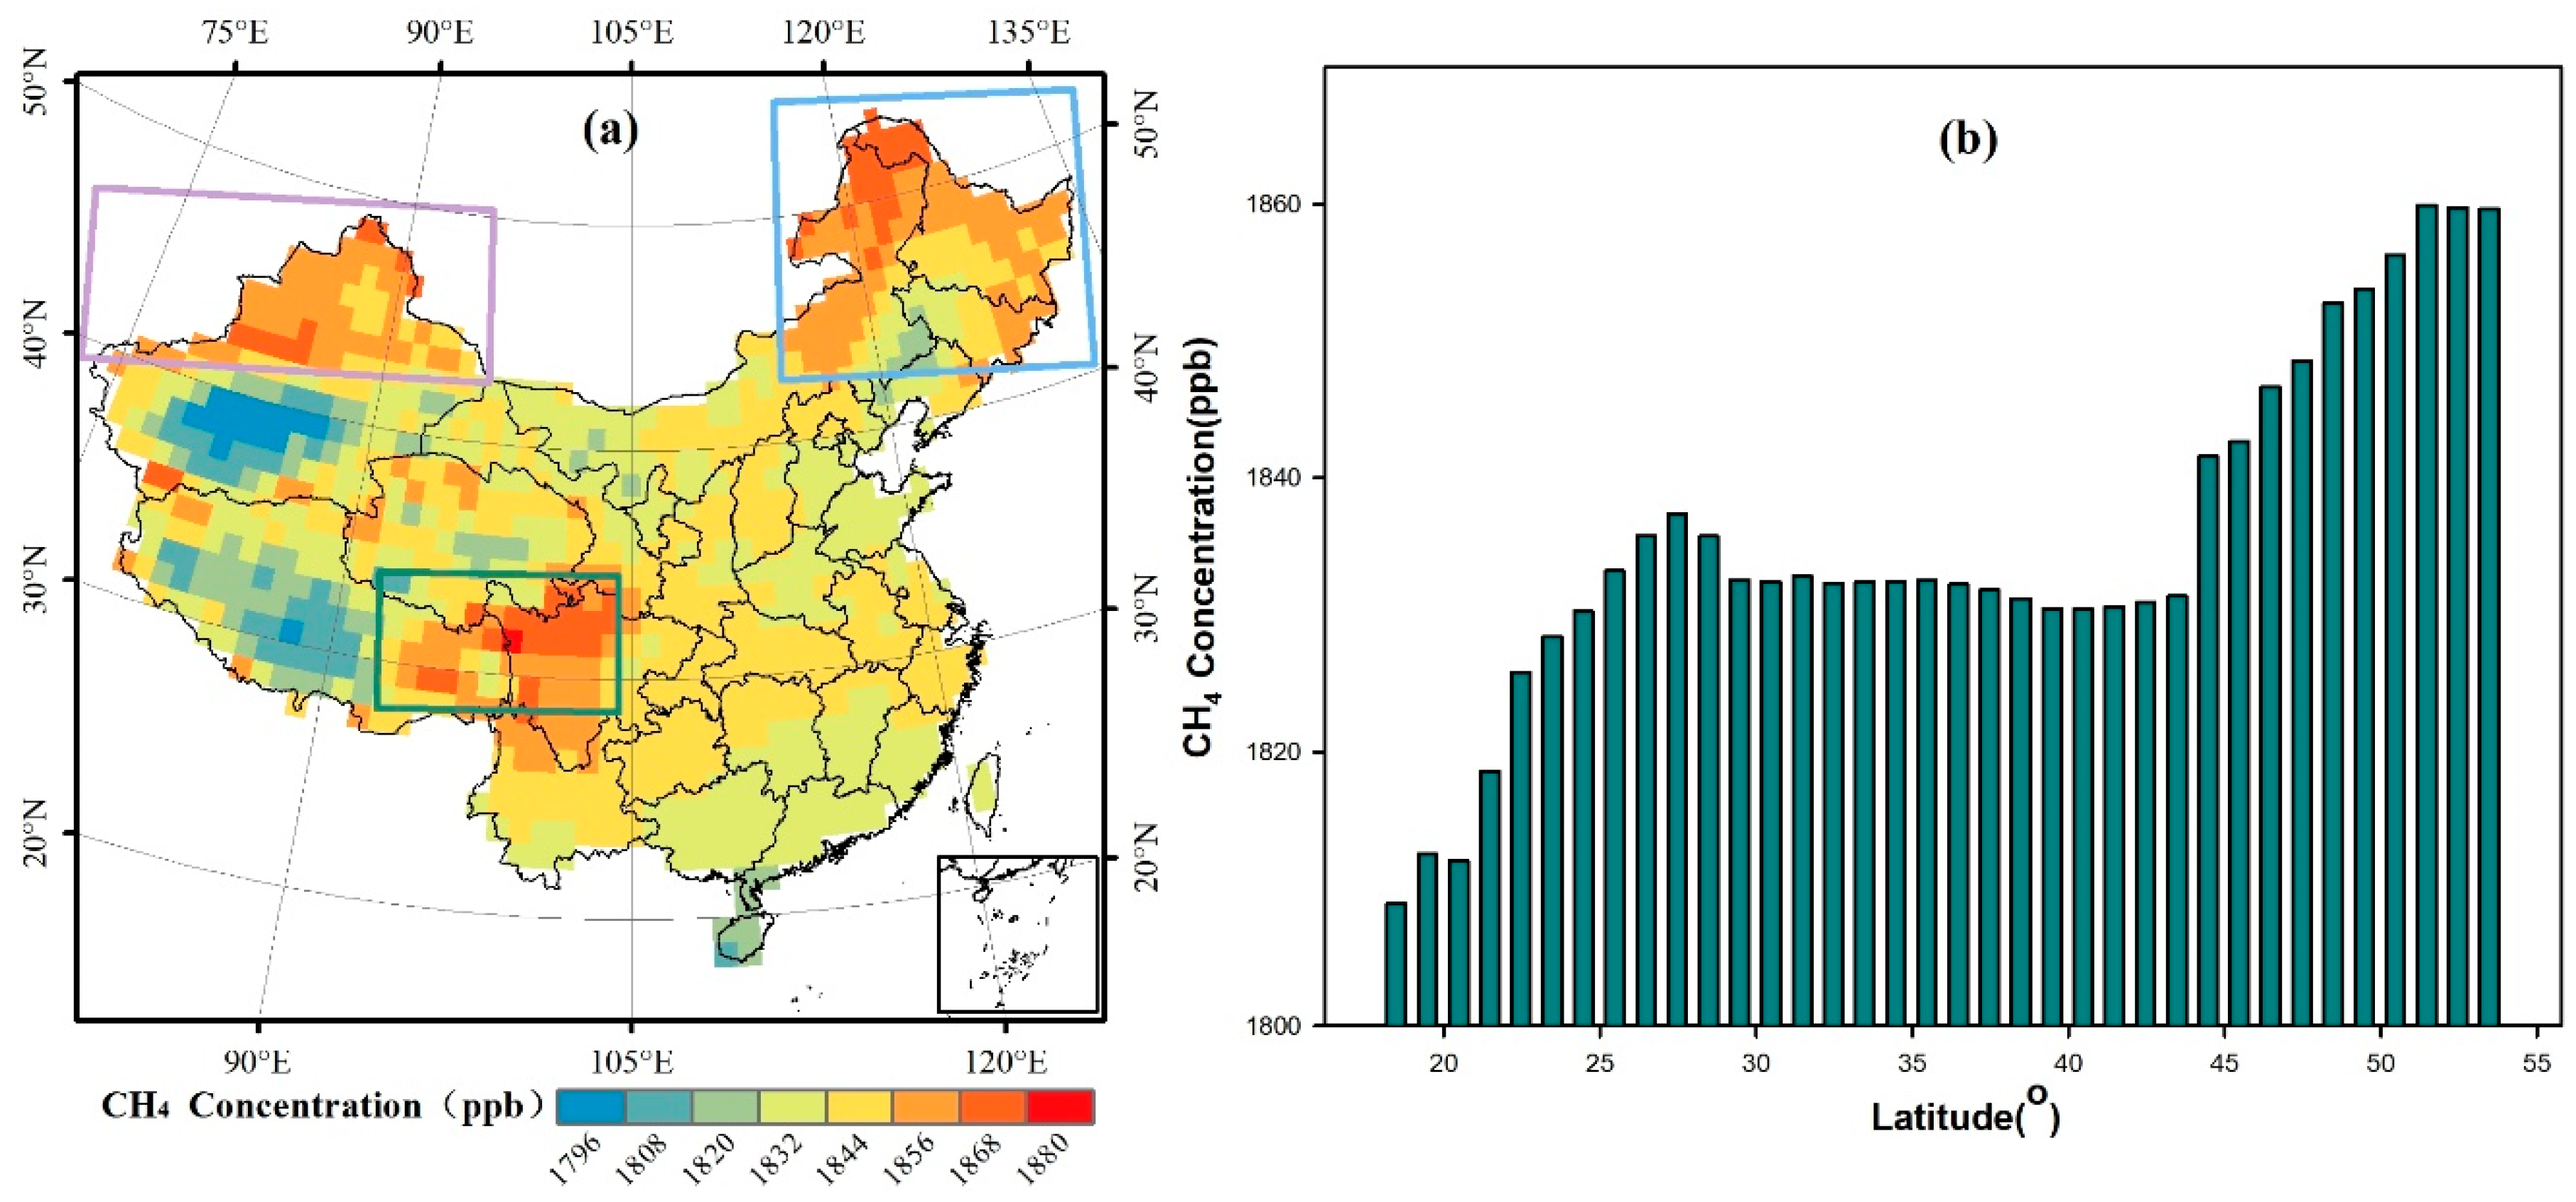
The multi-year-averaged AIRS CH4 concentration across China during 2002–2016 is described in Figure 3a. The CH4 concentration ranged from ∼1784 to 1877 ppb, with a mean of 1832 ppb and a standard deviation of 14 ppb. On the whole, although CH4 concentration did not show great spatial variation across China, it still presented some spatial clusters. The CH4 concentration presented apparently latitudinal zonal distribution characteristics, showing high CH4 concentrations in the north, and low CH4 concentrations in the south (Figure 3b). The spatial pattern of atmospheric CH4 was influenced by emission sources and the accumulation of atmospheric transport. Zhang [58] pointed out that CH4 emission sources demonstrated latitude and seasonal changes, and that the photochemical reaction of CH4 with OH radicals is affected by solar radiations [59]. Methane at low latitudes is more frequently consumed by photochemical reactions, and it has a life cycle of about 12.5 years. Therefore, the accumulation of CH4 in the atmosphere is explained by latitudinal differences, which are characterized by lower CH4 concentrations in south China than in the north, while in central China, the concentrations are relatively stable because of the effect of the low Qinghai-Tibet values.
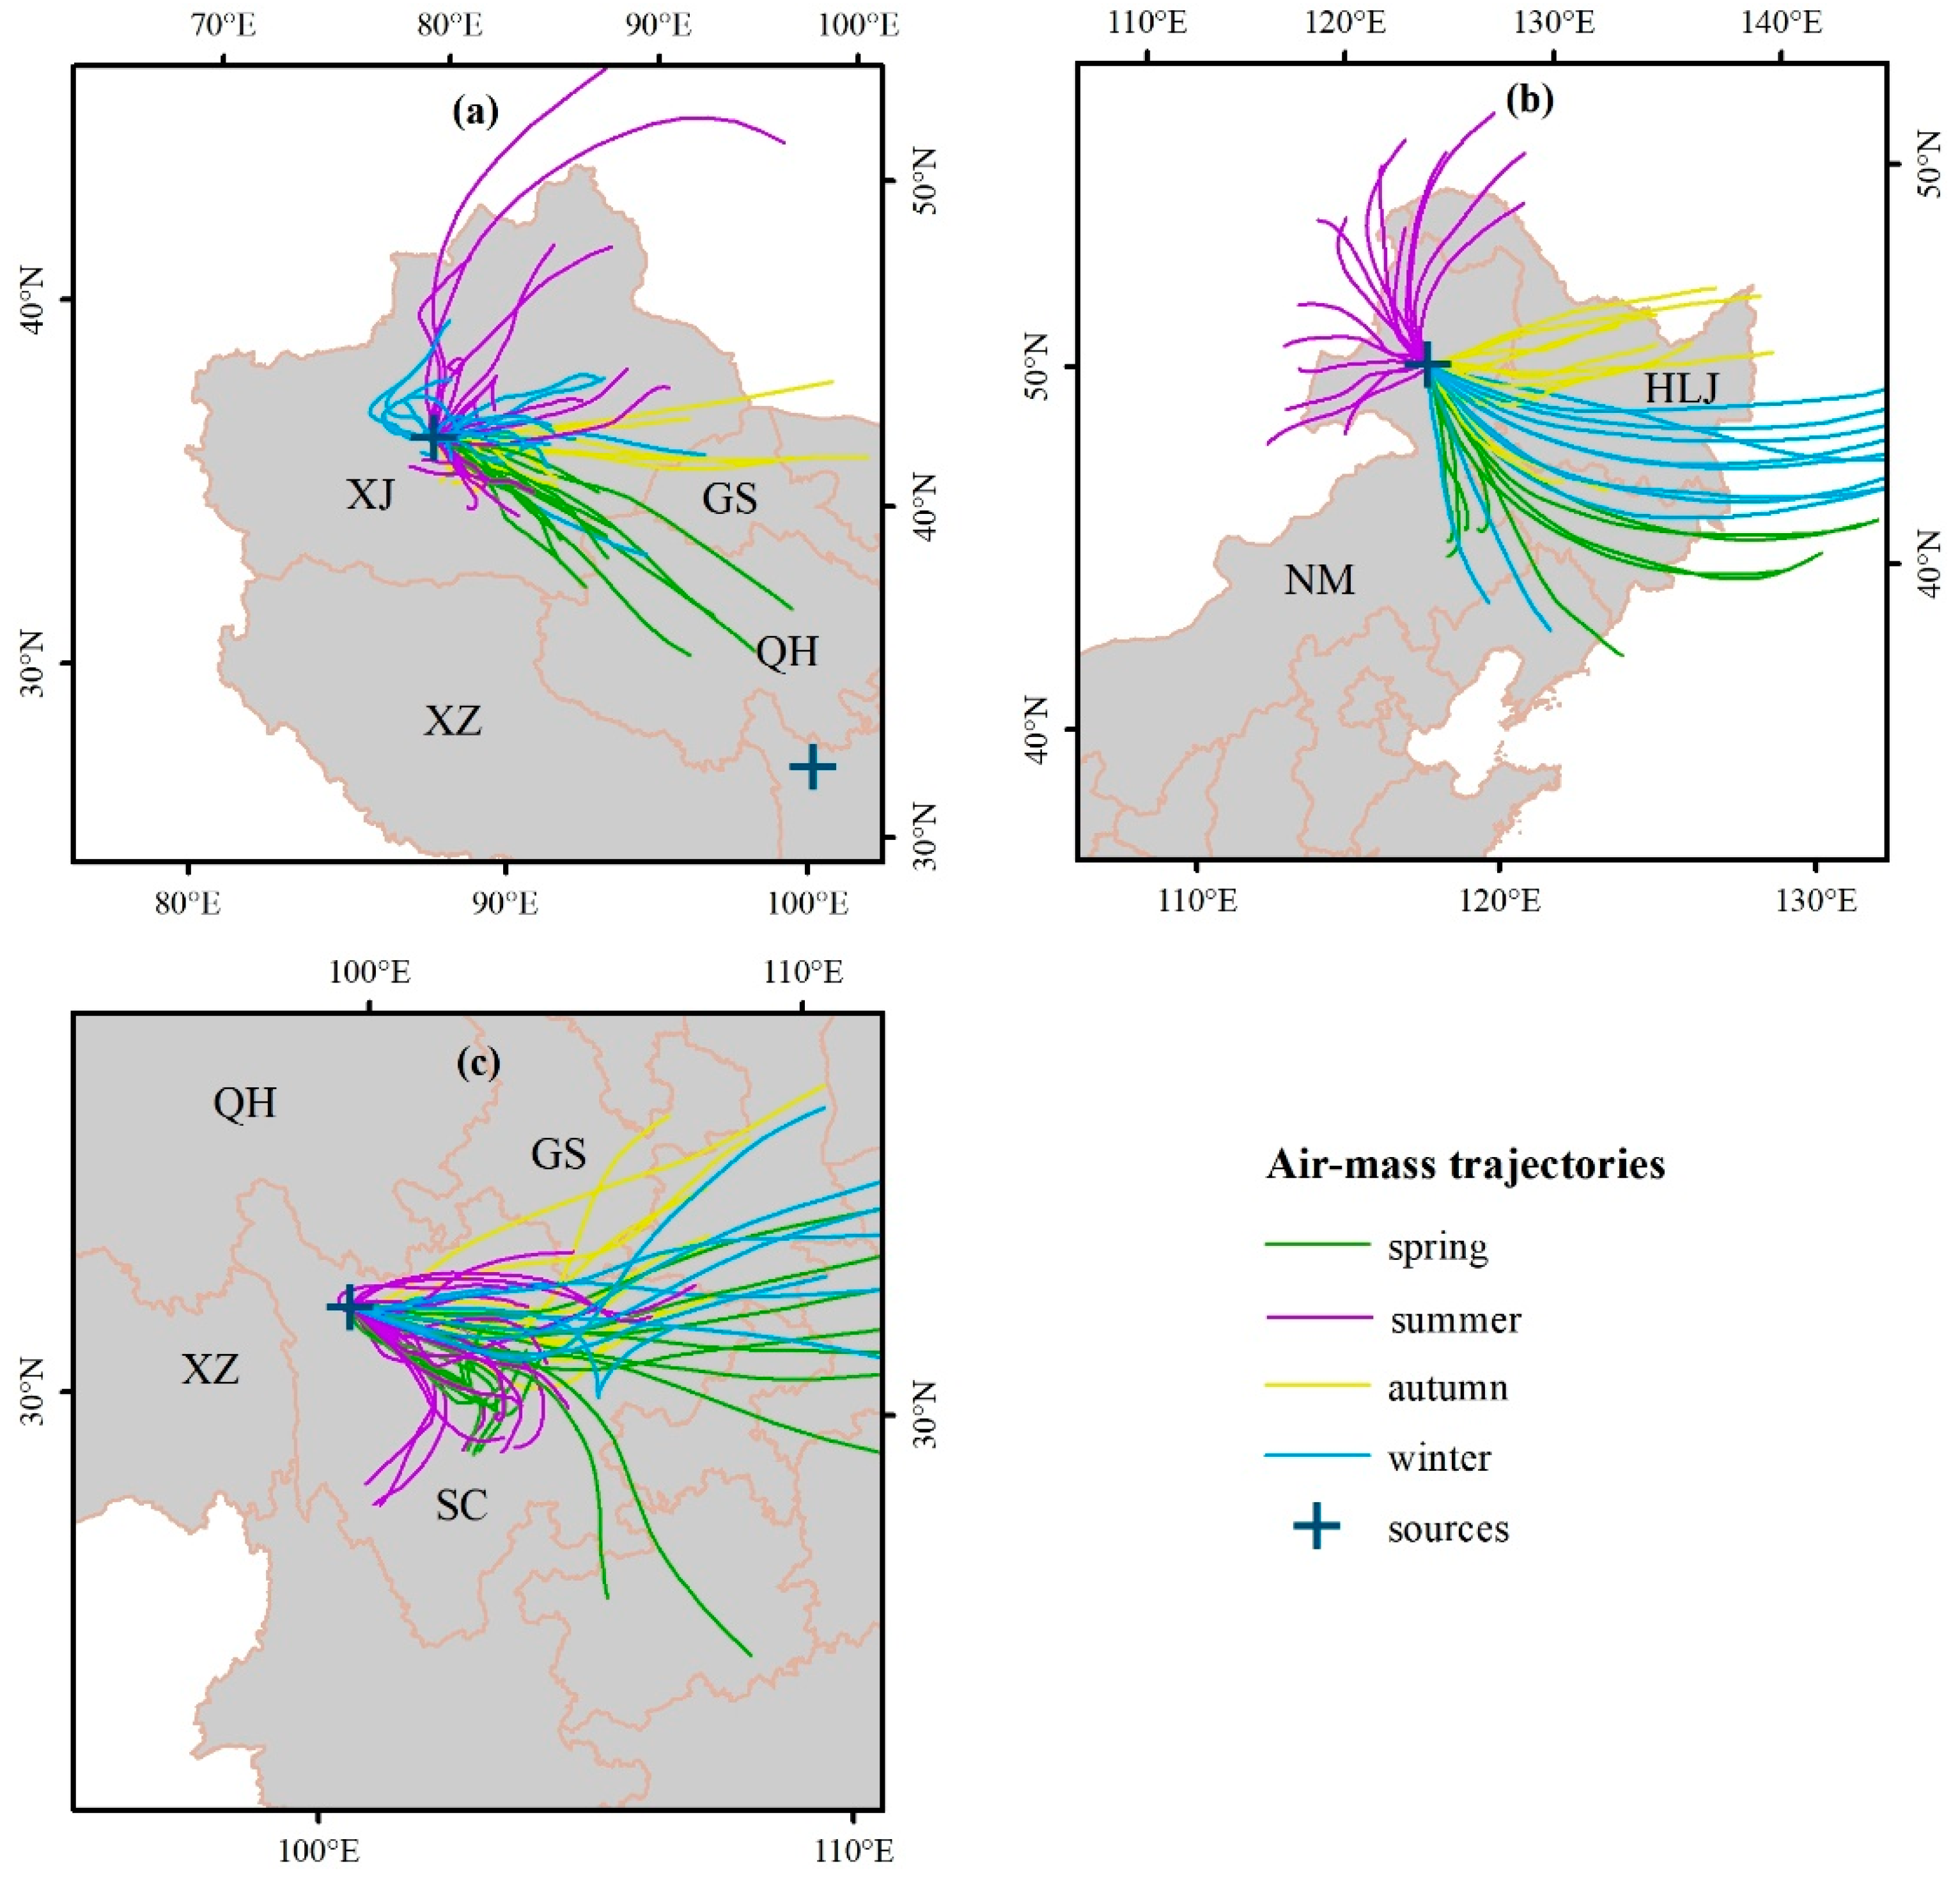
Moreover, the rice paddies and wetlands, and their related natural characteristics and human activities, resulted in higher CH4 concentrations in the eastern regions of China than those in western China [22,60]. Three hotspots of CH4 concentration over China were found. In this regard, taking the air-mass backward trajectories of different seasons in 2007 (Figure 4) as being representative, we further analyzed the cause of the high-value accumulations.
Region I features oil/gas production, with the two well-known oil/gas production bases of Tarim Basin and Junggar Basin [61]. Geological CH4 is the second largest natural source after wetlands [62]; leakage of oil/gas basin geology, fossil fuels, raw coal, and leak explorations for natural gas are all likely to lead to high values of CH4 concentrations in northern Xinjiang. Table 1 shows the incidence of higher CH4 emissions from oil/gas production and fossil fuel fires in Region I, compared with the national average. Also, the formation of high CH4 concentration centers is related to the local terrain, and to air-mass transmission (Figure 4a). Table 2 suggests that the back-trajectories might carry a large amount of CH4 emissions to Region I in summer and winter. In summer, the air masses were mainly from the north, and the CH4 concentrations were still low to the south of the Tianshan Mountains, due to the barrier of high altitude, which would cause a locally high concentration of CH4. In winter, the air-mass was mainly from the west, but a few air clusters from the east were still circling over a small range, leading to the accumulation of CH4 concentration in autumn and winter in this region, compared with the surrounding atmosphere. Moreover, based on the re-analysis of the monitoring data of meteorological stations in northern Xinjiang, the annual average wind speed in northern Xinjiang was 2.89 m/s from 1960 to 2013, and the strongest wind speeds occurred in spring and winter, accounting for 41.8% and 25.5% of the total timeframe, respectively [22]. Also, Liu [63] pointed out that according to surface monitoring, the dominant wind direction on the surface in northern Xinjiang from 1999 to 2013 was from the west, west-northwest, and northwest, with occurrence frequencies of 11.9%, 10.2% and 12.9%, respectively. The CH4 concentration in this region remained at high values throughout the year, especially in summer and winter, followed by autumn and spring, which was also consistent with the seasonal characteristics in Region I.
Region II had some potential CH4 sources. First, this area had the largest area of permafrost and island-like permafrost, which was a potential source of CH4 emissions in the case of drastic climate change or geological movement [64]. Second, this area had a large area of wetland forest, which was one of the main CH4 sources [65]. Ding and Wang estimated that 67% of methane emissions are from freshwater swamps in northeast China [66]. Third, burning coal/oil/gas for heating in winter also leads to large CH4 emissions in Region II (Table 1). Moreover, the high CH4 concentrations in northern Inner Mongolia may also be related to the breeding of large numbers of ruminants [67,68]. According to Table 1, a part of CH4 emissions in Region II came from animal husbandry, including enteric fermentation and manure management. Paddy fields and municipal waste landfills in Region II also produce a large number of CH4 emissions. Furthermore, considering the elevation and the local terrain, Region II possesses a plateau in the northwest and a plain in the southeast, which means that this area is relatively open in the south. In summer, the air-mass mainly comes from the northwest, and in spring, autumn, and winter, from the southeast (Figure 4b). Therefore, the high concentrations of CH4 components brought by the air-mass hardly diffuse, especially in autumn and winter, which would cause a high rate of CH4 accumulation.
The high CH4 concentration in Region III mainly resulted from the transport of high methane emissions, as well as the transmitted CH4 from the lower troposphere to the upper troposphere during the monsoon period [66,69,70]. CH4 emissions from rice paddies in the Sichuan basin during summer are one of the main reasons, and they cause the CH4 to increase significantly over a larger range around the natural sources, in summer [71]. Table 1 demonstrates that the higher CH4 emissions in Region III came from agricultural soil and municipal landfill, compared with other regions. The CH4 emissions of landfill gas are positively correlated with the amount of landfill gas. The higher the population density, and the more developed the economy is, the higher the landfill gas output will be [72,73]. The air-mass from the southeast brings large amounts of CH4 gases, and these accumulate here, due to the high plateau pressure (Figure 4c). Atmospheric transport has a far greater impact on Region III than on the other two regions, with possible CH4 emissions being more than twice as large as those in other regions (Table 2). The evidence is that a strong enhancement of the CH4 plume was found by AIRS, from the surface to about 10 km altitude, along the latitude of 35° over 70°–140°E in summer [9], which is consistent with our conclusions. In addition, there is a stable high-value center along the Himalayas, which may be associated with geological emissions of the fault zone, but the specific reasons need to be further confirmed [21].
We found that the average atmospheric CH4 concentrations of the three regions were higher than the average CH4 concentration, and that the maximum values appeared in Region III. CH4 in Region II was higher than that of the emission inventories in China (Table 1), which indicates that high levels of CH4 emissions do exist on the surface. Meanwhile, the CH4 emissions in Region I and Region III were relatively lower than the national average, confirming a strong transmission from the troposphere by the air-mass. Methane has a long life cycle as a greenhouse gas, and it is remarkable that the CH4 distribution in the upper troposphere, as detected by satellites, was not only correlated with emission sources on the ground, but was also related to the transmission of atmospheric motion. This was also an important reason for explaining the uncertainty of the sources of CH4 spatial distribution, which we should not neglect.
3.3. Seasonal Variations of CH4 Concentration over China
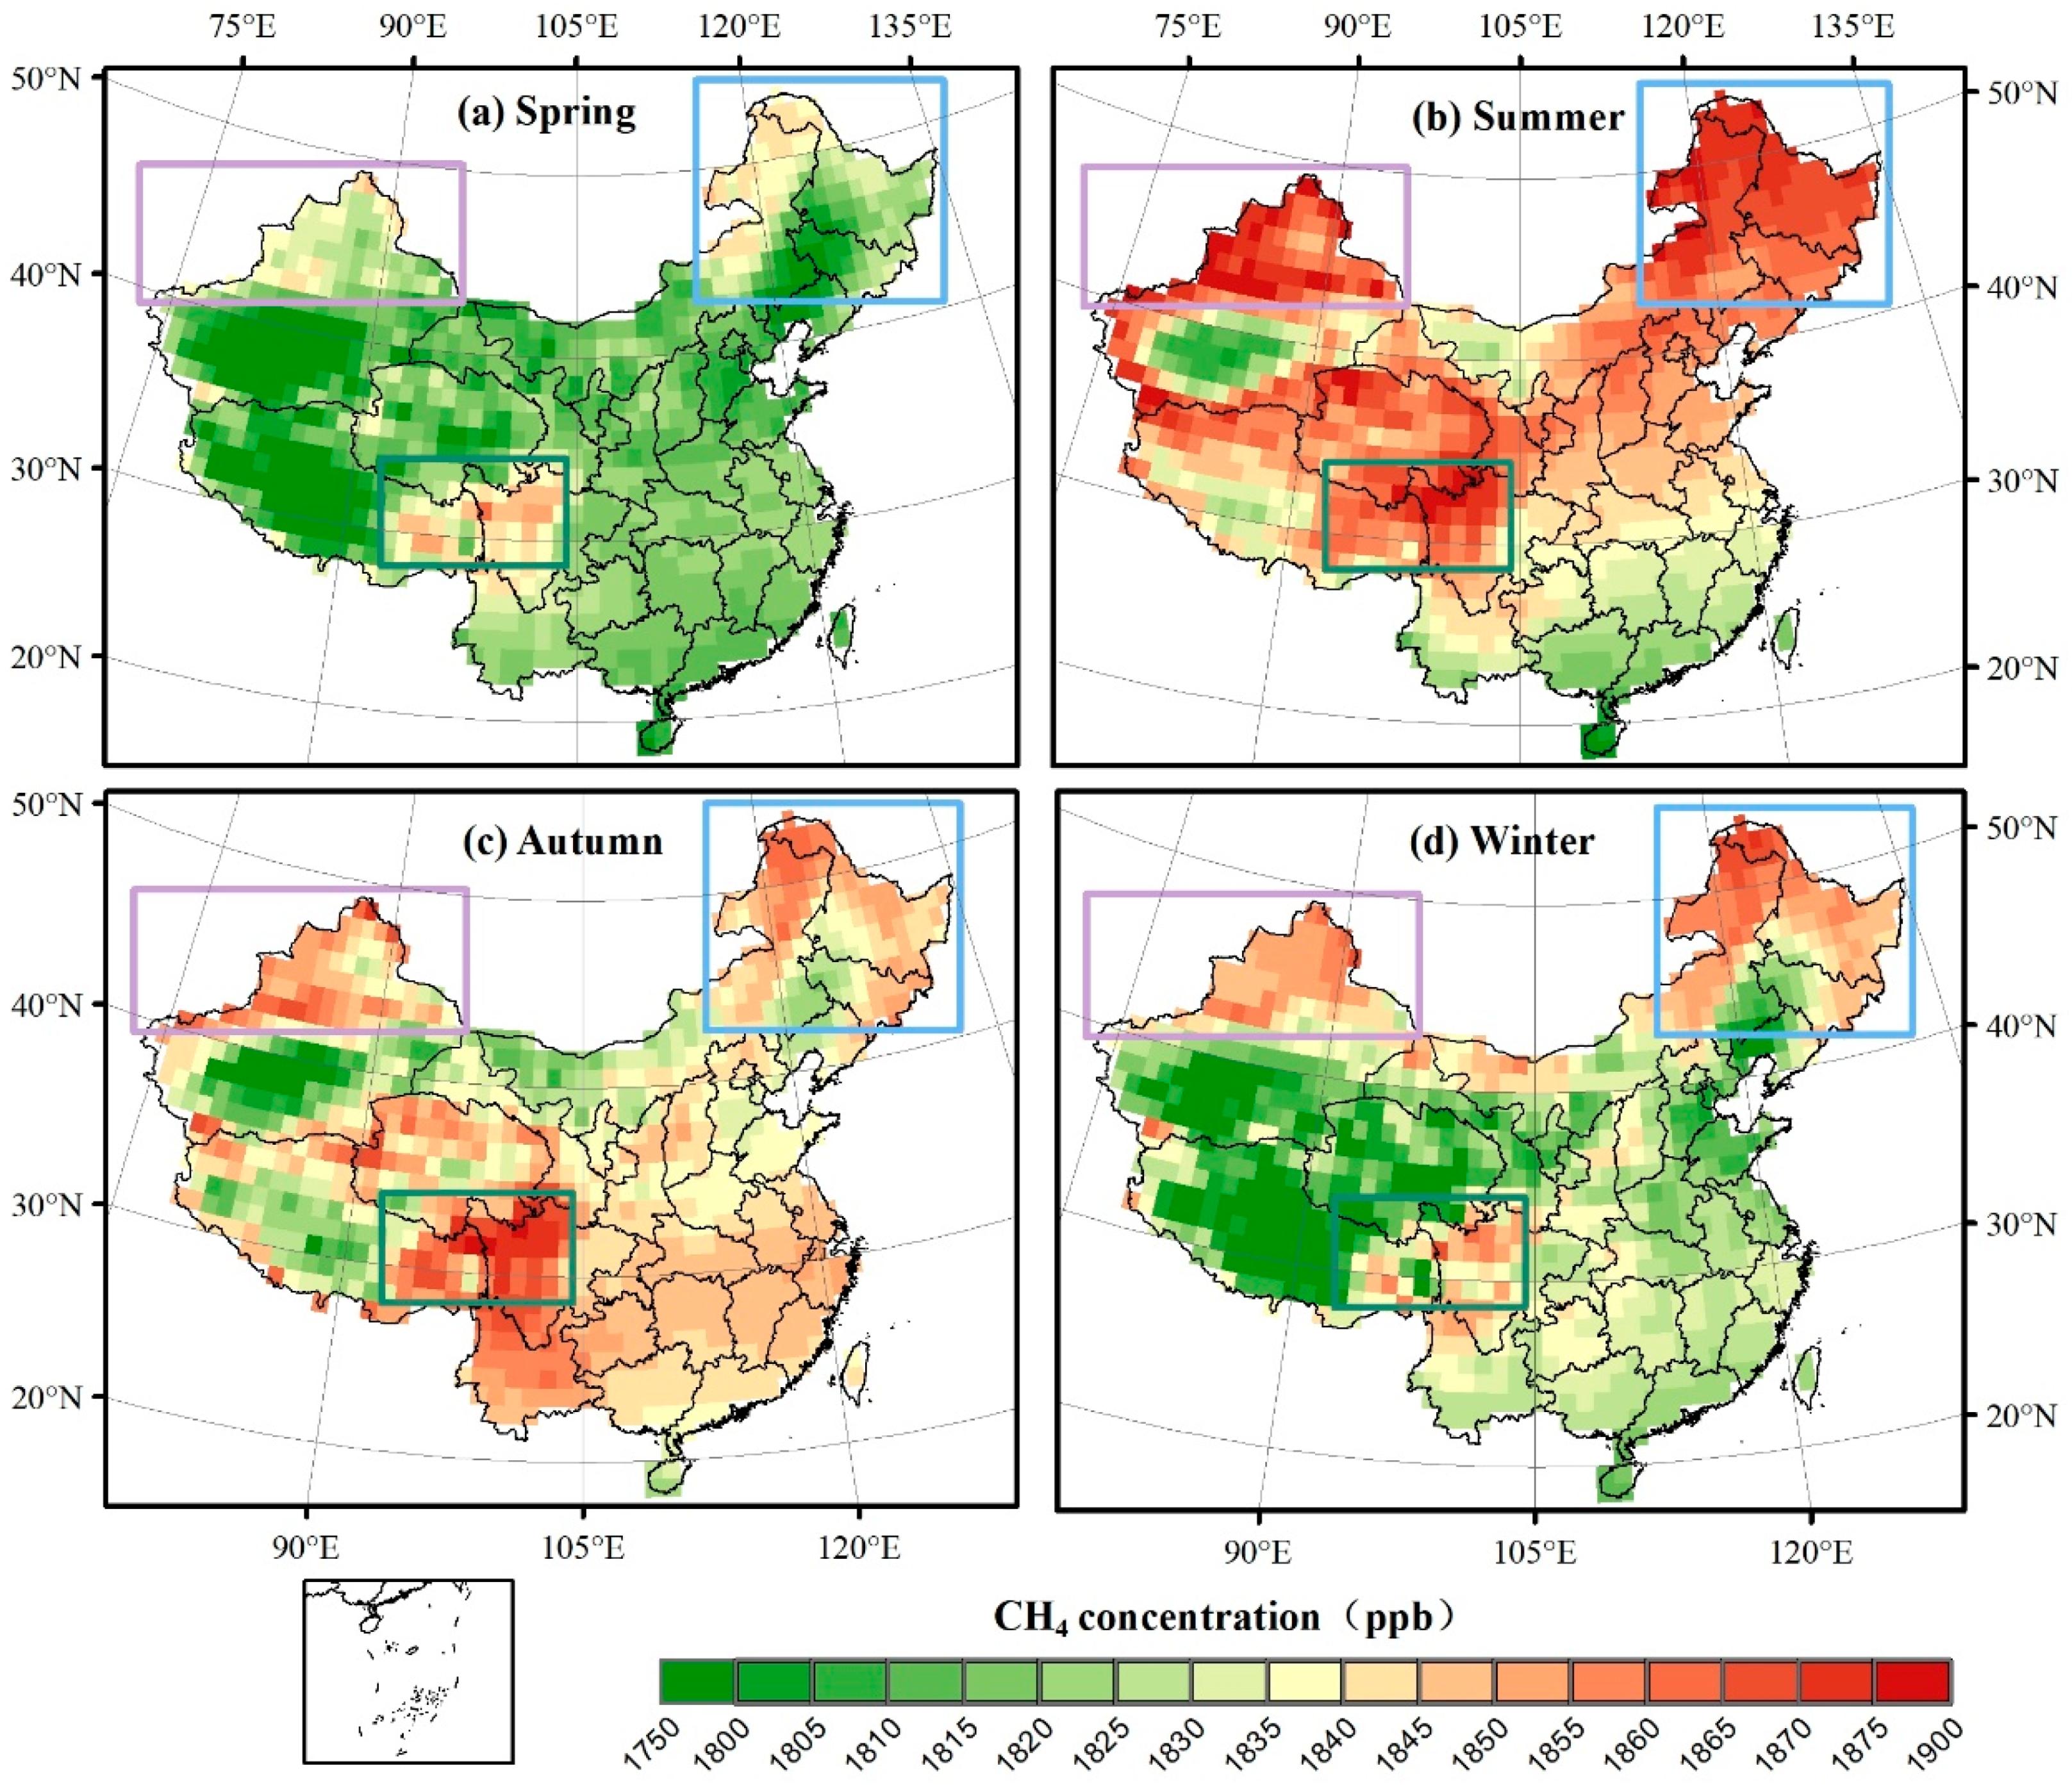
The averaged CH4 concentrations in China over the four seasons during 2002–2016 were 1816.99, 1850.39, 1840.85, and 1827.32 ppb, respectively. The peak of CH4 concentration occurred in summer, the lowest was in spring, and the autumn and winter concentrations were within this range. The averaged CH4 concentration in spring was about 1816 ppb. Contrasted with spring, the CH4 concentration over the entire area was almost 1850 ppb in summer, an increase of nearly 33 ppb. Then, the CH4 concentration decreased slightly in autumn and winter. Compared with the average, the AIRS CH4 concentration in China’s sites (WLG, SDZ, LLN) showed quite similar variations around the averaged CH4 concentration (Figure S3). The CH4 concentrations at all sites showed the highest values in summer, and the lowest values in winter, followed by autumn and spring. In contrast, the highest CH4 concentrations for other regions were found to be in autumn, followed by spring, summer, and winter. The different characteristics between China and other regions may be caused by the location and different patterns of atmospheric CH4 convection transport in different areas [9,56]. On the whole, the seasonal CH4 variations of AIRS in China remained consistent with the surface sites. As the temperature in summer and autumn is significantly higher than that in spring and winter, the increase of the temperature can undoubtedly create favorable conditions for methane biological source emissions. Studies have shown that there is a significant correlation between CH4 emissions and temperature [25].
CH4 mainly reacts with OH radicals in the troposphere via photochemical reactions. Due to the uniform solar radiation in low latitudes, the concentration of OH radicals are basically stable, with little seasonal variation [59,74]. The areas to the west of the Hu line appeared with obvious seasonal variations, and the averaged CH4 concentration difference between summer and winter was nearly 60 ppb. The combined effects of enhanced emission sources and pollution gases transmitted from the bottom troposphere to the mid-upper troposphere from the southeast contribute to the obvious high CH4 concentration in summer. The oxidation-cleaning effect of OH radicals was clearly weaker than that of the transportation of pollutants [75]; the reacted OH radicals by CH4 accounted for 20% [76,77,78]. The spatiotemporal distributions of the troposphere atmospheric OH radicals were simulated from Mozart-4 in China. Based on the results, the concentrations of OH radicals were the weakest in winter, and were relatively higher in the eastern regions, with heavier pollution in summer. In north China and south China, there are apparent high CH4 centers, and the lowest OH values were found in the western plateau regions, due to less human activity, which were caused by the differences in the emission intensities of the precondition sources of the OH radicals [79].
Figure 5 shows the spatial distribution of the averaged CH4 concentration in different seasons. It can be clearly seen that most of the maximum CH4 concentration months in China were distributed in summer, among which the maximal grid numbers of CH4 concentration in August and September accounted for 66.8% and 29.0%, respectively.
The maximum monthly distribution shows that the seasonal variation of CH4 concentration in China was characterized by high values in summer and autumn, and low values in spring and winter [22]. The highest CH4 concentration in southern China occurred in summer, and the lowest in spring, which was closely related to natural emission sources controlled by biological sources [22,24,60]. Also, high summer temperatures, and increased microbial activities and quantities may lead to rising methane emissions in rice paddies, wetlands, and swamps. Numerous studies have shown that the anaerobic processes of microorganisms in biological sources were closely related to temperature changes [80]. It is worth noting that the maximum methane concentrations in some parts of northwest China are in winter, and the minimums are in spring, which is consistent with previous results [22,81]. A time delay of one or two months represents the cumulative effect of atmospheric concentration and atmospheric transport [81]. The minimum methane concentration in the Qinghai-Tibet plateau appeared in winter, and CH4 biological sources emissions and permafrost releases of methane basically disappeared in winter, because of the low temperature [21], and lower impact from human activities.
3.4. Long-Term Trends of CH4 Concentrations across China
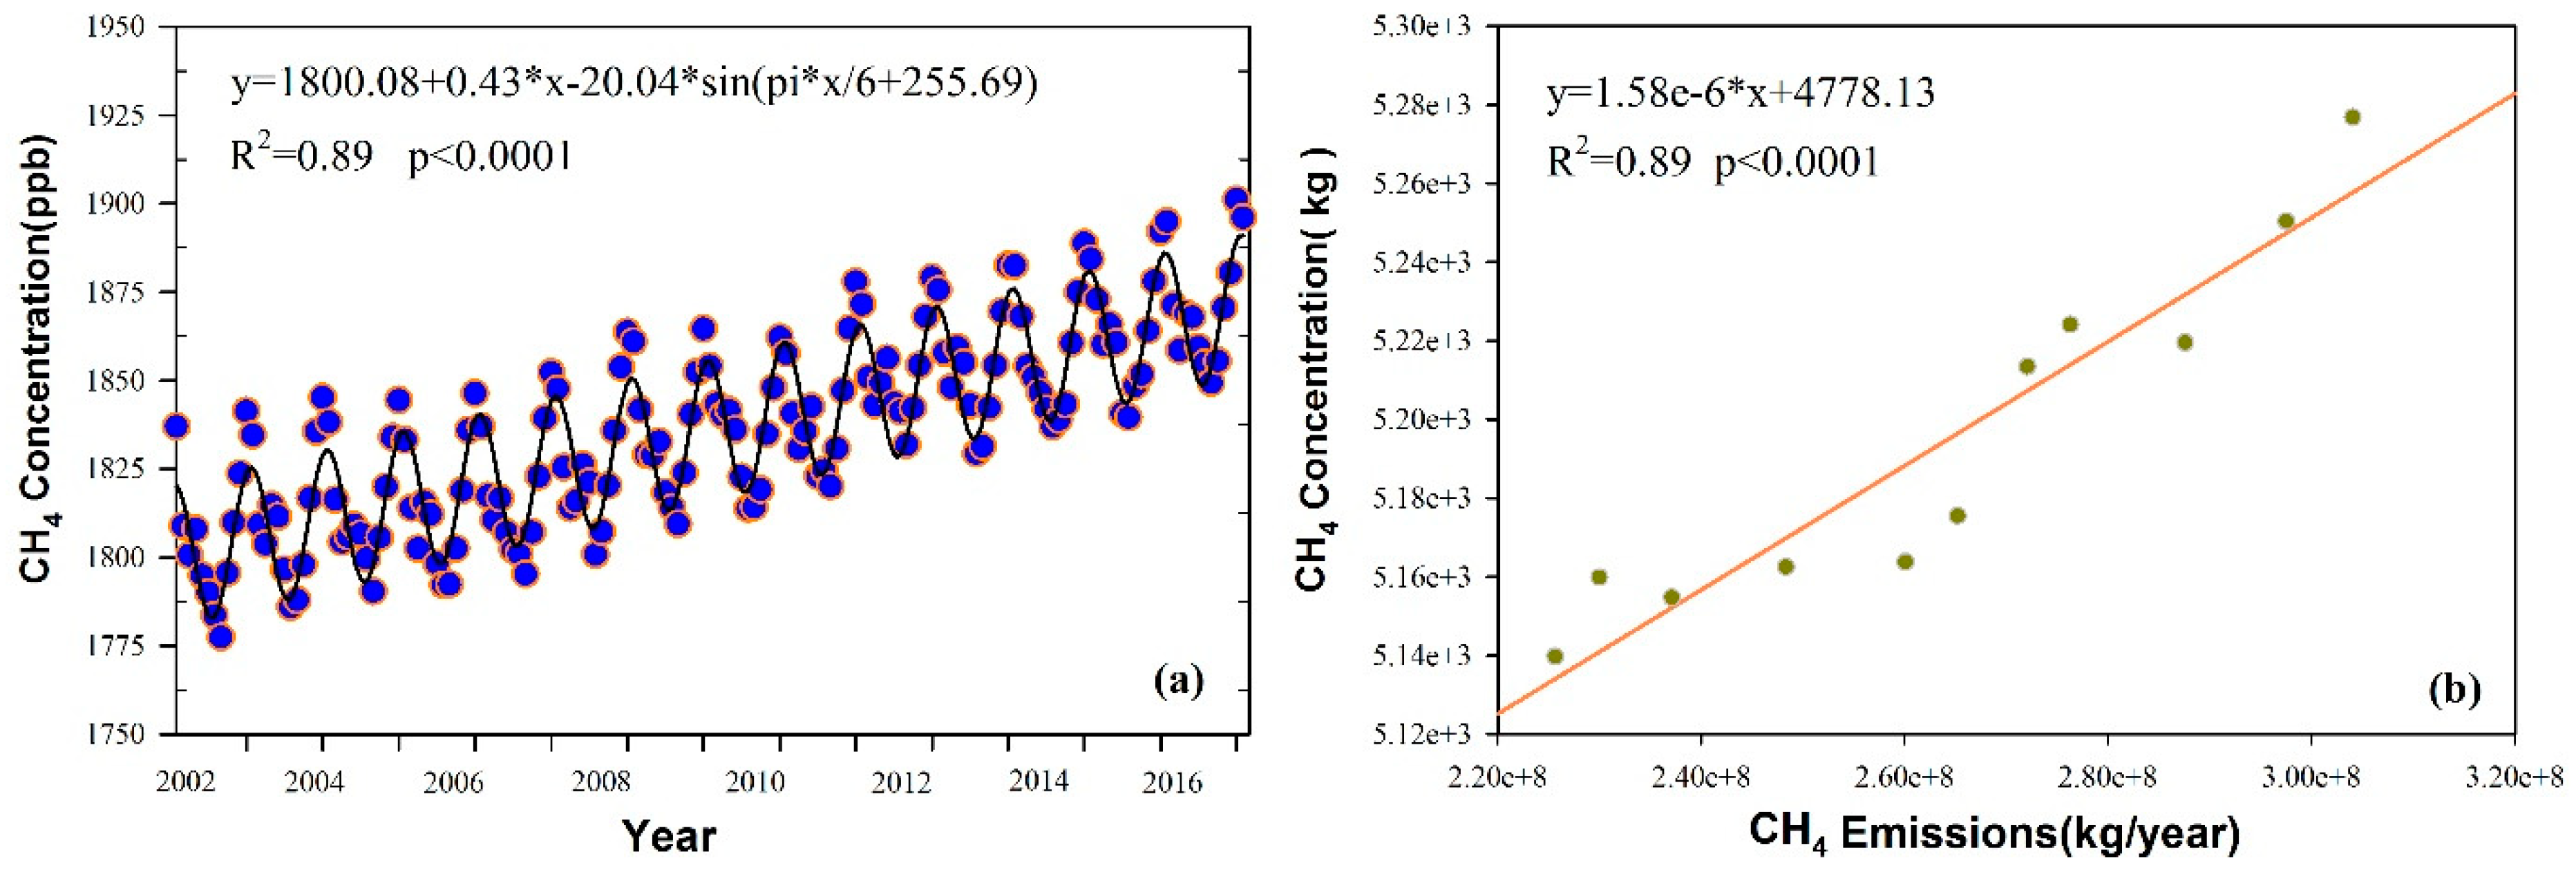
The sinusoidal curve (Figure 6a) across China from 2002 to 2016 gained a high R2 (0.89), indicating that the simulated model can reflect the seasonal and long-term trends of CH4 in China. The simulated CH4 concentration was 1800 ppb across China in January 2002, and then increased by 0.42 ppb·month−1 until December 2016. Moreover, the monthly differences in CH4 concentration were −20.04 in each yearly cycle, indicating relatively obvious seasonal variations over a 12-month cycle. Comparing the fitting coefficients among different surface sites (Table 3) the monthly average at all of the stations showed increasing trends, in line with the CH4 trend across China. Thus, the amplitude of seasonal change was quite different in each site. Notably, the differences in the amplitude of the seasonal cycle may contribute to the increasing proportion of the anthropogenic sources. The seasonal amplitude coefficient C was smaller in SDZ, LLN, TAP, and PDI, which may be related to frequent human activities. As China is developing rapidly, the proportion of methane emissions that are caused by human factors such as urban waste discharge, the development of animal husbandry, the increase of methane emissions from rice fields, and energy combustion, all contribute to lowering the seasonal CH4 change. Nevertheless, natural sources, such as wetlands methane, have increased slightly, and have even remained constant over recent years [6,7,10,18].
We also calculated the correlations between the CH4 concentration and emissions (Figure 6b). On a national scale, CH4 emissions had a strong influence on the CH4 concentration (R = 0.89, p < 0.01). The national CH4 emissions increased by 32.2% from 2002 to 2012, while the CH4 concentration increased by 3.14%. Furthermore, the simulated slope of the CH4 concentration to emissions was 1.58 × 10⁻⁶, indicating quite a strong relationship between atmospheric methane and emissions, and that part of the atmosphere methane gases sank, transferred, or chemically reacted in different ways. Moreover, the emissions from the east coast of China could also be advected in the atmosphere over the Pacific Ocean, and consequently not detected in the AIRS signal over China. Obviously, there was no direct equivalence between the atmospheric methane concentration and its emissions.
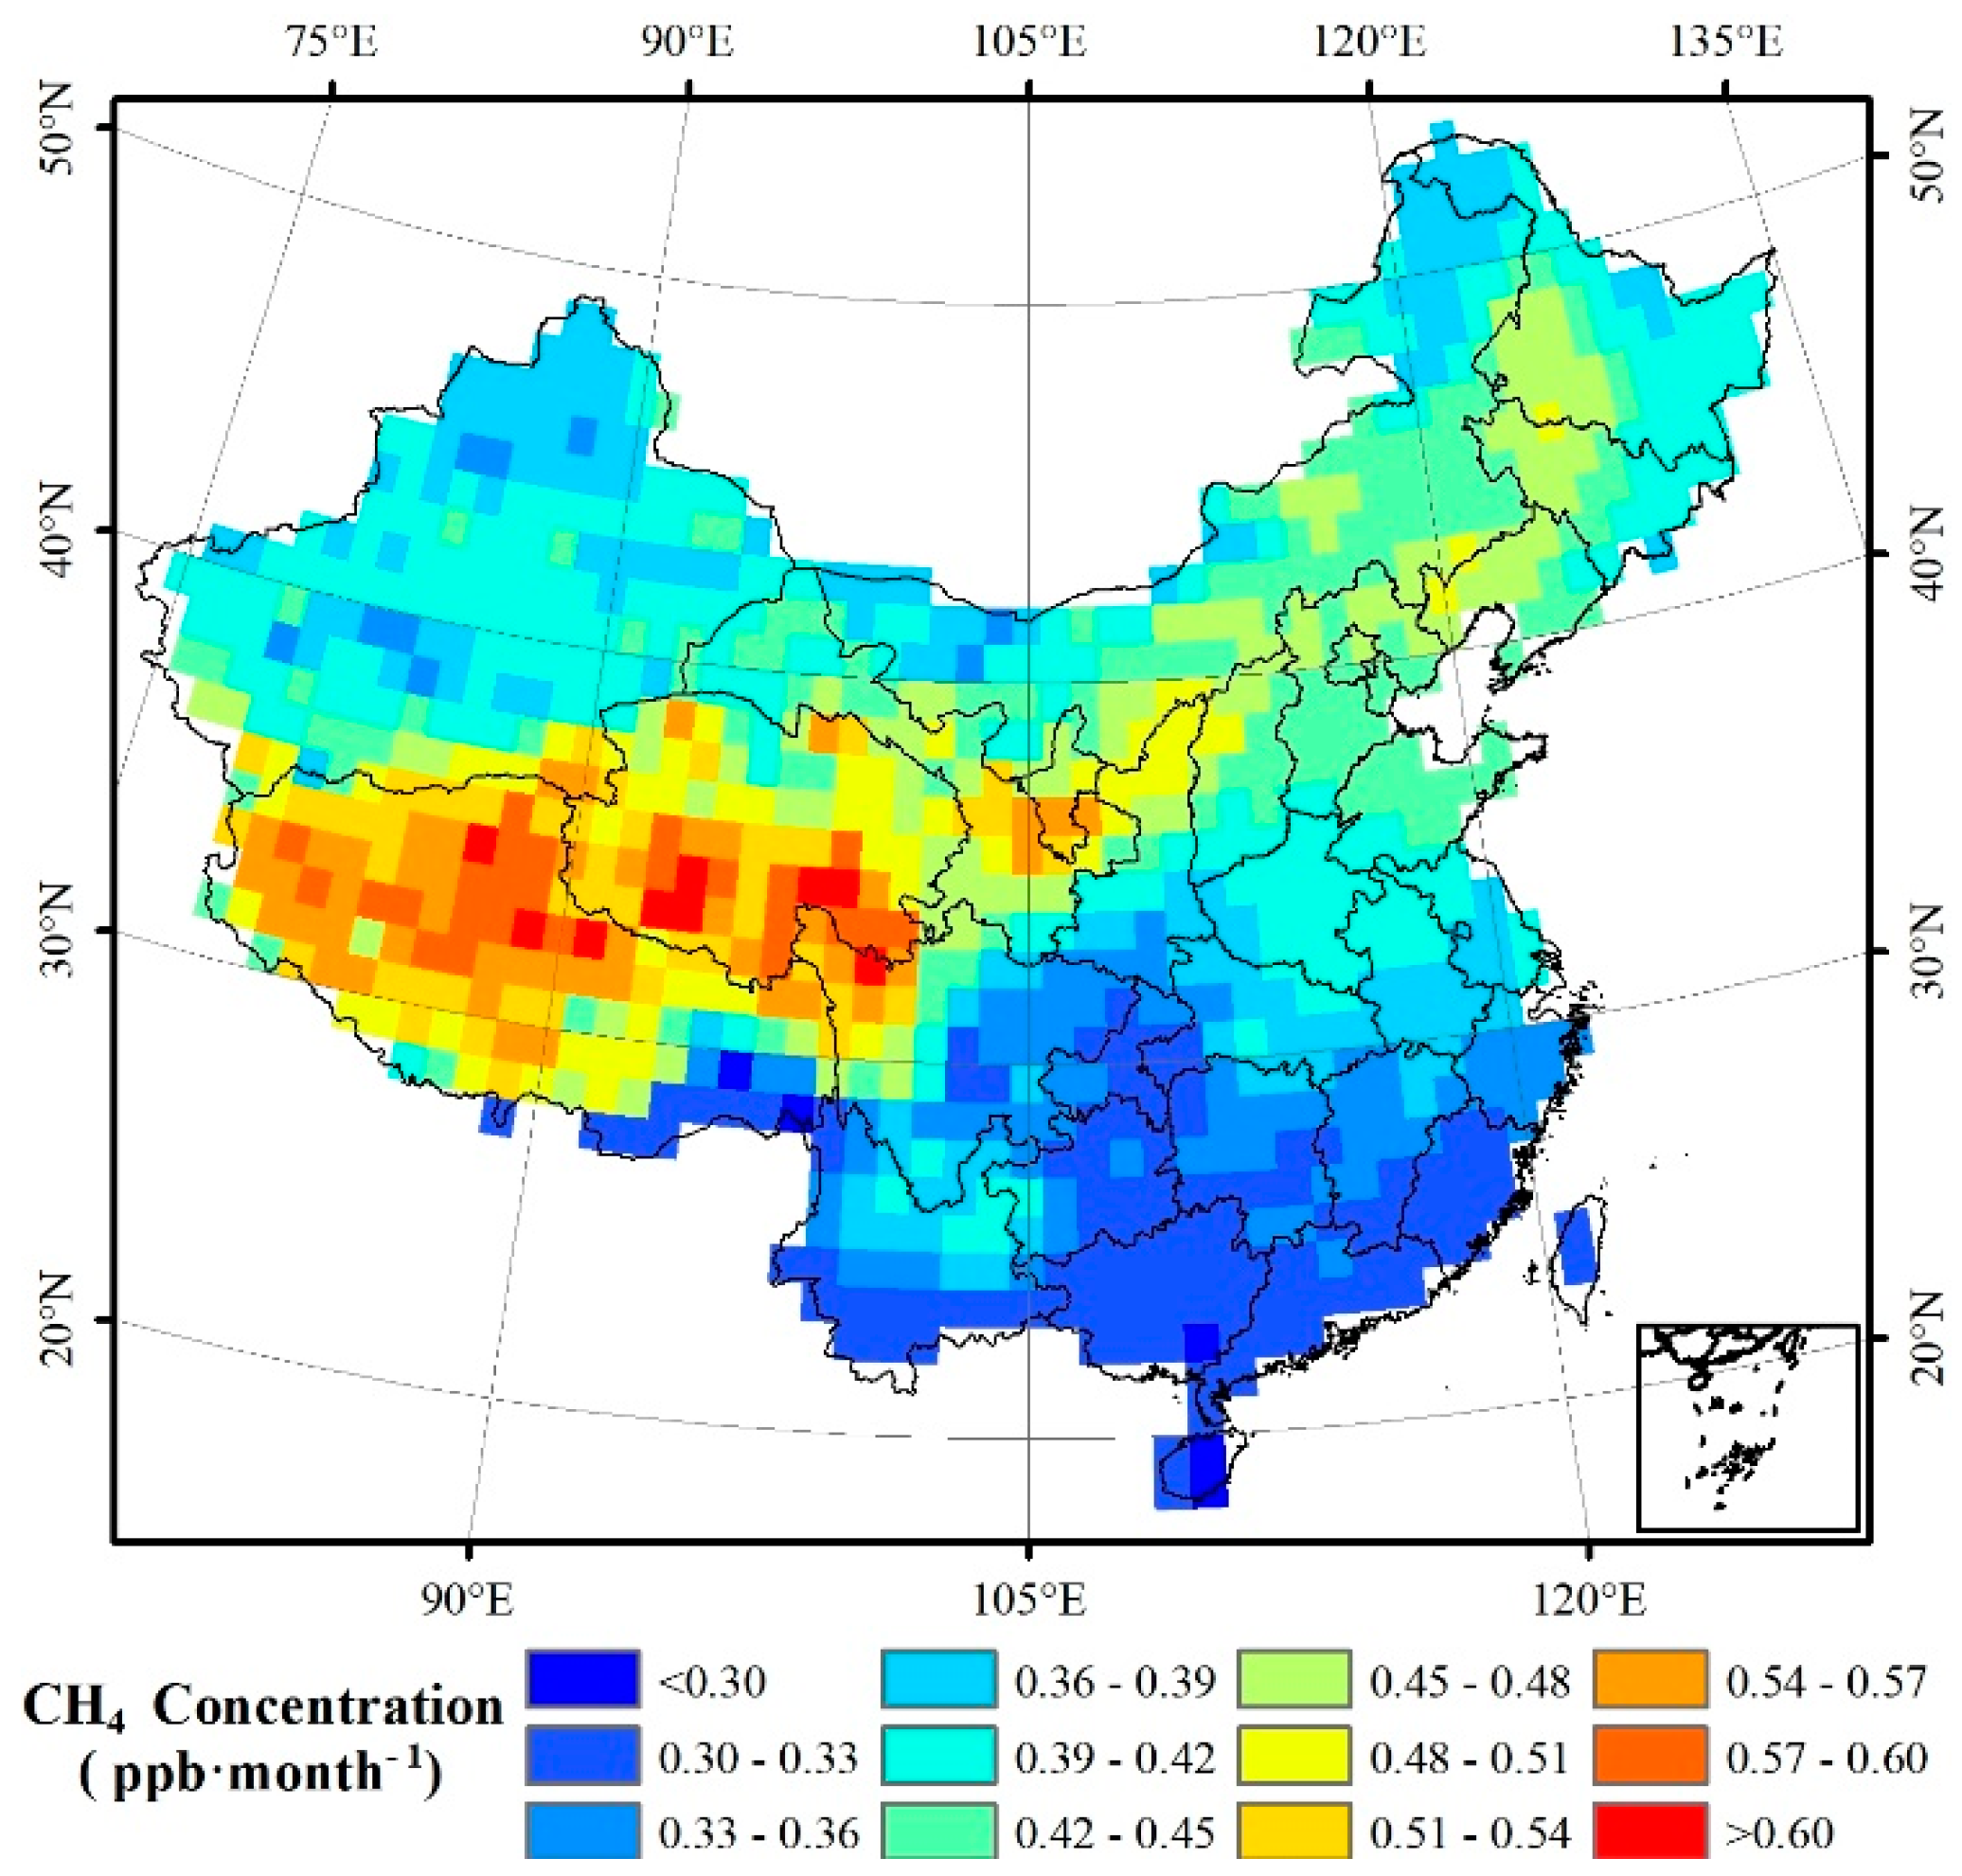
The monthly increased CH4 concentrations at each pixel are shown in Figure 7. The monthly CH4 change rates ranged from ∼0.29 to 0.62 ppb·month−1, with a mean of 0.42 ppb·month−1, and a standard deviation of 0.07 ppb·month−1. The fitting degree ranged from 0.41 to 0.95 (p < 0.0001), as most grids showed high fitness (Figure S4).
The CH4 concentration across China showed positive growth, with dramatic growth mainly distributed across the Qinghai-Tibet plateau and in northwestern China, and the lowest growth in the south. This shows the need to pay attention to the rapidly increasing rate of CH4 concentration in the mid-upper troposphere, in western China.
The Qinghai-Tibet plateau is gradually becoming warmer and wetter [82]. The increased temperature has led to a deepening of the frozen active layer, releasing a large amount of methane [83]. Moreover, the net primary productivity (NPP) in the Qinghai-Tibet plateau is gradually increasing year-by-year, due to the rising temperature and precipitation [84,85], and also due to the annual average effective photosynthetic radiation amount reaching the national maximum of 2800 MJ·cm−2·yr−1 [86]. The increased temperature, the precipitation amount, the melting of glacier snow, and the permafrost have enlarged the lake area in the Qinghai-Tibet plateau, which increased the CH4 emissions [87,88,89,90]. All of these factors rapidly increased the changing rate of CH4 concentrations in the Qinghai-Tibet plateau.
The changes in CH4 concentration in northeast China are related to the natural swamp emissions in the Sanjiang Plain. The relatively rapidly increasing rates of CH4 concentration, extending from the Qinghai–Tibet plateau to the northeast, showed a faster growth rate along the ecotone between agriculture and animal husbandry. Farm soil is an important atmospheric CH4 source, in addition to the atmospheric photochemical reaction and changes in land use patterns. With yearly increases, excessive farming and grazing, and the degradation of natural grasslands to farmland, the ability of the soil to absorb CH4 is reduced [67,91]. This area is reported to have increasing amounts of precipitation, and the wetter environment will increase CH4 emissions [84,85].
The increase in CH4 concentration in northwestern China was mainly influenced by policies, including the migration of industrial centers from east to west, and the adjustment of industrial structures, which may lead to more energy burning and fossil fuel emissions [92,93,94]. Geological methane is the second largest natural methane source after wetlands methane. The micro-seepages of sedimentary basins, mud volcanism, sub-marine seeps, and geothermal fluxes (volcanoes and hot springs), are important atmospheric CH4 sources that are seriously underestimated, due to the complexity of their geological genesis [95]. Northwest China has become an important gathering area of oil/gas fields [62]. Some scholars have also tested the varying degrees of CH4 emission fluxes of micro-leakage methane in oil-bearing basins [95,96,97]. Secondly, with the increasing demand, methane emission from animal husbandry and the breeding industry is also increasing [98,99].
In contrast with the Qinghai-Tibet plateau, the changing trends of CH4 concentration in south China are much more stable, which might reflect relatively stable natural sources and anthropogenic sources. The natural sources in this area are mainly paddy fields. In China, the share of rice planting area in the world decreased from 22.8% in 1990, to 19.7% in 2000, and the estimated CH4 emissions from rice fields reduced from 30 Tg·a−1 to 10 Tg·a−1 over the last 20 years. At the same time, measurements and research that validated CH4 emissions from Chinese paddy fields gradually decreased, and were mainly related to the amount of fertilizer application and water management measures. Methane emissions from the exploitation and utilization of energy compensated for the reduction from rice fields. However, it still showed a trend of slow increase [100,101].
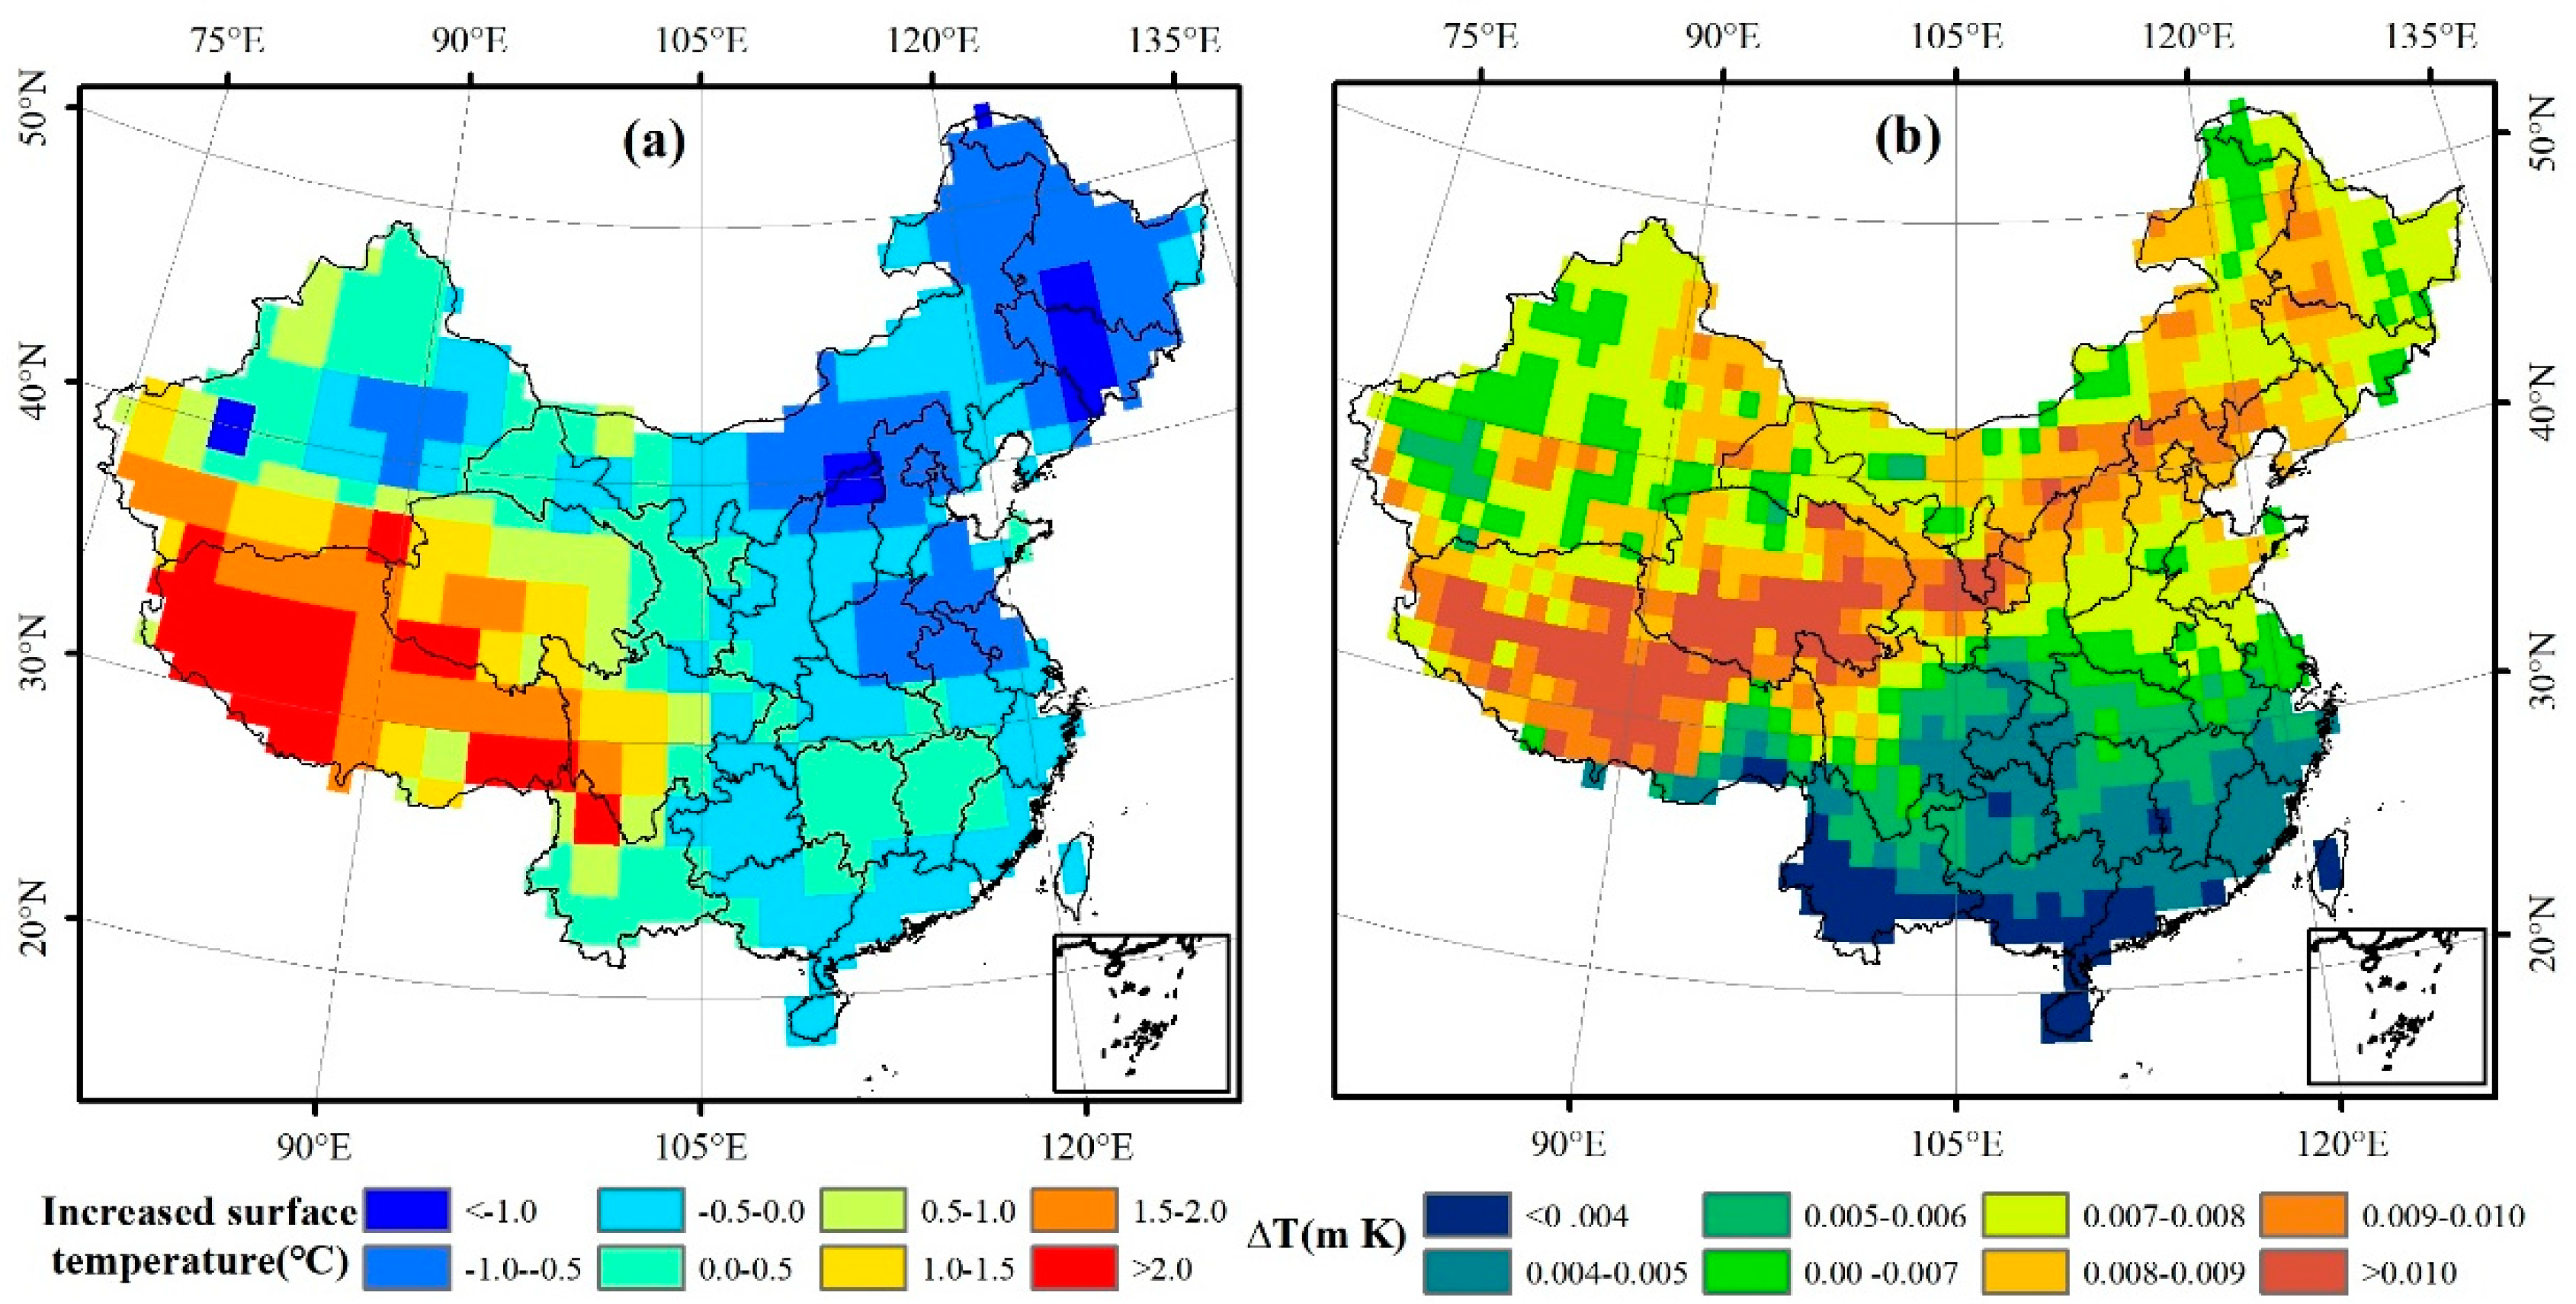
Furthermore, the increased CH4 concentration from 2002 to 2016 was calculated. The variation range of CH4 growth in China during the 15-year period was 14~103 ppb, showing great differences among the different regions. On the whole, the variation in northern China was stronger than that in the southern coastal areas. Here in this study, the annual AGTP of CH4 was calculated to be 4.6 × 10⁻¹⁴ K·kg−1 for a 20-year time frame, according to Equations (3) and (4) [50]. From 2002 to 2016, the CH4 concentration increased from 1813.64 ppb to 1870.56 ppb, the increased CH4 concentration could cause the average surface temperature to rise by 0.0075 mK for a 20-year time frame, and the contribution of the increase in atmospheric methane to ΔT for a 20-year time frame ranged from 0.0019 mK to 0.014 mK for the whole of China (Figure 8b). The highest global surface temperature response was observed in the Qinghai-Tibet plateau, with the lowest response resulting from emissions in Hainan Province. The above discussion clearly shows that although the surface temperature response is global, the contribution of CH4 in the atmosphere varies across different regions. The surface temperature response provides important information. Meanwhile, we found that the average of the annual temperature change in the Qinghai-Tibet plateau significantly increased over 2002 to 2016 (Figure 8a), and was much higher than that of other areas, followed by the northwest region. The rest of the regions remained basically stable. The rise in temperature is also a factor that indicates dramatic changes in this region.
As one of the long life-cycle greenhouse gases, the accumulation of CH4 could lead to climate change, even over a small range. The increases of atmospheric CH4 concentration in the Qinghai–Tibet plateau will lead to a rise in temperature, and at the same time the temperature can also promote CH4 emissions. The relationship between CH4 emissions and temperature is one of positive feedback; therefore, the methane changes in the Tibetan plateau deserve further study. The regional differences are very important, and they merit further discussion. Also, comparisons with other types of measurements or other satellite observations will help us to better explain the mechanism in greater depth.
4. Conclusions
In this study, the long time-series data of CH4 concentration derived from the AIRS sensor were used to discuss the temporal and spatial variation characteristics of CH4 across China, from 2002 to 2016. The AIRS CH4 concentration reflected the spatial and temporal variations of the surface CH4 concentration, as derived from a comparison between the AIRS CH4 products, and the results from nine observation sites in eastern Asia.
The spatial distribution of CH4 in the mid-upper troposphere in China was characterized by north/east highs, and south/west lows. The lowest values of CH4 concentration were generally distributed in the Qinghai-Tibet Plateau, and there were three significantly high-value zones, namely, northwest Xinjiang, northeast Heilongjiang/Inner Mongolia, and the Norgay Plateau in northwestern Sichuan. Combined with air-mass back-trajectories analyses, the results showed that the special spatial distribution pattern was affected by both emissions and atmospheric transmission. Additionally, the high value zones aggregations in the mid-upper troposphere on the Qinghai-Tibet Plateau were closely related to summer monsoon transmission in Asia.
The CH4 concentration in China showed obvious seasonal changes. The lowest values of CH4 concentration were generally distributed during March and April, which showed a high summer/autumn concentration, and low spring/winter concentration characteristics.
The CH4 concentration in China showed an increasing trend. The CH4 concentration from the Qinghai-Tibet plateau to northeast China, on a month-scale, showed the most dramatic changes, which may be closely related to rising temperatures and precipitation. Finally, the estimated surface temperature response caused by the increase in CH4 concentration from 2002 to 2016, over a 20-year time frame, ranges from 0.0019 mK to 0.014 mK across China as a whole.
Supplementary Materials
The following are available online at https://www.mdpi.com/2072-4292/11/5/538/s1, Figure S1: Distribution of nine ground-based stations in eastern Asia, Figure S2: Scatter plots of the monthly averaged surface CH4 concentrations from WDCGG and AIRS retrievals in 9 stations around China on annual scale from 2002 to 2016, respectively, Figure S3: Comparison of the seasonal CH4 concentration over China between AIRS and ground-based observations, Figure S4: R2 of the linear trend model in CH4 concentration by grids over China, Table S1: Specific information of the nine ground-based observation sites.
Author Contributions
X.W. and X.Z conceived the idea; X.W. and X.Z. conducted the analyses; Z.W., X.H. and X.C. contributed to the writing and revisions.
Funding
This study was supported by the National Natural Science Foundation of China (No. 41471343), and the major projects of the National Social Science Fund (17ZDA061).
Acknowledgments
This study was supported by the National Natural Science Foundation of China (No.41471343), and the major projects of the National Social Science Fund (17ZDA061).The monthly AIRS data used here are provided by NASA/ESRL (http://disc.sci.gsfc.nasa.gov/) and the data from ground-based sites was obtained from the World Data Centre for Greenhouse Gases (WDCGG) (http://ds.data.jma.go.jp/gmd/wdcgg/). We also greatly appreciate the free use of CH4 emissions data from Emissions Database for Global Atmospheric Research (EDGAR) (http://edgar.jrc.ec.europa.eu/archived_datasets.php#ghg) and the monthly surface temperature data from NOAA NCEP/DOE Reanalysis 2 (https://www.esrl.noaa.gov/psd/data/gridded/data.ncep.reanalysis2.html).We gratefully acknowledge the NOAA Air Resources Laboratory (ARL) for the provision of the HYSPLIT transport and dispersion model and/or READY website (https://ready.arl.noaa.gov/HYSPLIT_traj.php) used in this paper.
Conflicts of Interest
The authors declare no competing financial interests.
References
- Mosier, A.R. Soil processes and global change. Biol. Fertil. Soils. 1998, 27, 221–229. [Google Scholar] [CrossRef]
- Sussmann, R.; Stremme, W.; Buchwitz, M.; de Beek, R. Validation of ENVISAT/SCIAMACHY columnar methane by solar FTIR spectrometry at the Ground-Truthing Station Zugspitze. Atmos. Chem. Phys. Discuss. 2005, 5, 2419–2429. [Google Scholar] [CrossRef] [Green Version]
- Solomon, S. IPCC (2007): Climate Change The Physical Science Basis. In Proceedings of the AGU Fall Meeting, San Francisco, CA, USA, 10–14 December 2007. [Google Scholar]
- Ehhalt, D.H.; Schmidt, U. Sources and sinks of atmospheric methane. Pure Appl. Geophys. 1978, 116, 452–464. [Google Scholar] [CrossRef]
- Zhang, D.; Liao, H. Advances in the Research on Sources and Sinks of CH4 and Observations and Simulations of CH4 Concentrations. Adv. Meteorol. Sci. Technol. 2015, 1, 40–47. [Google Scholar]
- Saunois, M.; Jackson, R.B.; Bousquet, P.; Poulter, B.; Canadell, J.G. The growing role of methane in anthropogenic climate change. Environ. Res. Lett. 2016, 11, 120207. [Google Scholar] [CrossRef] [Green Version]
- Poulter, B.; Bousquet, P.; Canadell, J.G.; Ciais, P.; Peregon, A.; Saunois, M.; Arora, V.K.; Beerling, D.J.; Brovkin, V.; Jones, C.D. Global wetland contribution to 2000–2012 atmospheric methane growth rate dynamics. Environ. Res. Lett. 2017, 12, 094013. [Google Scholar] [Green Version]
- Stocker, T.; Qin, D.; Plattner, G.; Tignor, M.; Allen, S.; Boschung, J.; Nauels, A.; Xia, Y.; Bex, V.; Midgley, P. Summary for policymakers. In Climate Change 2013: The Physical Science Basis. Contribution of Working Group I to the fifth assessment report of the Intergovernmental Panel on Climate Change; IPCC Localised 9; Cambridge University Press: New York, NY, USA, 2013. [Google Scholar]
- Xiong, X.Z.; Houweling, S.; Wei, J.; Maddy, E.; Sun, F.; Barnet, C. Methane plume over south Asia during the monsoon season: Satellite observation and model simulation. Atmos. Chem. Phys. 2009, 9, 783–794. [Google Scholar] [CrossRef]
- Peng, S.S.; Piao, S.L.; Bousquet, P.; Ciais, P.; Li, B.G.; Lin, X.; Tao, S.; Wang, Z.P.; Zhang, Y.; Zhou, F. Inventory of anthropogenic methane emissions in mainland China from 1980 to 2010. Atmos. Chem. Phys. 2016, 16, 14545–14562. [Google Scholar] [CrossRef] [Green Version]
- Crutzen, P.J. On the Role of CH4 in Atmospheric Chemistry: Sources, Sinks and Possible Reductions in Anthropogenic Sources. Ambio. 1995, 24, 52–55. [Google Scholar]
- Wuebbles, D.J.; Hayhoe, K. Atmospheric methane and global change. Earth Sci. Rev. 2002, 57, 177–210. [Google Scholar] [CrossRef] [Green Version]
- Bloom, A.A.; Palmer, P.I.; Fraser, A.; Reay, D.S.; Frankenberg, C. Large-Scale Controls of Methanogenesis Inferred from Methane and Gravity Spaceborne Data. Science. 2010, 327, 322–325. [Google Scholar] [CrossRef] [PubMed] [Green Version]
- Chen, H.; Zhu, Q.; Peng, C.; Wu, N.; Wang, Y.; Fang, X.; Jiang, H.; Xiang, W.; Chang, J.; Deng, X. Methane emissions from rice paddies natural wetlands, and lakes in China: Synthesis and new estimate. Glob. Chang. Biol. 2012, 19, 19–32. [Google Scholar] [CrossRef] [PubMed]
- Zhang, X.Y.; Jiang, H.; Lu, X.H.; Cheng, M.M.; Zhang, X.M.; Li, X.H.; Zhang, L.J. Estimate of methane release from temperate natural wetlands using ENVISAT/SCIAMACHY data in China. Atmos. Environ. 2013, 69, 191–197. [Google Scholar] [CrossRef]
- Li, T.T.; Zhang, Q.; Cheng, Z.G.; Wang, G.C.; Yu, L.J.; Zhang, W. Performance of CH4MOD wetland for the case study of different regions of natural Chinese wetland. J. Environ. Sci. 2017, 57, 356–369. [Google Scholar] [CrossRef] [PubMed]
- Muntean, M.; Janssensmaenhout, G.; Olivier, J.G.; Guizzardi, D.; Dentener, F.J. Trends of anthropogenic mercury emissions from 1970–2008 using the global EDGARv4 database: The role of increasing emission mitigation by the energy sector and the chlor-alkali industry. In Proceedings of the AGU 2012 Fall Meeting, San Francisco, CA, USA, 3–7 December 2012. [Google Scholar]
- Saunois, M.; Poulter, B.; Peregon, A.; Ciais, P.; Canadell, J.G.; Dlugokencky, E.J.; Etiope, G.; Bastviken, D.; Houweling, S.; Janssens-Maenhout, G.; et al. Variability and quasi-decadal changes in the methane budget over the period 2000-2012. Atmos. Chem. Phys. 2017, 17, 11135–11161. [Google Scholar] [CrossRef]
- Xiao, X.; Boles, S.; Liu, J.Y.; Zhuang, D.F.; Frolking, S.; Li, C.S.; Salas, W.; Iii, B.M. Mapping paddy rice agriculture in southern China using multi-temporal MODIS images. Remote Sens. Environ. 2005, 95, 480–492. [Google Scholar] [CrossRef]
- Zhou, J.; Guan, L. Characteristics of Spatial and Temporal Distributions of Methane over the Tibetan Plateau and Mechanism Analysis for High Methane Concentration in Summer. Clim. Environ. Res. 2017, 22, 315–321. [Google Scholar]
- Feng, D.X.; Gao, X.Q.; Yang, L.W.; Hui, X.Y.; Zhou, Y. A spatial-temporal distribution characteristics of the atmospheric methane in troposphere on Qinghai-Tibetan plateau using ARIS data. China Environ. Sci. 2017, 37, 2822–2830. [Google Scholar]
- Wang, H.M.; Li, J.T.; Zhang, Y.; Li, S.S.; Zhang, L.; Chen, L.F. Spatial and temporal distribution of near-surface methane concentration over China based on AIRS observations. J. Remote Sens. 2015, 19, 827–835. [Google Scholar]
- Zhang, X.M.; Zhang, X.Y.; Zhang, L.J.; Li, X.H. Accuracy comparison of monthly AIRS, GOSAT and SCIAMACHY data in monitoring atmospheric CH4 concentration. In Proceedings of the International Conference on Geoinformatics, Kaifeng, China, 20–22 June 2013. [Google Scholar]
- Xu, Y.Y.; Wang, J.L.; Sun, J.L.; Xu, Y.; Harris, W. Spatial and Temporal Variations of Lower Tropospheric Methane During 2010–2011 in China. IEEE J. Sel. Top. Appl. Earth Obs. Remote Sens. 2012, 5, 1464–1473. [Google Scholar] [CrossRef]
- Zhang, X.Y.; Bai, W.G.; Zhang, P.; Wang, W.H. Spatio-temporal variations in mid-upper tropospheric methane over China from satellite observations. Sci. Bull. 2011, 56, 3321–3327. [Google Scholar] [CrossRef]
- Clerbaux, C.; Hadjilazaro, J.; Turquety, S.; Megie, G.; Coheur, P.F. Trace gas measurements from infrared satellite for chemistry and climate applications. Atmos. Chem. Phys. 2003, 3, 1495–1508. [Google Scholar] [CrossRef] [Green Version]
- Turquety, S.; Hadji-Lazaro, J.; Clerbaux, C.; Hauglustaine, D.A.; Clough, S.A.; Casse, V.; Schlussel, P.; Megie, G. Operational trace gas retrieval algorithm for the Infrared Atmospheric Sounding Interferometer. J. Geophys. Res. Atmos. 2005, 109, D21301. [Google Scholar] [CrossRef]
- Zhang, X.Y. The Progress in Trace Gas Remote Sensing Study Based on the Satellite Monitoring. Meteorol. Mon. 2007, 33, 3–14. [Google Scholar]
- Susskind, J.; Barnet, C.D.; Blaisdell, J.M. Determination of atmospheric and surface parameters from simulated AIRS/AMSU/HSB sounding data: Retrieval and cloud clearing methodology. Adv. Space Res. 1998, 21, 369–384. [Google Scholar] [CrossRef]
- Susskind, J.; Barnet, C.D.; Blaisdell, J.M. Retrieval of atmospheric and surface parameters from AIRS/AMSU/HSB data in the presence of clouds. IEEE Trans. Geosci. Remote Sens. 2003, 41, 390–409. [Google Scholar] [CrossRef]
- Susskind, J.; Blaisdell, J.M.; Iredell, L.; Keita, F. Improved Temperature Sounding and Quality Control Methodology Using AIRS/AMSU Data: The AIRS Science Team Version 5 Retrieval Algorithm. IEEE Trans. Geosci. Remote Sens. 2011, 49, 883–907. [Google Scholar] [CrossRef] [Green Version]
- Xiong, X.Z.; Barnet, C.; Wei, J.; Maddy, E. Information-based mid-upper tropospheric methane derived from Atmospheric Infrared Sounder (AIRS) and its validation. Atmos. Chem. Phys. Discuss. 2009, 9, 16331–16360. [Google Scholar] [CrossRef]
- Aumann, H.H.; Chahine, M.T.; Gautier, C.; Goldberg, M.D.; Kalnay, E.; Mcmillin, L.M.; Revercomb, H.; Rosenkranz, P.W.; Smith, W.L.; Staelin, D.H. AIRS/AMSU/HSB on the Aqua mission: Design, science objectives, data products, and processing systems. IEEE Trans. Geosci. Remote Sens. 2003, 41, 253–264. [Google Scholar] [CrossRef]
- Xiong, X.Z.; Barnet, C.; Maddy, E.S.; Gambacorta, A.; King, T.S.; Wofsy, S.C. Mid-upper tropospheric methane retrieval from IASI and its validation. Atmos. Meas. Tech. Discuss. 2013, 6, 2501–2531. [Google Scholar] [CrossRef]
- Zhou, L.X.; Zhou, X.J.; Zhang, X.C.; Wen, Y.P.; Yan, P. Progress in the Study of Background Greenhouse Gases at Waliguan Observatory. Acta Meteorol. Sin. 2007, 65, 458–468. [Google Scholar]
- Fang, S.X.; Zhou, L.X.; Xu, L.; Yao, B.; Liu, L.X.; Xia, L.J.; Wang, H.Y. CH4 concentrations and the variation characteristics at the four WMO/GAW background stations in China. Environ. Sci. 2012, 33, 2917–2923. [Google Scholar]
- Mondiale, O.M. International Operations Handbook for Measurement of Background Atmospheric Pollution; WMO No. 491; World Meteorological Organization: Geneva, Switzerland, 1978. [Google Scholar]
- Tarasova, O.A.; Braathen, G.O.; Barrie, L.A.; Suda, K.; Dlugokencky, E. The state of greenhouse gases in the atmosphere using global observations through 2008. In Proceedings of the EGU General Assembly Conference, Vienna, Austria, 2–7 May 2010. [Google Scholar]
- Zhang, D.Q. Quality control of CO2 and CH4 measurement data on China global atmosphere watch baseline observatory. Q. J. Appl. Meteorol. 2004, 15, 95–100. [Google Scholar]
- Song, C. Retrieval, Simulation and Regional Fluxes Estimation of Greenhouse Gases; East China Normal University: Shanghai, China, 2015. [Google Scholar]
- Olivier, J.G.J.; Bouwman, A.F.; Maas, C.W.M.V.D.; Berdowski, J.J.M. Emission Database for Global Atmospheric Research (EDGAR); Springer: Dordrecht, The Netherlands, 1994. [Google Scholar]
- Kanamitsu, M.; Ebisuzaki, W.; Woollen, J.; Yang, S.K.; Hnilo, J.J.; Fiorino, M.; Potter, G.L. NCEP/DOE AMIP-II Reanalysis (R-2). Bull. Am. Meteorol. Soc. 2002, 83, 1631–1643. [Google Scholar] [CrossRef]
- Weatherhead, E.C.; Reinsel, G.C.; Tiao, G.C.; Meng, X.L.; Choi, D.; Cheang, W.K.; Keller, T.; Deluisi, J.; Wuebbles, D.J.; Kerr, J.B. Factors affecting the detection of trends: Statistical considerations and applications to environmental data. J. Geophys. Res. Atmos. 1998, 103, 1241–1255. [Google Scholar] [CrossRef]
- Wang, Y.Q.; Jiang, H.; Zhang, X.Y.; Zhou, G.M.; Yu, S.Q.; Xiao, Z.Y. Temporal-Spatial Distribution of Tropospheric NO2 in China Using OMI Satellite Remote Sensing Data. Res. Environ. Sci. 2009, 22, 932–937. [Google Scholar]
- Zhang, Y.J.; Niu, Z.; Wang, L.; Chang, C.Y. Study on Tropospheric NO2 Change Trend in Cities Using OMI Satellite Data. Geogr. Geo-Inf. Sci. 2008, 24, 96–99. [Google Scholar]
- Stein, A.F.; Draxler, R.R.; Rolph, G.D.; Stunder, B.J.B.; Cohen, M.D.; Ngan, F. NOAA’S HYSPLIT atmospheric transport and dispersion modeling system. Bull. Am. Meteorol. Soc. 2015, 96, 2059–2077. [Google Scholar] [CrossRef]
- Zhang, X.Y.; Jiang, H.; Zhang, Q.X.; Zhang, X. Chemical characteristics of rainwater in northeast China, a case study of Dalian. Atmos. Res. 2012, 116, 151–160. [Google Scholar] [CrossRef]
- Shine, K.P.; Fuglestvedt, J.S.; Hailemariam, K.; Stuber, N. Alternatives to the Global Warming Potential for Comparing Climate Impacts of Emissions of Greenhouse Gases. Clim. Chang. 2005, 68, 281–302. [Google Scholar] [CrossRef] [Green Version]
- Farquharson, D.V.; Jaramillo, P.; Schivley, G.; Klima, K.; Carlson, D.; Samaras, C. Beyond Global Warming Potential: A Comparative Application of Climate Impact Metrics for the Life Cycle Assessment of Coal and Natural Gas Based Electricity. J. Ind. Ecol. 2017, 21, 857–873. [Google Scholar] [CrossRef]
- Kumari, S.; Hiloidhari, M.; Kumari, N.; Naik, S.N.; Dahiya, R.P. Climate change impact of livestock CH4 emission in India: Global temperature change potential (GTP) and surface temperature response. Ecotoxicol. Environ. Saf. 2018, 147, 516–522. [Google Scholar] [CrossRef] [PubMed]
- Giuntoli, J.; Agostini, A.; Caserini, S.; Lugato, E.; Baxter, D.; Marelli, L. Climate change impacts of power generation from residual biomass. Biomass Bioenergy 2016, 89, 146–158. [Google Scholar] [CrossRef] [Green Version]
- Conway, T.J.; Tans, P.; Waterman, L.S.; Thoning, K.W.; Masarie, K.A.; Gammon, R.H. Atmospheric carbon dioxide measurements in the remote global troposphere, 1981–1984. Tellus 1988, 40B, 81–115. [Google Scholar] [CrossRef]
- Komhyr, W.D.; Gammon, R.H.; Harris, T.B.; Waterman, L.S.; Conway, T.J.; Taylor, W.R.; Thoning, K.W. Global atmospheric CO2 distribution and variations from 1968–1982 NOAA/GMCC CO2 flask sample data. J. Geophys. Res. Atmos. 1985, 90, 5567–5596. [Google Scholar] [CrossRef]
- Xiong, X.Z.; Barnet, C.; Maddy, E.; Sweeney, C.; Liu, X.P.; Zhou, L.H.; Goldberg, M. Characterization and validation of methane products from the Atmospheric Infrared Sounder (AIRS). J. Geophys. Res. 2008, 113. [Google Scholar] [CrossRef] [Green Version]
- Xiong, X.Z.; Barnet, C.D.; Zhuang, Q.L.; Machida, T.; Sweeney, C.; Patra, P.K. Mid-upper tropospheric methane in the high Northern Hemisphere: Spaceborne observations by AIRS, aircraft measurements, and model simulations. J. Geophys. Res. 2010, 115, D19309. [Google Scholar] [CrossRef]
- Xiong, X.Z.; Zhang, Y.; Chen, L.F.; Zhan, R.F.; Li, J.P. Variation of Methane, Water Vapor and Clouds over Tibetan Plateau Under the Impact of Asian Summer Monsoon. J. Chengdu Univ. Inf. Technol. 2011, 26, 480–485. [Google Scholar]
- Ding, A.J.; Wang, T.; Xue, L.K.; Gao, J.; Stohl, A.; Lei, H.C.; Jin, D.Z.; Ren, Y.; Wang, X.Z.; Wei, X.L. Transport of north China air pollution by mid-latitude cyclones: A case study of aircraft measurements in summer 2007. J. Geophys. Res. Atmos. 2009, 114, D11399. [Google Scholar] [CrossRef]
- Zhang, R.J.; Wang, M.X. A Modeling of the Sudden Decrease in CH4 Growth Rate in 1992. Adv. Atmos. Sci. 2000, 16, 242–250. [Google Scholar] [CrossRef]
- Zhang, H.H.; Li, C.; Gao, Y.B.; Fang, X.J.; Xiong, W.; Jinji, M.A. Research for High-Level OH Radicals Spatio-Temporal Distribution Characteristics and Its Formation Mechanism. J. Atmos. Environ. Opt. 2017, 12, 292–304. [Google Scholar]
- Zhang, X.Y.; Jiang, H.; Wang, Y.Q.; Han, Y.; Buchwitz, M.; Schneising, O.; Burrows, J.P. Spatial variations of atmospheric methane concentrations in China. Inter. J. Remote Sens. 2011, 32, 833–847. [Google Scholar] [CrossRef]
- Song, Y. Petrolem exploration main characteristics of geochemistry and geology in China’s medium large gas fields. Acta Pet. Sin. 1998, 19, 1–5. [Google Scholar]
- Tang, H.J.; Wu, X.; Bao, Z.Y.; Qiao, S.Y.; Guo, Q.H. Effect of Geogenic Emission of Methane on the Atmosphere. Geol. Sci. Technol. Inf. 2006, 25, 75–82. [Google Scholar]
- Liu, H.Z.; Xu, C.C.; Li, J.X.; Pi, Y.Y. Changes in the Maximum Wind Speed and the Confirmatory Analysis by the Circulation Index in Xinjiang Region. Yellow River 2017, 39, 19–25. [Google Scholar]
- Wang, B. Larix Gmelinii Forest Soil CH4 Flux Change Research in Da Xing An Ling; Inner Mongolia Agricultural University: Hohhot, China, 2014. [Google Scholar]
- Kaplan, J.O.; Folberth, G.; Hauglustaine, D.A. Role of methane and biogenic volatile organic compound sources in late glacial and Holocene fluctuations of atmospheric methane concentrations. Glob. Biogeochem. Cycles. 2006, 20, GB2016. [Google Scholar] [CrossRef]
- Ding, W.X.; Wang, C.D.X. Preliminary budget of methane emissions from natural wetlands in China. Atmos. Environ. 2004, 38, 751–759. [Google Scholar] [CrossRef]
- Wang, Y.S.; Ji, B.M.; Huang, Y.; Hu, Y.Q.; Wang, Y.F. Effects of grazing and cultivating on emission of nitrous oxide, carbon dioxide and uptake of methane from grasslands. Chin. J. Enviromental Sci. 2001, 22, 7. [Google Scholar] [CrossRef]
- Yang, Y.M.; Pang, Z.; Wu, E. The Current Situation of Methane Emissions from Livestock and Poultry in Inner Mongolia and its Countermeasure. Inn. Mong. Agric. Sci. Technol. 2011, 5, 1–3. [Google Scholar]
- Liu, Y.; Li, W.L.; Zhou, X.J.; Isaksen, I.S.A.; Sundet, J.K.; He, J.H. The Possible Influences of the Increasing Anthropogenic Emissions in India on Tropospheric Ozone and OH. Adcances Atmos. Sci. 2003, 20, 968–977. [Google Scholar]
- Lawrence, M.G.; Rasch, P.J.; Kuhlmann, R.V.; Williams, J.; Fischer, H.; Reus, M.D.; Lelieveld, J.; Crutzen, P.J.; Schultz, M.; Stier, P. Global Chemical Weather Forecasts for Field Campaign Planning: Predictions and Observations of Large-Scale Features during MINOS, CONTRACE, and INDOEX. Atmos. Chem. Phys. Discuss. 2002, 2, 267–289. [Google Scholar] [CrossRef]
- Xie, M.; Li, S.; Jiang, F.; Wang, T.J. Methane emission from terrestrial vegetation in China and its effect on methane concentration in the lower troposphere. Chin. Sci. Bull. 2008, 53, 2365–2370. [Google Scholar]
- Bu, M.; Zhang, T. Assessment of methane production from domestic waste landfill in China. Renew. Energy Resour. 2012, 30, 89–94. [Google Scholar]
- Xu, S.Y.; Chen, G.C.; Wei, S.Q.; Wang, F. Estimate of Methane Emission from Municipal Solid Waste Landfills in Chongqing. J. Southwest Univ. 2010, 32, 120–125. [Google Scholar]
- Liu, Y. Study on Atmospheric Mathane in Beijing: Emission from Rice Paddies and Consumption by Oxidizing; Chinese Research Academy of Environmental Sciences: Beijing, China, 1995.
- Zhang, F. Re-analysis and Evaluation of Atmospheric Carban Dioxide (CO2), Methane (CH4) and Carbon Monoxide (CO) at Mout Waliguan, China; Chinese Research Academy of Environmental Sciences: Beijing, China, 2011.
- Thompson, A.M. The Oxidizing Capacity of the Earth’s Atmosphere: Probable Past and Future Changes. Science 1992, 256, 1157–1165. [Google Scholar] [CrossRef] [PubMed]
- Wang, Y.H.; Jacob, D.J. Anthropogenic forcing on tropospheric ozone and OH since preindustrial times. J. Geophys. Res. Atmos. 1998, 103, 31123–31135. [Google Scholar] [CrossRef] [Green Version]
- Zhang, R.J. Atmosphere methane trends oer the last 150 years. Acta Meteorol. Sin. 2002, 60, 620–624. [Google Scholar]
- Lin, Y.P.; Zhao, C.S. The Oxidation in the Troposphere:A Review. Adv. Earth Sci. 2009, 24, 488–496. [Google Scholar]
- Zhang, G.J.; Le, Q. Distribution of CH4 Column in China using SCIAMACHY Data. Geospat. Inf. 2011, 4, 115–117. [Google Scholar]
- Wang, M.X.; Liu, W.W.; Lv, G.T.; Gong, Y.B.; Rasmussen, R.A.; Khalil, M.A.K. Long-term Trend and Seasonal Cycle of Atmospheric Methane. Chin. Sci. Bull. 1990, 35, 213–216. [Google Scholar]
- Duan, A.M.; Wu, G.X. Role of the Tibetan Plateau thermal forcing in the summer climate patterns over subtropical Asia. Clim. Dyn. 2005, 24, 793–807. [Google Scholar]
- Zhang, F.G.; Zhang, S.Y.; Tang, R.L.; Wang, H.Y.; Yang, Z.B.; Zhou, Y.L.; Sun, Z.J. Methane emission characteristics of active layer in wetland permafrost area of the Tibetan Plateau. Geophys. Geochem. Explor. 2017, 41, 1027–1036. [Google Scholar]
- Piao, S.L.; Fang, J.Y. Terrestrial net primary production and its spatio-temporal patterns in Qinghai-Xizang Plateau, China during 1982–1999. J. Nat. Resour. 2002, 37, 563–569. [Google Scholar]
- Yang, Y.H.; Piao, S.L. Variations in grassland vegetation cover in relation to climate factors on the Tibetan Plateau. J. Plant Ecol. 2006, 30, 1–8. [Google Scholar]
- Piao, S.L.; Guo, Q.H. Application of CASA model to the estimation of chinese terrestrial net primary productivity. Acta Phytoecol. Sin. 2001, 25, 603–608. [Google Scholar]
- Wan, W.; Xiao, P.F.; Feng, X.Z.; Li, H.; Ma, R.H.; Duan, H.T.; Zhao, L.M. Monitoring lake changes of Qinghai-Tibetan Plateau over the past30 years using satellite remote sensing data. Chin. Sci. Bull. 2014, 59, 1021–1035. [Google Scholar] [CrossRef]
- Shao, Z.G.; Meng, X.G.; Zhu, D.G.; Zheng, D.X.; Qiao, Z.J.; Yang, C.B.; Han, J.N.; Yu, J.; Meng, Q.W.; Lu, R.P. Characteristics of the change of major lakes on the Qinghai-Tibet Plateau in the last 25 years. Front. Earth Sci. China 2008, 2, 364–377. [Google Scholar] [CrossRef]
- Wu, Q.B.; Zhang, T.J. Recent permafrost warming on the Qinghai-Tibet Plateau. J. Geophys. Res. Atmos. 2008, 113, D13108. [Google Scholar] [CrossRef]
- Peng, F.; Xue, X.; You, Q.G.; Zhou, X.H.; Wang, T. Warming effects on carbon release in a permafrost area of Qinghai-Tibet Plateau. Environ. Earth Sci. 2015, 73, 57–66. [Google Scholar] [CrossRef]
- Jiao, Y.; Hou, J.H.; Zhao, J.H.; Yang, W.Z. Land-use change from grassland to cropland affects CH4 uptake in the farming-pastoral ecotone of Inner Mongolia. China Environ. Sci. 2014, 34, 1514–1522. [Google Scholar]
- Li, P.X.; Cao, Y.H. Spatial and Temporal Changes of Industrial Carbon Emissions under Regional Industrial Transfer: The Case of Pan-Yangtze River Delta. Adv. Earth Sci. 2013, 28, 939–947. [Google Scholar]
- Dong, J.F.; Deng, C. Dynamic relation among XinJiang’s carbon dioxide emission, energy, energy efficiency anf industrial structure. Resour. Ind. 2015, 17, 22–29. [Google Scholar]
- Yao, L.L.; Gao, Z.G. An Empirical Analysis of the Relations between Energy Consumption, Economic Growth and Carbon Emissions in Xinjiang. J. Xinjiang Univ. 2012, 3, 212–217. [Google Scholar]
- Ma, X.X.; Zheng, G.D.; Liang, S.Y.; Fan, C.Y.; Wang, Z.X.; Liang, M.L. Contributions of Geologic Methane to Atmospheric Methane Sources and Sinks. Bull. Mineral. Petrol. Geochem. 2012, 31, 139–183. [Google Scholar]
- Xu, Y.; Tang, J.H.; Wang, G.J.; Wang, W.H.; Xu, C. A Comprehensive Review of Geologic Methane Emission in Hydrocarbon-Prone Areas. Acta Geol. Sin. 2016, 90, 553–558. [Google Scholar]
- Li, H.J.; Tang, J.H. Research Progress of Atmospheric Methane Emission Sources. J. Hangzhou Dianzi Univ. 2014, 34, 52–55. [Google Scholar]
- Xirzat, B.; Batur, B.; Jia, H.T.; Zhao, C.Y.; Ruxan, M. Analysis of Animal Methane Emission in Recent Two Decades in Xinjiang Uyghur Autonomous Region, China. Southwest China J. Agric. Sci. 2010, 23, 2102–2105. [Google Scholar]
- Cheng, Z.; Wang, T.N.; Liu, Y.; Li, J.J. Methane emission of animal husbandry and reduction measures in Ningxia. J. Agric. Sci. 2017, 38, 7–9. [Google Scholar]
- Khalil, M.A.K.; Shearer, M.J. Decreasing emissions of methane from rice agriculture. Int. Congr. 2006, 1293, 33–41. [Google Scholar] [CrossRef]
- Xu, L.; Ding, Y.H.; Luo, Y.; Liu, J.L.; Yang, N.; Wang, T.L.; Yu, Y. Decreasing Emission of Methane from Rice Fields in China. Adv. Clim. Chang. Res. 2005, 1, 32–34. [Google Scholar]
Figure 1.
Scatter plots of the monthly averaged surface CH4 concentrations from World Data Centre for Greenhouse Gases (WDCGG) and Atmospheric Infrared Sounder (AIRS) retrievals at nine sites around China, during September 2002 to September 2016, respectively (the gray dotted line denotes a 1:1 ratio line).

Figure 2.
Scatter plots of the annual averaged ground-based CH4 concentrations, and AIRS retrievals for nine sites during 2002 to 2016.
Figure 2.
Scatter plots of the annual averaged ground-based CH4 concentrations, and AIRS retrievals for nine sites during 2002 to 2016.

Figure 3.
(a) The distribution of the averaged CH4 concentration over the area of China from September 2002 to September 2016, derived from the AIRS products (the pink box represents Region I: northern Xinjiang; the blue box represents Region II: northeast of Inner Mongolia/Heilongjiang; the green box represents Region III: northwest Sichuan); (b) variations of CH4 concentration distribution at over different latitudes, varying by one degree.

Figure 4.
Locations of three typical high CH4 concentration areas and air-mass back-trajectories at an altitude of 3 km: (a) Region I; (b) Region II; (c) Region III.
Figure 4.
Locations of three typical high CH4 concentration areas and air-mass back-trajectories at an altitude of 3 km: (a) Region I; (b) Region II; (c) Region III.

Figure 5.
Spatial distributions of the seasonal averages of CH4 concentration at 500 hPa across China in the four seasons: (a) spring, (b) summer, (c) autumn, and (d) winter (the pink box represents Region I: northern Xinjiang; the blue box represents Region II: northeast of Inner Mongolia/Heilongjiang; the green box represents Region III: northwest Sichuan).

Figure 6.
(a) Sinusoidal fitting results of the monthly averaged CH4 concentration across China from September 2002 to September 2016; (b) the correlation between atmospheric CH4 concentration, and emissions from EDGAR.
Figure 6.
(a) Sinusoidal fitting results of the monthly averaged CH4 concentration across China from September 2002 to September 2016; (b) the correlation between atmospheric CH4 concentration, and emissions from EDGAR.

Figure 7.
Spatial distributions of the trend in CH4 concentration at 500 hPa during 2002 to 2016, from AIRS.
Figure 7.
Spatial distributions of the trend in CH4 concentration at 500 hPa during 2002 to 2016, from AIRS.

Figure 8.
(a) The increased surface temperature from 2002 to 2016; (b) the estimated surface temperature response for a 20-year time frame.
Figure 8.
(a) The increased surface temperature from 2002 to 2016; (b) the estimated surface temperature response for a 20-year time frame.


Table 1.
The average emissions from different Emissions Database for Global Atmospheric Research (EDGAR) anthropogenic sectors * in three specific geographic regions across China (tons/year).
Table 1.
The average emissions from different Emissions Database for Global Atmospheric Research (EDGAR) anthropogenic sectors * in three specific geographic regions across China (tons/year).
| Sources | REGION I | REGION II | REGION III | China |
|---|---|---|---|---|
| Energy manufacturing | 0.35 | 1.60 | 2.31 | 4.04 |
| Coal/oil/gas production | 711,265.40 | 113,917.30 | 93,848.85 | 133,246.97 |
| Animal husbandry | 41.50 | 68.71 | 54.80 | 108.24 |
| Agricultural soil | 15.81 | 151.97 | 309.57 | 352.35 |
| Fossil fuel fires | 10.21 | 7.72 | no data | 8.20 |
| Waste solid/wastewater | 131.64 | 260.09 | 866.48 | 593.81 |
| Averaged CH4 Emissions | 137,240 | 283,430 | 135,100 | 260,400 |
| CH4 concentration (ppb) | 1844.67 | 1844.75 | 1846.22 | 1833.89 |
* The IPCC 1996 code is used for the specification of the sectors.
Table 2.
The CH4 emissions carried by air-mass back-trajectories in three regions across China in 2007 from EDGAR * (103 tons/year).
Table 2.
The CH4 emissions carried by air-mass back-trajectories in three regions across China in 2007 from EDGAR * (103 tons/year).
| Seasons | REGION I | REGION II | REGION III |
|---|---|---|---|
| Spring | 2471.99 | 107,814.43 | 463,804.09 |
| Summer | 52,801.26 | 20,600.35 | 218,368.48 |
| Autumn | 1461.59 | 149,896.14 | 222,366.25 |
| Winter | 56,916.27 | 207,415.99 | 469,519.92 |
| Year | 28,412.78 | 121,431.7 | 343,514.7 |
* The emission data obtained from EDGAR v. 4.3.2 (2002–2012).
Table 3.
Comparison of the fitting parameters among the average CH4, and nine surface sites from 2002 to 2016 (ppb).
Table 3.
Comparison of the fitting parameters among the average CH4, and nine surface sites from 2002 to 2016 (ppb).
| Sites | A | B | C | R2 |
|---|---|---|---|---|
| China | 1800.08 | 0.42 | −20.04 | 0.89 |
| WLG | 1791.40 | 0.47 | −28.48 | 0.91 |
| SDZ | 1796.34 | 0.45 | −23.71 | 0.85 |
| LLN | 1798.60 | 0.31 | −15.94 | 0.78 |
| UUM | 1842.02 | 0.43 | −16.85 | 0.85 |
| TAP | 1804.25 | 0.40 | −14.74 | 0.83 |
| AMY | 1844.88 | 0.66 | −20.82 | 0.79 |
| PDI | 1799.55 | 0.29 | −16.61 | 0.76 |
| RYO | 1814.30 | 0.36 | −13.44 | 0.83 |
| MNM | 1785.27 | 0.35 | −12.70 | 0.84 |
© 2019 by the authors. Licensee MDPI, Basel, Switzerland. This article is an open access article distributed under the terms and conditions of the Creative Commons Attribution (CC BY) license (http://creativecommons.org/licenses/by/4.0/).
Share and Cite
MDPI and ACS Style
Wu, X.; Zhang, X.; Chuai, X.; Huang, X.; Wang, Z. Long-Term Trends of Atmospheric CH4 Concentration across China from 2002 to 2016. Remote Sens. 2019, 11, 538. https://doi.org/10.3390/rs11050538
AMA Style
Wu X, Zhang X, Chuai X, Huang X, Wang Z. Long-Term Trends of Atmospheric CH4 Concentration across China from 2002 to 2016. Remote Sensing. 2019; 11(5):538. https://doi.org/10.3390/rs11050538
Chicago/Turabian StyleWu, Xiaodi, Xiuying Zhang, Xiaowei Chuai, Xianjin Huang, and Zhen Wang. 2019. "Long-Term Trends of Atmospheric CH4 Concentration across China from 2002 to 2016" Remote Sensing 11, no. 5: 538. https://doi.org/10.3390/rs11050538
Note that from the first issue of 2016, this journal uses article numbers instead of page numbers. See further details here.