1. Introduction
When a catastrophic event occurs, timely and efficient response and rescue are the main elements to increase the chances to save trapped victims under collapsed structures. In this scenario, first responders (FR) visually inspect the affected area and decide where and how to start the rescue activities. The inspection is usually performed with ground vehicles or on foot, though this often does not yield a complete overview of the area to allow an efficient prioritization of rescue measures, whilst also exposing rescue forces to unnecessary hazards.
Remote sensing techniques have been increasingly adopted to map disaster areas in recent decades [
1,
2,
3] as witnessed by a rapidly growing amount of research works dealing with optical [
4,
5,
6], radar [
7,
8], and laser [
9,
10] data with each sensor giving different advantages. Except for subtle damage patterns that deformation-sensitive radar can identify particularly well, optical data are usually preferrable to detect building damage [
11] in the early hours after the event as images are more easily interpretable by human operators who still typically carry out the initial damage map production manually [
1]. Existing emergency mapping services such as the Copernicus Emergency Management Service [
12] have adopted synoptic satellite imagery for this task as they can cover large areas and are available a few hours after a disaster. The main objective of these early impact analyses is to produce georeferenced data of the affected areas, to support search and rescue efforts and humanitarian actions. Crucial information is the identification of the disaster areas and the estimation of the number of people affected. However, these satellite images typically have limited spatial resolution (0.3–1 m ground sampling distance, GSD) and the uncertainty and subjectivity in the identification of hazard-induced damages can often be solved by using higher resolution images [
13]. On the other hand, airborne images [
14,
15,
16] are often not available in remote places where the delivery of mapping airplanes is not feasible in an emergency timeframe. Therefore, in situ surveys are often preferred.
In this regard, the massive uptake of unmanned aerial vehicles (UAV) in the market has created the possibility to collect very high-resolution images of a given scene, whilst also readily coupling vertical with oblique imaging [
14,
15]. Their higher portability and their lower instrument cost, compared to manned platforms, represent a good alternative to traditional data sources. This has been witnessed by the increasing number of UAV footages that have been acquired in the very last events and are frequently made available on the internet. Many rescue departments have also added UAVs to the regular equipment of their field teams [
17,
18]. However, flight execution and image interpretation are still performed manually (using UAVs for inspections from the sky), requiring a dedicated operator. This can be often perceived as a waste of time by first responders given the strong time pressure on their work. This was a common feedback by the first response end users in the recently concluded EU funded project INACHUS [
19]. Rescuers require a flexible solution that is: (i) able to deliver timely data (as near real-time as possible) and with frequent update possibility. (ii) Easy to use and that yields data that are quick to interpret also by non-remote sensing experts. The extent of the area, the practical operational problems faced in emergency conditions and possible legal restrictions still in place in the affected area should also be considered. In this regard, (iii) low-cost and (iv) easily deployable (i.e., portable and light) and replicable solutions (i.e., off-the-shelf or easily adaptable devices) would be therefore desirable.
Recent advances in robotics and computer vision [
20] have demonstrated that autonomous flights and real-time localization can be reliably implemented on small UAVs. On-board computing and real-time processing have also shown their potential for real-time mapping [
21]. However, the replicability of these solutions in real scenarios is still limited because their limited flight autonomy and the high level of customization required for the used platforms. None of the existing solutions is devoted to the quick mapping of building damages to address the FRs’ needs.
The development of deep learning algorithms for image classification [
22,
23] has shown its potential in the remote sensing domain [
24,
25,
26] providing very promising results in the detection of building damages such as debris or rubble piles [
14,
27]. These works have demonstrated how the convolutional neural networks (CNN) outperform traditional classification approaches in terms of performances and transferability of the learnt features to new datasets. In these works, however, no specific attention is paid to timely results delivery. The main drawback of these techniques remains the extensive computational time required that is incompatible with FR’s demands.
The present work tries to overcome the above-mentioned problems by proposing a solution based on a commercial UAV platform to autonomously map an area and detect building damages in near real-time. In particular, a binary map depicting the extension of the damages (i.e., delineation map) is delivered as output. The developed approach takes advantage of the most recent commercial UAV platforms that are delivered with software development kits (SDKs): these SDKs can customize the flight mode of the UAV and enable the real-time data streaming on a laptop. An efficient photogrammetric process is then implemented to generate a quick orthophoto of the area. A hybrid detection technique was then implemented combining in cascade morphological filters and vegetation indexes with a shallow convolutional neural networks (CNN). The first algorithms identify the areas of potential damages by selecting candidate areas in each image. Subsequently, the implemented CNN only classifies these regions instead of analyzing the whole image.
In the following sections a brief state of the art on the main elements of the developed solution (i.e., deep learning and real-time mapping) is given (
Section 2). The developed methodology and some of the performed tests are presented in
Section 3 and
Section 4, respectively. The results obtained are discussed in
Section 5 leading to the conclusions (
Section 6).
3. The Proposed Methodology—Materials and Methods
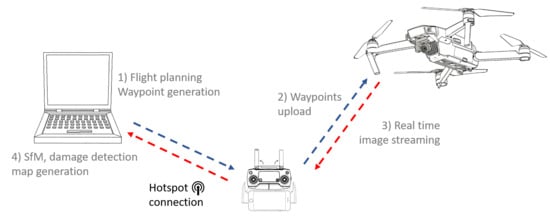
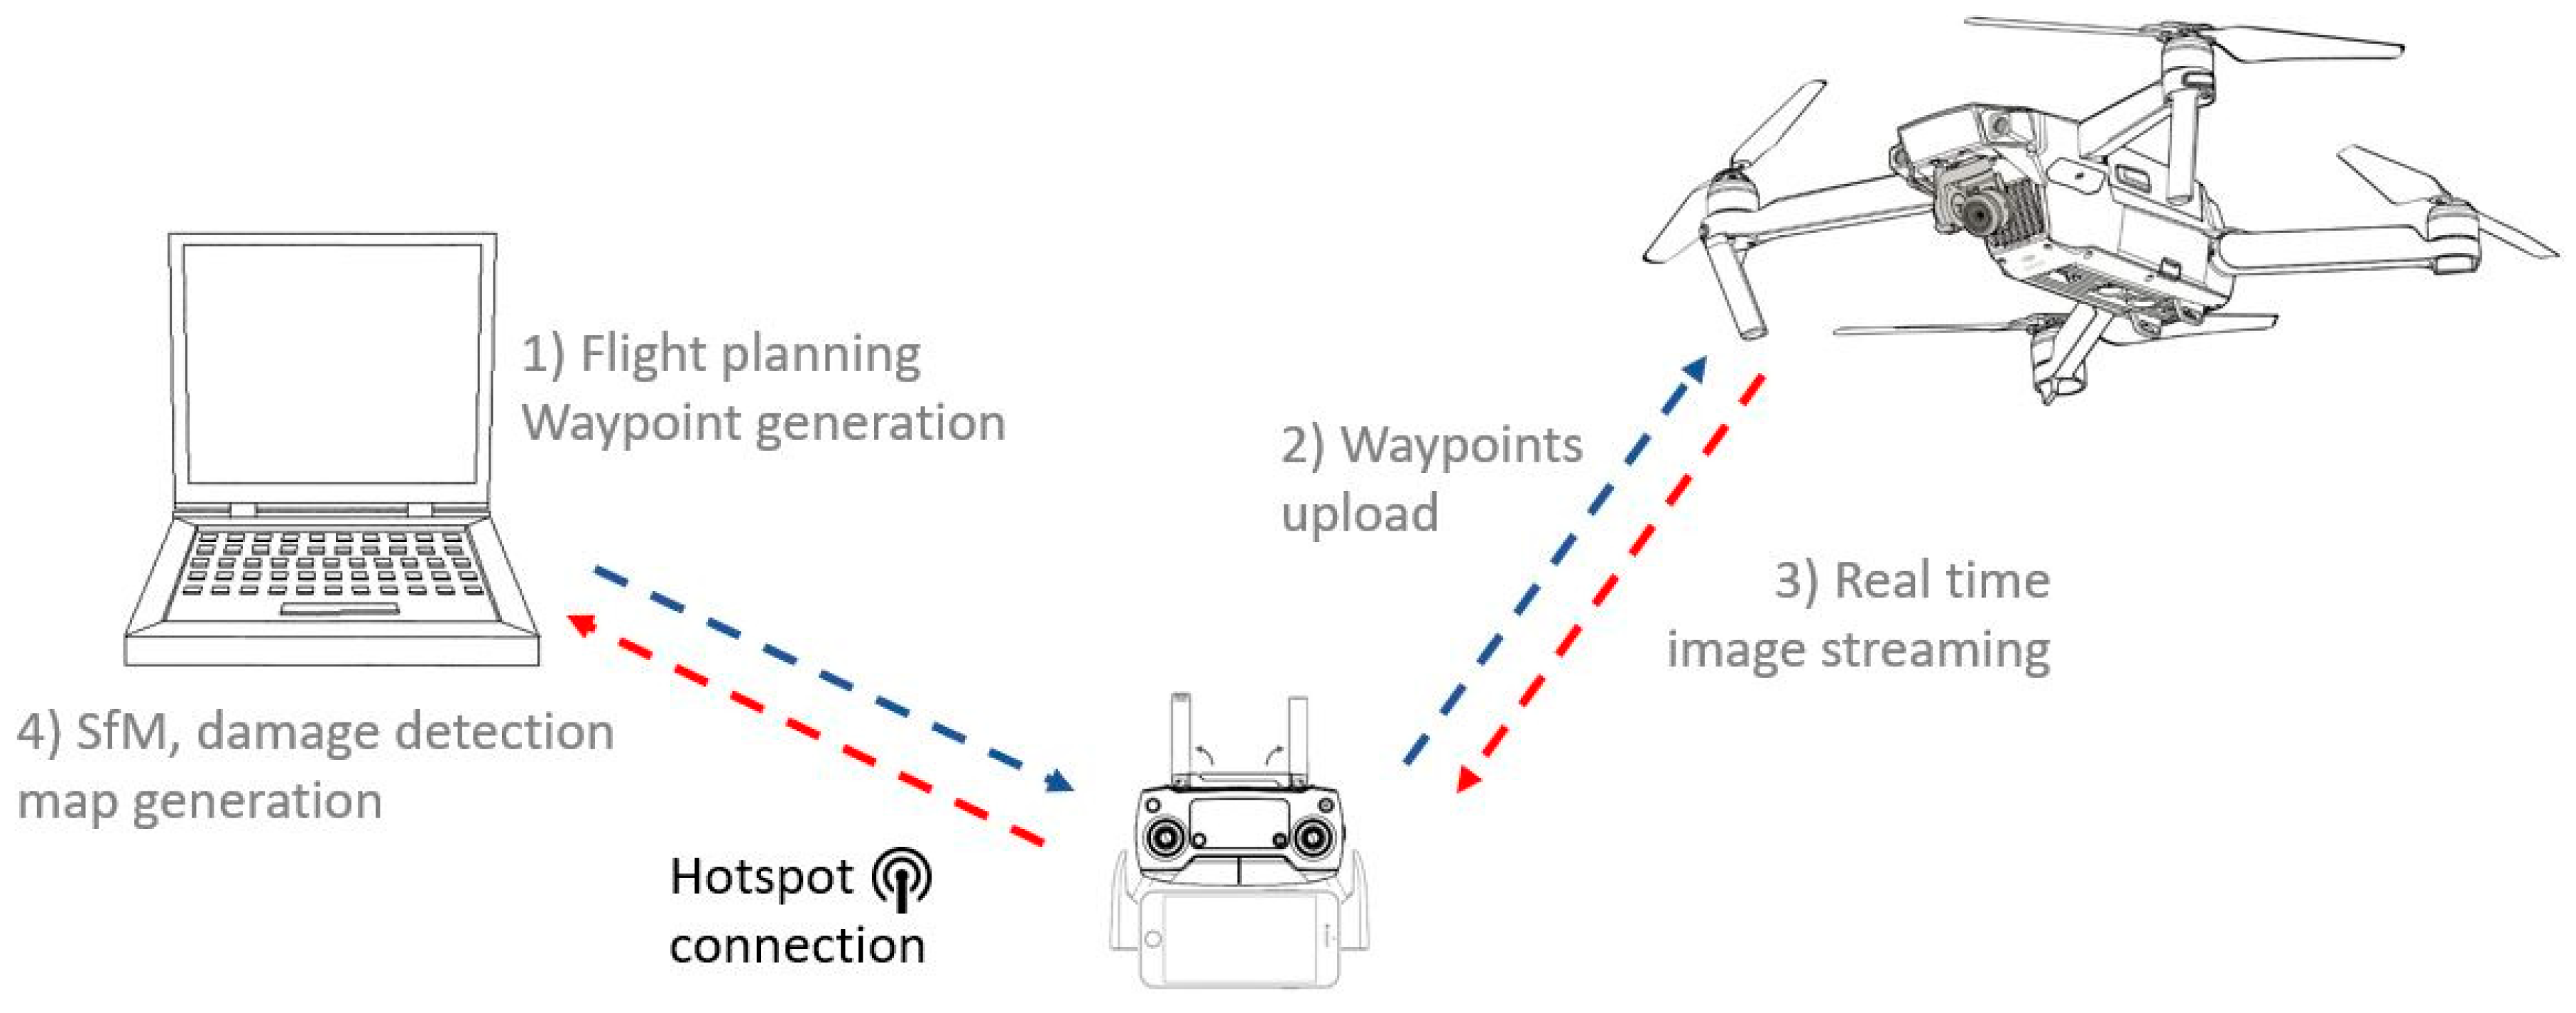
The developed method can be divided into three main components: (i) the app (installed on a smartphone) for customized flight mode and data streaming, (ii) the UAV flight planning toolbox, and (iii) the incremental map generation and building damage detection (both installed on a laptop). The three components are embedded together in order to optimize the process and assure the timely processing of the data. As shown in
Figure 1, the user initially defines an area of interest on the map and the software generates automatically a flight plan. The waypoints are then uploaded on the UAV that can start the image acquisition. During the flight the newly collected images are streamed on the laptop through the remote control and the customized app on the smartphone. The images are progressively processed in the laptop: the new images are sequentially added with a SfM algorithm and the damages are then detected in a classification process. When the image collection is completed, a true-orthophoto displaying the location of building damages is generated, and it is available by the time the UAV lands.
3.1. UAV Platform and Customized Flight Mode
Many UAV platforms are delivered with a dedicated SDK to customize their flight modes. In this paper, the adopted UAV platform is the Mavic Pro produced by DJI. This platform provides a reliable and fast connection with the remote control thanks to the Ocusync protocol that has higher communication speeds compared to other existing protocols (i.e., Lightbridge by DJI), as also confirmed by the performed tests. The Mavic Pro can also feature a relatively long flight time in excess of 20 min.
The communication between UAV platform and laptop is provided by an
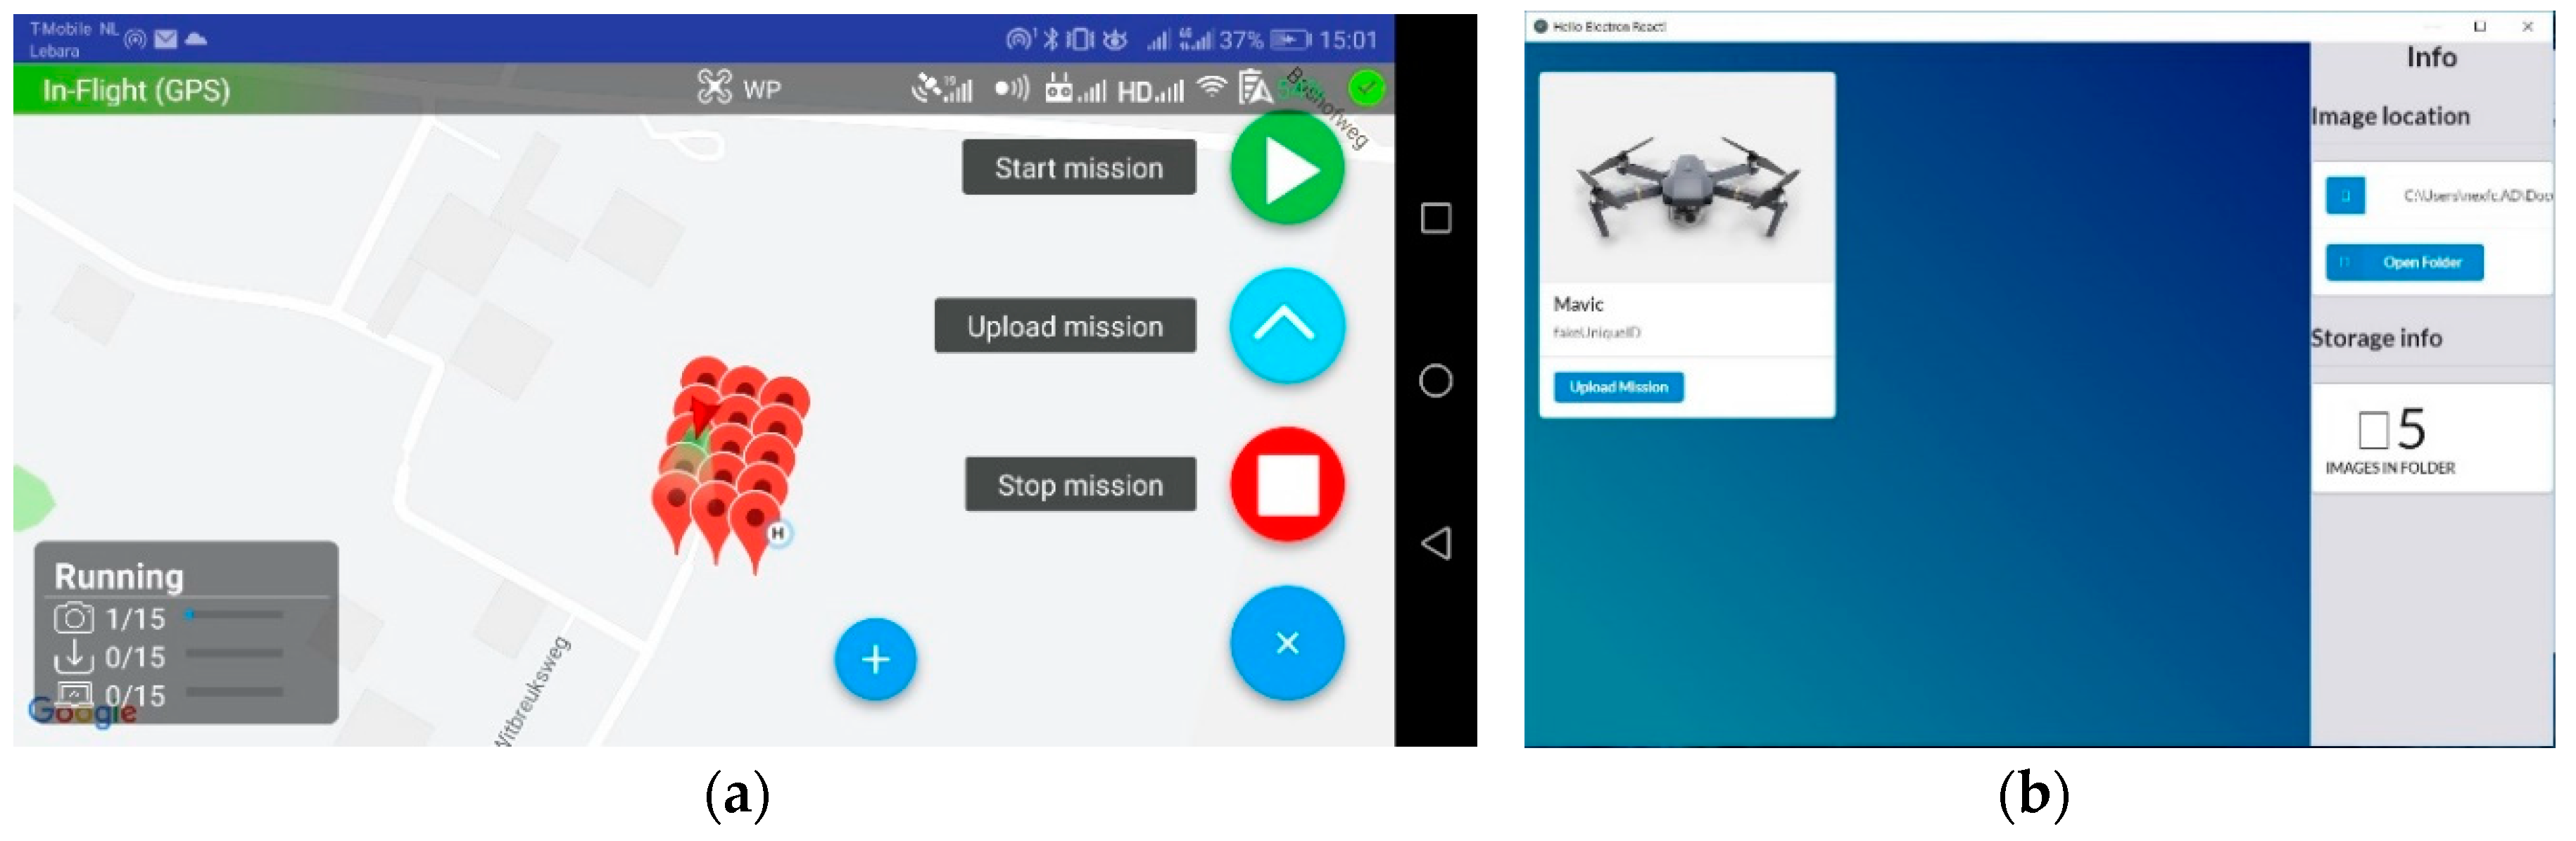
Android app installed on the mobile phone. This device is connected to the remote control via USB and to the laptop thanks to a wi-fi hotspot connection. Dedicated Javascript is installed on the laptop to allow the communication with the smartphone. The app has been developed using the mobile SDK of DJI and has two main functions: (i) upload the mission generated in the laptop on the drone, and (ii) receive the images from the platform and stream them to the laptop (see
Figure 2a). The Javascript has a graphical interface that allows to verify the connection status with the app, to select the flight plan file to be uploaded and the folder for image storing on the laptop (see
Figure 2b). This software interface communicates with the app through a websocket communication protocol, sending the flight plan to the app and receiving the streamed images during the flight. Each platform has a unique ID and the communication with more than one drone is therefore allowed. The UAV acquires the images in a stop and go mode. Although this acquisition mode is slower than in the continuous flight with regular internal shots, it gives higher flexibility that allows the change of camera pitch and yaw for every image.
3.2. UAV Flight Planning
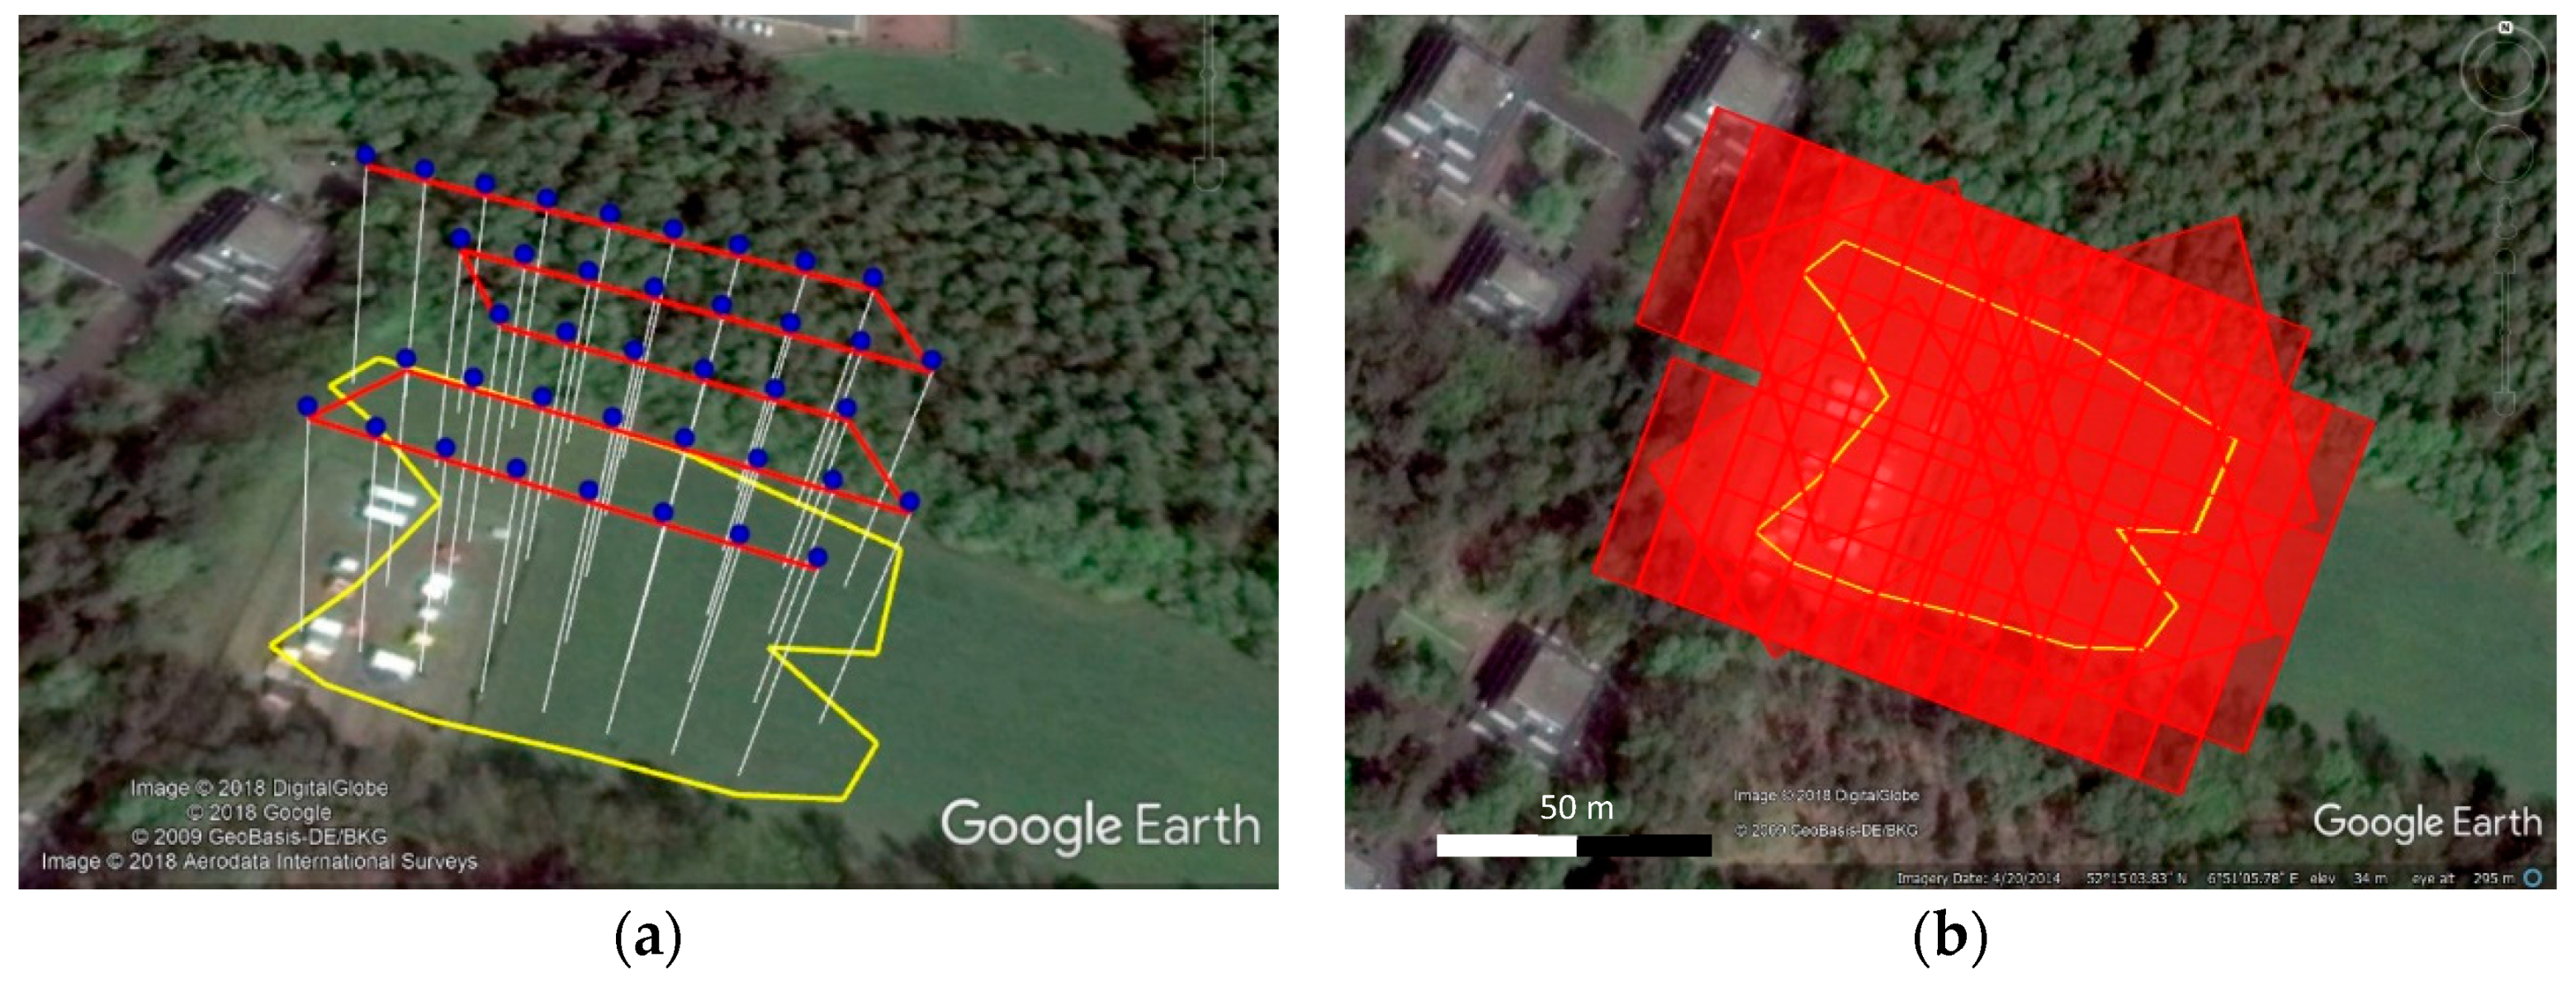
The goal of the UAV mission is to explore a new area and deliver a map for FR activity planning: no prior information such as the position of buildings or the presence of obstacles is given in advance. In the proposed implementation, the flight has therefore the aim of acquiring only nadir images while flying above obstacles. The flight planning software has been implemented to allow the automated generation of waypoints on an interest area. The user must define a polygon (of any shape) on Google Earth and the flight plan is automatically generated according to predefined overlaps, flight height, and UAV camera specifications. The flight plan parameters can be changed by the user, if needed.
The image location is planned in order to guarantee a minimum overlap (and number of images) in each point of the surveyed area. The position and the acquisition order are optimized in order to minimize the number of acquired images and, therefore, their acquisition time. To do that, the minimum bounding box of the initial polygon is initially determined. The flight strip orientation is set parallel to the longer side of this bounding box as image collection along the same strip is faster than across adjacent strips while the number of strips is also minimized. This strategy assumes locally flat areas to survey. The algorithm can optimize the flight plan for any shape of the area to be surveyed, as shown in
Figure 3. The algorithm returns a .csv file with the waypoint coordinates of each image and the information on gimbal pitch (i.e., nadir view, 90°) and heading (i.e., equivalent to flight strip direction). This file is then uploaded from the laptop to the UAV using the Javascript and the smartphone app (see
Figure 2).
3.3. Incremental 3D Map Generation and Building Damage Detection
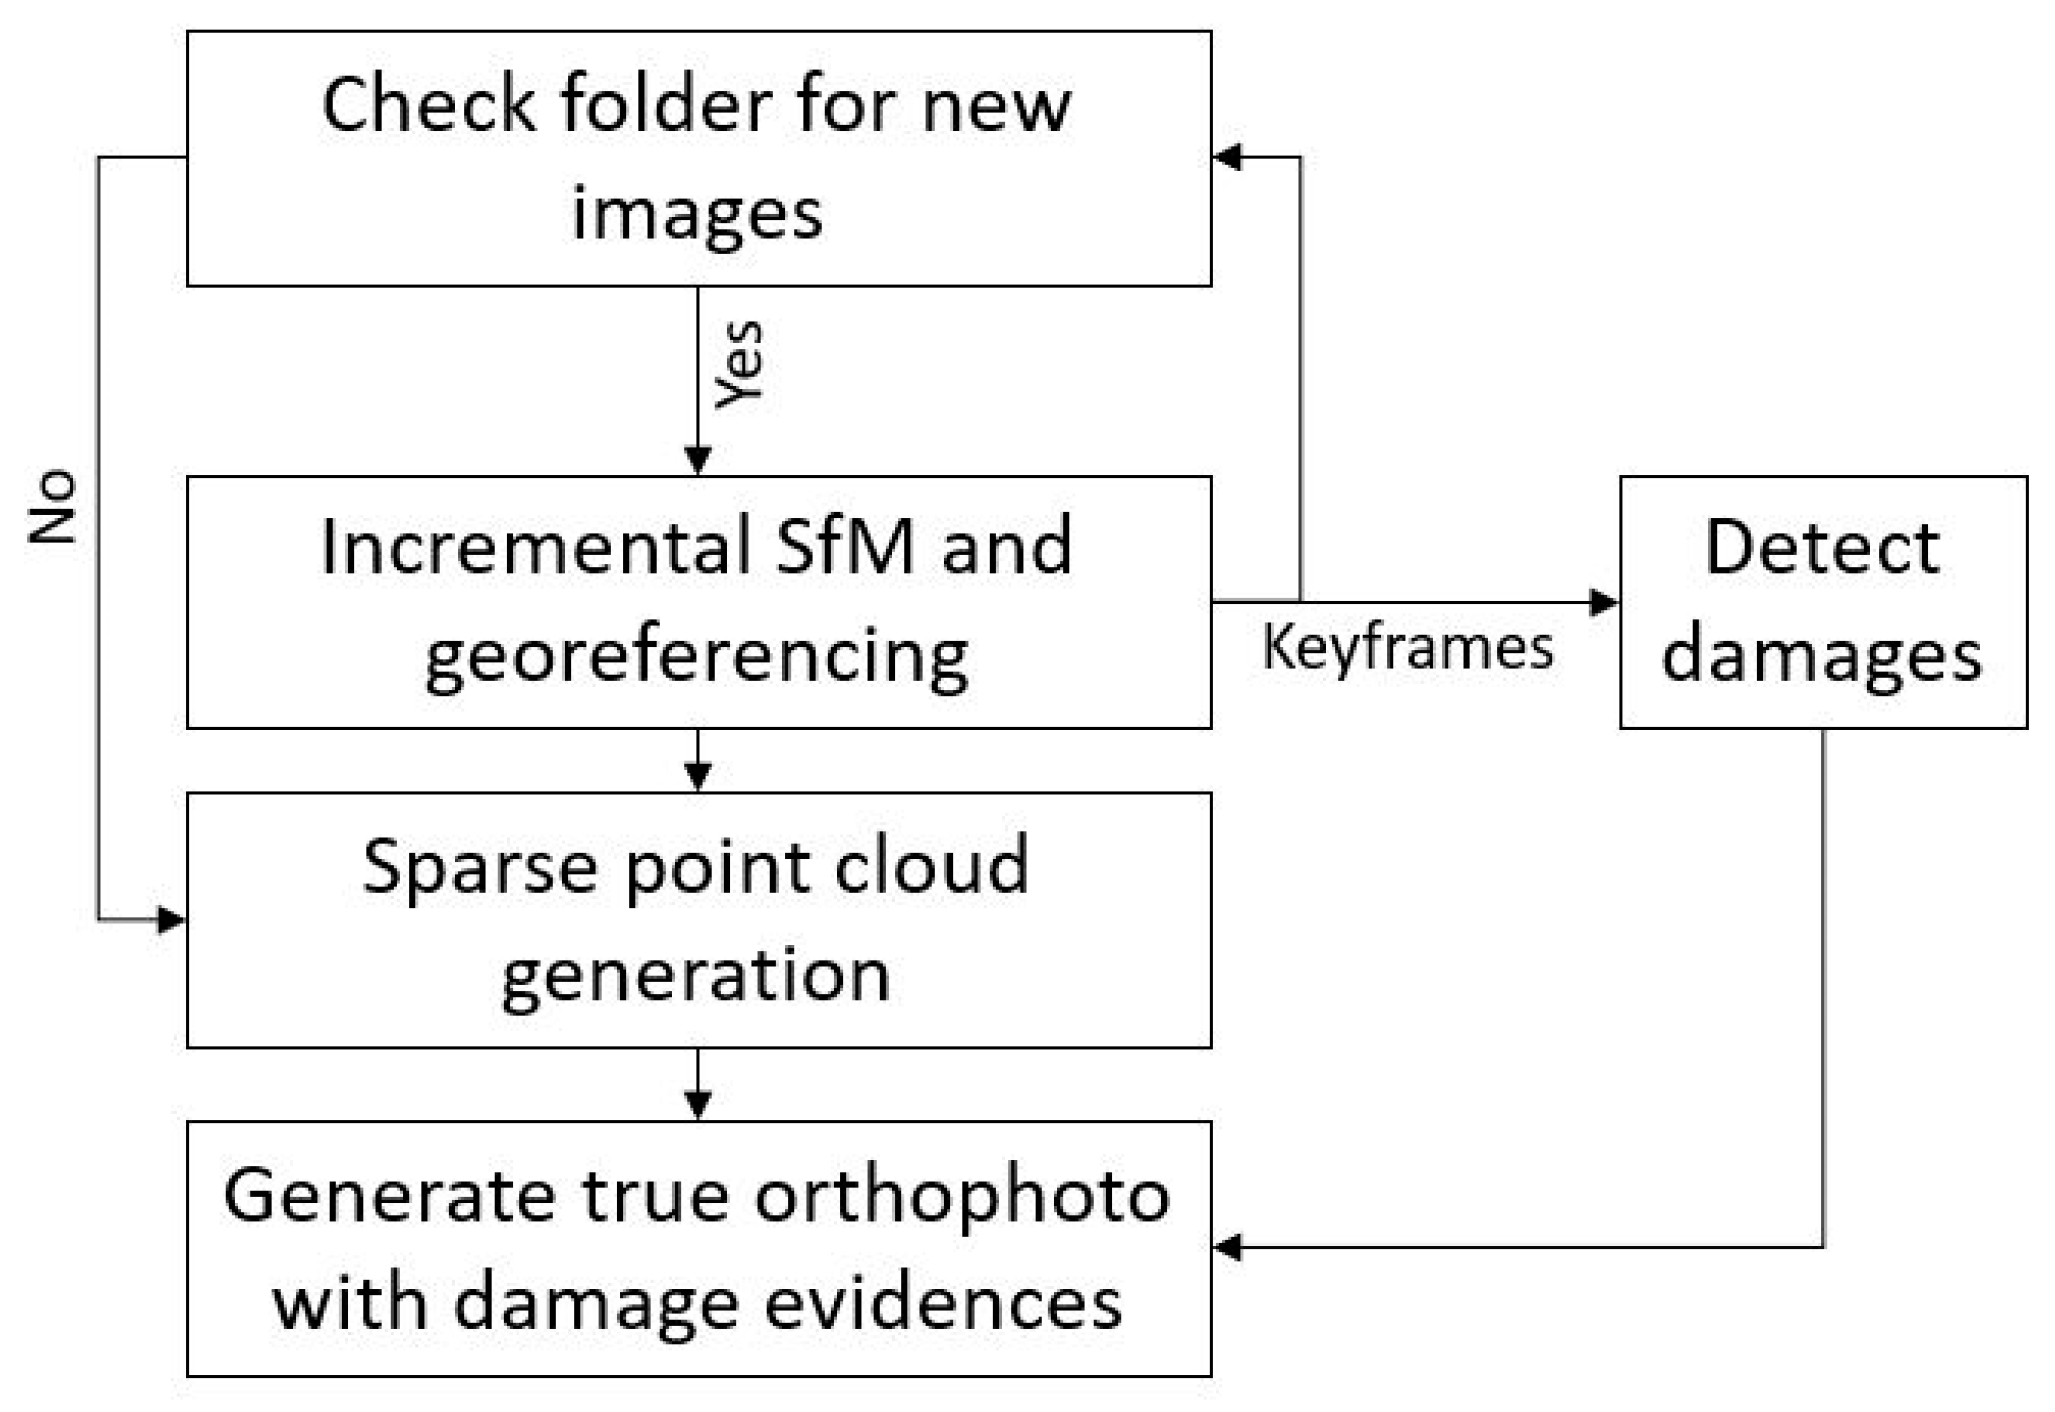
The acquired images are streamed to the laptop during the flight and are iteratively processed to generate a building damage map of the area. As shown in
Figure 4 two different process are integrated: (i) the incremental 3D map generation and (ii) the building damage detection.
The algorithm initializes the orientation of images after the first three images arrive on the laptop. Every new image received is added to the initial orientation iteratively enlarging the image block with a SfM process. This orientation process was implemented using the ColMap library [
32] that takes advantage of CPU and GPU processing. This library can flexibly modify the parameters of the SfM and get fast and accurate 3D reconstructions of aerial image blocks. The original images (4000 × 3000 pixels) are downsampled to reduce the computation time needed for the tie-points extraction: ColMap implements a GPU enabled version of the SIFT algorithm. The image sequence concatenation is guided by the geotag coordinates of the images, reducing the search to the 10 closest images. The bundle block adjustment (BBA) is iteratively run to reduce deformations in the image block. A local BBA is run for every new image added to the block: only a few neighboring images are considered in this process. A global BBA is run after several images are added to the block. In the developed implementation, five images are considered as neighborhood of the local adjustment while the global BBA is run for every 10 new images.
When the image stream stops, a final global BBA is run. The geotag of the images is then used to determine the absolute orientation of the block. The sparse point cloud generated by tie-points is finally used to generate a rough digital surface model (DSM) for the orthorectification process. Damaged areas are usually characterized by heterogeneously textured regions: many tie-points evenly distributed in the area are therefore extracted and used to generate these (quick) DSMs.
Some keyframes are regularly selected during the image collection to detect the presence of building damages (i.e., debris) as described in
Section 3.3.1. The classified images are finally used as input in the orthophoto generation. The closest nadir image to each point of the DSM is used in the orthorectification process and a Z-buffer algorithm [
39] is then used to avoid double mapping and occlusion problems. No radiometric correction is applied to blend the radiometric values among the different images as this significantly increases the computational time.
3.3.1. Damage Detection Algorithm
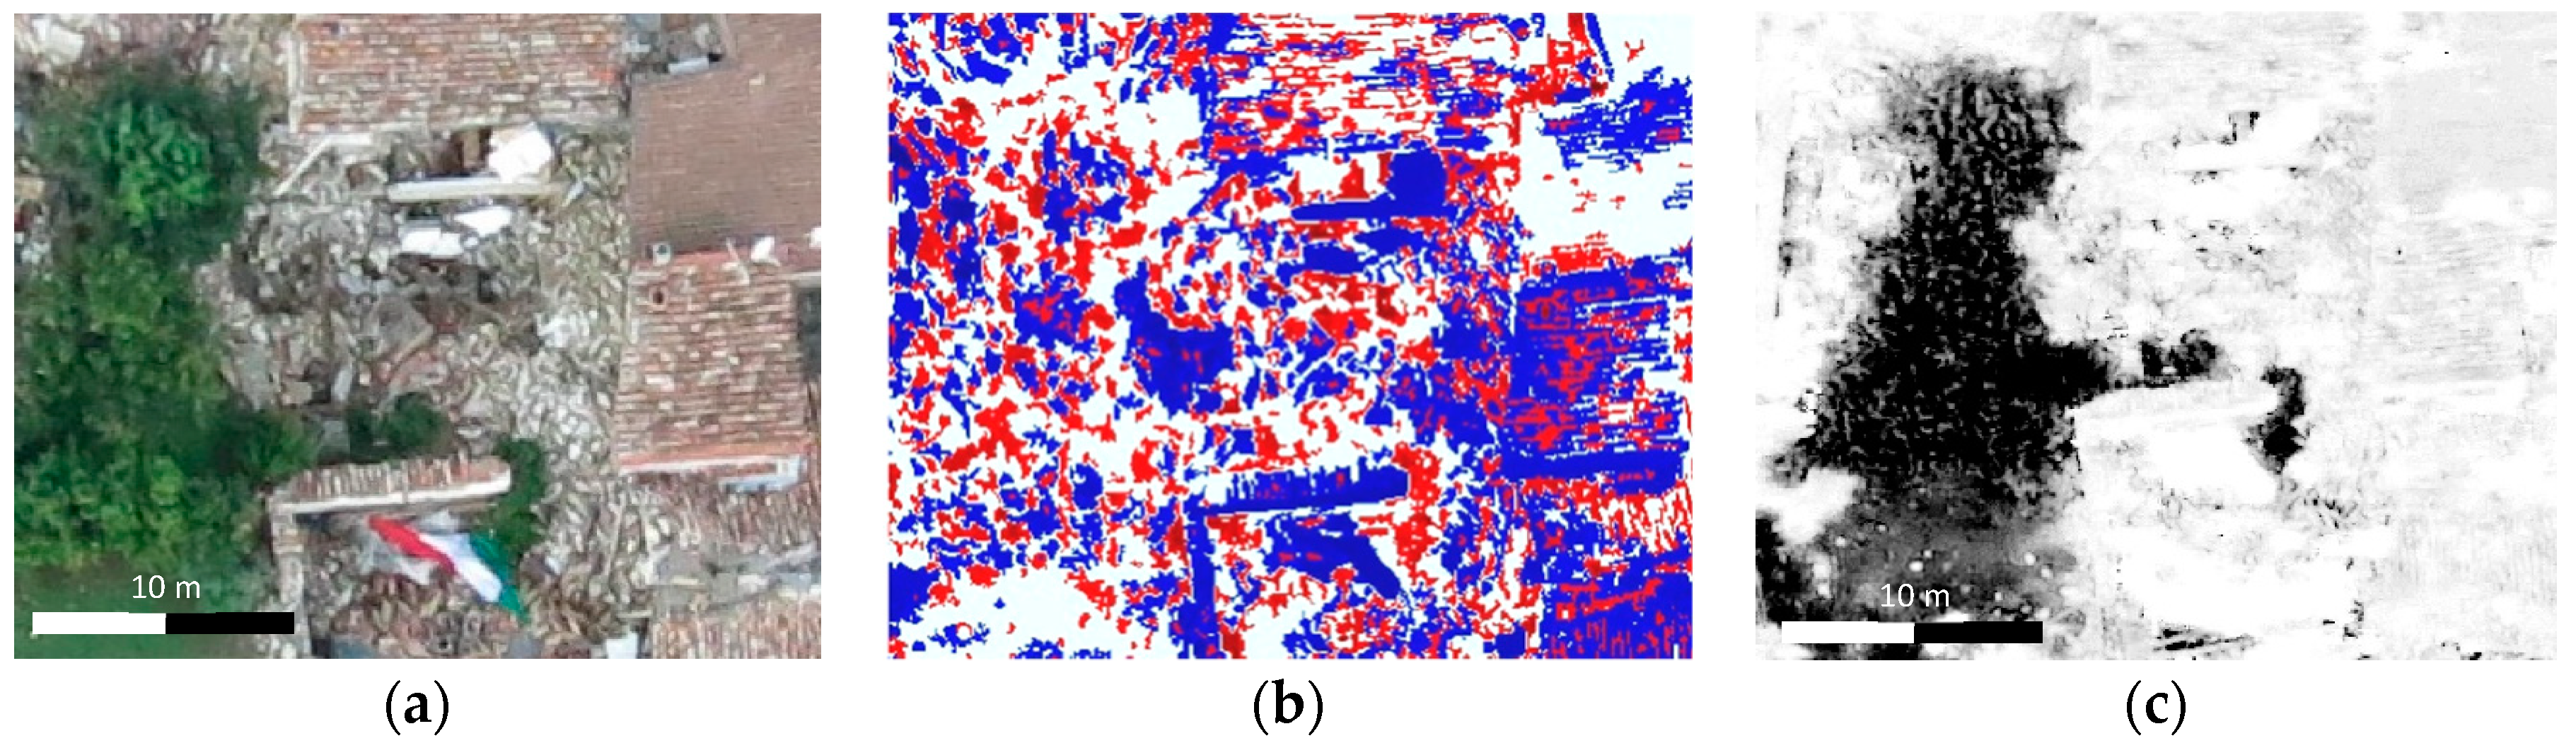
The direct use of CNN on the whole image would substantially increase the processing time, thus a two-step cascade approach was implemented. Debris, compared to intact regions, has normally a very fragmented and irregular structure. It is characterized by sudden radiometric variations between several small brighter and darker areas generated by the different illumination on the fragmented surface. The rough selection of the areas potentially indicating damages can therefore be conducted using a morphological filter and the GRVI index [
40]. The first filter excludes the areas corresponding to homogenously textured areas (typically in correspondence of intact regions) while the second eliminates the vegetated regions. The morphological filter is given by a sequence of image closing-by-reconstruction and opening-by-reconstruction as proposed in [
41]. The first filter detects brighter areas compared to neighboring objects while the darker areas are detected with the second filter. Compared to other filtering methods, this approach defines a minimum and maximum size of darker and brighter areas that allows to select only relatively small regions (as in the case of debris). Given the approximate GSD of a UAV flight (typically 1–5 cm), it is possible to select regions on the ground with a size interval preserving their shapes in the images. Bright areas larger than 3 pixels and smaller than 25 pixels as well as dark regions smaller than 15 pixels are used to select candidate damages (
Figure 5b). These sizes have been defined by experimental tests on the available test datasets. The image is then divided in patches (80 × 80 pixels) to assess the presence of damages. If a patch has a higher percentage of both brighter and darker pixels, this is considered a proxy for potential building damage areas. From experimental tests, 10% of both brighter and darker regions (extracted by morphological filters) is a precautionary value that allows to extract the damaged area without generating false negatives. These patches are further selected excluding those with large extends of GRVI values. The following CNN detection algorithm is run only on these patches to remove false positives, greatly reducing the time needed to classify the complete image.
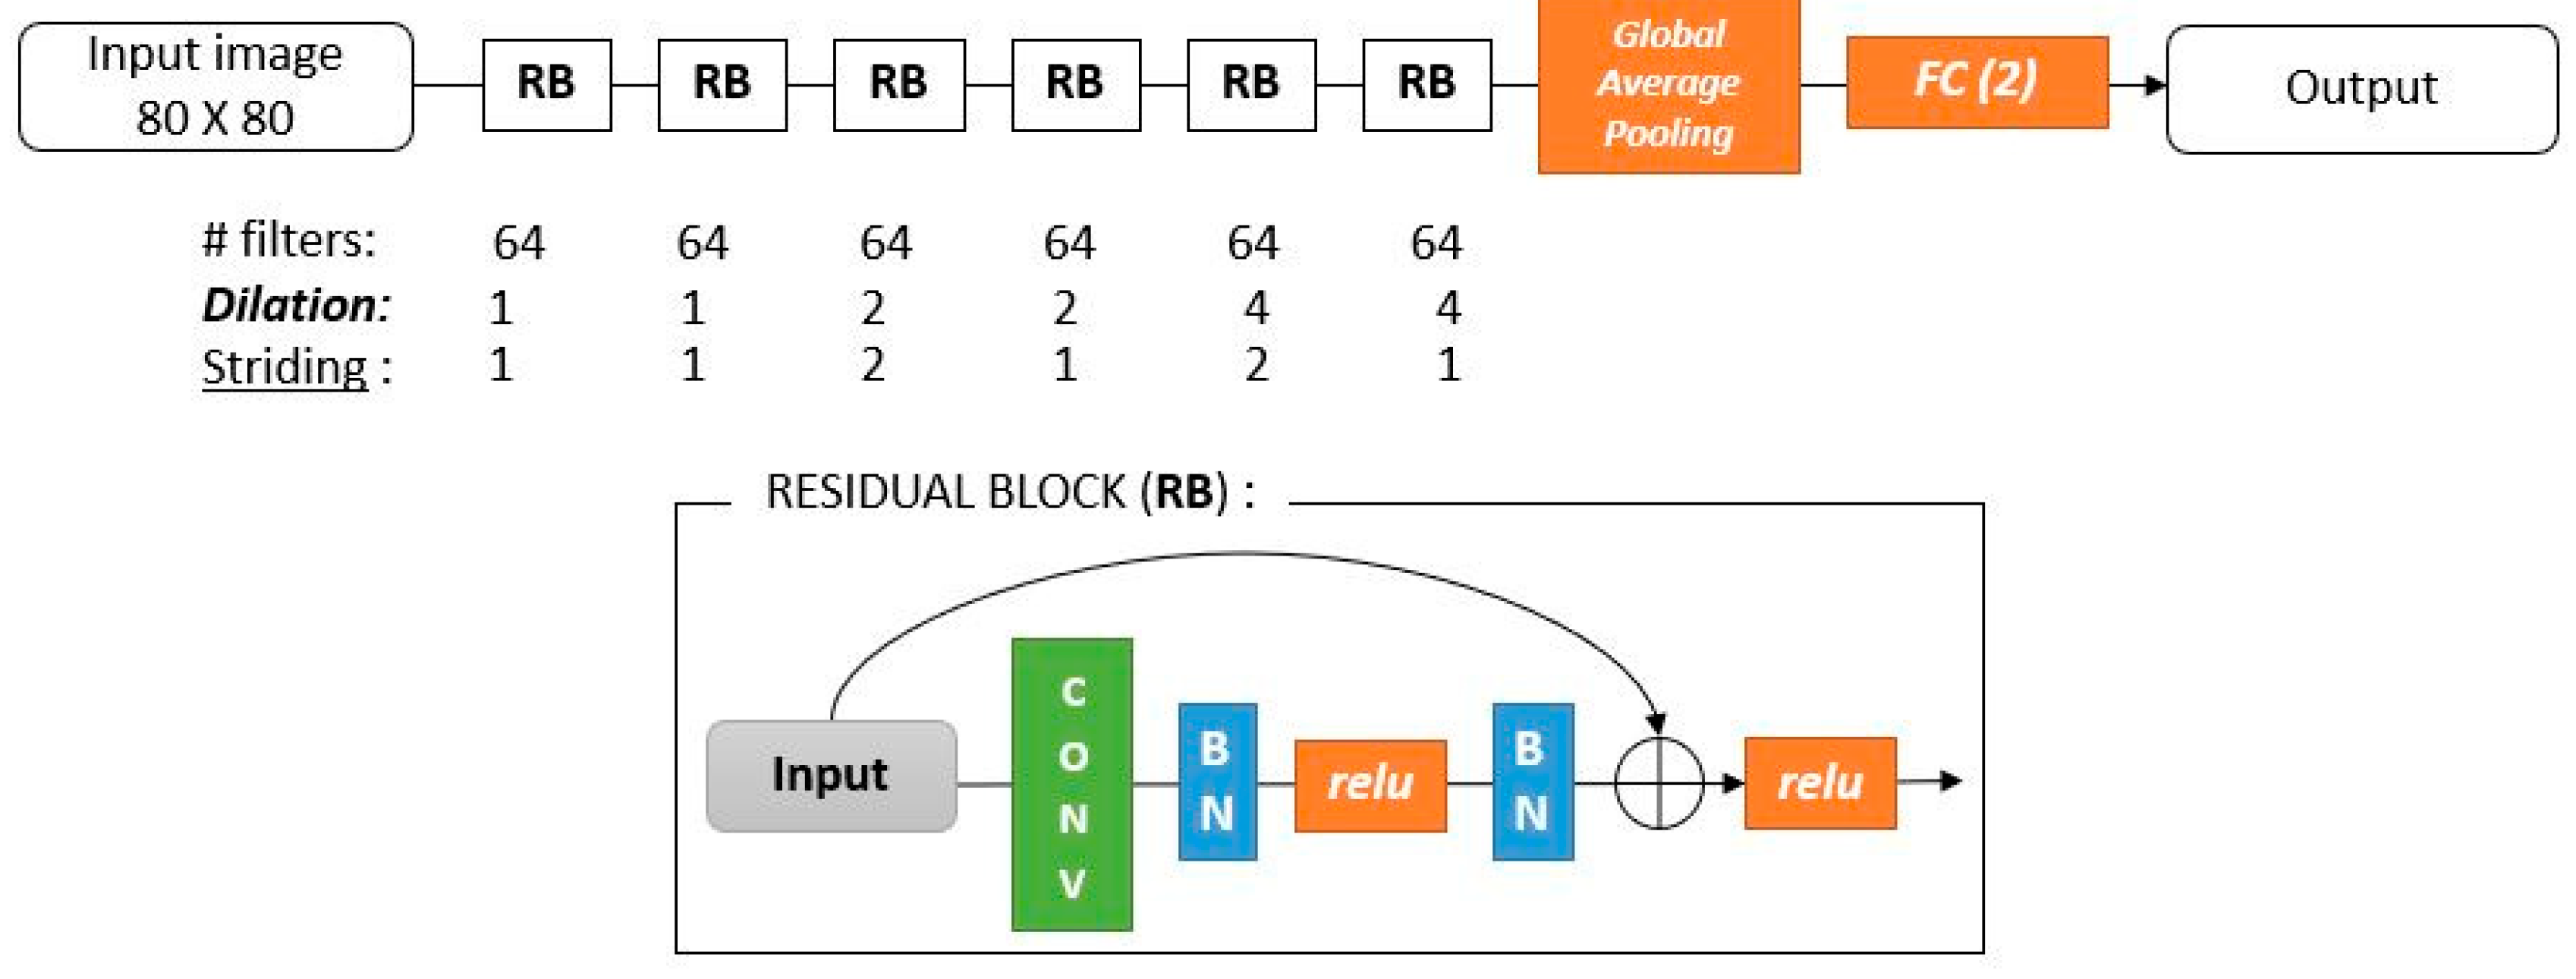
A shallow ResNet [
22] network (see
Figure 6) was developed to allow the fast and reliable detection of the damages. ResNet-like networks have shown very promising results in the damage detection [
27] and shallow versions of this architecture have provided reliable results in complex tasks such as autonomous UAV flights [
20]. In our application, we use a residual block that is formed as indicated in
Figure 6 (RB—residual block) [
22]. Six residual blocks are stacked with a low number of filters decreasing the number of parameters in the network (to reduce the overfitting) and also decreasing the time needed for both training and testing on new images. For the classification part of the network, global average pooling followed by a fully connected layer are used.
Building damage detection can be most reliably detected considering the contextual information of the patch: the developed network uses dilated convolutions and downsampled patches to take this into account (
Figure 6). From experimental tests, the presented network has shown comparable results to deeper networks used for the same task while reducing the processing time: deeper and more complex networks [
14,
27] just marginally improved the validation accuracy at the cost of longer running processes.
The developed network was trained using the datasets presented in [
27] for UAV images. Two classes (damaged and intact) have been considered, using about 4000 samples for each of them during the training. In order to prevent overfitting issues, training was extended using data augmentation (translation, rotation, and affine transformations). The training consisted of 100 epochs, with a batch size of 128 and 0.1 initial learning rate and a learning rate drop period of 40 epochs. The validation performed on 20% of the training samples reported an overall accuracy of 92.1%.
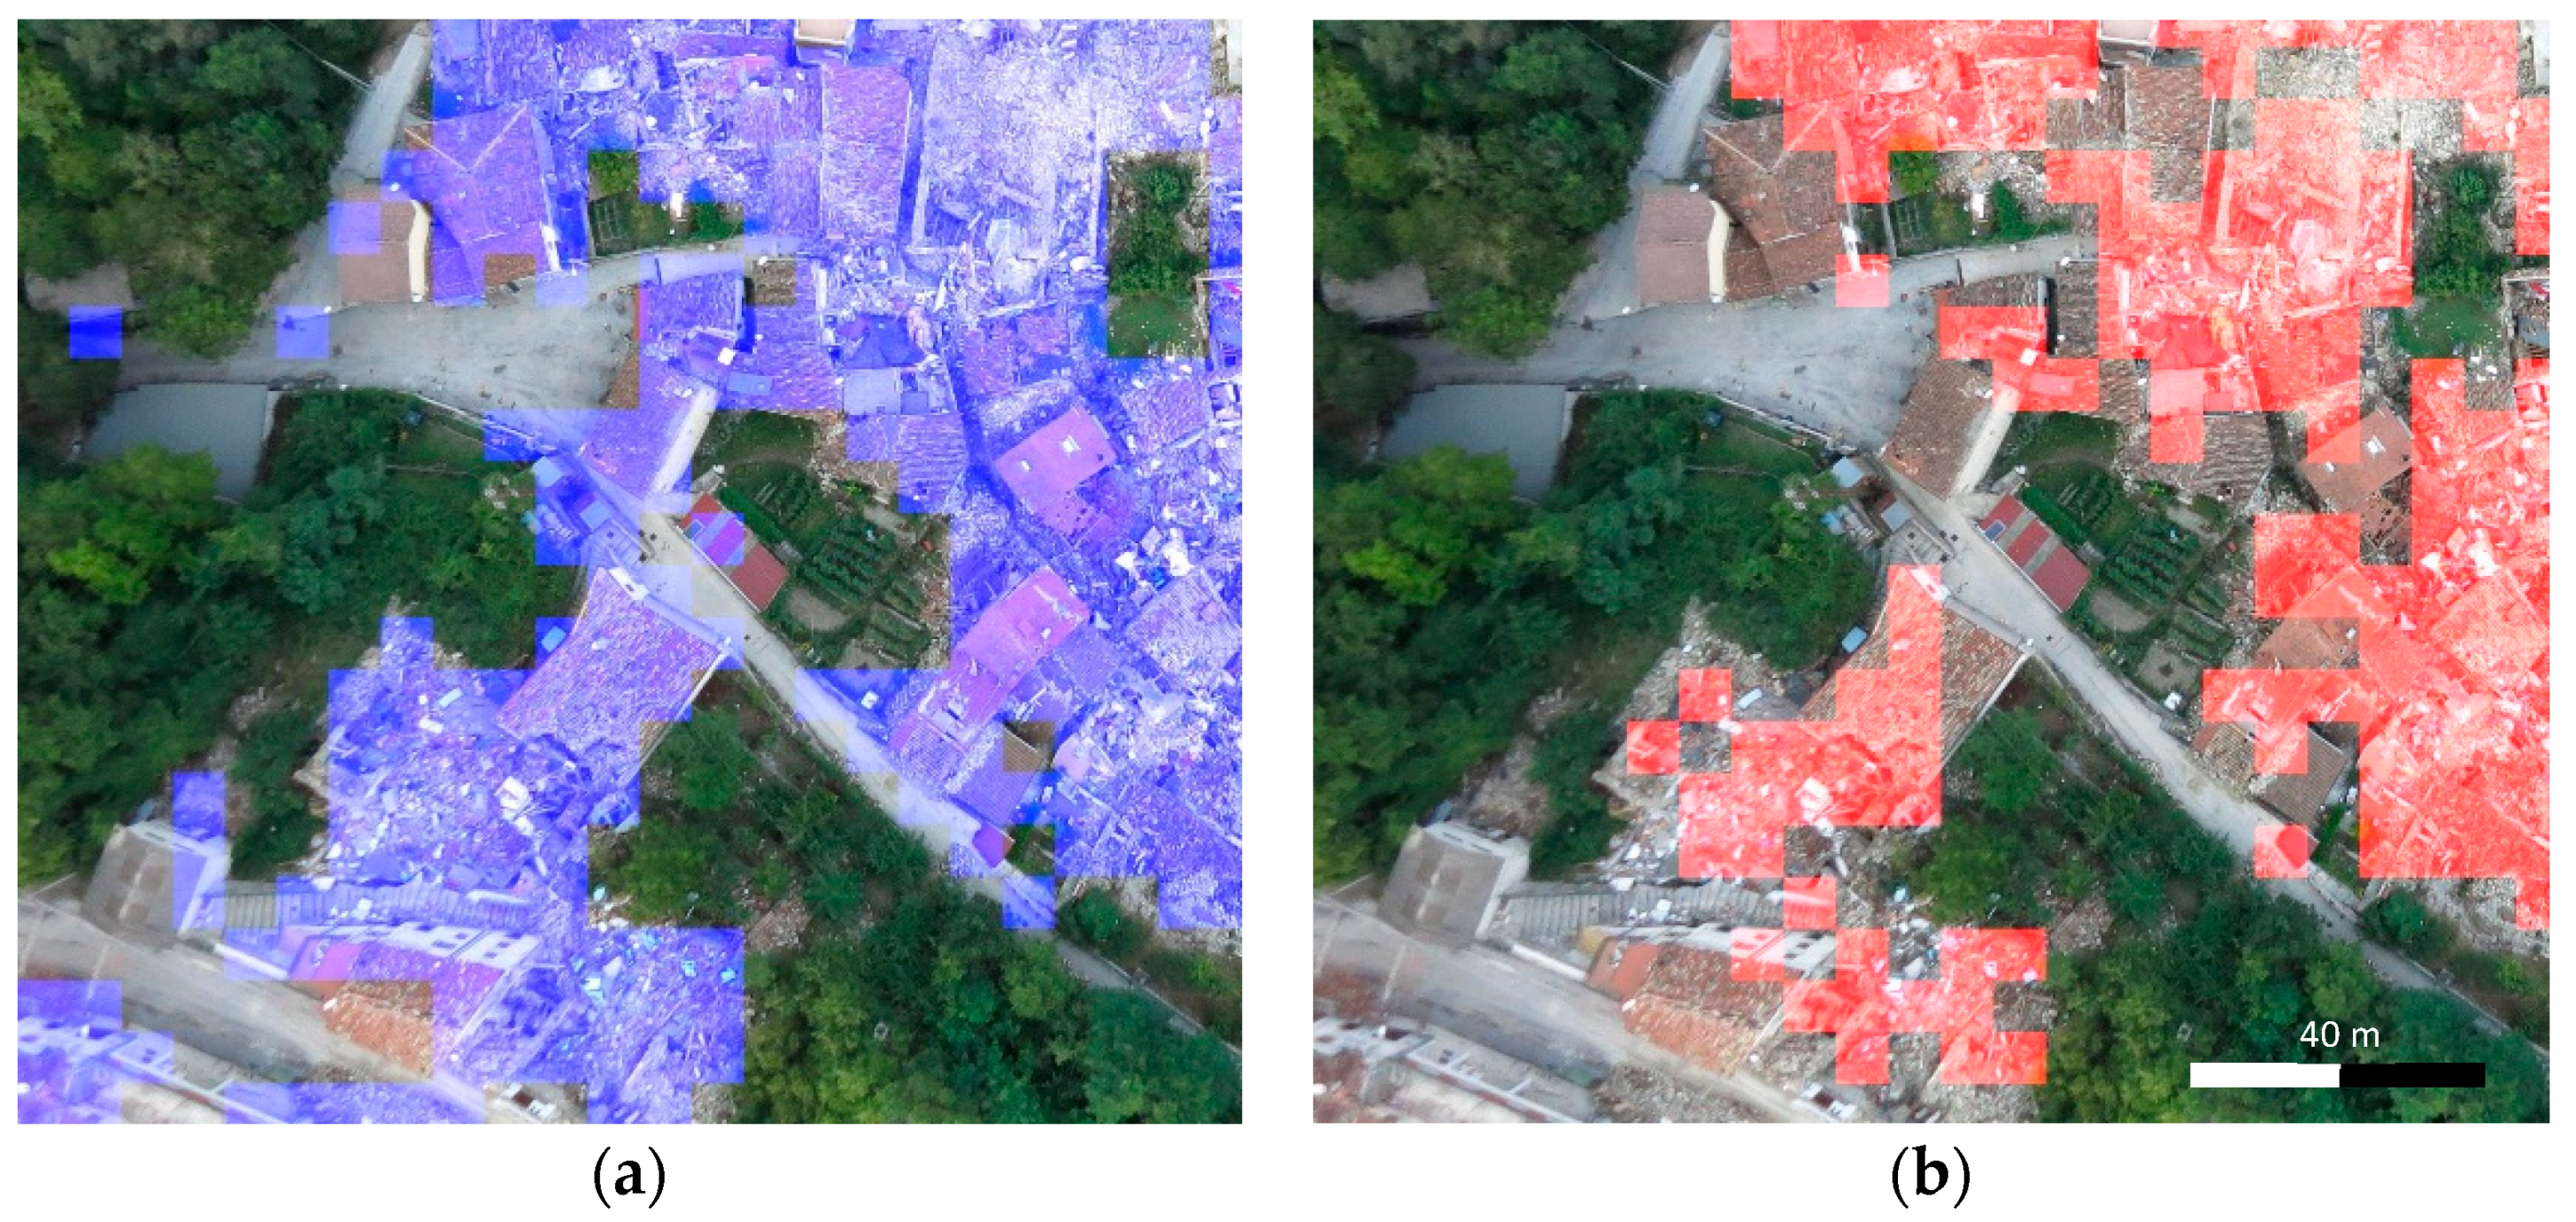
As shown in
Figure 7, the network is able to classify the patches, reducing the number of false positives in the scene and delivering accurate detections in the images. The algorithm was implemented in MATLAB 2018b using the deep learning toolbox and taking advantage of the GPU and parallel processing.
4. Tests and Results
All components of the proposed approach have been tested in dedicated experiments. In this paper, only the two most relevant experiments are shown. These refer to two realistic scenarios executed during the pilot tests of the INACHUS project. In both cases the full pipeline was used to assess the performance of the methodology. Relatively small areas were surveyed because of legal constraints. The used CNN was trained before these tests using samples from different locations (as explained above) to test its transferability to new datasets and therefore its practical usability in real scenarios.
The same PC was used for both tests: a Dell 5520 - i7 7820HQ (2.9GH) with 32 GB RAM and a Nvidia Quadro M1200 GPU graphic card. This allowed GPU to be fully exploited for the SfM (in the ColMap library) as well as for the MATLAB code implementing the morphological filters and the damage detection with CNN.
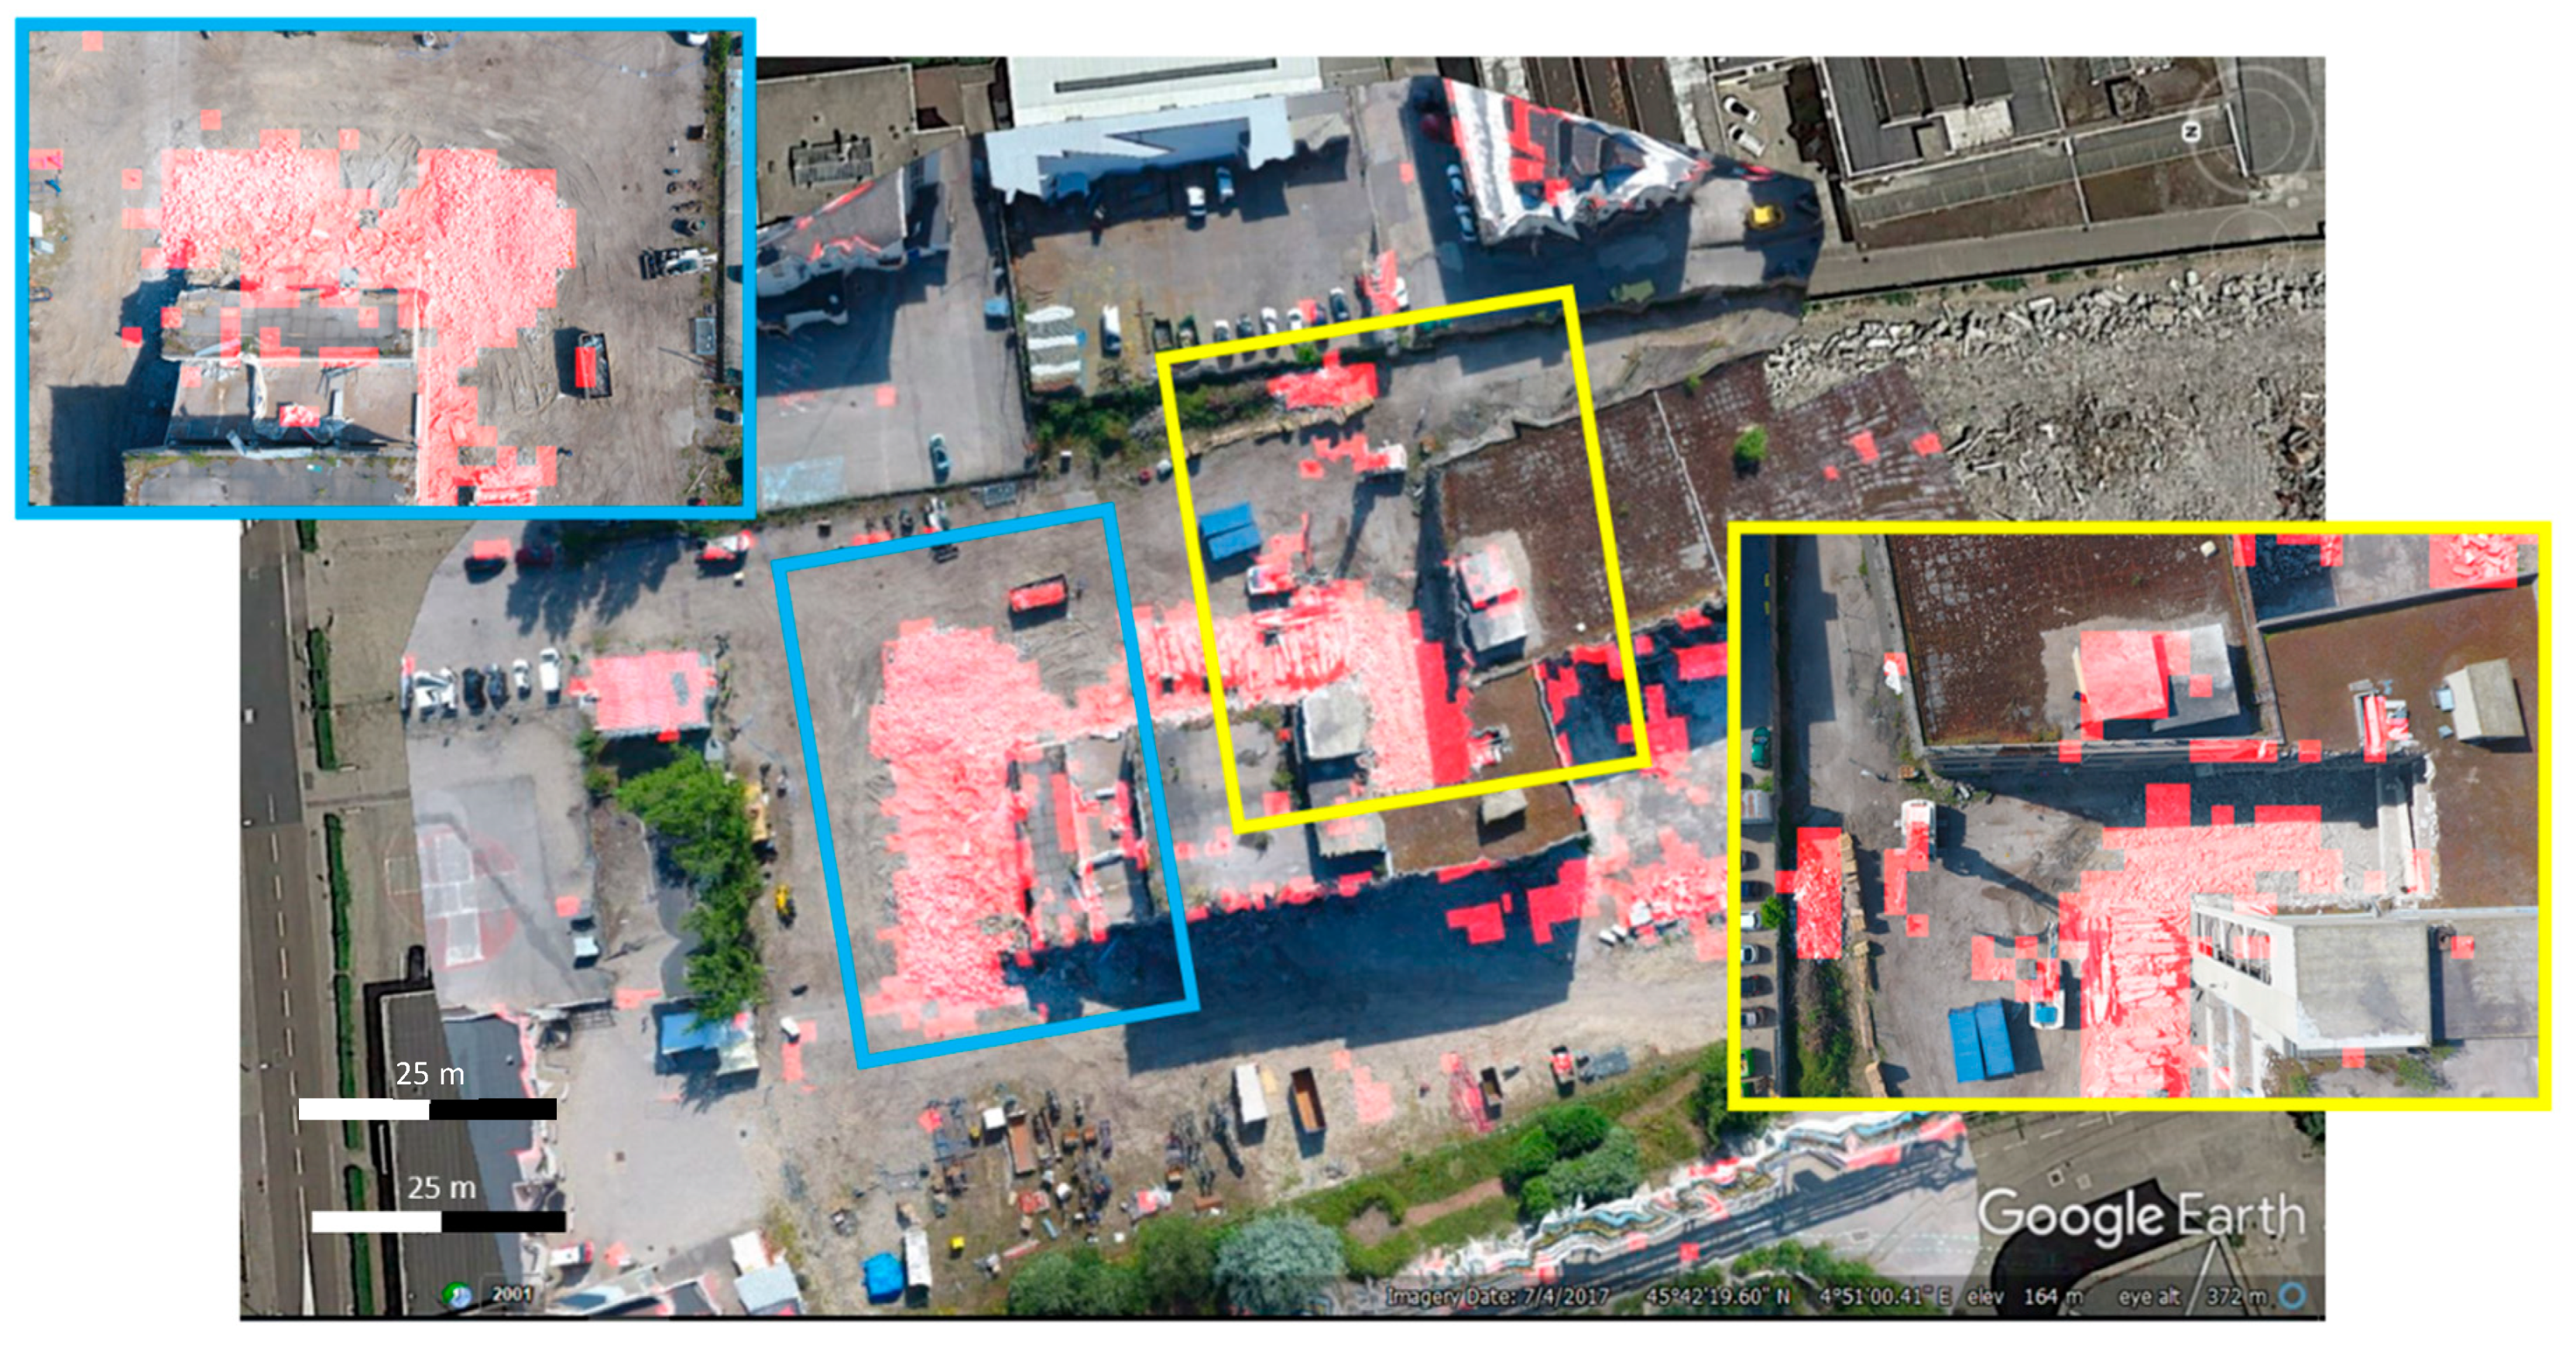
4.1. Lyon (France)
This dataset consists of 91 images that were acquired over a building demolition site (Lyon, France) specifically prepared for this pilot test. The flight height is 50 m while overlaps are 90% (forward) and 80% (side). The complete acquisition was performed in approximately 10 min (including take-off and landing), acquiring an image every 5.5 s on average. The data processing started after receiving the first images. Downsampled images (one-quarter the original size) were used in the orientation procedure, while a full resolution image was used for the damage identification. The damage detection was performed on every third image and this process took about 5 s for each image. In this regard the morphological filtering allowed the number of considered patches to be reduced by about 76% (on average only 397 patches out of 1900 per image).
The image orientation and the damage detection were completed about 50 s after the acquisition of the last image: this is still compatible with the near real-time goals as the UAV only took approximately 30 s to return from the final waypoint and land in its initial position. An additional 55 s were necessary to deliver the final orthophoto in GeoTIFF format to visualize them on external tools such as Google Earth as shown in
Figure 8.
The orthophoto was rectified using the tie-points extracted in the image orientation as 3D. The generated DSM is therefore suboptimal and includes considerable distortions in correspondence of the edges of the image block where fewer tie-points are available to correctly reconstruct the scene in 3D. However, the used UAV does not have an accurate GNSS on board and systematic shifts (2–3 m in an easterly direction) are visible when comparing the orthophoto with Google Earth. However, map deformations and systematic errors in georeferencing are acceptable considering the specific purpose of the mapping. The detection algorithm was able to correctly localize the damages. The quantitative assessment (
Table 1) shows recall, precision and F1-score computed on the orthophoto (
Figure 8): a manually delineated damage mask was used as ground truth. The achieved values confirm that the only morphological filter overestimates the percentage of true positives while CNN provides better results in all the considered metrics. In general, building damages are overestimated in correspondence of roofs and manmade objects that appear very similar to building debris in the images. Small false negative regions can be detected close to the building in the shadowed area: this misclassification can be explained by considering that these small regions are not visible in many images (due to the building occlusions) as well as by shadows and poor image quality in this part of the scene.
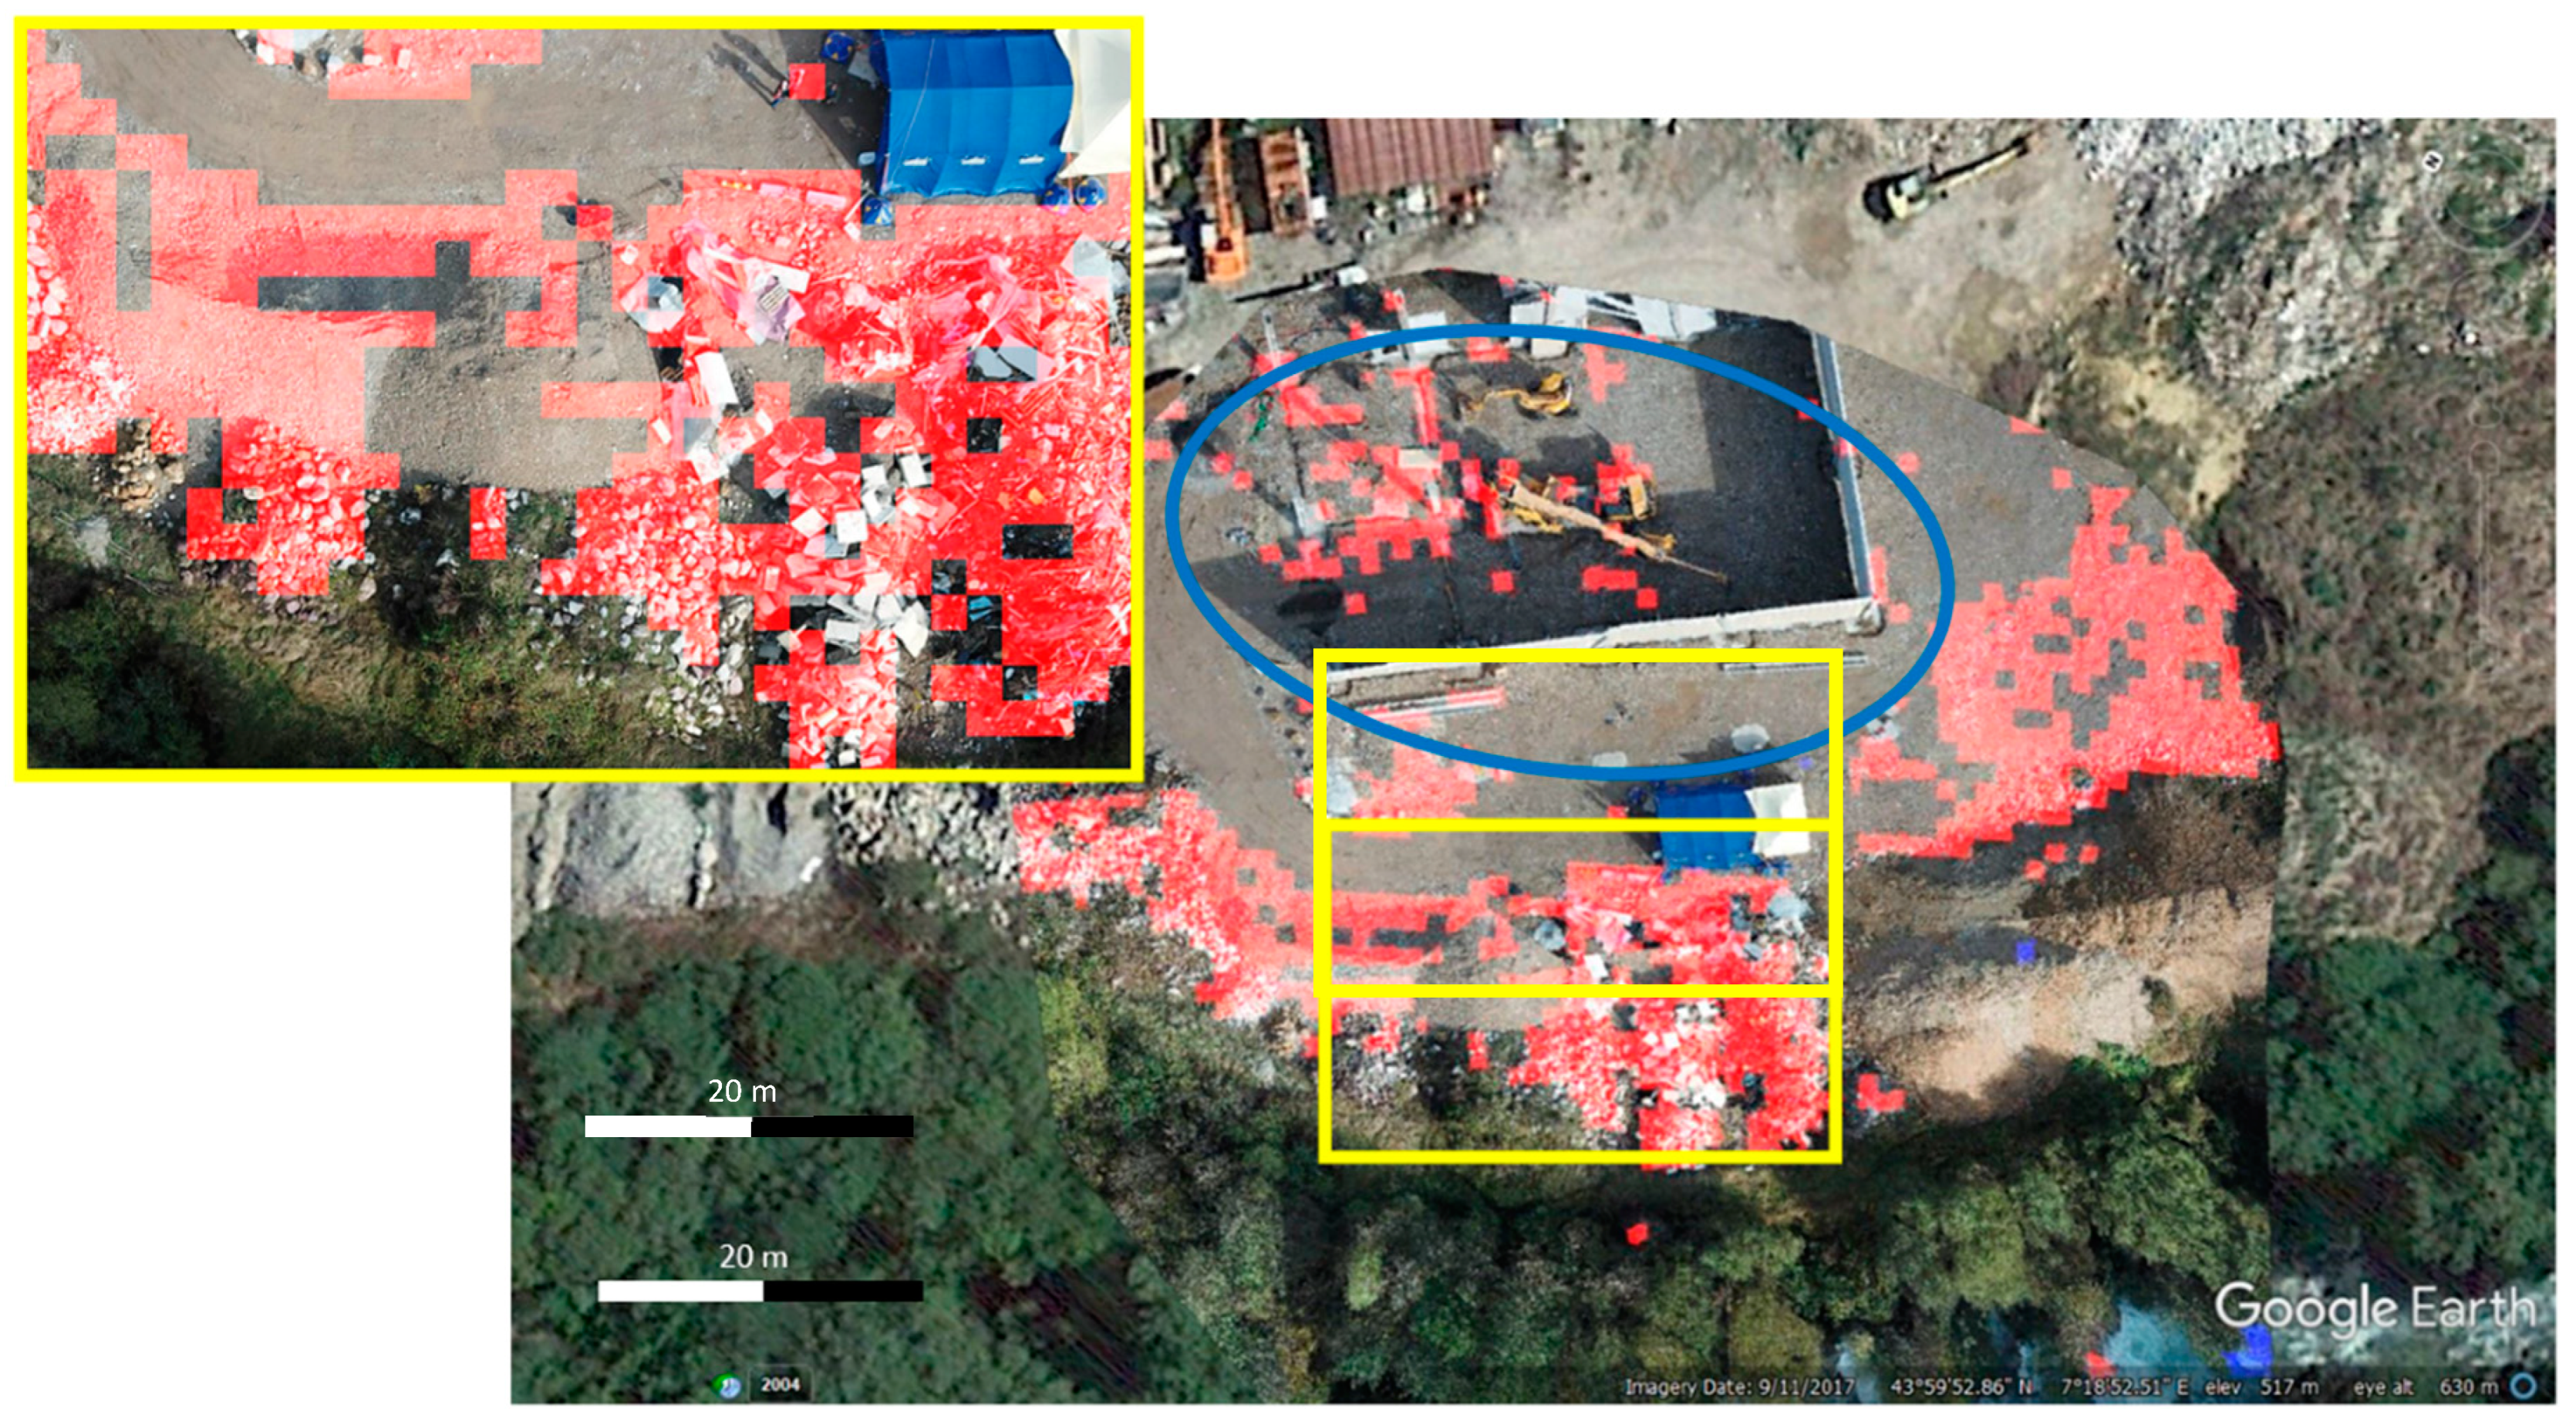
4.2. Roquebilliere (France)
This dataset is composed by 24 images acquired in a construction area formerly used as quarry. The flight was performed at 50 m height with 80% forward overlap and 60% side overlap. Part of the scene is occupied by a rubble pile on one side of the construction area (
Figure 9).
A large percentage of the scene is also occupied by vegetation and bare soil. The flight was slower than the previous case (probably because of the wind) and images were acquired at 7 seconds intervals. The complete flight took 4:30 min.
The image orientation and damage detection were performed in real-time, while the generation of the orthophoto was completed few seconds before the UAV landing. In this case, the longer intervals and the lower number of images supported the completion of the work at reduced times.
The damage detection was performed regularly on every third image. As in the previous test, the morphological filters and the detection of vegetation reduced the number of patches processed by the neural network to 24%. The 81% of these patches were then classified as damages. The generated orthophoto has some small shifts compared to the Google Earth map, as discussed in the previous case. Given the difficulty in defining a univocal ground truth (because of the presence of many objects mimicking the debris), no quantitative assessment has been performed in this test. Qualitatively, the number of false positives is relatively high: the algorithm was trained (with real case images) to detect concrete and brick debris that mimic rubble piles made of stones and soil largely present in this scene. Some additional false positives are then visible inside the building under construction. No false negatives are visible in the delivered results.
5. Discussion
The performed tests have shown the suitability of the presented approach for near real-time damage mapping. The stop & go flight mode implemented in the app reduces the productivity of the flight: between 8 and 12 images per minute were normally acquired in the performed tests, depending on the distance among them and the weather conditions. The stop & go however allows a better quality of the images (i.e., no motion blur) and gives a higher flexibility compared to acquisitions with fixed time intervals as the gimbal can be rotated for each image independently. The delay between image acquisition and storing on the laptop is normally less than 2 s. The performed tests showed that the streaming is faster and more reliable if no obstacles are present between the remote control and the UAV.
The approach can execute the orientation of the images and the simultaneous damage detection in real-time for small blocks, as was the case in the second test. Large image blocks (as in the Lyon test) usually determine delays in the processing of the images: this is mainly due to the global BBA in the image orientation as a larger number of observations progressively needs to be processed, requiring more time. How often to perform the global adjustment in the image block is one of the main aspects to be considered to reduce the processing time. Many implementations in the robotics domain only perform local BBA (or similar approaches) to make the orientation progress more efficient, often at the cost of larger block deformations. In the presented application, the geometric consistency of the generated map still represents a priority that cannot be neglected for a slightly faster implementation. Other elements such as the resolution of the images used in the orientation or the performance of the used laptop can also strongly influence the real-time feasibility of the approach.
The use of deep learning algorithms outperforms traditional detection algorithms but requires higher processing times. The adoption of a morphological filter coupled with a vegetation index has greatly reduced the search for building damages in the image, reducing the tiles processed by the neural network. The parameters of the morphological filter are intentionally relaxed to prevent the generation of false negatives. As shown in
Section 4.1, few damages can be classified as intact regions (i.e., false negatives), but this problem can be explained considering the presence of shadows, the building occlusions in many images and the poor image quality. It must be noted that the damage detection on these regions fails using both the morphological filter and the CNN. False positives are more advisable than false negatives from a FR’s perspective. However, the performed tests (also using other datasets) have demonstrated that this kind of error is limited to very small areas and peculiar conditions (i.e., shadowed areas, blurred images, etc.). In general, the implemented CNN has allowed to generate reliable and complete detections despite its (relatively) limited number of layers. Damages are generally overestimated as many objects look very similar to damaged structures.
6. Conclusions and Future Developments
This paper has demonstrated that building damage maps can be generated in near real-time using low-cost and commercial UAVs. The solution was conceived to give an answer to the practical needs of FR involved in urban search and rescue operations: FR involved in the INACHUS project have appreciated the performance of this solution. The presented methodology takes advantage of different solutions coming from different domains (robotics, photogrammetry, and computer vision) to deliver an almost completely autonomous solution. The customizations performed with the SDK allowed to stream the images on a dedicated laptop while the integration of photogrammetry and deep learning algorithms allowed the efficient generation of building damage maps.
All the implemented components of the methodology were thoughtfully tested although only two sets of results on the performed pilot tests were presented in this paper. These tests showed that the communication between UAV and remote control as well as the following data streams are generally reliable. However, the use of high-end smartphones, with better hotspot capability and processing speed is preferable to fasten the streaming. As already discussed, a stop & go flight mode is more flexible but less efficient than flights with regular interval acquisitions: for this reason, the app will be further developed to introduce this option only for nadir flights. On the other hand, the presented approach will also be extended to façade inspection planning.
The developed data processing showed real-time capabilities only for small datasets. Larger datasets can be processed with increasing delays in the orientation procedure. Although the registered delays are still acceptable for the specific task, more effective solutions could be tested to further improve this feature.
The two-step approach building damage detection has allowed to achieve reliable results in acceptable times, overcoming the need of more expensive hardware. The full resolution images (12MP in the performed tests) can be efficiently processed in a few seconds. The presented network is largely a state-of-the-art network customized for building damage assessment. Although its performance is comparable with existing deeper networks [
14,
27], additional studies will be undertaken to test different architecture and improve the current results. The migration from MATLAB to more efficient programming languages could further fasten the process, although recent developments of this software have returned comparable processing times to other tools and libraries [
42].


