1. Introduction
Remote sensing is well suited for non-intrusive observation of bare soils, especially over large, hazardous, or inaccessible areas, such as a wildfire site. For example, spaceborne remote sensing techniques are commonly used to rapidly (1) establish wildfire perimeters, (2) assess the remaining vegetative cover, and (3) determine the burn severity after containment of the fire. Collected remotely sensed data (burn severity, extent) are often calibrated with ground-truthing methods, yet these proximal ground-truthing methods are often point-wise, spatially limited, and cannot easily cover vast areas. Moreover, information about the soil is not commonly collected in these areas following a wildfire. Characterization of soil in a wildfire-affected area commonly relies on regional, typified soils data from databases like the Soil Survey Geographic Database (SSURGO) and the State Soil Geographic Survey (STATSGO). These data, however, have insufficient resolution for reliable, site-specific, predictive modeling of post-wildfire hazards (e.g., debris flows) and do not capture the time-variability associated with meteorological and hydrological action. Because burned areas are ideally suited for study with remote sensing techniques, due to the absence of vegetation (fire-induced denudation), there is a need for methods to collect high-resolution, timely, and site-specific soils information.
To address this need, a ground-based, remote sensor, called the soil observation laser absorption spectrometer (SOLAS), was developed to rapidly infer soil properties at the field scale. The development of the SOLAS followed laboratory-based, proof-of-concept testing that successfully derived soil water characteristic curves (SWCC) as well as index properties (liquid limit (LL), plastic limit (PL), and clay fraction (CF)) for several soil types by using only non-contact, optical techniques. By combining spectroradiometric, differential laser absorption, and range altimetry techniques, the SOLAS instrument was designed to collect range-resolved information from bare soils, including soil surface moisture (an estimation of volumetric water content, θv), soil matric potential (ψm), burn severity, LL, PL, and CF. An initial description of the SOLAS instrument is provided herein; as such, the materials and methods used in the development of the instrument are detailed and described. Additionally, supporting background information about reflectance spectroradiometry, lidar altimetry, and differential laser absorption is provided. Measurement results from field-testing will be described by the authors in later articles.
2. Background
A variety of remote and proximal sensing techniques for obtaining soils information have been demonstrated. These techniques include passive imaging spectroradiometry (multispectral, hyperspectral, visible near-infrared (VNIR), shortwave infrared (SWIR), and mid-wave-infrared (MWIR)), active and passive microwave systems (synthetic- and real-aperture radar, ground-penetrating radar), and gamma-ray spectrometry [
1]. Although the correlation between reflectance and soil moisture was studied as early as 1925 [
2], advances in ground-based multispectral and hyperspectral measurement techniques of reflectance spectra, primarily in the VNIR (380–1000 nm) and SWIR (1000–2500 nm) ranges, have been utilized to estimate soil moisture content (SMC) in the laboratory setting [
3,
4,
5,
6,
7,
8,
9,
10,
11,
12,
13,
14,
15,
16,
17,
18,
19,
20,
21,
22,
23,
24]. In the aforementioned studies, the laboratory measurements were collected using carefully prepared or dilute soil specimens under controlled conditions. Fewer studies were conducted under field conditions [
23,
25,
26]. Among the numerous developed soil reflectance correlations in the literature, other soil parameters of interest have included clay content [
9,
14,
24,
27,
28,
29,
30], grain size [
9,
28,
29,
31], soil plasticity [
24,
32,
33] and matric potential [
24].
The SOLAS instrument that is described herein was designed based on other work previously performed at the University of Arkansas. For example, Garner [
24] utilized a laboratory-based diffuse reflectance infrared Fourier transform (DRIFT) technique to develop an empirical relationship between reflectance spectra and soil plasticity for illite and kaolinite soil types, as well as for a commercial synthetic nepheline synetite material (Donna Fill Co., Little Rock, AR, USA). Garner [
24] also developed a laser analysis of soil tension (LAST) technique to infer the SWCC for dilute pressure plate extractor (PPE) prepared soil specimens. The measurement technique utilized coherent illumination from two low-power, near-infrared laser diodes and data collection using a high radiometric-resolution spectrometer (ASD FieldSpec 4 Hi-Res; Malvern Panalytical, Longmont, CO, USA) to relate
θv and
ψm through the SWCC. The empirical relationships relied upon partial least squares and principle components regression techniques [
9,
24,
34].
2.1. FMCW Lidar Altimetry
Among laser altimetry methods, coherent, frequency modulated continuous waveform (FMCW) lidar has been widely pursued [
35,
36,
37,
38,
39,
40,
41,
42]. A pulse compression technique has been applied to FMCW lidar systems, whereby a linear frequency sweep or “chirp” with a large bandwidth is used to modulate the optical carrier signal. As documented in the aforementioned FMCW lidar literature, range accuracy was maintained, while peak output power and receiver bandwidth requirements were reduced (over direct detection or conventional, pulsed, time-of-flight systems).
Adany et al. [
39] demonstrated the advantages of a self-chirped, homodyne detection scheme for FMCW lidar. The simplified homodyne system offered significant advantages over direct detection and heterodyne detection methods through less complex receiver configuration. Furthermore, improved receiver sensitivity permitted better long-range lidar measurements. In the Adany et al. [
39] configuration, the optical signal was intensity-modulated with a linear frequency modulated (FM) sweep (from frequency
f1 to
f2) with chirp bandwidth,
B, equal to
f2 −
f1. For the Adany et al. [
39] design, a portion of the carrier signal was used as the local oscillator (LO) in conjunction with a balanced photodetector (BPD). The range to the target was proportional to the frequency difference between the LO and the received signal (beat frequency,
fR). For FMCW lidar with self-chirped homodyne detection, like that proposed by Adany et al. [
39], the range to target (
R) should be calculated using Equations (1) and (2) [
39], while the approximate range accuracy (
σR) should be determined by using Equations (3) and (4) [
36,
43,
44].
In Equation (1), R is the range to target, c is the speed of light, fR is the beat frequency, τ is the chirp duration, and f2 − f1 is the chirp bandwidth. In Equation (2), Δt is the time delay for roundtrip propagation through the atmosphere. In Equation (3), σR is the range accuracy, K is a chirp waveform constant, B is the signal bandwidth, and SNR is the signal to noise ratio of the receiver data. In Equation (4), SNRcoh is the signal to noise ratio for a shot-noise-dominant coherent detection process, ℜ is the photodetector responsivity, Pr is the received signal power, q is the electron charge (1.6 × 10⁻¹⁰ C), and BRX is the bandwidth of the receiver.
2.2. Differential Absorption Measurements
The differential absorption lidar (DIAL) technique, sometimes also called (differential) laser absorption spectrometry (LAS), has been employed to determine the concentration of molecular species in the atmosphere by measuring the difference in light absorption between two transmitted laser wavelengths. DIAL theory was developed by Schotland [
45] but has been advanced over the last six decades [
46,
47,
48,
49,
50,
51,
52,
53,
54]. Moreover, during this time period, DIAL has become the most accurate measurement technique for tropospheric water vapor concentration [
51,
53,
55,
56]. A variety of DIAL instruments and measurement techniques have been developed to measure water vapor profiles and concentrations of other atmospheric greenhouse gases (e.g., carbon dioxide, methane). These measurements have been performed from ground-based platforms [
50,
57,
58,
59,
60,
61,
62,
63,
64,
65,
66], airborne platforms [
67,
68,
69,
70,
71,
72], and proposed spaceborne platforms [
55,
73,
74,
75,
76].
DIAL measurements are typically achieved by alternating the transmission of two laser wavelengths through the atmosphere along the same path to determine the water vapor concentration. The so-called on-line wavelength is tuned to correspond with a water vapor absorption feature, while the off-line wavelength is tuned to a nearby spectral region in which water vapor is not well absorbed. For accurate measurement, a spectral region of interest must be identified for which the on- and off-line wavelengths are adjacent and the temperature dependence of the DIAL measurement is minimal. Various wavelength ranges have been recommended in the literature for measurement of water vapor. For example, Grant [
49] utilized the 720–730 nm wavelength range, while Machol et al. [
60] used wavelengths near 823 nm. The water vapor density (
ρυ), averaged over distance (
R), is commonly calculated using the DIAL equation proposed by Schotland [
46] and presented in the form of Equations (5)–(7) [
60]. For vertical measurements of the atmospheric water vapor concentration, the Voigt function (
Λ) changes due to thermal- and pressure-broadening effects, which are typically extrapolated from ground measurements. The water vapor concentration is commonly calculated using Equations (8) and (9) [
60].
In Equation (5), ρυ is the water vapor density averaged over a distance ΔR at a range R, MH2O is the molecular weight of water, NA is Avogadro’s constant, σon and σoff are the on-line and off-line water vapor absorption cross-sections obtained from Equation (6), and Pon and Poff are the received on-line and off-line backscatter signals. In Equation (6), S is the temperature-dependent absorption line strength and Λ is the Voigt function. In Equation (7), S0 and T0 are the absorption line strength and temperature under standard conditions, T is the temperature, h is the Planck constant, c is the speed of light, E” is the lower-state energy (in cm−1), and kB is the Boltzmann constant. In Equation (8), es is the saturation vapor pressure obtained from Equation (9), RH is the relative humidity (RH ≈ 100 × e/es), where e = ρυ·Rυ·T, and Rυ is the water vapor gas constant equal to 461 J·kg−1·K−1. In Equation (9), es0 is the saturation vapor pressure at T0 = 273 K and is equal to 611 Pa, and L is the latent heat of vaporization and is equal to 2.5 × 10⁶ J·kg−1.
3. Development of the SOLAS Concept
The SOLAS instrument was devised to collect range-resolved hyperspectral measurements of soils while also measuring water absorption, due to water vapor, over the measurement range. Moreover, the bench-scale studies conducted by Garner [
24] indicated that under coherent illumination, empirical inference of soil matric potential (
ψm), and volumetric water content (
θv) was possible. The instrument therefore utilized laser transmission to achieve these metrics while collecting passive radiometric measurements across the VNIR to SWIR range (350–2500 nm). Based on water vapor absorption spectra published by the high-resolution transmission (HITRAN) molecular absorption database [
77] and the availability of commercial off-the-shelf laser diodes, laser wavelengths of 823.20 nm (on-line) and 847.00 nm (off-line) were selected. For completeness, the on- and off-line wavelengths transmitted by the SOLAS instrument are transposed over a plot of the atmospheric absorption coefficient as a function of wavelength in
Figure 1.
Because DIAL instruments have primarily been developed to measure vertical gas and aerosol profiles, there are limited examples of instruments operating in horizontal orientations or for topographic target returns [
48,
50,
62,
78,
79]. Furthermore, DIAL instruments have typically utilized pulsed, rapid spectral-switching lasers to increase the accuracy of atmospheric volume sampling, especially over long vertical ranges (vertical measurements of atmospheric water vapor are extremely sensitive to pressure- and temperature-induced gradients). To provide coherent illumination to the target, while enabling simplified topographic ranging and differential absorption measurements, a diode-laser-based FMCW laser scheme was designed to switch between the on-line and off-line laser sources over short intervals (seconds). The use of a self-chirped, homodyne detection configuration (similar to [
39]), has enabled range-resolved measurements.
Figure 1.
Absorption coefficient, as a function of wavelength, for free water and water vapor with transposed on-line (823.20 nm) and off-line (847.00 nm) laser wavelengths; raw data from [
80,
81,
82].
Figure 1.
Absorption coefficient, as a function of wavelength, for free water and water vapor with transposed on-line (823.20 nm) and off-line (847.00 nm) laser wavelengths; raw data from [
80,
81,
82].
4. Instrument Description
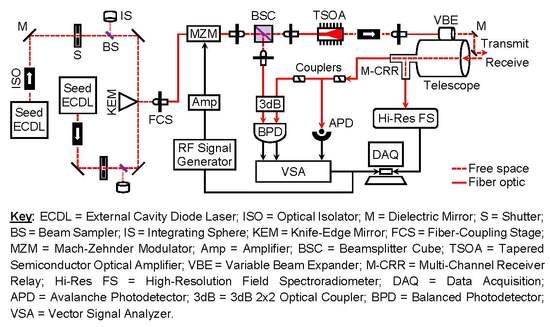
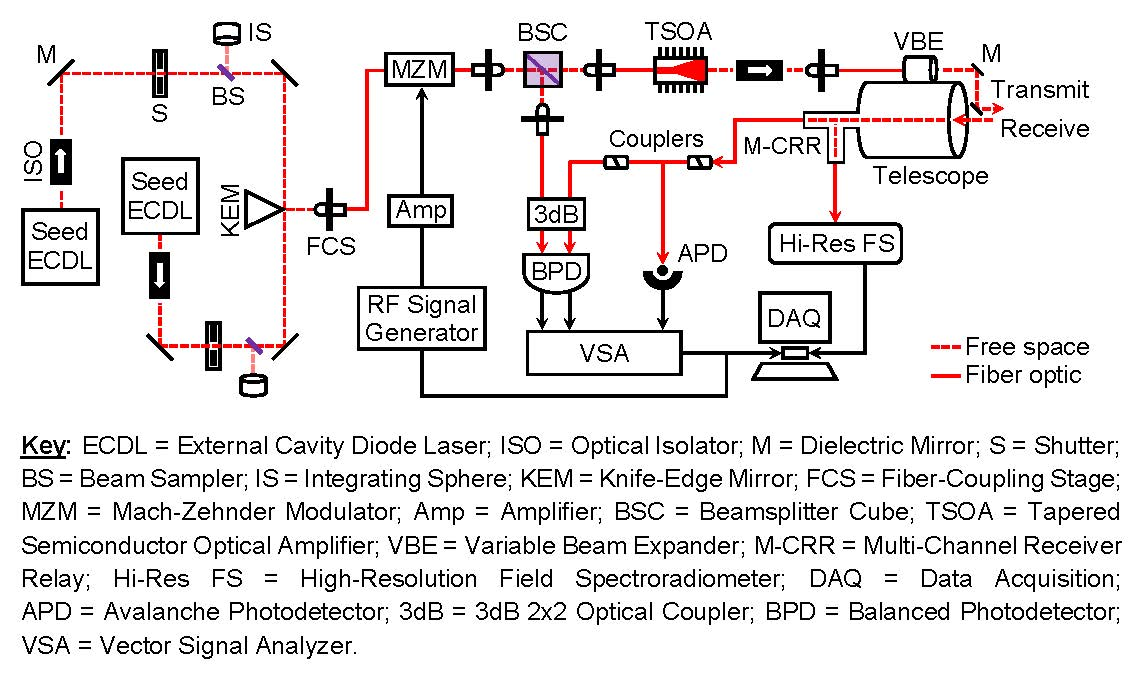
The SOLAS instrument combines range altimetry, differential absorption, and reflectance spectroradiometry technologies. The instrument is comprised of (1) a laser source and transmitting system, (2) a multi-channel receiving system (active LAS and passive hyperspectral sensing), and (3) a data acquisition and control system (signal processing and component control). A schematic of the major architecture of the SOLAS instrument is presented in
Figure 2 and a table describing the technical specifications is presented as
Table 1. Each of the instrument subsystems are further described in the following sections.
4.1. Transmitter Design
The optical carrier signal is seeded by two New Focus TLB-6817 Vortex Littman–Metcalf external cavity diode lasers (ECDL) precision-tuned to center wavelengths of 823.20 nm and 847.00 nm, with fine tuning from 823.03 nm to 823.35 nm, and 846.84 nm to 847.14 nm, respectively (Newport Corporation; Irvine, CA, USA). Each laser is powered with a low noise controller (New Focus TLB-6800-LN), producing 17 mW to 26 mW outputs with narrow linewidths (≤200 kHz). As previously presented in
Figure 2, the laser transmission path is partially free space and partially fiber optic based. To protect each ECDL from back reflections, the laser beams pass through narrowband polarization-dependent Faraday isolators (Thorlabs IO-5-850-HP) that are tuned to match each respective wavelength (Thorlabs Inc.; Newton, NJ, USA). Optomechanical shutters in the free space laser paths provide a fail-safe (Thorlabs SH05). A sequence of dielectric mirrors direct each laser beam into a polarization-maintaining fiber optic cable via a Thorlabs PAF-X-5-B fiber-coupling stage. The light energy within the fiber optic cable is then coupled into a Jenoptik AM830 Mach–Zehnder modulator (MZM) where the optical signal is intensity modulated (Jenoptik Optical Systems GmbH; Jena, Germany). The modulation is achieved by utilizing a radio frequency (RF) signal generator to encode the transmitted light with a chirp. Seventy percent of the intensity-modulated optical signal continues along the transmitter path (into the tapered semiconductor optical amplifier (TSOA)) while the remaining 30% is reflected through a free-space beamsplitting cube and fiber-coupled into a 650 MHz bandwidth New Focus 1607-AC-FC balanced photodetector (BPD) to provide the local oscillator (LO) input signal. The carrier signal is fiber-coupled and amplified through a Thorlabs TPA830P10-SP butterfly package TSOA mounted to a thermoelectric-cooled (TEC) 205 TEC Butterfly LaserMount (Arroyo Instruments LLC, San Luis Obispo, CA, USA). The TSOA chip is tuned to a center wavelength (CWL) of 835 nm (centered between the 823.20 nm and 847.00 nm transmitting wavelengths). The amplified beam is subsequently shaped with a collimation package before exiting the TSOA output window in free space. The beam is then isolated (Faraday isolator tuned to a CWL of 835 nm) and coupled into a high-power, armored fiber optic cable. The laser output is transmitted into the atmosphere co-axial with the optical receiver (telescope) by means of a collimator (Thorlabs F280SMA-835), a variable beam expander (Thorlabs BE052-B), and a pair of mirrors, as depicted in
Figure 2 and
Figure 3. The transmitter beam has an adjustable output diameter between 2.0 mm and 8.0 mm with an average beam divergence of 0.29 mrad (resulting in the diameter increasing to approximately 29 cm at a range of 1.0 km). The average beam diameter-dependent power density ranges from 10–160 mW⋅mm
−2 at the source, with the density decreasing as a function of range.
4.2. Receiver Design
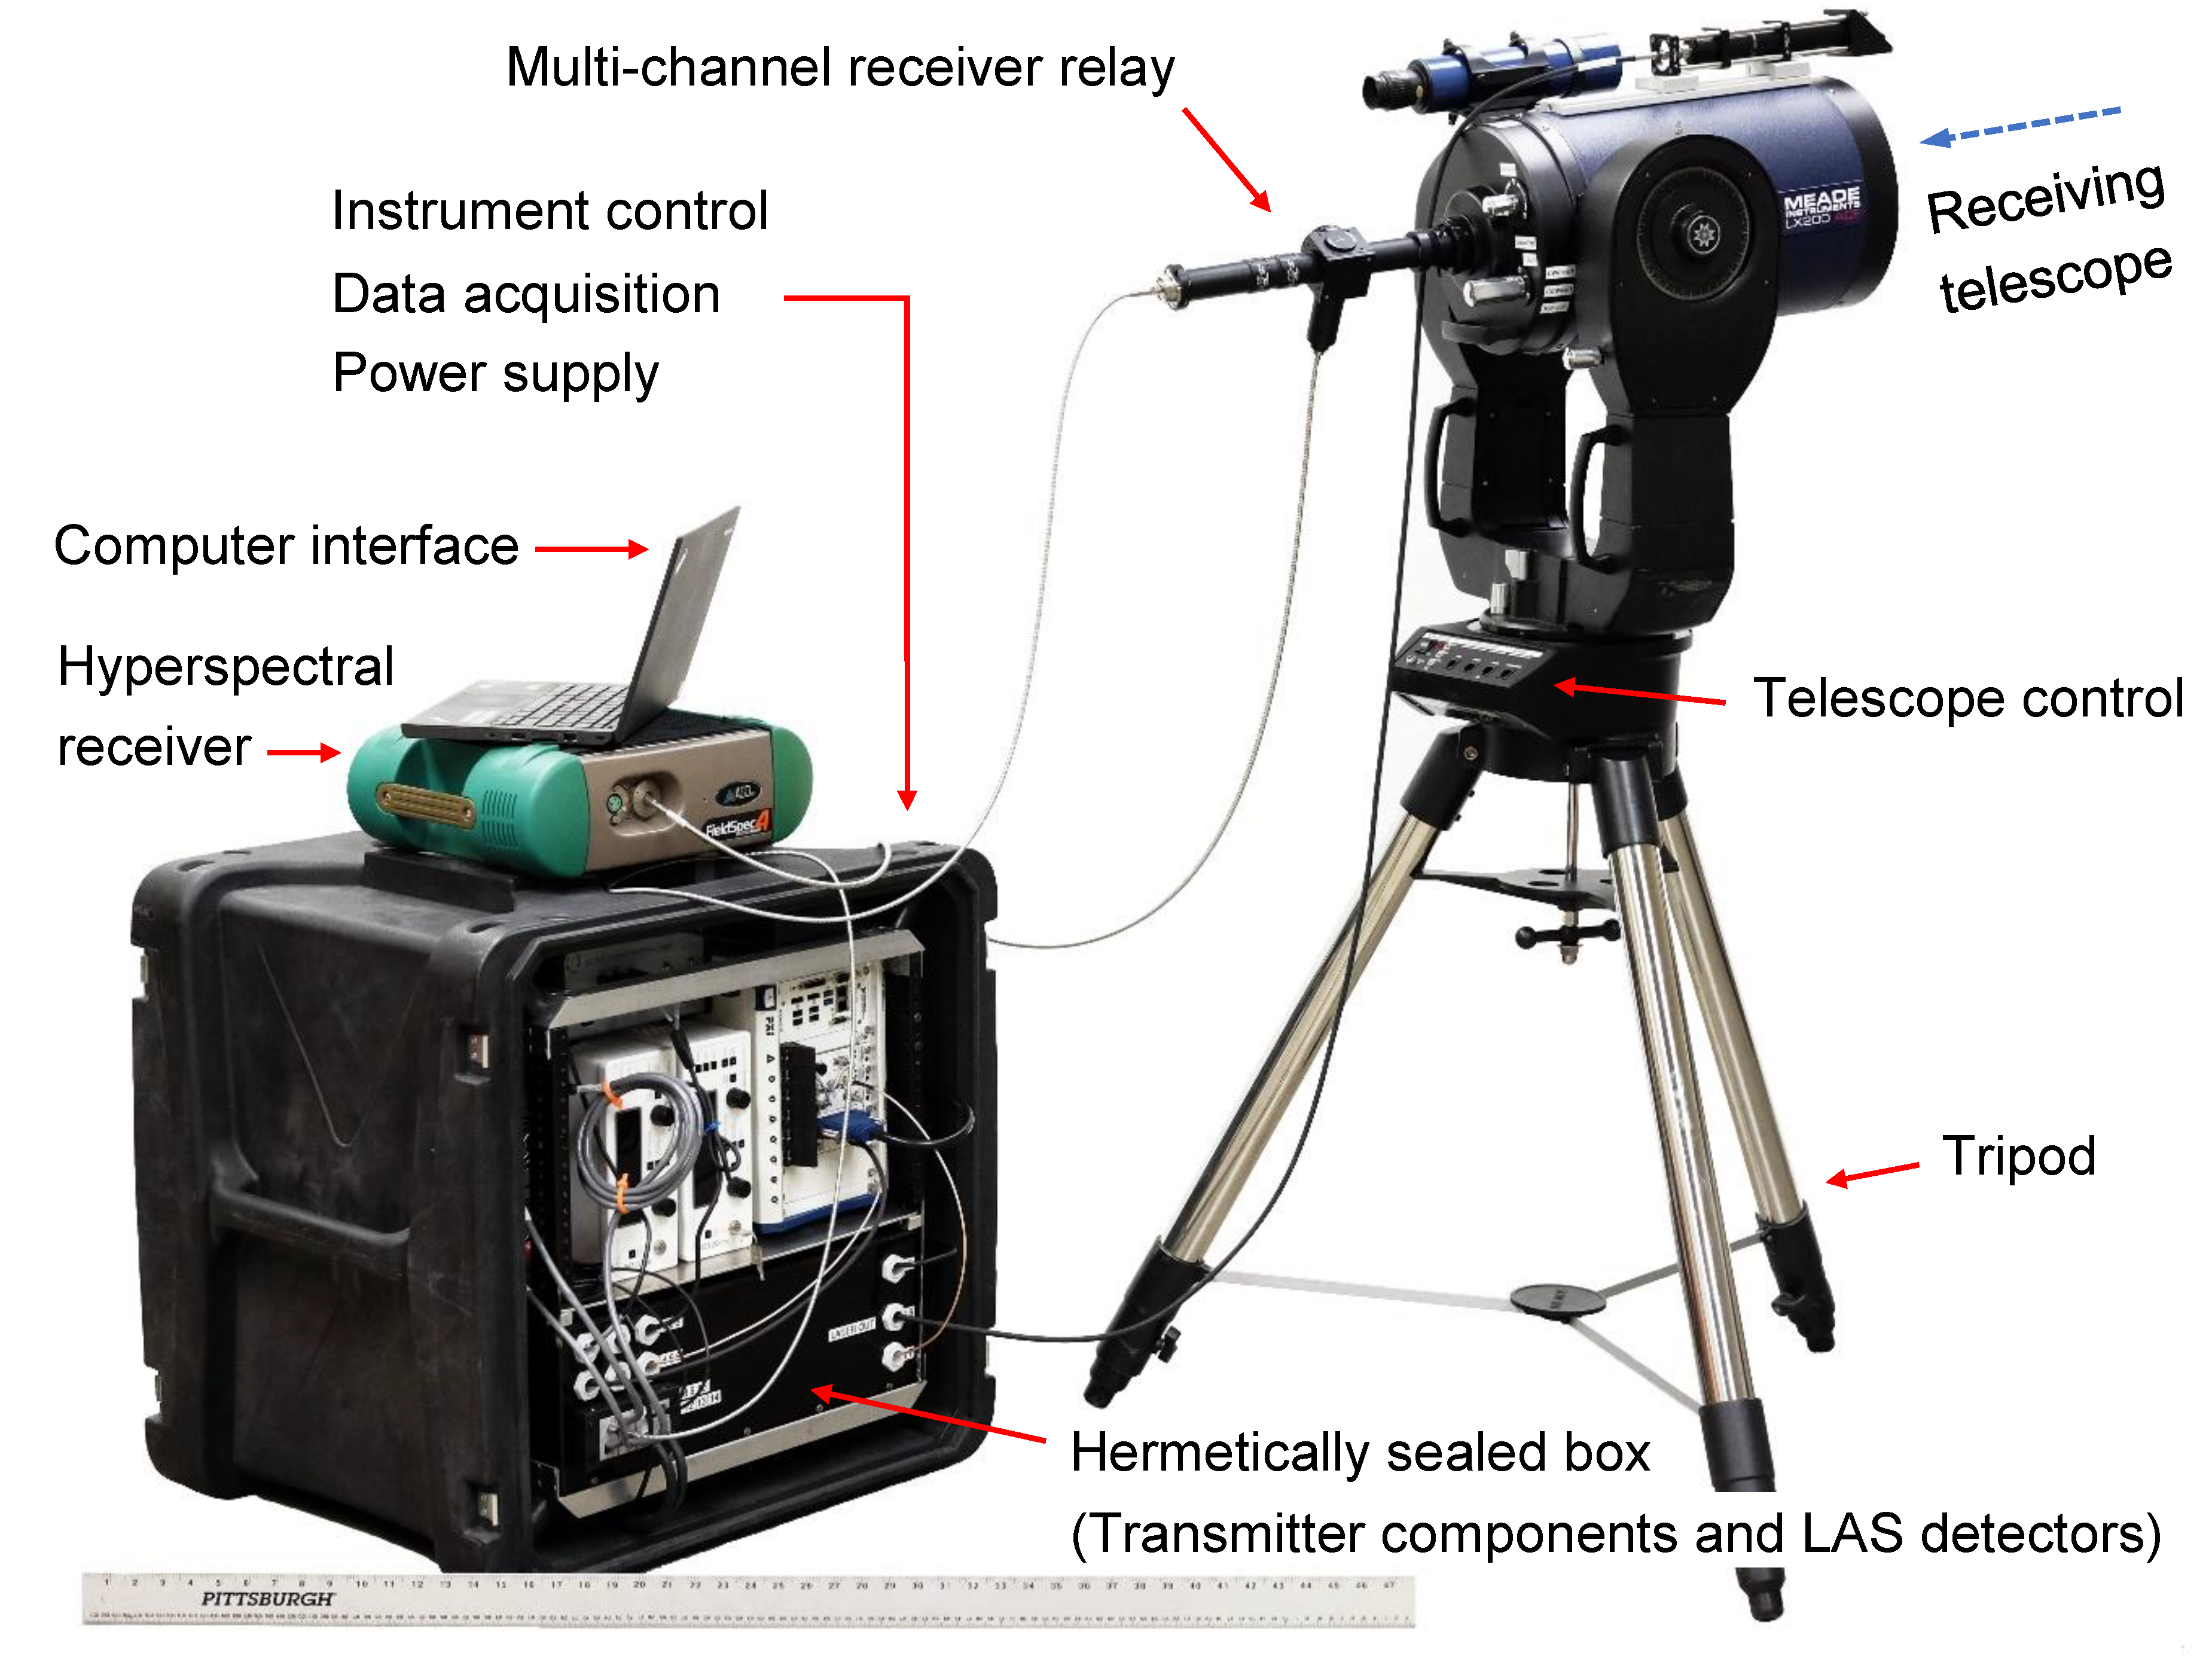
The receiving aperture for the instrument is a 203-mm diameter, 2032-mm equivalent focal length, Schmidt-Cassegrain catadioptric telescope (model LX200-ACF 203 mm f/10) from Meade Instruments (Irvine, CA, USA). As depicted in
Figure 3, a custom-built, multi-channel, optical receiver relay is mounted to the rear of the telescope. The receiver was designed to gather, collimate, split, and focus the light from the telescope into two separate channels. On the primary channel (LAS channel), backscattered light is filtered (to isolate the on-line and off-line wavelengths and to reduce diffuse sunlight saturation), focused, and fiber-coupled into the SOLAS instrument. The optical signal is further divided through a multimode fiber optic coupler. Ten percent of the split light is directed into a 400 MHz bandwidth, variable gain Thorlabs APD430A silicon avalanche photodetector (APD) via a beam collimator and focuser. The remaining 90% of the light is coupled into the BPD via a 3 dB 2 × 2 fiber optic coupler. The signal is de-chirped (i.e., mixed with the LO signal) and the beat frequency is measured directly. On the secondary channel (hyperspectral channel), the light remains unfiltered and is focused and fiber-coupled into a high-resolution spectroradiometer instrument (ASD FieldSpec 4 Hi-Res). The spectral resolution of the secondary channel is 3nm in the VNIR range (350–1000 nm) and 8 nm in the SWIR range (1000–2500 nm). The sampling interval is 1.4 nm and 1.1 nm in the VNIR and SWIR ranges, respectively. The angular field of view (FOV) for the LAS channel is 0.27 mrad and the FOV for the hyperspectral channel is 0.32 mrad (VNIR range) and 0.61 mrad (SWIR range). Due to space limitations in this manuscript, the optical receiver is described in more detail in a separate publication.
4.3. Data Acquisition and Control Design
Data acquisition and component control for the SOLAS are achieved via a computer that is mounted in a compact, module-based National Instruments (Austin, TX, USA) PXIe chassis (PXIe-8135 computer, PXIe-1082 chassis) via LabVIEW software in a Windows environment. Within the chassis are (1) a high frequency RF signal generator module (PXIe-5652), (2) a wide instantaneous bandwidth vector signal analyzer (PXIe-5663E) comprised of three parallel modules (PXIe-5601, PXIe-5622, PXIe-5652), and (3) a multifunction input/output module (PXI-6238). The LabVIEW software is used to generate the chirp signal (100 MHz to 500 MHz linear ramping signal with a chirp rate of 6 MHz/μs) that is amplified and directed into the MZM. The software is also used to (1) collect and interpret the de-chirped frequency from the BPD (to determine the range to the target), and to (2) collect and interpret data from the APD (to detect atmospheric water vapor en route to the target). The ASD RS
3 software is used to collect the reflectance spectra from the spectroradiometer and the ASD ViewSpec
TM Pro software is used to export the raw data for further processing. A flow diagram outlining the data acquisition and processing chain is presented in
Figure 4.
4.4. Field Ruggedization
The majority of the components that were previously presented in
Figure 2 are mounted within a hermetically sealed, nitrogen-purged box. The ECDL heads and MZM are mounted directly to the 12 mm thick aluminum floor of the box with thermal paste to enable the floor to act as a heat sink. The remaining power-emitting components (e.g., Thorlabs TPA830P10-SP amplifier) are actively regulated via thermoelectric cooling or are self-regulating (e.g., New Focus 1607-AC-FC and Thorlabs APD430A photodetectors). The floor of the box also acts as an optical bench for the bulk-optical components associated with the free space lasers. The transmitting and receiving fiber optic cables, RF signal cables, and component power cables are fed through one wall of the box via sealed cable glands. A plan view of the box interior is presented in
Figure 5 and a photograph of the SOLAS instrument annotated with major assemblies is presented as
Figure 6.
5. Discussion
The SOLAS instrument was designed to transmit on-line and off-line wavelengths of 823.20 nm and 847.00 nm, respectively. The difference between these wavelengths combined with continuous-wave transmission, necessitated the use of two separate seed lasers (whereas some dedicated DIAL instruments have achieved on- and off-line wavelength transmission with a single, widely tunable, pulsed laser source). The two lasers were aligned into a common transmitter system using readily-available, free-space bulk optics to ease customization, calibration, and implementation. Therefore, the efficiency of the laser delivery system may be improved using an all-fiber-based design in future iterations.
The collection of measurements in the field introduces additional complexity, primarily due to (1) viewing geometry (i.e., incidence and viewing angles), (2) the sensitivity of the hyperspectral measurements to changes in light conditions (solar irradiation intensity), and (3) environmental interferences (dust, water droplets, vegetative cover). To address these issues, the instrument observation location must be carefully selected and the spectroradiometer should be calibrated using a diffuse white reference panel (e.g., Spectralon®; Labsphere Inc., North Sutton, NH, USA) positioned at approximately the same incidence angle as the intended measurements. The manufacturer of the spectroradiometer recommends frequent recalibration (referencing of the diffuse reflector panel) when collecting typical proximal (<1 m distance) measurements in the laboratory or in the field. However, it would be possible to collect remote (up to 1 km distance, or greater) measurements for an extended period of time, without frequent recalibration, if careful considerations are made. The spectroradiometer, as well as other components (e.g., laser sources, data acquisition system, and telescope), should be allowed a warm-up period (to minimize instrument noise and temperature-induced drift). Furthermore, after initial calibration of the spectroradiometer, any changes in light conditions (e.g., temporary cloud cover over target) should be observed and, if necessary, the measurements should be repeated.
The data collected by the three receivers (spectroradiometer and two LAS channel detectors) must be synthesized for meaningful interpretation of a measurement. Reflectance spectra are compiled, averaged, and compared with spectral libraries for different soil types. The measurements require post-processing (empirical calibration and statistical analysis) to extract the soil properties of interest. While reflectance data is collected using the ASD software (native to the spectroradiometer), future development of the SOLAS instrument software will enable custom data collection and near real-time data interpretation. The reflectance measurements are susceptible to attenuation, due to atmospheric water vapor, especially at longer ranges or in conditions with higher relative humidity. To correct for the additional atmospheric absorption en route to the soil surface, the differential laser absorption measurements are used. The coherent signals also provide sub-meter range to target identification. Preliminary hyperspectral measurements have been collected for ranges greater than 100 m (laboratory setting) and 500 m field setting). Based on design calculations, measurements are possible for ranges of up to a kilometer or more (depending on atmospheric conditions), with spatial resolutions of 6 cm, 30 cm, and 60 cm (nadir) for ranges of 100 m, 500 m, and 1.0 km, respectively.
6. Conclusions
The development of a field-deployable, ground-based, remote sensing instrument for obtaining physical and hydro-mechanical soil properties was described herein. The soil observation laser absorption spectrometer (SOLAS) was designed to collect range-resolved hyperspectral backscatter data from bare soil surfaces across the visible to shortwave infrared spectral ranges (350–2500 nm). The SOLAS instrument transmits two near-infrared wavelength lasers (823.20 nm and 847.00 nm) to measure atmospheric water vapor by differential absorption along the transmitter path. Self-chirped, coherent detection of the same lasers provides target range measurements. The backscattered light is received through a 203-mm diameter telescope. The combination of high-resolution reflectance spectroradiometry and lidar (ranging and differential absorption) techniques has introduced a new ground-based approach to remote sensing of the natural environment. Envisioned applications for the instrument include rapid classification of soils on unstable slopes, mine tailings, or in wildfire-affected areas. Future improvements will enable long-range measurements, increased portability (lighter instrument components), or semi-autonomous measurements as part of a long-term monitoring installation (e.g., wildfire basin or mining operation).
Author Contributions
Conceptualization, R.A.C., C.D.G. and S.E.S.; Methodology, S.E.S., C.D.G. and R.A.C.; Software, S.E.S.; Validation, S.E.S. and R.A.C.; Formal Analysis, S.E.S.; Investigation, S.E.S. and R.A.C.; Resources, R.A.C.; Data Curation, S.E.S.; Writing—Original Draft Preparation, S.E.S.; Writing—Review and Editing, S.E.S., C.D.G. and R.A.C.; Visualization, S.E.S.; Supervision, R.A.C.; Project Administration, R.A.C.; Funding Acquisition, R.A.C. and S.E.S.
Funding
This project was funded by the U.S. Department of Transportation (USDOT) through the Office of the Assistant Secretary for Research and Technology (OST-R) under USDOT Cooperative Agreement No. OASRTRS-14-H-UARK. The views, opinions, findings and conclusions reflected in this publication are solely those of the authors and do not represent the official policy or position of the USDOT/OST-R, or any State or other entity. USDOT/OST-R does not endorse any third party products or services that may be included in this publication. This material is also based upon work supported by the National Science Foundation Graduate Research Fellowship Program under Grant No. DGE-1450079. Any opinions, findings, and conclusions or recommendations expressed in this material are those of the authors and do not necessarily reflect the views of the National Science Foundation.
Conflicts of Interest
The authors declare no conflict of interest. The funders had no role in the design of the study; in the collection, analyses, or interpretation of data; in the writing of the manuscript, or in the decision to publish the results.
Abbreviations
The following abbreviations are used in this manuscript:
| dB | Decibel |
| AM | Amplitude Modulation |
| APD | Avalanche Photodetector |
| ASD | Analytical Spectral Devices Inc. (a Malvern Panalytical Company, Longmont, CO, USA) |
| B | Signal Bandwidth |
| BPD | Balanced Photodetector |
| BRX | Bandwidth of the Receiver |
| BSC | Beamsplitter Cube |
| c | Speed of Light |
| CW | Continuous-Wave |
| CWL | Center Wavelength |
| CF | Clay Fraction |
| Δt | Roundtrip Time Delay for Atmospheric Propagation |
| D | Diameter of Primary Mirror (Telescope) |
| DIAL | Differential Absorption Lidar |
| DRIFT | Diffuse Reflectance Infrared Fourier Transform |
| es | Saturation Vapor Pressure |
| es0 | Saturation Vapor Pressure at T0 = 273 K |
| E" | Lower State Energy |
| ECDL | External Cavity Diode Laser |
| FM | Frequency Modulated |
| FMCW | Frequency-Modulated Continuous-Wave |
| FOV | Field of View (Angular) |
| f | Focal Length |
| f2 − f1 | Chirp Bandwidth |
| fR | Beat Frequency |
| h | Planck Constant |
| HITRAN | High-Resolution Transmission Molecular Absorption Database |
| θv | Volumetric Water Content |
| InGaAs | Indium Gallium Arsenide |
| kB | Boltzmann Constant |
| K | Chirp Waveform-Dependent Constant |
| λ | Wavelength |
| Λ | Voigt Function |
| L | Latent Heat of Vaporization |
| LAS | Laser Absorption Spectrometry |
| LAST | Laser Analysis of Soil Tension |
| LIDAR | Light Detection and Ranging (commonly Lidar) |
| LL | Liquid Limit |
| LO | Local Oscillator |
| MH2O | Molecular Weight of Water |
| MWIR | Mid-Wave-Infrared |
| MZM | Mach-Zehnder Modulator |
| N | F-Number |
| NA | Avogadro’s Constant |
| NIR | Near-Infrared |
| ρυ | Water Vapor Density |
| PL | Plastic Limit |
| PPE | Pressure Plate Extractor |
| Pn-RX | Receiver Power Noise |
| Poff | Received Off-Line Backscatter Signal |
| Pon | Received On-Line Backscatter Signal |
| Pr | Received Signal Power |
| Psig | Detected Signal Power |
| PXIe | PCI (Peripheral Component Interconnect) Extensions for Instrumentation Express |
| q | Electron Charge |
| ℜ | Photodetector Responsivity |
| R | Range to Target |
| RF | Radio Frequencies |
| RH | Relative Humidity |
| Rυ | Water Vapor Gas Constant |
| σoff | Off-Line Water Vapor Absorption Cross-section |
| σon | On-Line Water Vapor Absorption Cross-section |
| σR | Range Accuracy |
| S | Temperature-Dependent Absorption Line Strength |
| S0 | Absorption Line Strength under Standard Conditions |
| SMC | Soil Moisture Content |
| SNR | Signal-to-Noise Ratio |
| SNRcoh | Signal to Noise Ratio for Shot-Noise-Dominant Coherent Detection |
| SOLAS | Soil Observation Laser Absorption Spectrometer |
| SSURGO | Soil Survey Geographic Database |
| STATSGO | State Soil Geographic Survey |
| SWCC | Soil Water Characteristic Curve |
| SWIR | Shortwave Infrared |
| τ | Chirp Duration |
| T | Temperature |
| T0 | Absorption Temperature under Standard Conditions |
| TEC | Thermoelectric-Cooled |
| TSOA | Tapered Semiconductor Optical Amplifier |
| UHTC | Ultra-High Transmission Coating (Meade Instruments Corporation, Irvine, CA, USA) |
| VNIR | Visible Near-Infrared |
| ψm | Soil Water Matric Potential (Soil Suction) |
References
- Wulf, H.; Mulder, T.; Schaepman, M.E.; Keller, A.; Jӧrg, P.C. Remote Sensing of Soils; University of Zurich: Zurich, Switzerland, 2015; pp. 1–71. [Google Scholar]
- Ångström, A. The Albedo of Various Surfaces of Ground. Geogr. Ann. 1925, 7, 323–342. [Google Scholar] [CrossRef]
- Bowers, S.A.; Hanks, R.J. Reflection of Radiant Energy from Soils. Soil Sci. 1965, 100, 130–138. [Google Scholar] [CrossRef]
- Park, J.K. A Soil Moisture Reflectance Model in Visible and Near IR Bands. In Proceedings of the International Symposium on Machine Processing of Remotely Sensed Data and Soil Information Systems and Remote Sensing and Soil Survey, Purdue University, West Lafayette, IN, USA, 3–6 June 1980. [Google Scholar]
- Dalal, R.C.; Henry, R.J. Simultaneous Determination of Moisture, Organic Carbon, and Total Nitrogen by Near Infrared Reflectance Spectrophotometry. Soil Sci. Soc. Am. J. 1986, 50, 120–123. [Google Scholar] [CrossRef]
- Whalley, W.R.; Leeds-Happison, P.B.; Bowman, G.E. Estimation of Soil Moisture Using Near Infrared Reflectance. Hydrol. Process. 1991, 5, 321–327. [Google Scholar] [CrossRef]
- Bach, H.; Mauser, W. Modelling and Model Verification of the Spectral Reflectance of Soils Under Varying Moisture Conditions. In Proceedings of the International Geoscience and Remote Sensing Symposium (IGARSS’94), Pasadena, CA, USA, 8–12 August 1994; pp. 2354–2356. [Google Scholar] [CrossRef]
- Ben-Dor, E.; Banin, A. Near-Infrared Analysis as a Rapid Method to Simultaneously Evaluate Several Soil Properties. Soil Sci. Soc. Am. J. 1995, 59, 364–372. [Google Scholar] [CrossRef]
- Chang, C.-W.; Laird, D.; Mausbach, M.J.; Hurburgh, C.R. Near-Infrared Reflectance Spectroscopy-Principle Components Regression Analysis of Soil Properties. Soil Sci. Soc. Am. J. 2001, 65, 480–490. [Google Scholar] [CrossRef]
- Hummel, J.W.; Sudduth, K.A.; Hollinger, S.E. Soil Moisture and Organic Matter Prediction of Surface and Subsurface Soils Using an NIR Soil Sensor. Comput. Electron. Agric. 2001, 32, 149–165. [Google Scholar] [CrossRef]
- Liu, W.; Baret, F.; Gu, X.; Tong, Q.; Zheng, L.; Zhang, B. Relating Soil Surface Moisture to Reflectance. Remote Sens. Environ. 2002, 81, 238–246. [Google Scholar]
- Liu, W.; Baret, F.; Gu, X.; Zhang, B.; Tong, Q.; Zheng, L. Evaluation of Methods for Soil Surface Moisture Estimation from Reflectance Data. Int. J. Remote Sens. 2003, 24, 2069–2083. [Google Scholar] [CrossRef]
- Lobell, D.B.; Asner, G.P. Moisture Effects on Soil Reflectance. Soil Sci. Soc. Am. J. 2002, 66, 722–727. [Google Scholar] [CrossRef]
- Islam, K.; Singh, B.; McBratney, A. Simultaneous Estimation of Various Soil Properties by Ultra-Violet, Visible, and Near-Infrared Reflectance Spectroscopy. Aust. J. Soil Res. 2003, 41, 1101–1114. [Google Scholar] [CrossRef]
- Whiting, M.L.; Li, L.; Ustin, S.L. Predicting Water Content Using Gaussian Model on Soil Spectra. Remote Sens. Environ. 2004, 89, 535–552. [Google Scholar] [CrossRef]
- Mouazen, A.M.; Karoui, R.; de Baerdemaeker, J.; Ramon, H. Characterization of Soil Water Content Using Measured Visible and Near Infrared Spectra. Soil Sci. Soc. Am. J. 2006, 70, 1295–1302. [Google Scholar] [CrossRef]
- Lesaignoux, A.; Fabre, S.; Briottet, X. Influence of Soil Moisture Content on Spectral Reflectance of Bare Soils in the 0.4-14 μm Domain. Int. J. Remote Sens. 2013, 34, 2268–2285. [Google Scholar] [CrossRef]
- Knadel, M.; Deng, F.; Alinejadian, A.; de Jonge, L.W.; Moldrup, P.; Greve, M.H. The Effects of Moisture Conditions—From Wet to Hyper Dry—On Visible Near-Infrared Spectra of Danish Reference Soils. Soil Sci. Soc. Am. J. 2014, 78, 422–433. [Google Scholar] [CrossRef]
- Nolet, C.; Poortinga, A.; Roosjen, P.; Bartholomeus, H.; Ruessink, G. Measuring and Modeling the Effect of Surface Moisture on the Spectral Reflectance of Coastal Beach Sand. PLoS ONE 2014, 9, e112151:1–e112151:9. [Google Scholar] [CrossRef] [PubMed]
- Fabre, S.; Briottet, X.; Lesaignoux, A. Estimation of Soil Moisture Content from the Spectral Reflectance of Bare Soils in the 0.4–2.5 μm Domain. Sensors 2015, 15, 3262–3281. [Google Scholar] [CrossRef]
- Sadeghi, M.; Jones, S.B.; Philpot, W.D. A Linear Physically-Based Model for Remote Sensing of Soil Moisture Using Short Wave Infrared Bands. Remote Sens. Environ. 2015, 164, 66–76. [Google Scholar] [CrossRef]
- Tian, J.; Philpot, W.D. Relationship Between Surface Soil Water Content, Evaporation Rate, and Water Absorption Band Depths in SWIR Reflectance Spectra. Remote Sens. Environ. 2015, 169, 280–289. [Google Scholar] [CrossRef]
- Xu, C.; Zeng, W.; Huang, J.; Wu, J.; van Leeuwen, W.J.D. Prediction of Soil Moisture Content and Soil Salt Concentration from Hyperspectral Laboratory and Field Data. Remote Sens. 2016, 8. [Google Scholar] [CrossRef]
- Garner, C.D. Development of a Multiband Remote Sensing System for Determination of Unsaturated Soil Properties. Ph.D. Dissertation, University of Arkansas, Fayetteville, AR, USA, 2017. [Google Scholar]
- Mouazen, A.M.; Maleki, M.R.; de Baerdemaeker, J.; Ramon, H. On-line Measurement of Some Selected Soil Properties Using a VIS-NIR Sensor. Soil Till. Res. 2007, 93, 13–27. [Google Scholar] [CrossRef]
- Haubrock, S.N.; Chabrillat, S.; Lemmnitz, C.; Kaufmann, H. Surface Soil Moisture Quantification Models from Reflectance Data Under Field Conditions. Int. J. Remote Sens. 2008, 29, 3–29. [Google Scholar] [CrossRef]
- Walvoort, A.; McBratney, A. Diffuse Reflectance Spectrometry as a Proximal Sensing Tool for Precision Agriculture. In Proceedings of the 3rd European Conference on Precision Agriculture, Montpellier, France, 18–20 June 2001; pp. 503–508. [Google Scholar]
- Shepherd, K.D.; Walsh, M.G. Development of Reflectance Spectral Libraries for Characterization of Soil Properties. Soil Sci. Soc. Am. J. 2002, 66, 988–998. [Google Scholar] [CrossRef]
- Cozzolino, D.; Moron, A. The Potential of Near-Infrared Reflectance Spectroscopy to Analyze Soil Chemical and Physical Characteristics. J. Agric. Sci. 2003, 140, 65–71. [Google Scholar] [CrossRef]
- Knadel, M.; Stenberg, B.; Deng, F.; Thomsen, A.; Greve, M.H. Comparing Predictive Abilities of Three Visible-Near Infrared Spectrophotometers for Soil Organic Carbon and Clay Determination. J. Near Infrared Spectrosc. 2013, 21, 67–80. [Google Scholar] [CrossRef]
- Leu, D.J. Visible and Near-Infrared Reflectance of Beach Sands: A Study on the Spectral Reflectance/Grain Size Relationship. Remote Sens. Environ. 1977, 6, 169–182. [Google Scholar] [CrossRef]
- Yitagesu, F.A.; van der Meer, F.; van der Werff, H.; Zigterman, W. Quantifying Engineering Parameters of Expansive Soils from their Reflectance Spectra. Eng. Geol. 2009, 105, 151–160. [Google Scholar] [CrossRef]
- Waruru, B.K.; Shepherd, K.D.; Ndegwa, G.M.; Kamoni, P.T.; Sila, A.M. Rapid Estimation of Soil Engineering Properties Using Diffuse Reflectance Near Infrared Spectroscopy. Biosyst. Eng. 2014, 121, 177–185. [Google Scholar] [CrossRef]
- Janik, L.; Skjemstad, J. Characterization and Analysis of Soils Using Mid-Infrared Partial Least Squares: II. Correlations with Some Laboratory Data. Aust. J. Soil Res. 1995, 33, 637–650. [Google Scholar] [CrossRef]
- Karlsson, C.J.; Olsson, F.Å.A. Linearization of the Frequency Sweep of a Frequency-Modulated Continuous-Wave Semiconductor Laser and the Resulting Ranging Performance. Appl. Opt. 1999, 38, 3376–3386. [Google Scholar] [CrossRef]
- Allen, C.; Cobanoglu, Y.; Chong, S.K.; Gogineni, S. Performance of a 1319 nm Laser Radar Using RF Pulse Compression. In Proceedings of the International Geoscience and Remote Sensing Symposium (IGARSS 2001), Sydney, Australia, 9–13 July 2001; pp. 997–999. [Google Scholar] [CrossRef]
- Pierrottet, D.; Amzajerdian, F.; Peri, F. Development of an All-Fiber Coherent Laser Radar for Precision Range and Velocity Measurements. In Proceedings of the Materials Research Society Symposium, Boston, MA, USA, 28 November–2 December 2005. [Google Scholar] [CrossRef]
- Pierrottet, D.; Amzajerdian, F.; Petway, L.; Barnes, B.; Lockard, G.; Rubio, M. Linear FMCW Laser Radar for Precision Range and Vector Velocity Measurements. In Proceedings of the Materials Research Society Symposium, San Francisco, CA, USA, 24–28 March 2008. [Google Scholar] [CrossRef]
- Adany, P.; Allen, C.; Hui, R. Chirped Lidar Using Simplified Homodyne Detection. J. Lightw. Technol. 2009, 27, 3351–3357. [Google Scholar] [CrossRef] [Green Version]
- Barber, Z.W.; Babbitt, W.R.; Kaylor, B.; Reibel, R.R.; Roos, P.A. Accuracy of Active Chirp Linearization for Broadband Frequency Modulated Continuous Wave Ladar. Appl. Opt. 2010, 49, 213–219. [Google Scholar] [CrossRef] [PubMed]
- Gao, S.; Hui, R. Frequency-Modulated Continuous-Wave Lidar Using I/Q Modulator for Simplified Heterodyne Detection. Opt. Lett. 2012, 37, 2022–2024. [Google Scholar] [CrossRef] [PubMed]
- Mateo, A.B. Applications of High Resolution and Accuracy Frequency Modulated Continuous Wave Ladar. Master’s Thesis, Montana State University, Bozeman, MT, USA, 2014. [Google Scholar]
- Skolnik, M.I. Theoretical Accuracy of Radar Measurements. IRE T. Aeron. Navig. Electr. 1960, 123–129. [Google Scholar] [CrossRef]
- Jelalian, A. Laser Radar Systems; Artech House: Norwood, MA, USA, 1992; ISBN 9780890065549. [Google Scholar]
- Schotland, R.M. Some Observations of the Vertical Profile of Water Vapor by a Laser Optical Radar. In Proceedings of the Fourth Symposium on Remote Sensing of the Environment, Ann Arbor, MI, USA, 12–14 April 1966; pp. 273–283. [Google Scholar]
- Schotland, R.M. Errors in the Lidar Measurement of Atmospheric Gases by Differential Absorption. J. Appl. Meteorol. 1974, 13, 71–77. [Google Scholar]
- Menzies, R.T.; Shumate, M.S. Remote Measurements of Ambient Air Pollutants with a Bistatic Laser System. Appl. Opt. 1976, 15, 2080–2084. [Google Scholar] [CrossRef] [PubMed]
- Grant, W.B. Effect of Differential Spectral Reflectance on DIAL Measurements Using Topographic Targets. Appl. Opt. 1982, 21, 2390–2394. [Google Scholar] [CrossRef] [PubMed]
- Grant, W.B. Differential Absorption and Raman Lidar for Water Vapor Profile Measurements: A Review. Opt. Eng. 1991, 30, 40–48. [Google Scholar] [CrossRef]
- Hardesty, R.M. Coherent DIAL Measurement of Range-Resolved Water Vapor Concentration. Appl. Opt. 1984, 23, 2545–2553. [Google Scholar] [CrossRef]
- Bӧsenberg, J. Ground-Based Differential Absorption Lidar for Water-Vapor and Temperature Profiling: Methodology. Appl. Opt. 1998, 37, 3845–3860. [Google Scholar] [CrossRef]
- Wulfmeyer, V.; Bӧsenberg, J. Ground-Based Differential Absorption Lidar for Water-Vapor Profiling: Assessment of Accuracy, Resolution, and Meteorological Applications. Appl. Opt. 1998, 37, 3825–3844. [Google Scholar] [CrossRef] [PubMed]
- Wulfmeyer, V.; Walther, C. Future Performance of Ground-Based and Airborne Water-Vapor Differential Absorption Lidar. I. Overview and Theory. Appl. Opt. 2001, 40, 5304–5320. [Google Scholar] [CrossRef] [PubMed]
- Spuler, S.; Repasky, K.; Morley, B.; Moen, D.; Weckwerth, T.; Hayman, M.; Nehrir, A. Advances in Diode-Laser-Based Water Vapor Differential Absorption Lidar. In Proceedings of the 27th International Laser Radar Conference (ILRC 27), New York, NY, USA, 5–10 July 2015. [Google Scholar] [CrossRef]
- Ismail, S.; Browell, E.V. Airborne and Spaceborne Lidar Measurements of Water Vapor Profiles: A Sensitivity Analysis. Appl. Opt. 1989, 28, 3603–3615. [Google Scholar] [CrossRef] [PubMed]
- Weckwerth, T.M.; Weber, K.J.; Turner, D.D.; Spuler, S.M. Validation of a Water Vapor Micropulse Differential Absorption Lidar (DIAL). J. Atmos. Ocean. Technol. 2016, 33, 2353–2372. [Google Scholar] [CrossRef]
- Prasad, N.S.; Geiger, A.R. Remote Sensing of Propane and Methane by Means of a Differential Absorption Lidar by Topographic Reflection. Opt. Eng. 1996, 35, 1105–1111. [Google Scholar] [CrossRef]
- Wulfmeyer, V. Ground-Based Differential Absorption Lidar for Water-Vapor and Temperature Profiling: Development and Specifications of a High-Performance Laser Transmitter. Appl. Opt. 1998, 37, 3804–3824. [Google Scholar] [CrossRef]
- Little, L.M.; Papen, G.C. Fiber-Based Lidar for Atmospheric Water-Vapor Measurements. Appl. Opt. 2001, 40, 3417–3427. [Google Scholar] [CrossRef]
- Machol, J.; Ayers, T.; Schwenz, K.; Koenig, K.; Hardesty, R.; Senff, C.; Krainak, M.; Abshire, J.; Bravo, H.; Sandberg, S. Preliminary Measurements with an Automated Compact Differential Absorption LIDAR for Profiling Water Vapor. Appl. Opt. 2004, 43, 3110–3121. [Google Scholar] [CrossRef]
- Nehrir, A.R. Water Vapor Profiling Using a Compact Widely Tunable Diode Laser Differential Absorption Lidar (DIAL). Master’s Thesis, Montana State University, Bozeman, MT, USA, 2008. [Google Scholar]
- Nehrir, A.R. Development of an Eye-Safe Diode-Laser-Based Micro-Pulse Differential Absorption Lidar (MP-DIAL) for Atmospheric Water-Vapor and Aerosol Studies. Ph.D. Dissertation, Montana State University, Bozeman, MT, USA, 2011. [Google Scholar]
- Nehrir, A.R.; Repasky, K.S.; Carlsten, J.L.; Obland, M.D.; Shaw, J.A. Water Vapor Profiling Using a Widely Tunable, Amplified Diode-Laser-Based Differential Absorption Lidar (DIAL). J. Atmos. Ocean. Technol. 2009, 26, 733–745. [Google Scholar] [CrossRef]
- Nehrir, A.R.; Repasky, K.S.; Carlsten, J.L. Eye-Safe Diode-Laser-Based Micropulse Differential Absorption Lidar (DIAL) for Water Vapor Profiling in the Lower Troposphere. J. Atmos. Ocean. Technol. 2011, 28, 131–147. [Google Scholar] [CrossRef]
- Nehrir, A.R.; Repasky, K.S.; Carlsten, J.L. Micropulse Water Vapor Differential Absorption Lidar: Transmitter Design and Performance. Opt. Express 2012, 20, 25137–25151. [Google Scholar] [CrossRef] [PubMed]
- Spuler, S.M.; Repasky, K.S.; Morley, B.; Moen, D.; Hayman, M.; Nehrir, A.R. Field-Deployable Diode-Laser-Based Differential Absorption Lidar (DIAL) for Profiling Water Vapor. Atmos. Meas. Tech. 2015, 8, 1073–1087. [Google Scholar] [CrossRef]
- Remsberg, E.E.; Gordley, L.L. Analysis of Differential Absorption Lidar from the Space Shuttle. Appl. Opt. 1978, 17, 624–630. [Google Scholar] [CrossRef] [PubMed]
- Bufton, J.L.; Itabe, T.; Grolemund, D.A. Airborne Remote Sensing Measurements with a Pulsed CO2 Dial System. In Optical and Laser Remote Sensing; Killinger, D.K., Mooradian, A., Eds.; Springer: Berlin/Heidelberg, Germany, 1983; pp. 2–9. ISBN 9783662157367. [Google Scholar]
- Ehret, G.; Kiemle, C.; Renger, W.; Simmet, G. Airborne Remote Sensing of Tropospheric Water Vapor with a Near-Infrared Differential Absorption Lidar System. Appl. Opt. 1993, 32, 4534–4551. [Google Scholar] [CrossRef] [PubMed]
- Bruneau, D.; Quaglia, P.; Flamant, C.; Meissonnier, M.; Pelon, J. Airborne Lidar LEANDRE II for Water-Vapor Profiling in the Troposphere. I. System Description. Appl. Opt. 2001, 40, 3450–3461. [Google Scholar] [CrossRef] [PubMed]
- Bruneau, D.; Quaglia, P.; Flamant, C.; Pelon, J. Airborne Lidar LEANDRE II for Water-Vapor Profiling in the Troposphere. II. First Results. Appl. Opt. 2001, 40, 3462–3475. [Google Scholar] [CrossRef] [PubMed]
- Browell, E.V.; Dobler, J.; Kooi, S.A.; Choi, Y.; Harrison, F.W.; Moore, B.; Zaccheo, T.S. Airborne Validation of Laser Remote Measurements of Atmospheric Carbon Dioxide. In Proceedings of the 25th International Laser Radar Conference (ILRC 25), St. Petersburg, Russia, 5–9 July 2010; pp. 779–782. [Google Scholar]
- Megie, G.; Menzies, R.T. Complementarity of UV and IR Differential Absorption Lidar for Global Measurements of Atmospheric Species. Appl. Opt. 1980, 19, 1173–1183. [Google Scholar] [CrossRef] [PubMed]
- Ehret, G.; Kiemle, C.; Wirth, M.; Amediek, A.; Fix, A.; Houweling, S. Space-Borne Remote Sensing of CO2, CH4, and N2O by Integrated Path Differential Absorption Lidar: A Sensitivity Analysis. Appl. Phys. B 2008, 90, 593–608. [Google Scholar] [CrossRef]
- Wirth, M.; Fix, A.; Mahnke, P.; Schwarzer, H.; Schrandt, F.; Ehret, G. The Airborne Multi-Wavelength Water Vapor Differential Absorption Lidar WALES: System Design and Performance. Appl. Phys. B 2009, 96, 201–213. [Google Scholar] [CrossRef]
- Barrientos-Barria, J.; Mammez, D.; Dherbecourt, J.-B.; Raybaut, M.; Melkonian, J.-M.; Pelon, J.; Godard, A.; Lefebvre, M. Progress on High Energy Optical Parametric Transmitter for Multiple Greenhouse Gases DIAL. In Proceedings of the International Conference on Space Optics (ICSO 2014), Tenerife, Canary Islands, Spain, 6–10 October 2014; Volume 10563. [Google Scholar] [CrossRef]
- Gordon, I.E.; Rothman, L.S.; Hill, C.; Kochanov, R.V.; Tan, Y.; Bernath, P.F.; Birk, M.; Boudon, V.; Campargue, A.; Chance, K.V.; et al. The HITRAN2016 Molecular Spectroscopic Database. J. Quant. Spectrosc. Radiat. 2017, 203, 3–69. [Google Scholar] [CrossRef]
- Sakaizawa, D.; Kawakami, S.; Nakajima, M.; Sawa, Y.; Matsueda, H. Ground-Based Demonstration of CO2 Remote Sensor using 1.57 μm Differential Laser Absorption Spectrometer with Direct Detection. J. Appl. Remote Sens. 2010, 4, 043548:1–043548:17. [Google Scholar] [CrossRef]
- Ishii, S.; Koyama, M.; Baron, P.; Iwai, H.; Mizutani, K.; Itabe, T.; Sato, A.; Asai, K. Ground-Based Integrated Path Coherent Differential Absorption Lidar Measurement of CO2: Foothill Target Return. Atmos. Meas. Tech. 2013, 6, 1359–1369. [Google Scholar] [CrossRef]
- Kou, L.; Labrie, D.; Chylek, P. Refractive Indices of Water and Ice in the 0.65- to 2.5-μm Spectral Range. Appl. Opt. 1993, 32, 3531–3540. [Google Scholar] [CrossRef] [PubMed]
- Pope, R.M.; Fry, E.S. Absorption Spectrum (380–700 nm) of Pure Water. II. Integrating Cavity Measurements. Appl. Opt. 1997, 36, 8710–8723. [Google Scholar] [CrossRef] [PubMed]
- Rothman, L.S.; Gordon, I.E.; Babikov, Y.; Barbe, A.; Benner, D.C.; Bernath, P.F.; Birk, M.; Bizzocchi, L.; Boudon, V.; Brown, L.R.; et al. The HITRAN2012 Molecular Spectroscopic Database. J. Quant. Spectrosc. Radiat. 2013, 130, 4–50. [Google Scholar] [CrossRef]
© 2019 by the authors. Licensee MDPI, Basel, Switzerland. This article is an open access article distributed under the terms and conditions of the Creative Commons Attribution (CC BY) license (http://creativecommons.org/licenses/by/4.0/).


