Ship Detection Using Deep Convolutional Neural Networks for PolSAR Images


1
Key Laboratory of Electronic Information Countermeasure and Simulation Technology of Ministry of Education, Xidian University, Xi’an 710071, China
2
National Laboratory of Radar Signal Processing, Xidian University, Xi’an 710071, China
3
School of Electronics and Information, Northwestern Polytechnical University, Xi’an 710072, China
*
Author to whom correspondence should be addressed.
Remote Sens. 2019, 11(23), 2862; https://doi.org/10.3390/rs11232862
Submission received: 9 October 2019
/
Revised: 22 November 2019
/
Accepted: 27 November 2019
/
Published: 2 December 2019
(This article belongs to the Special Issue Signal Processing of Polarimetric SAR: Detection and Parameter Extraction)
Abstract
:Ship detection plays an important role in many remote sensing applications. However, the performance of the PolSAR ship detection may be degraded by the complicated scattering mechanism, multi-scale size of targets, and random speckle noise, etc. In this paper, we propose a ship detection method for PolSAR images based on modified faster region-based convolutional neural network (Faster R-CNN). The main improvements include proposal generation by adopting multi-level features produced by the convolution layers, which fits ships with different sizes, and the addition of a Deep Convolutional Neural Network (DCNN)-based classifier for training sample generation and coast mitigation. The proposed method has been validated by four measured datasets of NASA/JPL airborne synthetic aperture radar (AIRSAR) and uninhabited aerial vehicle synthetic aperture radar (UAVSAR). Performance comparison with the modified constant false alarm rate (CFAR) detector and the Faster R-CNN has demonstrated that the proposed method can improve the detection probability while reducing the false alarm rate and missed detections.

1. Introduction
As one of the most important applications in remote sensing, ship detection has played significant roles in commercial, fishery, vessel traffic services, and military applications, etc. [1,2,3]. Particularly, polarimetric synthetic aperture radar (PolSAR) is vital in ship detection because it permits good target characterization and guarantees effective detection regardless of illumination and weather conditions by capturing massive structural and textural information. Therefore, ship detection from PolSAR images has drawn increasing attention in recent years. Featured by adaptive detection threshold, CFAR has become one of the most popular ship detectors [1,2,3,4,5,6]. However, its performance strongly depends on statistical modeling of the local background clutter and empirical sliding window size (i.e., the target window, protect window, and background window). As we all know, heterogeneous clutter and interfering targets often lead to inaccurate estimations and biased modeling in practice. To deal with the intrinsic drawbacks of the CFAR detector, modified CFAR detectors have been proposed, where the heterogeneous clutter is reduced by advanced background estimation method [7] and the problem of statistical contamination, i.e., the sliding window contains one or more interfering targets, is solved by truncated statistics [8,9]. Additionally, other ship detectors have been developed by exploiting polarimetric scattering characteristics; e.g., polarization entropy, cross entropy, the degree of polarization, and eigenvalue [10,11,12], etc. However, the success of the available methods lies in effective feature extraction, which usually requires rich prior knowledge that is hard to obtain.
DCNN can automatically extract hierarchical features from abundant training data, and it has been successfully applied to image classification [13] and object detection [14,15,16]. For example, Simonyan et al. proposed a visual geometry group (VGG) network and investigated the effect of the convolutional network depth on the accuracy in the large-scale image recognition setting [13]. Girshick et al. proposed a fast and precise detector; namely, region-based convolutional neural network (R-CNN) [14]. After that, he proposed a more precise object detection method termed “fast R-CNN” by using a multi-task loss [15]. To boost the detection performance, Ren et al. presented the Faster R-CNN, in which it enables nearly cost-free region proposals by adding a Region Proposal Network (RPN), and shares full-image convolutional features with the detection network [16]. Such convolutional neural network architecture has achieved superior performance over task-specific feature extractors for multi-class remote sensing data classification and object detection [17,18,19,20,21,22,23], especially for PolSAR image. Maggiori et al. presented a large-scale remote sensing image classification based on DCNN [17]. Kang et al. proposed a modified faster R-CNN based on CFAR algorithm. It takes the object proposals generated by faster R-CNN for the guard windows of CFAR algorithm to improve the detection performance for small ships [18]. It may perform well in homogeneous areas, while the detection performance will degrade in the heterogeneous area due to the drawback of the CFAR. Lin et al. presented a new network architecture based on the faster R-CNN to further improve the detection performance by using squeeze and excitation mechanism [19]. The detection result shown in [19] demonstrates the effectiveness of the proposed ship detector, but there are many missed ships. Meanwhile, the precision of the bounding boxes generated by the proposed ship detector is low. Chen et al. established a polarimetric-feature-driven deep CNN detection and classification scheme by incorporating expert knowledge of target scattering mechanism interpretation and polarimetric feature mining [20]. Zhang et al. adopts the idea of deep networks and presents a fast regional-based convolutional neural network (R-CNN) method to detect ships from high-resolution remote sensing imagery [21]. Fan et al. proposed a pixel-wise detection for compact polarimetric SAR images based on a fully convolutional network [22]. Motivated by these advancements, the deep convolutional neural network (DCNN) is a promising tool for achieving object detection on PolSAR images.
Although Faster R-CNN has been successfully applied to object detection and recognition from optical images, some problems remain to be solved for its successful application in PolSAR target detection: (1) the interpretation and understanding of SAR images differ from optical images due to inherent scattering and imaging mechanisms, and SAR/PolSAR targets are easily contaminated by speckle noise and strong sea clutters; (2) in the AIRSAR and UAVSAR PolSAR images, ships appear as bright spots without refined structure characters; therefore, ship detection performances are severely affected by coast. (3) it is difficult to detect small ships by proposals generated from the feature maps output by the last shared convolutional layer for the deep network [16] because the size of proposals depends on the total stride, while the total stride in the deep network is generally larger than the size of the small ships.
To deal with the problems mentioned above, we proposed a DCNN-based ship detector for PolSAR images. The proposed ship detector consists of the following steps: (1) convert the multi-look complex (MLC) PolSAR data into a 3-D real vector by utilizing Pauli decomposition, which serves as the input of the modified Faster R-CNN, then segment the PolSAR image into sub-samples with a sliding window of fixed size. Meanwhile, random translation and multi-scale rotation (180° and flipping from left to right) are performed on original samples to enrich the training dataset; (2) extract interesting ship samples using a DCNN-based classifier; (3) apply modified Faster R-CNN to detect ships from extracted sub-samples; (4) For ships that are segmented into two or more sub-samples, fuse the detection windows according to the geometric relationships. Additionally, we merge proposals generated by adopting multi-level features produced by the convolution layers.
The major contributions include that the modified Faster R-CNN is proposed to achieve fast and accurate ship detection for ships with differing size. Meanwhile, the proposed ship detector can mitigate the influence of azimuth ambiguities on ship detection, and has exhibited superior detection performance for the heterogeneous PolSAR images.
The organization of this paper is listed as follows: Section 2 provides detailed description of the ship detection method and gives an introduction of the overall architecture, as well as the components of the proposed method. Section 3 presents experimental results on measured AIRSAR and USVSAR datasets, and Section 4 concludes the paper.
2. Theory and Methodology
The workflow of the proposed ship detector is shown in Figure 1. There are four core processes involved: preprocessing, DCNN based sea-coast-ship classifier, modified Faster R-CNN ship detector, and the target fusion. Firstly, in the preprocessing stage, we convert the covariance matrix of the PolSAR data to real vector by Pauli decomposition. To enrich the training dataset and suppress overfitting for DCNN, we segment the PolSAR image with sliding windows and do multi-scale rotation to segmented samples. Meanwhile, we apply the box-car multi-look processing for speckle noise reduction. Secondly, we designed a sea-coast-ship classifier based on deep convolutional neural network to extract samples containing ships. Thirdly, we use the modified Faster R-CNN detector to detect ships of the selected samples by using sea-coast-ship classifier. Finally, we merge the detection results according to the geometrical relationship of samples and output the final detection results. Below, we will discuss them sequentially.
2.1. Preprocessing
To feed PolSAR data into real-valued DCNN, the Pauli decomposition are utilized to generate color-coded images. The Pauli decomposition can express the Sinclair scattering as elementary scattering mechanisms, and they are given by
Specifically, represents single scattering from a plane surface, and represent dihedral scattering with relative orientations of 0° and 45°, respectively, and the final elements are all the antisymmetric components of the scattering matrix. The corresponding color-coded image of the Pauli decomposition with Red = , Green = , and Blue = . Then, the input can be expressed as
In the UAVSAR and AIRSAR datasets, the number of PolSAR images containing ships are usually limited. Meanwhile, the image resolution is low and most of the ships are small in size. To avoid severe overfitting and improve detection performance, it is required to generate sufficient samples by segmenting the PolSAR image with sliding windows. According to the prior knowledge of ship size in the UAVSAR and AIRSAR datasets, we set the segmentation size and stride size at and 8 pixels, respectively, in the training stage. The stride is set to 64 or 32 pixels in the testing stage. To further enrich the training data and suppress overfitting for DCNN, we do multi-scale rotation to segmented samples, and the multi-scale rotation mainly refers to rotating the samples 180 degrees and flipping the sample from left to right.
Illustratively, Figure 2 shows some Pauli images of the three types of targets, each image at 1090 5111 pixels. Figure 2a shows Pauli images of coast, Figure 2b shows Pauli images of sea, and Figure 2c shows Pauli images containing ships and sea. Meanwhile, some rotated Pauli images of sub-samples are presented in Figure 3 and them are extracted from Figure 2, where the top row corresponds to ship samples, the middle row corresponds to sea samples, and the bottom row corresponds to coast samples. It is worth noting that the first image in Figure 2a and the second image in Figure 2b are collected by AIRSAR in L band, while other images are collected by UAVSAR in L band. Meanwhile, the training dataset consists of different sea states, resolution, and azimuth ambiguities samples to make the sea-coast-ship classifier and the modified Faster R-CNN more robust.
Additionally, severe speckle noise will appear in the PolSAR imagery and affect ships with weak scattering due to the unique scattering and imaging mechanism for SAR. Therefore, multi-look processing should be utilized to suppress speckle noise before image segmentation. In this paper, we apply the simple box-car multi-look processing for speckle noise reduction, which will be proven necessary for detection from heterogeneous PolSAR data in Section 3.
2.2. Sea-Coast-Ship Segmentation
Compared to sea surface, ships usually exhibit stronger backscattering due to their unique double-bounce structures and large radar cross sections. On the contrary, ships and coast have similar backscattering intensity in PolSAR images, which would prevent effective detection. Therefore, coast samples should be removed firstly from the dataset before implementing the modified Faster R-CNN. Common approaches to coast masking include manual operation or designing classifiers with domain knowledge, which usually have poor performance with large computational burden. In this paper, we propose a DCNN-based sea-coast-ship classifier to distinguish ships, coast, and sea, which extracts ship samples automatically.
The network architecture is shown in Figure 4, which consists of 8 convolutional layers, 3 max-pooling layers, and 2 fully connected layers. The network architecture is designed by the best performance of the classification for sea, coast, and ship [24,25]. The sea-coast-ship classifier based on CNN is trained on the NVIDIA Titan-X GPU using caffe [26]. All the weights and biases are learned via the mini-batch stochastic gradient descent algorithm [26], where the mini-batch size is 64, the momentum parameter is 0.9, the weight decay parameter is 0.0005, and the learning rate is 0.001. Meanwhile, we randomly initialize the layers by drawing weights from Gaussian distributions with zero mean and standard deviation of 0.01, and initialize the bias by small constants; e.g., 0.1 [13].
2.3. Modified Faster-RCNN
With sufficient samples, we perform ship detection by modified Faster R-CNN, which is an improved version of Faster-RCNN specifically designed for ship detection. Originally, the Faster R-CNN is a DCNN-based detection algorithm, and the core is the region proposal network (RPN) that shares full-image convolutional features with the detection network. Figure 5 shows a typical architecture of the Faster R-CNN, which mainly includes two modules: (1) a fully DCNN that generates region proposal; and (2) the Fast R-CNN detector [15] that detects target based on region proposal generated by the first module. Such architecture enables a unified and deep-learning-based object detection system, which runs at near real-time frame rates and achieves satisfying performance with object detection.
The performance of the state-of-the-art ship detection networks depends heavily on region proposal algorithms; e.g., the RPN in the Faster R-CNN. The RPN simultaneously predicts a set of rectangular object bounds with object scores. To generate a region proposal, a small network with a spatial window of slides over feature maps produced by the last shared convolutional layer. Each sub-feature included in the sliding window is then mapped to lower-dimension features, which is fed into two sibling fully connected layers: the proposal-regression layer (termed “Proposal_bbox_pred” in Figure 7) and the proposal-classification layer (termed “Proposal_cls_score” in Figure 7). At each position, the small network simultaneously predicts multiple region proposals and the number of maximum possible proposals; i.e., k. Therefore, the proposal-regression layer has 4k outputs encoding coordinates of k boxes, and the proposal-classification layer outputs 2k scores to give the probability of being a ship or not a ship for each proposal. The k proposals are parameterized relative to k reference boxes; namely, anchors. By default, the “proposals” are dense sliding windows of 4 scales (2, 4, 8, 16) and 3 aspect ratios (1:1, 1:2, 2:1).
The detection network takes the entire image and the set of object proposals as input, and processes the whole image with several convolutional and max pooling layers to generate feature maps. It shares convolutional layers with RPN, where the fully connected layer demand fixed-length vectors as inputs. Therefore, the region of interest (ROI) pooling layer utilizes max-pooling to convert features inside a valid region of interest into a small feature map with fixed spatial extent. Figure 6 shows the structure of an ROI pooling layer, where each valid ROI feature map is converted into a vector with fixed length. Then, each feature vector is fed into a sequence of fully connected layers, which are finally branched into two sibling output layers; i.e., the box-regression layer (termed “Bbox_pred” in Figure 7) and the box-classification layer (termed “Cls_score” in Figure 7). The box-classification layer produces softmax probability of the ships plus a catch-all “background”, and the box-regression layer outputs four real-valued numbers to calibrate the coordinates of the boxes.
According to the translation-invariant property, the base proposal size defined in (3) depends on the total stride of the last convolutional layer, where is the total stride. Meanwhile, the architecture of the Faster R-CNN should be determined by the ship size; i.e., a large ship needs a large receptive filed to learn instinct features and generate large proposals, while a small ship needs a relatively small receptive filed to create small proposals. Additionally, the detection resolution, also known as the minimum detectable distance between two ships, should be equal to the base proposal size. Obviously, the conventional Faster R-CNN fails to simultaneously detect large and small ships in the PolSAR images. Therefore, we propose the modified Faster R-CNN, which is capable of detecting ships of varying size. The new architecture is shown in Figure 7, where we add an additional proposal-classification layer and proposal-regression layer after the lower-level feature map (conv2) to generate small proposals. Meanwhile, we add an additional box-regression layer and box-classification layer to improve the detection accuracy for small ships. It is observed that the RPN and the detection network share the first two convolutional layers, and the modified architecture could predict proposals with differing size from the last two shared convolutional layers. As shown in Figure 7, we apply a small feature extraction network instead of a classical network architectures (e.g., VGG-16 [13], ResNet-101 [27] and DenseNet [28]) to capture the low-level visual features of the ships in the PolSAR images. These classical network architectures are designed for optical images which have the characteristics of high resolution, large target size, and refined features. Compared with the targets in the optical images, the targets in the PolSAR images just have some rough features (e.g., brightness and edge). Meanwhile, due to the low resolution of the PolSAR images of the AIRSAR and UAVSAR, the sizes of ships usually do not match with the total stride of the classical network architectures. For example, the total stride of VGG-16 is 16, while the ship size in the PolSAR images is generally less than 16 16 pixel units. It is worth noting that the proposals generated from the Conv2 and Conv3 are conveyed to the Conv2-based and Conv3-based detection networks, respectively. Then, the Conv2-based and Conv3-based detection networks produce softmax probability of the ships and the coordinates of the boxes.
To improve the quality of region proposals, we first segmented the PolSAR image into sub-samples with the size of pixels, and set the smallest ship size at pixels. In the training stage of RPN, we randomly sample 64 anchors in an image to compute the loss function of a mini-batch, where the momentum parameter is set to 0.9, the decay parameter is set to 0.0005, and the learning rate is set to 0.01. Meanwhile, the weights are initialized from Gaussian distributions with a zero mean and standard deviation of 0.01, and the biases are initialized with a small constant of 0.1 [16]. The parameter values for setting up RPN network is determined by the best performance of the ship detection according to the references [24,25]. The modified Faster R-CNN is trained on the NVIDIA Titan-X GPU using caffe [26]. It takes advantage the GPUs, which makes for efficient prediction of object bounds and objectness scores at each position. The detection network shares the convolutional layer with RPN, and detailed architecture can be found in Figure 7. We train the detection network by backpropagation and stochastic gradient descent. Similarly, the detection network adapts the same parameter values as the RPN.
2.4. Target Fusion and Localization
As has been discussed previously, we segment the PolSAR image into sub-samples by the sliding window technique to fit the input size of DCNN and improve the ship detection performance. The stepping window structure of the segmented PolSAR image is shown in Figure 8, where the dashed rectangle indicates the edge of the PolSAR image, and the solid rectangle indicates the non-overlapping block-shifting segmentation window. Additionally, the black arrow denotes the shifting direction of the sliding window. For the target that occupies more than one sliding window, the detection window is split into red rectangles A and B. In this scenario, we need to merge them according to the geometrical relationship of the two samples and draw a bounding box of the ship. Additionally, the rectangles marked red and green are generated by two different detection networks shown in Figure 8; thus, we should also merge these detection results.
Supposing that the center coordinates , width , and height of the split detection windows A and B are known a priori, which are defined by and , respectively, then they should satisfy the two principles given below:
where is L1-norm. The first inequality sets constraint on the two windows in the horizontal direction, while the second one sets constraint in the vertical direction. is the lower bound of the distance between two detection windows, which is determined by the detection resolution and is experimentally set to 2. Meanwhile, is the higher bound of the distance between two detection windows distance, and is set to be
If the two detection windows satisfy merge principles given in (4) and (5), then the new detection windows are defined by
where , and denote the left, top, right, and bottom coordinates of the bounding box, respectively.
After that, we define the new detection window to draw bounds of ships in the PolSAR image,
where, denote the coordinates of the detection window in the PolSAR image, denote the coordinates of the detection window in the segmented samples, denote the width and height of the segmented samples, respectively, and is the stride.
3. Experimental Results
In the following discussions, experimental results of four measured datasets are presented to show the validity and the generality of the proposed method. Firstly, we illustrate the necessity of multi-look processing for heterogeneous PolSAR data before applying the detection algorithm by comparing the detection results of different number of looks. Meanwhile, we analyze the influence of azimuth ambiguity on ship detection performance. Because the ground truth provided by the automatic identification system (AIS) is unavailable, we discriminate between ships and their ambiguities by comparing the multi-frequency data [12], and assess the UAVSAR data by comparing images of the same scene at different time instants.
3.1. Results of AIRSAR Japan Dataset
The L-band dataset covers an area of the inland sea named Kojimawan, which is close to the Tamano City in Japan. It was acquired on 4 October 2000 using the NASA/JPL AIRSAR instrument. The extracted image has 797 741 pixels, corresponding to a resolution of 3.33 4.63 m (Range Azimuth). Figure 9 shows the Pauli RGB image of this dataset, where 21 ships are marked by red rectangles. Obviously, the PolSAR image is too large for DCNN. Therefore, we segment the image into smaller slices by the sliding-window technique, where the stride is set as 64 pixels and the size of a slice is . Then, the CNN-based classifier discussed in Section 2.2 is applied for ship subsamples extraction. The CNN-based classifier discussed in Section 2.2 achieves the state-of-the-art classification performance with 99.8% accuracy on the real-measured data, and is utilized for ship subsamples extraction. After that, the modified Faster R-CNN is applied to ship detection. In the training stage, it takes about 3 h to train an accurate modified Faster R-CNN model.
For illustration, Figure 10 shows typical detection results with Faster R-CNN, Figure 10a–d refer to the detection results of the original PolSAR image and Figure 10e–h refer to the detection results after multi-look processing with 9 looks. From Figure 10, it is observed that all the ships are concisely detected and marked with red and green rectangles, which are generated by feature maps of the last and the second last convolutional layers, respectively. It is worth noting that the Faster R-CNN, which generates proposals from Conv3 is termed deep Faster R-CNN, and shallow Faster R-CNN generates proposals from Conv2 (Conv2 and Conv3 are convolutional layer shown in Figure 7). Figure 10a,e shows that the all ships are clearly detected by the deep Faster R-CNN and can be individually distinguished, while the shallow Faster R-CNN detector miss the labeled A ship. Meanwhile, the large-size ship in Figure 10c,g is detected by shallow and deep Faster R-CNN, while the small ship in the right of Figure 10c,g is only detected by the shallow Faster R-CNN. The detection windows labeled A and B with respect to Figure 10a,e, and Figure 10b,f correspond to one ship, and thus they should be merged into a single window. Additionally, the detection proposals generated by feature maps from different convolutional layers should also be merged. As shown in Figure 10, there are two missed detections by using single-level feature, while robust detection performance can be achieved by using multi-level features.
Figure 11a,b present the merged ship detection result with respect to the shallow Faster R-CNN and the deep Faster R-CNN, respectively. Simultaneously, the target marked with red dotted circle, pink ellipse, and green dotted circle shown in Figure 11 are false alarm, missed ship, and roughness-detected ship, respectively. In Figure 11a, four missed ships and no false alarms occur. Figure 11b shows that 20 ships are detected with two false alarms, and one small ship is misdetected. Note that the clutter is detected by the deep Faster R-CNN as a ship, but it is corrected in the shallow Faster R-CNN, probably because of the strong energy of the clutter and the lack of train samples with clutter. The ship detection result of the modified Faster R-CNN is depicted in Figure 11c, where 21 ships are detected with two false alarms. No missed detections occur in this case. By comparing the detection result of the traditional Faster R-CNN, the modified Faster R-CNN achieves a better detection performance for multi-size ships by combining different feature maps. Figure 11d shows the ship detection result with modified CFAR, which applies the segmentation-based CFAR detector using truncation statistics for multi-look intensity (MLI) SAR imagery [8]. For the modified CFAR detector, the detection window, truncation ratio, confidence level, subsampling factor, and false alarm rate are set to , 5%, 99.9%, 4, and , respectively [8]. As shown in Figure 11d, all ships are correctly detected; however, the modified CFAR detector misses 2 ships and four false alarms appear due to strong clutter. Figure 11e presents the ship detection result of the SPWH detector. The SPWH detector is based on the assumption that sea clutter presents a homogeneous polarimetric behavior, and there are only two kinds of scatterers (i.e., sea, ship) in the scene [12]. We can see that major ships were clearly detected by this detector. However, there exist many false alarms marked using red dash circles, and these false alarms may be caused by severe clutter. It is indicated that the sea with abnormal polarimetric characteristics would generate false alarms, and we cannot simply suppose that only two kinds of scatterers existed in the scene. Ships do not have too much appearance information in PolSAR images, and their useful visual features (e.g., brightness and edge) can be easily captured by Conv1. Figure 11f shows the ship detection performance of the shallow Faster R-CNN detector with the proposals generated by the Conv1 in RPN. There are a lot of partial structures of large ships that have not been detected. It is worth noting that the shallow Faster R-CNN generates proposals by the Conv1 in RPN that would consume a large amount of memory, which seriously reduces the speed of target detection model training and testing. Figure 11e shows the ship detection result of the fully convolutional network-based ship detector; there are 5 false alarms and no misdetected ships. Meanwhile, some clutters are wrongly detected as a part of ships marked with greed dotted circles. The detection performance shown in Figure 11e demonstrates that the ship detector based on a fully convolutional network can’t mitigate the influence of the clutter. The fully convolutional network-based ship detector can output pixel-wise segmentation results [22] (sea, coast, and ship). The parameters of the fully convolutional network-based ship detector are adopted from the reference [28], while the fully convolutional network-based ship detector utilizes the same training data for the proposed ship detector. There are, in total, 31,892 samples with the size of for training the ship detector based on fully convolutional network. In Figure 11, it is shown that the proposed modified Faster R-CNN detector had superior performance compared to the traditional Faster R-CNN and the modified CFAR detector with the improvement of detection probability.
The training data was generated from Pauli decomposition. To demonstrate the validity of the training data generated from Pauli decomposition, we analyze the ship detection performance with training data generated from a different decomposition. Figure 12a shows the ship detection result with training data generated from Cloude decomposition [29], there are 13 false alarms marked with red dash ellipses and no ship missed detections. Figure 12b shows the ship detection result with training data generated from Huynen decomposition [29]; there are 14 false alarms marked with red dash ellipses and 1 missed ship was marked with a pink ellipse. By comparison, it is shown that the modified Faster R-CNN with the training data generated by Pauli decomposition has the best ship detection results.
Additionally, we analyzed the influence of the number of looks on the detection performance. Figure 13 shows the detection results of the proposed detector after multi-look processing with 9 looks, 25 looks, and 49 looks, respectively. Compared to the detection result of the original PolSAR image, the detection results after multi-look processing are more accurate. Figure 10d,h show partial ship detection result of the original and multi-look processed PolSAR images, respectively, which indicate that multi-look processing can suppress speckle noise and improve the detection performance. Compared to Figure 13, the bounding box marked by the green dash ellipse in Figure 11 became rougher. With an increasing number of looks, however, some weak ships may have been misdetected as clutter because the multi-look processing make it look more like clutter, as shown in Figure 13c. Therefore, the modified Faster R-CNN detector has better performance after multi-look processing with 9 or 25 looks for the heterogeneous PolSAR images.
To further validate the proposed method, the detection probability [12] and the figure of merit (FoM) [30] are introduced to perform performance evaluation quantitatively; i.e.,
where is the number of true detections, is the number of false alarms, and is the number of ground-truth targets. From Table 1, it is shown that the proposed ship detector has performance superior to the traditional Faster R-CNN and the modified CFAR, achieving high accuracy with for the Japan dataset.
The experiment is carried out on a personal computer with a 3.60-GHz Intel Core i7 processor and 64.00-GB RAM. The processing time of the shallow Faster R-CNN detector, the deep Faster R-CNN detector, proposed ship detector, the modified CFAR detector, and the shallow Faster R-CNN using Conv1 in RPN takes 2.53s, 2.71s, 3.03s, 201.9s, and 3.97s, respectively. The modified CFAR detector is a segmentation-based CFAR detection algorithm based on truncated statistics for multi-look intensity (MLI) SAR imagery. It takes around 195.3s for image segmentation due to the high computation complexity of the modified EM (Expectation Maximization) algorithm. On the contrary, all the parameters of the proposed ship detector are trained off-line, and thus the test stage takes much less time than the CFAR detector. A comparison between the execution time in Table 1 demonstrates that the proposed ship detector has a faster detection speed for complex and challenging sea clutter situations.
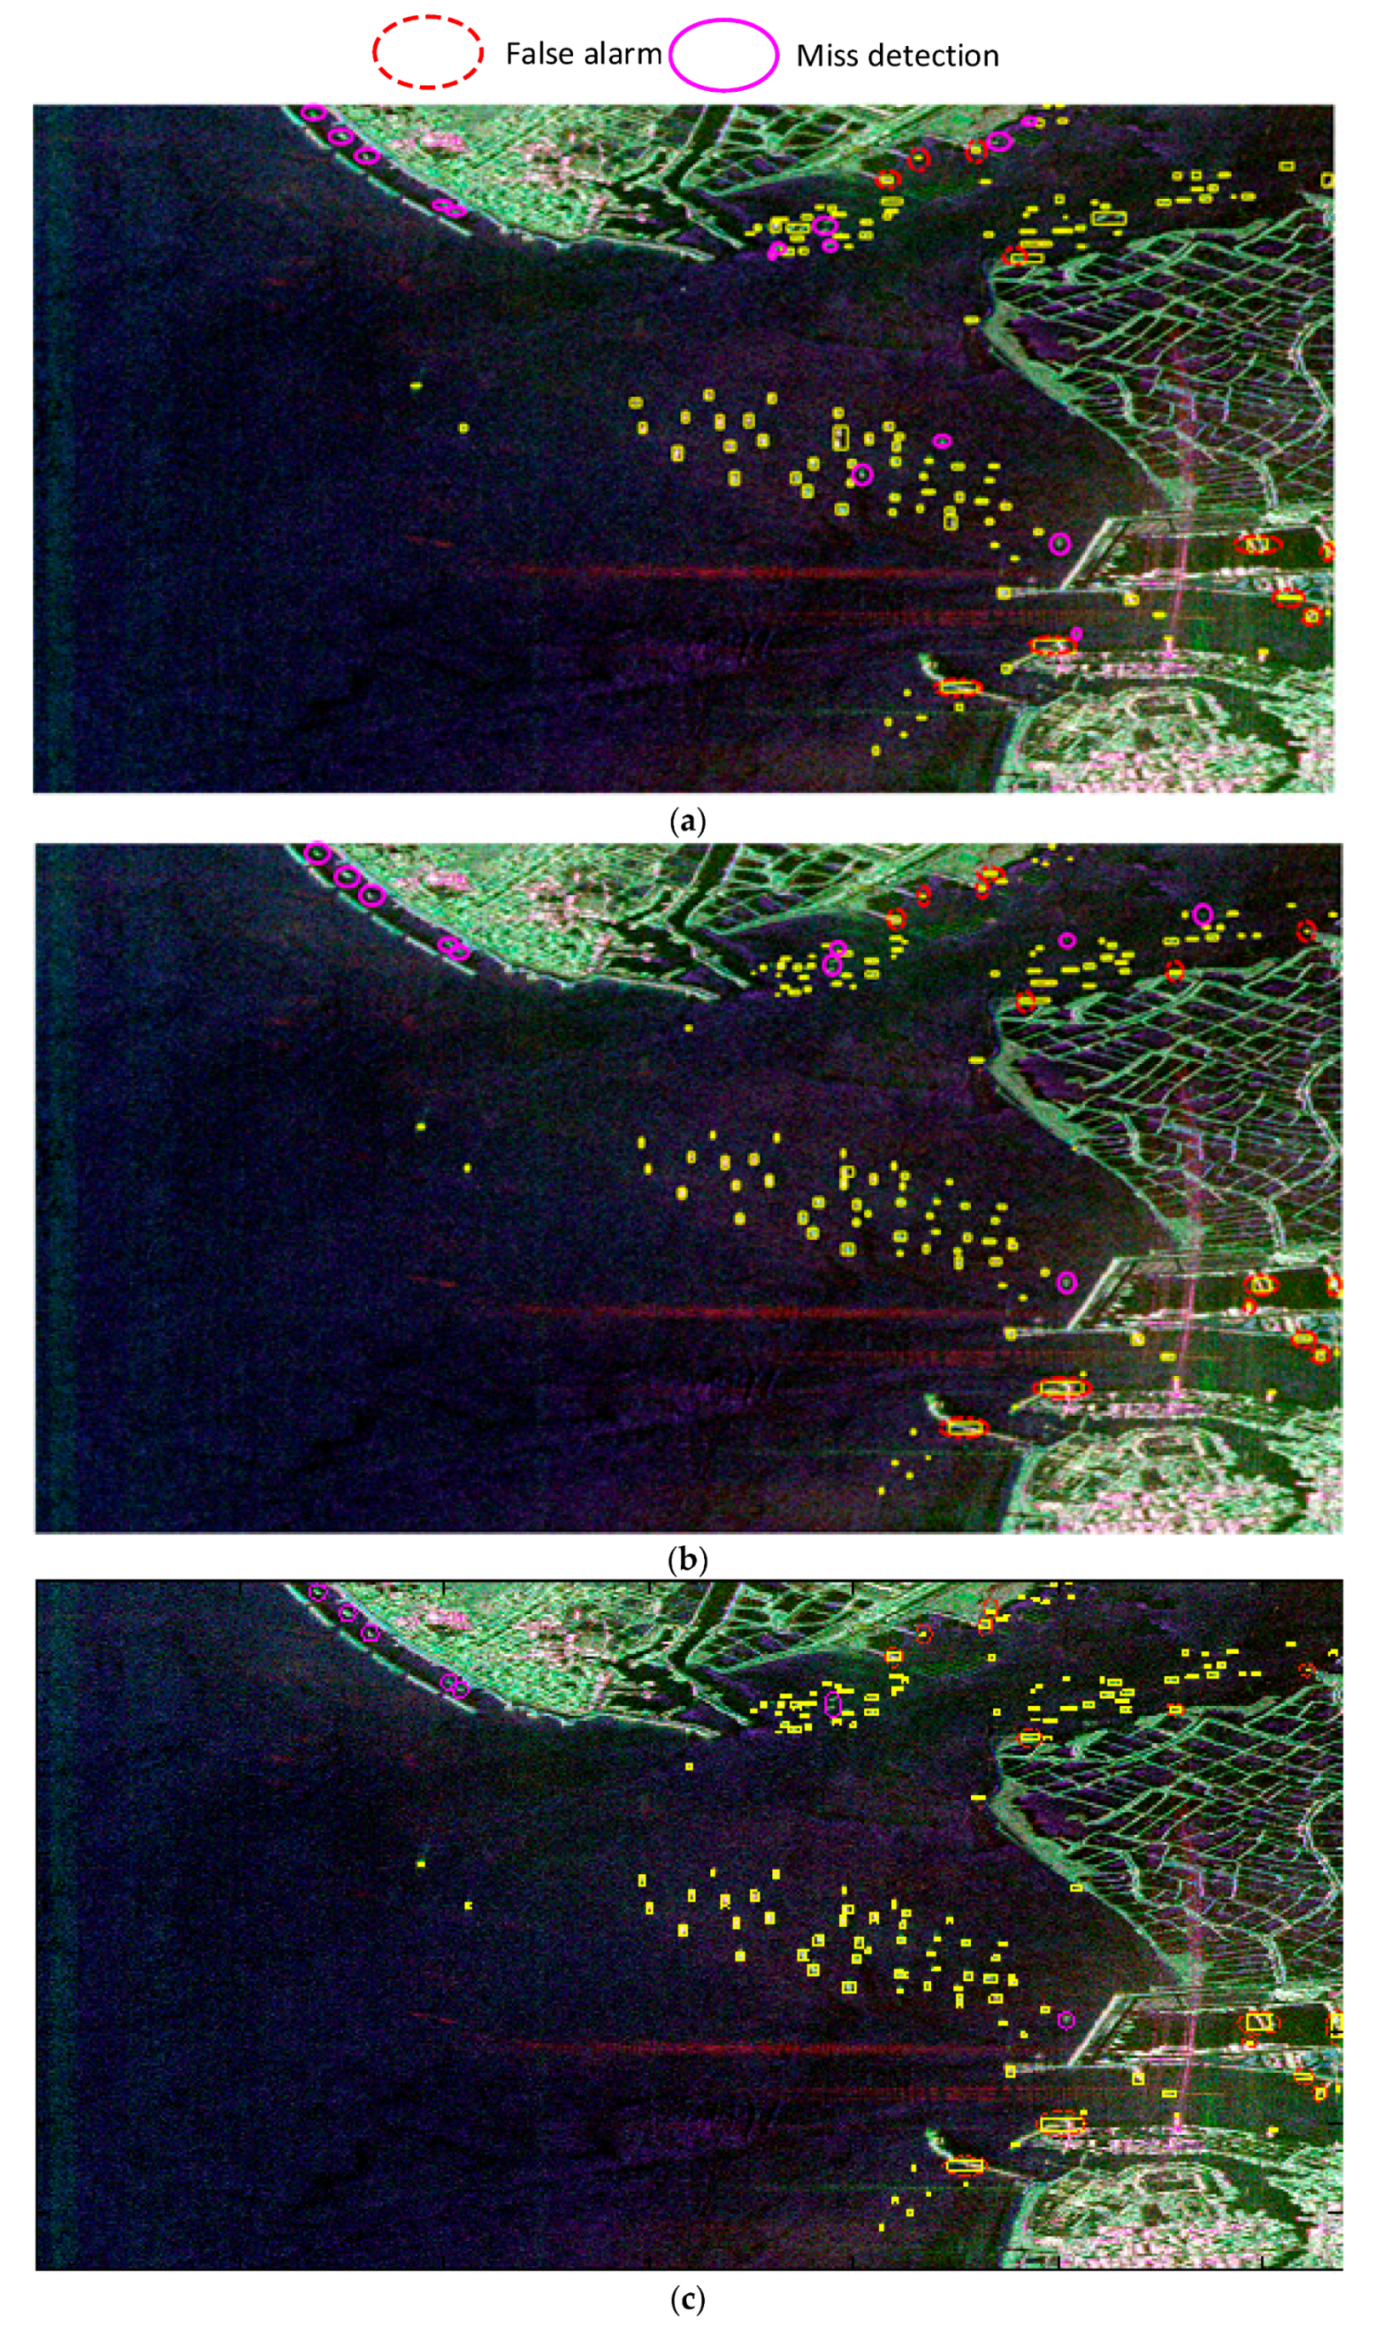
In addition, we analyzed the influence of azimuth ambiguity on the detection performance. For the C-band measured dataset of the same scene, the extracted image has 785 × 693 pixels, and the Pauli image is shown in Figure 14a, where the targets marked by red rectangles are ships, and those marked by a cyan rectangle are ambiguities. There are 20 ships and 8 ambiguities.
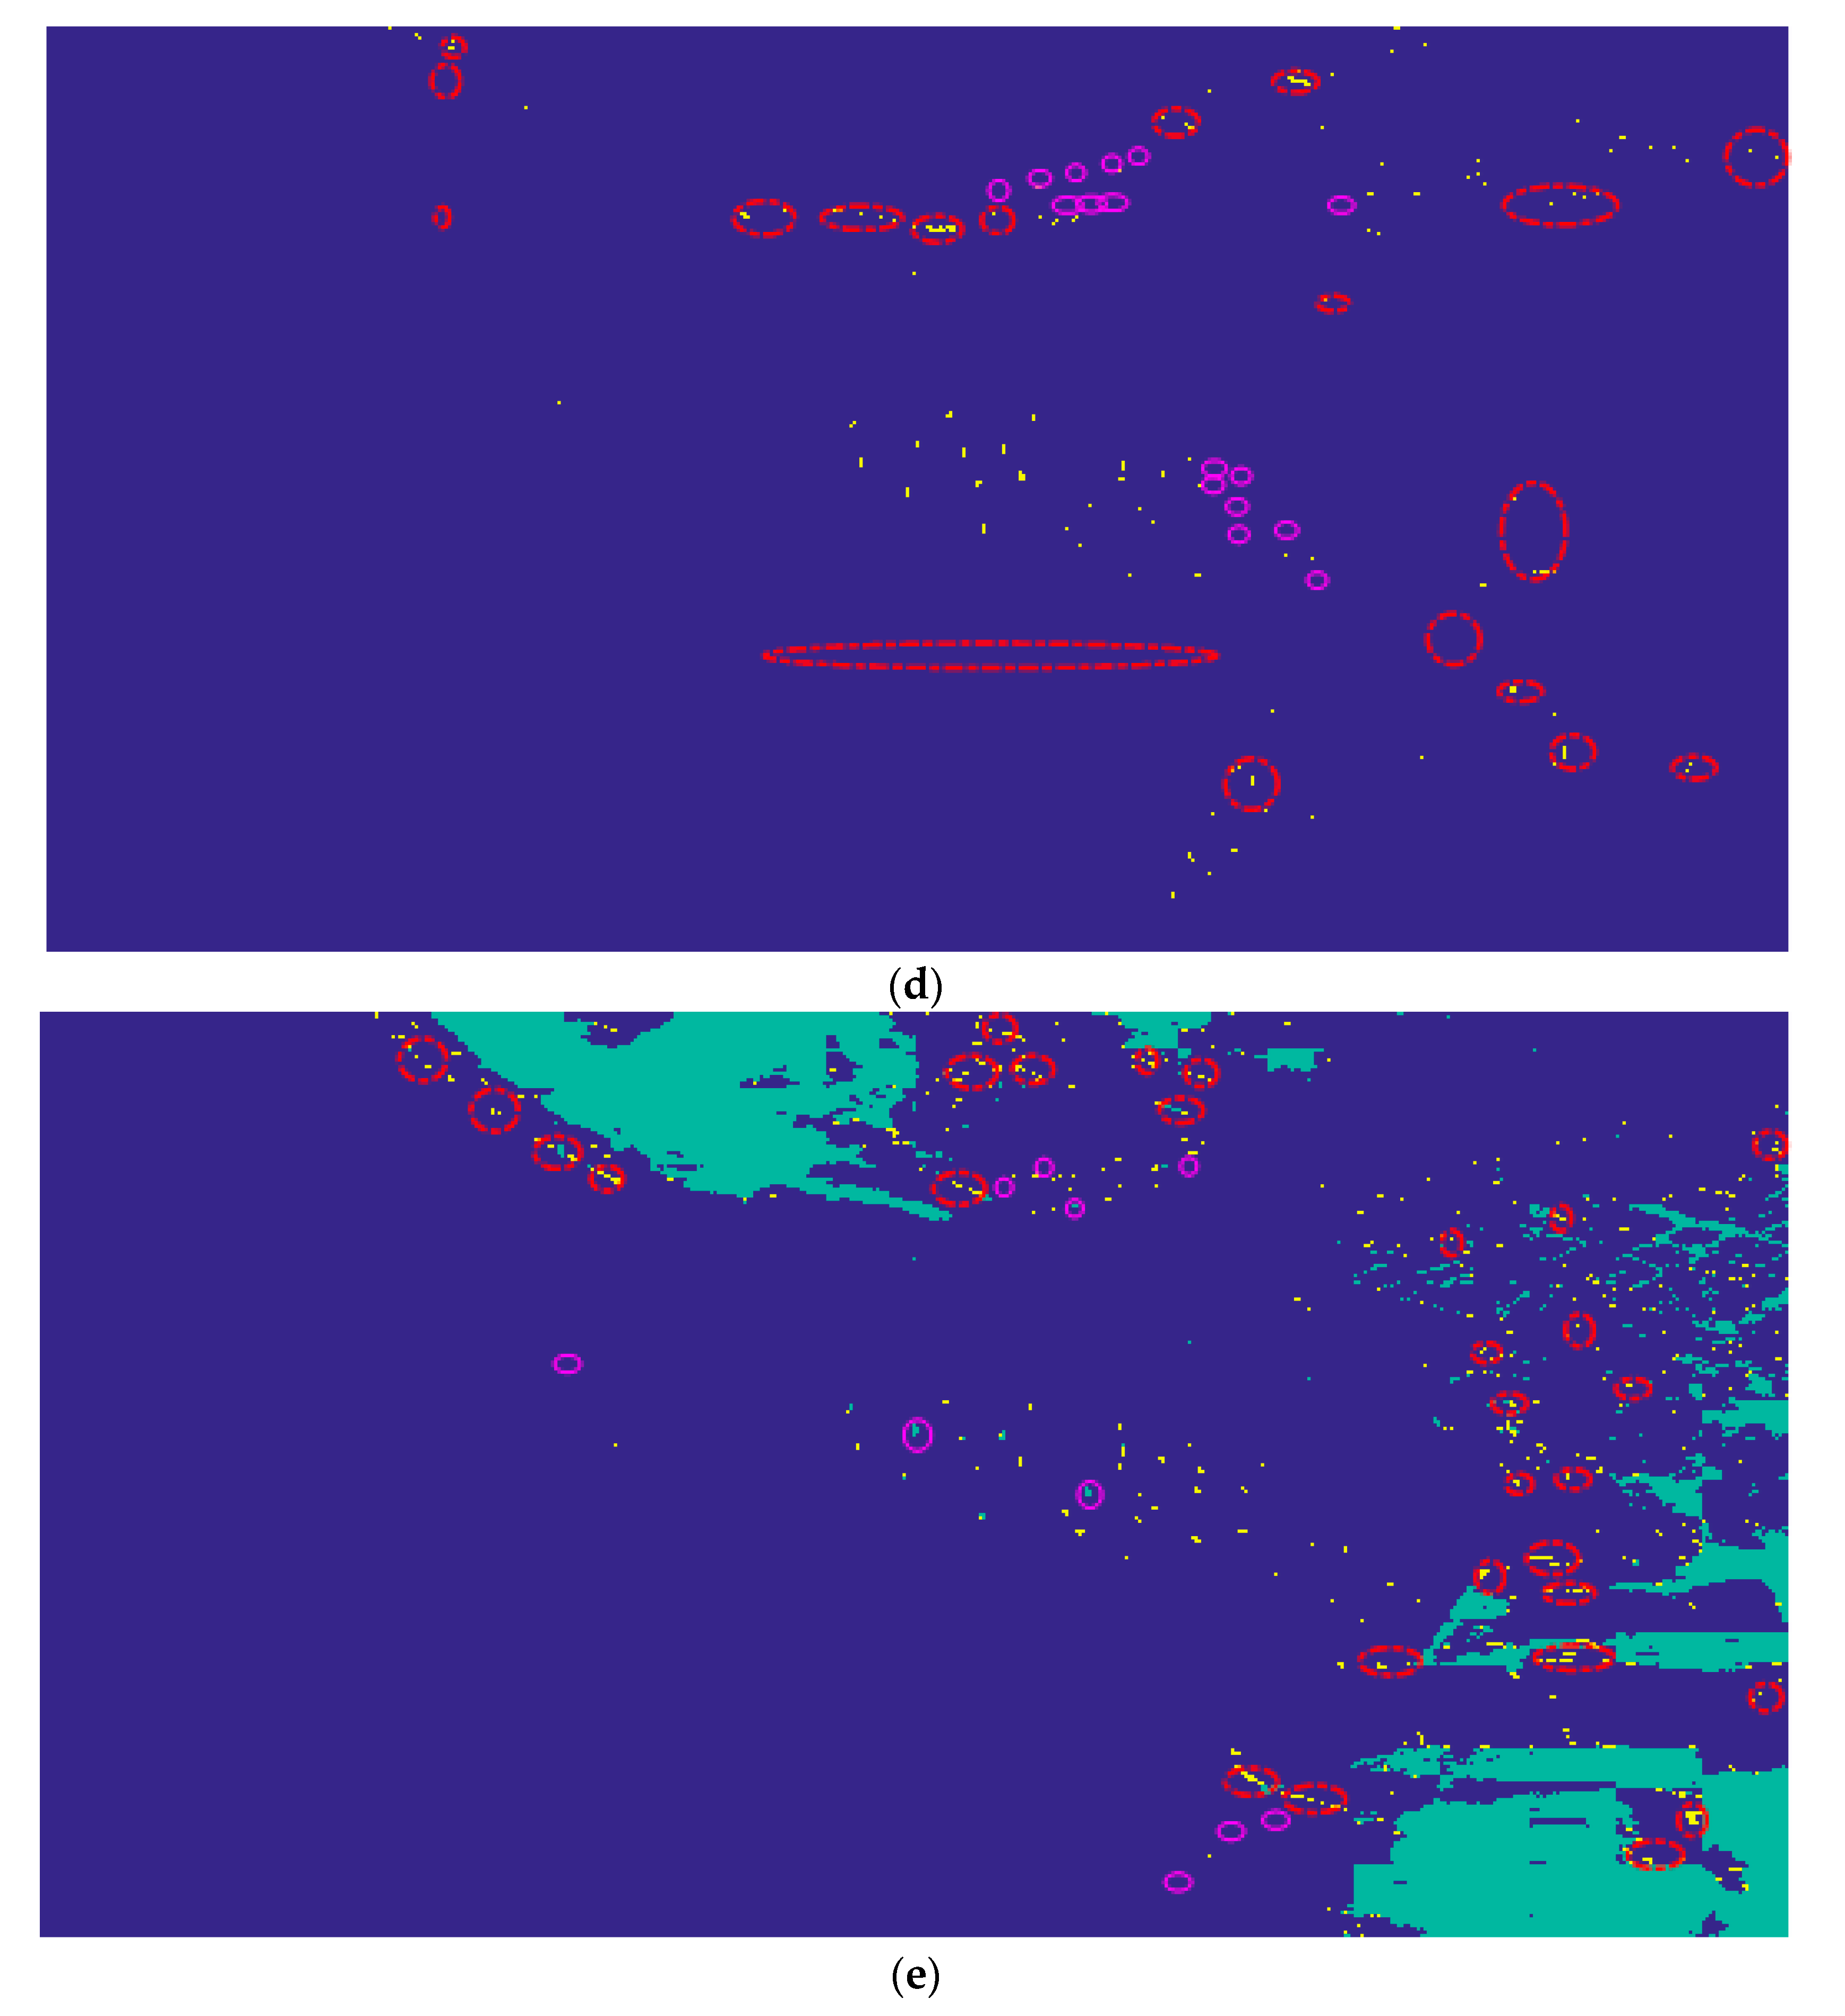
The detection results of the shallow Faster R-CNN, deep Faster R-CNN, proposed ship detector, proposed ship detector after multi-look processing, the modified CFAR detector, and the ship detector based on fully convolutional network are presented in Figure 14b–e, respectively. For the modified CFAR detector, the detection window, truncation ratio, confidence level, subsampling factor, and specifics false alarms are separately set by , 5%, 99.9%, 4, and [8]. Meanwhile, the parameters of the modified CFAR are the same for other test dataset. There is one false alarm marked with red dotted ellipse and one missed ship marked with pink circle in Figure 14b. As is shown in Figure 14c, there are 3 false alarms and one missed ship. The false alarms are marked by red dotted ellipses shown in Figure 14d, and there are no missed detections. As we can see from Figure 14e, the ship detection performance has improved after multi-look processing, and there are two false alarms. Figure 14f shows that there are 17 false alarms and 2 missed ships. Meanwhile, 7 ambiguities marked by green dotted circles are misclassified as ships. Figure 14e shows that there are 13 false alarms and no missed detections. Although the ship detector based on a fully convolutional network can mitigate the influence of the azimuth ambiguities, it introduces more false alarms due to strong clutter. Compared to the modified CFAR detector, the proposed ship detector has better ability in distinguishing the ambiguities and ships because it can accurately extract different features of ships and ambiguities in the scattering intensity. Quantitative analysis on the ship detection results is listed in Table 2, which demonstrates that the proposed ship detector has performance superior to the modified CFAR detector, the fully convolutional network based ship detector, and the proposed ship detector using a multi-level feature that has better detection performance than traditional Faster R-CNN. Due to the existence of ambiguities having an adverse impact on ship detection, it is recommended that the dataset should undergo ambiguity removal beforehand.
3.2. Result of UAVSAR Gulfco Area A Dataset
The detection results on the AIRSAR data where ships are distributed, targets have demonstrated the effectiveness of the proposed detector. In this part, we further analyze the detection performances on the UAVSAR Gulfco area A dataset, where the ships are compactly distributed. The dataset is acquired by NASA/JPL L-band, quad-pol UAVSAR over a bay area in Gulfco in 2010. The extracted image is 249 × 223 pixels in size with a resolution of 7.2 × 5 m (Azimuth × Range). This image contains 39 ships in the scene. Figure 15 shows the Pauli image for reference, where the ships are marked by red rectangles. Additionally, the ships marked by green solid circles in Figure 15 are relatively compacted, which are difficult to detect by conventional Faster R-CNN.
Figure 16 shows ship detection result of partial samples. It is observed that the deep Faster R-CNN were prone to take compacted ships as single ship while the shallow Faster R-CNN could detect all the compacted ships, as shown in Figure 16a,b. Figure 17a–e shows the final ship detection result of the shallow Faster R-CNN, the deep Faster R-CNN, the proposed ship detector, the modified CAFR ship detector, and the fully convolutional network based ship detector, respectively. All the ships are accurately detected without false alarms and missed detections for the shallow Faster R-CNN, the proposed ship detector, the modified CFAR ship detectors, and the fully convolutional network based ship detector. However, Figure 17b shows that there were three missed ship marked with pink circles, and three small ship are detected as one marked with green dotted ellipses. The modified CFAR achieves satisfying performance because the PolSAR data presents a homogeneous polarimetric behavior. Meanwhile, the fully convolutional network-based ship detector shows that it performed well in ship compactly distributed condition, as well as in homogeneous area. This experiment also verified that the proposed detector is capable of detecting compactly distributed ships accurately. Moreover, it proves that the deep Faster R-CNN is not suitable for small and compactly distributed ship detection. Detailed detection result of the four ship detectors can be found in Table 3.
3.3. Result of UAVSAR Gulfco Area B Dataset
The ship detection results on the AIRSAR and UAVSAR Gulfco area A datasets have demonstrated the validity and generality of the proposed ship detector. However, there are no coasts in the above datasets. To verify that the proposed ship detector can suppress the negative impact of coast on the detection result, we performed experiments on the UAVSAR Gulfco area B dataset. This L band dataset is also a product of NASA/JPL UAVSAR system acquired in Gulfco. The extracted image is 2021 × 1209 pixels in size with a resolution of 7.2 × 5 m (Azimuth × Range), and there are 22 ships in the scene. Figure 18 shows the Pauli image for reference, where ships are marked by red rectangles. Meanwhile, the targets marked by yellow rectangles are not ships with referred ground truth shown in the image. After obtaining sub-samples through the sliding-window technique, the DCNN based classifier is applied to extract samples containing ships.
Figure 19a–e shows the final ship detection result of the shallow Faster R-CNN, the deep Faster R-CNN, the proposed ship detector, the modified CAFR ship detector, and the fully convolutional network-based ship detector, respectively. Figure 19a shows that most ships were detected, two false alarms marked with red dotted circles, and one miss detected ship marked with pink circles. Figure 19b shows that most ships are detected and two false alarms presented. Figure 19c shows the merged ship detection results of the proposed ship detector, where all the ships are detected with 2 false alarms marked by red dotted ellipse. Due to the resolution of the PolSAR image being comparatively low, the proposed ship detector could not learn sufficient fine features and false alarms appeared in the detection result. Meanwhile, the detection results of the modified CFAR and the fully convolutional network-based ship detector shown in Figure 19d,e further demonstrate the superiority of the proposed ship detector. The segmentation result shown in Figure 19e demonstrates that the fully convolutional network performs well, the lakes and rivers are very clear. The sea, ship, and coast are marked with blue, yellow, and green color, respectively. However, there are some false alarms which occurs because the characteristic differences between ship and some coast are too small. Detailed ship detection performance comparisons of the five detectors are shown in Table 4. Note that though there is no clutter in the detected area and ship size is moderate, the detection performance of the traditional Faster R-CNN is consistent with the proposed algorithm.
3.4. Result of AIRSAR Taiwan Area Dataset
To further demonstrate the effectiveness of the proposed modified Faster R-CNN ship detector and to verify the performance of the proposed method in inshore scenery, we perform experiments on the AIRSAR Taiwan area dataset in L band. Figure 20 shows the Pauli RGB image of the AIRSAR Taiwan area dataset and the extracted image is 1527 1277 pixels in size with a resolution of 2.5720 1.6655 m (Azimuth Range). Figure 20 shows a complex and challenging sea situation for ship detection. There are multiple small weak ships appearing in the image, and many ships spread over the inshore. There are about 132 ships marked with red rectangle by visual inspection.
Figure 21a–e shows the final detection result of shallow Faster R-CNN, the deep Faster R-CNN, the proposed ship detector, the modified CAFR ship detector, and the fully convolutional network-based ship detector, respectively. The detection result shown in Figure 21 demonstrates that the proposed ship detector can provide a more excellent performance than the traditional Faster R-CNN, the modified CFAR, and the fully convolutional network-based ship detector. The proposed ship detector is sensitive enough to clearly detect and distinguish small and close located ships. It is worth noting that there were 14 false alarms observed around the coast edge because coast and ships have many similar image features in low-resolution PolSAR images. Moreover, the proposed ship detector completely missed the 8 ships because some samples contain ships were wrongly classified as coast. Compared with the traditional faster R-CNN and proposed ship detector, the performance of the modified CFAR and fully convolutional network-based ship detector was poor. There were many false alarms due to the complex inshore condition. Meanwhile, compared with the segmentation result shown in Figure 19e, the segmentation result shown in Figure 21e were worse, especially for coast. This situation may occur because there were no similar coastal samples in the training samples. However, the proposed ship detector performed well in such inshore areas. Detailed ship detection performance comparisons of the five detectors are shown in Table 5.
4. Discussion
In this paper, we developed a modified Faster R-CNN ship detector for PolSAR images. Compared with previous ship detection algorithms for PolSAR, the modified Faster R-CNN ship detector could capture the difference between the ship and clutter. Therefore, it performed well and effectively detected ships of multiple size. Four ship detection experiments performed on the measured PolSAR images in different condition demonstrates the effectiveness of the proposed ship detector. Meanwhile, the proposed ship detector had the ability to mitigate the influence of the azimuth ambiguities on the ship detection performance. Simultaneously, the modified Faster R-CNN ship detector had good performance in inshore scenery, expanding the scope of application of the proposed algorithm. However, the ship detection result presented in the last experiment shows that some small ships near land were more easily misdetected, and some coasts would be recognized as ships using the proposed ship detector. This might have occurred because the characteristic difference between ship and coast is very small in low resolution PolSAR images. In the future, we will introduce more additional features and use deep learning to improve the accuracy of ship detection for PolSAR.
5. Conclusions
In this paper, a DCNN based ship detection algorithm for PolSAR images is proposed. To mitigate the influence of the coast on ship detection, a three-class classifier based on DCNN was utilized to accurately extract samples containing ships. Compared with conventional Faster R-CNN, the modified Faster R-CNN could generate proposals of differing size from multi-level feature maps of the last two convolutional layers. Experimental results of four measured datasets have shown that the improvement in Faster R-CNN facilities fast and accurate detection performance for ships of differing size, especially for the compactly distributed ships and small ships. Additionally, we investigated the influence of multi-look processing, polarimetric decomposition methods and azimuth ambiguities on the detection performance for PolSAR images. Moreover, we performed an experiment on inshore scenery to demonstrate the effectiveness of the proposed ship detector.
Future works will focus on the methods of combining the deep learning and Bayesian theory to extract the structure, texture, and statistical characteristics of the ship, and further improve the detection performance.
Author Contributions
Conceptualization, W.F. and F.Z.; methodology, W.F.; validation, M.T., formal analysis, M.T.; writing—original draft preparation, W.F.; writing—review and editing, X.B.; visualization, T.T.
Funding
This paper was funded in part by the China Postdoctoral Science Foundation, grant numbers 2017M613076 and 2016M602775; in part by the National Natural Science Foundation of China, grant numbers 61801347, 61801344, 61522114, 61471284, 61571349, 61631019, 61871459, and 61801390; in part by the NSAF, grant number U1430123; by the Fundamental Research Funds for the Central Universities, grant numbers XJS17070, NSIY031403, and 3102017jg02014; and by the Natural Science Basic Research Plan in Shaanxi Province of China, grant number 2018JM6051; in part by the Aeronautical Science Foundation of China, grant number 20181081003; in part by the Postdoctoral Science Research Projects of Shaanxi Province; and by the Science, Technology and Innovation Commission of Shenzhen Municipality, grant number JCYJ20170306154716846.
Acknowledgments
The authors would like to thank the anonymous reviewers for their useful comments and suggestions, which were of great help in improving this paper. Meanwhile, the authors are grateful for NASA/JPL for providing the AIRSAR and UAVSAR datasets.
Conflicts of Interest
The authors declare no conflict of interest.
References
- Marino, A. A notch filter for ship detection with polarimetric SAR data. IEEE J. Sel. Top. Appl. Earth Obs. Remote Sens. 2013, 6, 1219–1232. [Google Scholar] [CrossRef]
- Wang, Y.; Liu, H. PolSAR ship detection based on superpixel-level scattering mechanism distribution features. IEEE Geosci. Remote Sens. Lett. 2015, 12, 1780–1784. [Google Scholar] [CrossRef]
- Lin, H.; Chen, H.; Wang, H.; Yin, J.; Yang, J. Ship Detection for PolSAR Images via Task-Driven Discriminative Dictionary Learning. Remote Sens. 2019, 11, 769. [Google Scholar] [CrossRef]
- An, W.; Xie, C.; Yuan, X. An improved iterative censoring scheme for CFAR ship detection with SAR imagery. IEEE Trans. Geosci. Remote Sens. 2014, 52, 4585–4595. [Google Scholar]
- Pelich, R.; Longepe, N.; Mercier, G. AIS-based evaluation of target detectors and SAR sensors characteristics for maritime surveillance. IEEE J. Sel. Top. Appl. Earth Obs. Remote Sens. 2015, 8, 3892–3901. [Google Scholar] [CrossRef]
- Song, S.; Xu, B.; Li, Z.; Yang, J. Ship detection in SAR imagery via variational Bayesian inference. IEEE Geosci. Remote Sens. Lett. 2015, 13, 319–323. [Google Scholar] [CrossRef]
- Smith, M.; Varshney, P. Intelligent CFAR processor based on data variability. IEEE Trans. Aerosp. Electron. Syst. 2000, 36, 837–847. [Google Scholar] [CrossRef]
- Tao, D.; Doulgeris, A.; Brekke, C. A segmentation-based CFAR detection algorithm using truncated statistics. IEEE Trans. Geosci. Remote Sens. 2016, 54, 2887–2898. [Google Scholar] [CrossRef]
- Tao, D.; Anfinsen, S.; Brekke, C. Robust CFAR detector based on truncated statistics in multiple-target situations. IEEE Trans. Geosci. Remote Sens. 2016, 54, 117–134. [Google Scholar] [CrossRef]
- Touzi, R. Calibrated polarimetric SAR data for ship detection. In Proceedings of the International Geoscience Remote Sensing Symposium, (IGARSS), Honolulu, HI, USA, 24–28 July 2000; pp. 144–146. [Google Scholar]
- Touzi, R.; Charbonneau, F. On the use of permanent symmetric scatters for ship characterization. IEEE Trans. Geosci. Remote Sens. 2004, 42, 2039–2045. [Google Scholar] [CrossRef]
- Wei, J.; Li, P.; Yang, J.; Zhang, J.; Lang, F. A new automatic ship detection method using L-band polarimetric SAR imagery. IEEE J. Sel. Top. Appl. Earth Obs. Remote Sens. 2014, 7, 1383–1393. [Google Scholar]
- Simonyan, K.; Zisserman, A. Very deep convolutional networks for large-scale image recognition. In Proceedings of the 2015 International Conference Learning Representations (ICLR), New York, NY, USA, 7–9 May 2015; pp. 1–14. [Google Scholar]
- Girshick, R.; Donahue, J.; Darrell, T.; Malik, J. Rich feature hierarchies for accurate object detection and semantic segmentation. In Proceedings of the 2014 IEEE Conference on Computer Vision and Pattern Recognition (CVPR), Columbus, OH, USA, 23–28 June 2014; pp. 580–587. [Google Scholar]
- Girshick, R. Fast r-cnn. In Proceedings of the 2015 IEEE International Conference on Computer Vision (ICCV), Santiago, Chile, 11–18 December 2015; pp. 1440–1448. [Google Scholar]
- Ren, S.; He, K.; Girshick, R.; Sun, J. Faster R-CNN: Towards Real-Time Object Detection with Region Proposal Networks. IEEE Trans. Pattern Anal. Mach. Intell. 2017, 39, 1137–1149. [Google Scholar] [CrossRef] [PubMed]
- Maggiori, E.; Tarabalka, Y.; Charpiat, G.; Alliez, P. Convolutional neural networks for large-scale remote-sensing image classification. IEEE Trans. Geosci. Remote Sens. 2017, 55, 645–657. [Google Scholar] [CrossRef]
- Kang, M.; Leng, X.; Lin, Z.; Ji, K. A modified faster R-CNN based on CFAR algorithm for SAR ship detection. In Proceedings of the 2017 International Workshop on Remote Sensing with Intelligent Processing (RSIP), Shanghai, China, 19–21 May 2017; pp. 1–4. [Google Scholar]
- Lin, Z.; Ji, K.; Leng, X.; Kuang, G. Squeeze and Excitation Rank Faster R-CNN for Ship Detection in SAR Images. IEEE Geosci. Remote Sens. Lett. 2019, 16, 751–755. [Google Scholar] [CrossRef]
- Chen, S.; Tao, C.; Wang, X.; Xiao, S. Polarimetric SAR Targets Detection and Classification with Deep Convolutional Neural Network. In Proceedings of the 2018 Progress in Electromagnetics Research Symposium (PIERS-Toyama), Toyama, Japan, 1–4 August 2018; pp. 2227–2234. [Google Scholar]
- Zhang, S.; Wu, R.; Xu, K.; Wang, J.; Sun, W. R-cnn-based ship detection from high resolution remote sensing imagery. Remote Sens. 2019, 11, 631. [Google Scholar] [CrossRef]
- Fan, Q.; Chen, F.; Cheng, M.; Lou, S.; Xiao, R.; Zhang, B.; Wang, C.; Li, J. Ship detection using a fully convolutional network with compact polarimetric sar images. Remote Sens. 2019, 11, 2171. [Google Scholar] [CrossRef]
- Cao, C.; Zhang, J.; Meng, J.; Zhang, X.; Mao, X. Analysis of ship detection performance with full-compact-and dul-polarimetric sar. Remote Sens. 2019, 11, 2160. [Google Scholar] [CrossRef]
- Christian, S.; Vincent, V.; Sergey, L.; Jon, S.; Zbigniew, W. Rethinking the inception architecture for computer vision. In Proceedings of the 2016 IEEE Conference on Computer Vision and Pattern Recognition (CVPR), Las Vegas, NV, USA, 26 June–1 July 2016; pp. 2818–2826. [Google Scholar]
- Ken, C.; Karen, S.; Andrea, V.; Andrew, Z. Return of the devil in the details: Delving deep into convolutional nets. In Proceedings of the British Machine Vision Conference (BMVC), Nottingham, UK, 1–5 September 2014; pp. 1–11. [Google Scholar]
- Jia, Y.; Shelhamer, E.; Donahue, J.; Karayev, S.; Long, J.; Girshick, R.; Guadarrama, S.; Darrell, T. Caffe: Convolutional architecture for fast feature embedding. In Proceedings of the 2014 ACM Conference on Multimedia, Orlando, FL, USA, 3–7 November 2014; pp. 675–678. [Google Scholar]
- He, K.; Zhang, X.; Ren, S.; Sun, J. Deep residual learning for image recognition. In Proceedings of the 2016 IEEE Conference on Computer Vision and Pattern Recognition (CVPR), Las Vegas, NV, USA, 26 June–1 July 2016; pp. 770–778. [Google Scholar]
- Huang, G.; Liu, Z.; Maaten, L. Densely Connected Convolutional Networks. In Proceedings of the 2017 IEEE Conference on Computer Vision and Pattern Recognition (CVPR), Honolulu, HI, USA, 21–26 July 2017; pp. 2261–2269. [Google Scholar]
- Lee, S.; Pottier, E. Polarimetric Imaging: From Basics to Applications; CRC Press: Boca Raton, FL, USA, 2009. [Google Scholar]
- Paes, R.; Lorenzzetti, J.; Gherardi, D. Ship detection using TerraSAR-X images in the campos basin (Brazil). IEEE Geosci. Remote Sens. Lett. 2010, 7, 545–548. [Google Scholar] [CrossRef]
Figure 1.
Workflow of the deep convolutional neural network (DCNN)-based ship detector.
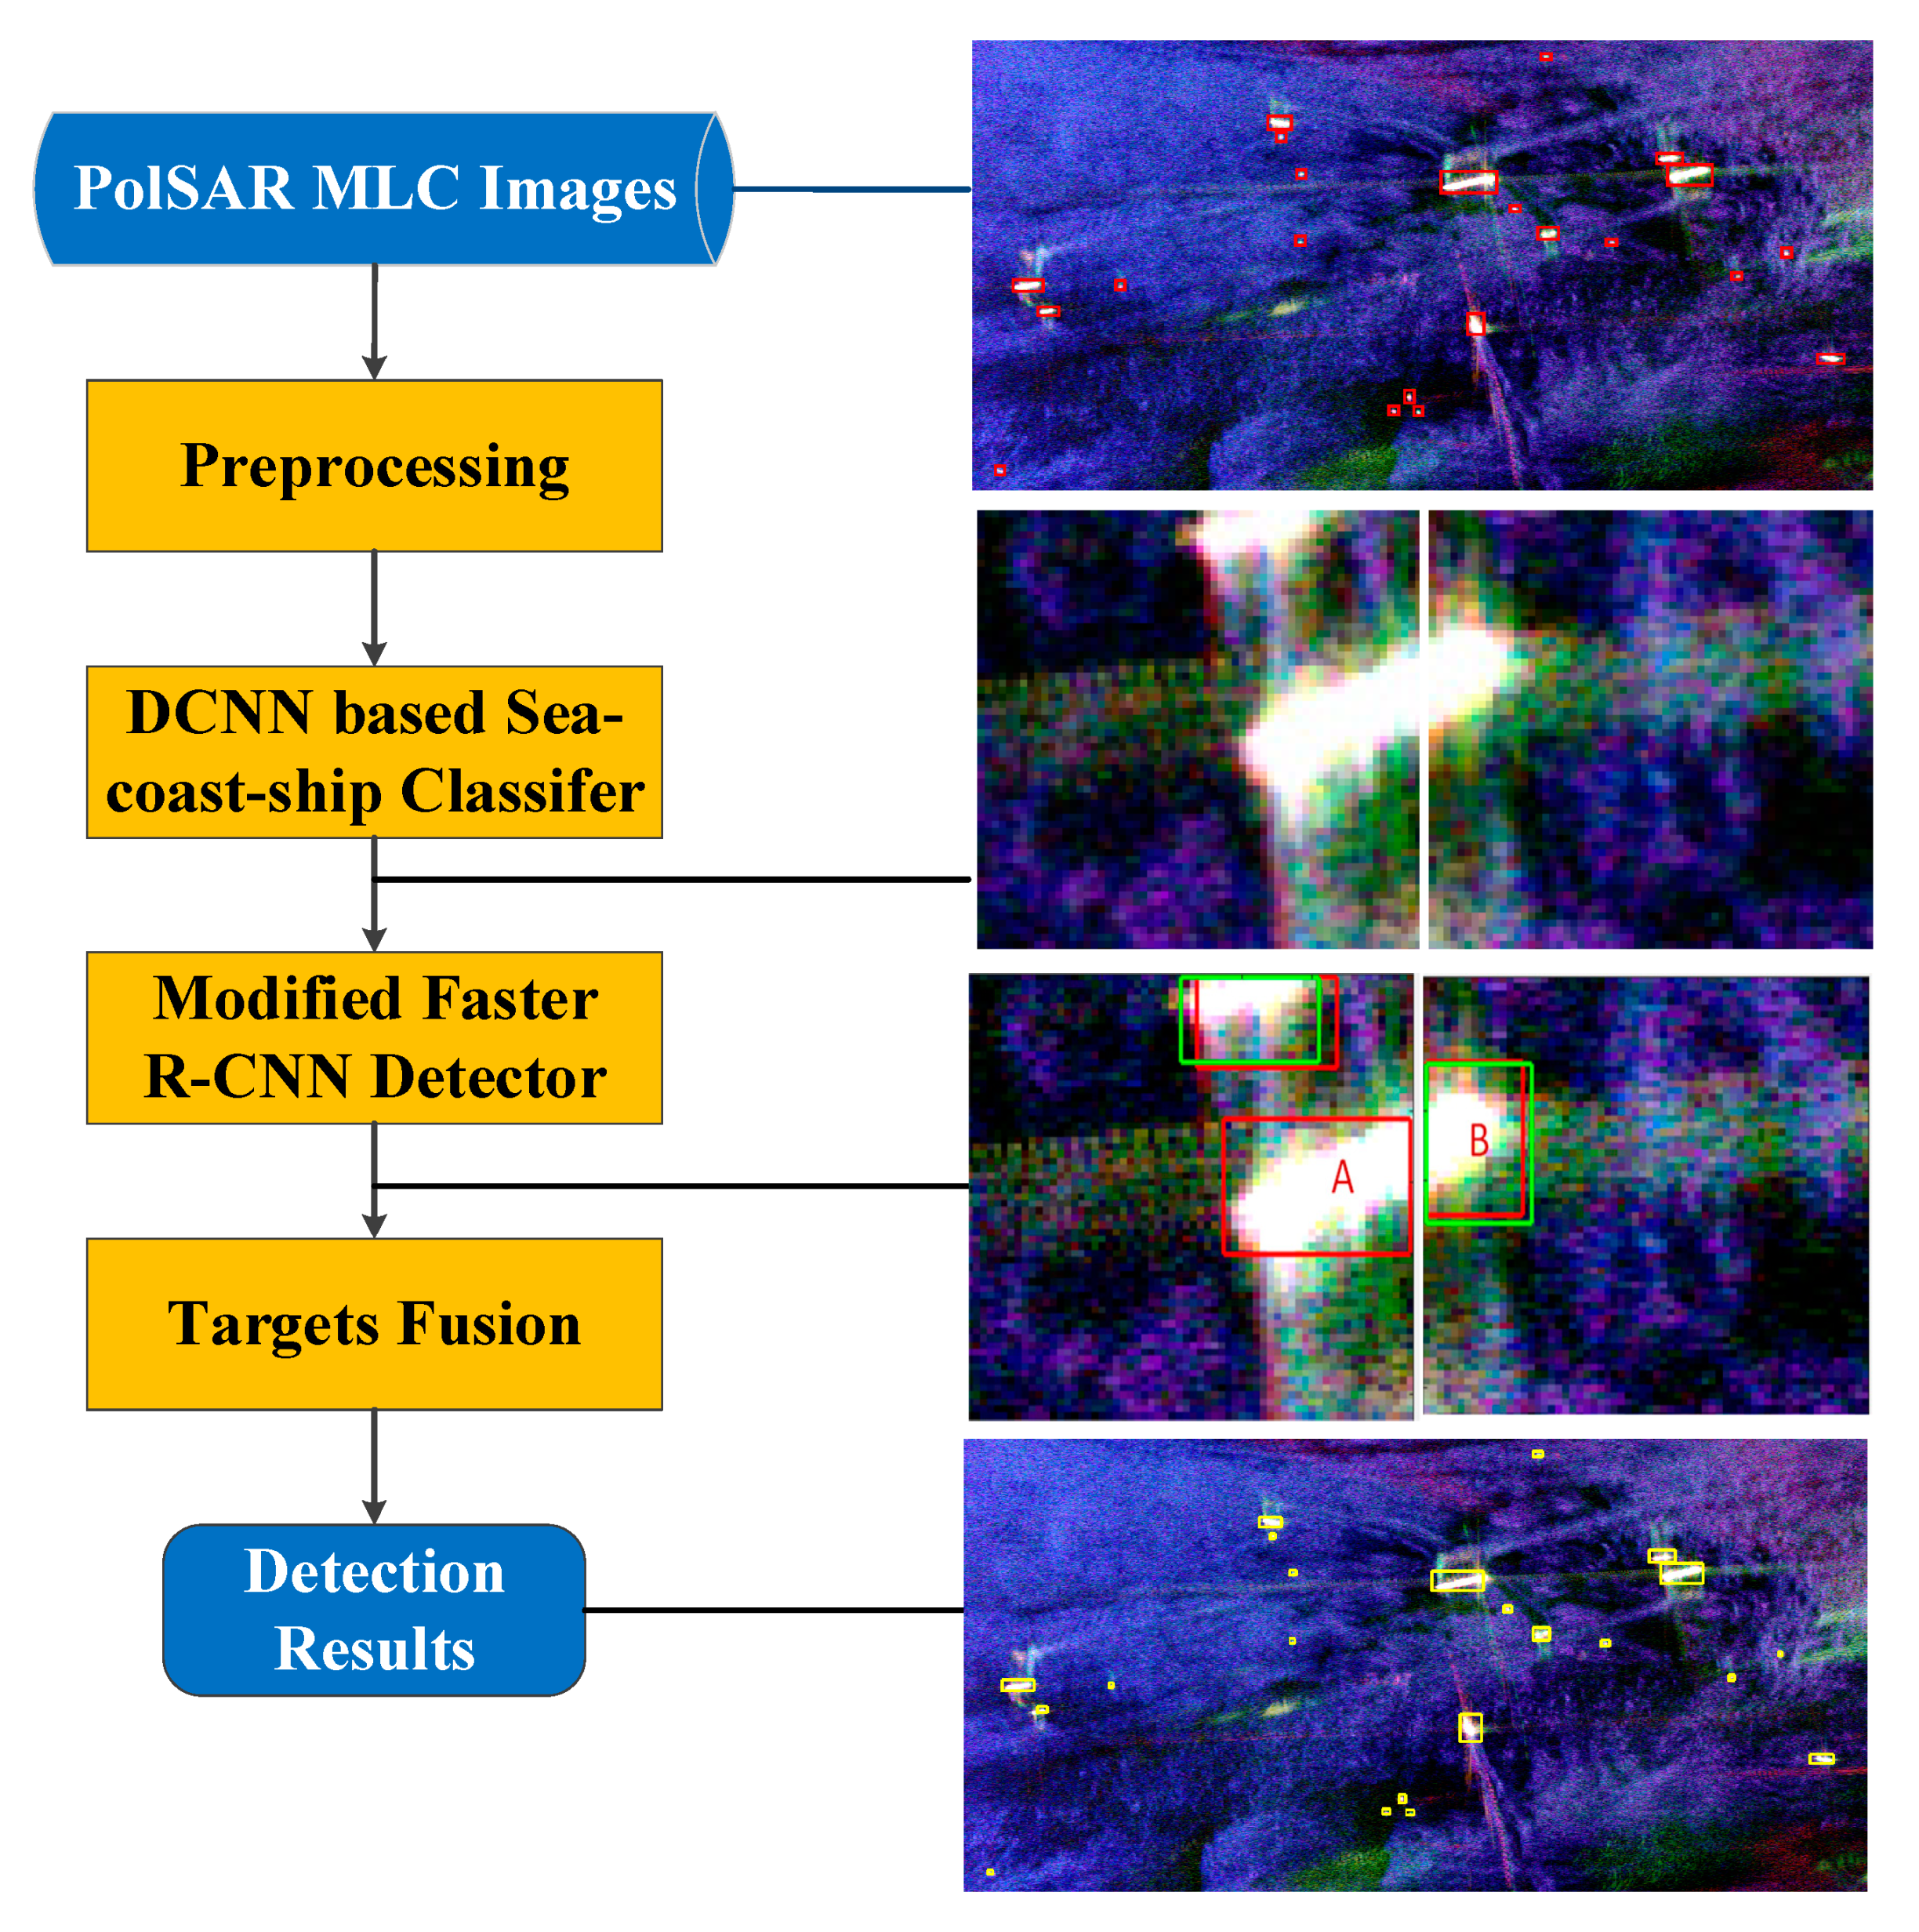
Figure 2.
Pauli images of (a) coast; (b) sea; and (c) ships.
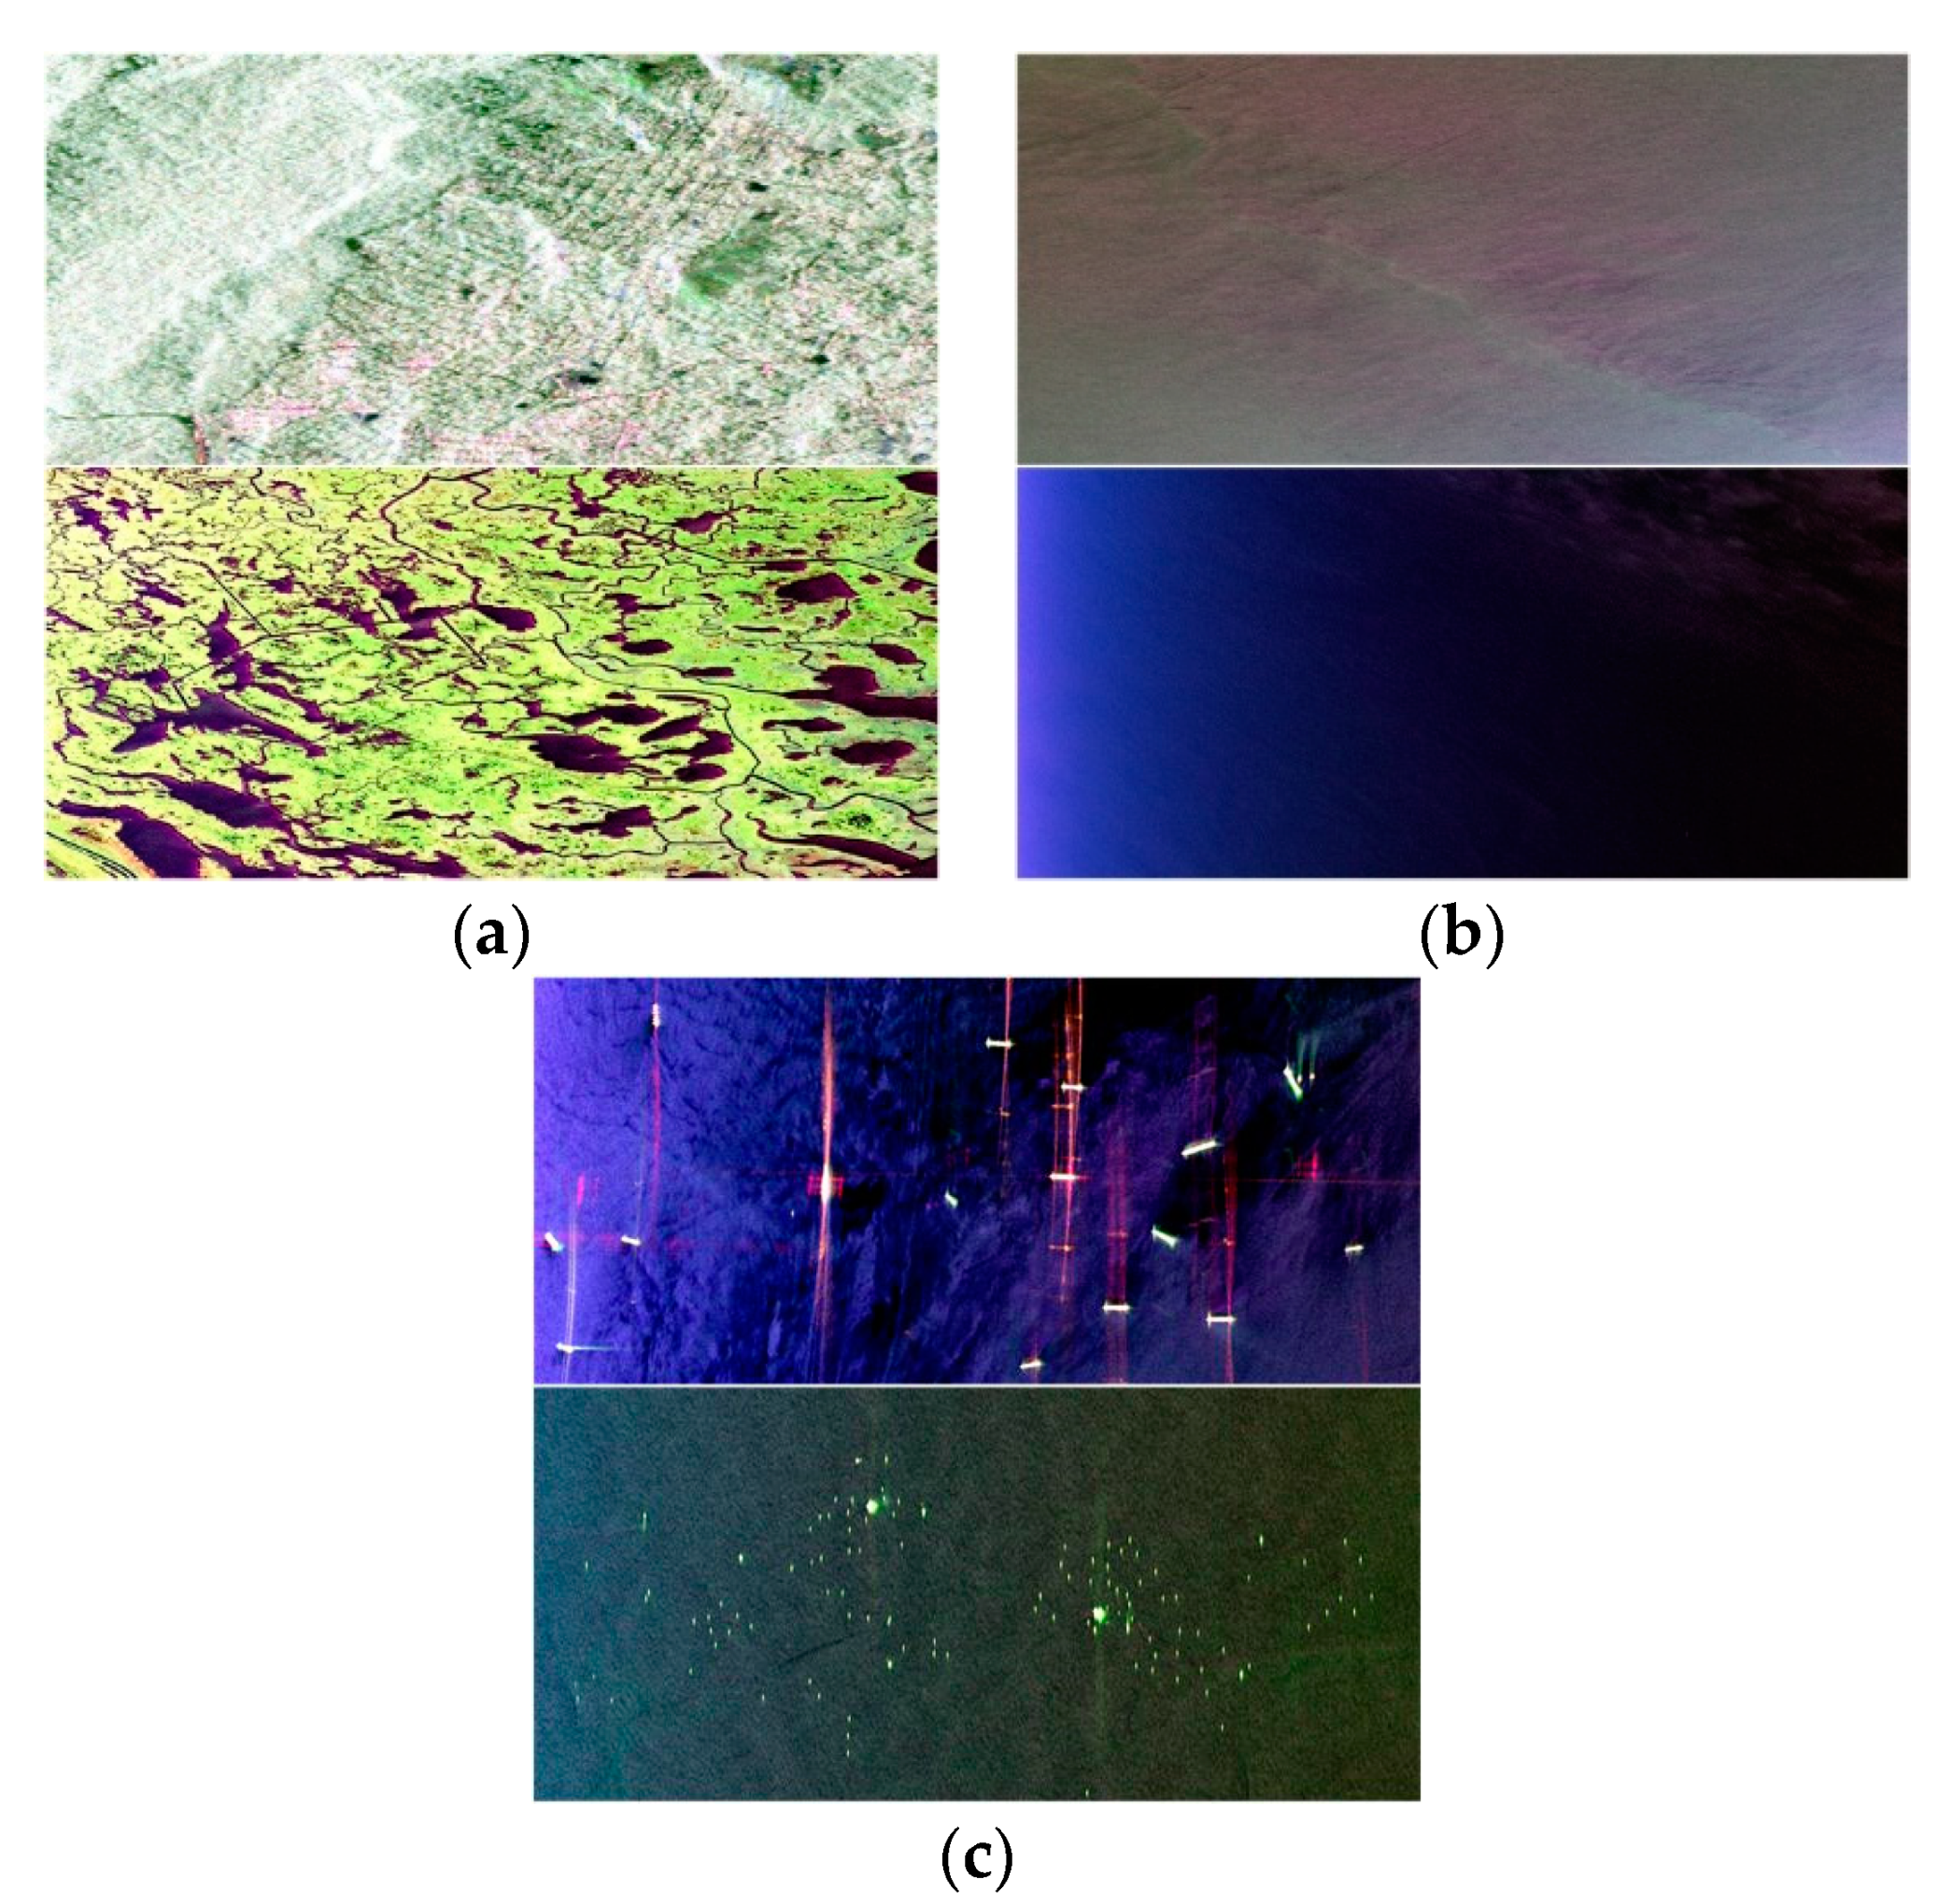
Figure 3.
Training samples with size of , where the top row shows ship samples, the middle row shows sea samples, and the bottom row shows coast samples.
Figure 3.
Training samples with size of , where the top row shows ship samples, the middle row shows sea samples, and the bottom row shows coast samples.
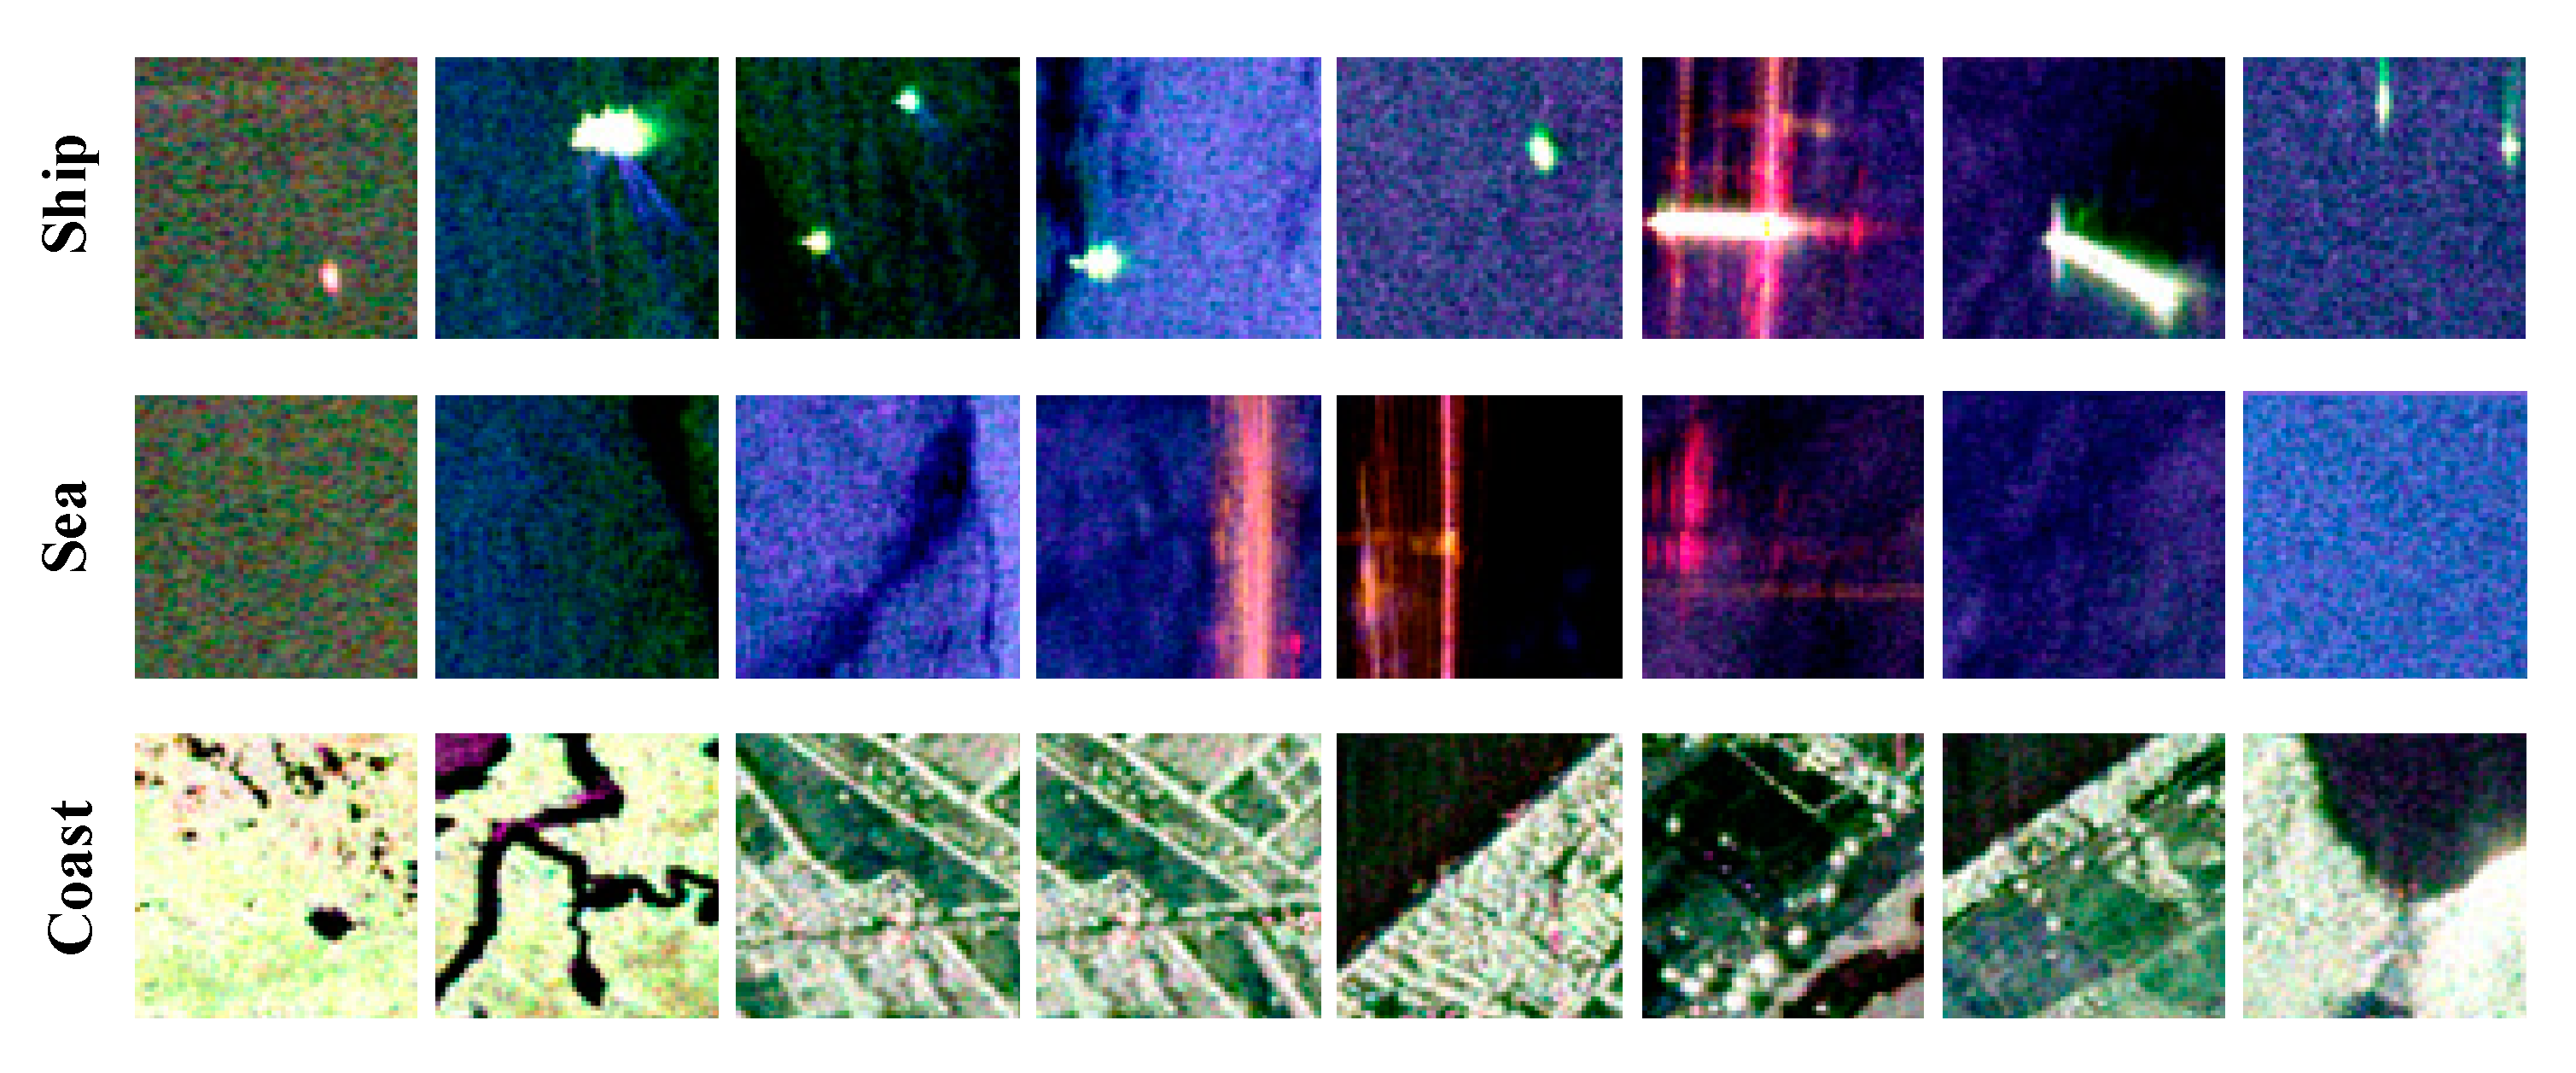
Figure 4.
Architecture of the proposed classifier.
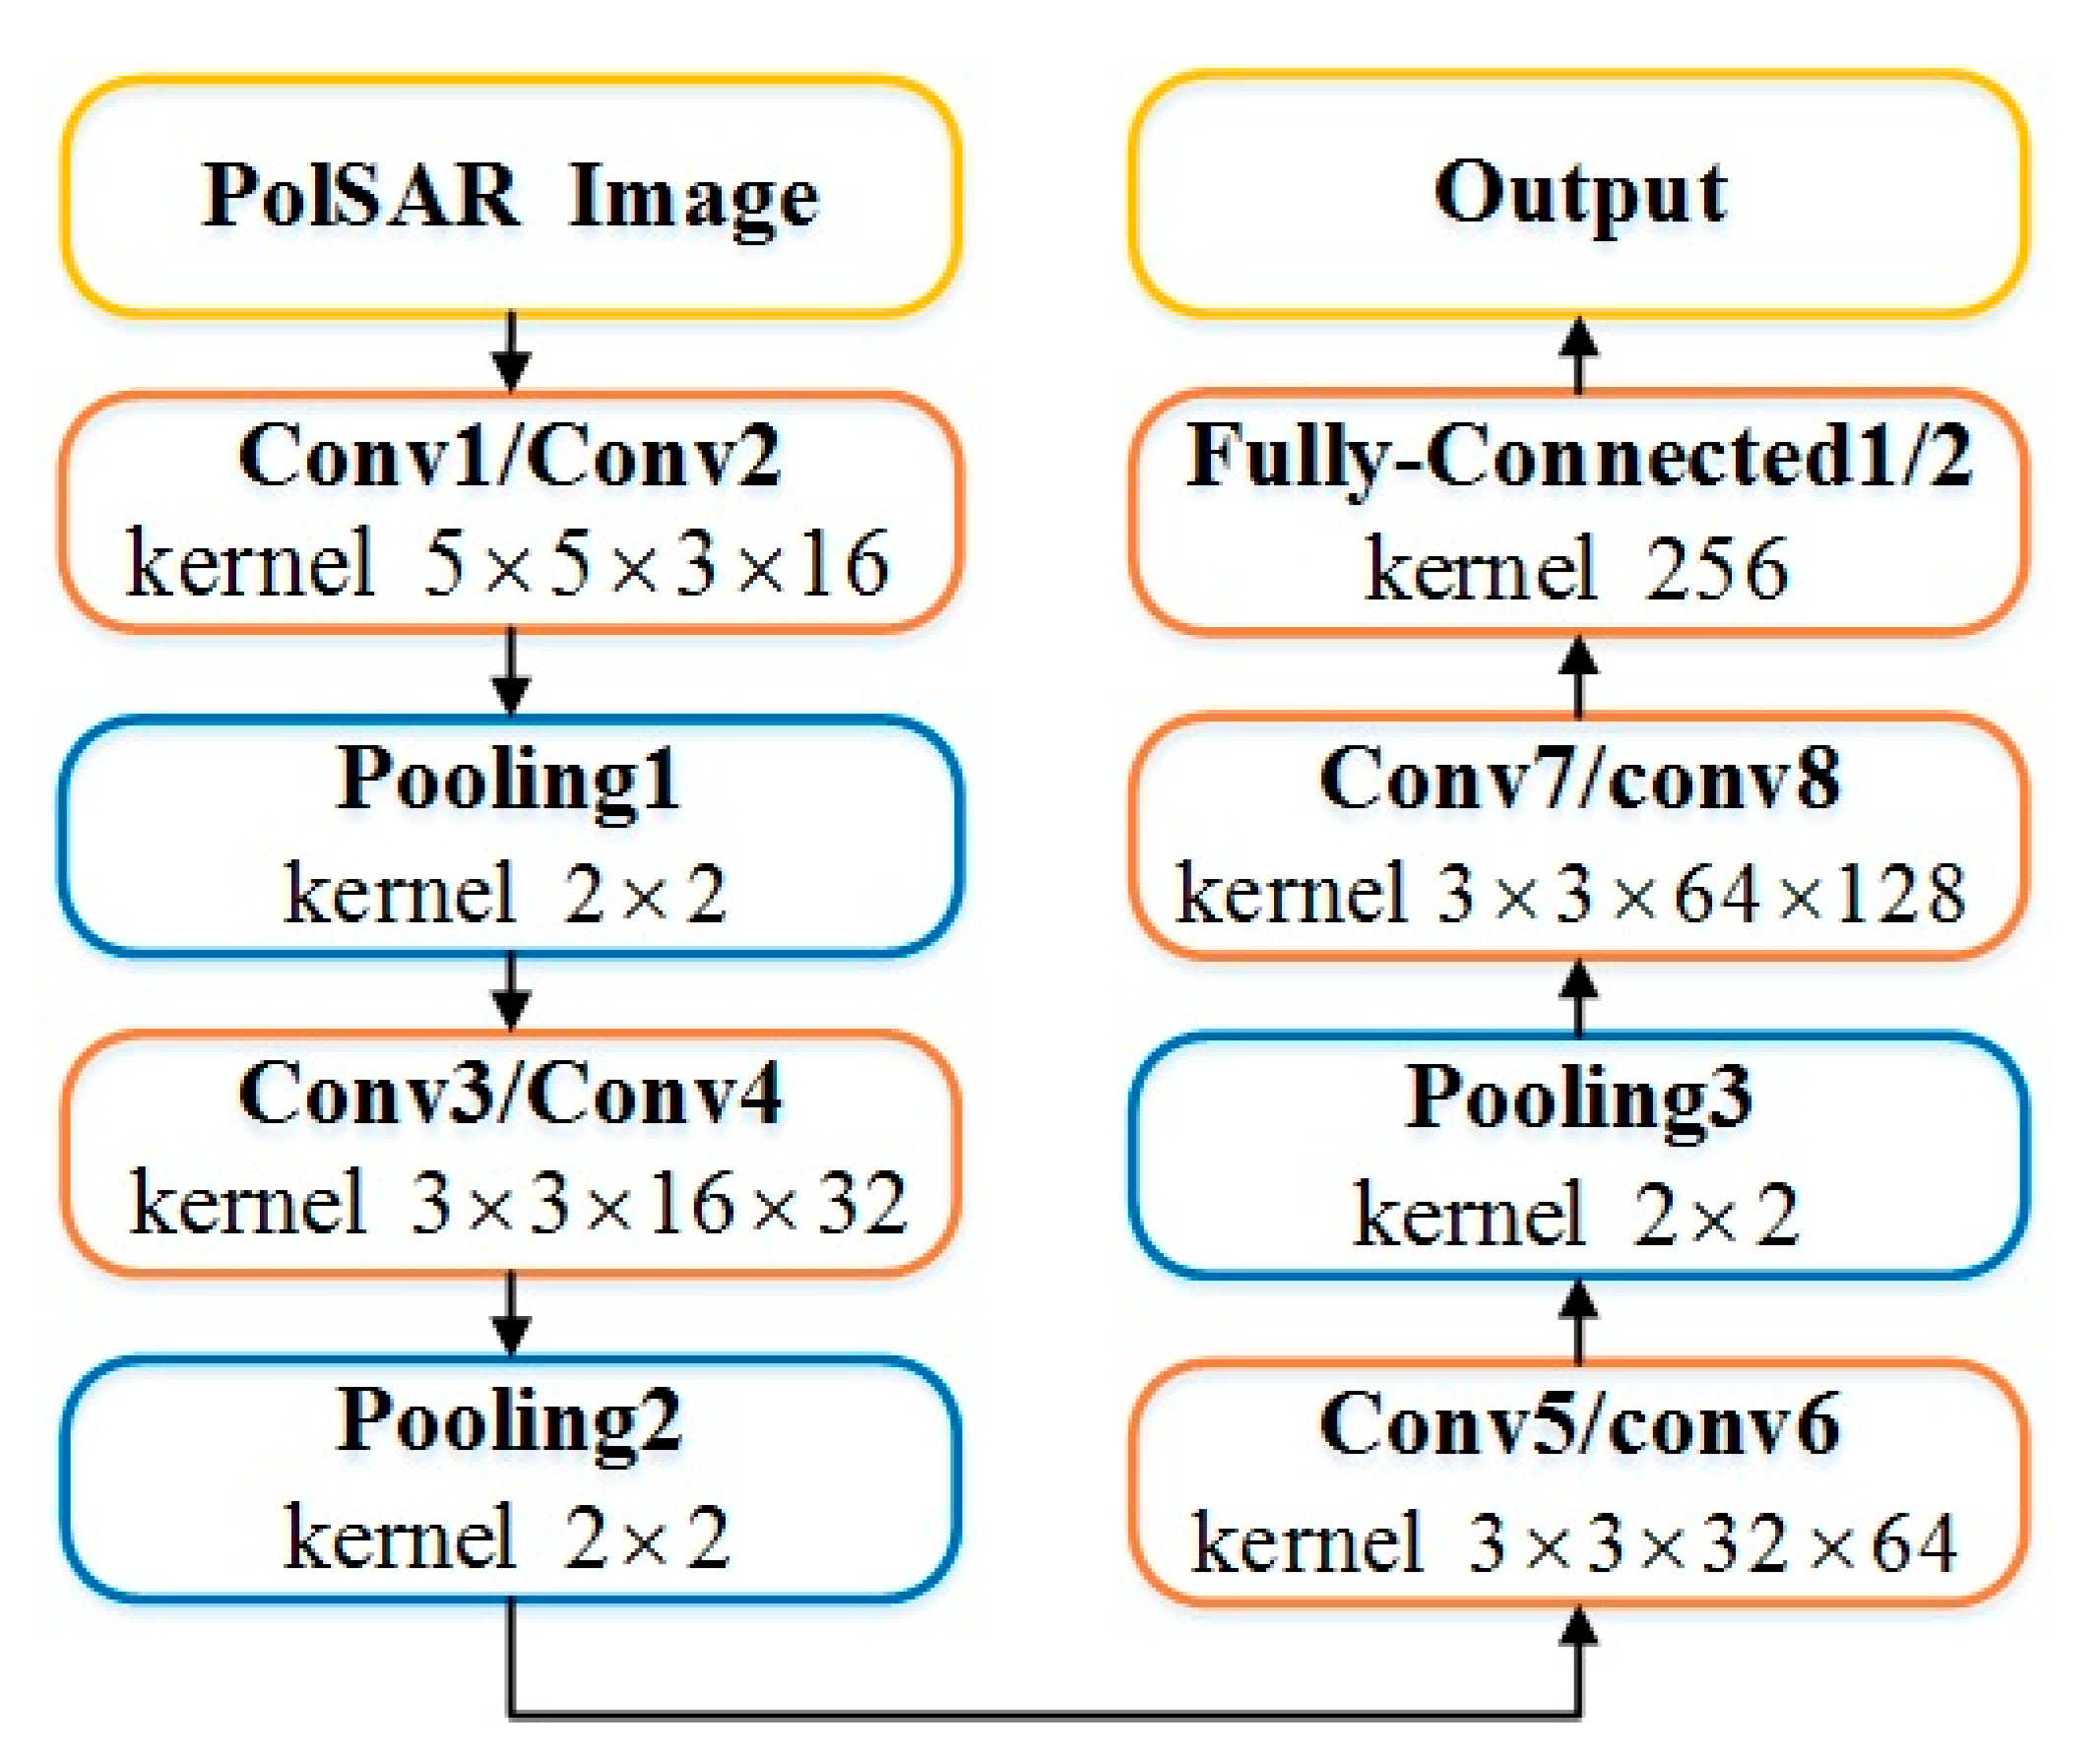
Figure 5.
Architecture of Faster R-CNN.
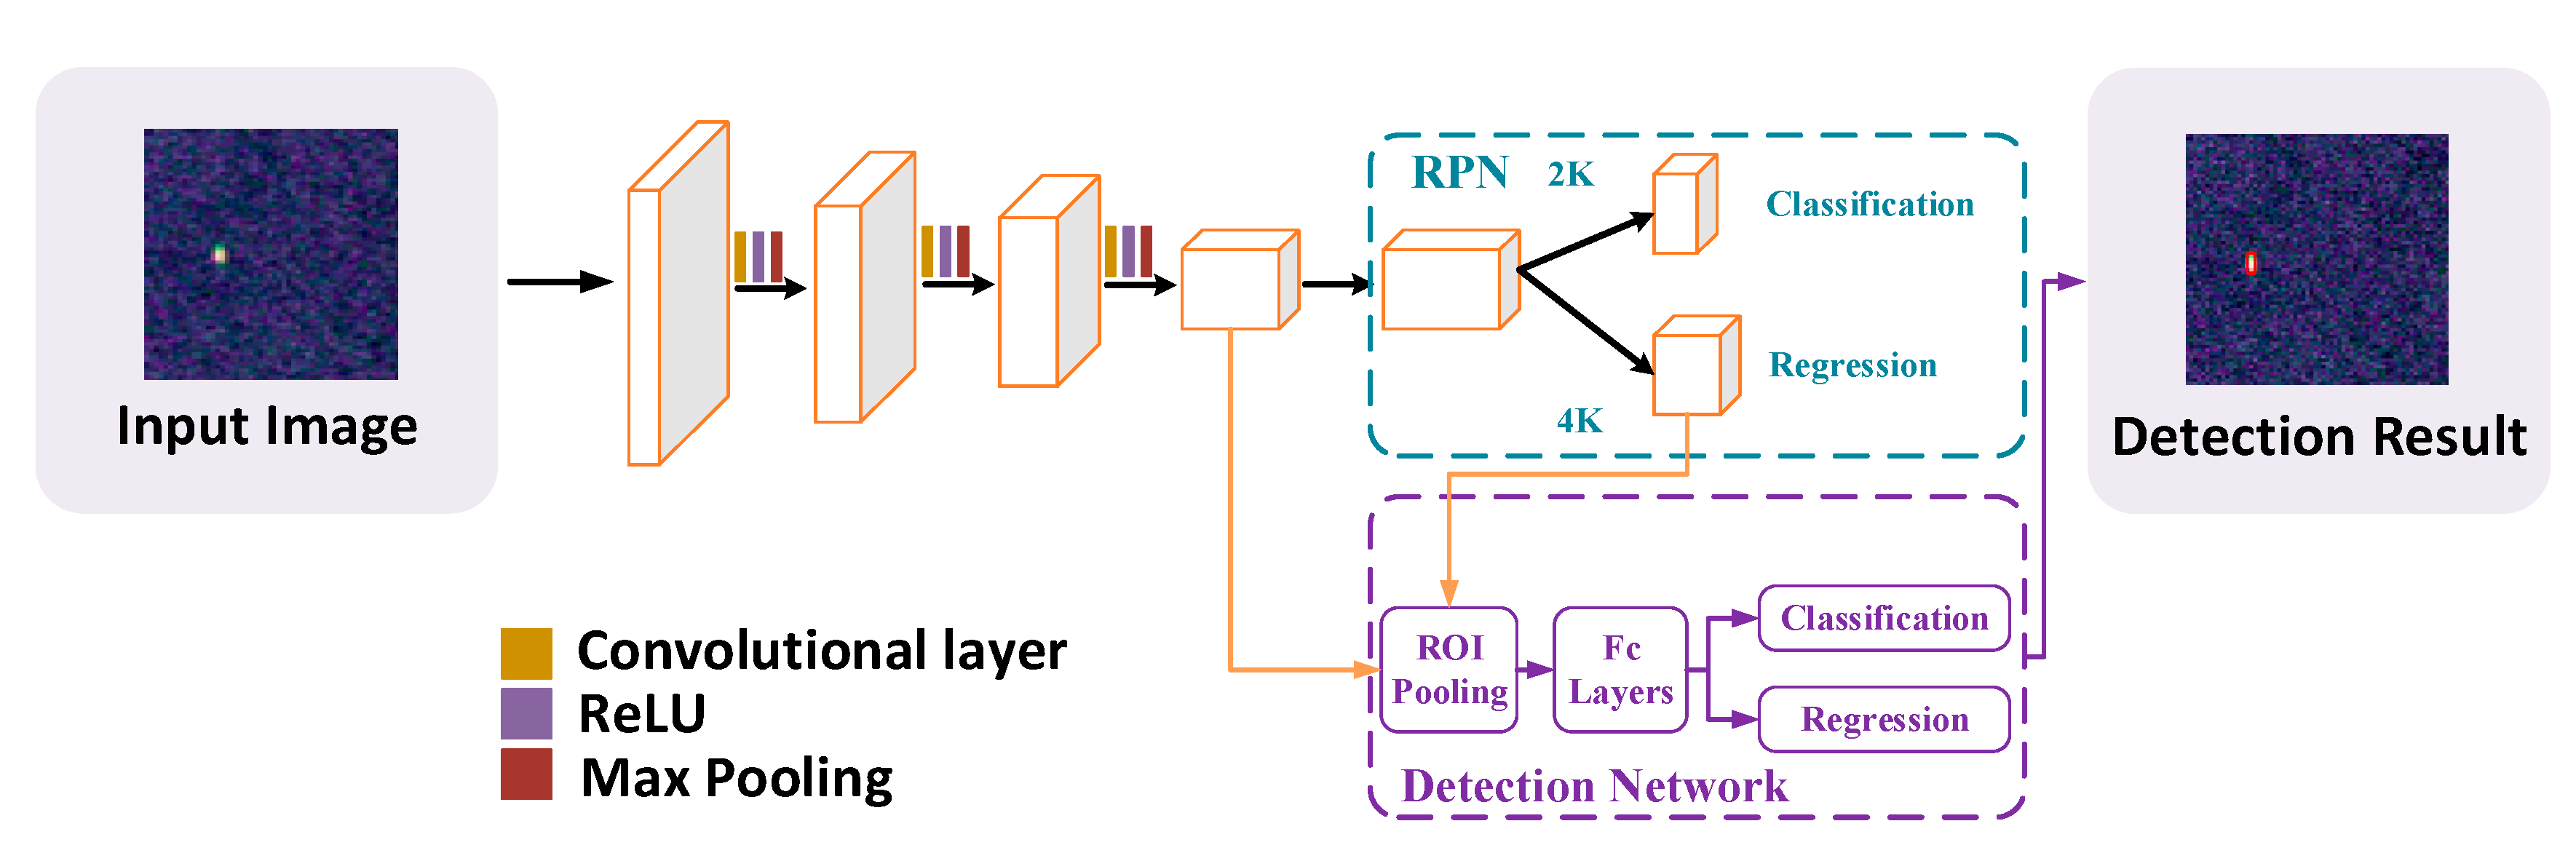
Figure 6.
Structure of the region of interest (ROI) pooling layer, the proposal in the last feature map must be converted into the same size to fit the input of the fully connected layer.
Figure 6.
Structure of the region of interest (ROI) pooling layer, the proposal in the last feature map must be converted into the same size to fit the input of the fully connected layer.
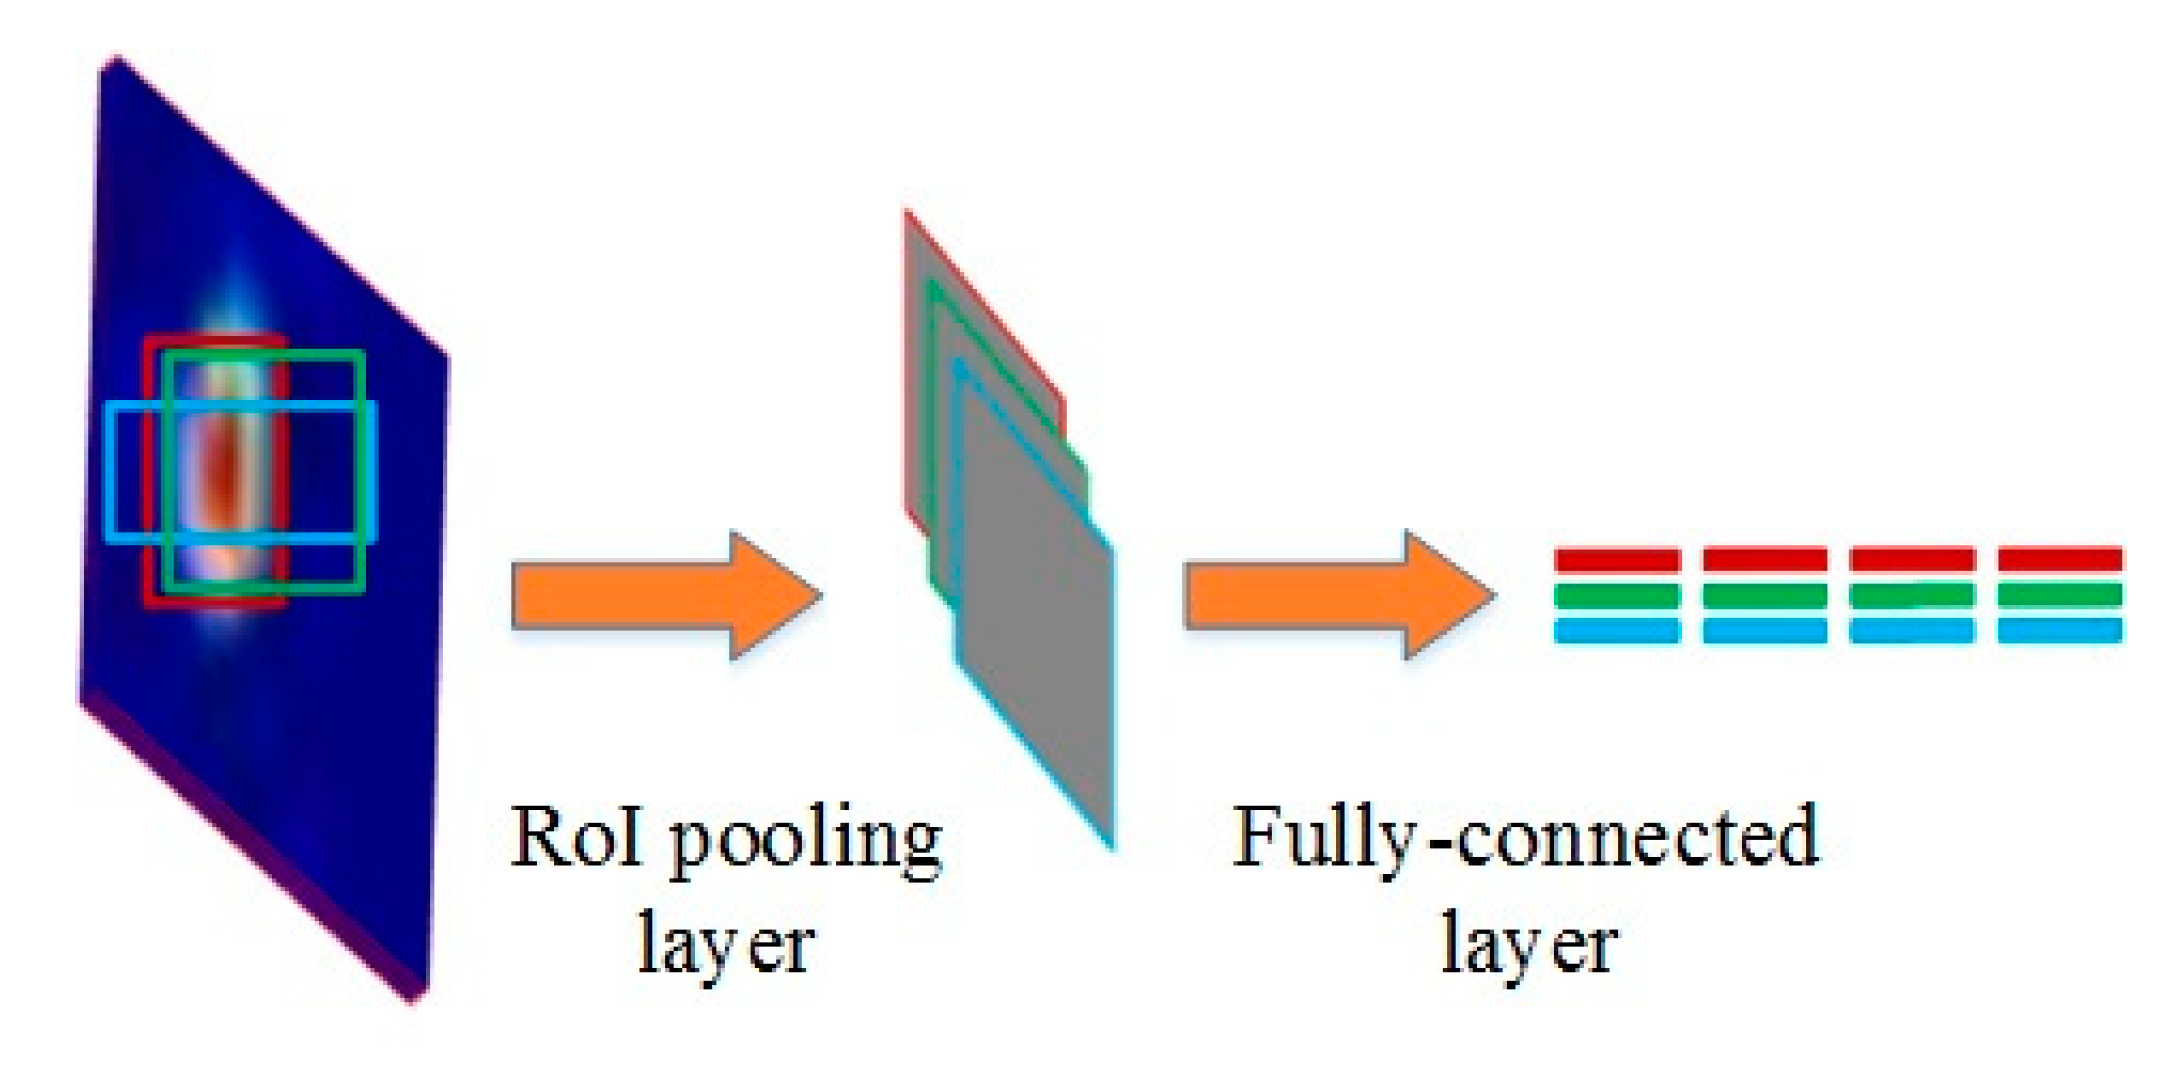
Figure 7.
The modified Faster R-CNN. The left part is region proposal network (RPN) and the layers are connected with solid-lines; the right part is the detection network, and the layers are connected with dash-lines; the proposal generated by RPN serves as input for the detection network. Meanwhile, the RPN and detection network share full-image convolutional features. The Faster R-CNN which generates proposals from Conv3 is termed deep Faster R-CNN and shallow Faster R-CNN generates proposals from Conv2.
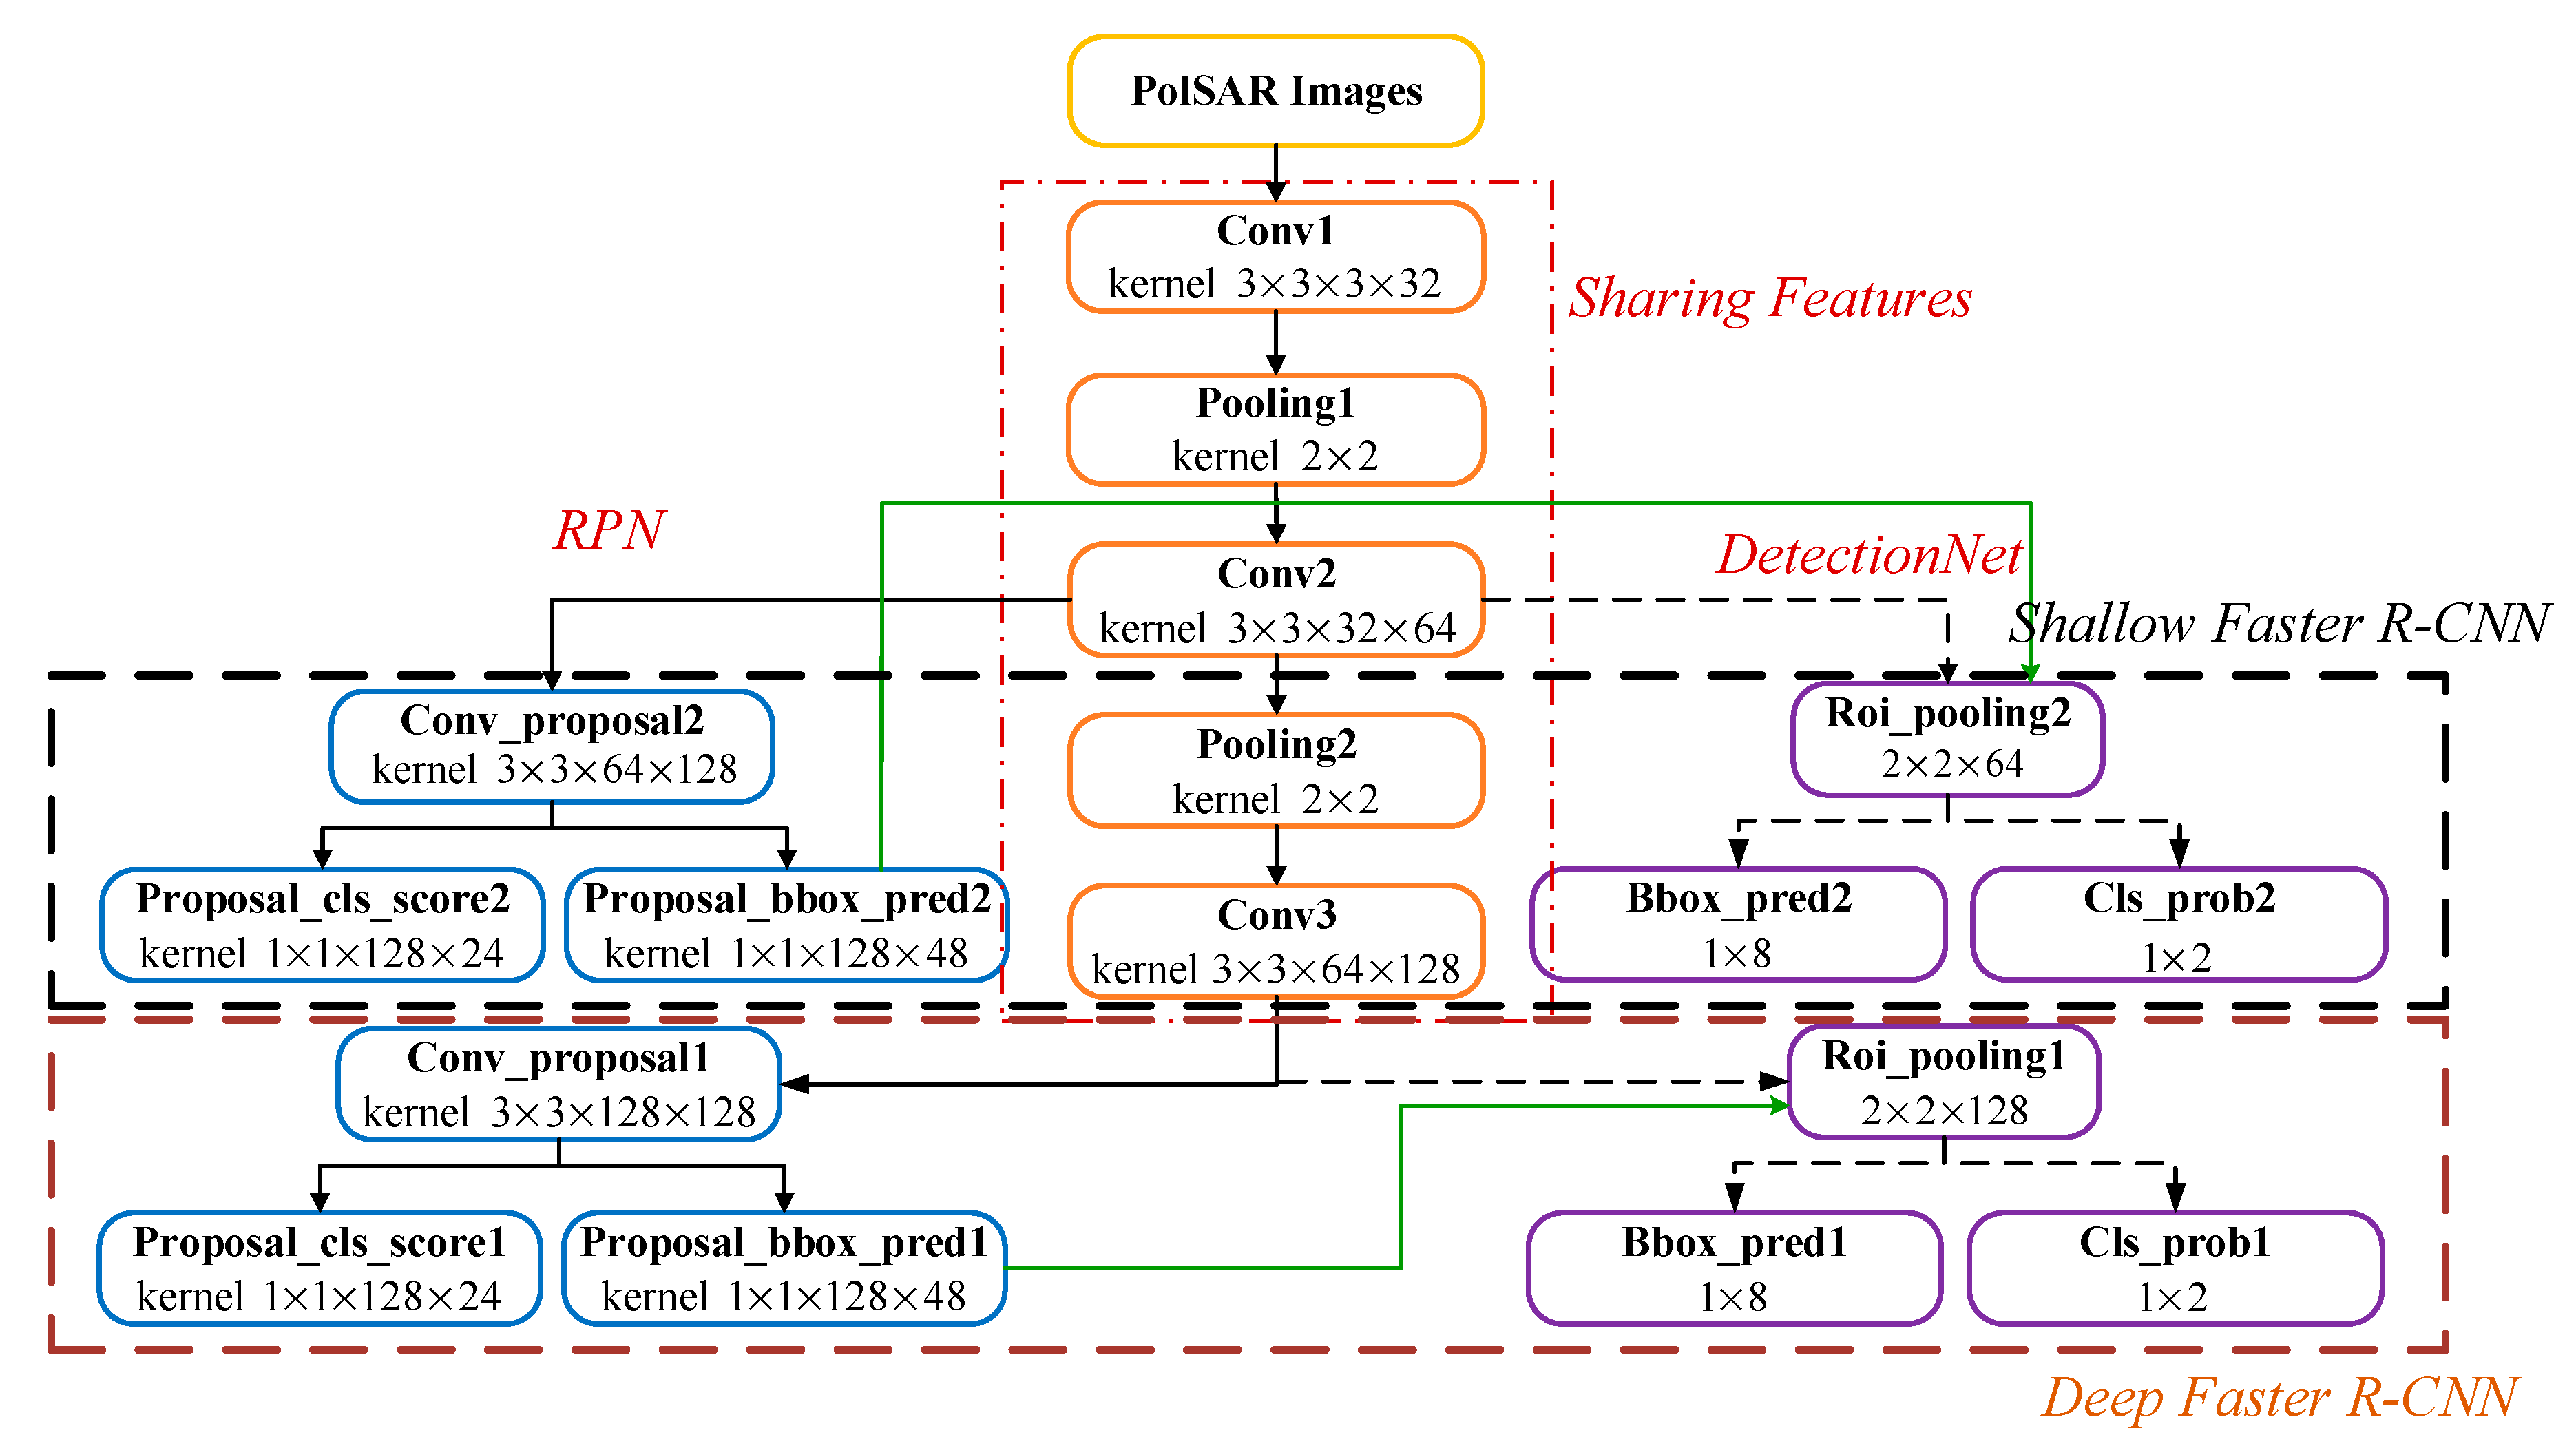
Figure 8.
Stepping window structure of the segment PolSAR image, where the dashed rectangle indicates the edge of the PolSAR image, and the solid rectangle indicates the non-overlapping block-shifting segmentation window.
Figure 8.
Stepping window structure of the segment PolSAR image, where the dashed rectangle indicates the edge of the PolSAR image, and the solid rectangle indicates the non-overlapping block-shifting segmentation window.
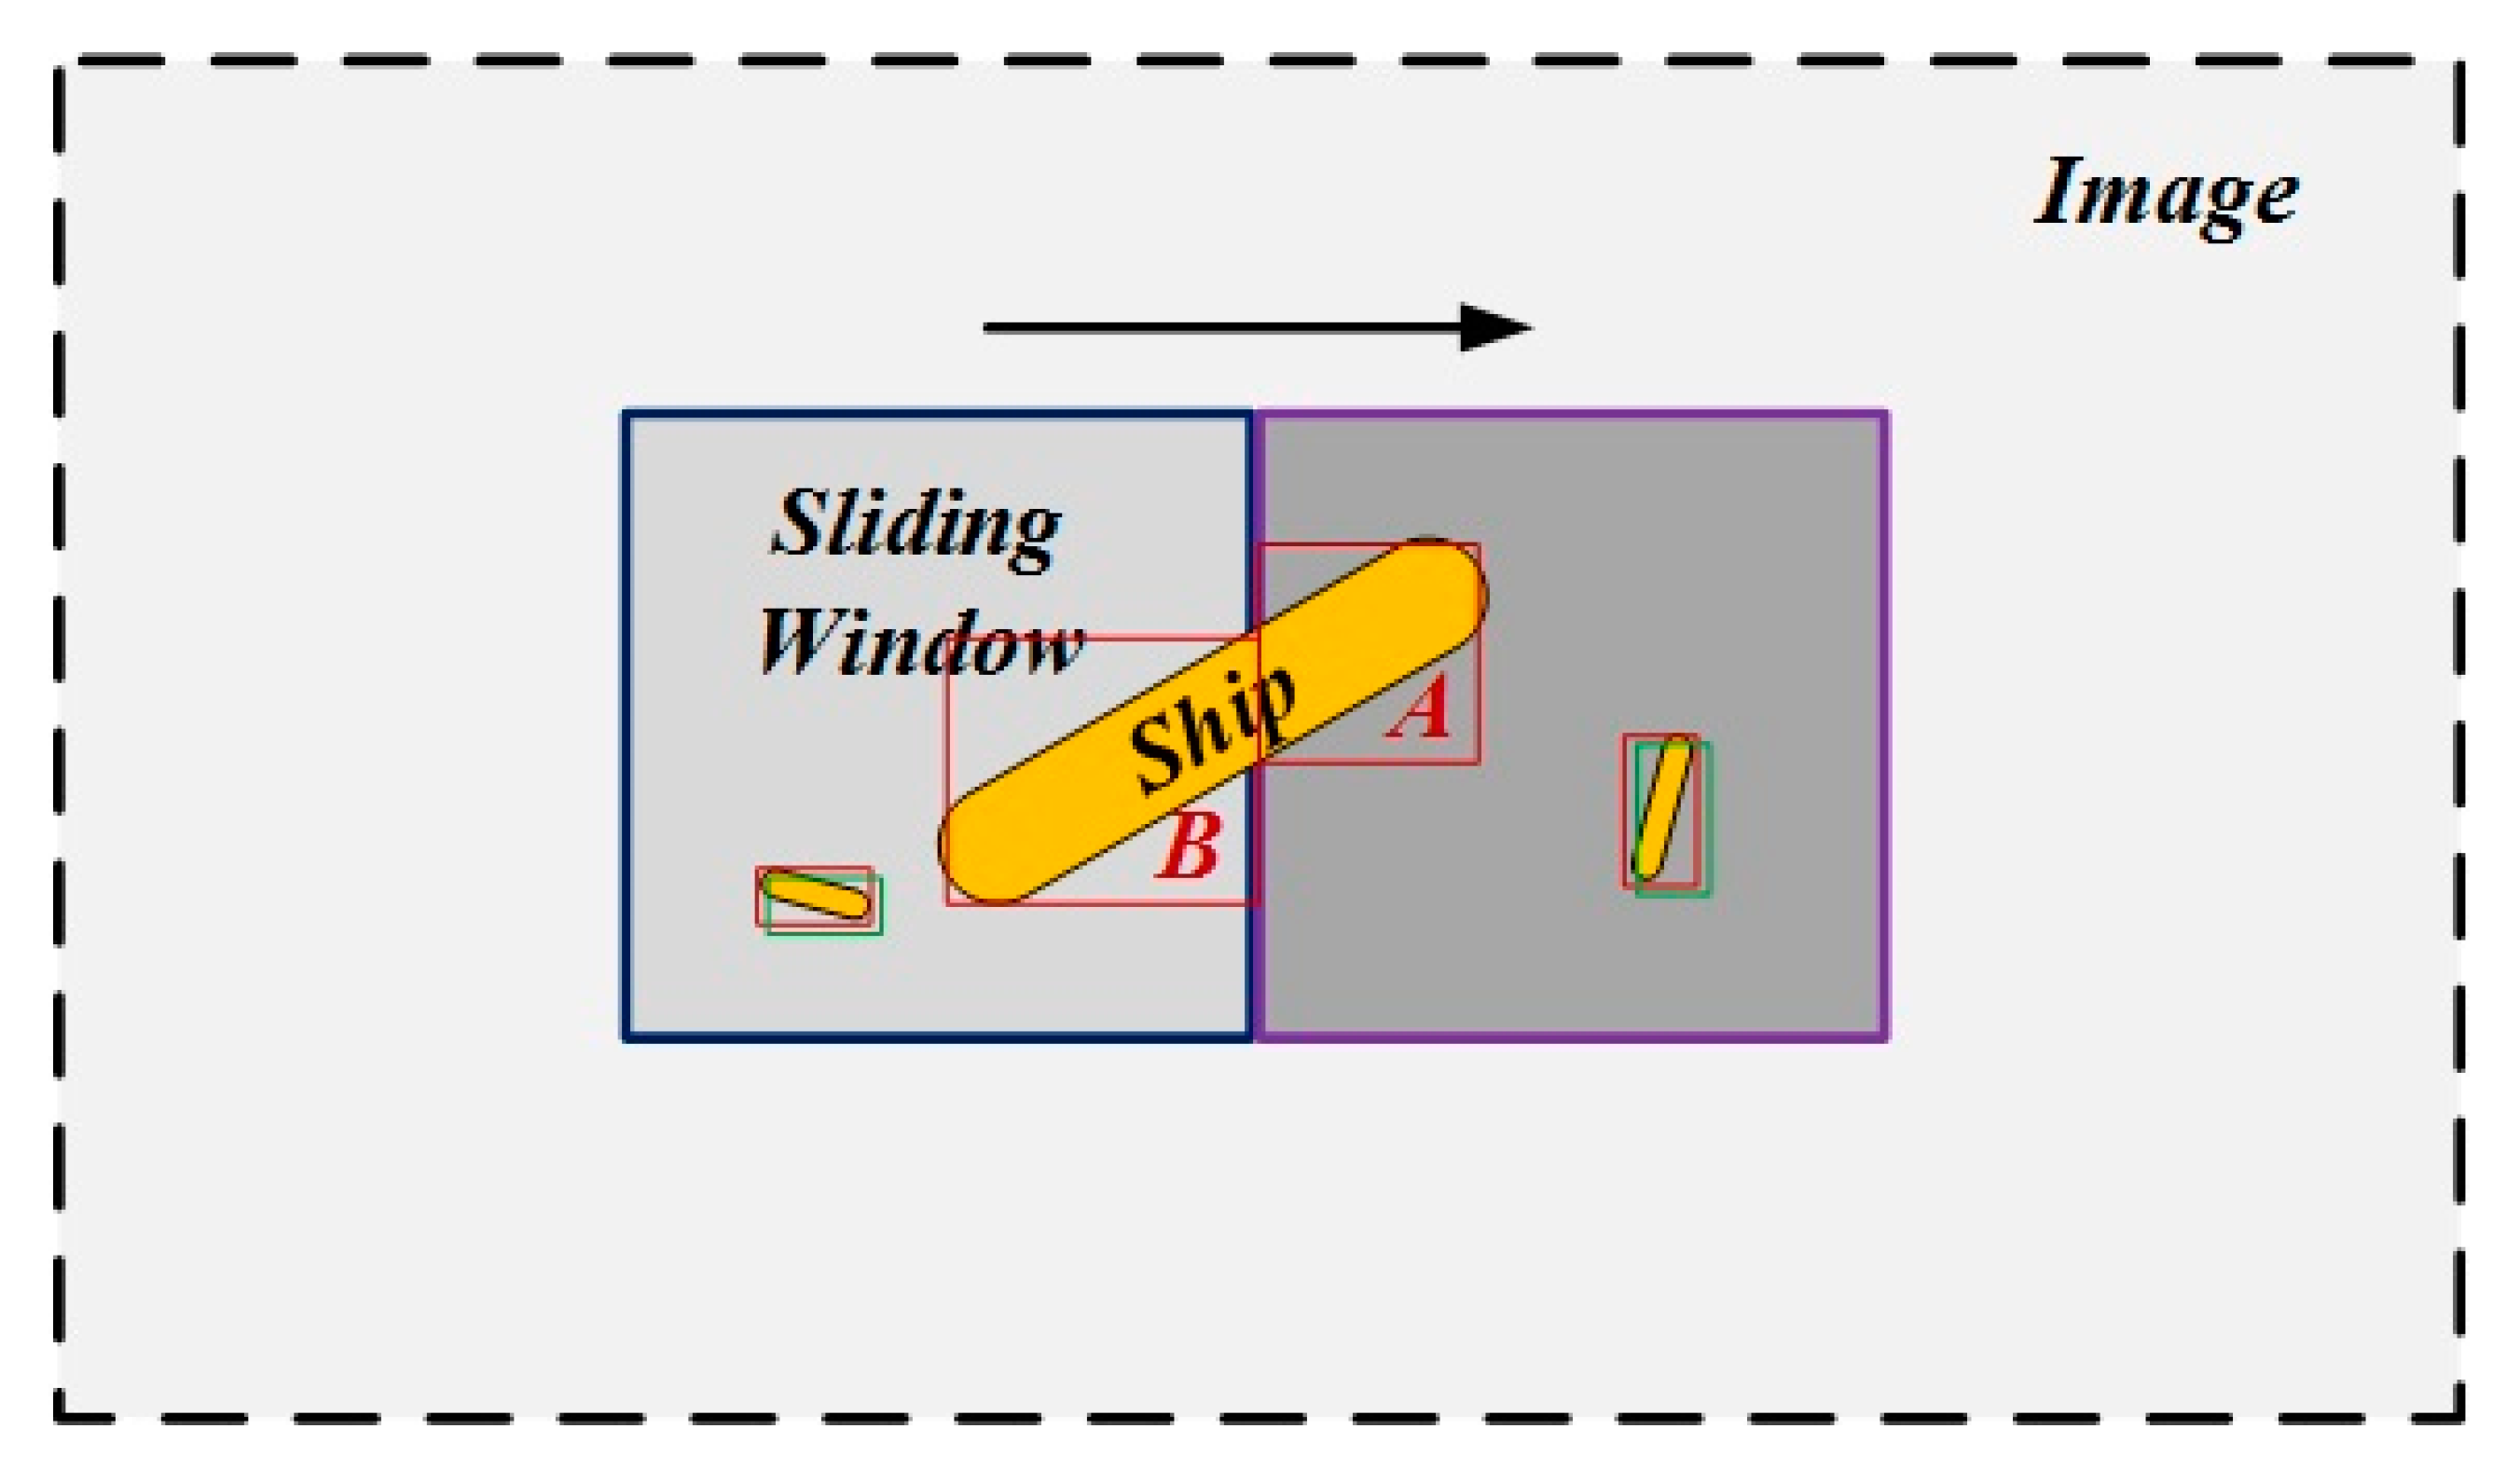
Figure 9.
Pauli RGB image of the airborne synthetic aperture radar (AIRSAR) Japan dataset.
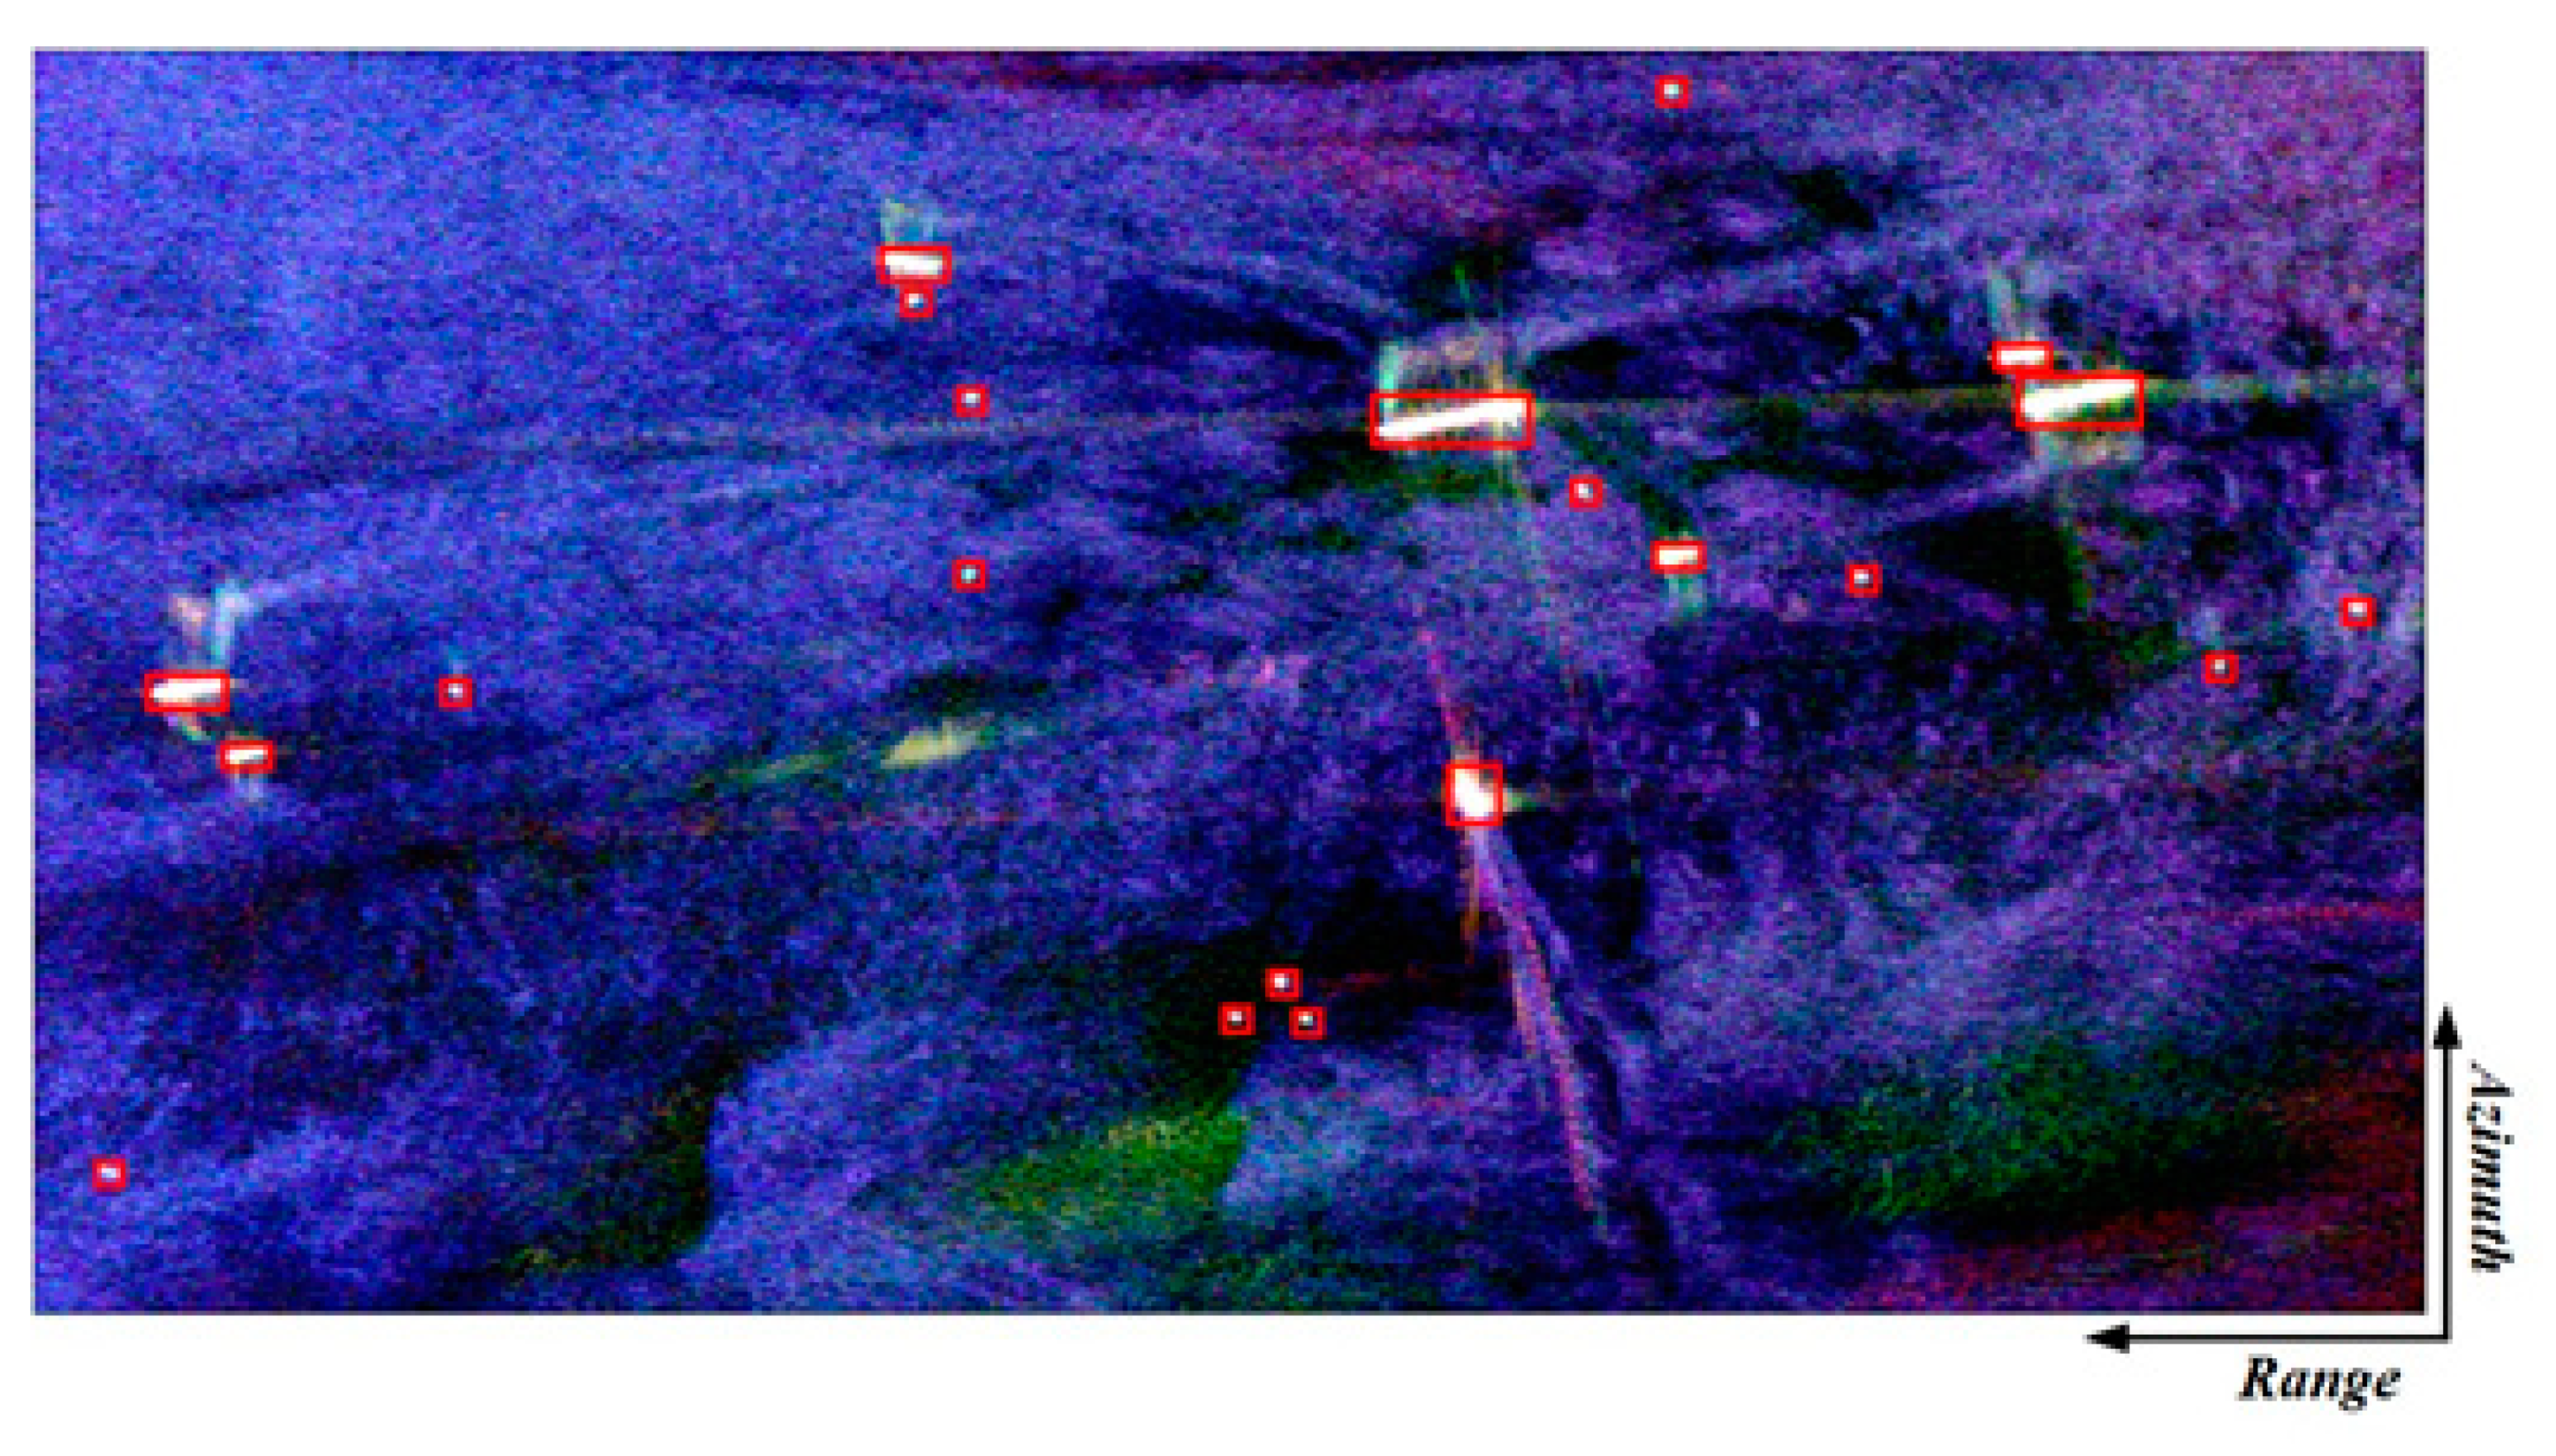
Figure 10.
Ship detection result of partial samples, where the red and green rectangles are generated from the last two convolutional layers, respectively. (a–d) show the ship detection results of the Faster R-CNN for original PolSAR image shown in Figure 9, and (e–h) show the ship detection results of the Faster R-CNN for PolSAR images after multi-look processing with 9 looks.
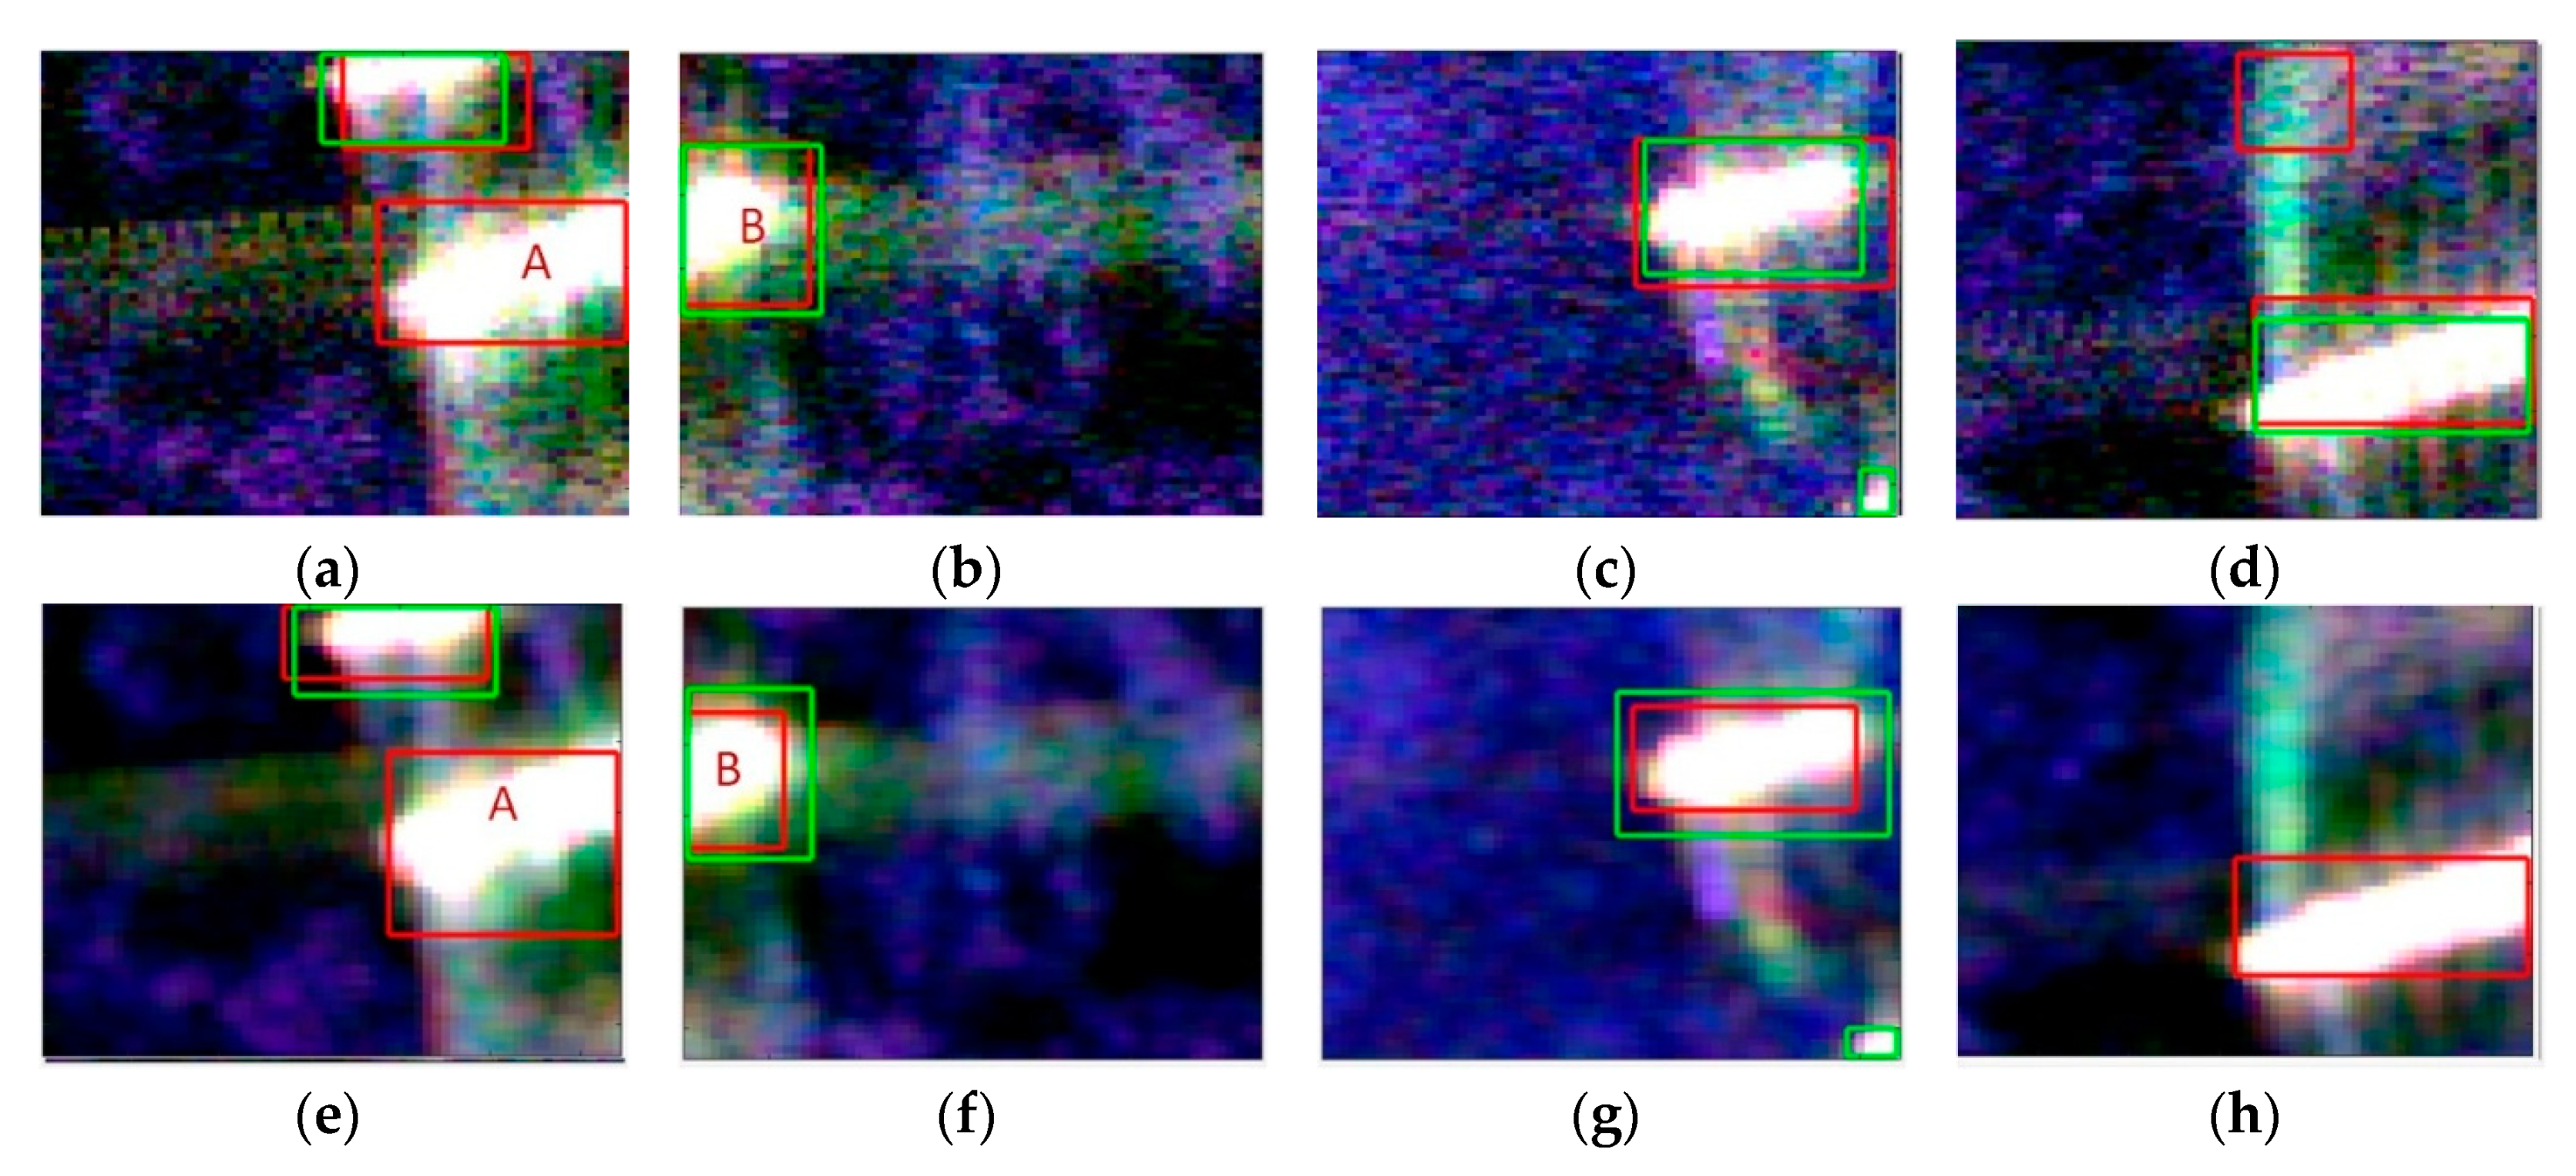
Figure 11.
Ship detection results of (a) the shallow Faster R-CNN detector, (b) the deep Faster R-CNN detector, (c) the proposed ship detector, (d) the modified constant false alarm rate (CFAR) detector, (e) the SPWH detector, (f) the shallow Faster R-CNN detector using Conv1 in RPN, and (g) the fully convolutional network-based ship detector.
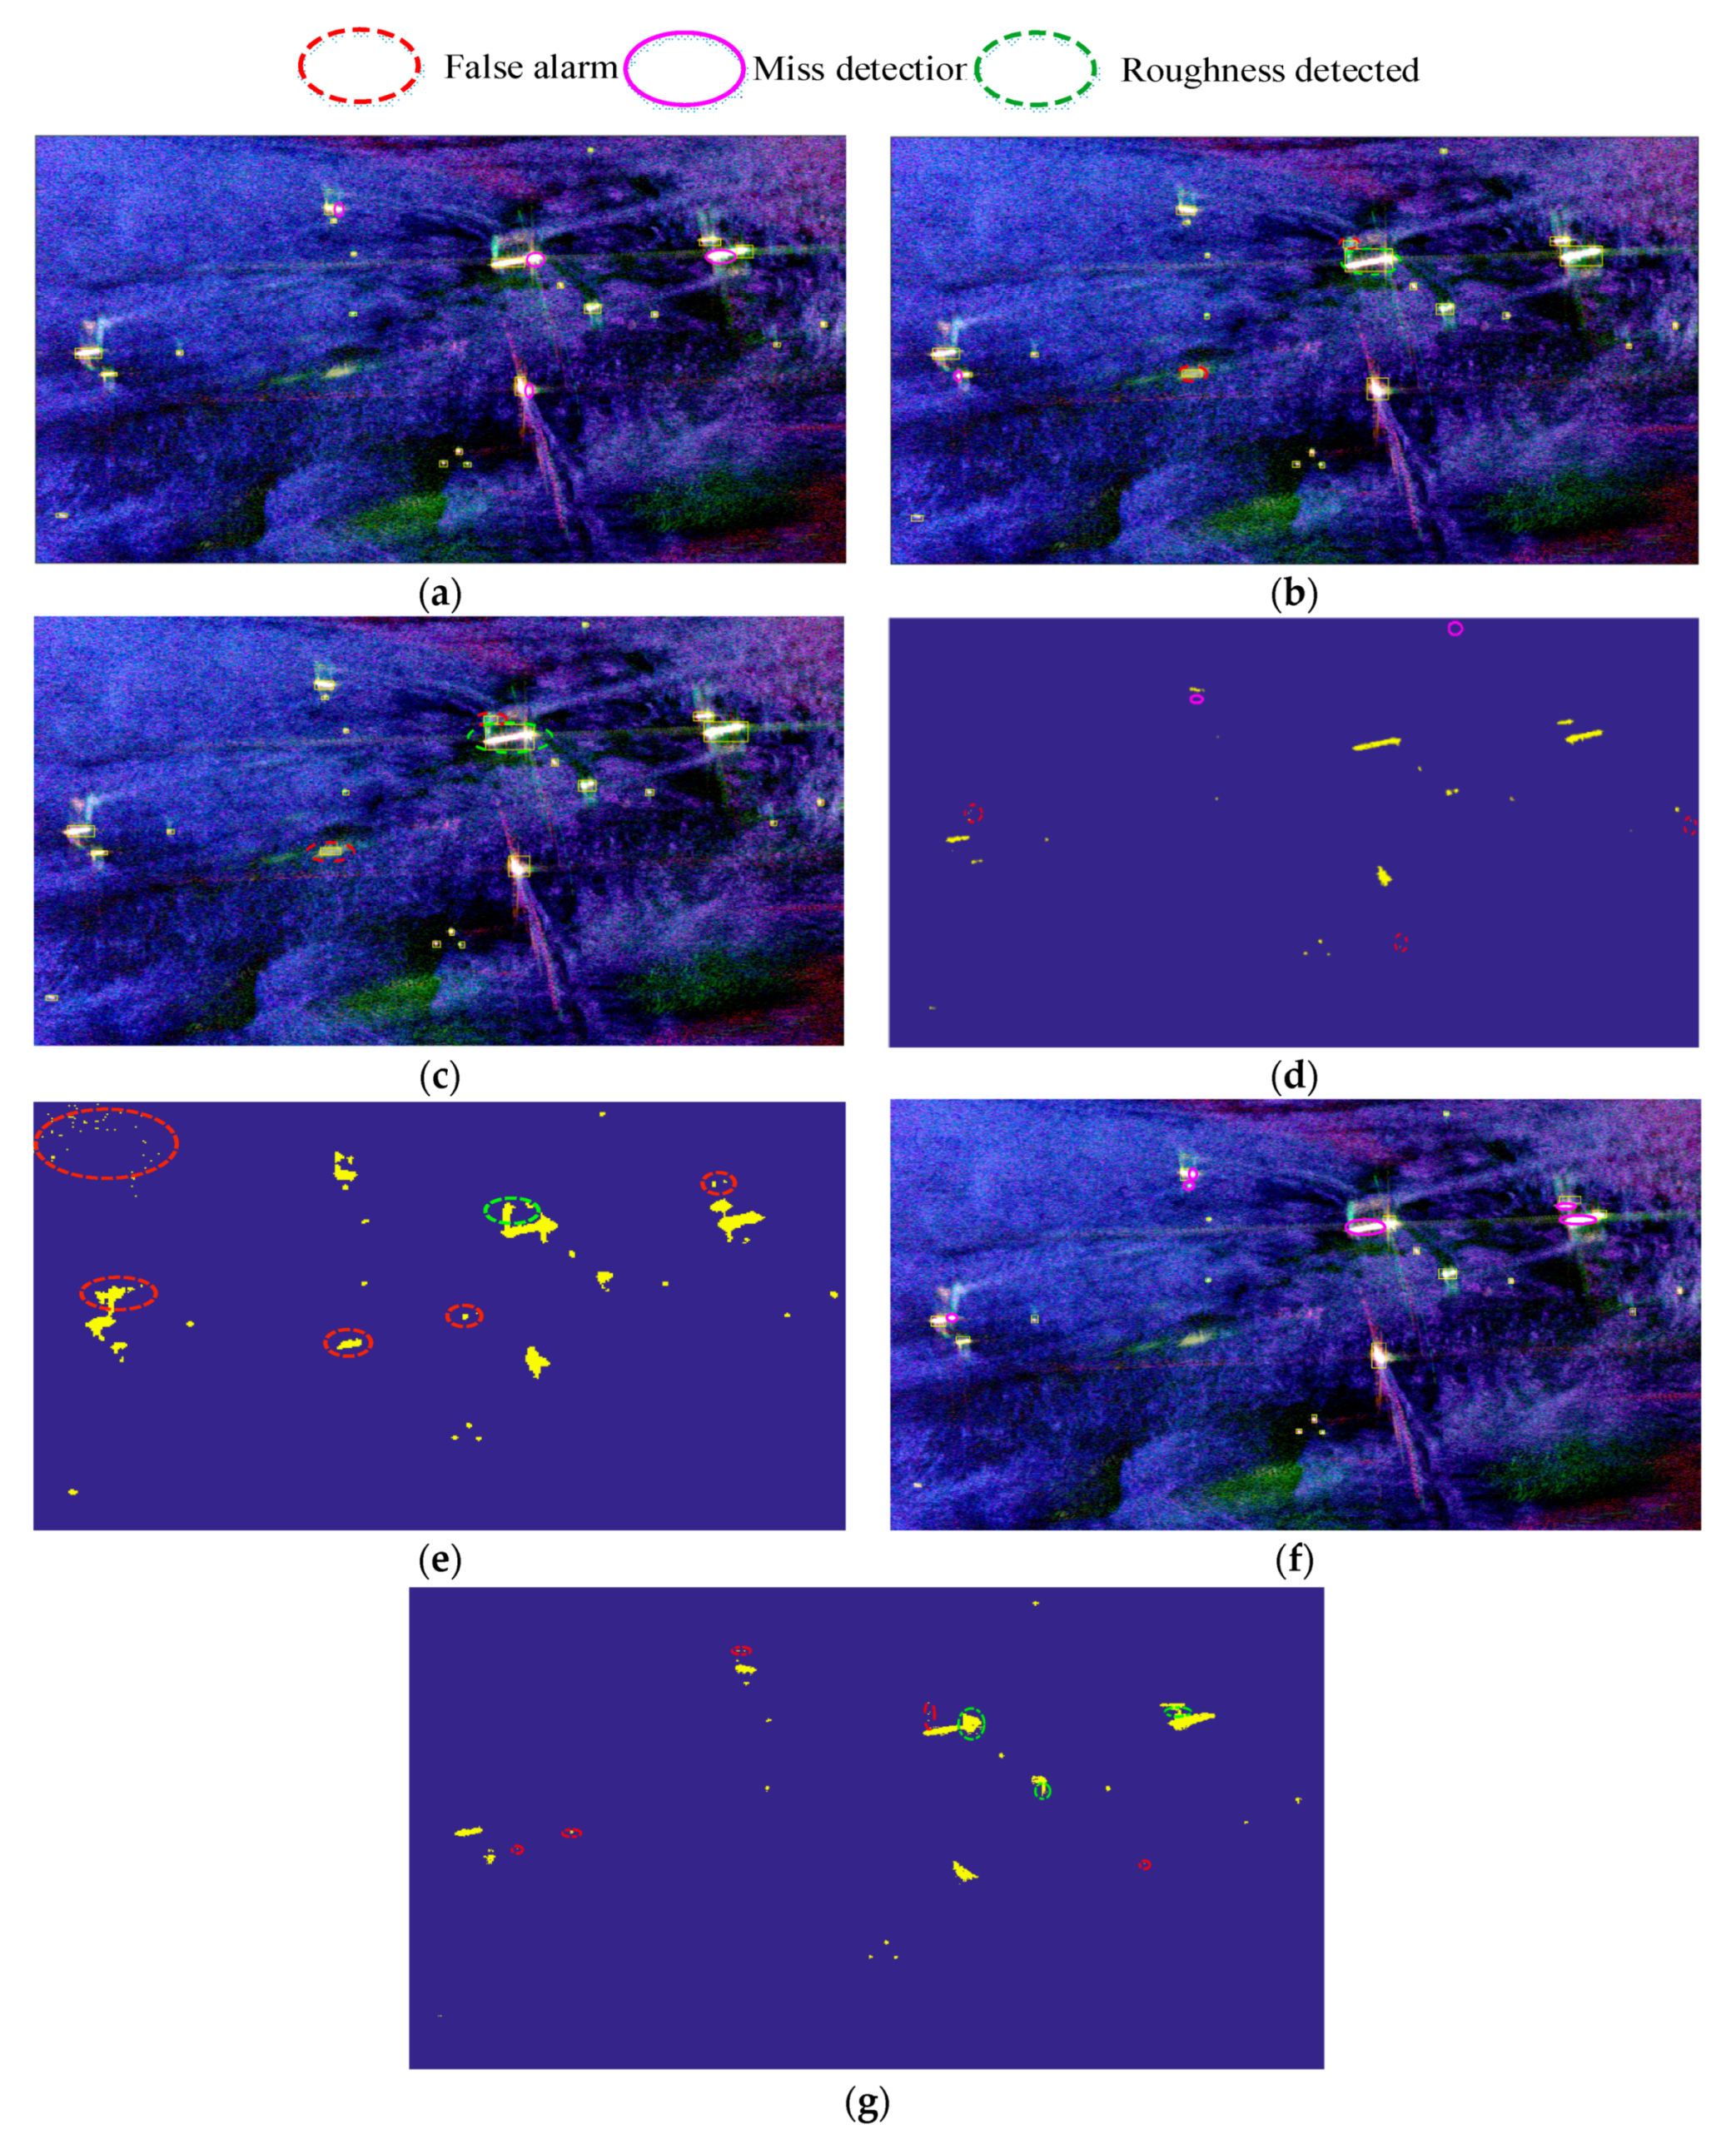
Figure 12.
Ship detection results of the proposed detector with training data generated from (a) Cloude decomposition and (b) Huynen decomposition.
Figure 12.
Ship detection results of the proposed detector with training data generated from (a) Cloude decomposition and (b) Huynen decomposition.
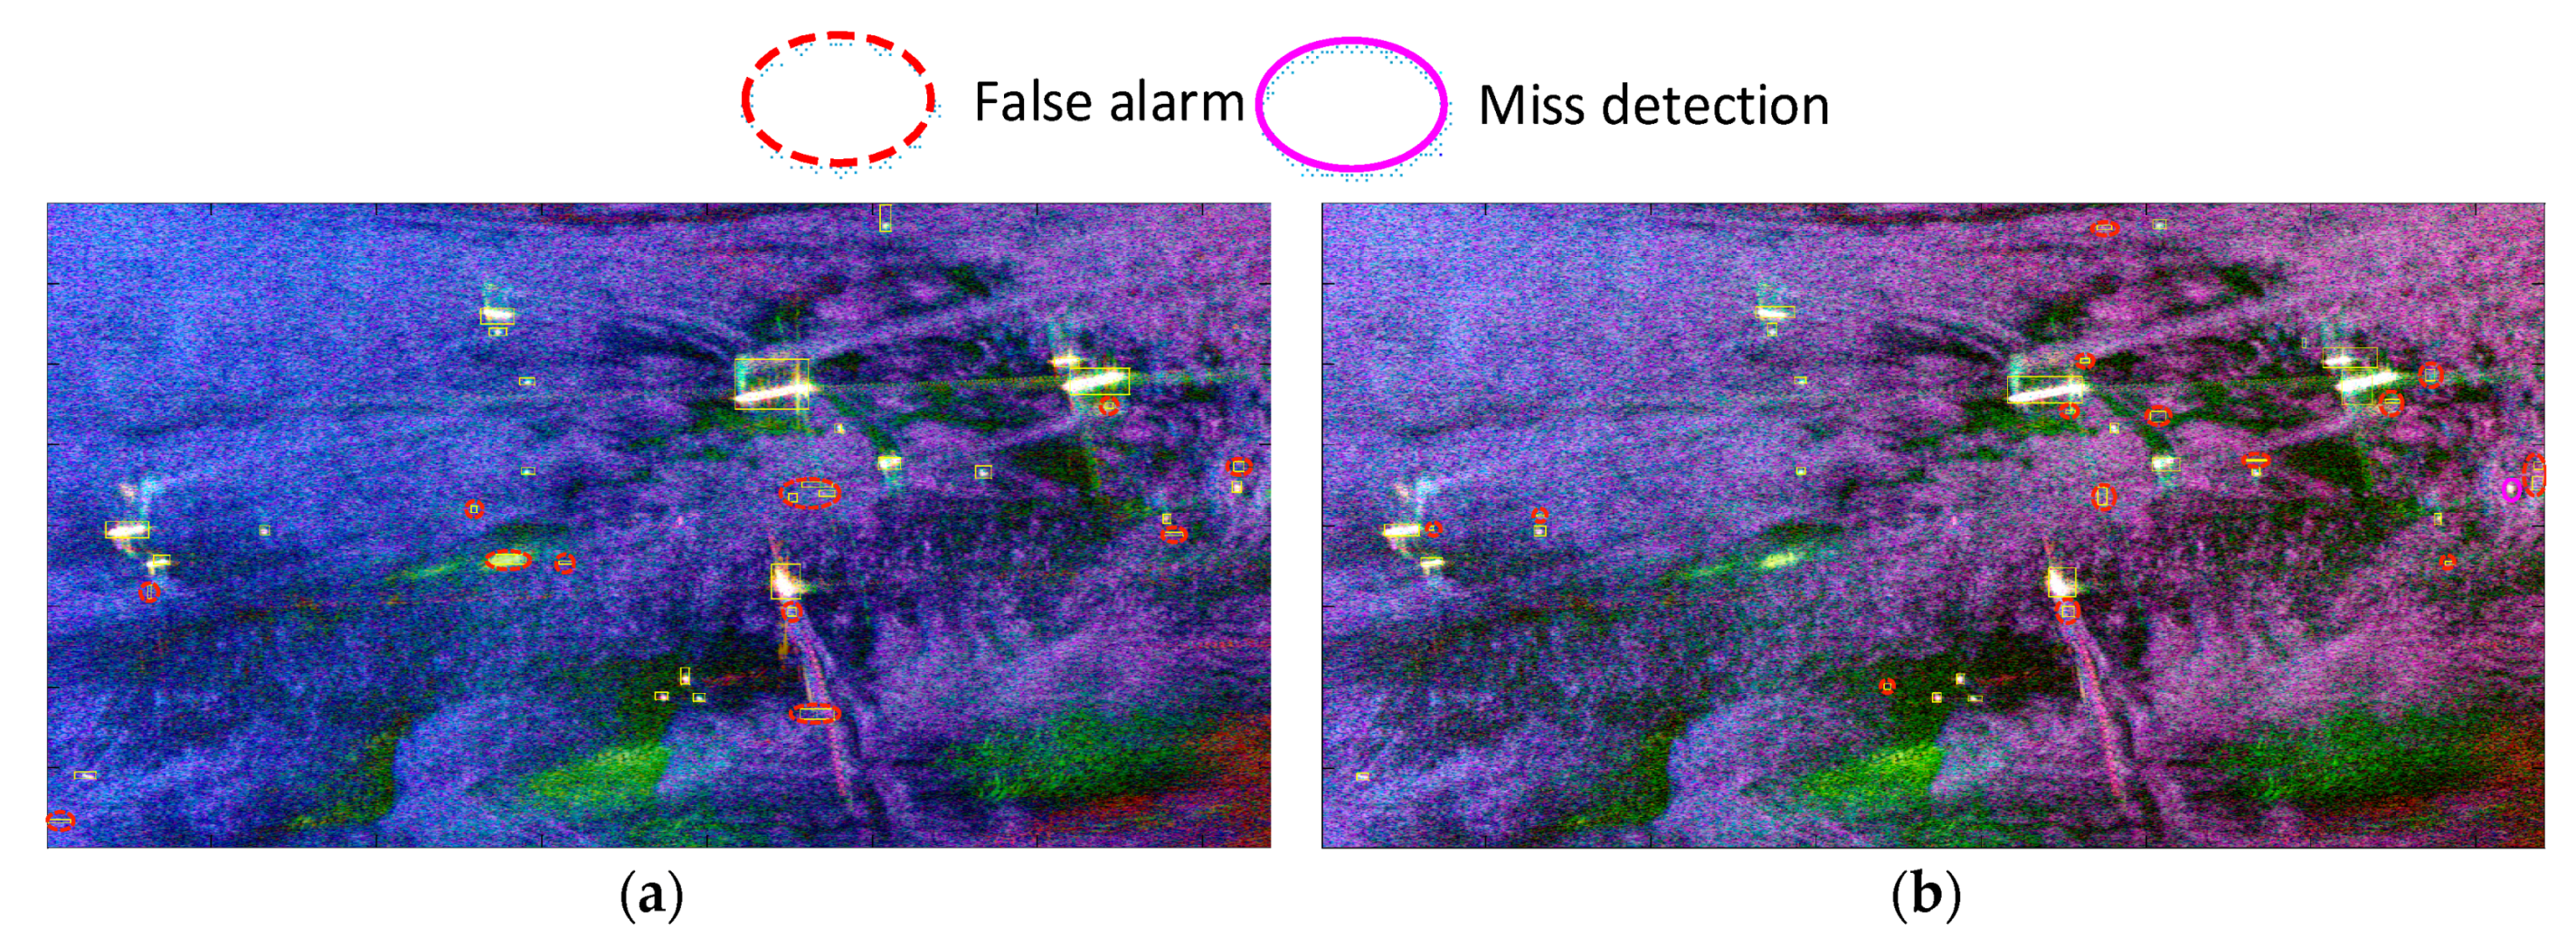
Figure 13.
Ship detection results of the proposed detector after multi-look processing with (a) 9 looks, (b) 25 looks, and (c) 49 looks.
Figure 13.
Ship detection results of the proposed detector after multi-look processing with (a) 9 looks, (b) 25 looks, and (c) 49 looks.
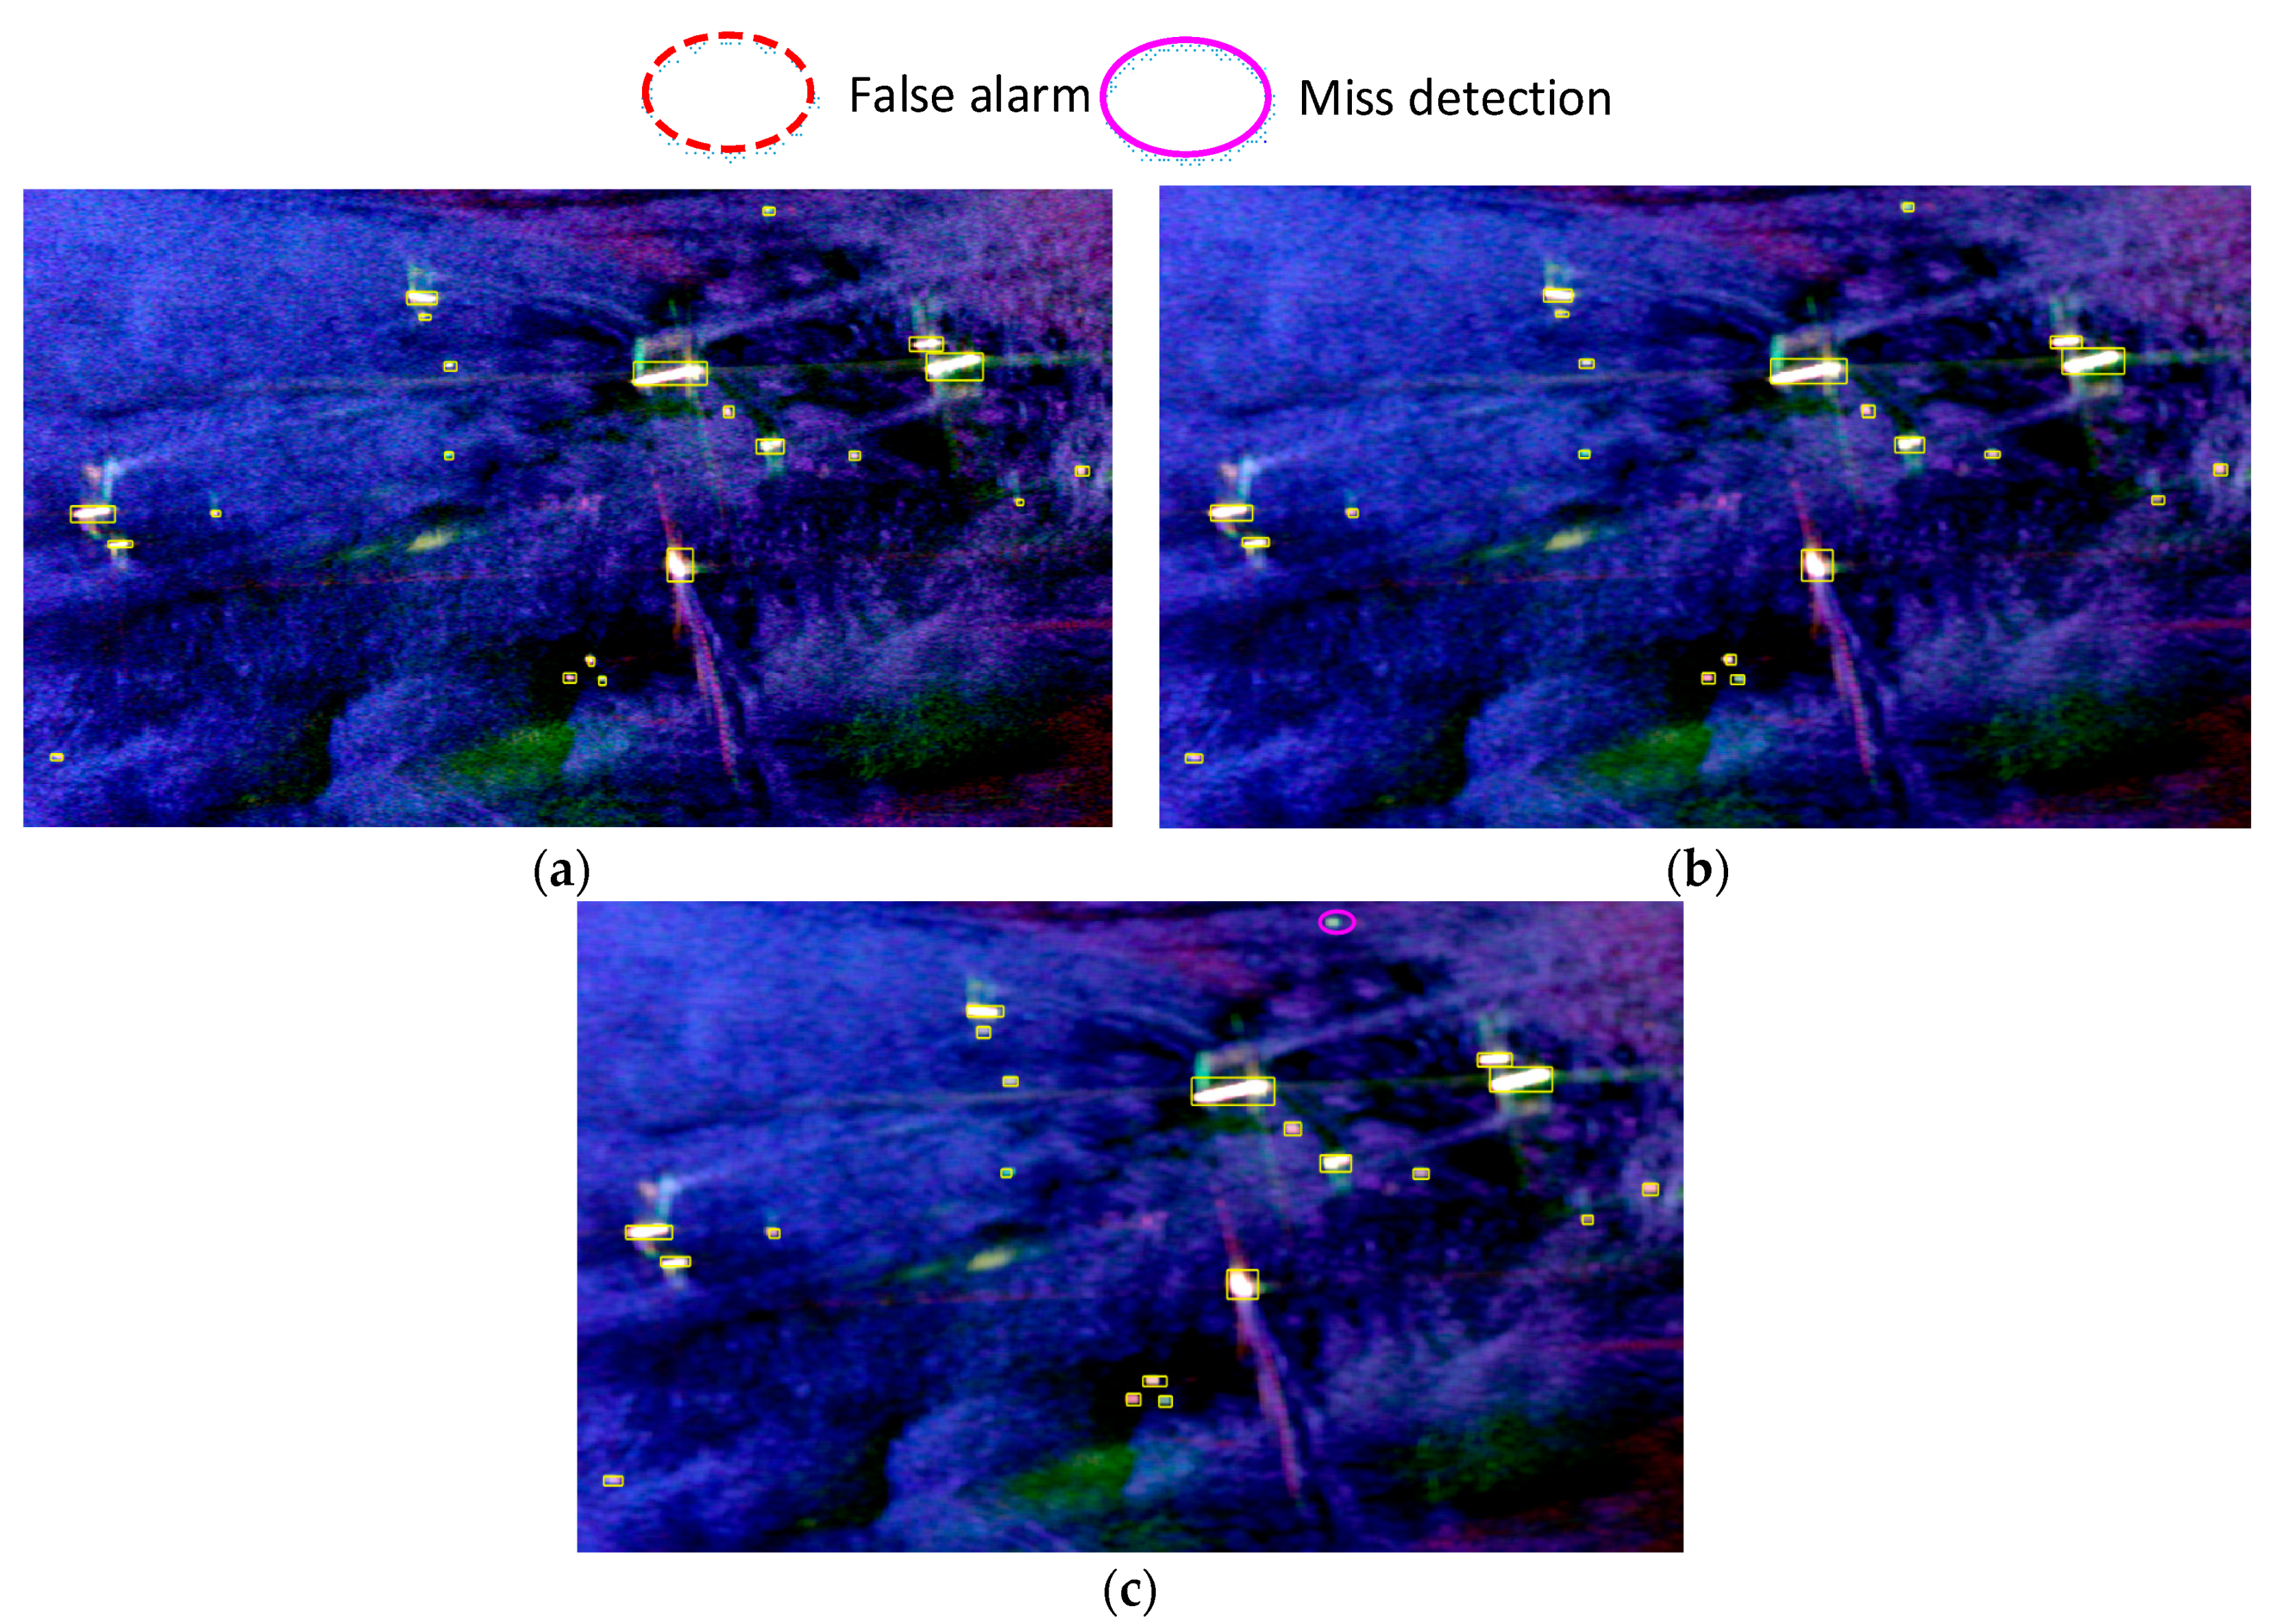
Figure 14.
C-band Japan dataset. (a) Pauli RGB image. (b) Detection result of the shallow Faster R-CNN detector. (c) Detection result of the deep Faster R-CNN detector. (d) Detection result of the proposed detector. (e) Detection result of the proposed detector after multi-look processing with 9-looks, (f) Detection result of the modified CFAR detector, and (g) the fully convolutional network based-ship detector.
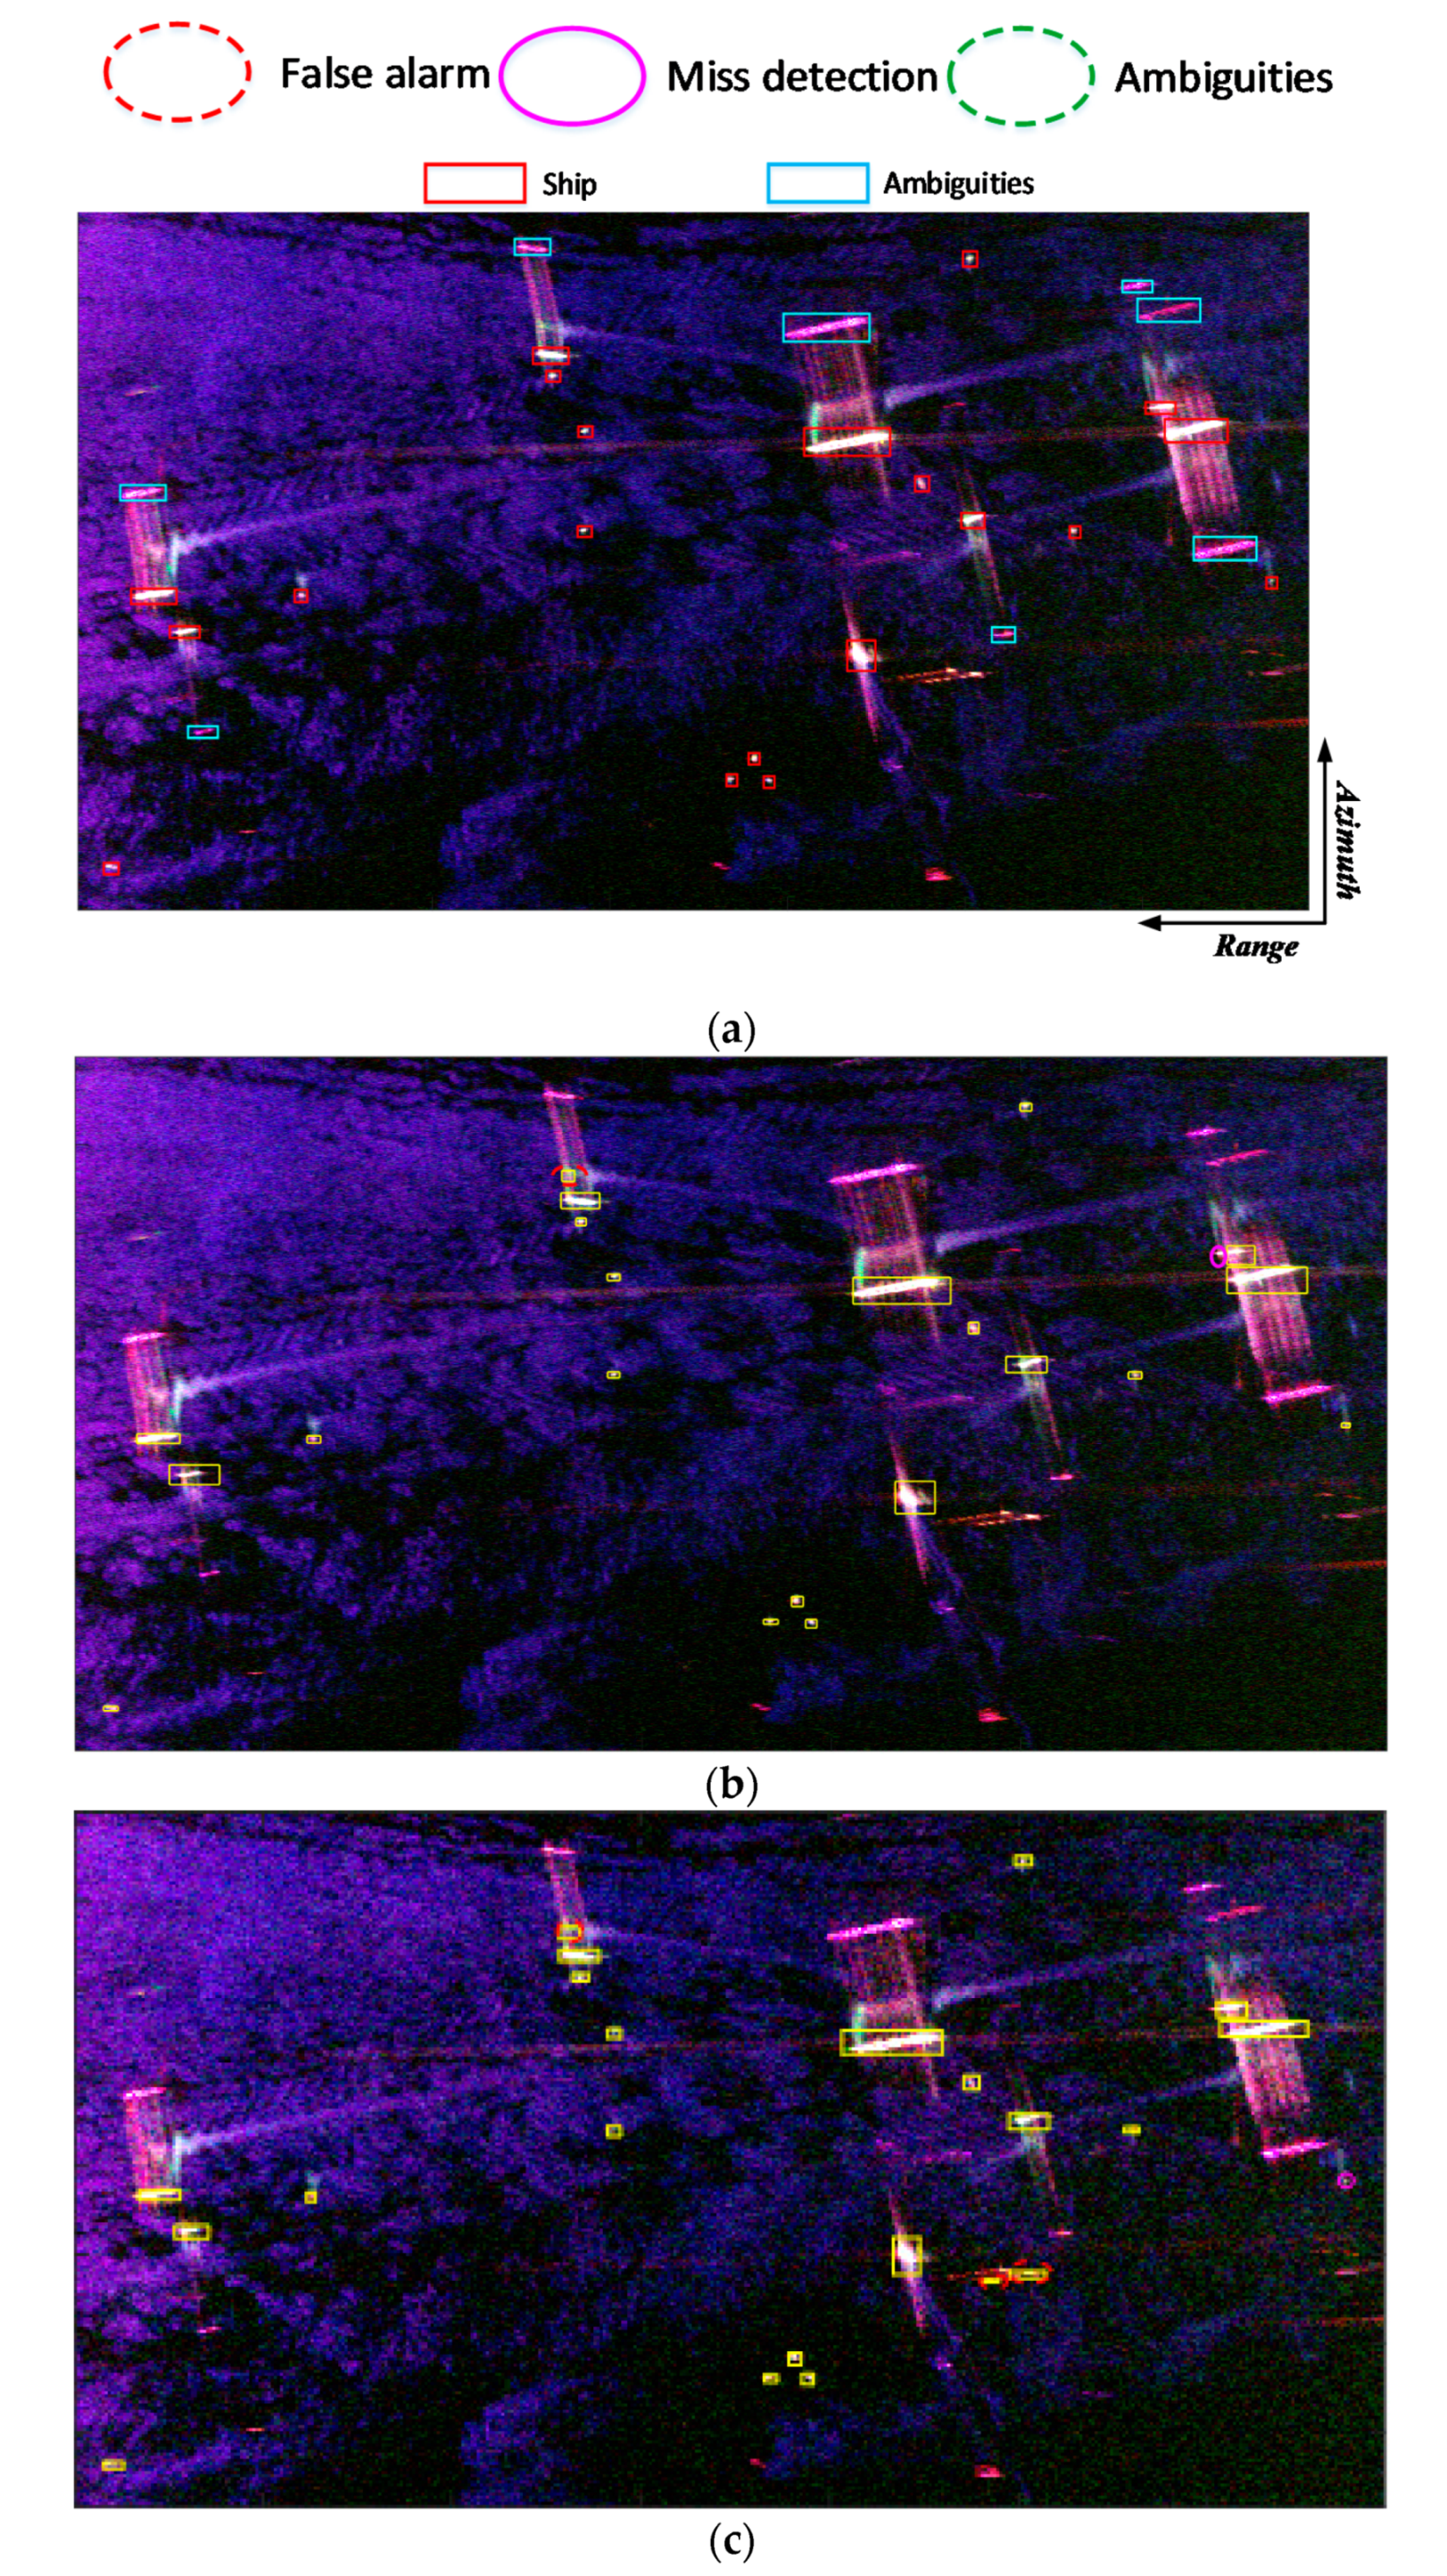
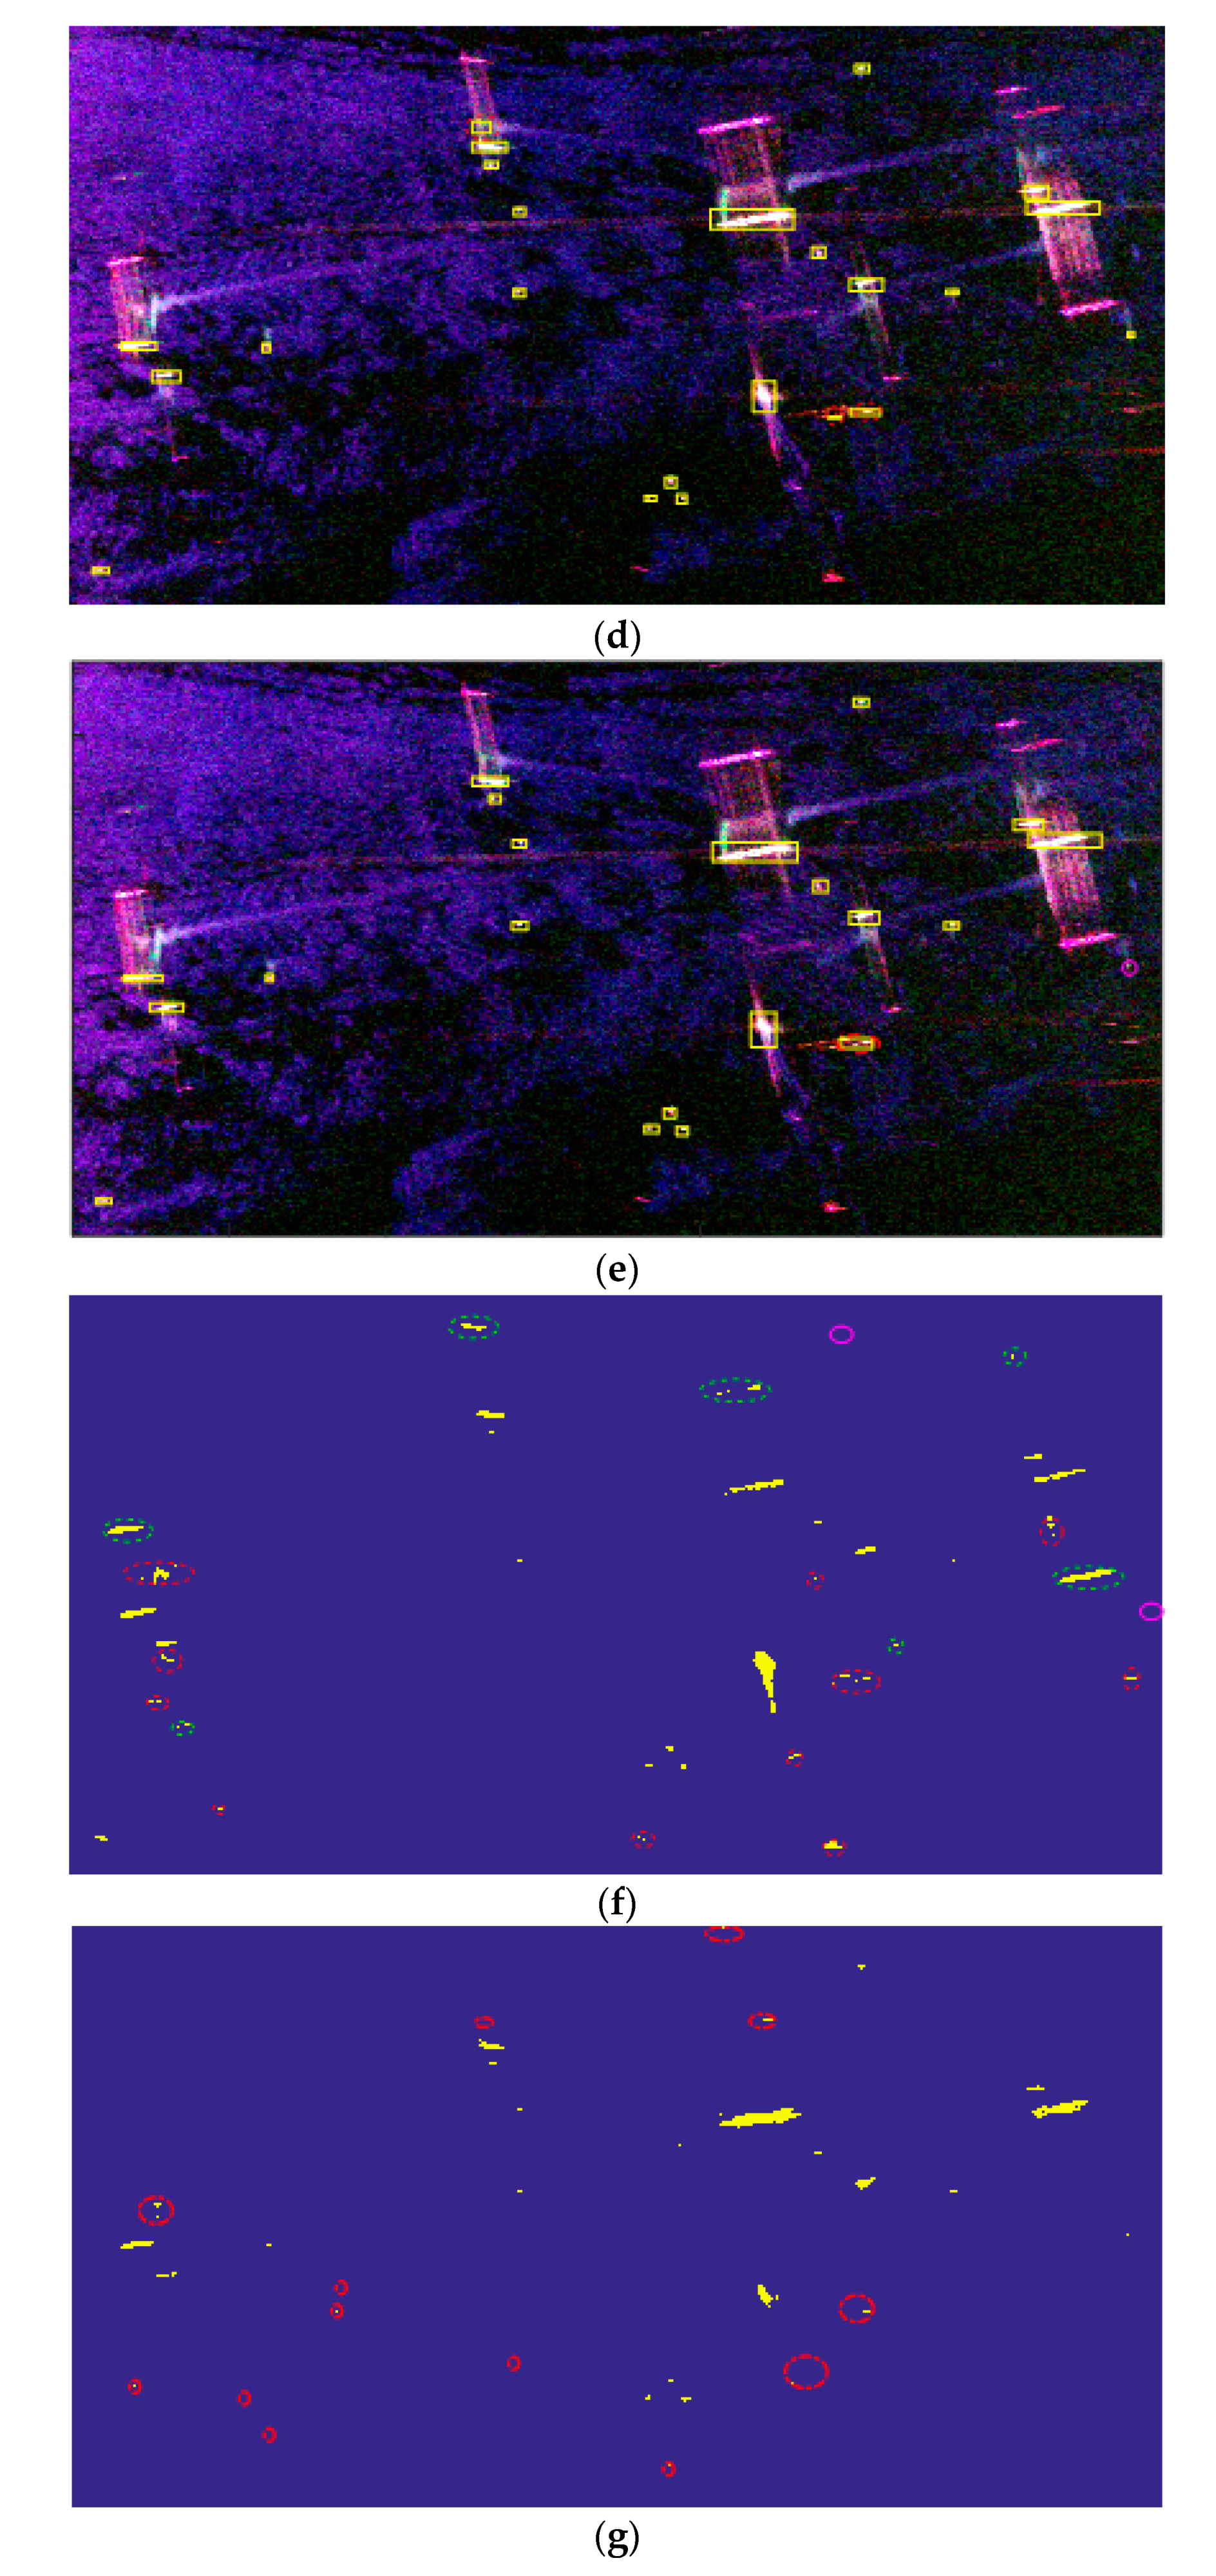
Figure 15.
Pauli RGB image of the Gulfco area A dataset.
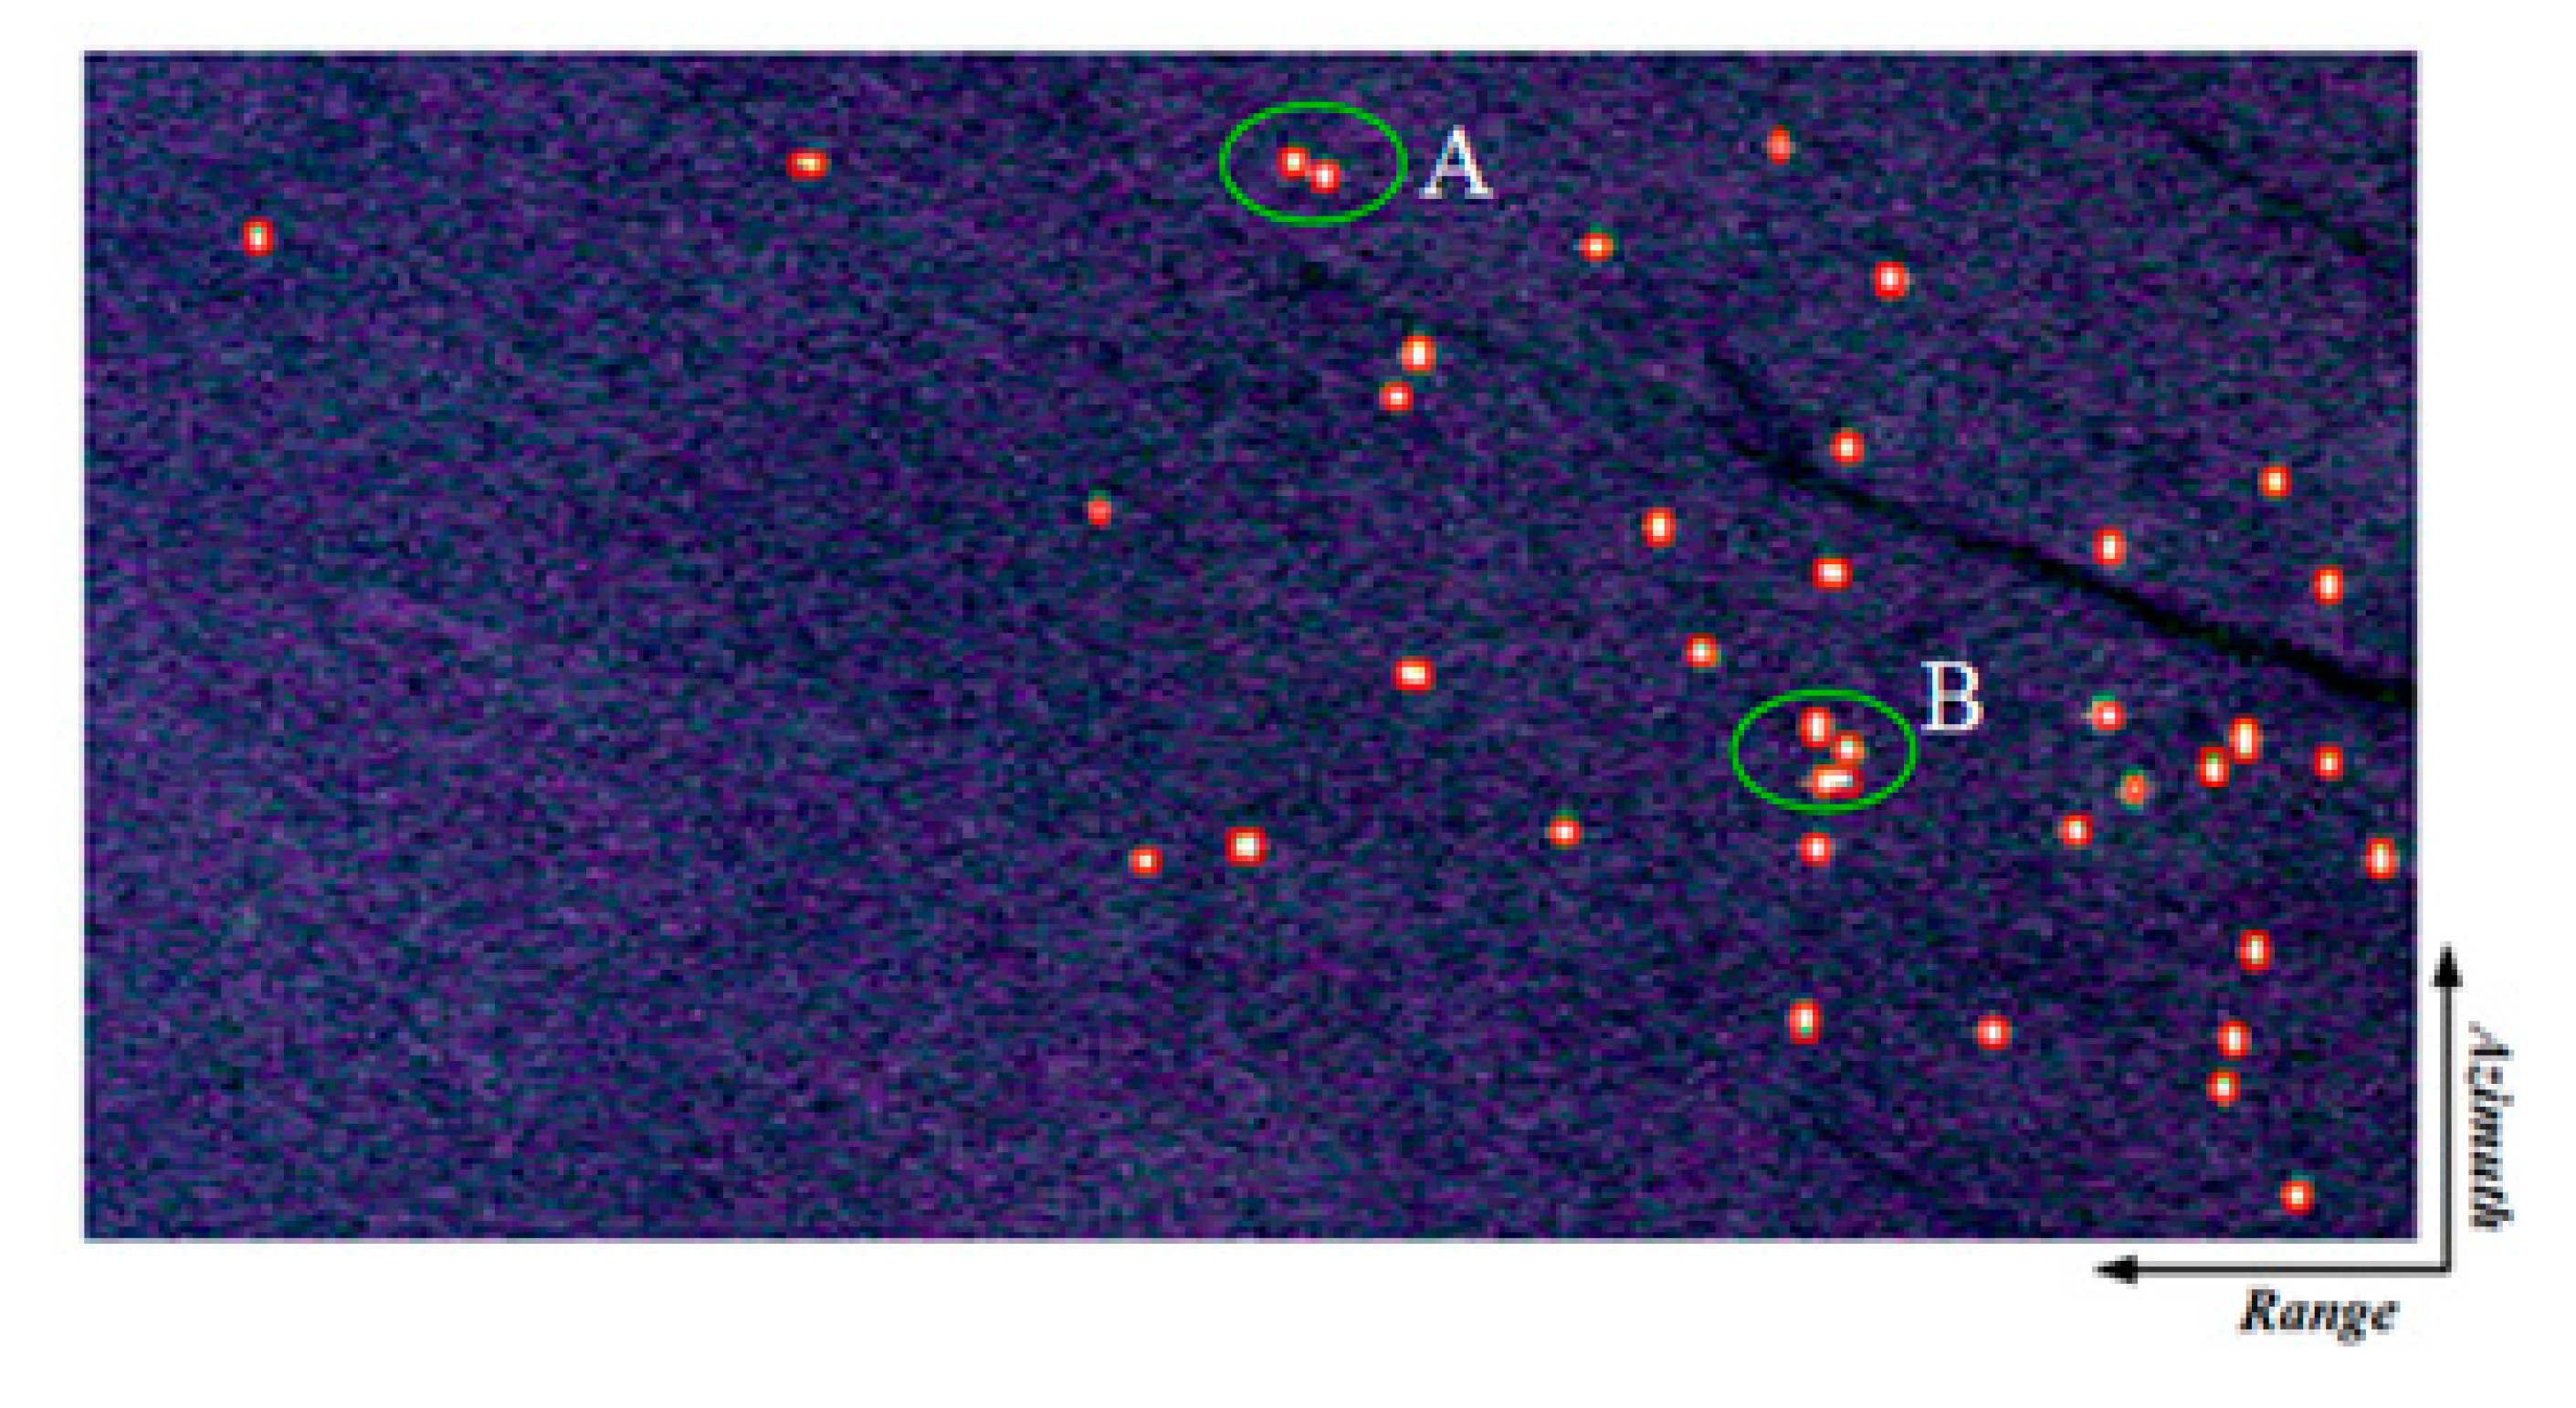
Figure 16.
Ship detection result of partial samples, the red and green rectangles denote the bounding boxes generated from feature maps of the last two convolutional layers, respectively. (a) shows the zoomed version of ship detection result of the area marked with A in the Figure 15, and (b) shows the zoomed version of ship detection result of the area marked with B in the Figure 15.
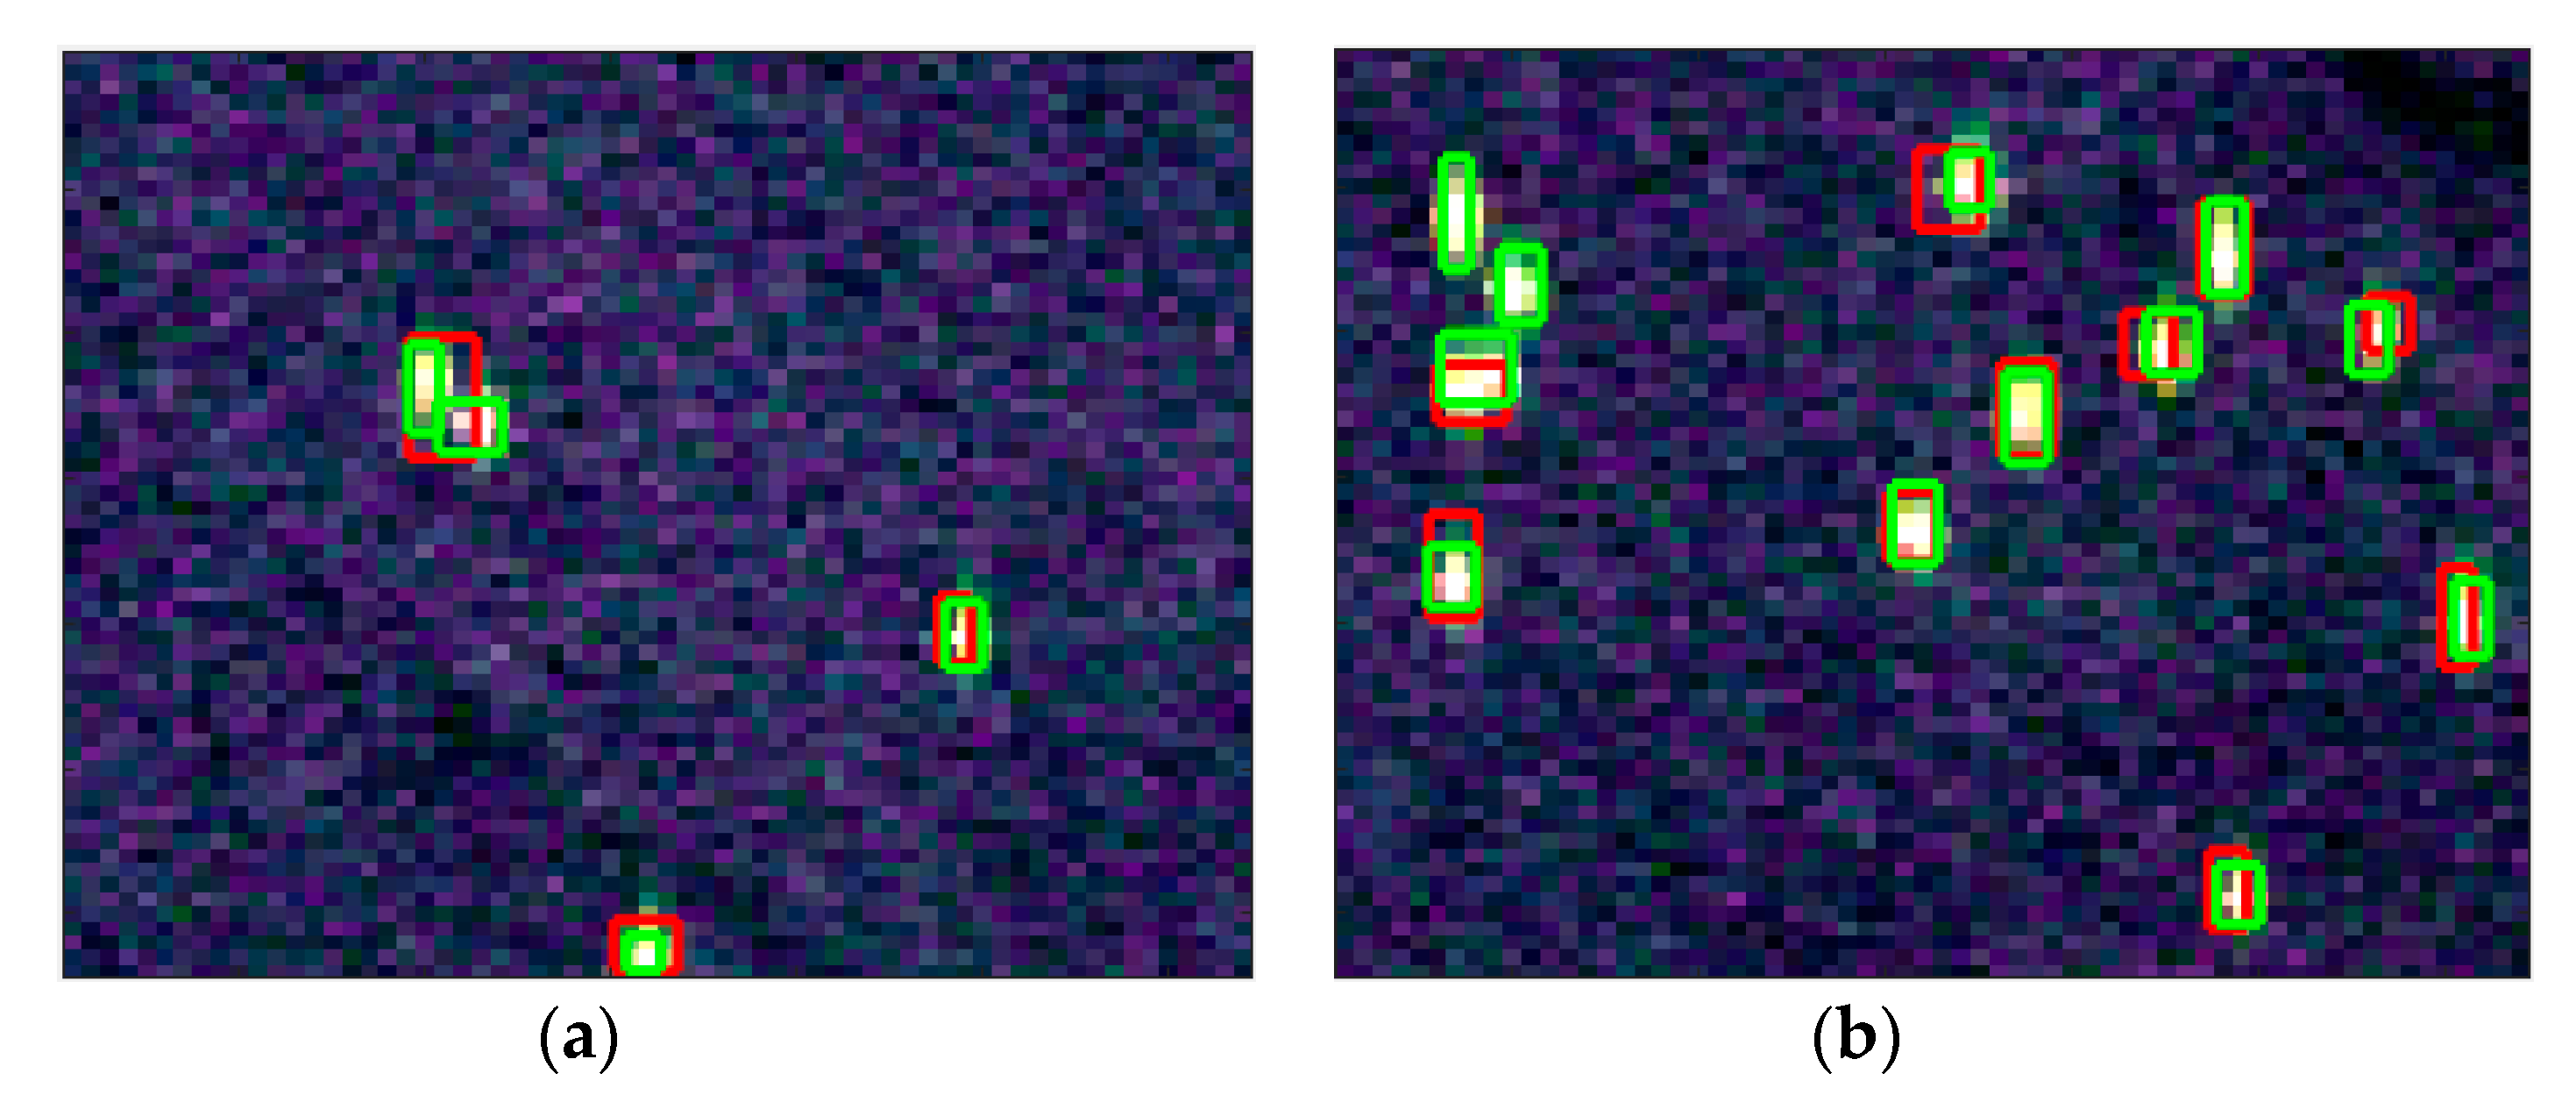
Figure 17.
Ship detection results of (a) the shallow Faster R-CNN, (b) the deep Faster R-CNN, (c) the proposed ship detector, (d) the modified CFAR detector and (e) the fully convolutional network-based ship detector.
Figure 17.
Ship detection results of (a) the shallow Faster R-CNN, (b) the deep Faster R-CNN, (c) the proposed ship detector, (d) the modified CFAR detector and (e) the fully convolutional network-based ship detector.
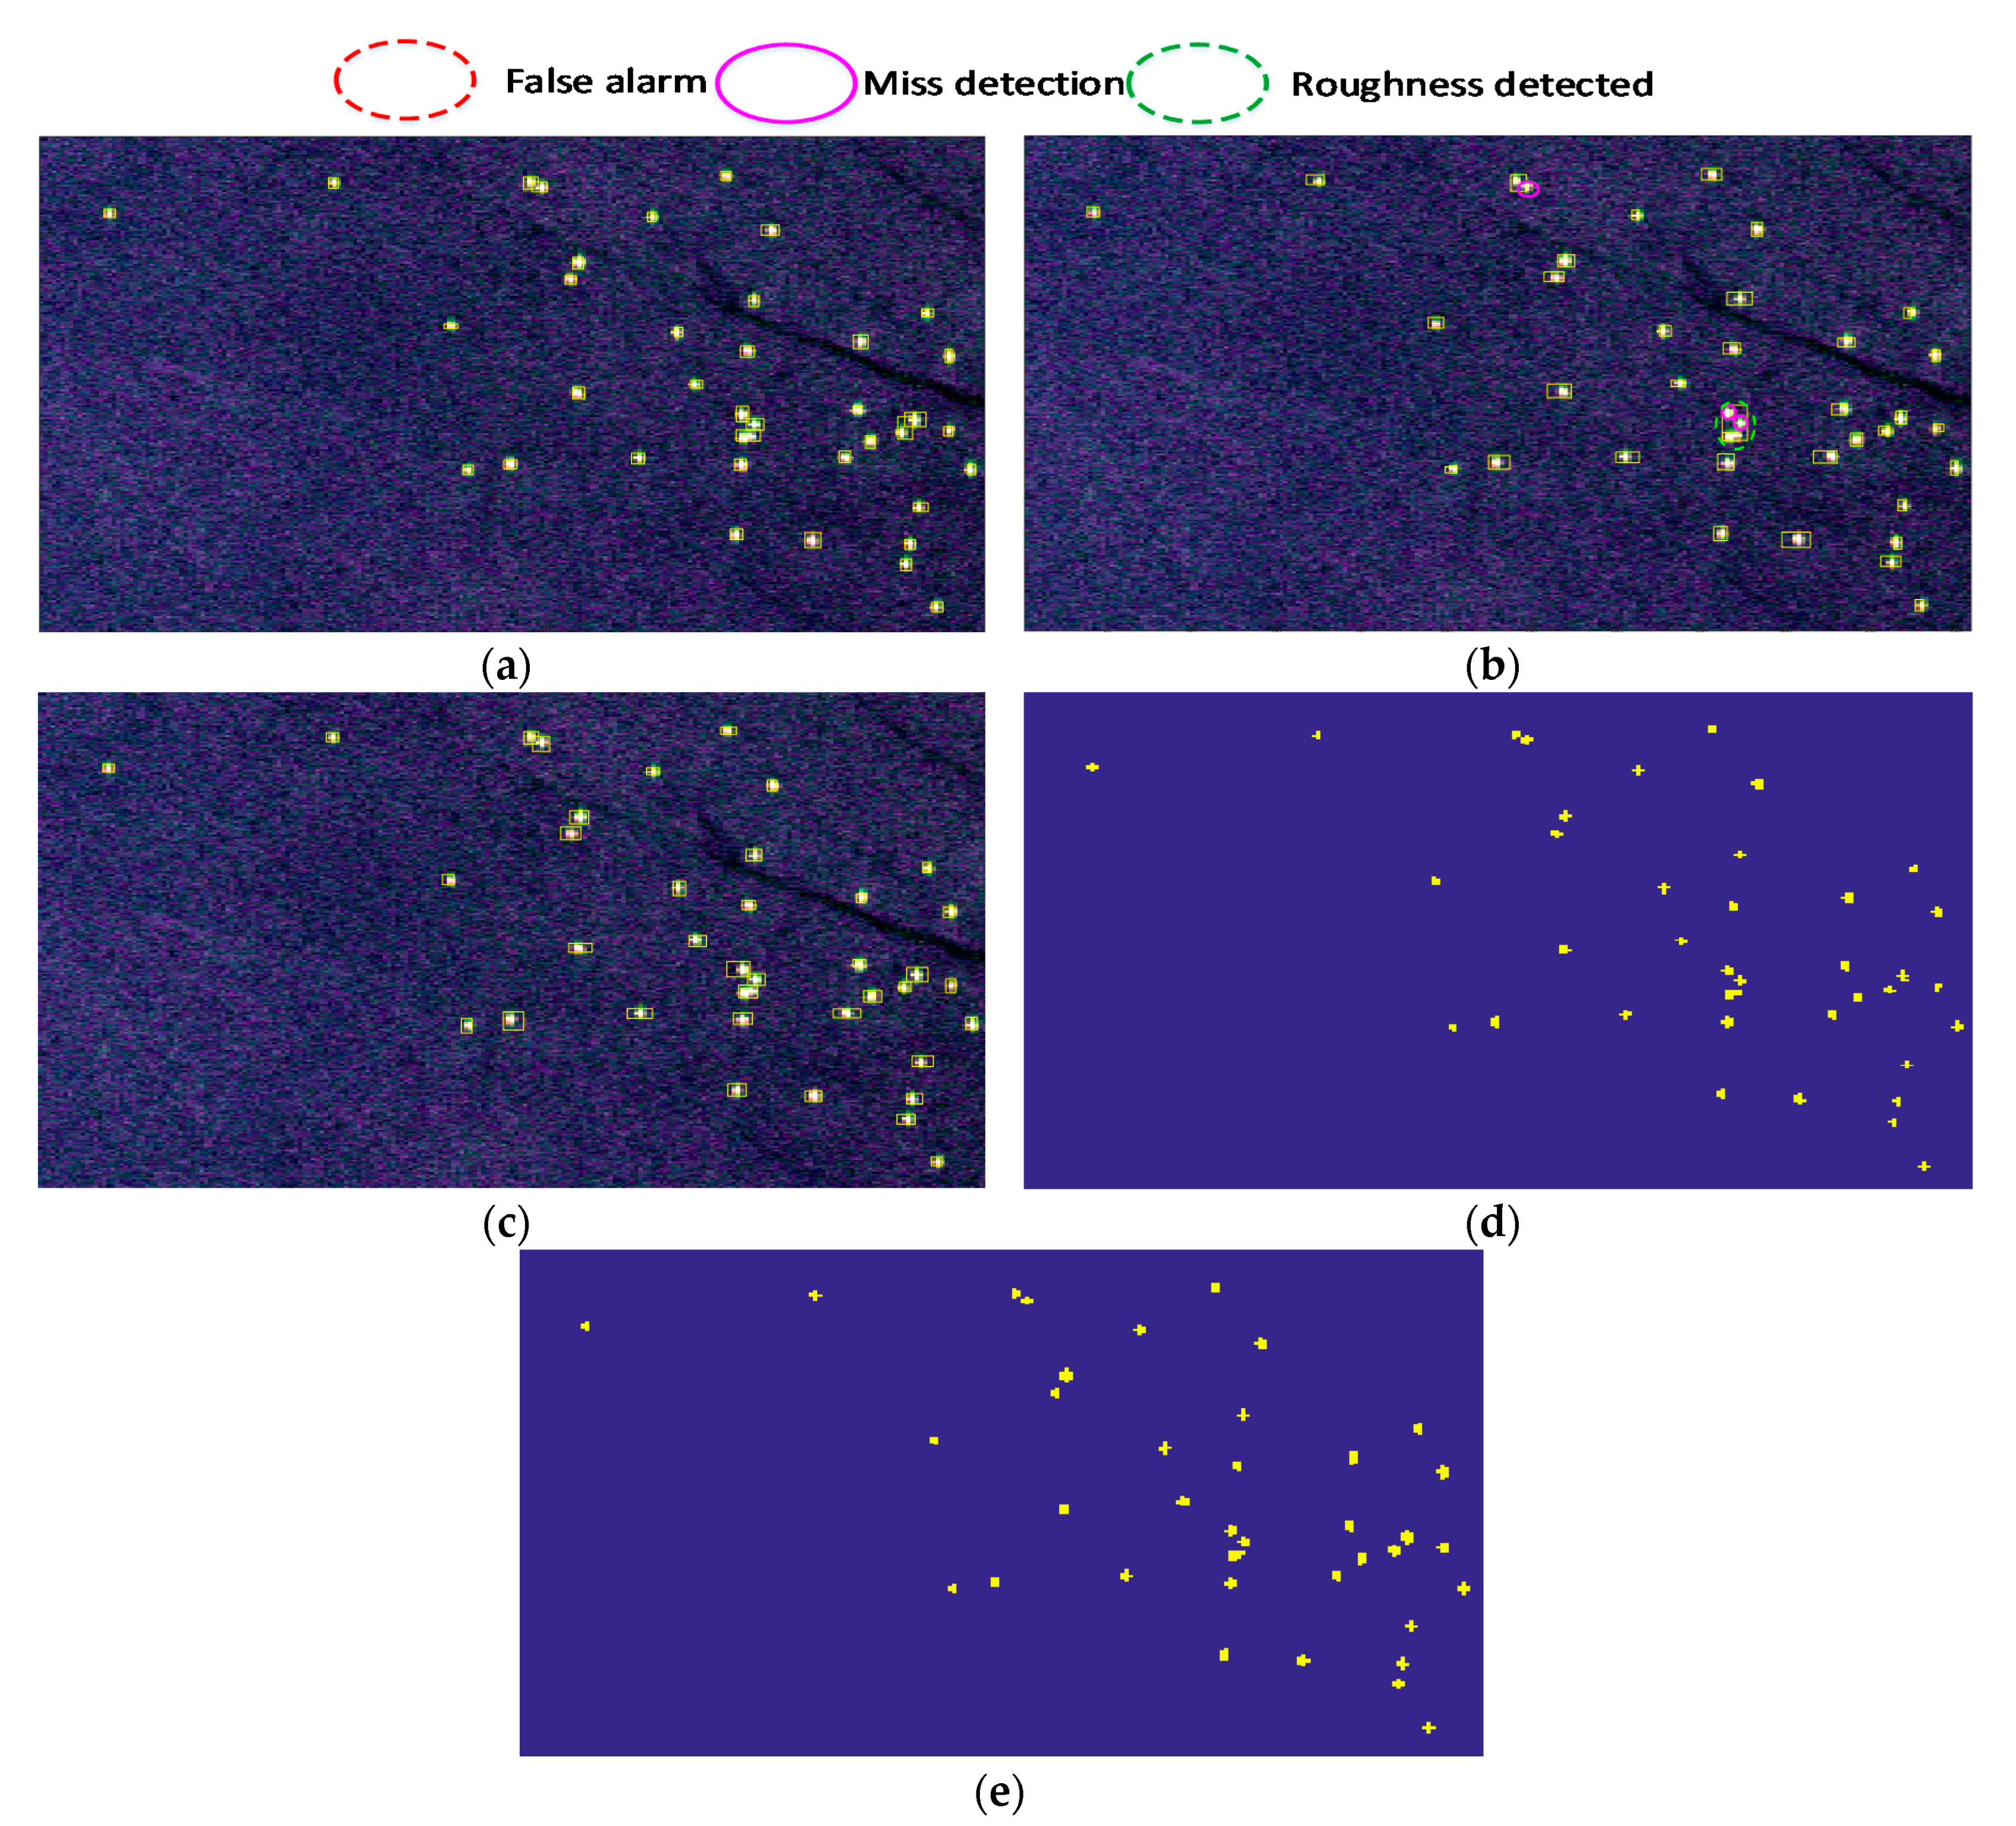
Figure 18.
Pauli RGB image of the uninhabited aerial vehicle synthetic aperture radar (UAVSAR) dataset. The aircraft sensor flew from top to bottom with respect to the image orientation, i.e., azimuth direction, during data acquisition, while the range direction was from the left to the right.
Figure 18.
Pauli RGB image of the uninhabited aerial vehicle synthetic aperture radar (UAVSAR) dataset. The aircraft sensor flew from top to bottom with respect to the image orientation, i.e., azimuth direction, during data acquisition, while the range direction was from the left to the right.
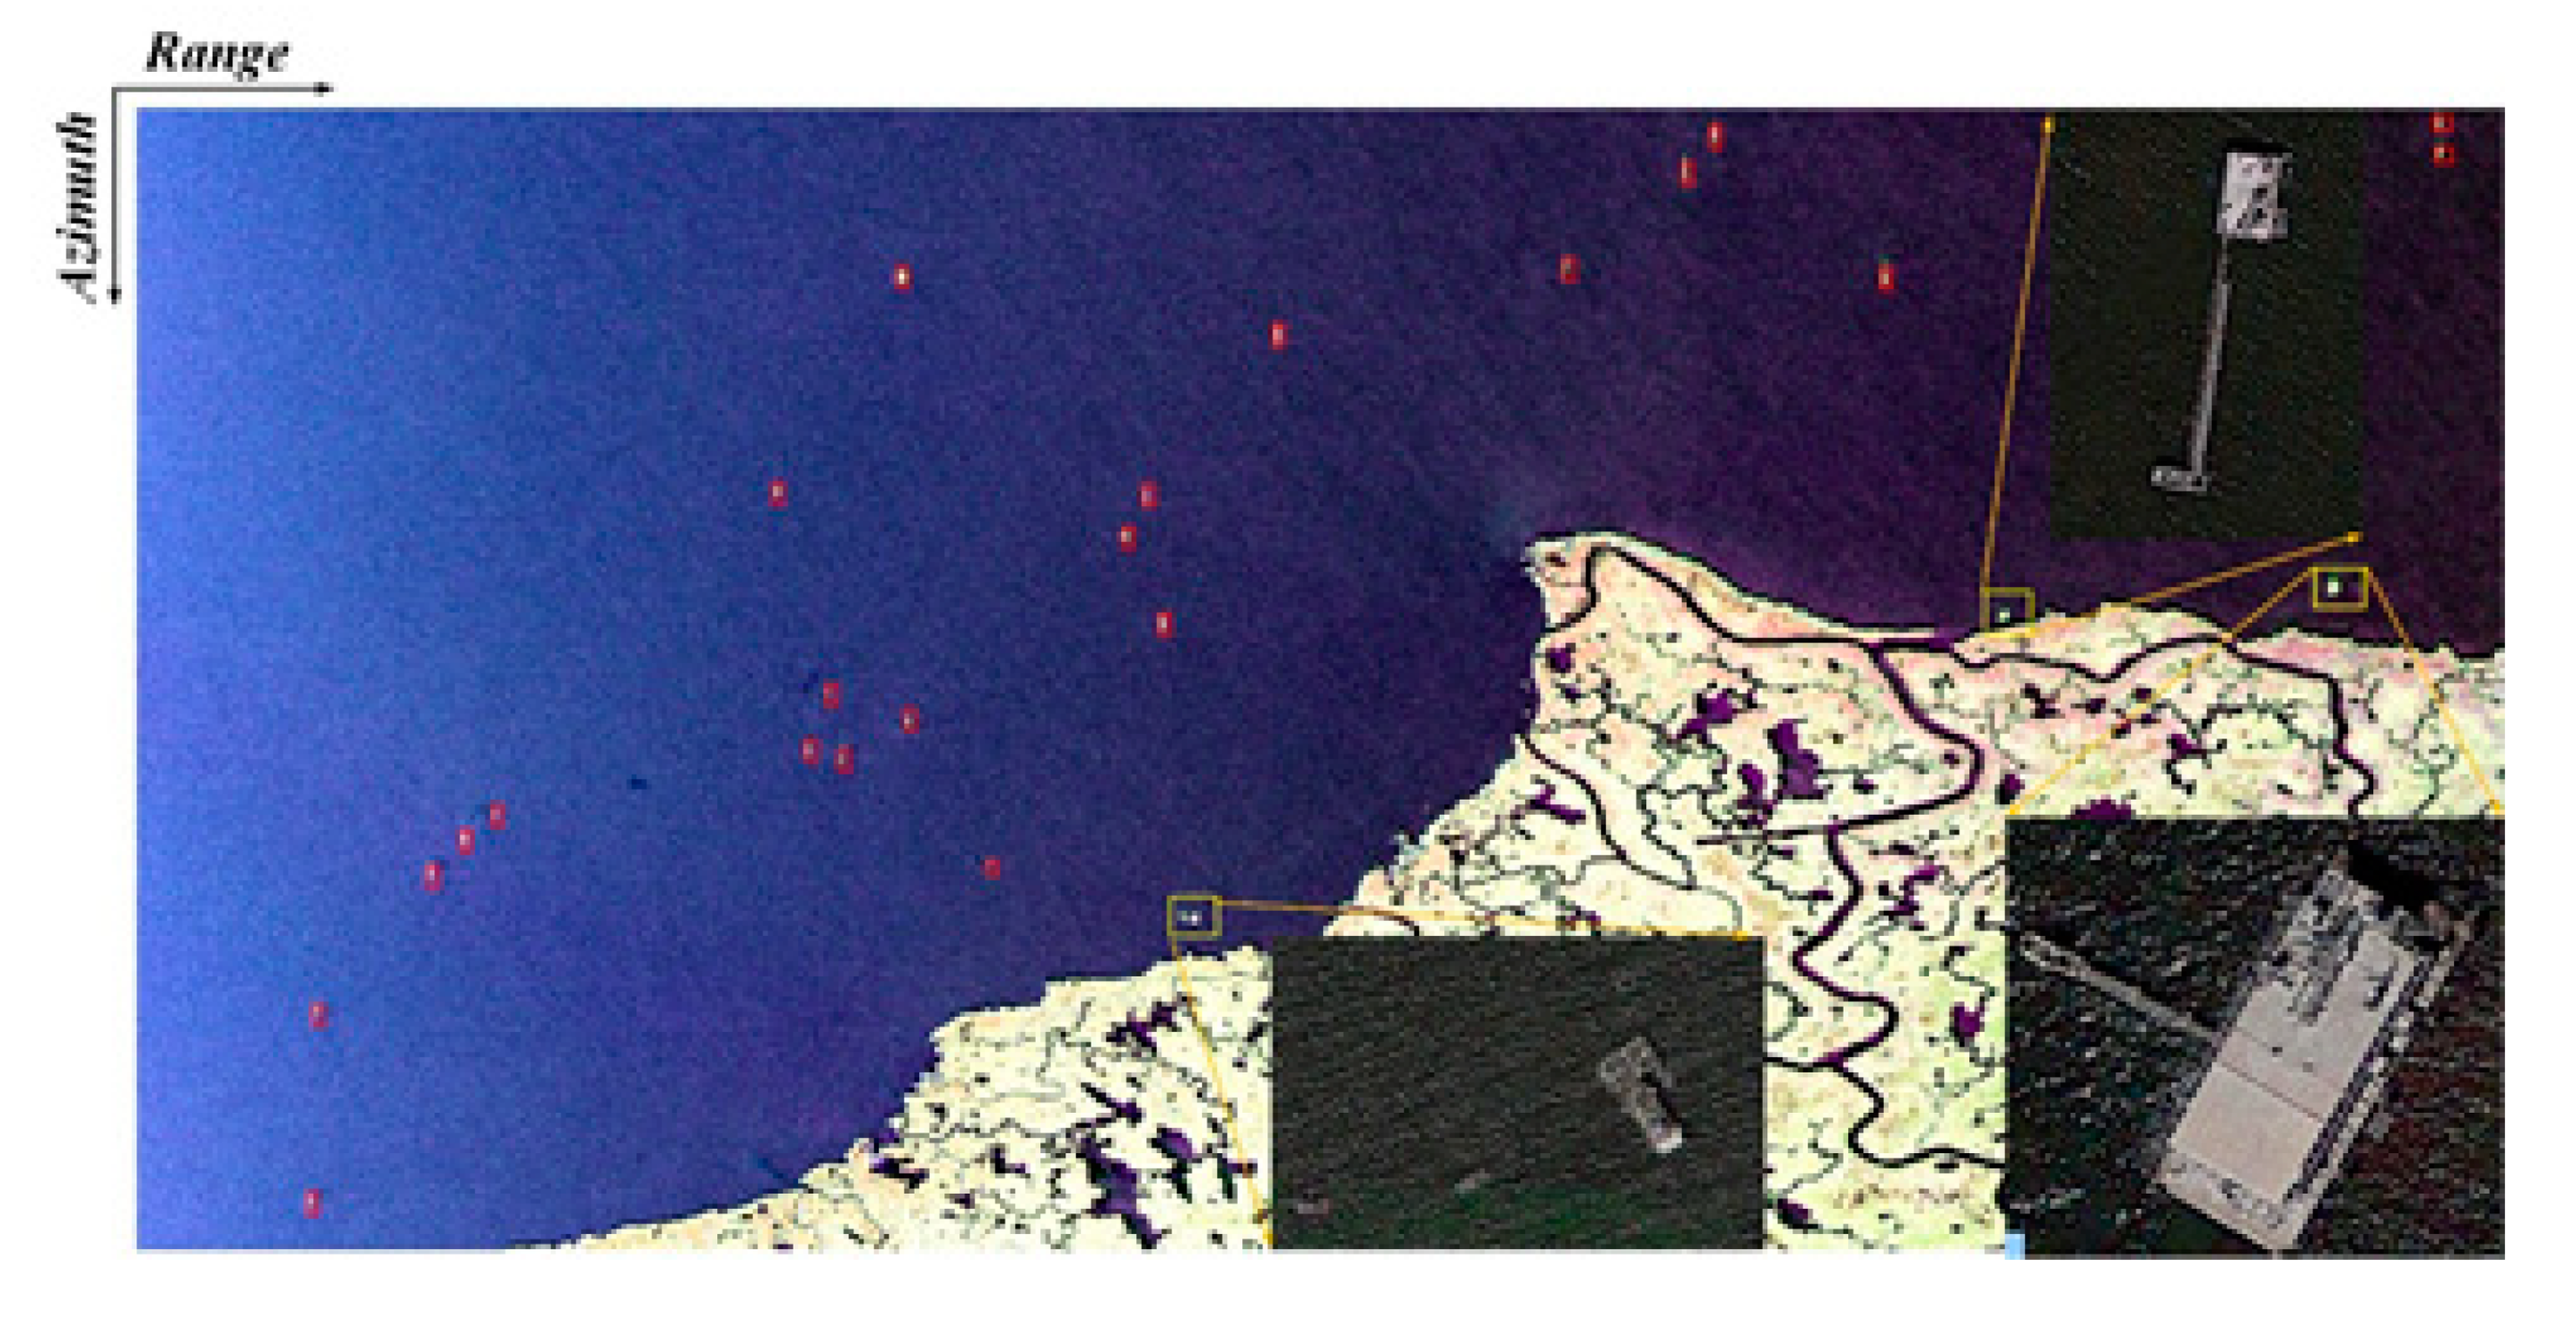
Figure 19.
Ship detection results of (a) the shallow Faster R-CNN, (b) the deep Faster R-CNN, (c) the proposed ship detector, (d) the modified CFAR detector and (e) the fully convolutional network-based ship detector.
Figure 19.
Ship detection results of (a) the shallow Faster R-CNN, (b) the deep Faster R-CNN, (c) the proposed ship detector, (d) the modified CFAR detector and (e) the fully convolutional network-based ship detector.
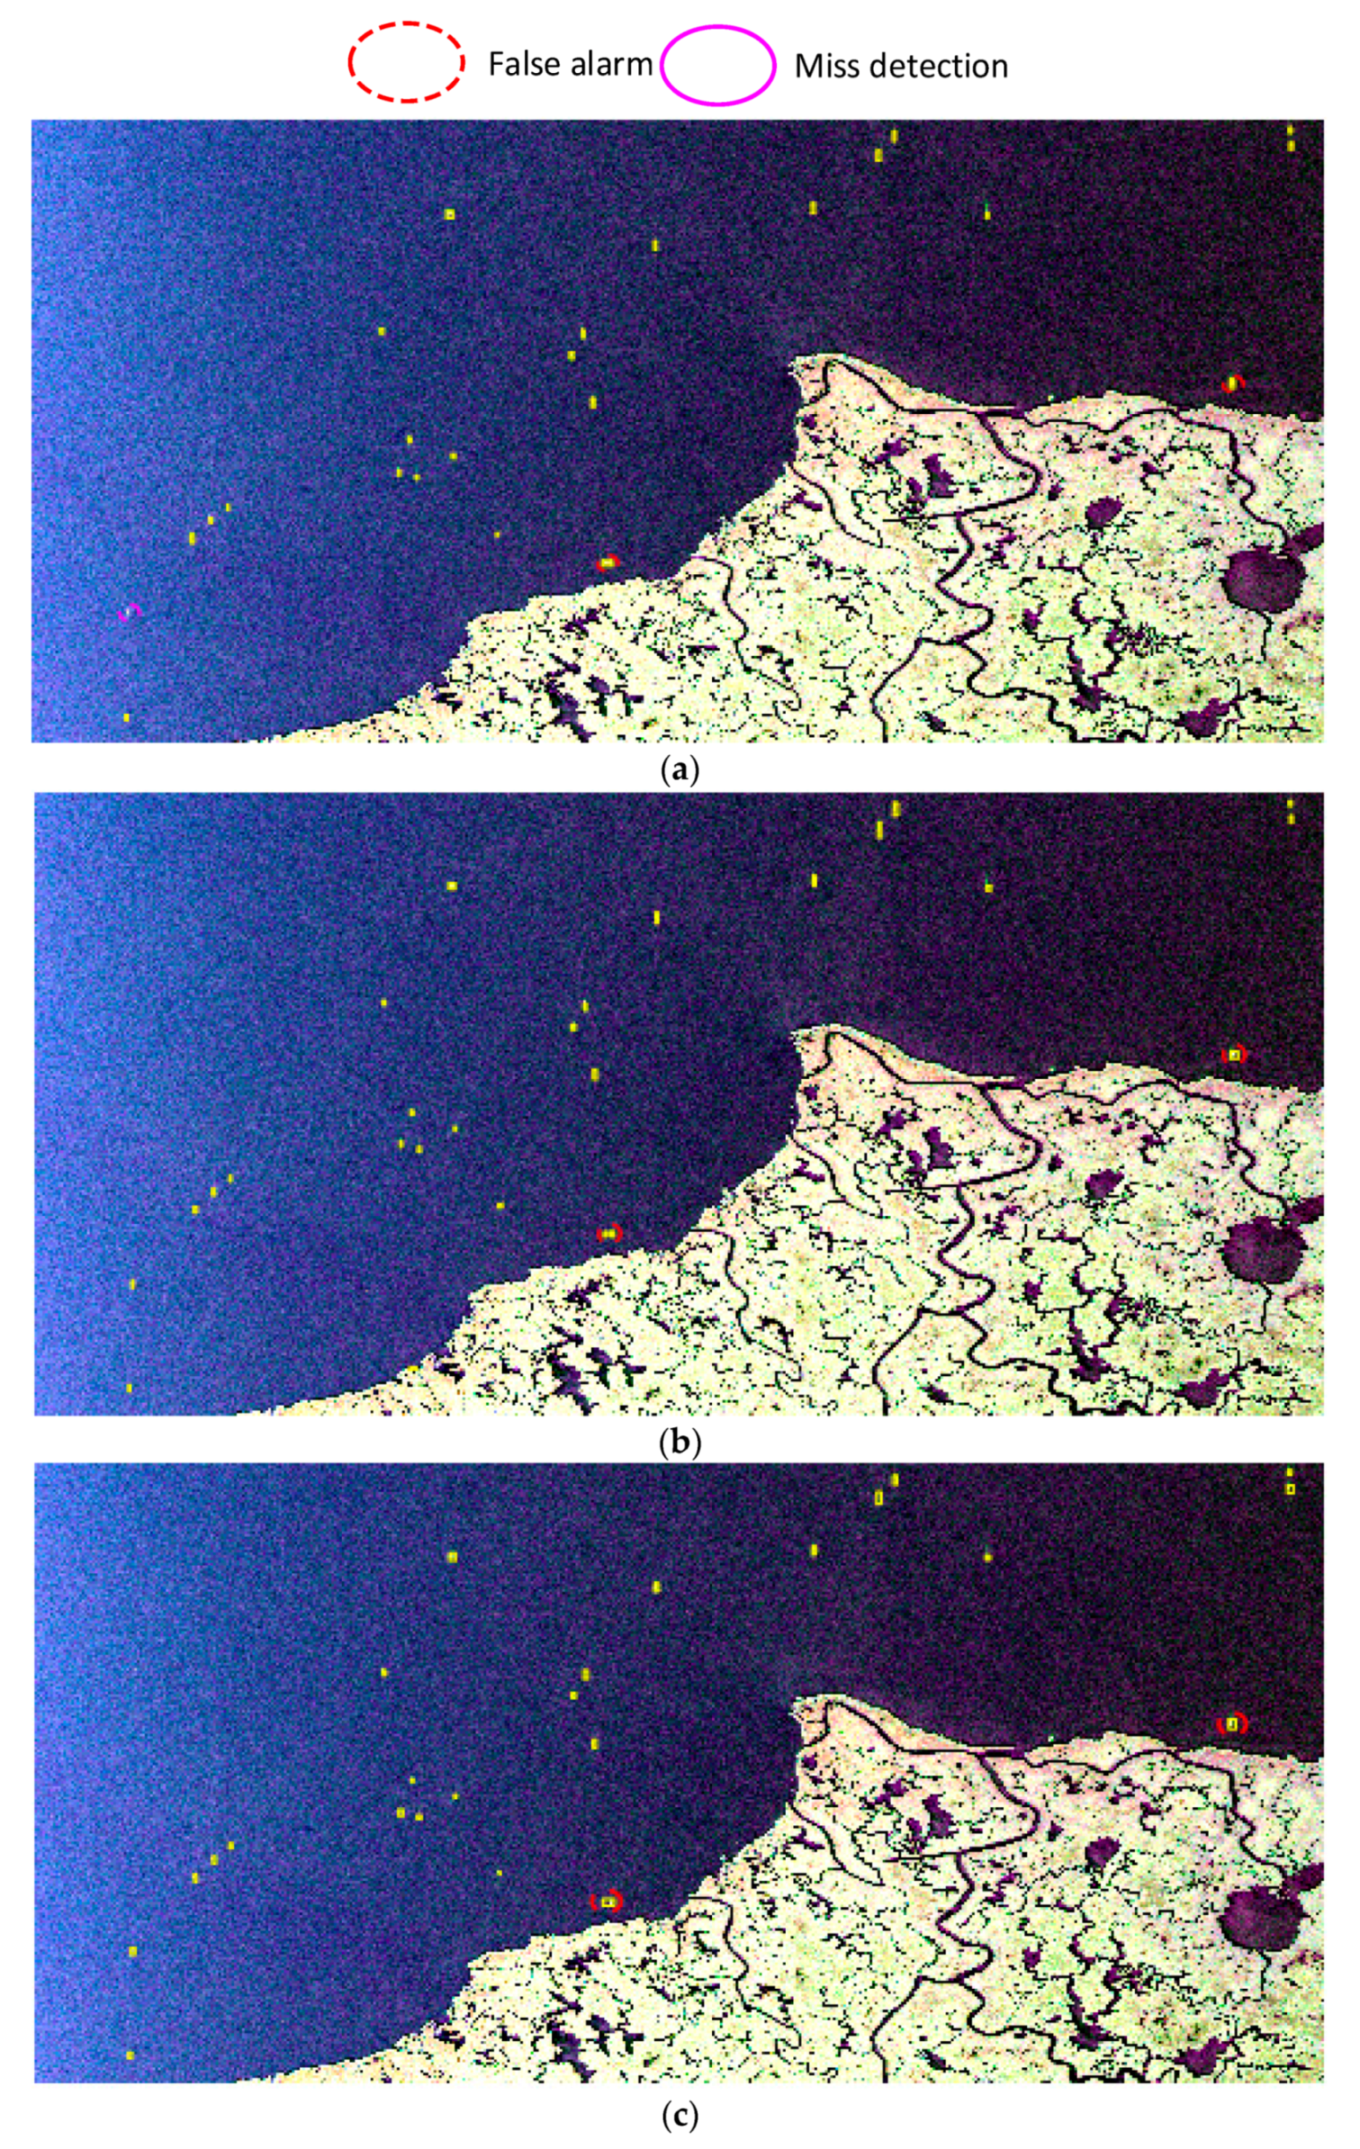
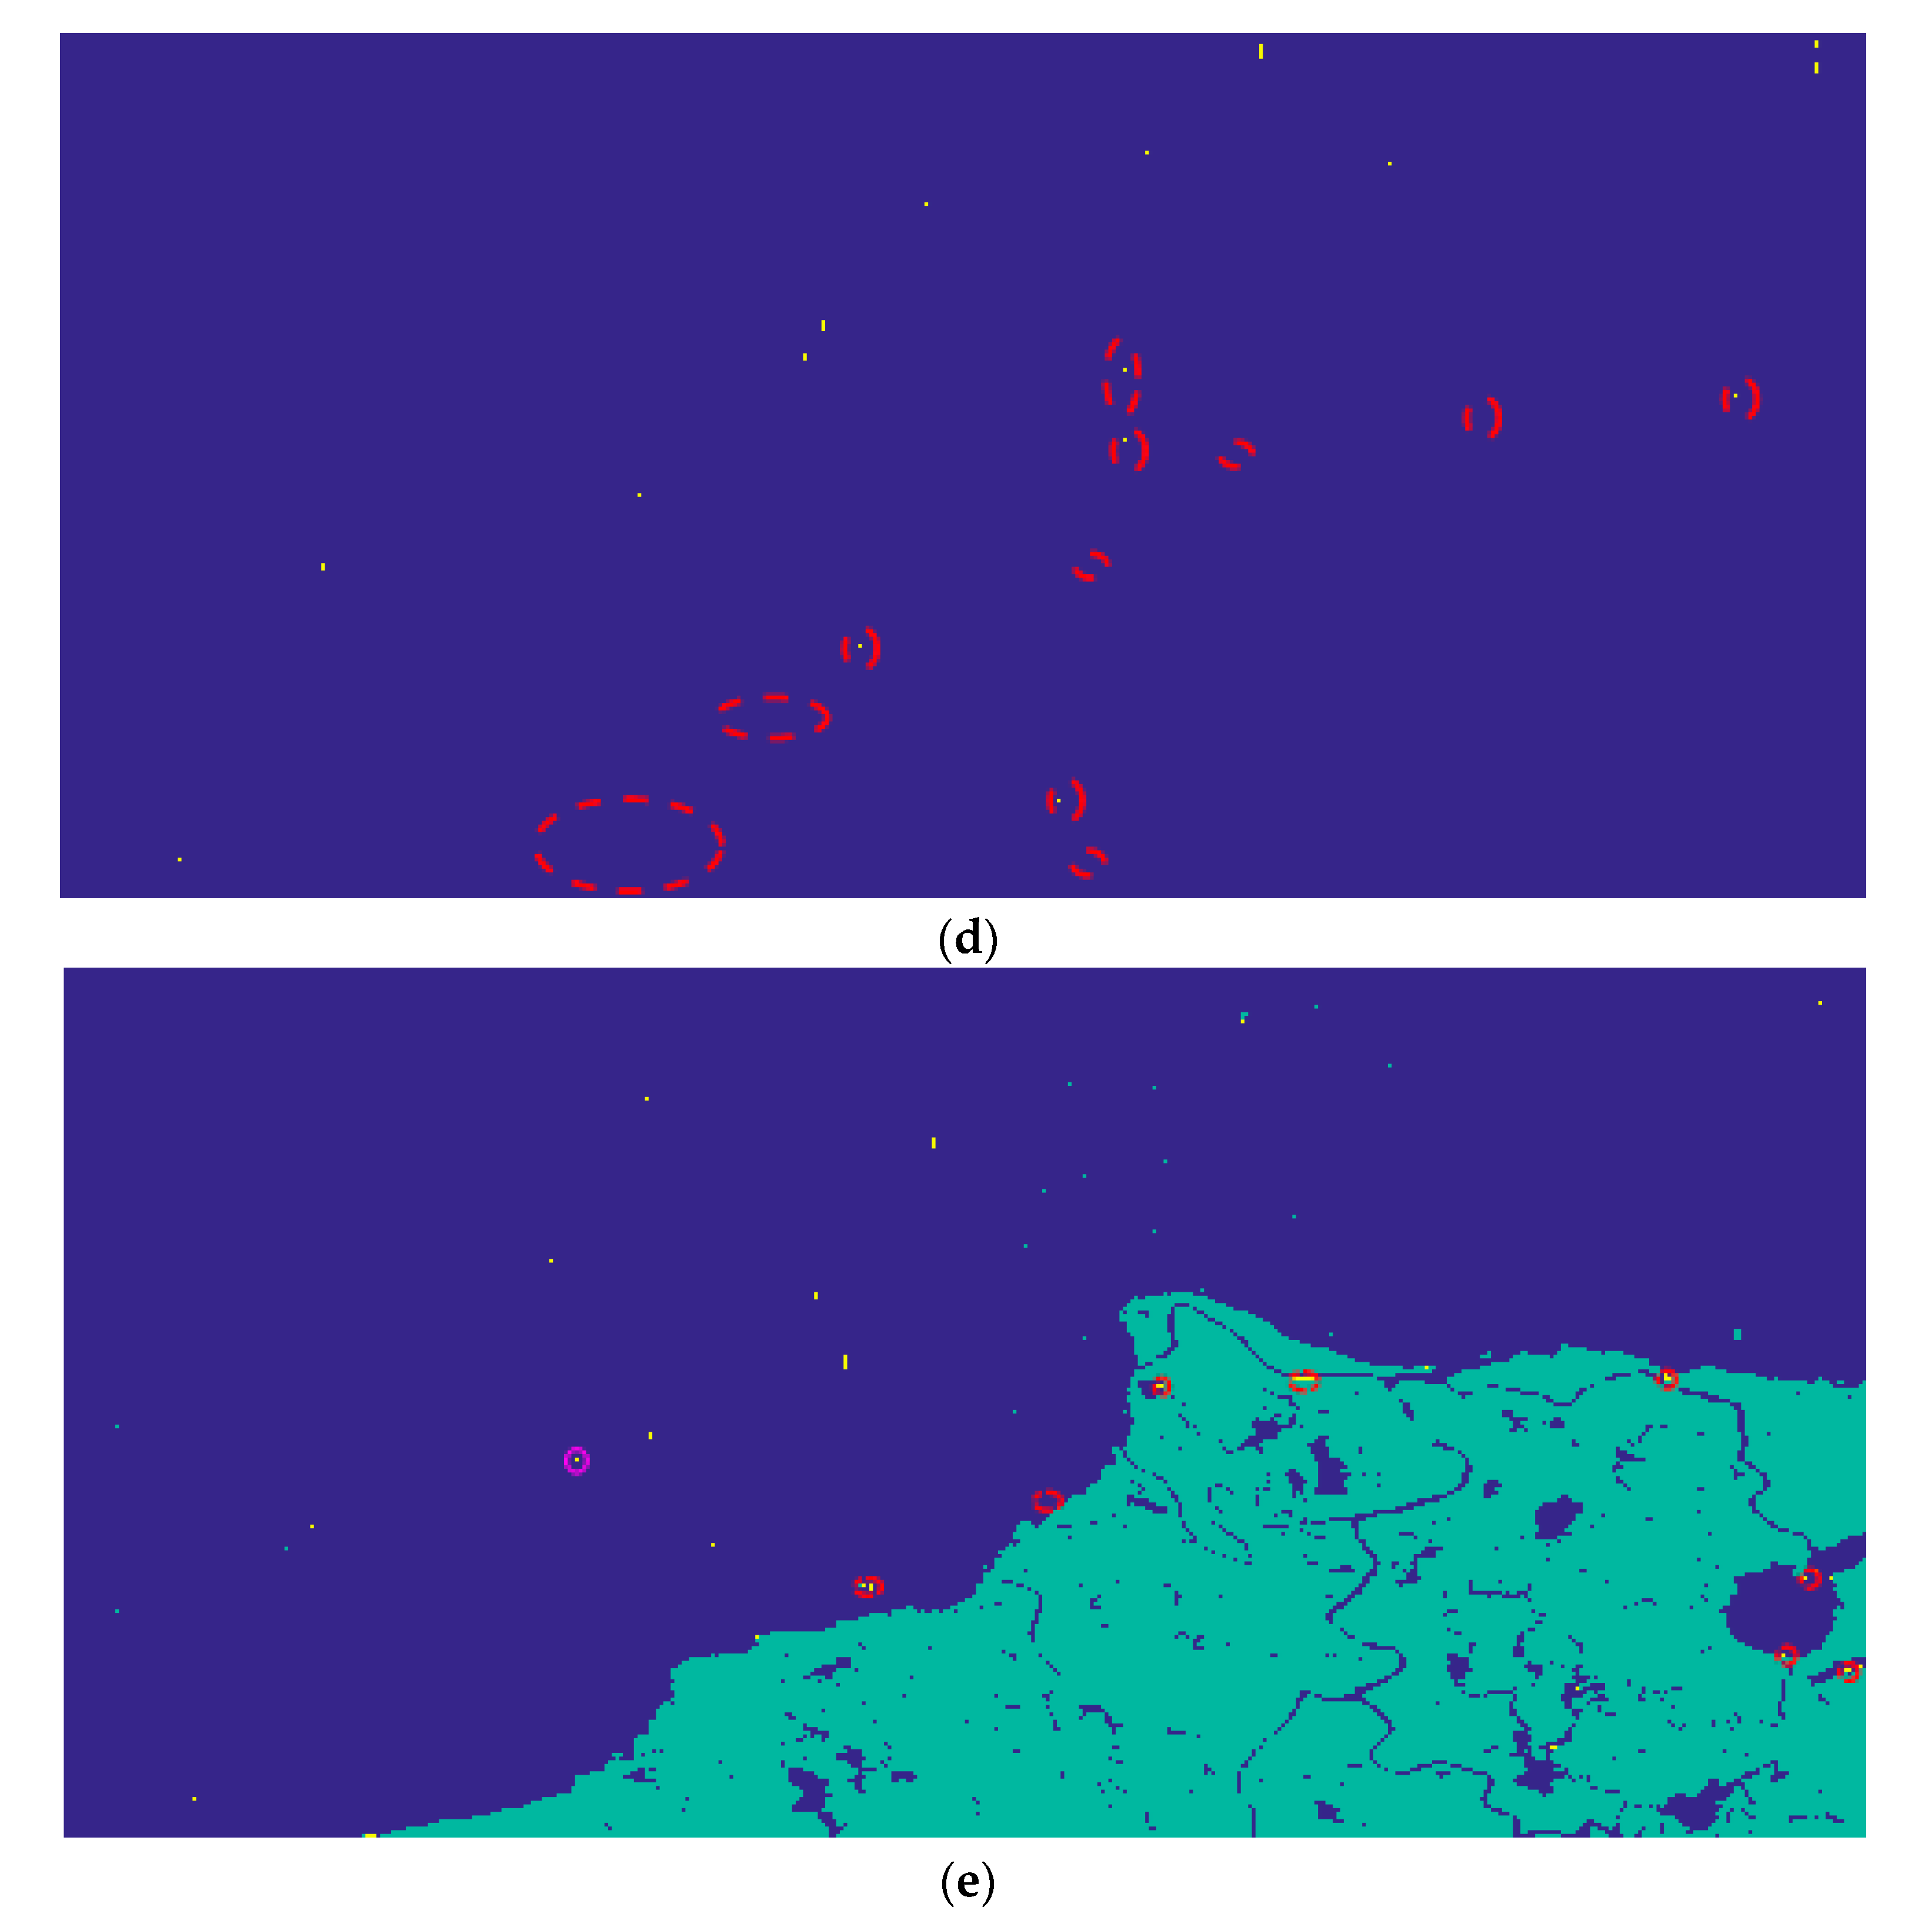
Figure 20.
Pauli RGB image of the AIRSAR Taiwan area dataset. The aircraft sensor flew from bottom to top with respect to the image orientation, i.e., azimuth direction, during data acquisition, while the range direction was from the right to the left.
Figure 20.
Pauli RGB image of the AIRSAR Taiwan area dataset. The aircraft sensor flew from bottom to top with respect to the image orientation, i.e., azimuth direction, during data acquisition, while the range direction was from the right to the left.
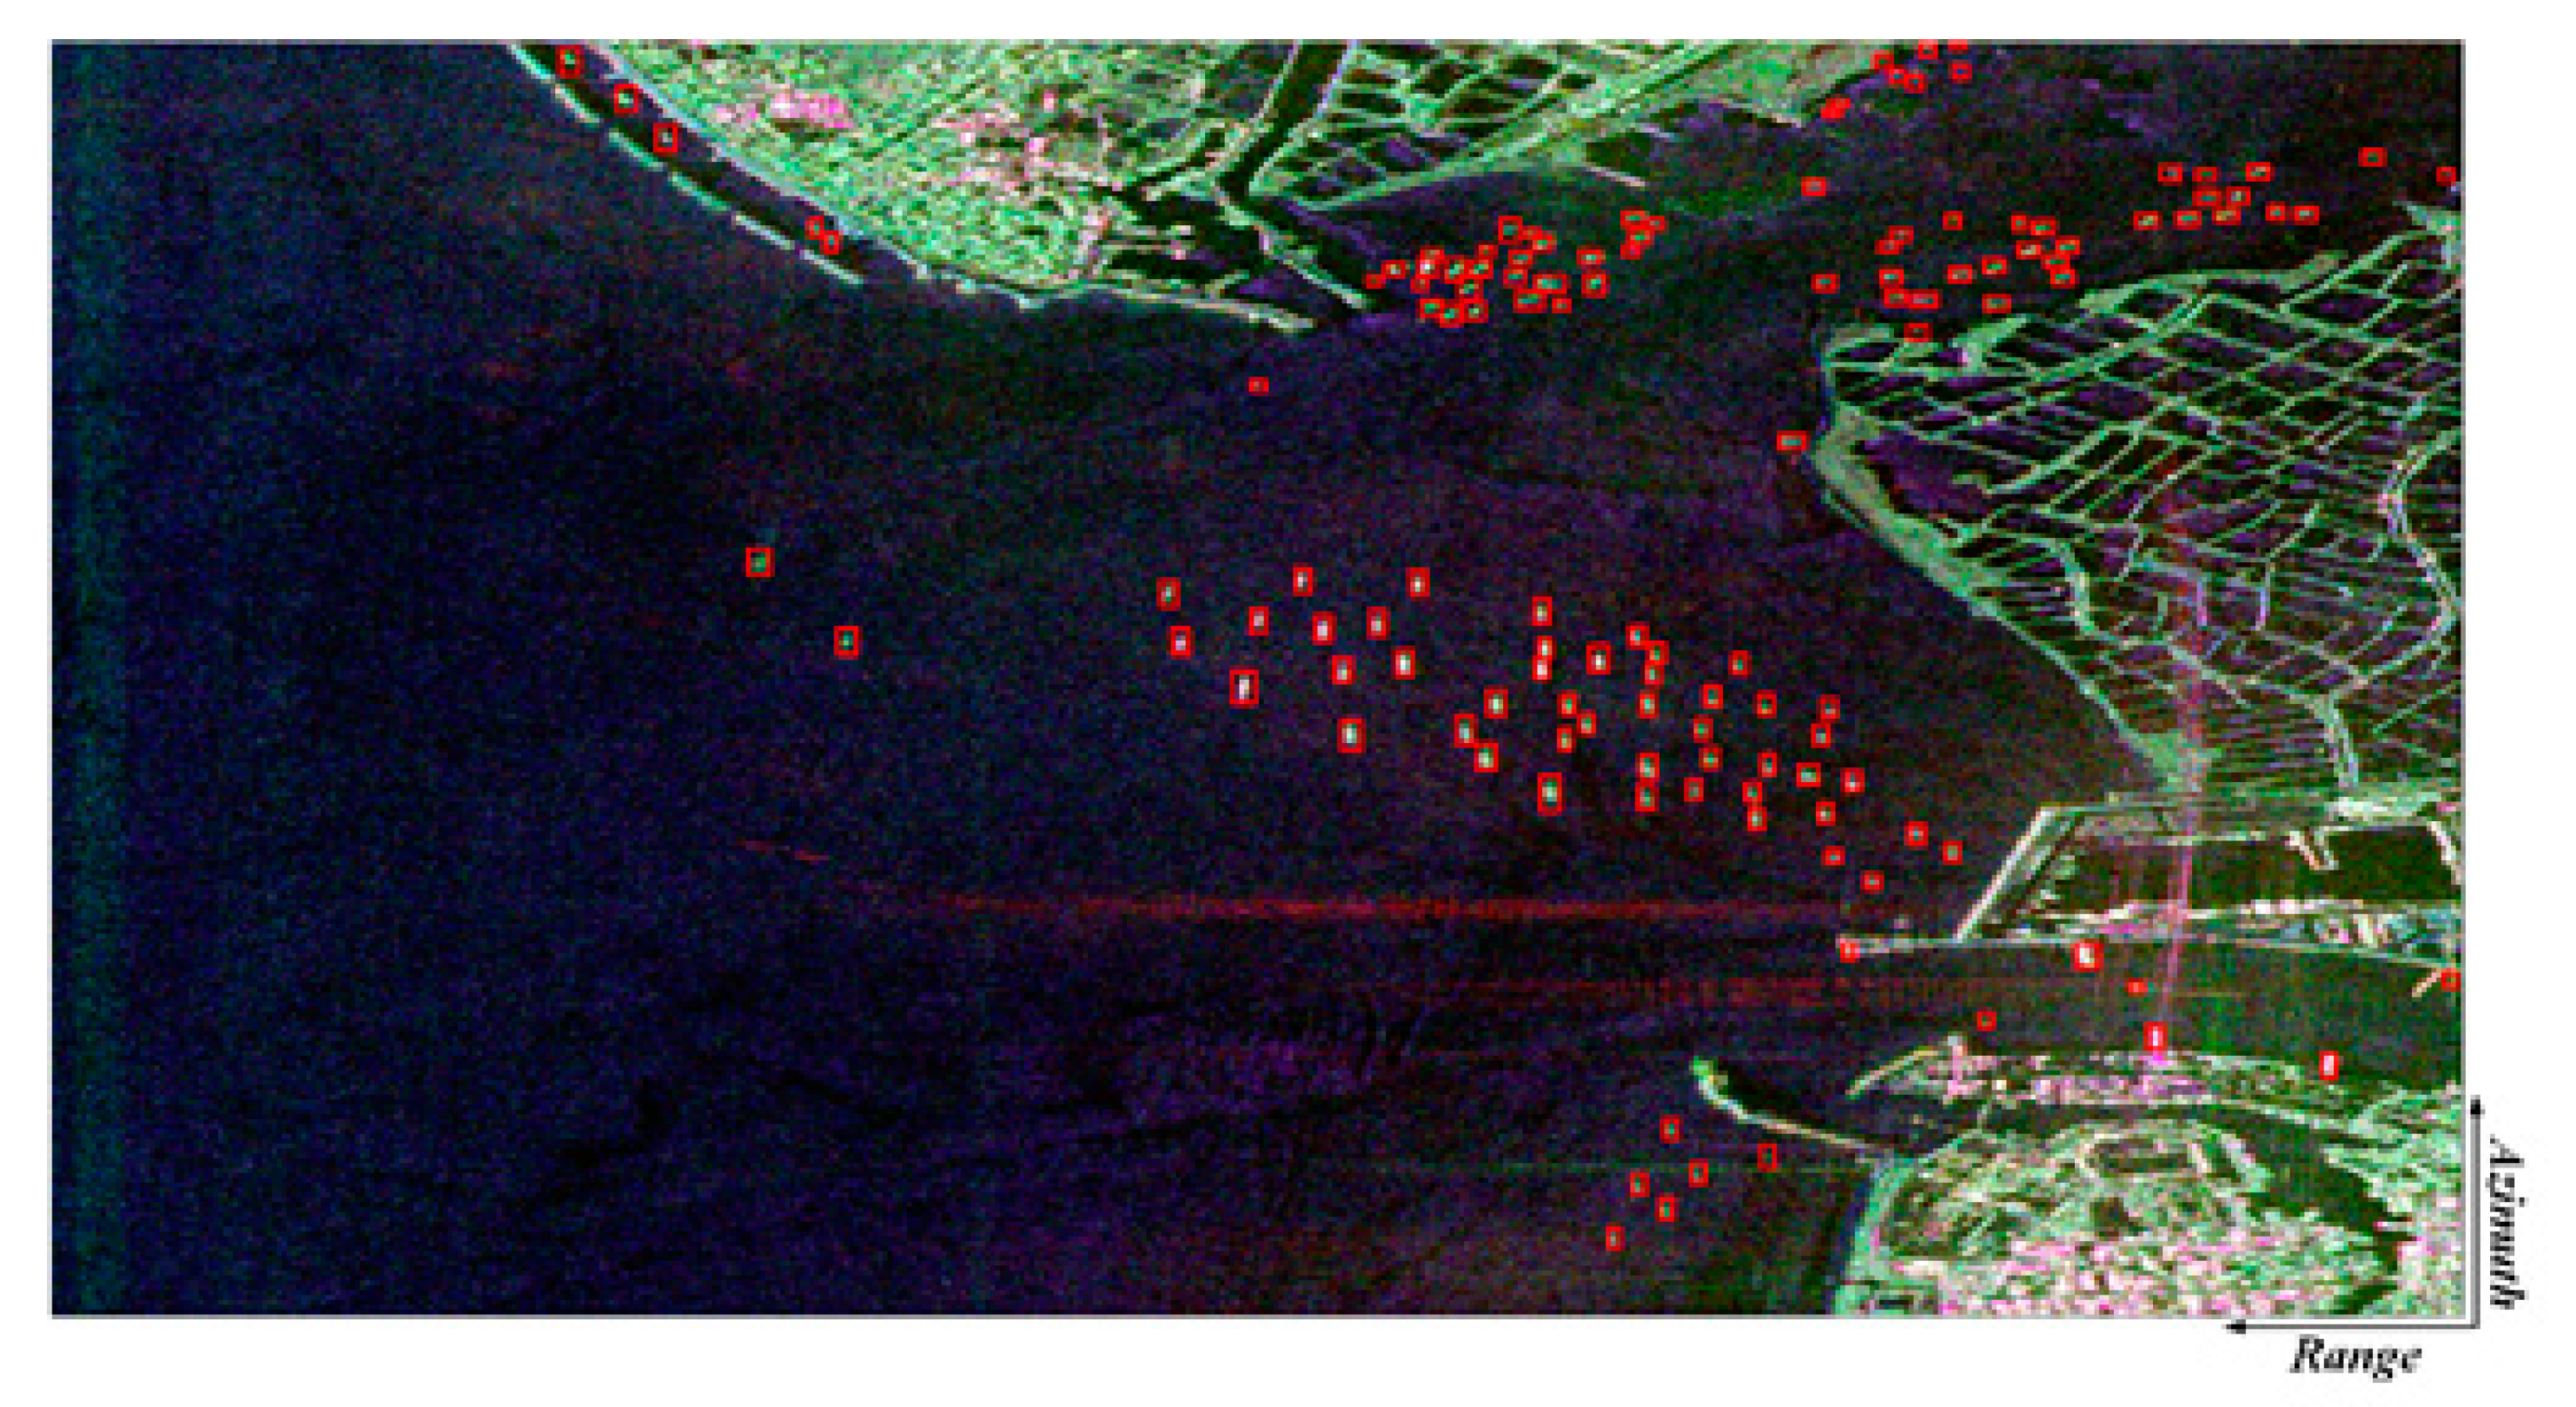
Figure 21.
Ship detection results of (a) the shallow Faster R-CNN, (b) the deep Faster R-CNN, (c) the proposed ship detector, (d) the modified CFAR detector and (e) the fully convolutional network-based ship detector.
Figure 21.
Ship detection results of (a) the shallow Faster R-CNN, (b) the deep Faster R-CNN, (c) the proposed ship detector, (d) the modified CFAR detector and (e) the fully convolutional network-based ship detector.

Table 1.
Accuracy assessment for AIRSAR Japan dataset.
| Method | Consumed Time | |||||
|---|---|---|---|---|---|---|
| Shallow Faster R-CNN [16] | 17 | 0 | 4 | 81.0% | 81.0% | 2.53 s |
| Deep Faster R-CNN [16] | 20 | 2 | 1 | 95.2% | 87.0% | 2.71 s |
| Proposed ship detector | 21 | 2 | 0 | 100% | 91.3% | 3.03 s |
| Modified CFAR [8] | 19 | 3 | 2 | 90.5% | 79.2% | 201.90 s |
| Fully convolutional network based ship detector [22] | 21 | 5 | 0 | 100% | 80.7% | 3.48 s |
Table 2.
Accuracy assessment for AIRSAR Japan dataset(c-band).
| Method | Consumed Time | |||||
|---|---|---|---|---|---|---|
| Shallow Faster R-CNN [16] | 19 | 1 | 1 | 95.0% | 90.5% | 4.20 s |
| Deep Faster R-CNN [16] | 19 | 3 | 1 | 95.0% | 82.6% | 4.50 s |
| Proposed ship detector | 20 | 3 | 0 | 100% | 86.9% | 5.30 s |
| Modified CFAR [8] | 18 | 17 | 2 | 90.0% | 48.6% | 108.10 s |
| Fully convolutional network based ship detector [22] | 20 | 13 | 0 | 100% | 60.6% | 3.37 s |
Table 3.
Accuracy assessment for UAVSAR Gulfco area a dataset.
| Method | Consumed Time | |||||
|---|---|---|---|---|---|---|
| Shallow Faster R-CNN [16] | 39 | 0 | 0 | 100% | 100% | 1.80 s |
| Deep Faster R-CNN [16] | 36 | 1 | 3 | 92.3% | 90.0% | 2.10 s |
| Proposed ship detector | 39 | 0 | 0 | 100% | 100% | 2.40 s |
| Modified CFAR [8] | 39 | 0 | 0 | 100% | 100% | 6.18 s |
| Fully convolutional network based ship detector [22] | 39 | 0 | 0 | 100% | 100% | 2.07 s |
Table 4.
Accuracy assessment for UAVSAR Gulfco area B dataset.
| Method | Consumed Time | |||||
|---|---|---|---|---|---|---|
| Shallow Faster R-CNN [16] | 21 | 2 | 1 | 95.5% | 87.5% | 4.48 s |
| Deep Faster R-CNN [16] | 22 | 2 | 0 | 100% | 91.7% | 5.17 s |
| Proposed ship detector | 22 | 2 | 0 | 100% | 91.7% | 8.42 s |
| Modified CFAR [8] | 22 | 11 | 0 | 100% | 66.7% | 98.6 s |
| Fully convolutional network based ship detector [22] | 21 | 8 | 1 | 95.5% | 70.0% | 6.94 s |
Table 5.
Accuracy assessment for AIRSAR Taiwan area dataset.
| Method | Consumed Time | |||||
|---|---|---|---|---|---|---|
| Shallow Faster R-CNN [16] | 118 | 10 | 14 | 89.4% | 83.1% | 17.84 s |
| Deep Faster R-CNN [16] | 122 | 14 | 10 | 92.4% | 83.6% | 18.54 s |
| Proposed ship detector | 125 | 14 | 7 | 94.7% | 85.6% | 19.83 s |
| Modified CFAR [8] | 116 | 19 | 16 | 87.9% | 78.4% | 564.48 s |
| Fully convolutional network based ship detector [22] | 122 | 30 | 10 | 92.4% | 75.3% | 7.27 s |
© 2019 by the authors. Licensee MDPI, Basel, Switzerland. This article is an open access article distributed under the terms and conditions of the Creative Commons Attribution (CC BY) license (http://creativecommons.org/licenses/by/4.0/).
Share and Cite
MDPI and ACS Style
Fan, W.; Zhou, F.; Bai, X.; Tao, M.; Tian, T. Ship Detection Using Deep Convolutional Neural Networks for PolSAR Images. Remote Sens. 2019, 11, 2862. https://doi.org/10.3390/rs11232862
AMA Style
Fan W, Zhou F, Bai X, Tao M, Tian T. Ship Detection Using Deep Convolutional Neural Networks for PolSAR Images. Remote Sensing. 2019; 11(23):2862. https://doi.org/10.3390/rs11232862
Chicago/Turabian StyleFan, Weiwei, Feng Zhou, Xueru Bai, Mingliang Tao, and Tian Tian. 2019. "Ship Detection Using Deep Convolutional Neural Networks for PolSAR Images" Remote Sensing 11, no. 23: 2862. https://doi.org/10.3390/rs11232862
Note that from the first issue of 2016, this journal uses article numbers instead of page numbers. See further details here.