Article

GNSS Radio Occultation Advances the Monitoring of Volcanic Clouds: The Case of the 2008 Kasatochi Eruption

1
Dipartimento di Geoscienze, Università degli Studi di Padova, 35131 Padua, Italy
2
AIRES Pty Ltd., Mt Eliza, VIC 3930, Australia
3
Wegener Center for Climate and Global Change (WEGC), University of Graz, 8010 Graz, Austria
4
Institute for Geophysics, Astrophysics, and Meteorology/Institute of Physics, University of Graz, 8010 Graz, Austria
5
Royal Belgium Institute for Space Aeronomy, 1180 Brussels, Belgium
*
Author to whom correspondence should be addressed.
Remote Sens. 2019, 11(19), 2199; https://doi.org/10.3390/rs11192199
Submission received: 20 August 2019 / Revised: 11 September 2019 / Accepted: 19 September 2019 / Published: 20 September 2019
(This article belongs to the Special Issue Convective and Volcanic Clouds (CVC))

Abstract

:
The products of explosive volcanic eruptions, in particular, volcanic ash, can pose a severe hazard to, for example, international aviation. Detecting volcanic clouds and monitoring their dispersal is hence, the subject of intensive current research. However, the discrepancies between the different available methods lead to detected cloud altitude with significant uncertainties. Here we show the results of an algorithm developed explicitly for high vertical resolution detection of volcanic cloud altitude by using the Global Navigation Satellite System radio occultation (RO) observations. Analyzing the energetic Kasatochi eruption of August 2008 in a case study, we find the volcanic cloud altitudes detected with RO in good agreement (within ~1 km) with cloud altitude estimations from Cloud-Aerosol Lidar with Orthogonal Polarization (CALIOP) lidar backscatter images in the 4 h range between RO and CALIOP acquisitions. The tracking by combined RO and imaging of the volcanic cloud evolution during the weeks after the eruption indicates a promising potential for operational global cloud altitude monitoring.

1. Introduction

On 7–8 August 2008, the Aleutian Arc was home to several energetic explosive eruptions from the Kasatochi volcano with a Volcanic Explosivity Index (VEI) of 4. On 7 August at 22:01 UTC, 8 August at 01:50 UTC, and 8 August at 04:35 UTC, three main pulses were defined via the detection of seismic and acoustic signals; the second pulse was the most energetic according to acoustic analysis [1]. The explosions emitted gas and ash plumes reaching up to 13.7 km above sea level (a.s.l.) and thus, into the local stratosphere [1,2]. Satellite retrievals estimated between 0.3–2.7 Tg of sulfur dioxide (SO2) and about 0.3–0.5 Tg of volcanic ash emitted [3,4,5,6]. Given the large amount of gas and ash injected in the atmosphere, air traffic in the North Pacific was disrupted for several days [7]. The emission reached the stratosphere, and the subsequent volcanic cloud (VC) dispersed widely over several hundred kilometers from the source. The VC drifted eastward reaching Europe and Svalbard on August 15 and later Japan, always between 30° N and 90° N latitude [4,8].
The Kasatochi eruption became subject of numerous studies, which focused on the retrieval of source parameters (e.g., [9]); the detection of the VC in the atmosphere from satellite-based (e.g., [4,10]) and ground-based techniques [8,11,12]; the distinction between ash and SO2 in the cloud (e.g., [3,13]); and the modelling of the VC dispersion (e.g., [14]). Also, studies focused on the investigation of the properties of volcanic aerosol, its aging and decay time in the stratosphere as well as the impact of the eruption on the atmosphere structure [15,16,17].
The necessity for accurate detection of the presence, altitude, and dispersion of volcanic aerosol, in particular, but not limited to, ash, is known for more than a decade (e.g., [18]). Recent advances in photogrammetry-based techniques have resulted in enhanced spatial and vertical resolution (e.g., [19,20]). However, current detection and monitoring techniques still suffer from resolution problems causing discrepancies between the different observation methods and dispersion models. Currently, the most accurate satellite-based VC altitude estimations are provided by the lidar on board of the Cloud-Aerosol Lidar and Infrared Pathfinder Satellite Observation (CALIPSO) satellite [6].
Given the large amount of data available on the 2008 Kasatochi eruption, which reached the stratosphere, together with the large extent of the VC dispersion, it makes the perfect case study to focus on the estimation of the VC altitude and present a novel cloud altitude detection methodology based on Global Navigation Satellite System (GNSS) radio occultation (RO). Originally, developed for the analysis of the atmospheric structure and climatological studies [21], this technique provides atmospheric variables of high accuracy and high vertical resolution (up to 0.2 km, see Section 2.3 for more details) under near-all meteorological conditions, i.e., it is not affected by clouds [22]. GNSS RO has been used to characterize the effect of the eruptions of Chaiten (Chile) in 2008, Eyjafjallajökull (Iceland) in 2010, and Puyehue-Cordón Caulle (Chile) in 2011 on the atmospheric temperature [23,24]. GNSS RO has also been successfully used to detect the convective cloud top altitude [25,26]. The same algorithm introduced in [25,26] has been used by Biondi et al. [27] for testing the capabilities of RO to detect the altitude of VCs and to characterize their effect on the atmospheric structure for the eruptions of Nabro (Eritrea) and Puyehue-Cordón Caulle (Chile), both in 2011.
We present the latest results of an algorithm specifically tuned to analyze GNSS RO observations for the accurate detection and tracking of the VC altitude for the case of the 2008 Kasatochi eruption. This work shows the potential of GNSS RO for estimating VC altitudes of explosive volcanic eruptions with a high vertical resolution and in an automated way. Thus, making GNSS RO a promising complementary tool to the already in use satellite imaging instruments for global volcanic cloud monitoring.

2. Materials and Methods

2.1. Atmospheric Infrared Sounder (AIRS), Infrared Atmospheric Sounding Interferometer (IASI), and Global Ozone Monitoring Experiment-2 (GOME-2) Data

The extension of the VC dispersion after the eruption has been defined using acquisitions from the Atmospheric Infrared Sounder (AIRS), the Infrared Atmospheric Sounding Interferometer (IASI), and the Global Ozone Monitoring Experiment-2 (GOME-2).
AIRS is a hyperspectral instrument on board of the AQUA polar-orbiting satellite. The AIRS swath width is 1650 km allowing a daily full disk coverage with a spatial resolution of 13.5 km at nadir and 41 × 21 km resolution at scan extremes [13]. SO2 is detected using infrared channels centered near the 7.3 µm absorption peak at both day and night. The detection method relies on a correlation between the spectral shape of a library absorption profile and a measured spectrum and works well for SO2 that has been lofted high into the atmosphere, where water vapor is less abundant. Several studies have been conducted comparing the retrieval to other techniques [6,28], and agreement is generally found within 10–30%. The typical retrieval error for a single AIRS pixel is ±6 DU [29].
IASI is an infrared Fourier transform instrument on board of the MetOp-A polar-orbiting satellite. The IASI swath width is 2200 km allowing a daily full disk coverage with a spatial resolution of 12 km at nadir [5,30]. The algorithm for retrieving SO2 is based on the spectral measurement in three different bands [31]. The measured signal is converted into SO2 vertical column density (VCD) by making use of look-up tables and operational pressure, temperature, and humidity profiles. The ash index product from IASI is based on a three-step approach, which includes; (1) the calculation of spectral distance according to the ash reference spectra, (2) the identification of ash with very strict criteria, and (3) completion of ash detection with low and medium levels of confidence in the neighborhood of a pixel with high level of confidence. The approach ensures a very low false detection rate (for more details see [32,33]).
GOME-2 is an ultraviolet and visible spectral range sensor also on board of the MetOp-A polar-orbiting satellite. The GOME-2 swath width is 1920 km allowing a daily full disk coverage with a spatial resolution of 40x80 km at nadir [34]. The SO2 retrievals from GOME-2 [35] use a differential optical absorption spectroscopy technique [36]. The SO2 concentration integrated along the mean optical light path in the atmosphere is converted into SO2 VCDs using an air mass factor from radiative transfer models and assuming hypothetical atmospheric layers representative of different scenarios of emissions. For the SO2 VCDs used in this study, an SO2 plume in the lower stratosphere (~15 km) is considered.
AIRS and IASI data are also commonly used to distinguish between the presence of ash and SO2. However, for the current work, we use all available data only for defining the area occupied by the VC, regardless of the type of volcanic aerosol.

2.2. Cloud-Aerosol Lidar with Orthogonal Polarization (CALIOP) Data

We have used vertical backscatter distributions (CAL_LID_L1, version V4 standard level 1 product in the 532 nm wavelength and the CAL_LID_L15 version V1 standard level 1.5 product in the 532 nm wavelength) acquired by the Cloud-Aerosol LIdar with Orthogonal Polarization (CALIOP) on board the CALIPSO satellite to estimate the VC altitude at high vertical resolution and validate our estimations with GNSS RO. CALIOP has a vertical resolution of 60 m and a horizontal resolution of 1000 m between 9–20 km [37]. We have used as reference the backscatter, instead of the CALIPSO cloud mask, to get a higher sensitivity and resolution on the cloud detection. The cloud top and bottom altitudes were manually retrieved selecting the altitude of the highest and lowest pixels within the cloud having a backscatter value larger than the background noise.

2.3. GNSS RO Data

GNSS RO is an active limb sounding method that uses a satellite-to-satellite link. Radio signals travel from the transmitter satellites to a receiver on a Low Earth Orbit (LEO) satellite. The signal propagation is influenced by the Earth’s refractivity field, and thus, it provides a vertical scan of the entire troposphere and stratosphere within about one minute [22]. Generally, the vertical resolution ranges from near 0.1 km in the lower troposphere to about 1 km in the stratosphere [22,38]. We used RO bending angle (BA) data processed by the Wegener Center for Climate and Global Change (WEGC) with the Occultation Processing System (OPS) version 5.6 that includes a combined geometric optics and wave optics retrieval [39], with transition from geometric optics to wave optics near or somewhat below the tropopause. This retrieval approach yields a vertical stratospheric resolution of 0.5 to 1 km and low noise level [40]. In 2019, Zeng et al. showed that the effective vertical resolution of RO measurements in the upper troposphere and lower stratosphere is about 0.2 km near the tropopause and about 0.5 km in the lower stratosphere at low to mid-latitudes [41]. The best resolution of 0.1 km is found at the cold-point tropical tropopause. At high latitudes, the effective resolution is about 0.2 km at 10–15 km to about 1.4 km at 22–27 km [41].
Several GNSS RO missions are available from the time of the eruption of 2008. In particular, we used data collected by the CHAllenging Minisatellite Payload (CHAMP, [42]), the Satélite de Aplicaciones Cientıficas (SAC-C, [43]), the Gravity Recovery And Climate Experiment (GRACE-A, [44,45]), the FORMOSAT-3/COSMIC [21], and the EUMETSAT/METOP missions [46]. According to Scherllin-Pirscher et al. [47,48], RO data acquired from the different missions are highly consistent (0.2 K agreement on temperature values between 4 to 35 km); thus, data inter-calibration or homogenization is not a necessary step [49,50].

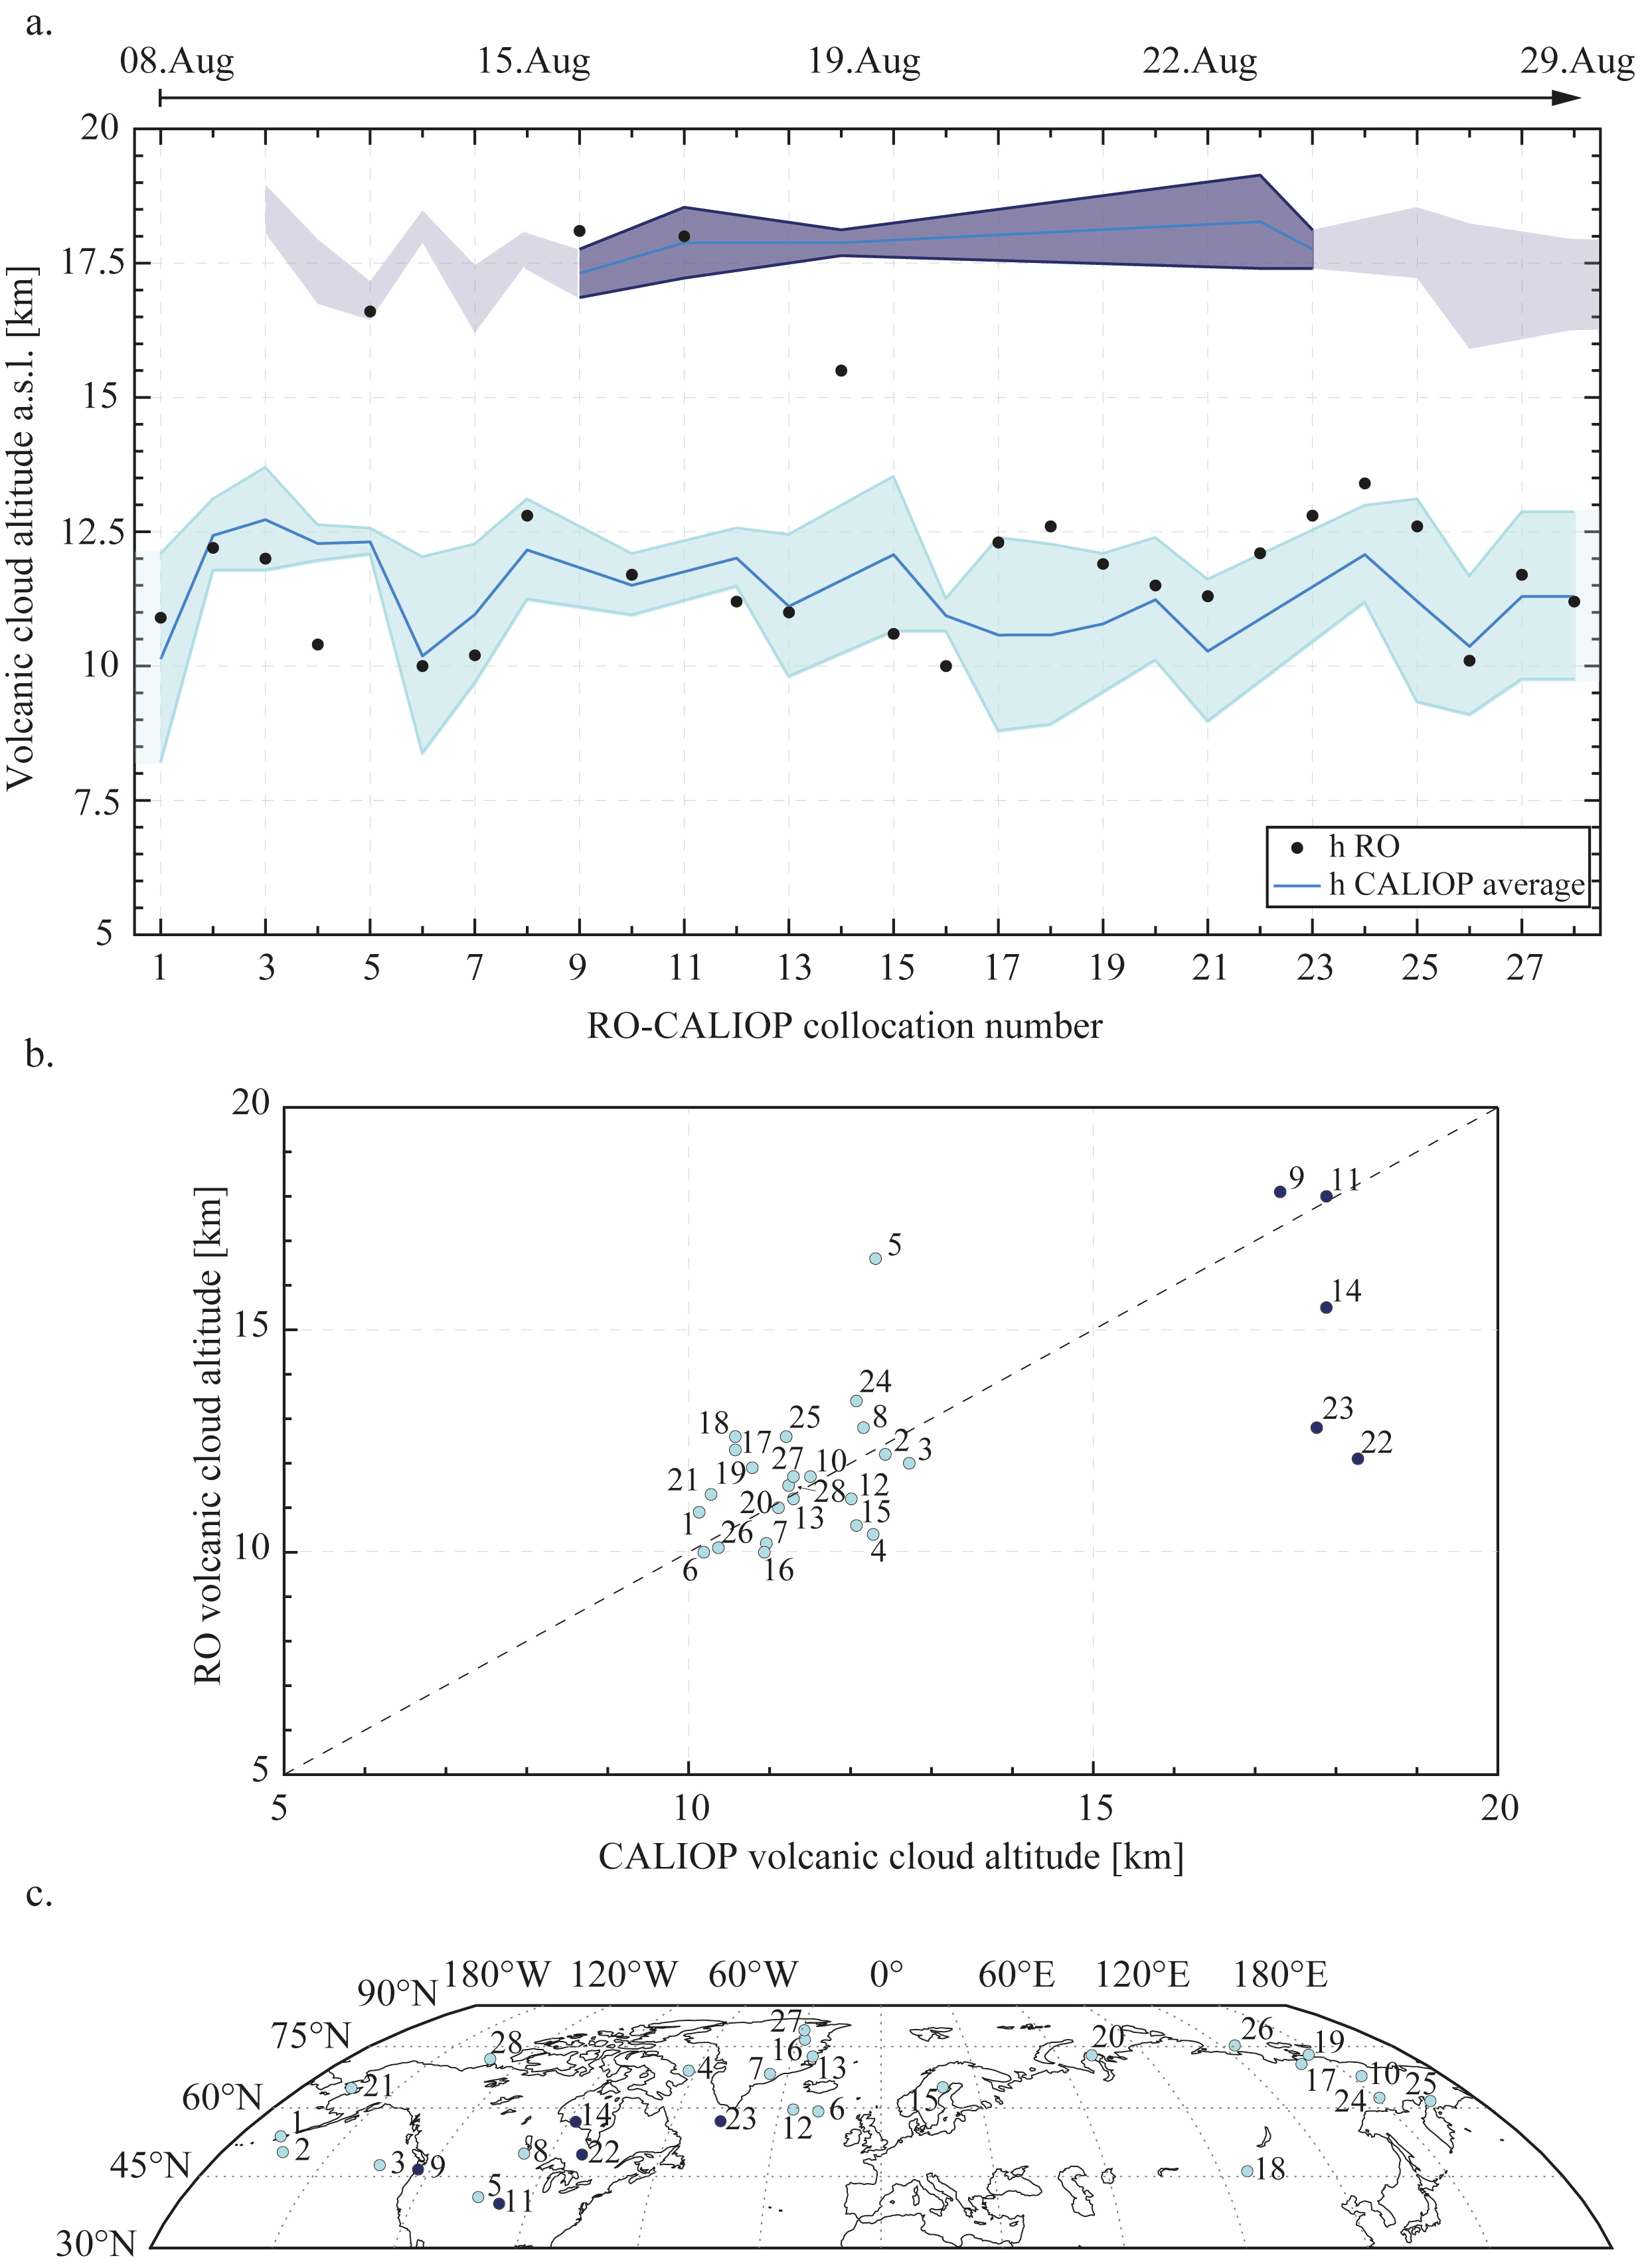
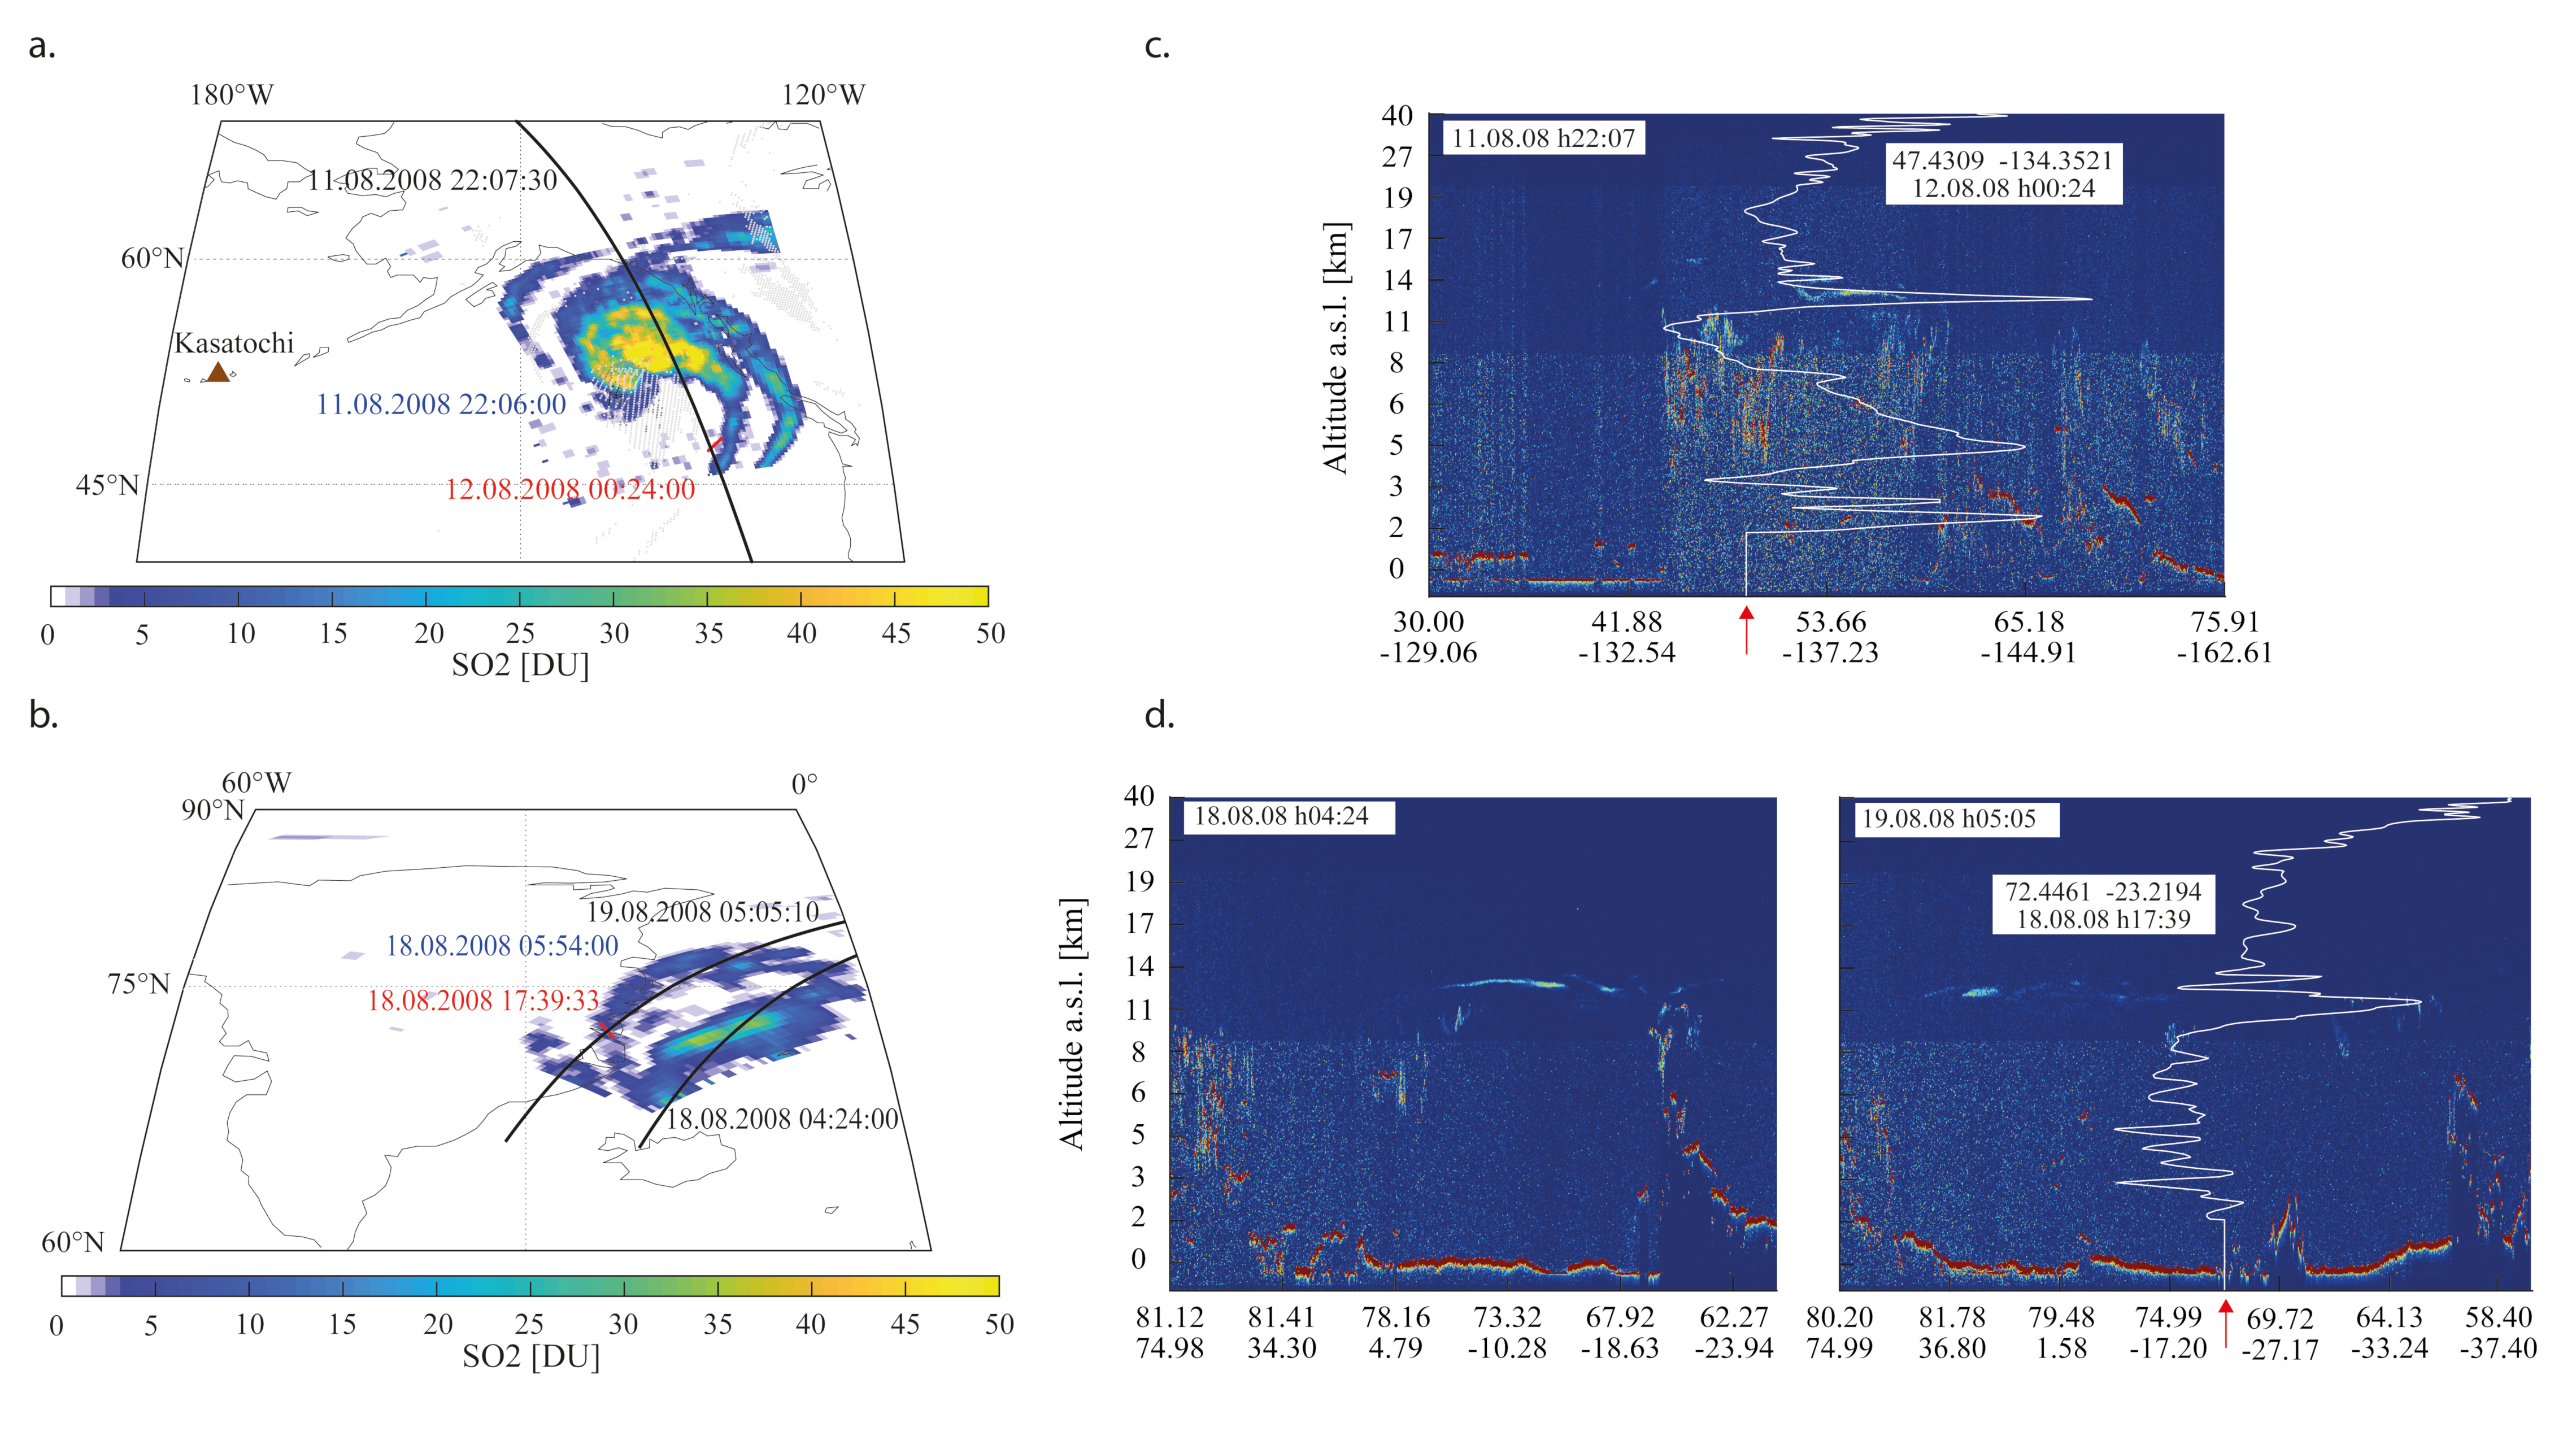
2.4. Collocations of Satellites and RO Profiles

First, we collocated spatially ±0.2° and temporally ±12 h all the RO profiles available in August 2008 with the volcanic aerosol maps provided by AIRS, IASI, and GOME-2 acquisitions using an ad hoc Matlab algorithm. The selection provided an initial dataset of 3700 RO profiles collocated with the Kasatochi VC from eruption day until the end of August. However, we focused on the detection of the VC altitude with high accuracy. Thus, we ran the second round of collocation in the same spatial and temporal range between the 3700 RO profiles collocated with the VC and the 10 s increment CALIOP tracks for August 2008. The second and final round provided a dataset, which includes a total of 28 RO profiles collocated with volcanic aerosols from the Kasatochi eruption with high confidence (see Tables S1 and S2 in Supplementary Material for details). Note, that we did not collocate all the RO profiles available for August 2008 on CALIOP tracks directly because the resulting dataset would have included many profiles outside the VC, requiring a time-consuming manual check of the presence of volcanic aerosol on CALIOP backscatter images. In fact, to the knowledge of the authors, a detailed database containing spatial and temporal information about volcanic aerosol retrieved by CALIOP does not exist to date for any volcanic eruption.
The collocations are fundamental to validate our altitude estimations at this stage because RO is a blind technique in the sense that it cannot differentiate between cloud types, i.e., VCs or meteorological convective clouds, as it detects changes in the atmospheric density structure from ray bending. However, once the cloud type is determined, RO provides accurate information on cloud altitudes from vertically high resolved BA anomalies relative to the climatological background.

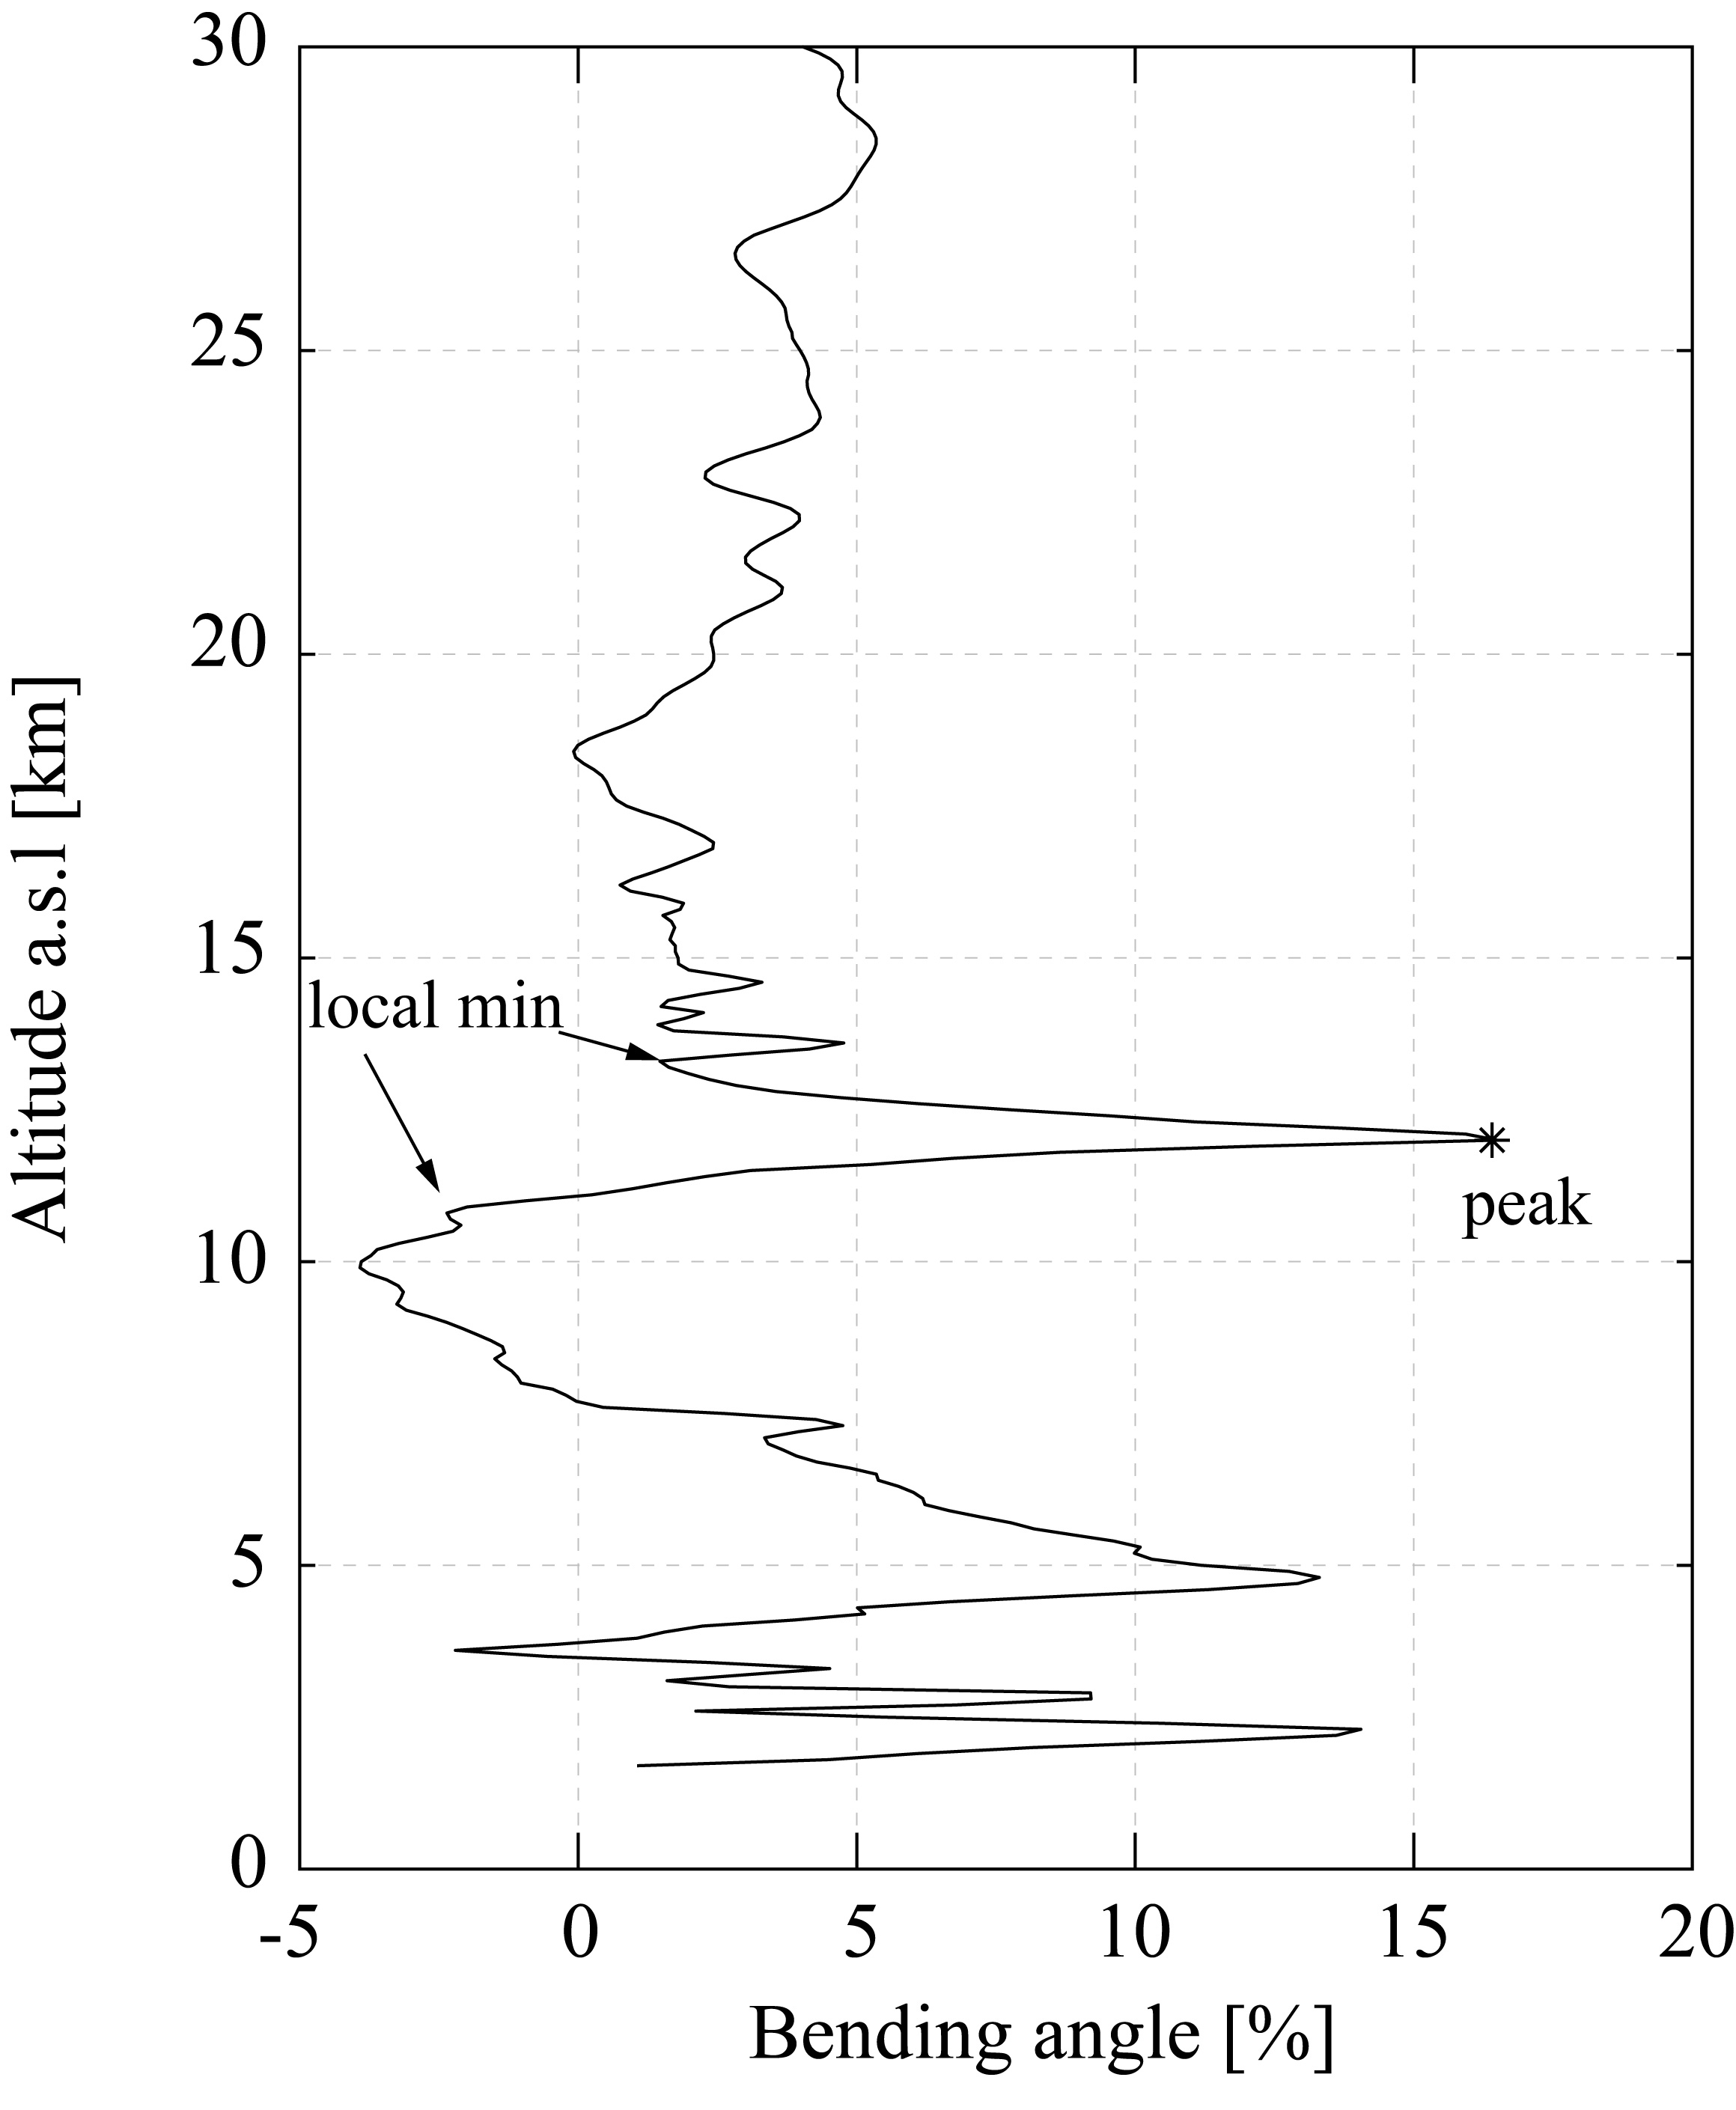
2.5. Estimation of the BA Anomaly
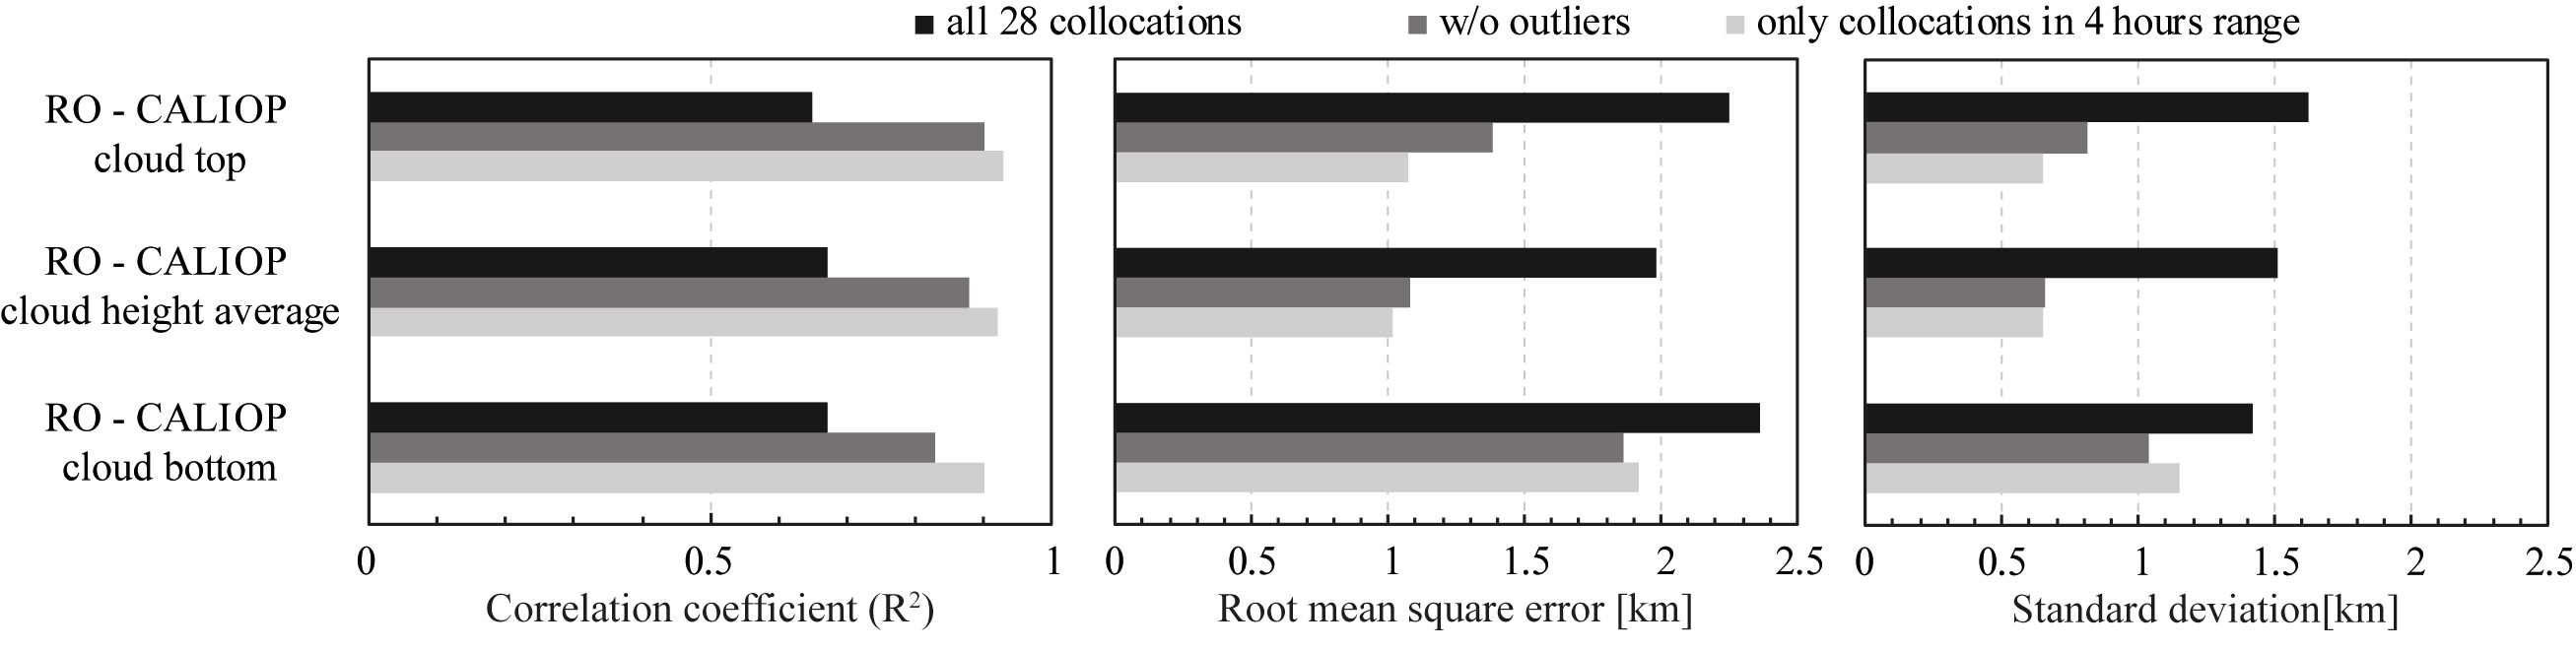
The BA reference climatology for the area of interest was calculated based on 10° latitude bands using the whole dataset of RO available from 2001 to 2017. In this way, we have obtained highly prominent anomaly peaks, more prominent than for example using a climatology calculated on a 2.5° × 2.5° grid resolution (see a comparison of the same BA anomaly profile calculated with the two different climatology method in Figure S1 in Supplementary Material). Following the methodology described in [27], the anomaly was estimated by subtracting the RO reference climatology profile from the individual RO BA profile collocated with the VC and normalized with respect to the reference climatology profile. The resulting anomaly is expressed in percentage, and a prominent peak in the BA anomaly defines the altitude of the VC.
For this case study, we have used an automated peak determination algorithm setting a minimum threshold of 5% in peak prominence, with respect to the local minimum just before and just after the peak (Figure 1). We focus on the injection of volcanic aerosol in the upper troposphere and lower stratosphere, since, at this altitude, the volcanic aerosol is more likely to be transported far from the source and for a long time after the eruption. Moreover, Kasatochi injected volcanic aerosol up to 10–11 km as estimated by, e.g., [3] and up to 13.7 km according to GVP reports, e.g., [2], at the beginning of the eruption. Thus, the algorithm has an imposed lower limit of 10 km, which also helps to avoid the detection of peaks related to the higher water vapor variation in the lower troposphere and the more pronounced presence of meteorological clouds (Figure 1). Furthermore, the VC of Kasatochi was generally detected in separate layers between 10 km and up to 19 km in the days and weeks after the eruptive event [14,51]. Ground-based retrievals on 1 September 2008 detected three distinct layers with properties relatable to the Kasatochi’s volcanic aerosols at 10–12 km, 14–15 km, and 17–17.5 km, respectively [8].

3. Results

Figure 2 presents the Kasatochi’s VC altitude estimations using the GNSS RO BA anomaly profiles. Figure 3 and Table S3 in the Supplementary Material summarize the resulting correlation coefficient (R2), root-mean-square error (rmse), and standard deviation (std). Furthermore, Table S1 in the Supplementary Material presents the summary of the data plotted in Figure 2, including the altitude estimations from CALIOP backscatter used as validation for the altitude estimations obtained on RO BA anomaly profiles. Table S2 in Supplementary Materials lists the date and time of each collocated RO profile together with the date and time of the related CALIOP, AIRS, IASI, and GOME-2 acquisitions. In a few cases, given the collocation criteria used (i.e., ±12 h and ±0.2°) the same RO profile is collocated with two sensors’ acquisitions (between AIRS, IASI, and GOME-2) at different times. This information is important because it gives one further indication that the VC was actually in the same area for several hours.
The VC altitude estimated from the RO BA anomaly profiles and the CALIOP backscatter is generally in good agreement (Figure 2a,b) with a rmse of about 2 km maximum (Figure 3). According to literature, up to three separate layers of volcanic aerosol related to the Kasatochi eruptions have been detected at different times in specific locations [8,51]. We have not observed multiple peaks on the collocated RO anomaly profiles that could be related to the simultaneous presence of different volcanic aerosol layers. However, Figure 2a shows that the volcanic aerosol was dispersed in at least two layers and that we have detected them in different locations at different times: One between 10 to 13 km and one between 16 to 19 km. The layers, in lighter and darker shades of blue in Figure 2a, are reconstructed from the cloud top and bottom altitude estimation on the collocated CALIOP backscatter. The gray shaded areas at the extremes of the upper dark blue layer in Figure 2a only represents the continuous temporal extension of this layer estimated from non-collocated backscatter in the first days after the eruption and towards the end of August. Figure 2c provides the spatial distribution of the 28 collocations on a map showing the wide VC dispersion.
We have observed at least three outlier points (collocation number: 5, 22, and 23, respectively) in the estimations proposed (Figure 2b). They can be explained as follows: In the case of collocation number 5 by an extremely noisy BA profile; while for collocation number 22 and 23 by a combination of the small horizontal extension of the VC (according to the related backscatter) and the presence of meteorological clouds at 10–12 km detected by the BA anomaly. If volcanic aerosol was included in the meteorological cloud, it might not be discerned by CALIOP, and we cannot state whether the anomaly peak detects the presence of volcanic aerosol within a meteorological cloud. Also, the temporal collocation is in the 12 h range in the latter two cases, which makes the interpretation of the peaks difficult. Figures showing the backscatter image and the collocated BA anomaly profile are shown in the Supplementary Material, Figures S2–S4, respectively. By considering these three points negligible, a recalculation of the statistical parameters shows an enhanced R2 of 0.88 and a reduced rmse of 1.08 km compared to the average CALIOP cloud altitude. Moreover, we have resampled the collocations in the ±4-h range reducing our dataset to eight profiles (collocation number: 2, 3, 9, 18, 19, 24, 26, and 28), but obtaining an enhanced R2 of 0.92 and a reduced rmse of 1.02 km compared to the average CALIOP cloud altitude.
Figure 4a,b show examples of collocations between AIRS maps, CALIOP tracks (black line), and RO profiles (red line) on a map, where both SO2 (color bar) and ash (if present, greyscale dots) detected with AIRS are plotted. Figure 4c,d show CALIOP backscatter images related to the maps with the collocated RO BA anomaly profile superimposed. The x-axis of the backscatter images represents CALIOP tracks’ geographical coordinates. In particular, Figure 4a,c show a collocation on the 11 August 2008 with a very prominent spike of the BA anomaly. The RO profile was acquired only two hours after AIRS and CALIOP acquisitions and about six hours after the acquisition from IASI (see also Table S2 in Supplementary Material), the BA anomaly peak at 12 km corresponds very well with the thin layer of volcanic aerosol shown in the backscatter image. Finally, Figure 4 b,d show a collocation on the 18–19 August 2008, just above Iceland. This collocation is peculiar because the satellite CALIPSO passed twice in 24 h in the area. Thus, it double checked the presence of the VC also detected with the BA anomaly, which is temporally collocated in between the two CALIPSO paths. Also, in this case, the BA anomaly peak at 11 km corresponds very well with the presence of the VC on the backscatter images.

4. Discussion

Explosive volcanic eruptions can inject large and hazardous amount of gas and volcanic ash in the atmosphere, which may be transported for hundreds of km from the source over several days and weeks after the eruption if they reach the stratosphere. Airplanes are currently recommended to avoid VCs, due to the threat posed by the ingestion of volcanic ash in their turbines. According to, for example, the latest update of the ‘Guidance regarding flight operations in the vicinity of volcanic ash’ issued by the UK Civil Aviation Authority (CAA) in 2017, it is recommended to consider volcanic ash a solid obstacle to be avoided by flying at least 600 m above it [52]. However, the different detection and dispersion models available often lead to estimated altitude values, which can differ by up to several km [6,53]. A higher vertical resolution tool for the detection and monitoring of VCs is still needed [18,53,54,55]. GNSS ROs have shown the potential of providing high-accurate atmospheric vertical profiles for the detection of large convective events and from this study show high potential towards operational monitoring of VCs.
The eruption of Kasatochi volcano in 2008 offered the perfect study case to test the GNSS RO potential. The large VC was injected in the local stratosphere and detected by several instruments, both by satellite-based and ground-based instruments and thus accurately studied (e.g., [1,3,4,8,9,13]). By collocating available RO profiles with the acquisitions of AIRS, IASI, GOME-2, and in particular CALIOP we have obtained 28 collocated profiles within 12 h and 0.2° range tracking the Kasatochi VC for the first 20 days from the eruptive event. The related detection of the VC altitude using the peak of the BA anomaly profiles results in a rmse of ~2 km with respect to the cloud altitude from CALIOP backscatter. The rmse reduces to 1.02 km when limiting the collocation range to ±0.2° and ±4 h. The results are very encouraging; nevertheless, limitations in the methodology need to be taken into account at the present state.
In 2008 the number of RO profiles available was about 2800 per day, at the same time the only available satellite-based lidar was (and still is) CALIOP, which results in the final small number of collocations found and thus determines the uncertainties in our estimations. Furthermore, limiting the number of collocations temporally and keeping only the ones within a ±4 h temporal range from CALIOP, we have reduced our dataset to eight profiles only. However, we have also significantly reduced related altitude estimation errors (i.e., rmse from ~2 km to 1.02 km).
Due to the nature of the refraction method, GNSS RO cannot differentiate between VCs and convective clouds. The information on the presence of volcanic aerosol is acquired from satellite sensors working in the visible, UV, and infrared (AIRS, IASI, and GOME-2, for example) and from CALIOP backscatter information. The valuable complementary information of GNSS RO is the detection of changes in the atmospheric refractivity structure and thus the VC altitude with high vertical resolution. Lidar instruments are currently the most accurate source of cloud altitude estimation. However, ground-based instruments are limited to land deployment, while CALIOP is currently the only available satellite-based lidar, and it is reaching the end of its operational lifetime. Given the very lightweight and low costs of a GNSS receiver, it is a straightforward and cheap instrument to implement. The GNSS coverage is already global and including land, oceans, and remote areas, furthermore, with the launch of COSMIC-2 and several other private missions in recent time, the number of RO is increasing, further improving the monitoring of extreme atmospheric events. The broader sensor coverage will also provide a higher temporal resolution resulting in a more precise VC altitude detection as well as broader horizontal coverage, also enabling the detection of smaller eruptions.

5. Conclusions

We have investigated the 2008 Kasatochi VC using GNSS RO BA anomaly profiles to test the potential of the proposed methodology in VCs detection and altitude estimation. By combining RO and more typical VC dispersion monitoring sensors like AIRS, IASI, GOME-2, and CALIOP, we have tracked the VC for 20 days after the eruption of Kasatochi, and we have estimated its altitude with a rmse of about 2 km when compared to estimations on CALIOP backscatter within ±0.2° and ±12 h. Moreover, we have reached a final rmse of 1.02 km when compared to estimations on CALIOP backscatter in the ±4 h temporal range.
Currently, CALIOP backscatter, with a vertical resolution of 60 m, provides the highest accuracy cloud altitude estimations. However, CALIOP by itself has a small spatial and temporal coverage. Taking into account the limitations and advantages of GNSS RO presented, the Kasatochi eruption is a starting point that allows the development of a routine to detect and track VCs using the synergy of different satellite-based imaging techniques and the GNSS RO. Thus, providing broad coverage and maintaining a high vertical resolution on cloud altitude estimations. The final goal is to create a robust dataset of significant and energetic eruptions, i.e., at least VEI 3 since 2006 and train a neural network capable of automating the VC altitude estimation, thus enhancing the current cloud monitoring capabilities.

Supplementary Materials

The following are available online at https://www.mdpi.com/2072-4292/11/19/2199/s1, Figure S1: Bending angle anomaly comparison between climatology calculated with two different methodologies, Figure S2: CALIOP backscatter and bending angle anomaly for collocation number 5, Figure S3: CALIOP backscatter and bending angle anomaly for collocation number 22, Figure S4: CALIOP backscatter and bending angle anomaly for collocation number 23. Table S1: Altitude estimation table, Table S2: Collocations date and time, Table S3: Error estimations.

Author Contributions

Conceptualization, V.C., and R.B.; methodology, V.C., R.B., A.K.S., A.J.P., H.B., and G.K.; software, V.C., and R.B; validation, V.C., and R.B.; formal analysis, V.C., and R.B.; investigation, V.C., and R.B.; resources, R.B., A.K.S., A.J.P., H.B., and G.K.; data curation, V.C., R.B., A.K.S., A.J.P., H.B., and G.K.; writing—original draft preparation, V.C.; writing—review and editing, V.C., R.B., A.K.S., A.J.P., H.B., and G.K.; visualization, V.C.; supervision, R.B.; project administration, R.B.; funding acquisition, R.B.

Funding

The work is accomplished in the frame of the VESUVIO project funded by the Supporting Talent in ReSearch (STARS) grant at Università degli Studi di Padova, IT. A.K.S acknowledges funding by the Austrian Science Fund (FWF) under research grant P27724-NBL (VERTICLIM).

Acknowledgments

CALIOP backscatter data are freely available from the NASA Langley Research Center Atmospheric Science Data Center. We thank the Wegener Center RO and climate research team for providing the WEGC OPSv5.6 RO data, available via https://doi.org/10.25364/WEGC/OPS5.6:2019.1. NASA/JPL are thanked for making access to the AIRS data freely available. We thank Lieven Clarisse from the Université Libre de Bruxelles, for providing IASI SO2 and ash data. Thanks to EUMETSAT for providing GOME-2 data.

Conflicts of Interest

The authors declare no conflict of interest. The funders had no role in the design of the study; in the collection, analyses, or interpretation of data; in the writing of the manuscript, or in the decision to publish the results.

References

  1. Fee, D.; Steffke, A.; Garces, M. Characterization of the 2008 Kasatochi and Okmok eruptions using remote infrasound arrays. J. Geophys. Res. Atmos. 2010, 115, D00L10. [Google Scholar] [CrossRef]
  2. Global Volcanism Program (GVP). Weekly Volcanic Activity Report, 6–12 August 2008; Report on Kasatochi (USA); Sennert, S.K., Ed.; Smithsonian Institution and US Geological Survey: Washington, DC, USA, 2008. [Google Scholar]
  3. Corradini, S.; Merucci, L.; Prata, A.J.; Piscini, A. Volcanic ash and SO2 in the 2008 Kasatochi eruption: Retrievals comparison from different IR satellite sensors. J. Geophys. Res. Atmos. 2010, 115, D00L21. [Google Scholar] [CrossRef]
  4. Karagulian, F.; Clarisse, L.; Clerbaux, C.; Prata, A.J.; Hurtmans, D.; Coheur, P.F. Detection of volcanic SO2, ash, and H2SO4 using the Infrared Atmospheric Sounding Interferometer (IASI). J. Geophys. Res. Atmos. 2010, 115, D00L02. [Google Scholar] [CrossRef]
  5. Carboni, E.; Grainger, R.G.; Mather, T.A.; Pyle, D.M.; Thomas, G.E.; Siddans, R.; Smith, A.J.A.; Dudhia, A.; Koukouli, M.E.; Balis, D. The vertical distribution of volcanic SO2 plumes measured by IASI. Atmos. Chem. Phys. 2016, 16, 4343–4367. [Google Scholar] [CrossRef]
  6. Carn, S.A.; Clarisse, L.; Prata, A.J. Multi-decadal satellite measurements of global volcanic degassing. J. Volcanol. Geotherm. Res. 2016, 311, 99–134. [Google Scholar] [CrossRef]
  7. Guffanti, M.; Schneider, D.J.; Wallace, K.L.; Hall, T.; Bensimon, D.R.; Salinas, L.J. Aviation response to a widely dispersed volcanic ash and gas cloud from the August 2008 eruption of Kasatochi, Alaska, USA. J. Geophys. Res. Atmos. 2010, 115, D00L19. [Google Scholar] [CrossRef]
  8. Hoffmann, A.; Ritter, C.; Stock, M.; Maturilli, M.; Eckhardt, S.; Herber, A.; Neuber, R. Lidar measurements of the Kasatochi aerosol plume in August and September 2008 in Ny-Ålesund, Spitsbergen. J. Geophys. Res. Atmos. 2010, 115, D00L12. [Google Scholar] [CrossRef]
  9. Arnoult, K.M.; Olson, J.V.; Szuberla, C.A.L.; McNutt, S.R.; Garcés, M.A.; Fee, D.; Hedlin, M.A.H. Infrasound observations of the 2008 explosive eruptions of Okmok and Kasatochi volcanoes, Alaska. J. Geophys. Res. Atmos. 2010, 115, D00L15. [Google Scholar] [CrossRef]
  10. Krotkov, N.A.; Schoeberl, M.R.; Morris, G.A.; Carn, S.; Yang, K. Dispersion and lifetime of the SO2 cloud from the August 2008 Kasatochi eruption. J. Geophys. Res. Atmos. 2010, 115, D00L20. [Google Scholar] [CrossRef]
  11. Bitar, L.; Duck, T.J.; Kristiansen, N.I.; Stohl, A.; Beauchamp, S. Lidar observations of Kasatochi volcano aerosols in the troposphere and stratosphere. J. Geophys. Res. Atmos. 2010, 115, D00L13. [Google Scholar] [CrossRef]
  12. Mattis, I.; Siefert, P.; Müller, D.; Tesche, M.; Hiebsch, A.; Kanitz, T.; Schmidt, J.; Finger, F.; Wandinger, U.; Ansmann, A. Volcanic aerosol layers observed with multiwavelength Raman lidar over central Europe in 2008–2009. J. Geophys. Res. Atmos. 2010, 115, D00L04. [Google Scholar] [CrossRef]
  13. Prata, A.J.; Gangale, G.; Clarisse, L.; Karagulian, F. Ash and sulfur dioxide in the 2008 eruptions of Okmok and Kasatochi: Insights from high spectral resolution satellite measurements. J. Geophys. Res. Atmos. 2010, 115, D00L18. [Google Scholar] [CrossRef]
  14. Kristiansen, N.I.; Stohl, A.; Prata, A.J.; Richter, A.; Eckhardt, S.; Seibert, P.; Hoffmann, A.; Ritter, C.; Bitar, L.; Duck, T.J.; et al. Remote sensing and inverse transport modeling of the Kasatochi eruption sulfur dioxide cloud. J. Geophys. Res. Atmos. 2010, 115, D00L16. [Google Scholar] [CrossRef]
  15. Jurkat, T.; Voigt, C.; Arnold, F.; Schlager, H.; Aufmhoff, H.; Schmale, J.; Schneider, J.; Lichtenstern, M.; Dörnbrack, A. Airborne stratospheric ITCIMS measurements of SO2, HCl, and HNO3 in the aged plume of volcano Kasatochi. J. Geophys. Res. Atmos. 2010, 115, D00L17. [Google Scholar] [CrossRef]
  16. Bourassa, A.E.; Degenstein, D.A.; Elash, B.J.; Llewellyn, E.J. Evolution of the stratospheric aerosol enhancement following the eruptions of Okmok and Kasatochi: Odin-OSIRIS measurements. J. Geophys. Res. Atmos. 2010, 115, D00L03. [Google Scholar] [CrossRef]
  17. Kravitz, B.; Robock, A.; Bourassa, A. Negligible climatic effects from the 2008 Okmok and Kasatochi volcanic eruptions. J. Geophys. Res. Atmos. 2010, 115, D00L05. [Google Scholar] [CrossRef]
  18. Tupper, A.; Carn, S.; Davey, J.; Kamada, Y.; Potts, R.; Prata, F.; Tokuno, M. An evaluation of VC detection techniques during recent significant eruptions in the western “Ring of Fire”. Remote Sens. Environ. 2004, 91, 27–46. [Google Scholar] [CrossRef]
  19. Kahn, R.A.; Limbacher, J.A. Eyjafjalljökull Volcano Plume Particle-Type Characterization from Space-Based Multi-angle Imaging. Atmos. Chem. Phys. 2012, 12, 9459–9477. [Google Scholar] [CrossRef]
  20. de Michele, M.; Raucoules, D.; Arason, Þ. Volcanic Plume Elevation Model and its velocity derived from Landsat 8. Remote Sens. Environ. 2016, 176, 219–224. [Google Scholar] [CrossRef]
  21. Anthes, R.A.; Bernhardt, P.A.; Chen, Y.; Cucurull, L.; Dymond, K.F.; Ector, D.; Healy, S.B.; Ho, S.; Hunt, D.C.; Kuo, Y.; et al. The COSMIC/Formosat/3 mission: Early results. Bull. Am. Meteorol. Soc. 2008, 89, 313–333. [Google Scholar] [CrossRef]
  22. Wang, K.Y.; Lin, S.C.; Lee, L.C. Immediate impact of the Mt Chaiten eruption on atmosphere from FORMOSAT-3/COSMIC constellation. Geophys. Res. Lett. 2009, 36, L03808. [Google Scholar] [CrossRef]
  23. Okazaki, I.; Heki, K. Atmospheric temperature changes by volcanic eruptions: GPS radio occultation observations in the 2010 Icelandic and 2011 Chilean cases. J. Volcanol. Geotherm. Res. 2012, 245, 123–127. [Google Scholar] [CrossRef]
  24. Kursinski, E.R.; Haij, G.A.; Schofield, J.T.; Linfield, R.P. Observing Earth’s atmosphere with radio occultation measurements using the Global Positioning System. J. Geophys. Res. Atmos. 1997, 102, 23429–23465. [Google Scholar] [CrossRef]
  25. Biondi, R.; Randel, W.J.; Ho, S.P.; Neubert, T.; Syndergaard, S. Thermal structure of intense convective clouds derived from GPS radio occultations. Atmos. Chem. Phys. 2012, 12, 5309–5318. [Google Scholar] [CrossRef] [Green Version]
  26. Biondi, R.; Steiner, A.K.; Kirchengast, G.; Rieckh, T. Characterization of thermal structure and conditions for overshooting of tropical and extratropical cyclones with GPS radio occultation. Atmos. Chem. Phys. 2015, 15, 5181–5193. [Google Scholar] [CrossRef] [Green Version]
  27. Biondi, R.; Steiner, A.K.; Kirchengast, G.; Brenot, H.; Rieckh, T. Supporting the detection and monitoring of VCs: A promising new application of Global Navigation Satellite System radio occultation. Adv. Space Res. 2017, 60, 2707–2722. [Google Scholar] [CrossRef]
  28. Carn, S.A.; Fioletov, V.E.; McLinden, C.A.; Li, C.; Krotkov, N.A. A decade of global volcanic SO2 emissions measured from space. Sci. Rep. 2017, 7, 44095. [Google Scholar] [CrossRef] [PubMed]
  29. Prata, A.J.; Bernardo, C. Retrieval of volcanic SO2 column abundance from Atmospheric Infrared Sounder data. J. Geophys. Res. Atmos. 2007, 112. [Google Scholar] [CrossRef]
  30. Clerbaux, C.; Boynard, A.; Clarisse, L.; George, M.; Hadji-Lazaro, J.; Herbin, H.; Hurtmans, D.; Pommier, M.; Razavi, A.; Turquety, S.; et al. Monitoring of atmospheric composition using the thermal infrared IASI/MetOp sounder. Atmos. Chem. Phys. 2009, 9, 6041–6054. [Google Scholar] [CrossRef] [Green Version]
  31. Clarisse, L.; Hurtmans, D.; Clerbaux, C.; Hadji-Lazaro, J.; Ngadi, Y.; Coheur, P.F. Retrieval of sulphur dioxide from the infrared atmospheric sounding interferometer (IASI). Atmos. Meas. Tech. 2012, 5, 581–594. [Google Scholar] [CrossRef] [Green Version]
  32. Clarisse, L.; Coheur, P.F.; Prata, F.; Hadji-Lazaro, J.; Hurtmans, D.; Clerbaux, C. A unified approach to infrared aerosol remote sensing and type specification. Atmos. Chem. Phys. 2013, 13, 2195–2221. [Google Scholar] [CrossRef] [Green Version]
  33. Brenot, H.; Theys, N.; Clarisse, L.; van Geffen, J.; van Gent, J.; Van Roozendael, M.; van der A., R.; Hurtmans, D.; Coheur, P.F.; Clerbaux, C.; et al. Support to Aviation Control Service (SACS): An online service for near-real-time satellite monitoring of volcanic plumes. Nat. Hazards Earth Syst. Sci. 2014, 14, 1099–1123. [Google Scholar] [CrossRef]
  34. Munro, R.; Eisinger, M.; Anderson, C.; Callies, J.; Corpaccioli, E.; Lang, R.; Lefebvre, A.; Livschitz, Y.; Pérez Albiñana, A. GOME-2 on MetOp. In Proceedings of the 2006 EUMETSAT Meteorological Satellite Conference, Helsinki, Finland, 12–16 June 2006; p. 48. [Google Scholar]
  35. Rix, M.; Valks, P.; Hao, N.; Loyola, D.G.; Schlager, H.; Huntrieser, H.H.; Flemming, J.; Koehler, U.; Schumann, U.; Inness, A. Volcanic SO2, BrO and plume height estimations using GOME-2 satellite measurements during the eruption of Eyjafjallajökull in May 2010. J. Geophys. Res. Atmos. 2012, 117, D00U19. [Google Scholar] [CrossRef]
  36. Platt, U.; Stutz, J. Differential absorption spectroscopy. In Differential Optical Absorption Spectroscopy; Springer: Berlin/Heidelberg, Germany, 2008; pp. 135–174. [Google Scholar]
  37. Winker, D.M.; Vaughan, M.A.; Omar, A.; Hu, Y.; Powell, K.A.; Liu, Z.; Hunt, W.H.; Young, S.A. Overview of the CALIPSO mission and CALIOP data processing algorithms. J. Atmos. Ocean. Technol. 2009, 26, 2310–2323. [Google Scholar] [CrossRef]
  38. Gorbunov, M.E.; Benzon, H.H.; Jensen, A.S.; Lohmann, M.S.; Nielsen, A.S. Comparative analysis of radio occultation processing approaches based on Fourier integral operators. Radio Sci. 2004, 39, RS6004. [Google Scholar] [CrossRef]
  39. Schwärz, M.; Kirchengast, G.; Scherllin-Pirscher, B.; Schwarz, J.; Ladstädter, F.; Angerer, B. Multi-Mission Validation by Satellite Radio Occultation Extension Project—Final Report; Tech. Rep. for ESAESRIN 01/2016; Wegener Center, University of Graz: Graz, Austria, 2016; p. 164. [Google Scholar]
  40. Angerer, B.; Ladstädter, F.; Scherllin-Pirscher, B.; Schwärz, M.; Steiner, A.K.; Foelsche, U.; Kirchengast, G. Quality aspects of the Wegener Center multi-satellite GPS radio occultation record OPSv5.6. Atmos. Meas. Tech. 2017, 10, 4845–4863. [Google Scholar] [CrossRef] [Green Version]
  41. Zeng, Z.; Sokolovskiy, S.; Schreiner, W.S.; Hunt, D. Representation of Vertical Atmospheric Structures by Radio Occultation Observations in the Upper Troposphere and Lower Stratosphere: Comparison to High-Resolution Radiosonde Profiles. J. Atmos. Ocean. Technol. 2019, 36, 655–670. [Google Scholar] [CrossRef]
  42. Wickert, J.; Reigber, C.; Beyerle, G.; König, R.; Marquardt, C.; Schmidt, T.; Grunwaldt, L.; Galas, R.; Meehan, T.K.; Melbourne, W.G.; et al. Atmosphere sounding by GPS radio occultation: First results from CHAMP. Geophys. Res. Lett. 2001, 28, 3263–3266. [Google Scholar] [CrossRef] [Green Version]
  43. Hajj, G.A.; Ao, C.O.; Iijima, B.A.; Kuang, D.; Kursinski, E.R.; Mannucci, A.J.; Meehan, T.K.; Romans, L.J.; de la Torre Juarez, M.; Yunck, T.P. CHAMP and SAC-C atmospheric occultation results and intercomparisons. J. Geophys. Res. Atmos. 2004, 109, D06109. [Google Scholar] [CrossRef]
  44. Beyerle, G.; Schmidt, T.; Michalak, G.; Heise, S.; Wickert, J.; Reigber, C. GPS radio occultation with GRACE: Atmospheric profiling utilizing the zero difference technique. Geophys. Res. Lett. 2005, 32, L13806. [Google Scholar] [CrossRef]
  45. Wickert, J.; Schmidt, T.; Michalak, G.; Heise, S.; Arras, C.; Beyerle, G.; Falck, C.; König, R.; Pingel, D.; Rothacher, M. GPS radio occultation with CHAMP, GRACE-A, SAC-C, TerraSAR-X, and FORMOSAT-3/COSMIC: Brief review of results from GFZ. In New Horizons in Occultation Research: Studies in Atmosphere and Climate; Steiner, A.K., Pirscher, B., Foelsche, U., Kirchengast, G., Eds.; Springer: Berlin/Heidelberg, Germany, 2009; pp. 3–15. [Google Scholar]
  46. Luntama, J.P.; Kirchengast, G.; Borsche, M.; Foelsche, U.; Steiner, A.; Healy, S.; von Engeln, A.; O’Clerigh, E.; Marquardt, C. Prospects of the EPS GRAS mission for operational atmospheric applications. Bull. Am. Meteorol. Soc. 2008, 89, 18631875. [Google Scholar] [CrossRef]
  47. Scherllin-Pirscher, B.; Steiner, A.K.; Kirchengast, G.; Kuo, Y.H.; Foelsche, U. Empirical analysis and modeling of errors of atmospheric profiles from GPS radio occultation. Atmos. Meas. Tech. 2011, 4, 1875–1890. [Google Scholar] [CrossRef] [Green Version]
  48. Scherllin-Pirscher, B.; Steiner, A.K.; Kirchengast, G.; Schwärz, M.; Leroy, S.S. The power of vertical geolocation of atmospheric profiles from GNSS radio occultation. J. Geophys. Res. Atmos. 2017, 122, 1595–1616. [Google Scholar] [CrossRef]
  49. Foelsche, U.; Scherllin-Pirscher, B.; Ladstädter, F.; Steiner, A.K.; Kirchengast, G. Refractivity and temperature climate records from multiple radio occultation satellites consistent within 0.05%. Atmos. Meas. Tech. 2011, 4, 2007–2018. [Google Scholar] [CrossRef] [Green Version]
  50. Steiner, A.K.; Lackner, B.C.; Ladstädter, F.; Scherllin-Pirscher, B.; Foelsche, U.; Kirchengast, G. GPS radio occultation for climate monitoring and change detection. Radio Sci. 2011, 46, RS0D24. [Google Scholar] [CrossRef]
  51. Schmale, J.; Schneider, J.; Jurkat, T.; Voigt, C.; Kalesse, H.; Rautenhaus, M.; Lichtenstern, M.; Schlager, H.; Ancellet, G.; Arnold, F.; et al. Aerosol layers from the 2008 eruptions of Mount Okmok and Mount Kasatochi: In situ upper troposphere and lower stratosphere measurements of sulfate and organics over Europe. J. Geophys. Res. Atmos. 2010, 115, D00L07. [Google Scholar] [CrossRef]
  52. Civil Aviation Authority (CAA). Guidance Regarding Flight Operations in the Vicinity of Volcanic Ash. 2017. Available online: http://publicapps.caa.co.uk/modalapplication.aspx?appid=11&catid=1&id=6464&mode=detail&pagetype=65 (accessed on 7 July 2019).
  53. Tupper, A.; Wunderman, R. Reducing discrepancies in ground and satellite-observed eruption heights. J. Volcanol. Geotherm. Res. 2009, 186, 22–31. [Google Scholar] [CrossRef]
  54. Tupper, A.; Itikarai, I.; Richards, M.; Prata, F.; Carn, S.; Rosenfeld, D. Facing the Challenges of the International Airways Volcano Watch: The 2004/05 Eruptions of Manam, Papua New Guinea. Weather Forecast. 2007, 22, 175–191. [Google Scholar] [CrossRef]
  55. Zehner, C. Monitoring volcanic ash from space. In Proceedings of the ESA-EUMETSAT Workshop on the 14 April to 23 May 2010 Eruption at the Eyjafjallajökull Volcano, South Iceland, Frascati, Italy, 26–27 May 2010; ESA-Publication STM-280. 2010. [Google Scholar]
Figure 1. Example of a bending angle (BA) anomaly profile for collocation number 3 also shown in Figure 4c. The y-axis represents the altitude in km above sea level (a.s.l.), while the x-axis represents the BA anomaly expressed as a percentage with respect to the reference climatology. The peak corresponding to the volcanic cloud is highlighted with a star, while the arrows indicate the local minima that the algorithm uses to detect the peak.
Remotesensing 11 02199 g001
Figure 2. (a) Plot showing on the y-axis the volcanic cloud (VC) altitude in km a.s.l. detected from the radio occultation (RO) BA anomaly profiles peaks (black dots) compared to the average VC altitude estimated from Cloud-Aerosol Lidar with Orthogonal Polarization (CALIOP) backscatter (blue line). The shaded areas correspond to the top, and bottom altitude of the two layers of VC estimated from the collocated backscatter. Only in the upper layer, the light gray extremes represent estimations on backscatter that is not collocated with any RO profile but was acquired around the same time window. On the x-axis, the RO-CALIOP collocation number in chronological order, see arrow above for the temporal indication. (b) Scatter plot between the VC altitude estimated from the RO BA anomaly (y-axis) and CALIOP backscatter (average values, x-axis). (c) Map showing the spatial distribution of the collocated RO profiles. In both (b) and (c) the same color code and number sequence of plot (a) applies.
Remotesensing 11 02199 g002
Figure 3. Error estimations. From left to right, the graphs show the correlation coefficient (R2), the root mean square error (rmse), and the standard deviation (std) of the VC altitude estimates from the RO BA anomaly and CALIOP backscatter. Shown are in black the values obtained when we consider all the 28 collocated profiles, in dark gray the values when we exclude the outliers (collocation number 5, 22 and 23), and in light gray the values for collocations within the 4 h range.
Remotesensing 11 02199 g003
Figure 4. On the left, (a) and (b) are maps showing the dispersion of the VC ejected by Kasatochi and comprised of both SO2 in Dobson Units [DU] (color bar) and ash (if present dots in different greyscale) as detected by atmospheric infrared sounder (AIRS) on 11 and 18 August 2008 (collocation number three and 12, respectively). On the same maps the Cloud-Aerosol Lidar and Infrared Pathfinder Satellite Observation (CALIPSO) track (black line) and the collocated RO profile (red line) are shown. The dates and times represent the passage of the satellites for the present collocation, in blue AIRS, in black CALIOP, and red the RO profile. Brown triangle: Kasatochi volcano. On the right, (c) and (d) are the related CALIOP backscatter images with the BA anomaly profile collocated and superimposed. On the x-axis of (c) and (d), CALIOP tracks’ geographical coordinates. A red arrow indicates the zero on the BA anomaly profile.
Remotesensing 11 02199 g004

