Article

The 2018 Mw 7.5 Palu Earthquake: A Supershear Rupture Event Constrained by InSAR and Broadband Regional Seismograms

1
School of Geodesy and Geomatics, Wuhan University, Wuhan 430079, China
2
Key Laboratory of Geospace Environment and Geodesy, Ministry of Education, Wuhan University, Wuhan 430079, China
3
Collaborative Innovation Center of Geospatial Technology, Wuhan University, Wuhan 430079, China
4
Key Laboratory of Comprehensive and Highly Efficient Utilization of Salt Lake Resources, Qinghai Institute of Salt Lakes, Chinese Academy of Sciences, Xining 810008, China
5
Qinghai Provincial Key Laboratory of Geology and Environment of Salt Lakes, Qinghai Institute of Salt Lakes, Chinese Academy of Sciences, Xining 810008, China
*
Author to whom correspondence should be addressed.
Remote Sens. 2019, 11(11), 1330; https://doi.org/10.3390/rs11111330
Submission received: 4 April 2019 / Revised: 16 May 2019 / Accepted: 29 May 2019 / Published: 3 June 2019
(This article belongs to the Special Issue Applications of Sentinel Satellite for Geohazards Prevention)

Abstract

:
The 28 September 2018 Mw 7.5 Palu earthquake occurred at a triple junction zone where the Philippine Sea, Australian, and Sunda plates are convergent. Here, we utilized Advanced Land Observing Satellite-2 (ALOS-2) interferometry synthetic aperture radar (InSAR) data together with broadband regional seismograms to investigate the source geometry and rupture kinematics of this earthquake. Results showed that the 2018 Palu earthquake ruptured a fault plane with a relatively steep dip angle of ~85°. The preferred rupture model demonstrated that the earthquake was a supershear event from early on, with an average rupture speed of 4.1 km/s, which is different from the common supershear events that typically show an initial subshear rupture. The rupture expanded rapidly (~4.1 km/s) from the hypocenter and propagated bilaterally towards the north and south along the strike direction during the first 8 s, and then to the south. Four visible asperities were ruptured during the slip pulse propagation, which resulted in four significant deformation lobes in the coseismic interferogram. The maximum slip of 6.5 m was observed to the south of the city of Palu, and the total seismic moment released within 40 s was 2.64 × 10²⁰ N·m, which was equivalent to Mw 7.55. Our results shed some light on the transtensional tectonism in Sulawesi, given that the 2018 Palu earthquake was dominated by left-lateral strike slip (slip maxima is 6.2 m) and that some significant normal faulting components (slip maxima is ~3 m) were resolved as well.

Graphical Abstract

1. Introduction

Indonesia is located in the triple junction zone where the Philippine Sea, Australian, and Sunda plates meet and acts as one of the most seismically active zones in the world [1], within which many microblocks and intense faulting are developed (Figure 1). On September 28, 2018, a strong earthquake with a moment magnitude (Mw) of 7.5 struck the Sulawesi, Eastern Indonesia, with the epicenter located at about 70 km to the north of the city of Palu (Figure 1c). This seismic event triggered catastrophic soil liquefaction, landslides, and a tsunami as well. The earthquake ruptured along the Palu–Koro fault [2], which runs offshore through the narrow Palu Bay to the north of Sulawesi connecting with the North Sulawesi trench and extends southwards with the Matano fault in the southeast (Figure 1b). Although the triple junction zone is highly seismically active, the Palu–Koro fault hosts a relatively low level of seismicity, with a recurrence interval of about 700 years for Mw ~7–8 earthquakes inferred by palaeoseismological investigations [3]. However, previous studies documented that the Palu–Koro fault shows a fast transtensive behavior, with a left–lateral strike slip rate of 39 mm/y and an extension rate of 11~14 mm/y [1]. As one of the most active structures, the large-scale Palu–Koro fault is considered to make great contributions to the regional crustal deformation and mass lateral extrusion in the region of Sulawesi [4] and represent great seismic hazards [5,6]. Therefore, a strong earthquake is expected on this fault.
Coseismic displacement map derived from geodetic data [2,7] and early aftershocks recorded by the US Geological Survey (USGS) clearly show a long rupture extension of the 2018 Mw 7.5 Palu earthquake (over 150 km). This feature combined with the short duration of the most seismic moment release (less than 25–30 s, USGS) suggests the possibility of supershear of this earthquake. Bao et al. [2] indicated that the earthquake is an early and persistent supershear rupture event as investigated by teleseismic back-projection and far-field Rayleigh Mach waves. This supershear feature has also been documented by Socquet et al. [7] through the analysis of the space geodetic data. Ulrich et al. [8] further revealed the pervasive supershear rupture by a joint analysis of geodetic, seismic, and tsunami records. The fault slip mechanism of this earthquake was constrained by Song et al. [9] using geodetic observations. However, the published slip models vary discernibly from each other. Socquet et al. [7] showed visible thrust slip in the Sulawesi Neck, which were not resolved by Song et al. [9]. However, Socquet et al. [7] revealed a large misfit in residual line-of-sight (LOS) displacement map in the Balaesang Peninsula.
In this study, we first determined the source geometry utilizing the ALOS-2 descending data. Then we inverted for the rupture kinematics of the 2018 Palu earthquake, jointly using the ALOS-2 data and the fortunately unclipped broadband regional seismograms. From our rupture model, we obtained insights into supershear rupture features and transtensional mechanism of Sulawesi.

2. Data and Method

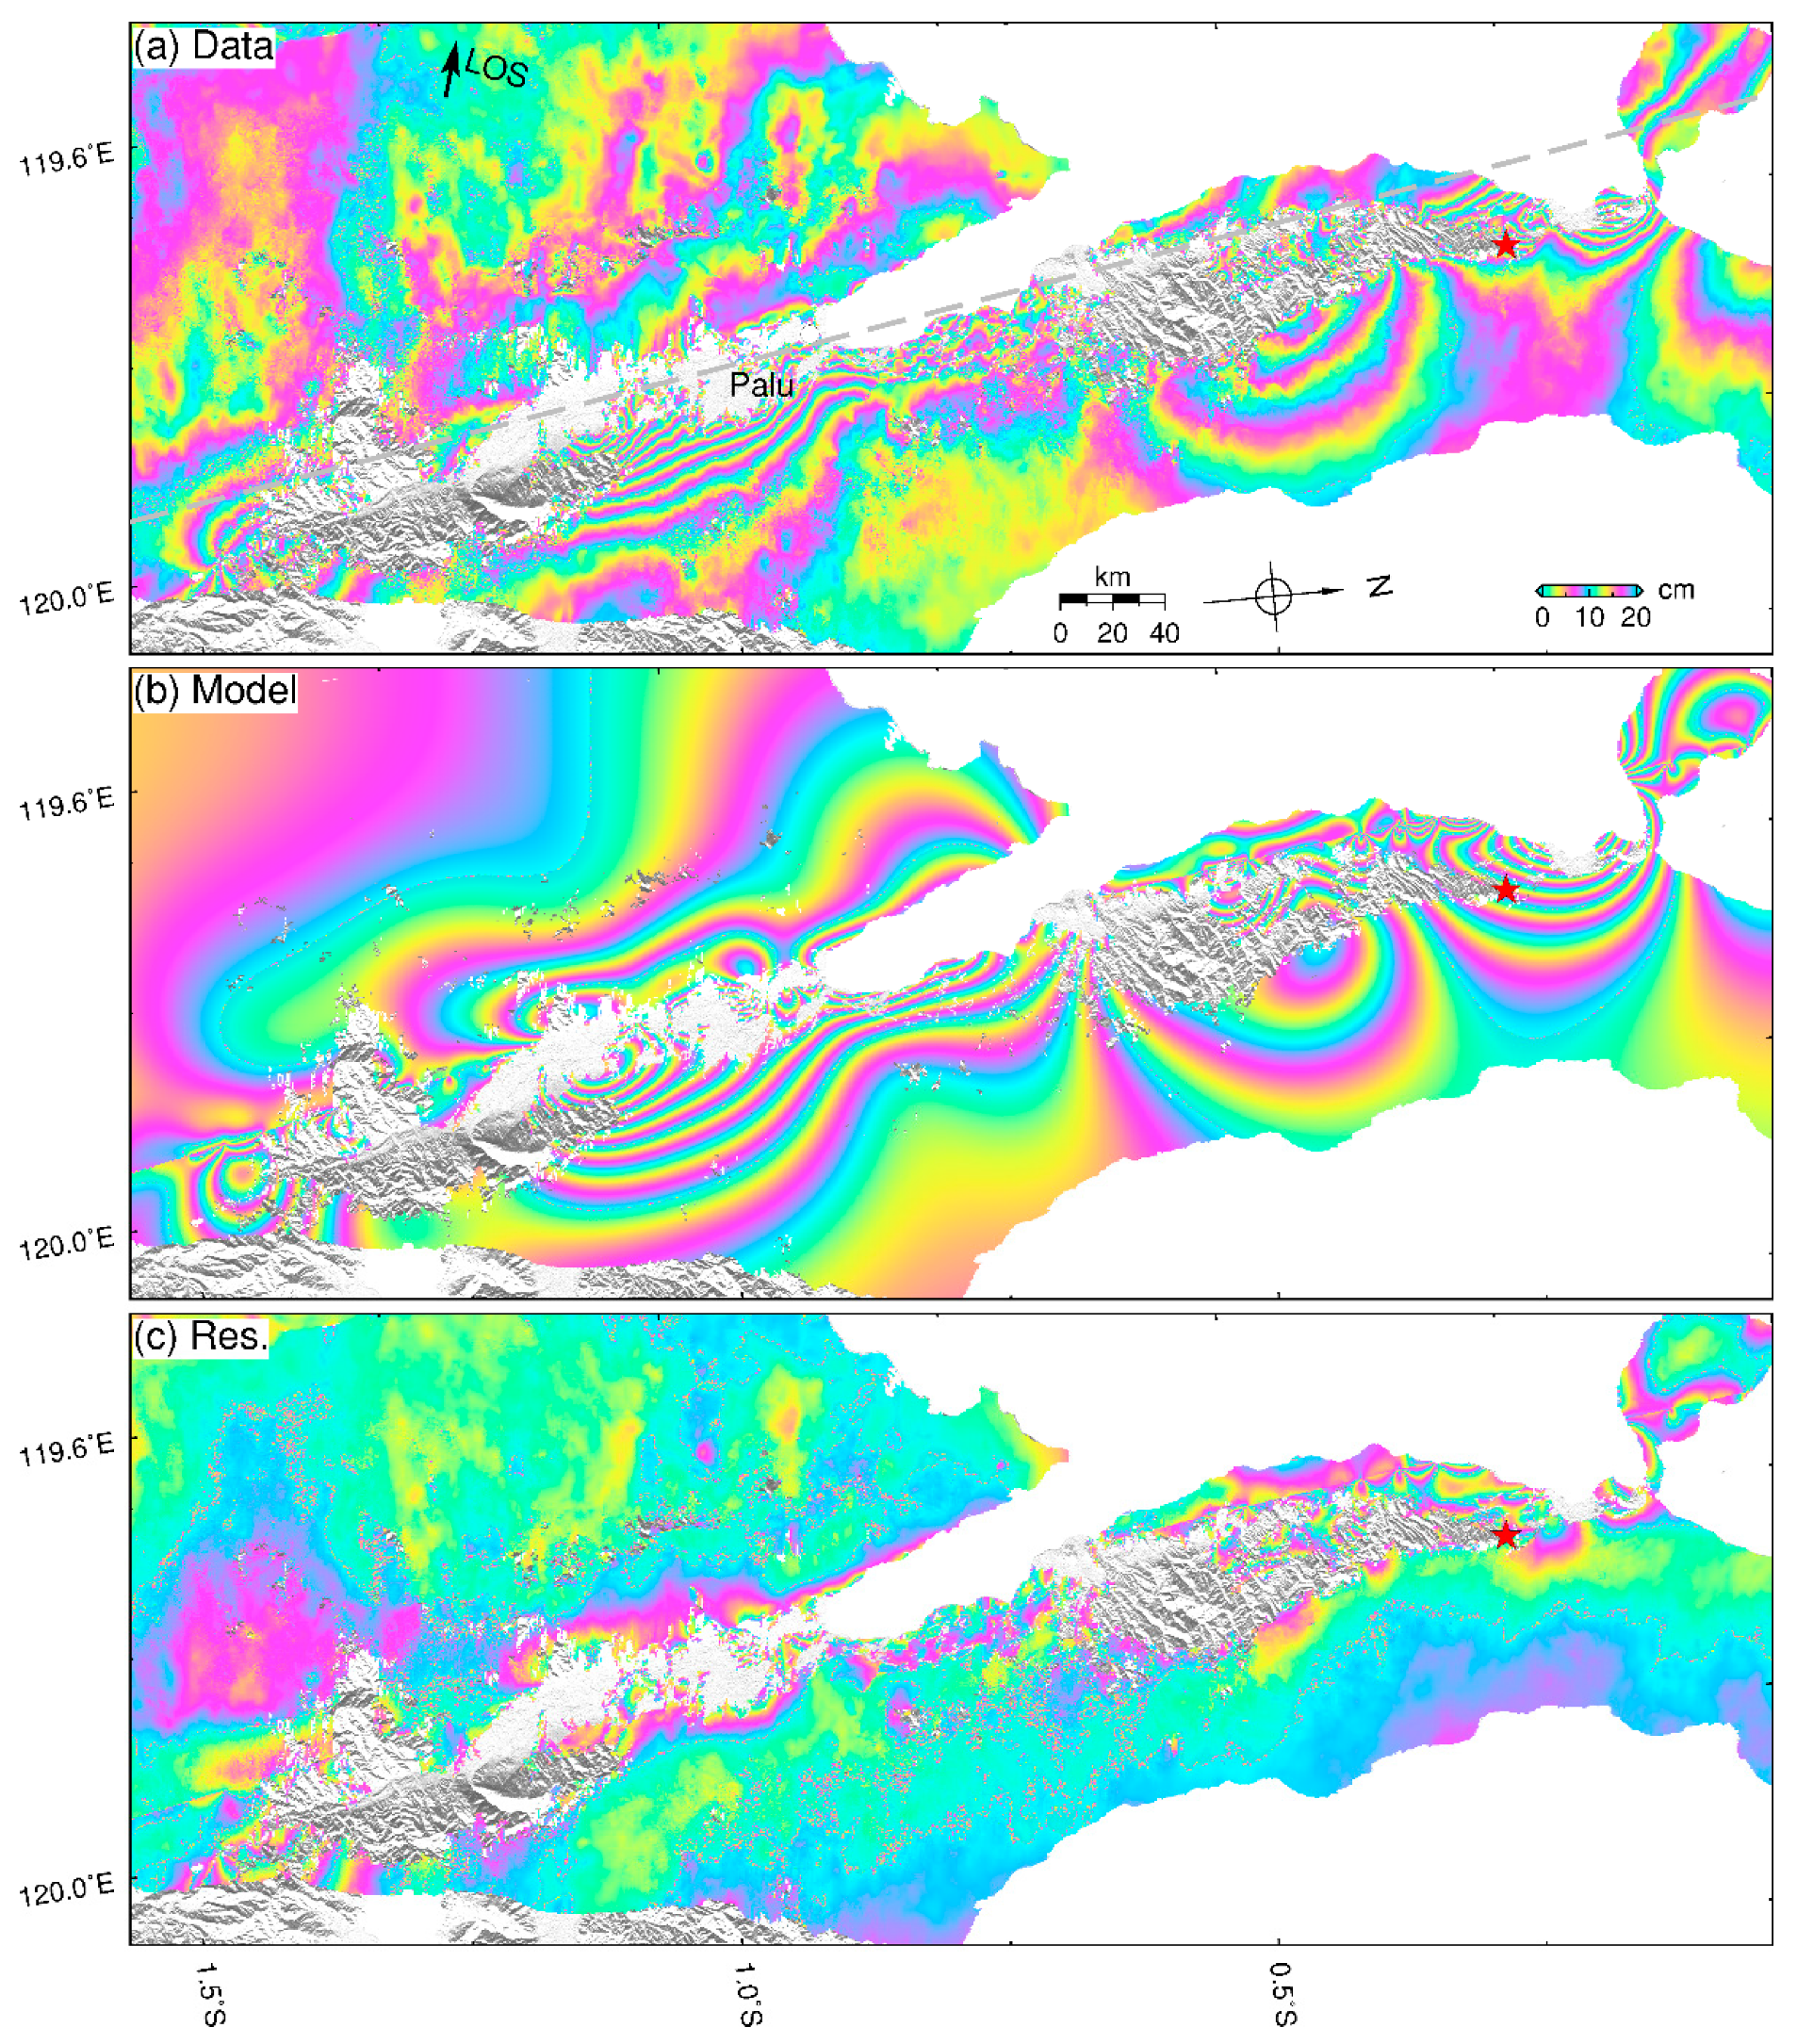
2.1. Data Processing

Due to the decorrelation problem of the Sentinel-1 data in this study area, we used the ALOS-2 descending SAR imagery to map the coseismic deformation caused by the 2018 Mw 7.5 Palu earthquake. The ALOS-2 interferogram was processed using the GAMMA remote sensing software [10]. The topographic effects in the interferogram were removed using the 30 m resolution shuttle radar topography mission (SRTM) digital elevation model (DEM) [11]. The interferogram was unwrapped using the branch cut method [12]. The unwrapped interferogram was geocoded to the WGS-84 geographic coordinates with 30 m resolution, and the relevant unwrapped phase data were converted to LOS displacement. To reduce the number of LOS displacement points and consequently improve the computational efficiency, a uniform down-sampling method [13] was employed, and finally, we obtained 3077 observations. The standard deviation was 17 mm for the interferogram, which was estimated from the ALOS-2 InSAR data in the nondeformation area using a 1-D covariance function [14].
The maximum LOS displacement is 1.1 m, and four main lobes of deformation are clearly visible (Figure 2a and Figure S1), which is in agreement with Socquet et al. [7]. The asymmetric fringe pattern, which shows more fringes on the eastern side of the fault, could suggest that the fault plane dips to east. The LOS displacement (Figure S1) shows a four-quadrant distribution pattern, which conforms to a strike-slip event. According to Socquet et al. [7], at the east of the fault, south of the city of Palu, the negative LOS displacement indicates a range increase, which is agreeable with left–lateral strike–slip and possible subsidence, as the satellite LOS direction is nearly perpendicular to the strike of the fault and the flight direction is almost southward. By contrast, the positive LOS displacement shows a range decrease, which suggests uplift, supporting local transpression at the Sulawesi neck [7]. Additionally, the deformation zone to the south of the epicenter in the Sulawesi Neck is much broader than that in other deformation regions concerning the sense of spatial extension (Figure 2a), which suggests that the earthquake has ruptured into a deeper part of the crust in this region [15]. By contrast, the deformation region to the south of the city of Palu is featured by more densely distributed fringes, allowing for a shallower rupture on this segment.
In addition, we also utilized unclipped broadband regional records from the event with a roughly homogeneous coverage on the azimuth (Figure 1a) to investigate the rupture kinematics, which could ensure high resolution of the kinematic model, whereas they were rarely used in the study of moderate-to-strong magnitude earthquake due to clipped records arising from strong shaking. We removed the instrumental response and applied a 0.02–0.2 Hz Butterworth filter considering (1) the effect of low-frequency baseline shift of near-field seismic data, (2) the effective response of frequency band of the broadband waveforms [16], as well as (3) the point-like source approximation condition of the subfault without aliasing [17,18]. Finally, three-component full displacement waveforms were obtained and used in the inversion. Although waveforms at higher frequencies can ensure higher model resolution [18], they are sensitive to the local velocity structure [19], and it is difficult to model them accurately at present due to the fact that they could introduce large errors during the inversion. By contrast, waveforms at lower frequencies are less sensitive to the velocity structure and usually have a higher signal to noise ratio. Therefore, in order to make a compromise between the model residual and resolution, the corner frequency of 0.2 Hz was determined according to an approximate formula of f c u t   ~   1 4 V s Δ L [17,18], where V s indicates the shear wave velocity and Δ L depicts the extension of the subfault.

2.2. Modeling Method

We adopted a two-step procedure to construct the rupture model of the 2018 Palu earthquake: A nonlinear inversion to constrain the source parameters assuming a uniform slip model in an elastic half-space, followed by a linear multitime window inversion to construct the rupture kinematics of the event. In the first step, we used a hybrid minimization algorithm based on the multipeak particle swarm optimization method (MPSO) [20,21] to invert the ALOS-2 InSAR data for the fault geometric parameters, by minimizing the misfits between the observed and modeled data, assuming a Poisson ratio of 0.25 and a shear modulus of 3.3 × 10¹⁰ N/m2. This algorithm combines particle swarm optimization (PSO) [22] and the downhill simplex algorithm (DSA) [23]. The PSO was employed to carry out a global search to find several local minima, and the global minimum was achieved using the DSA based on the PSO-derived local minima [24]. To simplify the fault model, we used only one fault segment to approximate the seismogenic fault, and the strike of the fault model was fixed to 352° according to the ALOS-2 InSAR interferogram pattern (Figure 2a). During the inversion, we assumed that the dip angle of the seismogenic fault was not varied along the strike. The parameters of the fault geometry obtained by inverting the InSAR observations within the most significant deformation zone at the south of the city of Palu (Figure 2a) were simply treated as the optimal parameters of the entire seismogenic fault. In addition, model solutions from 100 simulations perturbed with noise from the statistic properties based on previous 1-D covariance function in the nondeforming area [14] were used to evaluate the uncertainty of the source parameters by employing the Monte Carlo bootstrap simulation technique [25] (Figure S2).
Once the fault geometry was determined, we then extended the size of fault plane to be 200 km × 28 km and discretized it into 50 subfaults in the strike direction and 7 subfaults in the dip direction, with each subfault patch size of 4 km × 4 km. To take advantage of both the geodetic and seismic data, we followed the linear multitime window approach [26,27] to construct the rupture kinematics of the 2018 Palu earthquake using the ALOS-2 coseismic LOS displacement and broadband regional seismograms. The InSAR observations show good spatial resolution and can ensure the accuracy of static variables (fault geometry, total slip, stress drop, etc.), while the seismic waveforms present good temporal resolution, which can guarantee the time signal of the rupture process. In the joint inversion, the Green’s functions for both InSAR and broadband seismograms were computed using the frequency–wavenumber integration method [28] based on the CRUST 1.0 1-D layered velocity model. The maximum rupture velocity was set to 5.2 km/s to account for the possibility of supershear rupture, which is nearly the Eshelby speed [2]. We allowed slip on twenty-four 50% overlapping triangles with 0.8 s risetimes [29]. The rake angle was allowed to vary from −45° to 45°. Data weight determination is a tricky and cumbersome process. We followed the procedure described in Melgar et al. [30,31,32] and Chen et al. [33,34], where the relative weight ratio between ALOS-2 InSAR and broadband regional records was adjusted by trial and error repeatedly until the minimum misfit was obtained (Figure S3). We employed first derivative temporal regularization on the slip windows and Laplacian regularization on the total slip at each subfault [35]. We applied the formalism of Akaike’s Bayesian information criterion (ABIC) [36] to determine the optimal value of the temporal and spatial regularization parameters and then obtained the preferred kinematic rupture model of the event. Model solutions derived by inverting 100 sets of InSAR simulations perturbed by the standard deviation based on the previous 1-D covariance functions and 100 sets of broadband waveforms simulations perturbed by the standard deviations of 60 s of pre-event noise were used to estimate the model uncertainty.

3. Results

3.1. Geometric Parameters

Our result shows that the 2018 Mw 7.5 Palu earthquake is dominated by left–lateral strike–slip and accompanied by a significant normal-slip component, which is consistent with the transtensional tectonic mechanism of the region. The dip angle determined from the geodetic data is ~85°, steeper than some published results (Table 1). This is consistent with the result of Ulrich et al. [8], which shows a vertically dipping fault at the southernmost segment. We think it is reasonable, as steeply dipping faults are more common in strike–slip events (Table S1), e.g., the 2001 Mw 7.9 Kokoxili earthquake [37,38,39], the 2004 Mw 5.9 Parkfield earthquake [40], the 2010 Mw 6.9 Yushu earthquake [41], and the 2015 Mw 7.2 Tajikistan earthquake [42]. Our determined rake angle is comparable with the result from Ulrich et al. [8], which reveals a rake angle up to −30° to the south of the city of Palu, corresponding to the most significant LOS deformation zone. In addition, the errors of the source parameters are relatively small, indicating that our result is stable and reliable (Table 1 and Figure S2).

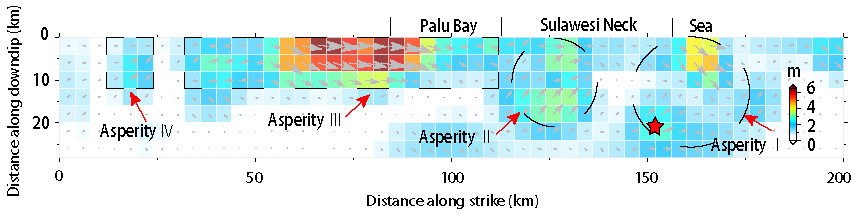
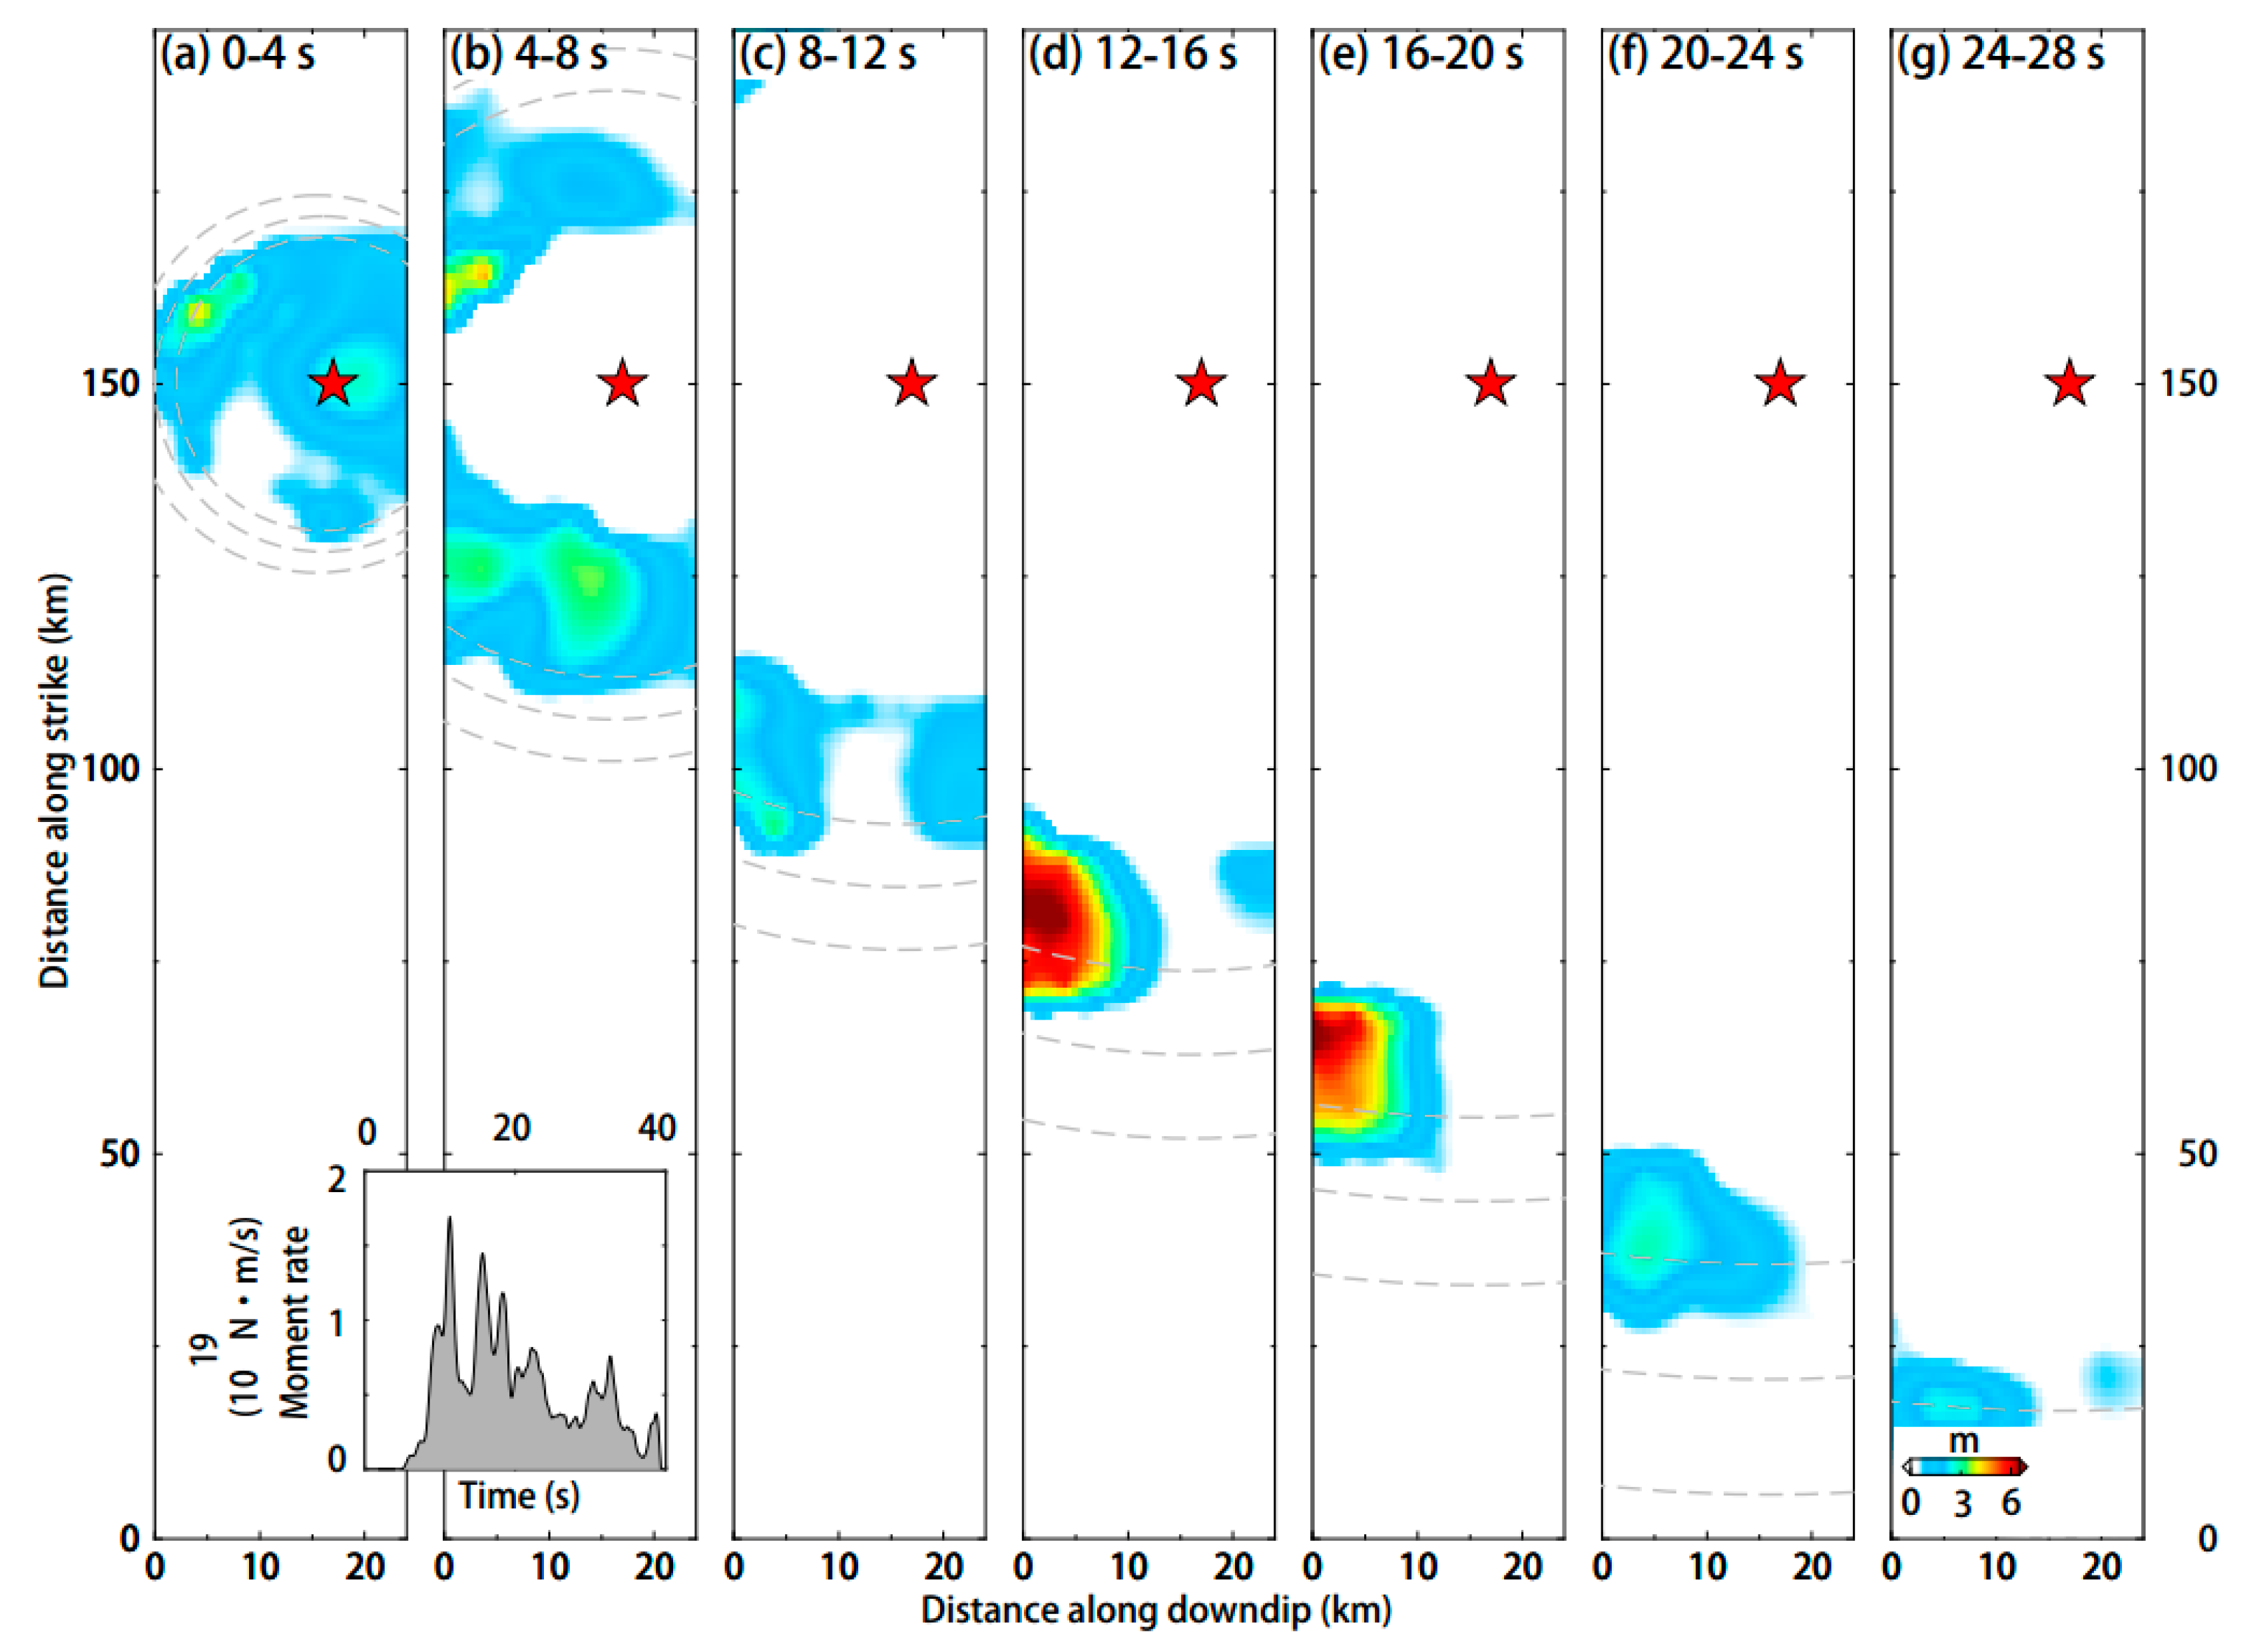
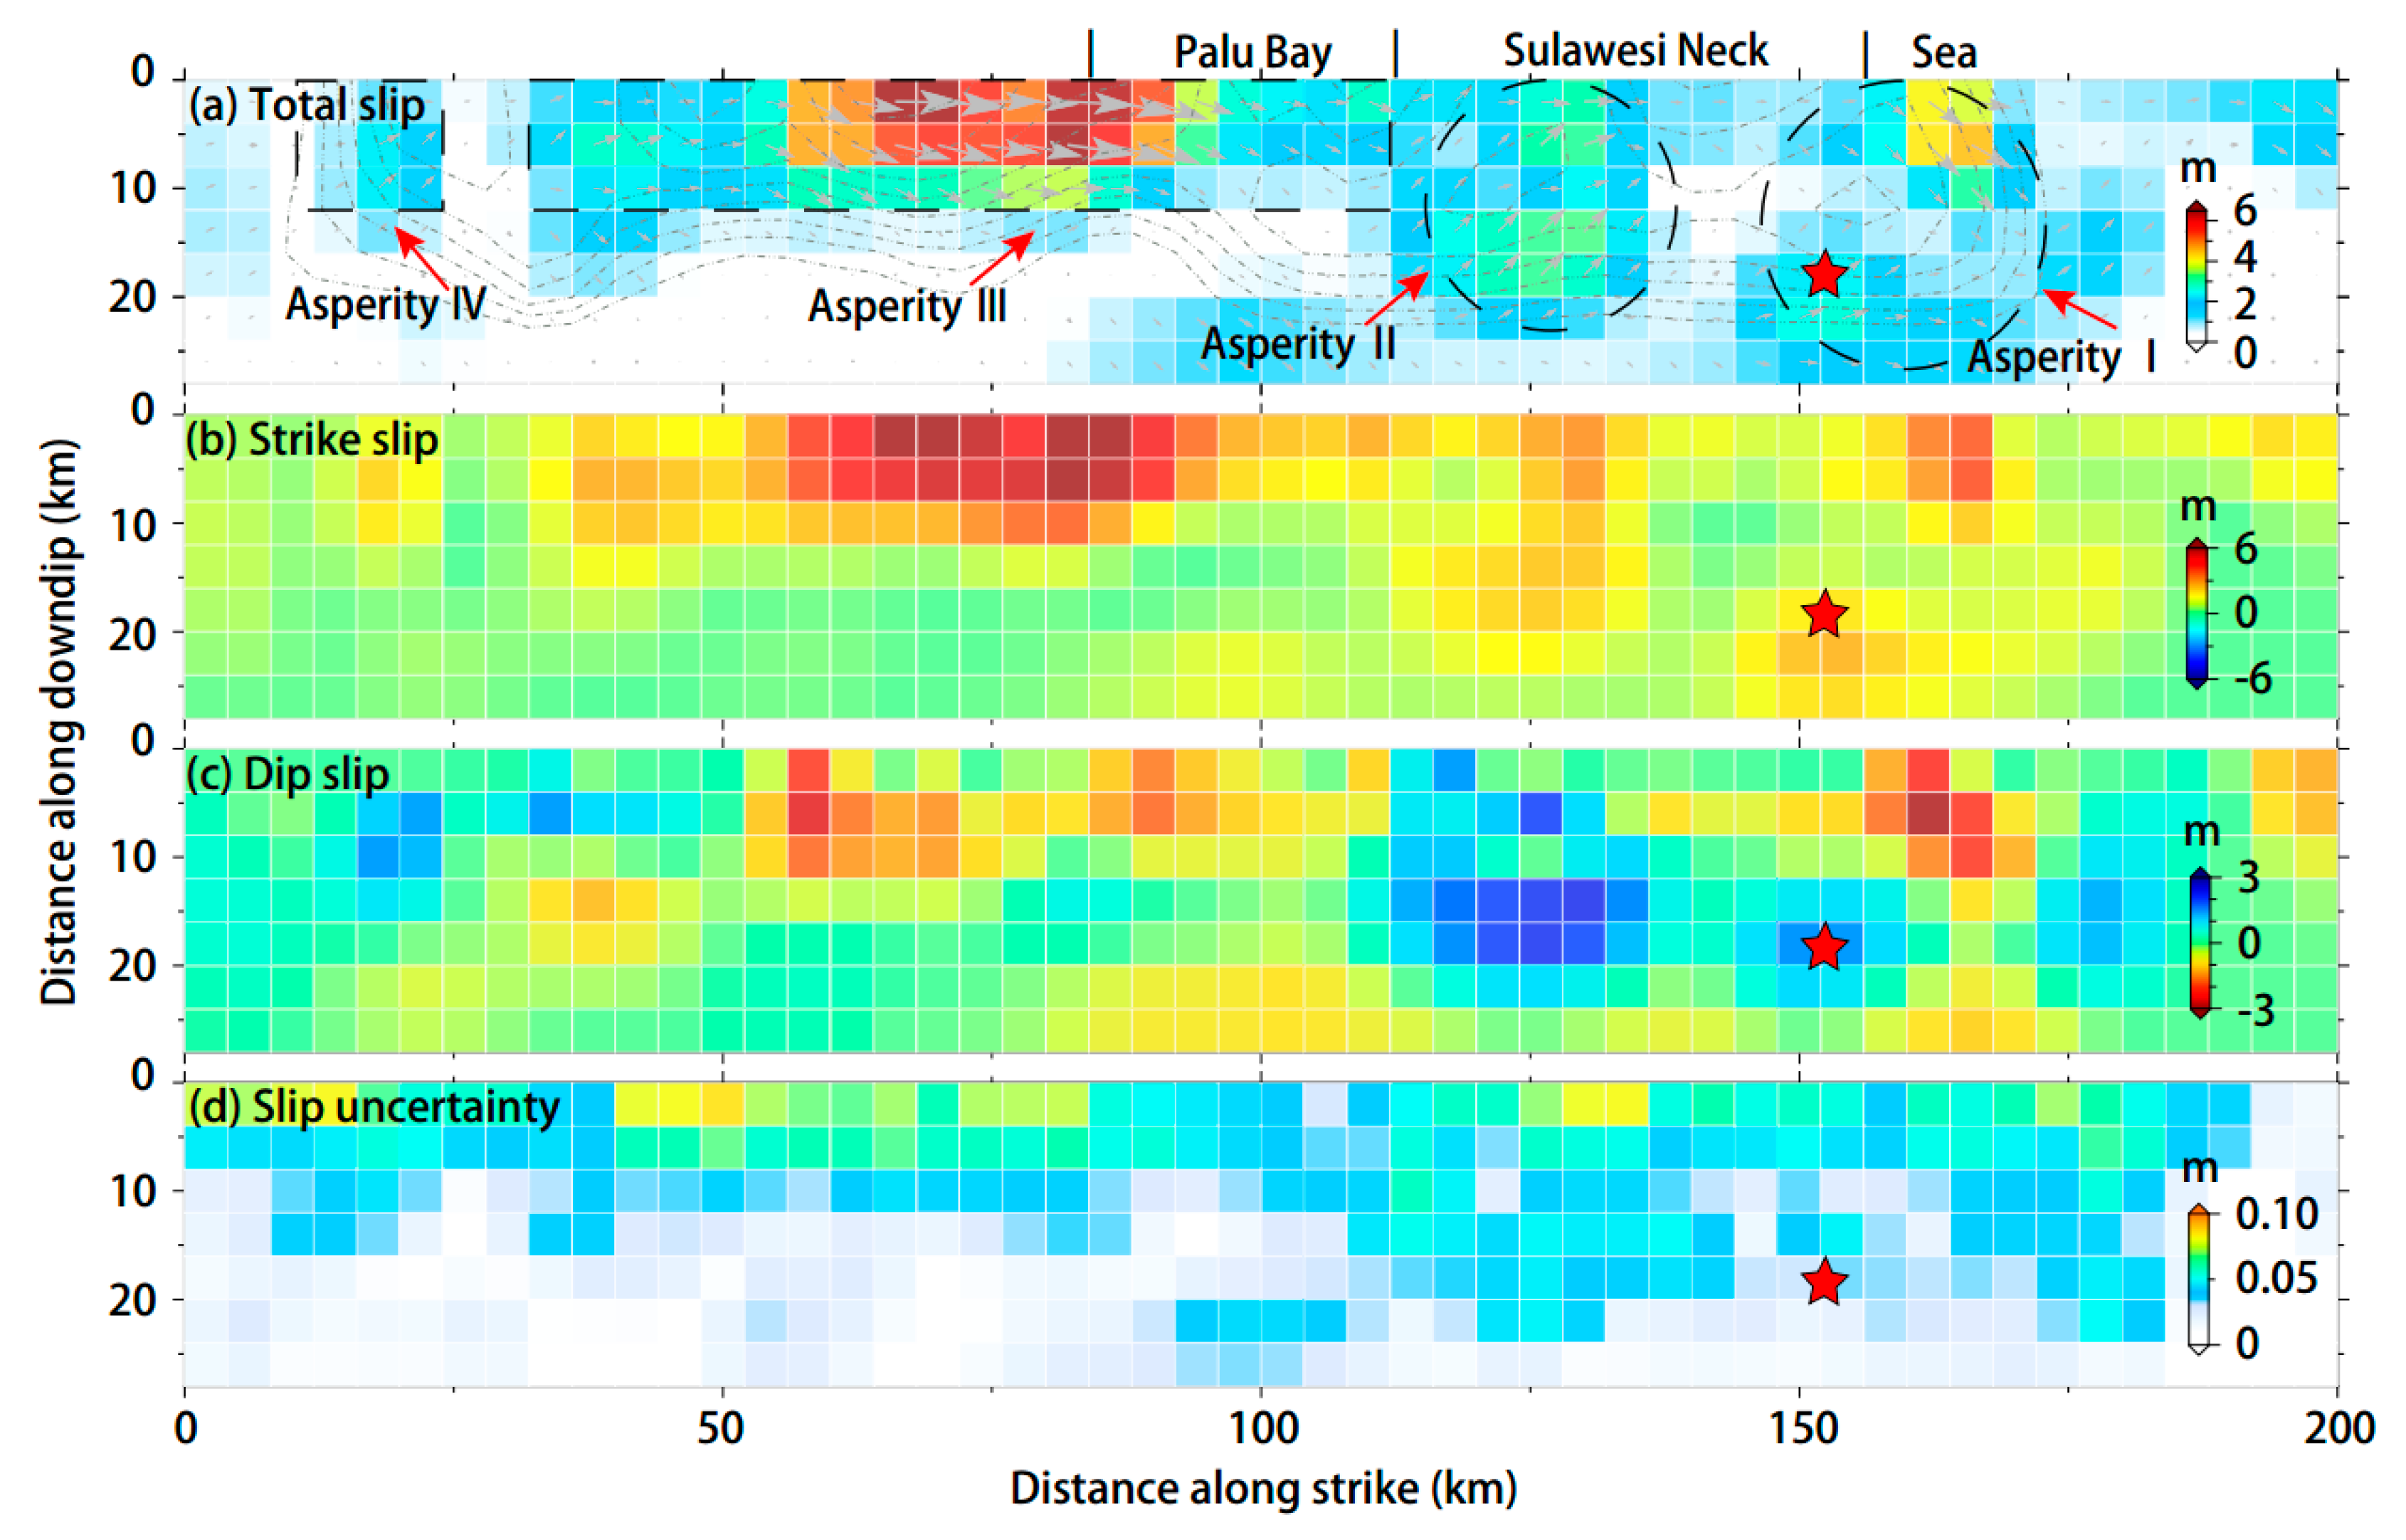
3.2. Kinematic Rupture

The local shear wave velocity ranges from 3.4 to 3.8 km/s between the depths of 3–20 km according to the CRUST 1.0 model [2]. Our result reveals that the 2018 Mw 7.5 Palu earthquake was a supershear rupture event from early on (Figure 3), with an average rupture speed of 4.1 km/s, which is consistent with the result of Bao et al. [2]. The rupture lasted for nearly 40 s, releasing a total seismic moment of 2.64 × 10²⁰ N·m (Mw 7.55), most of which was released within the first 30 s. The spatial–temporal slip evolution (Figure 3) demonstrates that the rupture expanded rapidly (~4.1 km/s) from the hypocenter and propagated bilaterally about 30 km towards the north and south in the along-strike direction during the first 8 s, and then to the south, resulting in four visible asperities as illustrated in the total slip distribution (Figure 4a), which corresponds to four main lobes of deformation in the coseismic interferogram (Figure 2a). A peak slip of 6.5 m was resolved on a shallow part of the crust (asperity III), which is consistent with the most seismic moment released along this segment as revealed by Bao et al. [2] and Socquet et al. [7]. The northern segment slipped at a greater depth down to 20 km, coinciding with the result of Socquet et al. [7].
The slip vector illustrated in Figure 4a indicates the focal mechanism is predominantly left–lateral strike–slip with normal-slip components as well, which coincides with the transtensional mechanism of the region. However, we found that the tectonic regime on the northern and southern part of the fault varies on these asperities (Figure 4c). Thrust slip is observed at the Sulawesi Neck, which connects to the North Sulawesi trench where subduction occurs (Figure 1b). Significant normal-slip components are observed in two areas (the asperity I and asperity III in Figure 4a), corresponding to two major releasing bends [7]: (1) Near the Balaesang Peninsula and (2) at the south of Palu Bay. The thrust–slip in asperity IV is likely due to the geometric complexity of the fault bends (Figure 1b) where the rupture terminated, which is consistent with the result given by USGS. In addition, the uncertainty of the total slip model is relatively low, with an insignificant maximum of 0.1 m comparable to slip maxima of 6.5 m (Figure 4d), which ensure the stability and reliability of the model. The slip error is larger in the area close to the surface, which can be ascribed to reduced observation constraints due to decorrelation. Also, the broadband regional waveforms are explained satisfactorily by our rupture model (Figure 5).

4. Discussion

4.1. An Early Supershear Rupture of the Palu Earthquake

Our preferred rupture model shows that the 2018 Mw 7.5 Palu earthquake is a supershear rupture event. The supershear rupture has been observed in numerous historical earthquakes, e.g., the 1999 Mw 7.6 Izmit earthquake [43]; the 1999 Mw 7.2 Düzce earthquake [43]; the 2001 Mw 7.8 Kokoxili earthquake [44]; the 2002 Mw 7.9 Denali earthquake [45]; the 2010 Mw 6.9 Yushu earthquake [41]; the 2012 Mw 8.6 Sumatra earthquake [46]; the 2013 Mw 7.6 Craig earthquake [47]; the 2014 Mw 6.9 Aegean Sea earthquake [48]; and the 2015 Mw 7.2 Tajikistan earthquake [42], which largely occurred on the strike–slip faults. Bouchon et al. [49] showed that supershear events are generally associated with faults that show simple geometry with small or even an absence of segmentation features. The surface traces of these faults are typically linear, continuous, and narrow, as evidenced by the optical satellite images [50], suggesting that stress–strength of the fault plane is mechanically homogeneous. What is more, supershear events tend to show a “quiet” aftershock potential, as revealed by both numerical simulations [51] and aftershock observations [49,52]. By contrast, aftershocks are likely to cluster on the secondary structures off the fault plane [52]. Bouchon and Karabulut [52] also emphasized that friction is relatively uniform over the supershear segments deduced by the post-earthquake quiescence of the fault. As for the seismic hazard analysis of supershear ruptures, Zhang et al. [51] reported that the supershear earthquake will bring in more strong shaking at large distance to the fault plane rather than intensive near-fault field ground motion, attributable to (1) the generation of S-wave Mach front, which can persist farther distance and (2) the seismic energy transmitted further with large amplitudes, which will definitely exacerbate the hazard [2,53,54].
Coincidentally, the coseismic surface displacement due to the 2018 Mw 7.5 Palu event, as revealed by the optical satellite image [7], shows a very sharp contrast between two sides of the Palu fault. This suggests that the rupture propagates in a linear, narrow, and smooth segment, and that the coseismic deformation is highly localized. This rupture behavior is similar to the supershear rupture feature observed in the 1999 Mw 7.6 Izmit earthquake [50]. From the viewpoint of aftershocks distribution within nearly 4 months after the event (Figure 1c), post-earthquake quiescence of the fault (especially in the Palu basin area) indicates relatively uniform frictional properties on the Palu fault [52], which facilitates the supershear rupture. Aftershocks are mainly located at the Sulawesi Neck and south of the city of Palu, most of which cluster off the fault plane (Figure 1c), coinciding with the feature in other known supershear events, e.g., the 1999 Mw 7.2 Düzce earthquake, the 2001 Mw 7.8 Kokoxili earthquake, and the 2002 Mw 7.9 Denali earthquake [52]. Studies have shown that the long, straight Palu–Koro fault is capable of generating supershear rupture [6]. The Mw 6.1 foreshock occurring 3 h before the Mw 7.5 mainshock may lead to strong stress concentration which was not completely released. According to the Burridge–Andrews mechanism, supershear rupture is initiated with a “daughter” rupture in the region of high shear stress [55]. Therefore, it is plausible that the rupture propagates at the supershear velocity from very early on with high initial shear stress [2,56]. Further, pre-existing damaged fault zones could also promote the early supershear rupture in the Palu earthquake [2,57]. This is different from an initial subshear rupture commonly observed in other supershear events, such as the 1999 Mw 7.2 Düzce earthquake, the 2001 Mw 7.8 Kokoxili earthquake, the 2002 Mw 7.9 Denali earthquake, the 2010 Mw 6.9 Yushu earthquake, the 2012 Mw 8.6 Sumatra earthquake, and the 2013 Mw 7.6 Craig earthquake, which propagate accompanied by a transition from subshear to supershear rupture (Table 2), possibly due to the smoothness of the fault segment and the cumulative stress distribution [41].

4.2. Comparisons with Published Results

Our rupture model reveals that the 2018 Mw 7.5 Palu earthquake was a predominantly left–lateral strike–slip event with both thrust and extension components as well, which shows good agreements with Socquet et al. [7]. Four visible asperities were ruptured during the slip pulse propagation, which were not resolved in the model of Song et al. [9] and Ulrich et al. [8]. Based on our model, we can speculate that the considerable normal slip in two offshore segments of the asperity I (~3 m) and asperity III (~2 m) (Figure 4a) probably favors tsunami genesis [8,9]. Left–lateral strike–slip up to 6 m with normal-slip up to 2 m was clearly seen around the Palu Bay, which is consistent with Ulrich et al. [8]. Thrust slip (~2 m) was found (asperity II) in the Sulawesi Neck (0.35 °S), where a restraining bend has been formed [8], which is consistent with Socquet et al. [7]. However, the slip model of Song et al. [9] shows no obvious thrust slip component, which is likely due to the fact that some near-fault data were cut off in their inversion. In addition, their model reveals that slip is confined to the top 10 km depths and shows a relatively larger slip amplitude which can reach up to ~10 m. Our slip model distinguishes the slip behavior with depth between the southern and northern segment. The southern fault segment experienced most of the moment release between 0 and 15 km depth, while the northern segment tended to slip at greater depth (down to 20 km). This can also be deduced from the deformation pattern of the ALOS-2 interferogram (Figure 2a). The deformation zone to the south of the epicenter is much broader than that in other deformation regions in the sense of spatial extension, which suggests that the earthquake has ruptured into a deeper part of the crust in this region [15]. By contrast, the deformation region to the south of the city of Palu features more densely distributed fringes, allowing for a shallower rupture on this segment. Slight thrust slip (~1 m) was reflected on the southernmost part of asperity III, where a restraining bend has been formed, coinciding with Ulrich et al. [8]. The asperity IV was characterized by thrust slip (~1.5 m), agreeable with USGS, which is likely due to geometrical complexities of the Palu–Koro fault bends which extend southwards with the Matano fault (Figure 1b). As for the rupture speed, our result shows an average speed of 4.1 km/s, which agrees with Bao et al. [2], but smaller than the result of Ulrich et al. [8] which demonstrated an average speed of 5 km/s. From the residual maps provided by Socquet et al. [7], we can see a large misfit (up to ~50 cm) in the Balaesang Peninsula and some LOS deformation areas that are either overfitted or underfitted. Our residual LOS map demonstrates a better fitting in the Peninsula, with a misfit of ~20 cm (Figure S1).
Our simple model honors the available data at hand and matches key earthquake features revealed by other published results, including the moment magnitude, rupture speed, and focal mechanism. We reproduce the major characteristics of the ALOS-2 interferogram deformation pattern and broadband regional seismograms (Figure 2, Figure 5 and Figure S1), indicating that our rupture model is convincible. To further validate our slip model, a forward modeling test of north–south displacements within the most significant deformation zone was also conducted (Figure S4). The modeling result is consistent with the findings of Ulrich et al. [8], Socquet et al. [7] and Song et al. [9], indicating a predominantly left–lateral strike–slip of the Palu earthquake, with northward displacements at the east of the Palu fault and southward displacements at the west. However, we should acknowledge that our simplified fault geometry with uniform dip angle may have some limitations. More accurate geometric parameters with more abundant datasets such as static and high-rate GPS measurements, strong motion data, teleseismic waveforms, and tsunami records will be favorable to refine a more detailed slip model and rupture kinematics. What is more, multisegment rupture scenarios will be taken into account in the future work to test the impacts of geometric complexities on initiation and termination of the rupture (especially for the supershear event) [7,60]. Our rupture model could be considered as a first approximation of the 2018 Palu earthquake.

4.3. Transtensional Tectonics

Previous studies have shown that the Palu–Koro fault is an active structure with a dominated left–lateral strike–slip rate of 39 mm/y and a significant extension rate of 14 mm/y [1]. The high strain rate of the Palu–Koro fault has been proposed to account for the major active deformation in Sulawesi [3,5] However, limited moderate-to-strong earthquakes have been observed on the fault, and the recurrence cycle for the M 7–8 earthquake is expected to be 700 years [61]. Therefore, this Mw 7.5 earthquake could be a characteristic event expected to occur on the fault. In the past 50 years, 14 earthquakes of M ≥ 5 have occurred on the Palu fault [62], which mainly concentrated on the southern segmentation of the Palu fault. Large-scale strike–slip faults are generally considered to be related to the mass lateral transformation process [4,63]. Wang et al. [4] proposed that the active Palu–Koro fault could dominate the mass lateral extrusion of the region and particularly contribute to the extensional deformation in central Sulawesi. In this case, the southern part of the Palu fault tends to have intensive seismicity than the northern part [4]. On August 18, 2012, a moment magnitude (Mw) of 6.3 earthquake occurred on the southern part of the Palu fault (Figure 1c). This earthquake shows a strike–slip focal mechanism, whilst accompanied by normal-slip component, which is similar to the source mechanism of the 2018 Mw 7.5 Palu earthquake. The seismic solutions of the 2012 Mw 6.3 earthquake and the 2018 Mw 7.5 earthquake are both consistent with the transtensional tectonic regime of Sulawesi.
Socquet et al. [1] revealed that the triple junction between the Philippine Sea, Australian, and Sunda plate in Southeast Asia is highly seismically active and the collision is accommodated by rapid microblock rotations. The deformation in Sulawesi can be explained by a pull-apart structure [1] characterized by both extensional and wrench structures. The combined effects of (1) the North Sula Block (NSB, Figure 1) north–northwestward motion and clockwise rotation [1], together with (2) extension related to back-arc spreading behind the North Sulawesi Trench (NST, Figure 1) [61], as well as (3) mass lateral extrusion along the large-scale Palu–Koro strike–slip fault [4], are likely to contribute to the transtensional regime in the region, which is well supported by our preferred slip model that the source mechanism is dominated by strike–slip and accompanied by significant normal-slip components.
The extension is prevailing in Sulawesi as revealed by slip-vector analysis [3] and GPS measurements [64], which could play an important role in normal faulting. Therefore, vertical deformation is anticipated to generate the tsunami. Ulrich et al. [8] produced an average vertical displacement of 1.5 m on the offshore fault segment within the Palu Bay, which acted as a source of the tsunami. Instead, Song et al. [9] emphasized that the submarine normal faulting in NW Sulawesi resulted in the tsunami. From our slip model, although less well constrained by InSAR observations in the submarine region, the two offshore segments along the asperity I and III host significant normal slip components (Figure 4a), which are both likely the cause of the tsunami. However, this question needs to be answered in further work.

5. Conclusions

In this study, the source parameters of the 2018 Mw 7.5 Palu earthquake were derived from ALOS-2 InSAR data, with a dip of 84.7° and a rake of −25.7°, indicating that the 2018 Mw 7.5 Palu earthquake is a strike–slip event with an almost vertically dipping fault, accompanied by a significant normal-slip component. The rupture kinematics were constructed jointly using ALOS-2 InSAR and broadband regional seismograms, which reveal that the 2018 Palu earthquake is a supershear rupture event from early on with an average rupture velocity of 4.1 km/s, different from other supershear events with a transition from subshear to supershear. The total seismic moment 2.64 × 10²⁰ N·m (equivalent to Mw 7.55) was released within 40 s. The accumulative slip model shows that there are four slip asperities, corresponding to four main lobes of deformation in the ALOS-2 interferogram, with a peak slip of 6.5 m located at the south of the city of Palu. Our results also shed some light on transtensional tectonism in Sulawesi.

Supplementary Materials

The following are available online at https://www.mdpi.com/2072-4292/11/11/1330/s1, Table S1: Review of dip angle in some strike–slip events, Figure S1: The unwrapped observed, modeled, and residual coseismic LOS displacement based on the joint inversion, Figure S2: Uncertainties and trade-offs in the source parameters based on the Monte Carlo bootstrap simulation technique, Figure S3: The relationship between the misfit and the weight ratio in the joint inversion, Figure S4: The forward modeling of north–south displacements within the most significant deformation zone based on the total slip distribution.

Author Contributions

Conceptualization, C.X., Y.W. and S.W.; methodology, J.F., Y.W. and S.W.; formal analysis, J.F., C.X., Y.W., S.W., G.X., Y.Z. and L.Y.; investigation, J.F., Y.W., S.W., G.X. and Y.Z.; resources, S.W., G.X. and Y.Z.; writing—original draft preparation, J.F.; writing—review and editing, J.F., C.X., Y.W. and S.W.; visualization, J.F. and S.W.; supervision, C.X. and Y.W.

Funding

This work is co-supported by the national key research and development plan of China under Grant No. 2018YFC1503604, the National Natural Science Foundation of China under Grant No. 41431069, No. 41721003, No. 41774011, and DAAD Thematic Network Project under Grant No. 57173947/57421148.

Acknowledgments

We thank Mong-han Huang at the University of Maryland, USA for helpful discussions and suggestions in seismic source inversion. We also thank Anne Socquet at the Université Grenoble Alpes, France for sharing their slip model. The broadband regional data can be obtained from the Incorporated Research Institutions for Seismology (IRIS) Data Manager Center (DMC). The ALOS-2 PALSAR-2 data were provided by JAXA through RA6 project (ID: 3048). The figures in the paper were produced using GMT mapping software [65].

Conflicts of Interest

The authors declare no conflict of interest.

References

  1. Socquet, A.; Simons, W.; Vigny, C.; McCaffrey, R.; Subarya, C.; Sarsito, D.; Ambrosius, B.; Spakman, W. Microblock rotations and fault coupling in SE Asia triple junction (Sulawesi, Indonesia) from GPS and earthquake slip vector data. J. Geophys. Res. 2006, 111, B08409. [Google Scholar] [CrossRef]
  2. Bao, H.; Ampuero, J.P.; Meng, L.; Fielding, E.J.; Liang, C.; Milliner, C.; Feng, T.; Huang, H. Early and persistent supershear rupture of the 2018 Mw 7.5 Palu earthquake. Nat. Geosci. 2019, 12, 200–205. [Google Scholar] [CrossRef]
  3. Bellier, O.; Sébrier, M.; Beaudouin, T.; Villeneuve, M.; Braucher, R.; Bourles, D.; Pratomo, I. High slip rate for a low seismicity along the Palu-Koro active fault in central Sulawesi (Indonesia). Terra Nova 2001, 13, 463–470. [Google Scholar] [CrossRef]
  4. Wang, S.; Xu, C.; Xu, W.; Yin, Z.; Wen, Y.; Jiang, G. The 2017 Mw 6.6 Poso Earthquake: Implications for Extrusion Tectonics in Central Sulawesi. Seismol. Res. Lett. 2018, 90, 649–658. [Google Scholar] [CrossRef]
  5. Cipta, A.; Robiana, R.; Griffin, J.D.; Horspool, N.; Hidayati, S.; Cummins, P.R. A probabilistic seismic hazard assessment for Sulawesi, Indonesia. Geol. Soc. Lond. Spec. Pub. 2017, 441, 133–152. [Google Scholar] [CrossRef]
  6. Watkinson, I.M.; Hall, R. Fault systems of the eastern Indonesian triple junction: Evaluation of Quaternary activity and implications for seismic hazards. Geol. Soc. Lond. Spec. Pub. 2017, 441, 71–120. [Google Scholar] [CrossRef]
  7. Socquet, A.; Hollingsworth, J.; Pathier, E.; Bouchon, M. Evidence of supershear during the 2018 magnitude 7.5 Palu earthquake from space geodesy. Nat. Geosci. 2019, 12, 192–199. [Google Scholar] [CrossRef]
  8. EarthArXiv. Available online: https://eartharxiv.org/3bwqa/ (accessed on 31 May 2019).
  9. Song, X.; Zhang, Y.; Shan, X.; Liu, Y.; Gong, W.; Qu, C. Geodetic observations of the 2018 Mw 7.5 Sulawesi earthquake and its implications for the kinematics of the Palu fault. Geophys. Res. Lett. 2019, 46, 4212–4220. [Google Scholar] [CrossRef]
  10. Werner, C.; Wegmüller, U.; Strozzi, T.; Wiesmann, A. GAMMA SAR and interferometric processing software. In Proceedings of the ERS ENVISAT Symposium, Gothenburg, Sweden, 16–20 October 2001. [Google Scholar]
  11. Farr, T.G.; Rosen, P.A.; Caro, E.; Crippen, R.; Duren, R.; Hensley, S.; Kobrick, M.; Paller, M.; Rodriguez, E.; Roth, L.; et al. The shuttle radar topography mission. Rev. Geophys. 2007, 45, RG2004. [Google Scholar] [CrossRef]
  12. Goldstein, R.; Zebker, H.; Werner, C. Satellite radar interferometry: Two-dimensional phase unwrapping. Radio Sci. 1988, 23, 713–720. [Google Scholar] [CrossRef] [Green Version]
  13. Pritchard, M.E.; Simons, M.; Rosen, P.A.; Hensley, S.; Webb, F.H. Co-seismic slip from the 1995 July 30 Mw = 8.1 Antofagasta, Chile, earthquake as constrained by InSAR and GPS observations. Geophys. J. Int. 2002, 150, 362–376. [Google Scholar] [CrossRef]
  14. Hanssen, R.F. Radar Interferometry: Data Interpretation and Error Analysis; Kluwer Academic Publishers: Dordrecht, The Netherlands, 2001. [Google Scholar]
  15. Wang, S.; Xu, C.; Wen, Y.; Yin, Z.; Jiang, G.; Fang, L. Slip model for the 25 November 2016 Mw 6.6 Aketao earthquake, western China, revealed by Sentinel-1 and ALOS-2 observations. Remote Sens. 2017, 9, 325. [Google Scholar] [CrossRef]
  16. Zhang, Y.; Chen, Y.T.; Xu, L.S.; Wei, X.; Jin, M.P.; Zhang, S. The 2014 Mw 6.1 Ludian, Yunnan, earthquake: A complex conjugated ruptured earthquake. Chin. J. Geophys. 2015, 58, 153–162. [Google Scholar] [CrossRef]
  17. Heimann, S. A Robust Method to Estimate Kinematic Earthquake Source Parameters. Ph.D. Thesis, University of Hamburg, Hamburg, Germany, 2011. [Google Scholar]
  18. Zheng, X.J.; Zhang, Y.; Ma, Q.; Wang, R.J. Fast inversion of rupture process based on strong motion data and the feasibility of its automation. Chin. J. Geophys. 2018, 61, 4021–4036. [Google Scholar] [CrossRef]
  19. Maurice, S.D.R.; Wiens, D.A.; Shore, P.J.; Vera, E.; Dorman, L.M. Seismicity and tectonics of the South Shetland Islands and Bransfield Strait from a regional broadband seismograph deployment. J. Geophys. Res. 2003, 108, 2461. [Google Scholar] [CrossRef]
  20. Feng, W.; Li, Z. A novel hybrid PSO/simplex algorithm for determining earthquake source parameters using InSAR observations. Prog. Geophys. 2010, 25, 1189–1196. [Google Scholar] [CrossRef]
  21. Feng, W.; Li, Z.; Elliott, J.R.; Fukushima, Y.; Hoey, T.; Singleton, A.; Cook, R.; Xu, Z. The 2011 MW 6.8 Burma earthquake: Fault constraints provided by multiple SAR techniques. Geophys. J. Int. 2013, 195, 650–660. [Google Scholar] [CrossRef]
  22. Eberhart, R.; Kennedy, J. A new optimizer using particle swarm theory. In Proceedings of the Sixth International Symposium on Micro Machine and Human Science, Nagoya, Japan, 4–6 October 1995; pp. 39–43. [Google Scholar] [CrossRef]
  23. Nelder, J.A.; Mead, R. A simplex method for function minimization. Comput. J. 1965, 7, 308–313. [Google Scholar] [CrossRef]
  24. Li, Z.; Elliott, J.R.; Feng, W.; Jackson, J.A.; Parsons, B.E.; Walters, R.J. The 2010 MW 6.8 Yushu (Qinghai, China) earthquake: Constraints provided by InSAR and body wave seismology. J. Geophys. Res. 2011, 116, B10302. [Google Scholar] [CrossRef]
  25. Parsons, B.; Wright, T.; Rowe, P.; Andrews, J.; Jackson, J.; Walker, R.; Khatib, M.; Talebian, M.; Bergman, E.; Engdahl, E.R. The 1994 Sefidabeh (eastern Iran) earthquakes revisited: New evidence from satellite radar interferometry and carbonate dating about the growth of an active fold above a blind thrust fault. Geophys. J. Int. 2006, 164, 202–217. [Google Scholar] [CrossRef]
  26. Melgar, D.; Bock, Y. Kinematic earthquake source inversion and tsunami runup prediction with regional geophysical data. J. Geophys. Res. 2015, 120, 3324–3349. [Google Scholar] [CrossRef]
  27. Ide, S.; Takeo, M.; Yoshida, Y. Source process of the 1995 Kobe earthquake: Determination of spatio-temporal slip distribution by Bayesian modeling. Bull. Seismol. Soc. Am. 1996, 86, 547–566. [Google Scholar]
  28. Zhu, L.; Rivera, L.A. A note on the dynamic and static displacements from a point source in multilayered media. Geophys. J. Int. 2002, 148, 619–627. [Google Scholar] [CrossRef]
  29. Melgar, D.; Geng, J.; Crowell, B.W.; Haase, J.S.; Bock, Y.; Hammond, W.C.; Allen, R.M. Seismogeodesy of the 2014 Mw 6.1 Napa earthquake, California: Rapid response and modeling of fast rupture on a dipping strike-slip fault. J. Geophys. Res. 2015, 120, 5013–5033. [Google Scholar] [CrossRef]
  30. Melgar, D.; Fan, W.; Riquelme, S.; Geng, J.; Liang, C.; Fuentes, M.; Vargas, G.; Allen, R.M.; Shearer, P.M.; Fielding, E.J. Slip segmentation and slow rupture to the trench during the 2015, Mw8.3 Illapel, Chile earthquake. Geophys. Res. Lett. 2016, 43, 961–966. [Google Scholar] [CrossRef]
  31. Melgar, D.; Ganas, A.; Geng, J.; Liang, C.; Fielding, E.J.; Kassaras, I. Source characteristics of the 2015 Mw6.5 Lefkada, Greece, strike-slip earthquake. J. Geophys. Res. 2017, 122, 2260–2273. [Google Scholar] [CrossRef]
  32. Melgar, D.; Riquelme, S.; Xu, X.; Baez, J.C.; Geng, J.; Moreno, M. The first since 1960: A large event in the Valdivia segment of the Chilean Subduction Zone, the 2016 M7. 6 Melinka earthquake. Earth Planet. Sci. Lett. 2017, 474, 68–75. [Google Scholar] [CrossRef]
  33. Chen, K.; Liu, Z.; Liang, C.; Song, Y.T. Towards the application of seismogeodesy in central Italy: A case study for the 2016 August 24 Mw 6.1 Italy earthquake modelling. Geophys. J. Int. 2018, 213, 1647–1658. [Google Scholar] [CrossRef]
  34. Chen, K.; Xu, W.; Mai, P.M.; Gao, H.; Zhang, L.; Ding, X. The 2017 Mw 7.3 Sarpol Zahāb Earthquake, Iran: A compact blind shallow-dipping thrust event in the mountain front fault basement. Tectonophysics 2018, 747, 108–114. [Google Scholar] [CrossRef]
  35. Wu, C.; Takeo, M.; Ide, S. Source process of the Chi-Chi earthquake: A joint inversion of strong motion data and global positioning system data with a multifault model. Bull. Seismol. Soc. Am. 2001, 91, 1128–1143. [Google Scholar] [CrossRef]
  36. Fukahata, Y.; Yagi, Y.; Matsu’ura, M. Waveform inversion for seismic source processes using ABIC with two sorts of prior constraints: Comparison between proper and improper formulations. Geophys. Res. Lett. 2003, 30, 1305. [Google Scholar] [CrossRef]
  37. Lasserre, C.; Peltzer, G.; Crampé, F.; Klinger, Y.; Van Der Woerd, J.; Tapponnier, P. Coseismic deformation of the 2001 Mw=7.8 Kokoxili earthquake in Tibet, measured by synthetic aperture radar interferometry. J. Geophys. Res. 2005, 110, B12408. [Google Scholar] [CrossRef]
  38. Das, S. The need to study speed. Science 2007, 317, 905–906. [Google Scholar] [CrossRef]
  39. Vallée, M.; Dunham, E.M. Observation of far-field Mach waves generated by the 2001 Kokoxili supershear earthquake. Geophys. Res. Lett. 2012, 39, L05311. [Google Scholar] [CrossRef]
  40. Hartzell, S.; Liu, P.; Mendoza, C.; Ji, C.; Larson, K.M. Stability and uncertainty of finite-fault slip inversions: Application to the 2004 Parkfield, California, earthquake. Bull. Seismol. Soc. Am. 2007, 97, 1911–1934. [Google Scholar] [CrossRef]
  41. Wang, D.; Mori, J. The 2010 Qinghai, China, earthquake: A moderate earthquake with supershear rupture. Bull. Seismol. Soc. Am. 2012, 102, 301–308. [Google Scholar] [CrossRef]
  42. Sangha, S.; Peltzer, G.; Zhang, A.; Meng, L.; Liang, C.; Lundgren, P.; Fielding, E. Fault geometry of 2015, Mw7. 2 Murghab, Tajikistan earthquake controls rupture propagation: Insights from InSAR and seismological data. Earth Planet. Sci. Lett. 2017, 462, 132–141. [Google Scholar] [CrossRef]
  43. Bouchon, M.; Bouin, M.P.; Karabulut, H.; Toksöz, M.N.; Dietrich, M.; Rosakis, A.J. How fast is rupture during an earthquake? New insights from the 1999 Turkey earthquakes. Geophys. Res. Lett. 2001, 28, 2723–2726. [Google Scholar] [CrossRef]
  44. Bouchon, M.; Vallée, M. Observation of long supershear rupture during the magnitude 8.1 Kunlunshan earthquake. Science 2003, 301, 824–826. [Google Scholar] [CrossRef]
  45. Dunham, E.M.; Archuleta, R.J. Evidence for a supershear transient during the 2002 Denali fault earthquake. Bull. Seismol. Soc. Am. 2004, 94, S256–S268. [Google Scholar] [CrossRef]
  46. Wang, D.; Mori, J.; Uchide, T. Supershear rupture on multiple faults for the Mw 8.6 Off Northern Sumatra, Indonesia earthquake of April 11, 2012. Geophys. Res. Lett. 2012, 39, L21307. [Google Scholar] [CrossRef]
  47. Yue, H.; Lay, T.; Freymueller, J.T.; Ding, K.; Rivera, L.; Ruppert, N.A.; Koper, K.D. Supershear rupture of the 5 January 2013 Craig, Alaska (Mw 7.5) earthquake. J. Geophys. Res. 2013, 118, 5903–5919. [Google Scholar] [CrossRef]
  48. Evangelidis, C.P. Imaging supershear rupture for the 2014 Mw 6.9 Northern Aegean earthquake by backprojection of strong motion waveforms. Geophys. Res. Lett. 2015, 42, 307–315. [Google Scholar] [CrossRef]
  49. Bouchon, M.; Karabulut, H.; Bouin, M.P.; Schmittbuhl, J.; Vallée, M.; Archuleta, R.; Marsan, D. Faulting characteristics of supershear earthquakes. Tectonophysics 2010, 493, 244–253. [Google Scholar] [CrossRef]
  50. Michel, R.; Avouac, J.P. Deformation due to the 17 August 1999 Izmit, Turkey, earthquake measured from SPOT images. J. Geophys. Res. 2002, 107, ETG-2. [Google Scholar] [CrossRef]
  51. Zhang, Z.; Xu, J.; Huang, H.; Chen, X. Seismic characteristics of supershear and sub-Rayleigh earthquakes: Implication from simple cases. Geophys. Res. Lett. 2017, 44, 6712–6717. [Google Scholar] [CrossRef]
  52. Bouchon, M.; Karabulut, H. The aftershock signature of supershear earthquakes. Science 2008, 320, 1323–1325. [Google Scholar] [CrossRef] [PubMed]
  53. Dunham, E.M. The Dynamics and Near-Source Ground Motion of Supershear Earthquakes. Ph.D. Thesis, University of California, Santa Barbara, CA, USA, 2005. [Google Scholar]
  54. Das, S. Supershear Earthquake Ruptures–Theory, Methods, Laboratory Experiments and Fault Superhighways: An Update. In Perspectives on European Earthquake Engineering and Seismology; Ansal, A., Ed.; Springer: Cham, Switzerland, 2015; Volume 2, pp. 1–20. [Google Scholar]
  55. Rosakis, A.J.; Xia, K.; Lykotrafitis, G.; Kanamori, H. Dynamic shear rupture in frictional interfaces: Speeds, directionality, and modes. In Reference Module in Earth Systems and Environmental Sciences, 2nd ed.; Elias, S.A., Ed.; Springer: Amsterdam, The Netherlands, 2007; Volume 4, pp. 183–213. [Google Scholar]
  56. Liu, Y.; Lapusta, N. Transition of mode II cracks from sub-Rayleigh to intersonic speeds in the presence of favorable heterogeneity. J. Mech. Phys. Solids 2008, 56, 25–50. [Google Scholar] [CrossRef]
  57. Huang, Y.; Ampuero, J.P.; Helmberger, D.V. The potential for supershear earthquakes in damaged fault zones—Theory and observations. Earth Planet. Sci. Lett. 2016, 433, 109–115. [Google Scholar] [CrossRef]
  58. Birgören, G.; Sekiguchi, H.; Irikura, K. Rupture model of the 1999 Düzce, Turkey, earthquake deduced from high and low frequency strong motion data. Geophys. Res. Lett. 2004, 31, L05610. [Google Scholar] [CrossRef]
  59. Walker, K.T.; Shearer, P.M. Illuminating the near-sonic rupture velocities of the intracontinental Kokoxili Mw 7.8 and Denali fault Mw 7.9 strike-slip earthquakes with global P wave back projection imaging. J. Geophys. Res. 2009, 114, B02304. [Google Scholar] [CrossRef]
  60. King, G.; Nábělek, J. Role of fault bends in the initiation and termination of earthquake rupture. Science 1985, 228, 984–987. [Google Scholar] [CrossRef] [PubMed]
  61. Bellier, O.; Sébrier, M.; Seward, D.; Beaudouin, T.; Villeneuve, M.; Putranto, E. Fission track and fault kinematics analyses for new insight into the Late Cenozoic tectonic regime changes in West-Central Sulawesi (Indonesia). Tectonophysics 2006, 413, 201–220. [Google Scholar] [CrossRef]
  62. Khairina, F.; Chen, W.; Wei, S.; Suardi, I. Focal mechanism of the August 18th 2012 Mw6. 3 Palu-Koro earthquake and its implication of seismic hazard. In AIP Conference Proceedings; AIP Publishing: College Park, CP, USA, 2017; Volume 1857, p. 050003. [Google Scholar]
  63. Avouac, J.P.; Tapponnier, P. Kinematic model of active deformation in central Asia. Geophys. Res. Lett. 1993, 20, 895–898. [Google Scholar] [CrossRef] [Green Version]
  64. Walpersdorf, A.; Vigny, C.; Subarya, C.; Manurung, P. Monitoring of the Palu-Koro Fault (Sulawesi) by GPS. Geophys. Res. Lett. 1998, 25, 2313–2316. [Google Scholar] [CrossRef] [Green Version]
  65. Wessel, P.; Smith, W.H.F.; Scharroo, R.; Luis, J.; Wobbe, F. Generic Mapping Tools: Improved Version Released. Eos Trans. AGU 2013, 94, 409–410. [Google Scholar] [CrossRef] [Green Version]
Figure 1. Tectonic setting of the 2018 Mw 7.5 Palu earthquake. (a) Dark red arrows show the convergent rates between the Philippine Sea, Australian, and Sunda plates. The red star marks the epicenter of the 2018 Palu earthquake. Blue triangles are the broadband regional stations used in this study. (b) Microblock model of Sulawesi [1] with the block boundaries depicted by dark blue dashed lines (modified from Wang et al. [4]). Red rectangle outlines the bounds of the panel (c). PF, Palu–Koro fault; MF, Matano fault; NST, North Sulawesi trench; NSB, North Sulawesi block; MAB, Manado block; ESB, East Sulawesi block; MKB, Makassar block. (c) Close-up of the epicenter region. The white circle shows the location of the city of Palu. The focal mechanism plotted in red represents the 2018 Mw 7.5 Palu earthquake. The magenta ones denote the 2018 Mw 6.1 foreshock and the 2012 Mw 6.3 earthquake. The black ones denote the Mw ≥ 5.5 historical earthquakes. The yellow dots are the aftershocks within nearly four months following the 2018 Palu earthquake. All the focal mechanisms are from the global centroid moment tensor (gCMT) solution. The gray dashed line depicts the fault trace used in the joint inversion. Black lines denote the regional fault traces, with the fault mechanism shown as well.
Remotesensing 11 01330 g001
Figure 2. The observed (a), modeled (b), and residual (c) coseismic LOS displacement of the 2018 Palu earthquake based on the joint inversion. The gray dashed line in (a) shows the fault trace used in the joint inversion. All the results are rewrapped in the range of 0 to 20 cm.
Remotesensing 11 01330 g002
Figure 3. Snapshots of the rupture propagation. The gray dashed lines represent the reference rupture fronts moving at the 3.5 km/s, 4 km/s, and 4.5 km/s, respectively. Note that the initial rupture front went beyond the reference velocity contour of 4 km/s in the first 4 s interval, indicating a supershear rupture at the beginning of the event. The red star represents the epicenter. The moment rate function is shown in the inset map.
Remotesensing 11 01330 g003
Figure 4. (a) Coseismic slip distribution from the joint inversion of InSAR and broadband regional seismograms. Gray arrows denote the slip directions of each fault patches. Gray dashed lines are the slip contours derived from Socquet et al. [7], with a slip magnitude greater than 1 m and a step of 0.5 m. The red star denotes the epicenter. (b) and (c) are the strike–slip and dip–slip components, respectively. (d) The uncertainty of the total slip model.
Remotesensing 11 01330 g004
Figure 5. The observed (black) and synthetic (red) broadband displacement waveforms for the north (a), east (b), and up (c) components respectively. Station names (e.g., TNTI) and corresponding amplitudes for the observed (in black) and synthetic (in red) displacements are also labeled.
Remotesensing 11 01330 g005
Table 1. Source parameters estimated from different institutions.
SourceStrike
(°)
Dip
(°)
Rake
(°)
Seismic Moment
(1020 N·m)
Moment Magnitude (Mw)
CPPT a354752
USGS b35067−172.4977.5
GFZ c35058−7 7.5
IPGP d3566911
gCMT e34857−152.827.6
Socquet et al. [7]variable60 3.47.618
Song et al. [9] f35564−6.8
Song et al. [9] g35558−112.47.43
34028−75
Ulrich et al. [8] hvariable65−30~30 7.57
65
90
This study352 i84.7 ± 0.14−25.7 ± 0.302.647.55
a CPPT: Centre Polynésien de Prévention des Tsunamis, the French Polynesia Tsunami Warning Center; b USGS: US Geological Survey; c GFZ: GeoForschungsZentrum, German Research Centre for Geosciences; d IPGP: Institut de Physique du Globe de Paris, Institute of Earth Physics of Paris; e gCMT: the global Centroid Moment Tensor catalog; f The one-segment fault model of Song et al. [9]; g The two-segment fault model of Song et al. [9]; h The three-segment fault model of Ulrich et al. [8]; i The strike angle is determined from the ALOS-2 InSAR interferogram pattern and fixed during the inversion.
Table 2. Comparisons with rupture speed of supershear events.
Supershear EventInitial Rupture Speed (km/s)Supershear Rupture Speed (km/s)Shear Wave Speed 1 (km/s)Source
1999 Mw 7.2 Düzce2.93.5~3.6~3.1Birgören et al. [58]
2001 Mw 7.8 Kokoxili2.65.73.3Walker and Shearer [59]
2002 Mw 7.9 Denali3.35.53.4Walker and Shearer [59]
2010 Mw 6.9 Yushu0~15.03.0~3.6Wang and Mori [41]
2012 Mw 8.6 Sumatra2~2.55.03.5~4.6Wang et al. [46]
2013 Mw 7.6 Craig3.07.03.8Yue et al. [47]
2018 Mw 7.5 Palu5.05.02.5~3.1Ulrich et al. [8]
4.14.13.4~3.8Bao et al. [2]
4.14.13.4~3.8This study
1 Shear wave upper crustal speed.

