Tidal and Meteorological Influences on the Growth of Invasive Spartina alterniflora: Evidence from UAV Remote Sensing


1
Key Laboratory of the Coastal and Wetland Ecosystems (Ministry of Education), Coastal and Ocean Management Institute, College of the Environment and Ecology, Xiamen University, Xiamen 361102, China
2
Center for Urban and Environmental Change, Department of Earth and Environmental Systems, Indiana State University, Terre Haute, IN 47809, USA
3
Baruch Institute and Department of Biological Sciences, University of South Carolina, Columbia, SC 29208, USA
*
Author to whom correspondence should be addressed.
Remote Sens. 2019, 11(10), 1208; https://doi.org/10.3390/rs11101208
Submission received: 17 April 2019
/
Revised: 12 May 2019
/
Accepted: 18 May 2019
/
Published: 22 May 2019
(This article belongs to the Special Issue Remote Sensing for Terrestrial Ecosystem Health)
Abstract
:Rapid invasion of Spartina alterniflora into Chinese coastal wetlands has attracted much attention. Many field and remote sensing studies have examined the spatio-temporal dynamics of S. alterniflora invasion; however, spatially explicit quantitative analyses of S. alterniflora invasion and its underlying mechanisms at both patch and landscape scales are seldom reported. To fill this knowledge gap, we integrated multi-temporal unmanned aerial vehicle (UAV) imagery, light detection and ranging (LiDAR)-derived elevation data, and tidal and meteorological time series to explore the growth potential (lateral expansion rates and canopy greenness) of S. alterniflora over the intertidal zone in a subtropical coastal wetland (Zhangjiang estuarine wetland, Fujian, China). Our analyses of patch expansion indicated that isolated S. alterniflora patches in this wetland experienced high lateral expansion over the past several years (averaged at 4.28 m/year in patch diameter during 2014–2017), and lateral expansion rates (, m/year) showed a statistically significant declining trend with increasing inundation (, h/day; ): , . Our analyses of canopy greenness showed that the seasonality of the growth potential of S. alterniflora was driven by temperature (Pearson correlation coefficient ) and precipitation (), with the growth potential peaking in early/middle summer with high temperature and adequate precipitation. Together, we concluded that the growth potential of S. alterniflora was co-regulated by tidal and meteorological regimes, in which spatial heterogeneity is controlled by tidal inundation while temporal variation is controlled by both temperature and precipitation. To the best of our knowledge, this is the first spatially explicit quantitative study to examine the influences of tidal and meteorological regimes on both spatial heterogeneity (over the intertidal zone) and temporal variation (intra- and inter-annual) of S. alterniflora at both patch and landscape scales. These findings could serve critical empirical evidence to help answer how coastal salt marshes respond to climate change and assess the vulnerability and resilience of coastal salt marshes to rising sea level. Our UAV-based methodology could be applied to many types of plant community distributions.
1. Introduction
Salt marshes are one of the most productive coastal ecosystems providing numerous important ecosystem services [1,2]. Besides being invaluable biological resources for coastal society and natural habitats for a variety of coastal fauna, salt marshes play critical roles in storing blue carbon, mitigating coastal erosions, facilitating sediment accretion, and accelerating tidal flat expansion [3,4,5,6]. With increasing recognition of the importance of these ecosystem services, coastal ecologists are paying close attention to the growth dynamics of salt marshes and the fate of salt marshes with sea-level rise. Sea-level rise leads to more prolonged hypoxia for salt marshes with longer submergence, but longer inundation time also promotes sediment deposition, and thus the survival of salt marshes is mainly determined by the balance between rates of sea-level rise and surface accretion [7,8,9]. Surface accretion of salt marshes results from organic and inorganic sedimentations, both of which are directly and indirectly related to vegetation growth properties. In fact, properties such as biomass and stem density have been widely used as key parameters in modeling bio-geomorphological processes in coastal salt marshes [10,11,12]. However, the introduction of these parameters poses significant challenges for model predictions since vegetation growth in complex and dynamic coastal habitats usually shows high spatial and temporal variations [7,13,14]. Therefore, to make a robust prediction of the survival of salt marshes with sea-level rise, it is important to enhance our understanding of the spatio-temporal heterogeneity of vegetation growth of coastal salt marshes and underlying environmental controlling mechanisms.
Spartina alterniflora, one of coastal salt marshes native to the Atlantic coast, has received much attention in the past decades due to its role as an invasive species in many parts of the world [15,16,17,18]. In terms of spatial variation over the intertidal zone, S. alterniflora is distributed across a wide elevation gradient between mean high water (MHW) and mean low water (MLW) [19,20], and the growth of S. alterniflora shows a hump-shaped cross-shore pattern over the elevation gradient [7,14,21]. Tidal inundation or relative surface elevation is a widely documented environmental control of the spatial variation of S. alterniflora growth [21,22]. In terms of temporal variation, S. alterniflora growth follows a distinct seasonal pattern correlated with temperature [23] and precipitation [13]. Although the spatio-temporal growth variations of S. alterniflora have been characterized by many empirical studies, most of these studies were based on field surveys of vegetation with limited sampling plots or in-situ bioassays, e.g., the “marsh-organ”. These studies have advantages in characterizing the detailed growth dynamics of S. alterniflora and underlying controlling mechanisms at small scales; however, given the high spatio-temporal variations of S. alterniflora growth, the results from these plot-scale studies might not accurately reflect actual growth dynamics of S. alterniflora at the landscape scale.
Use of satellite imagery to explore large-scale spatio-temporal dynamics of S. alterniflora is now well-established [24,25,26]. For example, Huang and Zhang [24] applied multi-temporal Landsat TM satellite imagery to capture the interannual dynamics of a S. alterniflora expansion in the Yangtze Estuary, China, and Ai et al. [25] applied multi-temporal GaoFen (GF-1) satellite imagery to track the seasonal dynamics of S. alterniflora expansion in the same estuary. Satellite imagery is ideal for large-scale monitoring of S. alterniflora expansion, but it is challenging to apply satellite imagery to examine the spatio-temporal dynamics of S. alterniflora expansion at the patch-scale. First, freely available multi-temporal satellite imageries (e.g., Landsat and Sentinel) have moderate spatial resolutions (tens of meters) that are not fine enough to accurately characterize the range expansion of many small isolated patches (<1 m in diameter) over bare tidal flat. Second, commercially available satellite imageries (e.g., Worldview and Quickbird) have sub-meter spatial resolutions, but they are usually cost prohibited and unavailable at regular temporal intervals. Third, due to frequent image contamination by cloud and tidal inundation, many satellite imageries acquired in coastal areas are of low quality and thus excluded in further image analyses.
The limitations of satellite imagery have been overcome by the application of unmanned airborne vehicle (UAV) technologies [27,28,29,30,31]. With UAV, it is possible to acquire very high resolution (VHR) images to track the growth of S. alterniflora at the patch scale, and the availability of VHR orthophotography merged with UAV imagery provides an opportunity to capture detailed spatio-temporal dynamics of plant community dynamics at the landscape scale. The characteristics of quick flight deployments and feasible flight timing of UAV make it ideal in monitoring S. alterniflora expansion over the intertidal zone where periodically inundated vegetation has limited exposure period. In addition, the UAV-borne light detection and ranging (LiDAR) technologies have been recently more available to characterize the detailed microtopography of coastal wetlands [32,33,34,35,36], which is unavailable from existing global or regional digital elevation model products [37]. The availability of the microtopography from UAV LiDAR makes it possible to accurately acquire the spatial variation in surface elevation and tidal inundation over flat (a slope of ~ 1‰ [36]), but complex intertidal zone topography by incorporating in-situ tidal observations. This provides an ideal opportunity to examine the influence of tidal inundation on the spatio-temporal dynamics of S. alterniflora expansion at both patch and landscape scales.
Here, we report results of a study of the spatio-temporal dynamics of S. alterniflora expansion at both patch and landscape scales in a subtropical coastal wetland: the Zhangjiang estuarine wetland in the southeastern coast of China. This wetland has experienced fast areal expansion of S. alterniflora since 2003 [38] with an explosive expansion over the past several years based on our regular UAV surveys. The Zhangjiang estuarine wetland is also protected as a national reserve, and the intertidal zone is free of intensive human disturbances, providing an ideal opportunity to observe the growth and expansion of S. alterniflora under natural conditions. The overall goal of this study is to characterize the spatio-temporal dynamics and underlying mechanisms of S. alterniflora expansion using multi-temporal UAV imagery in combination with the spatial data of surface elevation and tidal inundation. Spatially explicit quantitative analyses were conducted in order to answer the following questions: (1) What are the spatio-temporal dynamics of S. alterniflora expansion at annual and seasonal time scales? (2) How are such spatio-temporal dynamics related to environmental gradients of surface elevation and tidal inundation?
2. Materials and Methods
2.1. Study Area
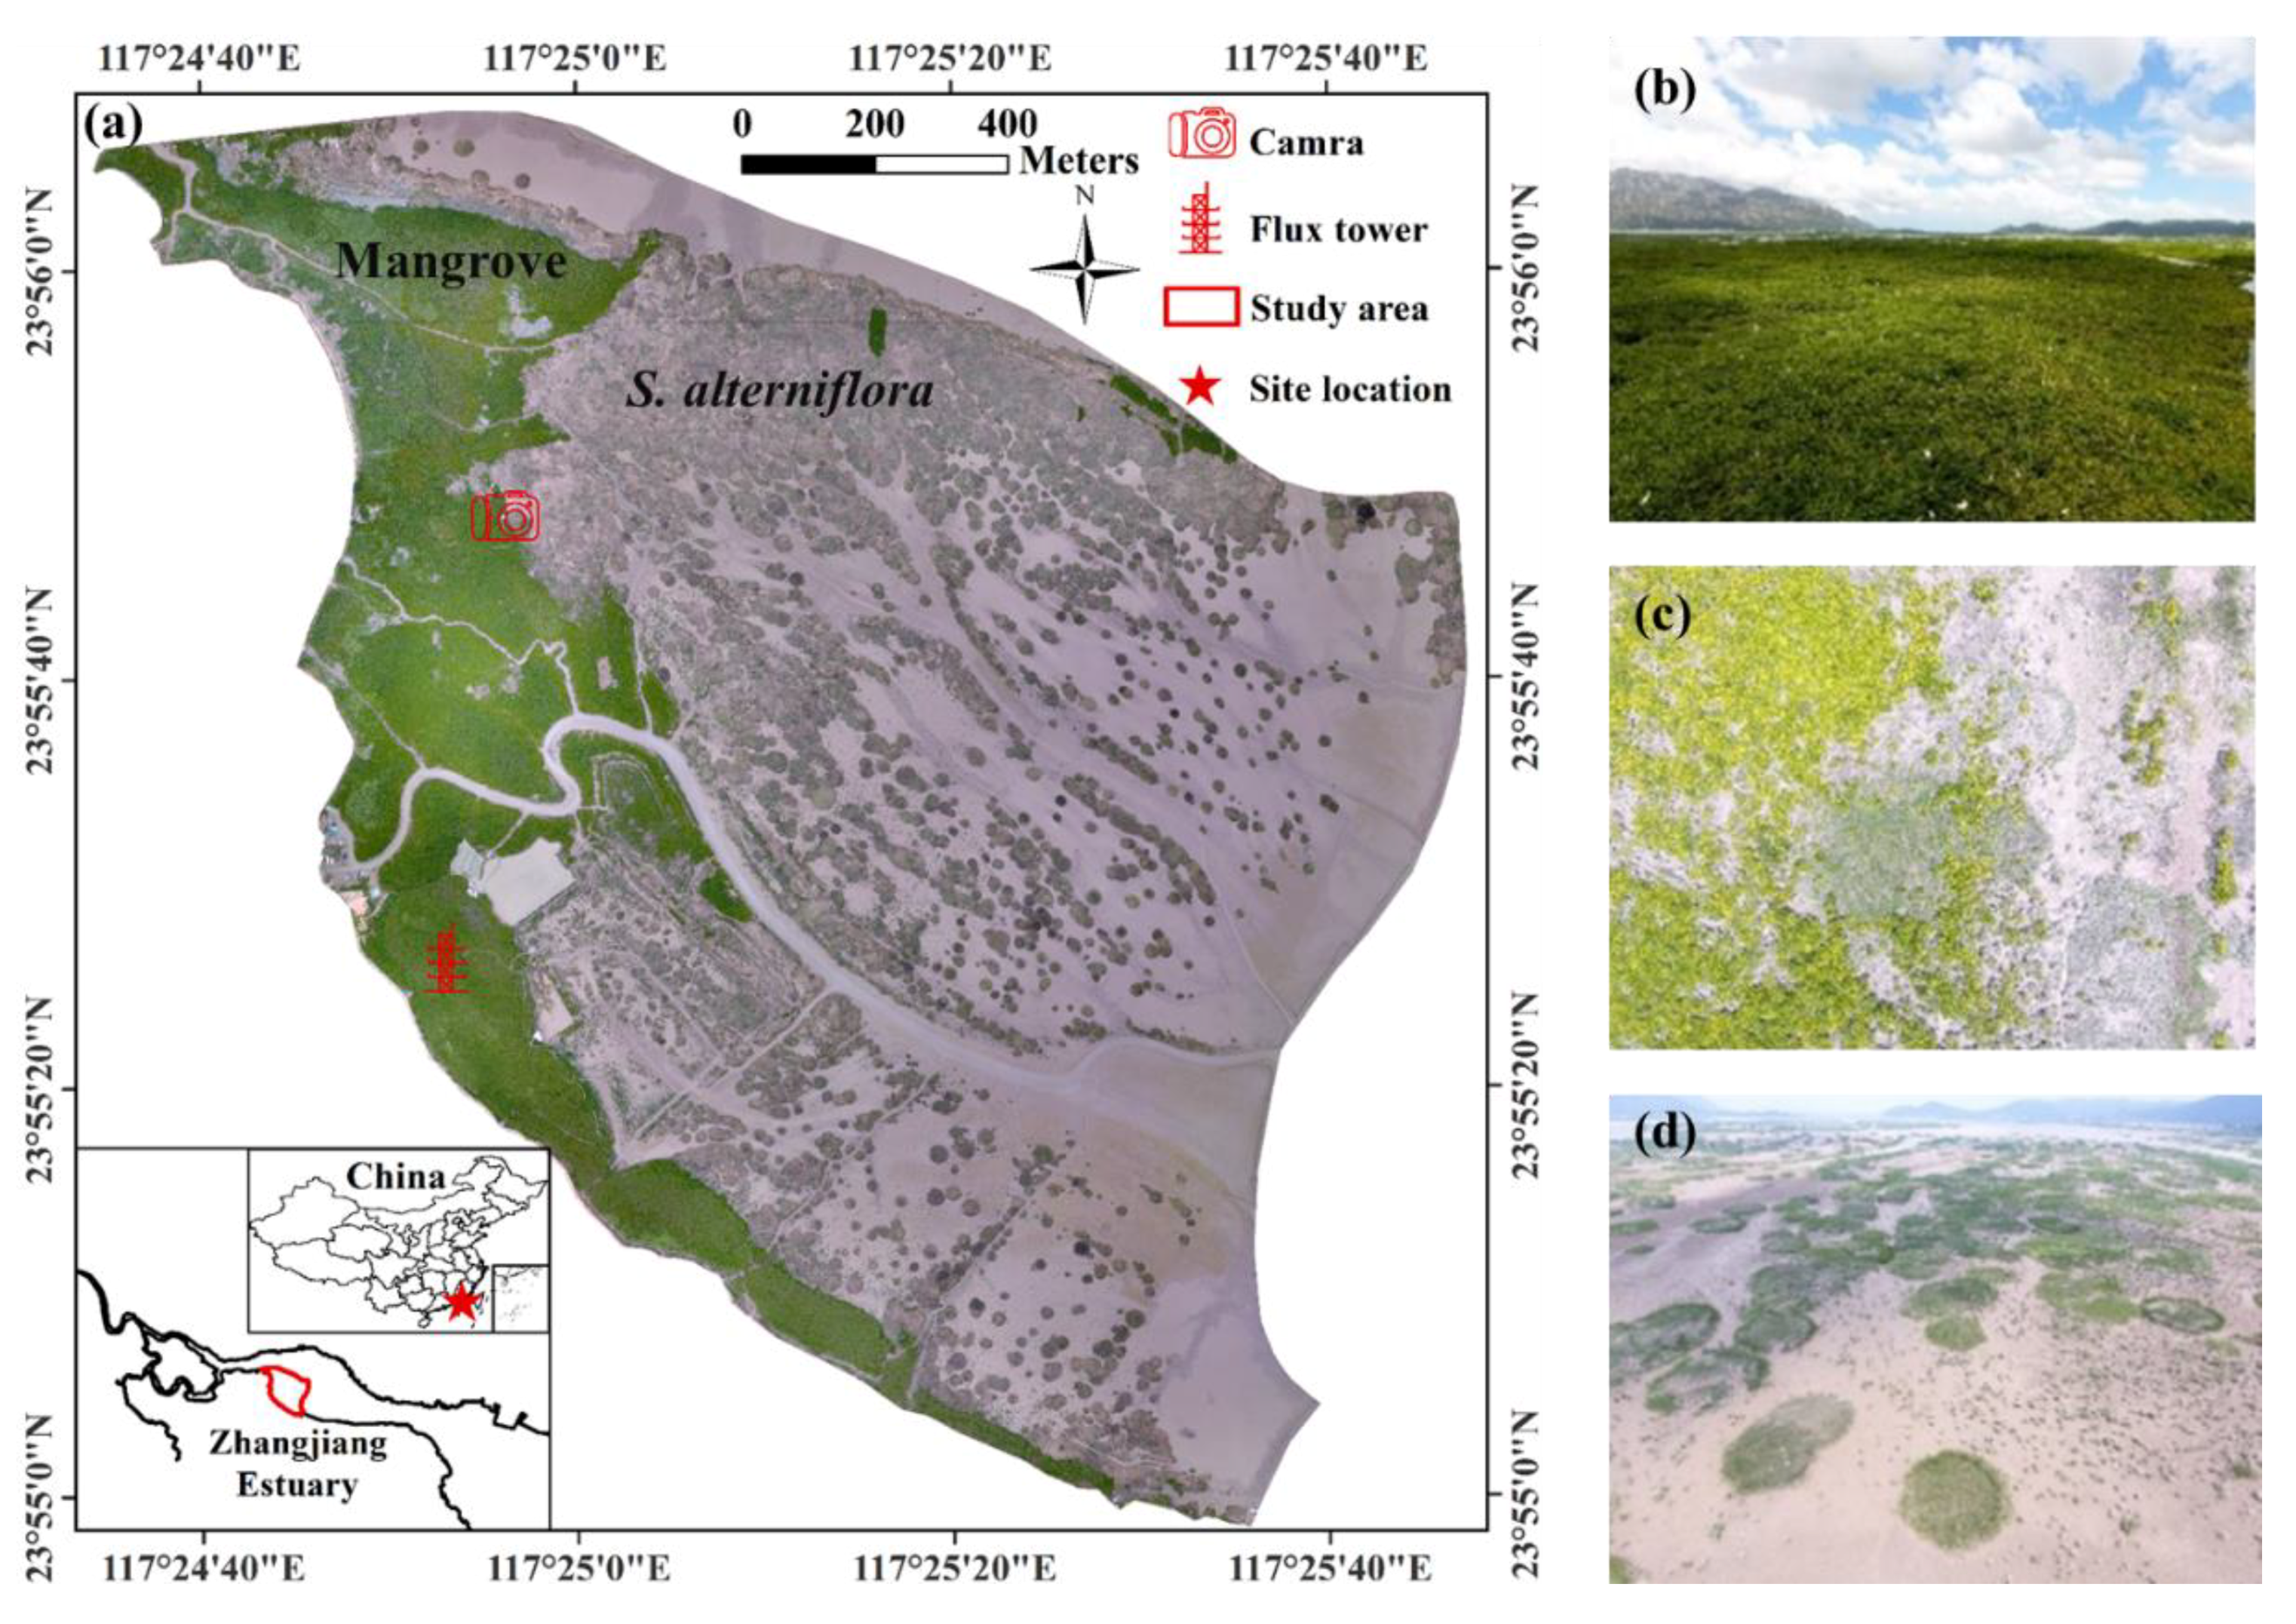
The study area, with an area of 2.6 km2, is located within the intertidal zone of the Zhangjiang estuarine wetland in Fujian, China (Figure 1; geographical extent: 117°24′34″E~117°25′48″E, 23°54′56″N~23°56′8″N). The wetland has a subtropical marine monsoonal climate with mean annual air temperature of 21.2 °C, precipitation of 1714.5 mm, 2125 h of daylight, and relative humidity of 79%; the wetland is affected by irregular semidiurnal tides with a mean tidal range (MTR) of 2.3 m and varying salinity of 0~20 and 16~26 practical salinity unit (PSU) for tidal surface water and soil pore water, respectively [39]. As a national nature reserve, the wetland is now being protected for the conservation of mangrove forests.
2.2. Acquisition and Processing of UAV RGB Imagery
Regular UAV flights were conducted to acquire multi-temporal RGB imagery over the study area (August 2014, August 2015, October 2016, and monthly flights from March 2017 to February 2018 except August and September 2017 due to temporary air traffic control). Each time, the UAV flights were conducted at a height of ~200 m during low-tide (UAV model: DJI Plantom 4; DJI Technology, Shenzhen, China; see Table S1 for UAV and RGB camera parameters). To reduce positioning errors, ground control points were measured using real-time kinematic (RTK) GPS to acquire high-accuracy geographical coordinates, which were then used for image georeferencing (total error < 0.5 m). A set of original RGB images (>500) were processed in Photoscan (Agisoft LLC, St. Petersburg, Russia) to generate a very high resolution (<10 cm) RGB orthophoto covering the whole study area. Then, we manually digitalized all isolated S. alterniflora patches for each orthophoto using ArcGIS 10.2 (ESRI, Inc., Redlands, CA, USA). In practice, patch diameters < 0.5 m were too small to accurately identify (mainly due to the difficulty in distinguishing between S. alterniflora patch and mangrove saplings), thus, they were excluded in the digitalization process. Since we were interested in characterizing the growth and expansion of S. alterniflora patches under a non-competitive environment, we only digitalized isolated patches not bordering on other patches, contiguous meadow or mangrove forest (Figure S1). With the acquisition of digitized spatial data, the area of each isolated S. alterniflora patch was determined and the diameter was then calculated in ArcGIS 10.2 by assuming circular shapes for all isolated patches (see typical isolated patches in Figure S2).
Time series of canopy greenness was used to characterize the seasonal phenology of each isolated S. alterniflora patch. Specifically, based on multi-temporal RGB orthophotos, we calculated green chromatic coordinates (), which had been often used to track the seasonal phenology of deciduous canopy [40,41]. The image raster calculations were performed to obtain greenness index maps from image RGB information: , where R, G, and B denote digital number of red, green, and blue channels of the image, respectively. In combination with digitized imagery, patch-mean greenness was then calculated for further analyses. The spatial analyses and calculation of RGB orthophotos were implemented in ArcGIS 10.2.
2.3. Acquisition and Processing of Other Data
UAV LiDAR remote sensing technologies were applied to obtain point cloud data (at a density of ~ 100 points/m2) of the intertidal zone in the Zhangjiang estuarine wetland during low-tide periods in October 2017. A LiDAR scanner (model: RIEGL VUX-1UAV; RIEGL, Horn, Austria) was mounted on a UAV (model: DJI Matrice 600; DJI Technology, Shenzhen, China) for collecting LiDAR data. See Zhu et al. [36] for the details of the flight campaign and the information of UAV and LiDAR sensors. Since ground filtering algorithms developed for LiDAR point cloud data had difficulty in deriving accurate surface elevation with short and dense canopies like S. alterniflora patches [42,43], we estimated surface elevation from LiDAR point cloud data using field RTK-GPS surface elevation measurements as a reference. Specifically, original LiDAR point cloud data were used to estimate mean surface elevation of each isolated S. alterniflora patches via a thresholding method based on a cumulative distribution curve of point elevation values (Figure S3). For a given patch, elevation values of all LiDAR points within the patch were sorted in ascending order to form a cumulative distribution curve, and an elevation threshold at the 10th percentile was selected to represent mean surface elevation of the patch. The threshold was determined based on the fact that the root mean square error at this percentile was the smallest between estimated patch surface elevation and field measurements (five random measurements for each of 132 surveyed patches over the wetland; Figure S4). As in Zhu et al. [36], the mean surface elevation was then combined with one-year (September 2016~September 2017) in-situ 10-min tidal water level time series measurements to calculate mean relative elevation (zero at local mean sea level, MSL) and mean daily inundation duration (0~24 h/day) for each studied S. alterniflora patch (Figure S5). Note that we referenced MSL to the arithmetic mean of the one-year water level time series (rather than 50% inundation), because the inundation duration at MSL was not equivalent to 12 h/day due to tidal asymmetry. During field RTK-GPS surface elevation surveys, we also sampled sediment at a depth of ~ 5 cm in each surveyed patch (three replicates) and determined pore-water salinity in the lab using a hand-held seawater salinity refractometer (2491 MASTER-S/Millα, ATAGO, Tokyo, Japan).
To further examine the seasonal phenology, we used a ground camera installed at a fixed position (Figure 1) to record daily images of a particular region of contiguous S. alterniflora, and greenness was then calculated as , defined above. In addition, we collected daily time series of meteorological data (air temperature and precipitation) and tidal surface water salinity. Air temperature and precipitation were respectively measured using a HMP155A sensor (Vaisala, Helsinki, Finland) and a TE525MM Rain Gage (Campbell Scientific, Inc., Logan, UT, USA) installed on a flux tower (Figure 1). Tidal surface water salinity was estimated from measurements using the HOBO U24-002-C Conductivity Logger (Onset, Bourne, MA, USA), deployed just above sediment surface near the flux tower.
2.4. Temporal Change Analyses
Mean expansion rates and mean greenness of isolated S. alterniflora patches were calculated from the digitized multi-temporal RGB orthophotos. Mean annual expansion rates were calculated from RGB orthophotos (one for each of four consecutive years acquired in August 2014, August 2015, October 2016, and July 2017), while seasonal expansion rates and greenness were derived from monthly RGB orthophotos. The LiDAR-derived spatial data of relative elevation and inundation duration were used to examine spatial expansion rates and greenness of isolated S. alterniflora patches along paired with relative elevation and inundation duration. For the interannual analyses, we selected isolated S. alterniflora patches with at least three consecutive years during 2014−2017 (i.e., not merged with others; N = 452). For the seasonal analyses, we selected isolated S. alterniflora patches from March 2017 to February 2018 (N = 252). The inconsistency in the number of isolated patches resulted from gradual merging of nearby expanding patches. Analyses of expansion rates and greenness were implemented in MATLAB R2016a (The MathWorks, Inc., Natick, MA, USA).
3. Results
3.1. Interannual Variations of S. alterniflora Expansion
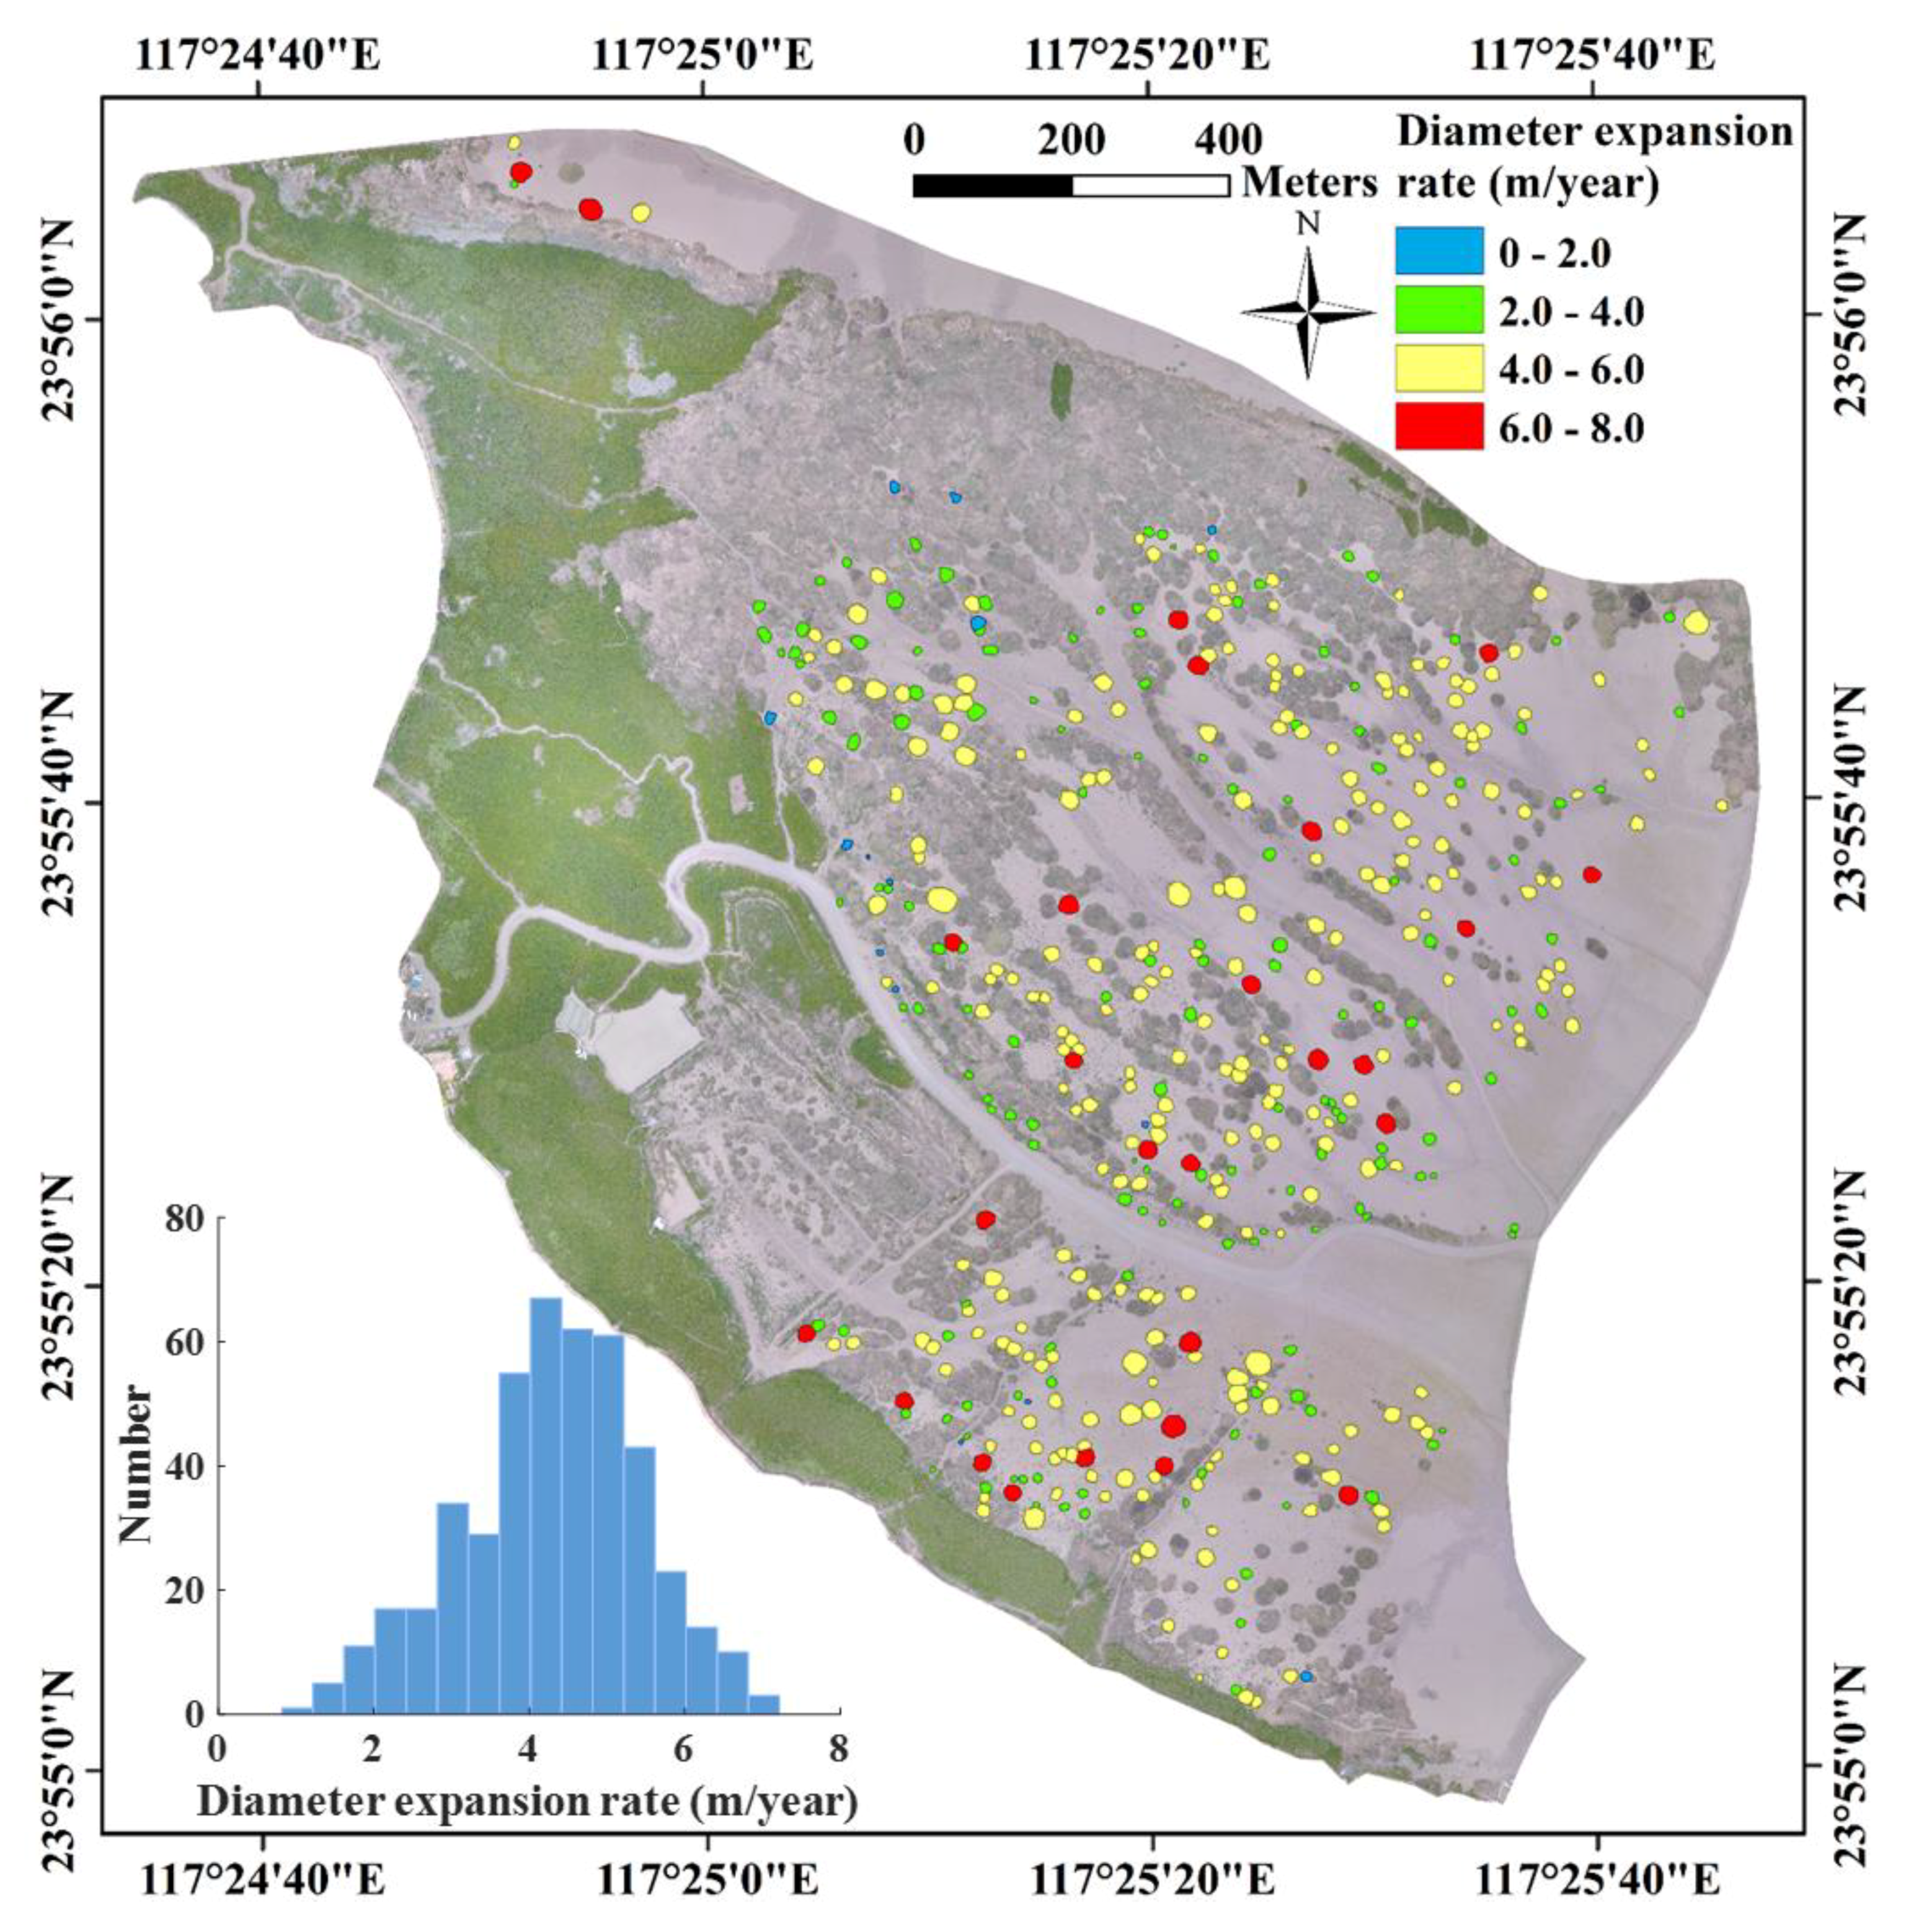
During the period of explosive expansion of S. alterniflora from 2014 to 2017, both the number and mean expansion rate of isolated patches decreased with time (Table 1), likely due to space limitation. For example, during 2014–2017, the number of isolated patches (>0.5 m in diameter) declined from 902 to 325 due largely to coalescence. The 325 remaining patches were comprised of 196 isolated patches persistent for 2014–2017, 41 newly formed in 2015, and 88 newly formed in 2016. Patches isolated for at least three consecutive years from 2014 to 2017 were mostly situated at lower elevations at the seaward fringe where there was a larger open mudflat area for S. alterniflora growth. They were least likely to occur at higher elevations landward, close to mangrove forests, where space for growth was more limited (Figure 2). Annual expansion rates of isolated S. alterniflora patches over the wetland followed a normal distribution with mean diameter growth of 4.28 m/year. The majority of patches had a diameter growth of 2~6 m/year.
3.2. Seasonal Dynamics of S. alterniflora Expansion
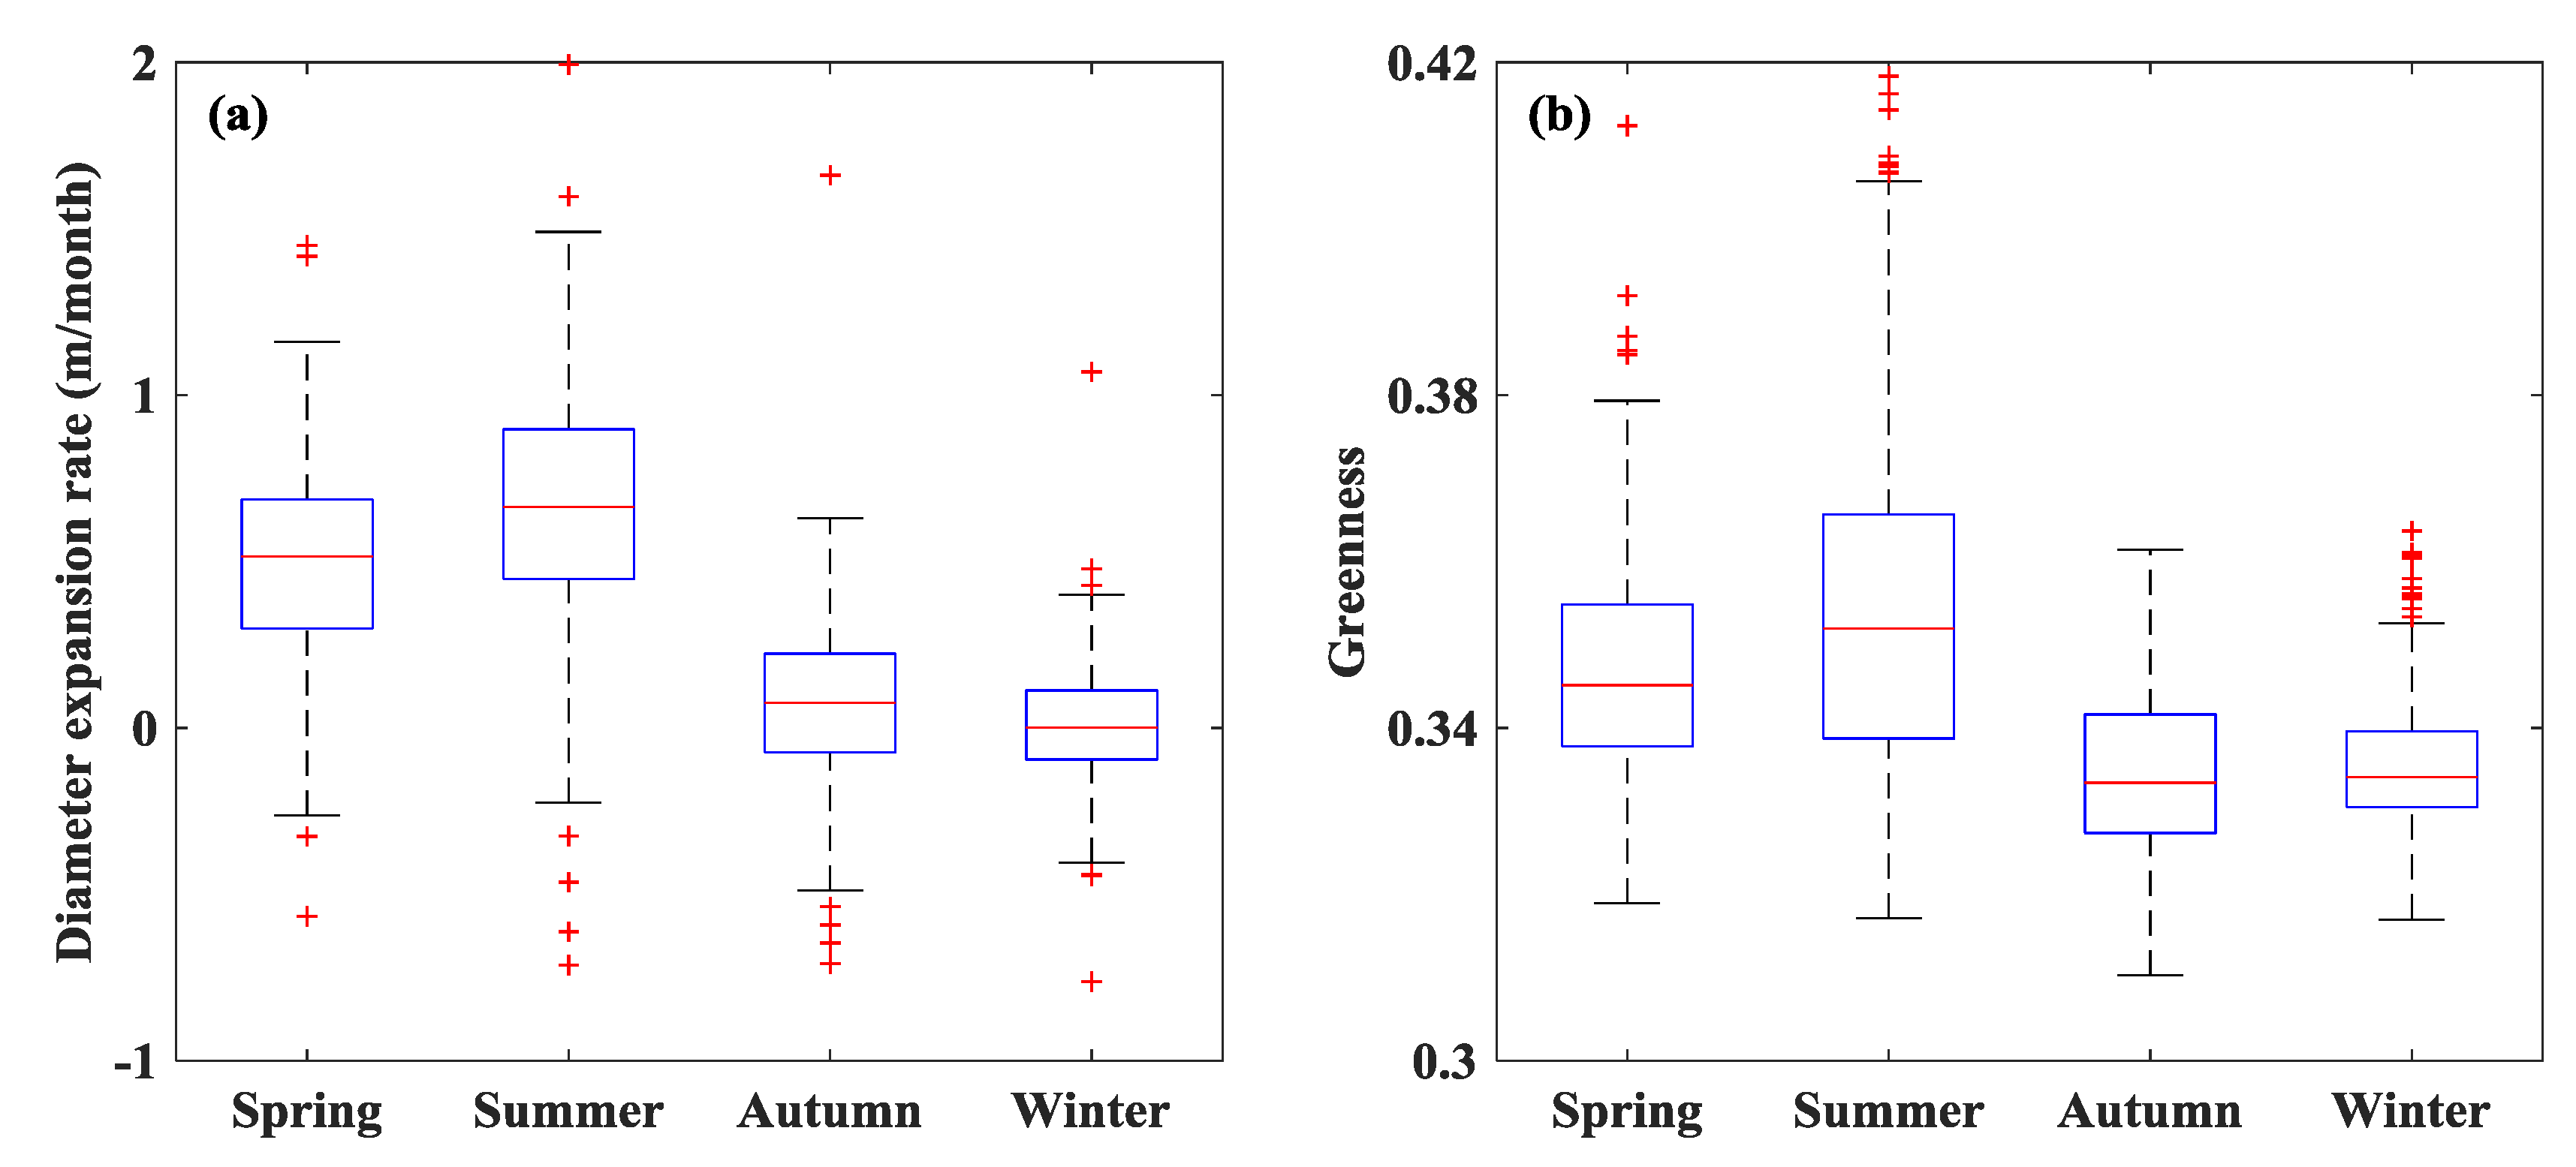
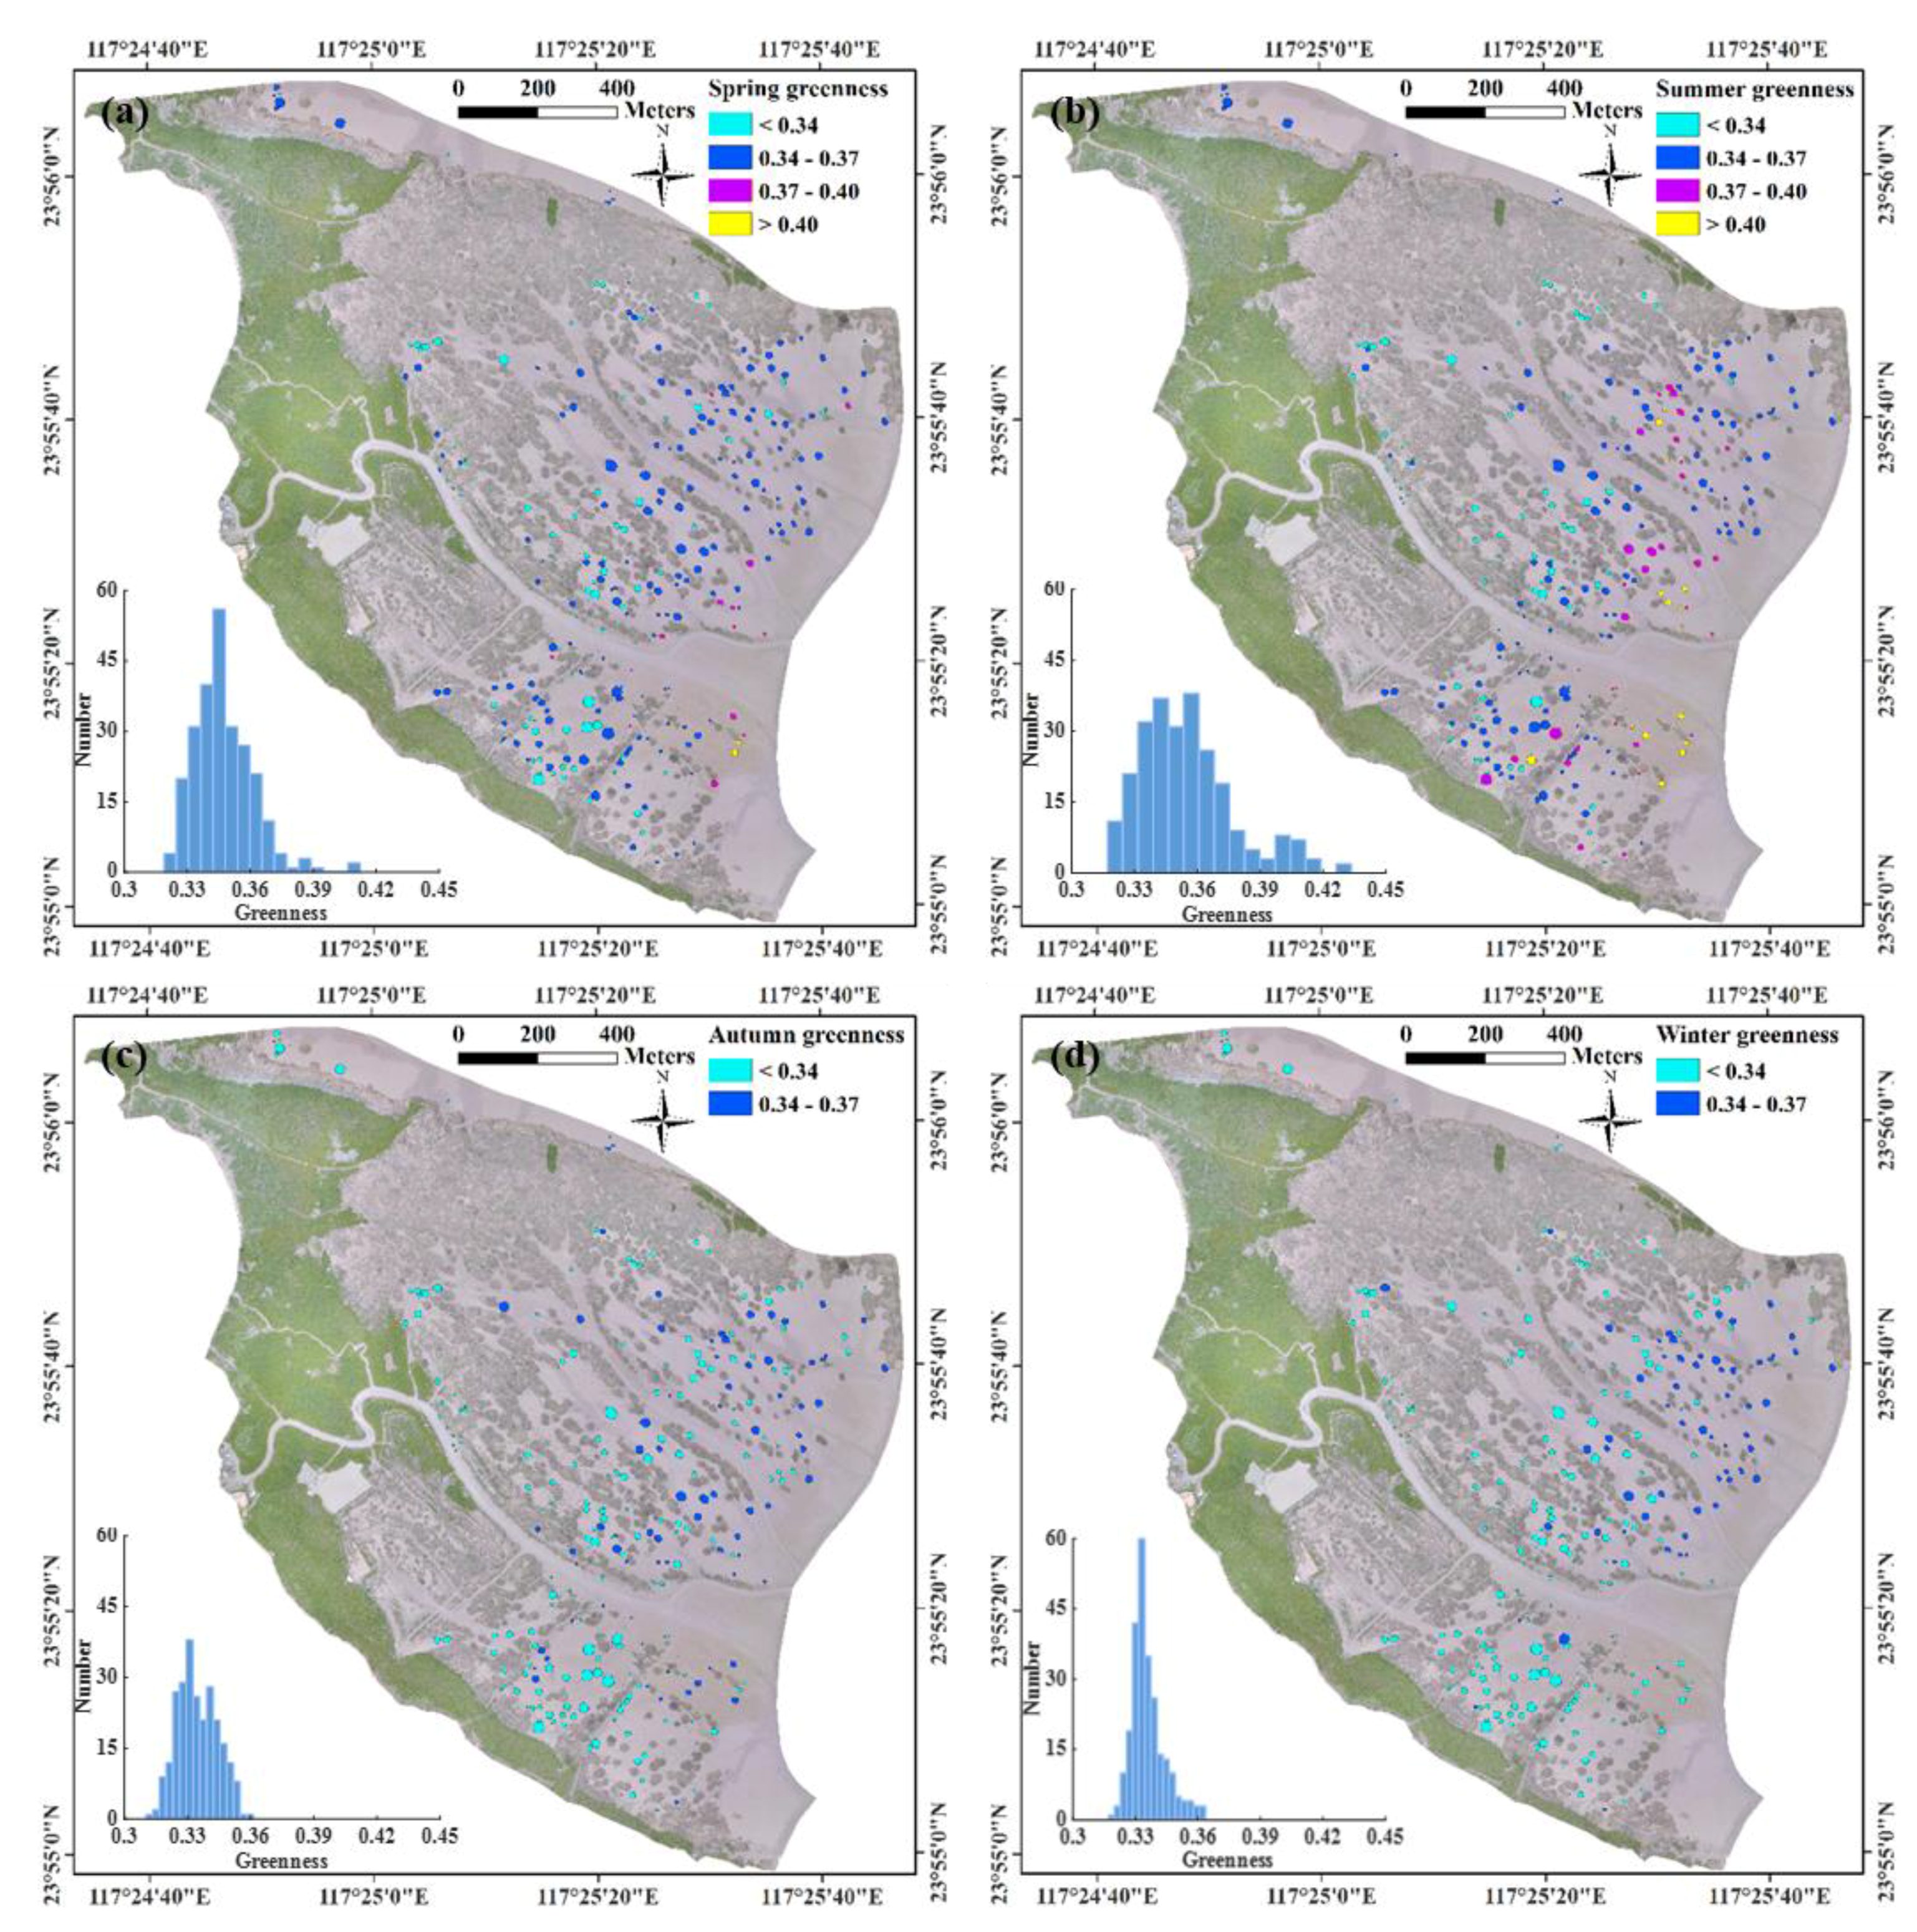
Isolated S. alterniflora patches had different expansion rates across seasons with higher rates in spring and summer (median values of 0.52 and 0.66 m/month, respectively) and lower rates in autumn and winter (median values of 0.08 and 0.00 m/month, respectively) (Figure 3a). Similar to the seasonality of patch expansion, the patch-mean greenness was higher in spring and summer (highest median greenness of 0.35 in summer) and lower in autumn and winter (lowest median greenness of 0.33 in autumn) (Figure 3b). The seasonal pattern of patch expansion rate and greenness followed the general seasonal growth dynamics of S. alterniflora. Patch-mean greenness was normally distributed with variable range, depending on season (Figure 4). The spatial distribution of patch-mean greenness differed by season with the largest spatial heterogeneity (corresponding to the largest standard derivation of 0.023) in summer (Figure 4b) and the lowest spatial heterogeneity (corresponding to the smallest standard derivation of 0.008) in winter (Figure 4d). The daily changes in greenness of contiguous S. alterniflora from the ground camera had similar seasonal pattern as in UAV-based patch-mean greenness of isolated S. alterniflora patches (Figure 5), although there were offsets in absolute values of greenness probably due to different view angles between UAV (down-looking) and ground camera (side-looking).
3.3. Environmental Impacts on S. alterniflora Expansion
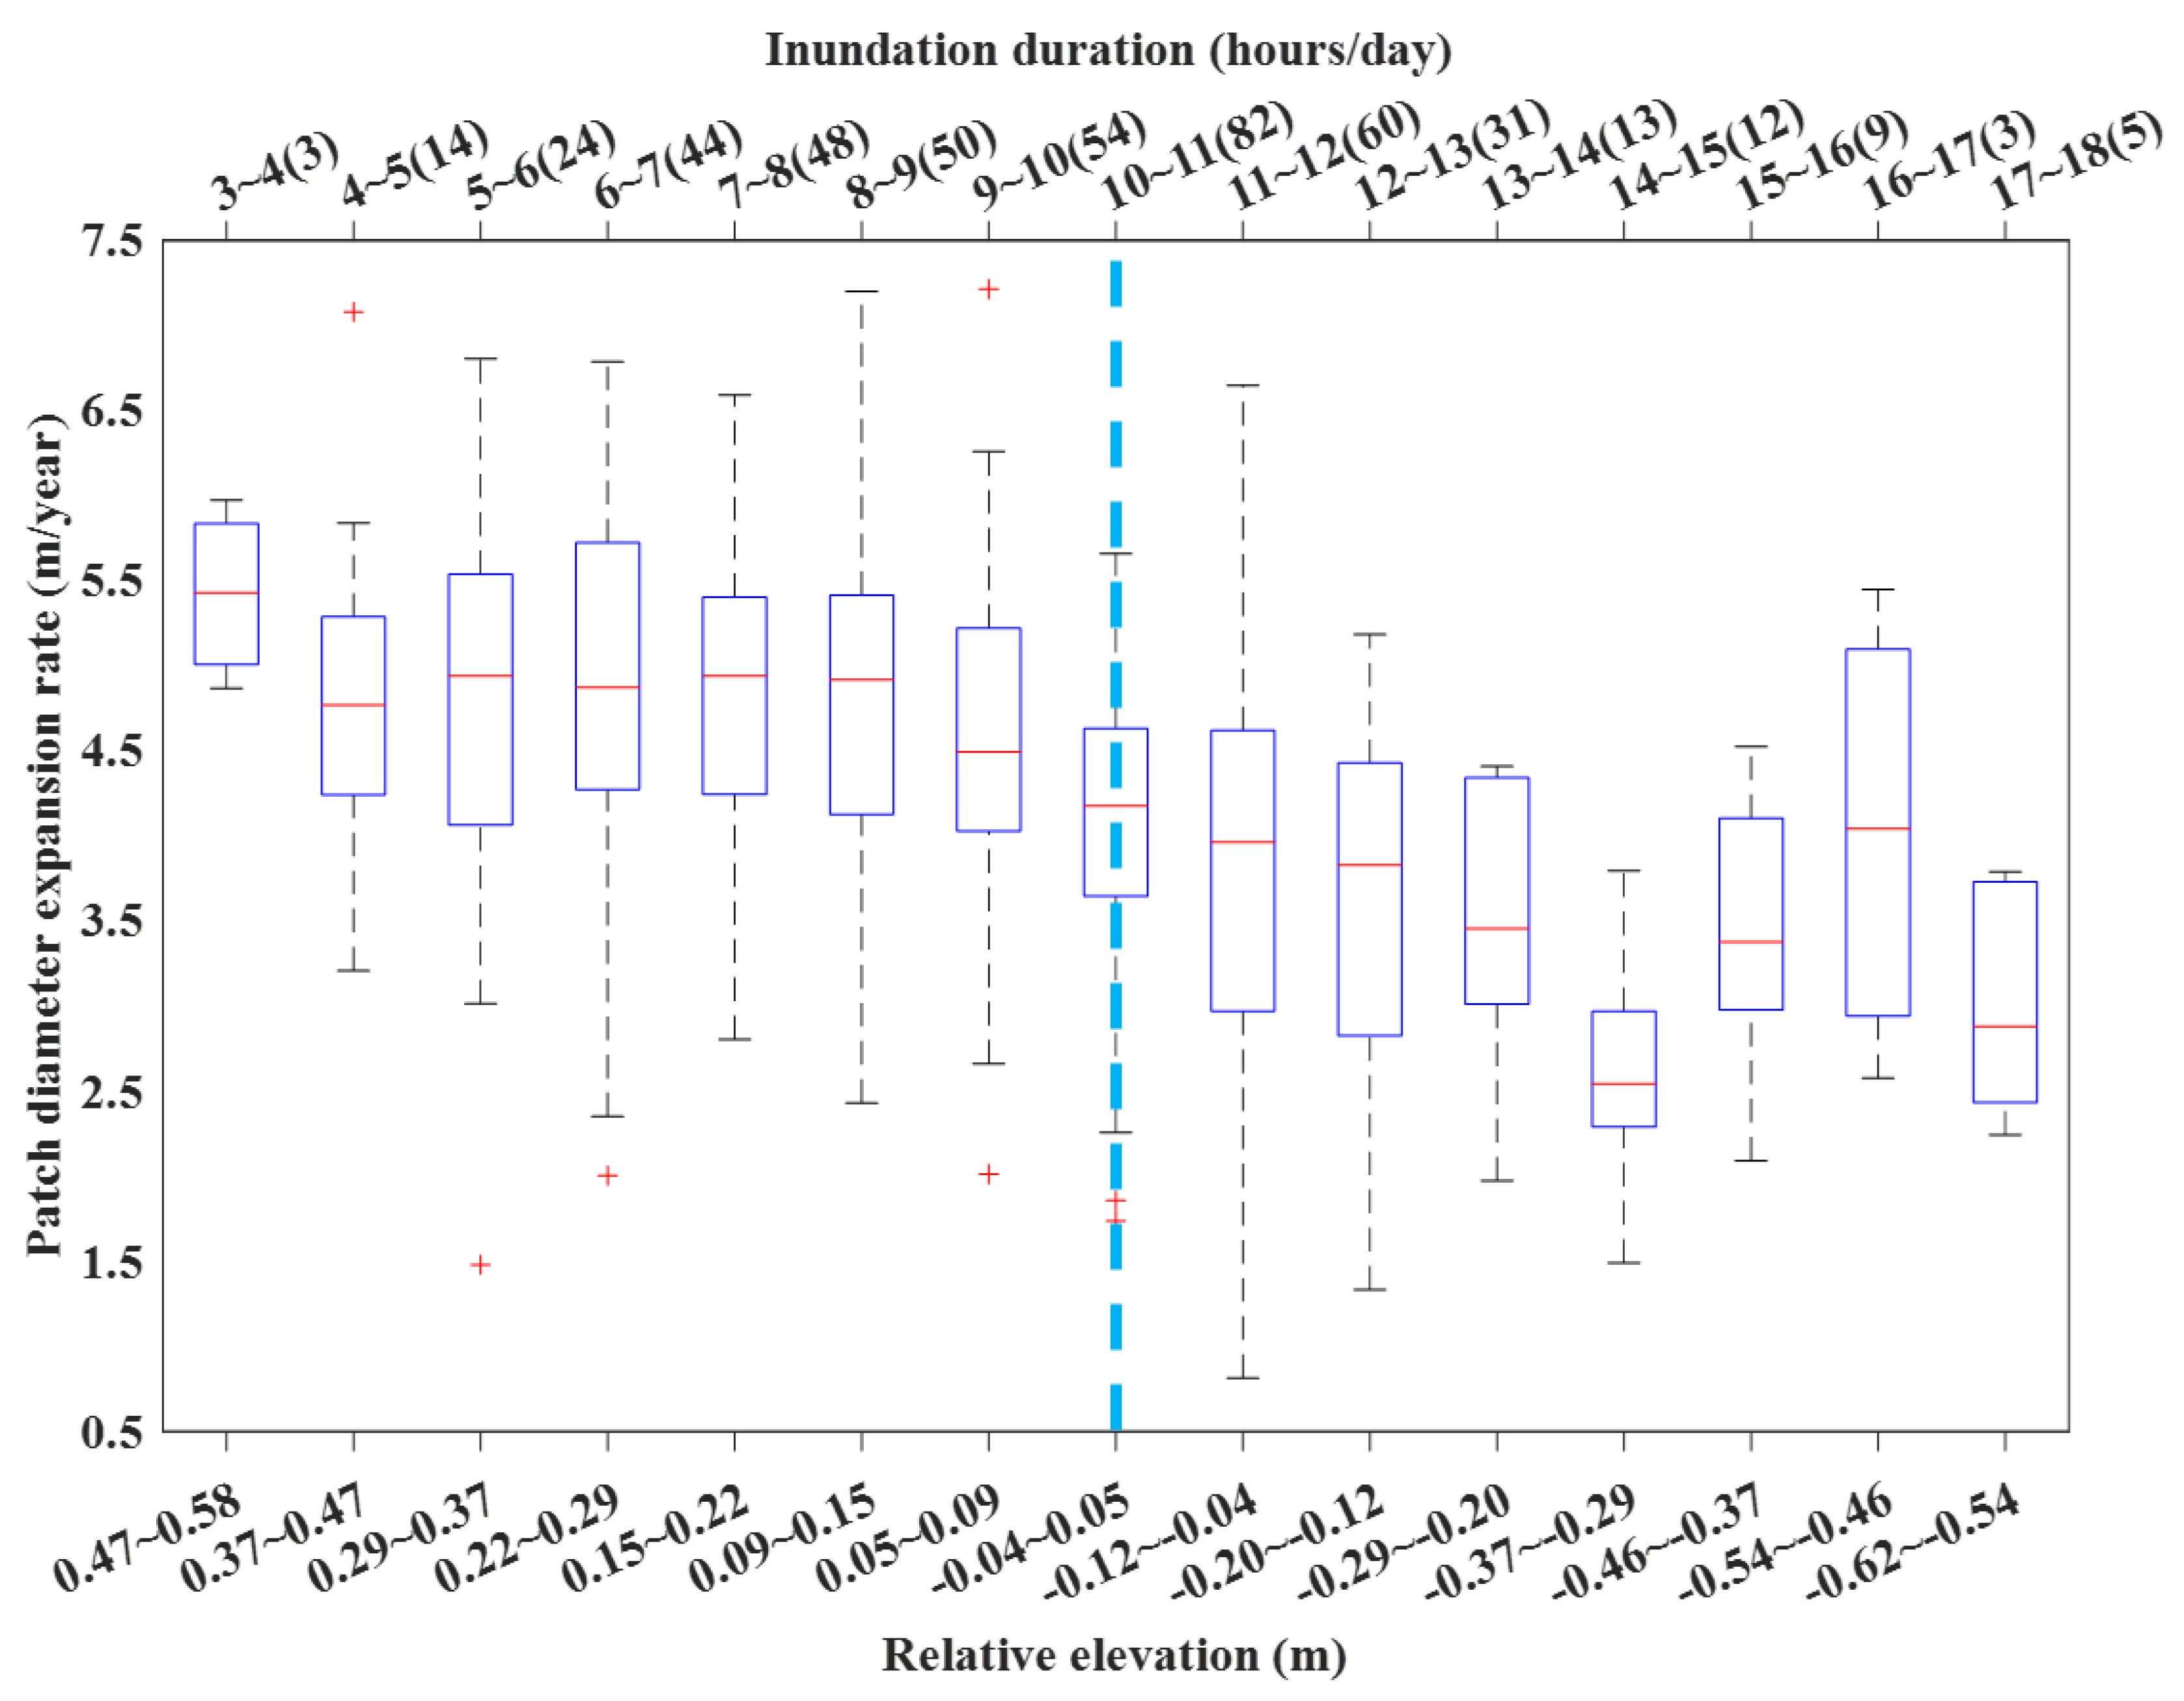
Isolated S. alterniflora patches (isolated at least three consecutive years from 2014 to 2017) were situated within the intertidal zone of inundation duration varying from 3 to 18 h/day (or relative elevations from 0.58 to −0.62 m) (Figure 6). 84 percent (379/452) of isolated patches were situated over the intertidal zone with <50% of the time inundated (3~12 h/day, or 0.58~−0.12 m), while the remaining 16% of patches were found at a lower elevation >50% of the time inundated (12~18 h/day, or −0.12~−0.62 m). Obviously, more isolated patches were found at a mid-elevation zone than higher or lower zones: about three quarters of patches within a six-hour inundation interval of 6~12 h/day. Despite large variation within each inundation/elevation gradient, expansion rate was significantly affected by inundation time. Median expansion rate was relatively stable and high when inundation duration was 9 h/day or less, and showed steep declines with increasing inundation. The optimal inundation duration for isolated S. alterniflora patches over this wetland was estimated to be ~4 to 9 h/day corresponding to 0.47 to 0.09 m in elevation (excluding the highest median value for the first inundation interval with only three patches). Linear regression of median values over the whole inundation gradient between expanding rate (, m/year) and inundation duration (, hours/day; ) confirmed a statistically significant declining trend (; , ). When using relative elevation (, m; ), the trend can be best described by (). Sediment salinity in all surveyed patches fell between 14 to 18 PSU without any spatial trend (data not shown).
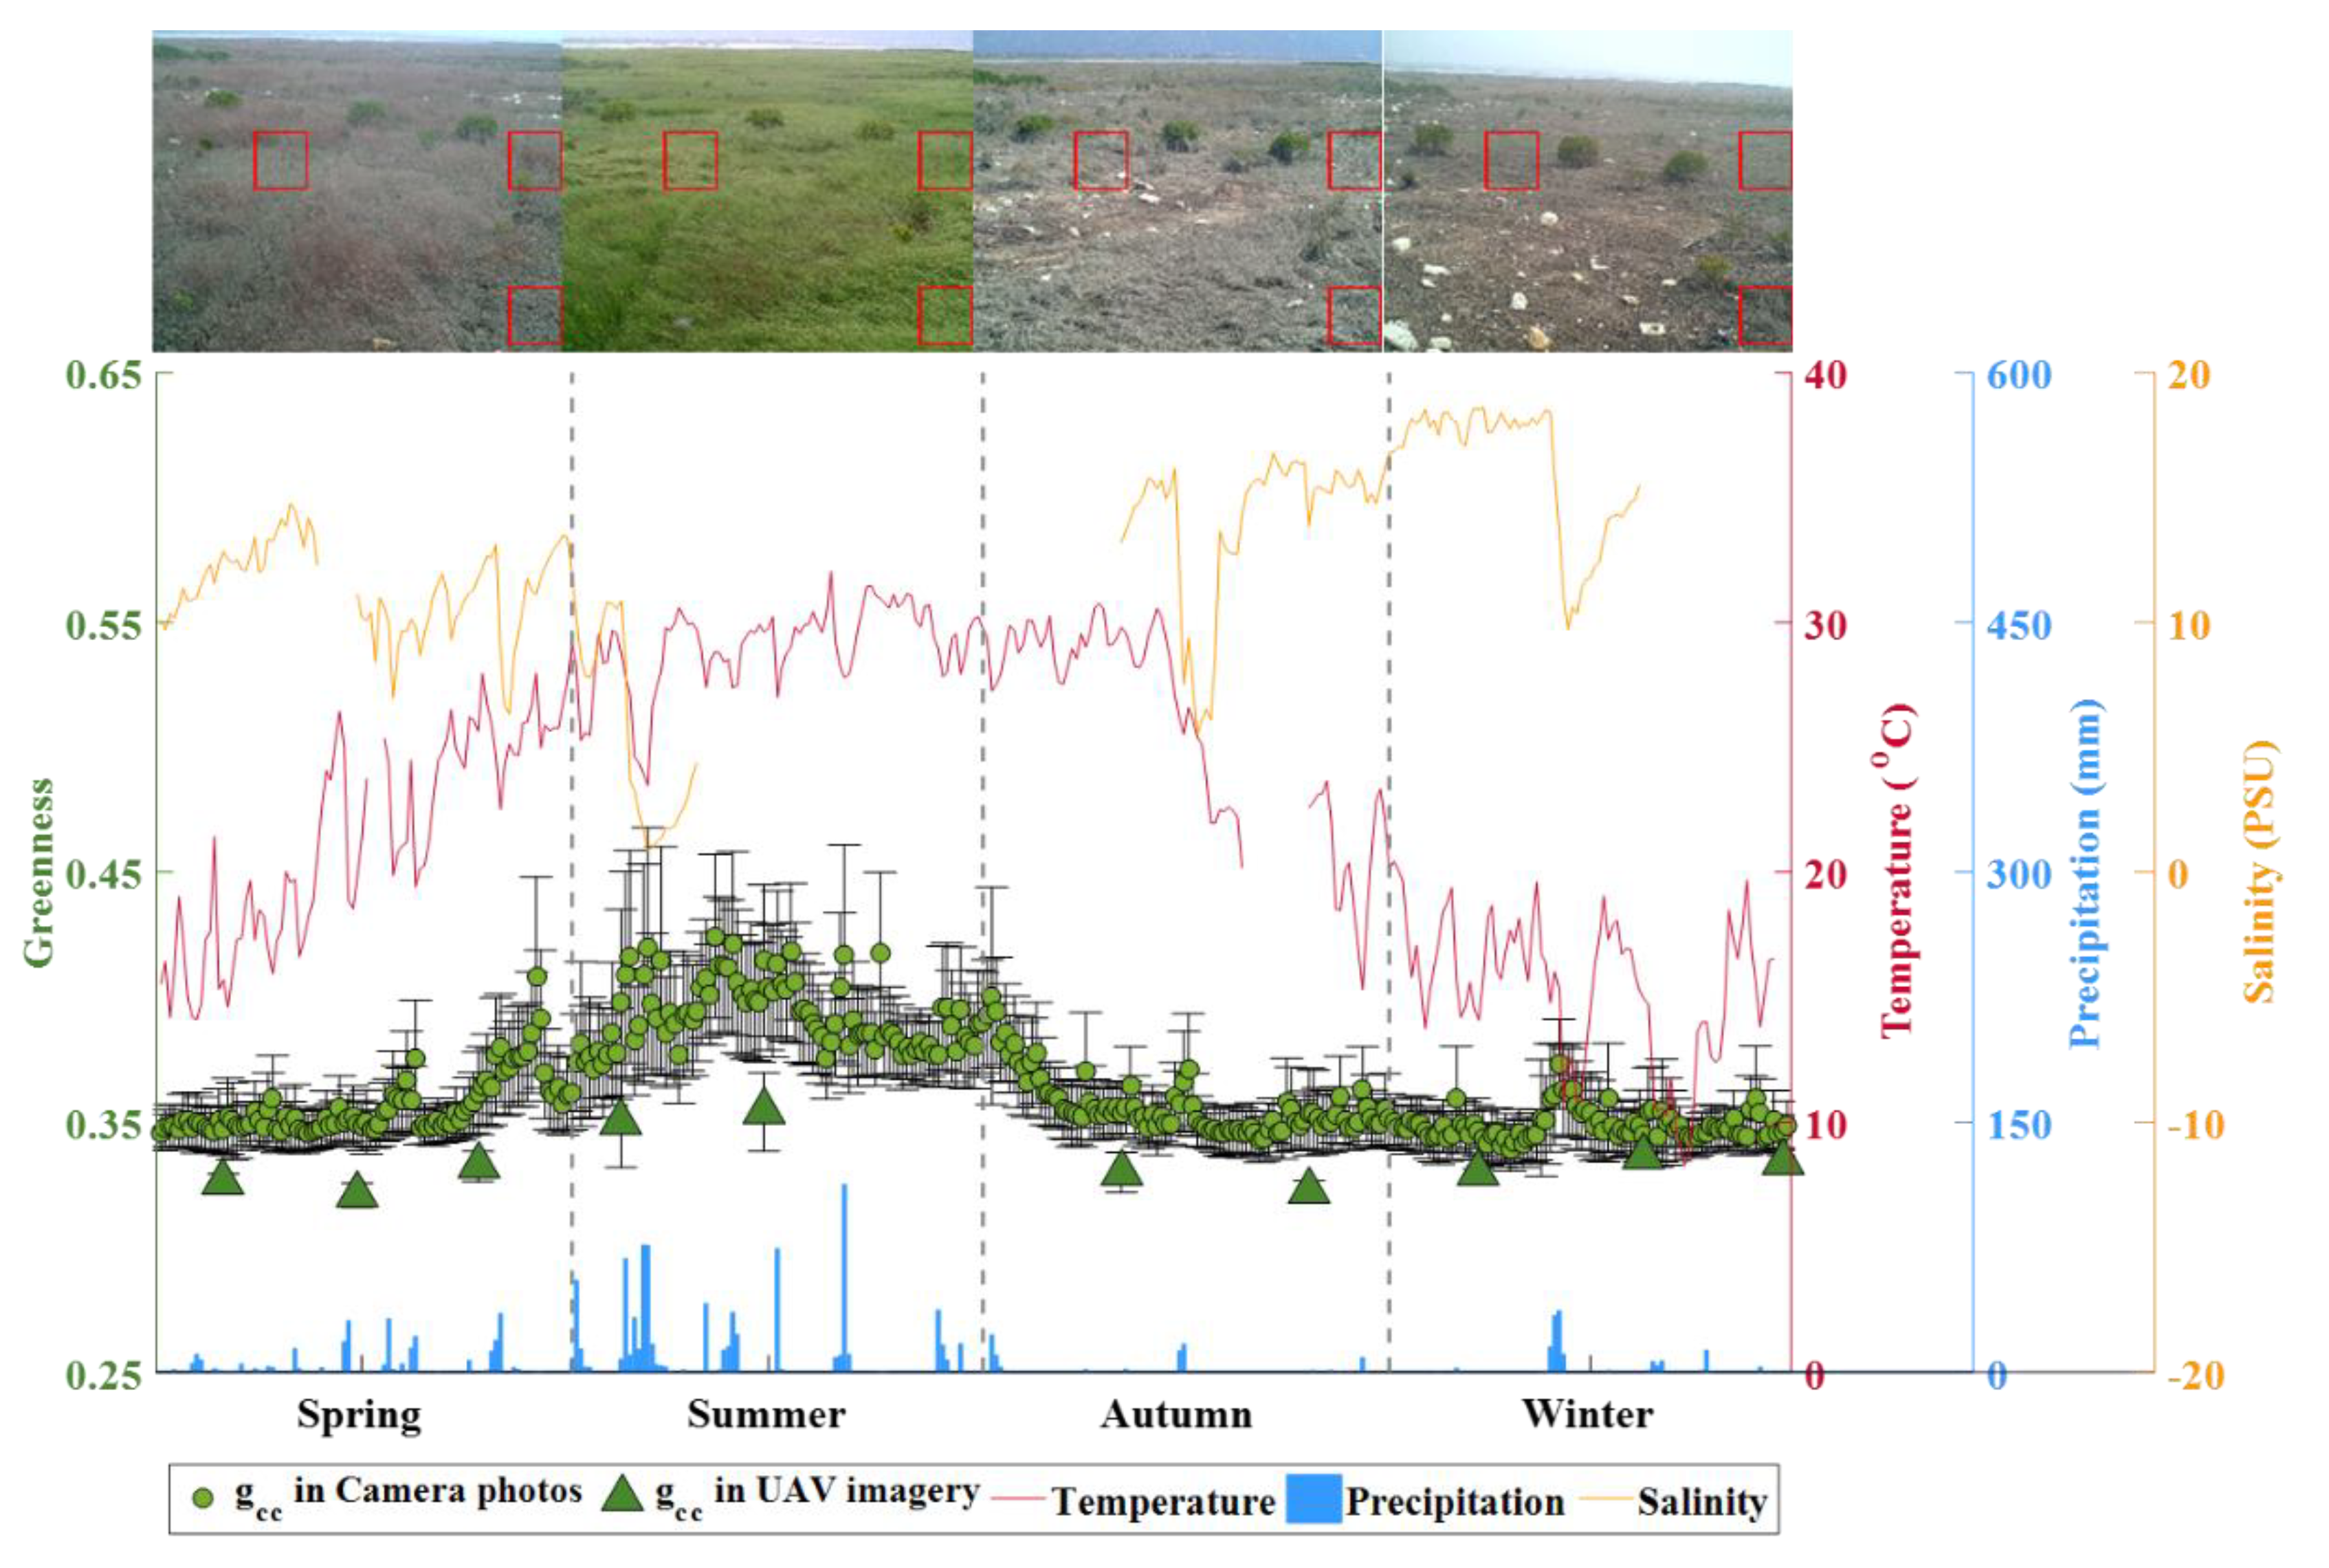
Different from the spatial pattern of patch expansion rate, the changing patch-mean greenness of S. alterniflora did not show any obvious trends with inundation or elevation, despite the magnitude and variation of greenness differed seasonally. The comparison of daily time series between camera-based greenness and environmental factors (Figure 5) indicated that the seasonality of greenness was significantly positively correlated with the seasonal variations in air temperature () and precipitation () (Table 2). Over the one-year period, greenness increased, beginning in late spring (moderate temperature and precipitation), peaking in early/middle summer (optimal temperature and precipitation), and declining in late summer (optimal temperature but inadequate precipitation) throughout winter (low temperature and little precipitation).
4. Discussion
During the past several years, the intensive invasion and rapid expansion of S. alterniflora over the Zhangjiang estuarine wetland threatens mangrove conservation by occupying bare mudflats in front of mangrove fringes and filling the gaps within mangrove forests [38,44,45]. The spatial distribution of S. alterniflora over the wetland conforms to previous generalizations that this species has a wide vertical distribution across the intertidal zone (between MHW and MLW) [19,20,46,47]. The spatial spread of S. alterniflora evolved from high-elevation mudflats in mangrove fringes towards low-elevation mudflats near tidal creeks (Figure S1). In comparison with a recent global analysis of seaward salt marsh extent and MTR [47], the lower limit of S. alterniflora over Zhangjiang (1.5 m below MHW) is within the reported vertical range (0.4~2.0 m below MHW) with the same MTR. It is noted that the upper limit of S. alterniflora over this wetland can reach up to MHW and would likely expand beyond this level in the absences of mangrove, although we only focused on isolated patches (up to 0.6 m, Figure 6) in our temporal change analyses.
Compared to few previous studies on quantitative estimates of lateral expansion rates of existing S. alterniflora patches (0.5~2.5 m/year in patch diameter; [48,49,50], we found that isolated S. alterniflora patches over the Zhangjiang estuary experienced much higher expansion rates over the past several years (4.28 m/year in diameter, averaged for all patches). Annual diameter growth rates of isolated S. alterniflora patches over this wetland were almost linear over the years (data not shown), and thus, the area of these patches trended exponentially, which was consistent with lateral expansions of isolated S. alterniflora patches colonizing unvegetated mudflats in Willapa Bay, Washington [49]. The lateral expansions of S. alterniflora could be affected by a number of factors (e.g., nutrient availability, tidal hydrodynamics, sediment characteristics, etc.). We speculate that high nutrient availability [51,52] could be contributing to the rapid expansion here given that this wetland is adjacent to a populated village with intensive aquaculture activities (mainly shrimp ponds), and most S. alterniflora patches had experienced abundant nutrient inputs from the effluents from shrimp ponds [53,54].
Our results confirm that inundation duration (or relative elevation) plays an important role in governing the expansion rate of isolated S. alterniflora patches. Following the fundamental ecophysiological principle “law of tolerance” [55], intertidal plants tend to show a hump-shaped growth pattern along the inundation/elevation gradients [7,56]. This hump-shaped growth pattern had been confirmed for S. alterniflora in this wetland via a “marsh-organ” experiment with elevation treatments spanning from −0.5 m to 2.0 m (corresponding to 14.4~0 h/day for inundation duration) [21], showing S. alterniflora reaches optimal growing condition at an inundation duration of ~7 h/day (equivalently at an elevation of 0.5 m). In this study, isolated patches over this wetland had the highest elevation only up to 0.6 m; therefore, we did not have an enough elevation range to further confirm this hump-shaped growth pattern at the landscape scale. However, we were able to conduct an overall comparison of the growth over a range between −0.5 m and 0.5 m in the field (this study) and a “marsh-organ” experiment [21]. In fact, the declining spatial pattern between expansion rate and inundation duration in this study (Figure 6) corresponds well to one half of the hump-shaped growing curve showing declining biomass with increasing inundation [21], and the optimal inundation duration for S. alterniflora over this wetland, 4~9 h/day, is comparable to Peng et al. [21] and other previous studies exploring the elevation-growth relationship for tidal marshes (e.g., Adam et al. [52] and Voss et al. [57]). The subsequent steep decline of expansion rate with increasing inundation (>9 h/day) suggests that anaerobic habitats with intensive tidal inundation suppress growth potential of S. alterniflora [52]. Although salinity could be another factor influencing spatial growth pattern of S. alterniflora [58], the role of salinity here was negligible, given that the range of measured sediment pore-water salinity was small (4 PSU) and the inundation time was across the high end of the spectrum.
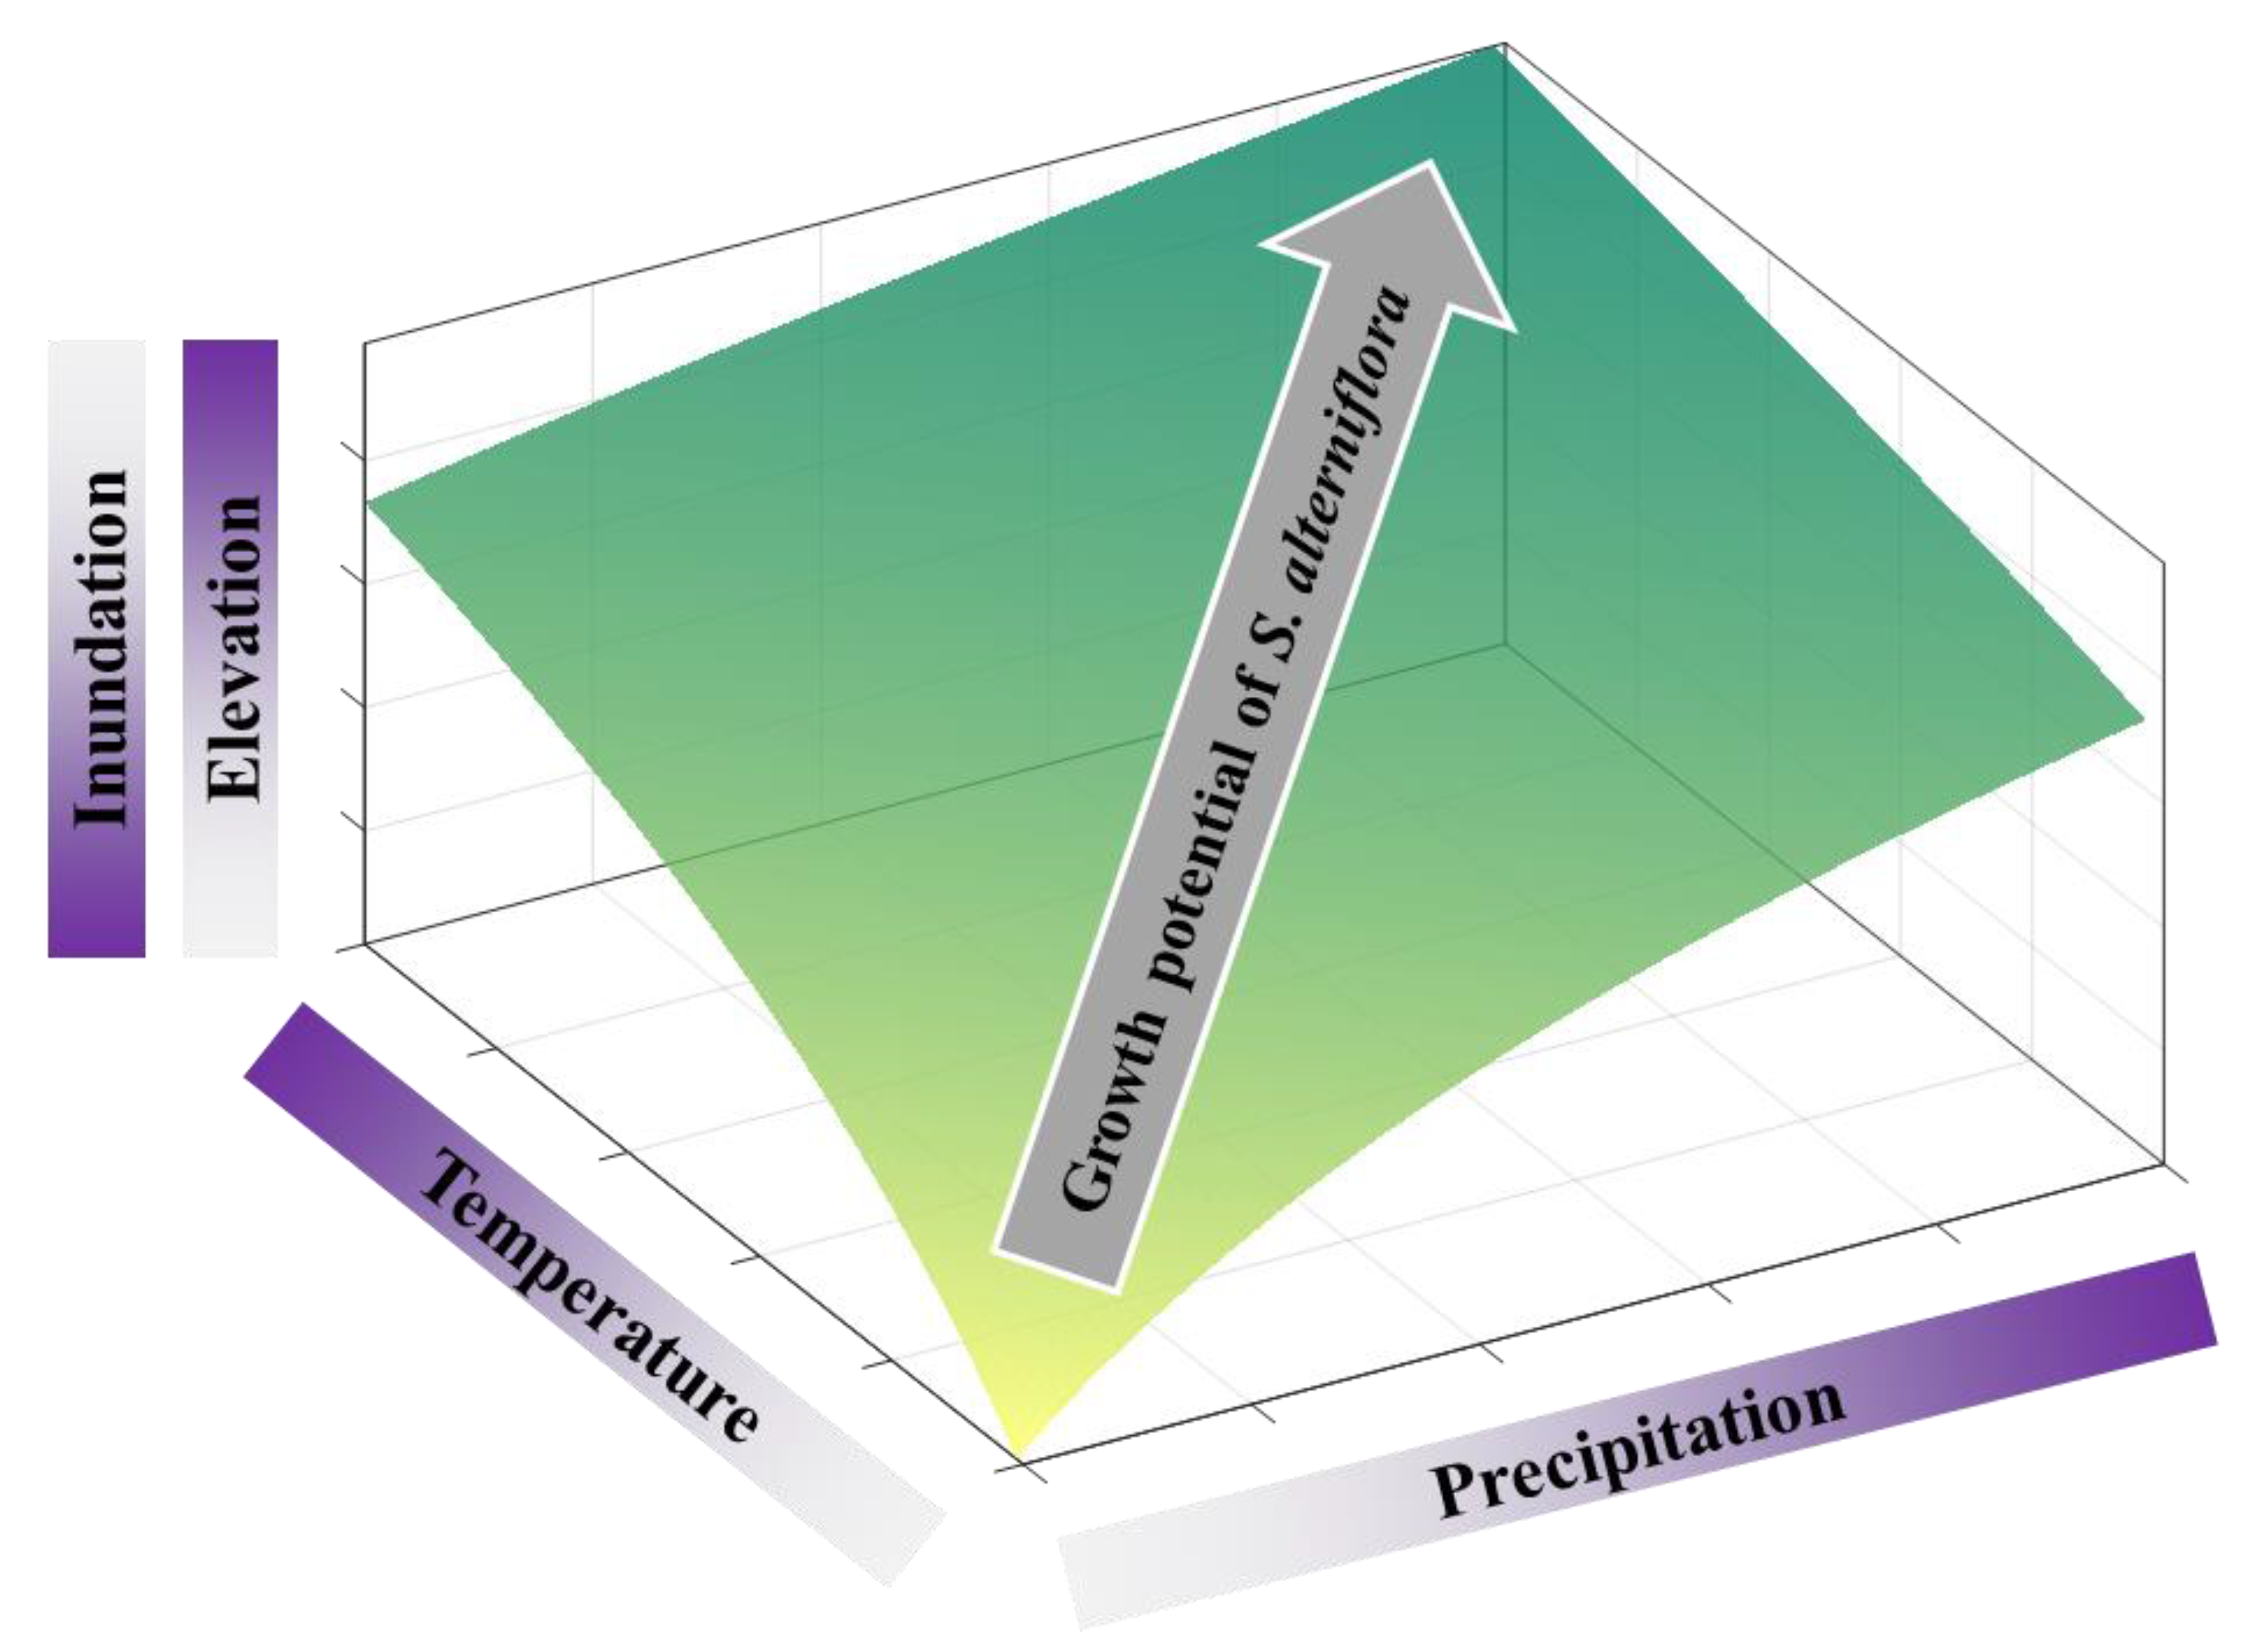
The seasonal growing phenology of isolated S. alterniflora patches in the Zhangjiang estuarine wetland is consistent with previous field [13,21,44] and remote sensing [25,59] studies on seasonal dynamics of coastal salt marshes. S. alterniflora has maximal growth potential during summer months and minimum during winter months, both in terms of lateral expansion rates and greenness. Specifically, our monthly UAV surveys revealed that more than 90% of annual lateral expansions of isolated S. alterniflora patches occurred in summer (52%) and spring (41%) months, and greenness during these months was obviously higher (Figure 3 and Figure 4). Direct comparisons of seasonal variations between daily greenness and in-situ environmental factors confirm that S. alterniflora growth potential peaked in early/middle summer with high temperature and adequate precipitation (more precipitation could reduce salinity-induced suppression on the growth potential), and either lower temperature (late spring) or inadequate precipitation (late summer) led to reduced growth potential (Figure 5). This dual control of temperature and precipitation agrees with previous studies showing significantly positive correlations between the growth of S. alterniflora and temperature [23] and precipitation [13]. Taking spatial and temporal dimensions together, the growth potential of S. alterniflora was co-regulated by tidal and meteorological regimes, in which spatial heterogeneity is controlled by tidal inundation while temporal variation is controlled by both temperature and precipitation (Figure 7).
This study confirms the practicability of applying multi-temporal UAV imagery to characterize the interannual and seasonal dynamics of S. alterniflora invasion at both patch and landscape scales. The integration of UAV imagery, LiDAR-derived surface elevation, and continuous in-situ tidal measurements provides a great opportunity to conduct spatially explicit quantitative analyses and to reveal underlying mechanisms. Compared to traditional field studies usually focusing on a small number of S. alterniflora patches, our investigation method based on regular UAV surveys make it possible to simultaneously explore the temporal dynamics of hundreds of isolated patches across the inundation gradient over the intertidal zone, which is a prerequisite for conducting such landscape-scale quantitative analyses. Compared to previous many satellite remote sensing studies examining total areal change of S. alterniflora-dominated area, we are also able to examine detailed spatio-temporal dynamics for each individual S. alterniflora patch, which is of importance for characterizing underlying ecophysiological mechanisms.
Several uncertainties on data acquisition and processing might bias our analyses. First, although we conducted regular UAV flights using the same field flight and data processing protocols, a variety of factors, such as UAV positioning errors, varying flight weather conditions (cloud and wind regimes), and imperfect ground control point setup (due to inaccessibility of mudflats and mangrove forests), could result in uncertainties in RGB orthophoto of different flight dates [30,31]. Obvious spatial mismatch across different flight dates was found in some isolated S. alterniflora patches. Future improvement of UAV (e.g., emerging RTK built-in UAV) might relieve these issues. Second, manual digitalization of isolated S. alterniflora patches from multi-temporal RGB orthophotos unavoidably lead to some errors since subjective decisions were involved especially when it came to adjoining patches or very small patches. Abnormal contractions or negative expansions were found in calculating monthly patch expansion rates due to inaccurate manual digitalization. The application of object-based image classification approaches [60,61] could help improve the digitization process. Third, only one color index (i.e., green chromatic coordinates) was calculated in current analyses to examine seasonal phenology. Other RGB-based color indices (e.g., green excess index, green red vegetation index [62]) might be also considered to characterize the uncertainty of seasonal phenology. Fourth, RGB-based imagery with three broad-band spectral signals might not have enough information to accurately characterize plant dynamics in particular for seasonal phenology, and future application of numerous narrow-band vegetation indices from multi- or hyper-spectral imagery has the potential to improve the analyses of such plant community dynamics [63,64]. Fifth, patch surface elevations in our analyses were estimated from LiDAR point cloud data referenced with field RTK-GPS surface elevation measurements, but heterogeneous patch microtopography and inadequate patch survey could bias the estimated patch surface elevations. Last, only one-year time series of tidal measurements were used to calculate mean inundation duration of each isolated patch, and thus, the disregard of interannual variation in tidal activities might cause uncertainties in generating spatial data of mean inundation duration and identifying expansion-inundation spatial patterns.
5. Conclusions
Spatially explicit quantitative analyses were conducted in this study to examine temporal and spatial dynamics of S. alterniflora invasion into a subtropical coastal wetland (Zhangjiang estuarine wetland, Fujian, China). Lateral expansion rates and patch-mean greenness of isolated S. alterniflora patches over the intertidal zone were derived from multi-temporal RGB orthophotos to characterize the growth potential of S. alterniflora, which was then correlated with tidal and meteorological regimes to explore the underlying mechanisms regulating spatial heterogeneity and temporal variation of growing S. alterniflora. The main findings are summarized as follows. (1) Isolated S. alterniflora patches over the intertidal zone of Zhangjiang estuarine wetland had experienced high lateral expansion rates over the past several years (4.28 m/year in diameter). (2) Annual patch expansion rate declined with inundation duration with maximum rates occurring at an inundation duration of 4~9 h/day. Thus, expansion rate was probably regulated by inundation-induced hypoxia. (3) Seasonal changing analyses between daily S. alterniflora patch greenness and meteorological variables lead to a dual control of temperature and precipitation on S. alterniflora, and the growth potential of S. alterniflora peaked in early/middle summer with high temperature and adequate precipitation.
To the best of our knowledge, this is the first spatially explicit quantitative study to examine the influences of tidal and meteorological regimes on both spatial heterogeneity (over the intertidal zone) and temporal variation (intra- and inter-annual) of S. alterniflora at both patch and landscape scales. This study highlights the practicability of the application of multi-temporal UAV imagery in systematically and accurately characterizing spatio-temporal dynamics of plant community such as S. alterniflora range expansion reported here. The growth potential of S. alterniflora over the intertidal zone was co-regulated by tidal and meteorological regimes, in which spatial heterogeneity in the growth potential was controlled by tidal inundation and temporal variation was subject to temperature-precipitation dual controls. These findings could serve critical empirical evidence to help answer how coastal salt marshes respond to climate change and assess the vulnerability and resilience of coastal salt marshes to rising sea levels. Our UAV-based methodology could be applied to many types of plant community distributions.
Supplementary Materials
The following are available online at https://www.mdpi.com/2072-4292/11/10/1208/s1, Figure S1: The image digitalization of all identified isolated Spartina alterniflora patches (>0.5 m in diameter) from 2014 to 2017, Figure S2: Typical UAV imagery of isolated Spartina alterniflora patches (14 July 2017) at (a) low, (b) median, and (c) high elevations, Figure S3: Example illustration of cumulative distribution curve of all LiDAR point elevation values within an isolated Spartina alterniflora patch, with a horizontal dashed line indicating the threshold used for calculating mean surface elevation of the patch, Figure S4: RTK-GPS surface elevation survey and sediment sampling of isolated Spartina alterniflora patches over the intertidal wetland in the Zhangjiang estuary, Fujian, China, Figure S5: Inundation duration of each isolated Spartina alterniflora patches over the intertidal wetland in the Zhangjiang estuary, Fujian, China, Table S1: Parameters of unmanned aerial vehicle (UAV) and built-in camera.
Author Contributions
Conceptualization, X.Z., Y.Z., and Q.W.; methodology, X.Z., L.M., and Q.W.; formal analysis, X.Z., L.M., and Q.W.; investigation, L.M. and Y.Z.; writing-original draft preparation, X.Z.; writing-review and editing, Q.W. and J.M.; funding acquisition, X.Z. and Y.Z.
Funding
This study was funded by the National Key R&D Program of China (2016YFC0500204), the National Natural Science Foundation of China (31600368, 31770464), the Natural Science Foundation of Fujian Province, China (2017J01069), the Fundamental Research Funds for the Central Universities of China (20720160109, 20720180118, 20720190104), the Key Laboratory of the Coastal and Wetland Ecosystems (WELRI201601), and the State Key Laboratory of Marine Environmental Science (MELRI1603).
Acknowledgments
We thank P. Lin, K. Chen, Y. Hou and C. Zheng for their help in the fieldwork. We also thank the Zhangjiang Estuary Mangrove National Nature Reserve for its long-term support of our ecological research programs.
Conflicts of Interest
The authors declare no conflict of interest. The funders had no role in the design of the study; in the collection, analyses, or interpretation of data; in the writing of the manuscript, or in the decision to publish the results.
References
- Barbier, E.B.; Hacker, S.D.; Kennedy, C.; Koch, E.W.; Stier, A.C.; Silliman, B.R. The value of estuarine and coastal ecosystem services. Ecol. Monogr. 2011, 81, 169–193. [Google Scholar] [CrossRef]
- Costanza, R.; de Groot, R.; Sutton, P.; van der Ploeg, S.; Anderson, S.J.; Kubiszewski, I.; Farber, S.; Turner, R.K. Changes in the global value of ecosystem services. Glob. Environ. Chang. 2014, 26, 152–158. [Google Scholar] [CrossRef]
- Duarte, C.M.; Losada, I.J.; Hendriks, I.E.; Mazarrasa, I.; Marbà, N. The role of coastal plant communities for climate change mitigation and adaptation. Nat. Clim. Chang. 2013, 3, 961. [Google Scholar] [CrossRef]
- Temmerman, S.; Meire, P.; Bouma, T.J.; Herman, P.M.; Ysebaert, T.; De Vriend, H.J. Ecosystem-based coastal defence in the face of global change. Nature 2013, 504, 79. [Google Scholar] [CrossRef] [PubMed]
- Gao, S.; Du, Y.; Xie, W.; Gao, W.; Wang, D.; Wu, X. Environment-ecosystem dynamic processes of Spartina alterniflora salt-marshes along the eastern China coastlines. Sci. China Earth Sci. 2014, 57, 2567–2586. [Google Scholar] [CrossRef]
- Möller, I.; Kudella, M.; Rupprecht, F.; Spencer, T.; Paul, M.; Van Wesenbeeck, B.K.; Wolters, G.; Jensen, K.; Bouma, T.J.; Miranda-Lange, M. Wave attenuation over coastal salt marshes under storm surge conditions. Nat. Geosci. 2014, 7, 727. [Google Scholar] [CrossRef]
- Morris, J.T.; Sundareshwar, P.; Nietch, C.T.; Kjerfve, B.; Cahoon, D.R. Responses of coastal wetlands to rising sea level. Ecology 2002, 83, 2869–2877. [Google Scholar] [CrossRef]
- Kirwan, M.L.; Megonigal, J.P. Tidal wetland stability in the face of human impacts and sea-level rise. Nature 2013, 504, 53–60. [Google Scholar] [CrossRef]
- Schuerch, M.; Spencer, T.; Temmerman, S.; Kirwan, M.L.; Wolff, C.; Lincke, D.; McOwen, C.J.; Pickering, M.D.; Reef, R.; Vafeidis, A.T.; et al. Future response of global coastal wetlands to sea-level rise. Nature 2018, 561, 231–234. [Google Scholar] [CrossRef]
- Morris, J.T. Competition among marsh macrophytes by means of geomorphological displacement in the intertidal zone. Estuar. Coast. Shelf Sci. 2006, 69, 395–402. [Google Scholar] [CrossRef]
- Kirwan, M.L.; Murray, A.B. A coupled geomorphic and ecological model of tidal marsh evolution. Proc. Natl. Acad. Sci. USA 2007, 104, 6118–6122. [Google Scholar] [CrossRef] [Green Version]
- Mariotti, G.; Fagherazzi, S. A numerical model for the coupled long-term evolution of salt marshes and tidal flats. J. Geophys. Res. Earth Surf. 2010, 115. [Google Scholar] [CrossRef]
- Morris, J.T.; Haskin, B. A 5-yr record of aerial primary production and stand characteristics of Spartina alterniflora. Ecology 1990, 71, 2209–2217. [Google Scholar] [CrossRef]
- Li, R.; Yu, Q.; Wang, Y.; Wang, Z.B.; Gao, S.; Flemming, B. The relationship between inundation duration and Spartina alterniflora growth along the Jiangsu coast, China. Estuar. Coast. Shelf Sci. 2018, 213, 305–313. [Google Scholar] [CrossRef]
- An, S.; Gu, B.; Zhou, C.; Wang, Z.; Deng, Z.; Zhi, Y.; Li, H.; Chen, L.; Yu, D.; Liu, Y. Spartina invasion in China: Implications for invasive species management and future research. Weed Res. 2007, 47, 183–191. [Google Scholar] [CrossRef]
- Nehring, S.; Hesse, K.-J. Invasive alien plants in marine protected areas: The Spartina anglica affair in the European Wadden Sea. Biol. Invasions 2008, 10, 937–950. [Google Scholar] [CrossRef]
- Lu, J.; Zhang, Y. Spatial distribution of an invasive plant Spartina alterniflora and its potential as biofuels in China. Ecol. Eng. 2013, 52, 175–181. [Google Scholar] [CrossRef]
- Strong, D.R.; Ayres, D.R. Ecological and evolutionary misadventures of Spartina. Annu. Rev. Ecol. Evol. Syst. 2013, 44, 389–410. [Google Scholar] [CrossRef]
- Redfield, A.C. Development of a New England Salt Marsh. Ecol. Monogr. 1972, 42, 201–237. [Google Scholar] [CrossRef]
- Mckee, K.L.; Patrick, W.H. The relationship of smooth cordgrass (Spartina alterniflora) to tidal datums: A review. Estuaries 1988, 11, 143–151. [Google Scholar] [CrossRef]
- Peng, D.; Chen, L.; Pennings, S.C.; Zhang, Y. Using a marsh organ to predict future plant communities in a Chinese estuary invaded by an exotic grass and mangrove. Limnol. Oceanogr. 2018, 63, 2595–2605. [Google Scholar] [CrossRef]
- Silvestri, S.; Defina, A.; Marani, M. Tidal regime, salinity and salt marsh plant zonation. Estuar. Coast. Shelf Sci. 2005, 62, 119–130. [Google Scholar] [CrossRef]
- Kirwan, M.L.; Guntenspergen, G.R.; Morris, J.T. Latitudinal trends in Spartina alterniflora productivity and the response of coastal marshes to global change. Glob. Chang. Biol. 2009, 15, 1982–1989. [Google Scholar] [CrossRef]
- Huang, H.M.; Zhang, L.Q. A study of the population dynamics of Spartina alterniflora at Jiuduansha shoals, Shanghai, China. Ecol. Eng. 2007, 29, 164–172. [Google Scholar] [CrossRef]
- Ai, J.; Gao, W.; Gao, Z.; Shi, R.; Zhang, C. Phenology-based Spartina alterniflora mapping in coastal wetland of the Yangtze Estuary using time series of GaoFen satellite no. 1 wide field of view imagery. J. Appl. Remote Sens. 2017, 11. [Google Scholar] [CrossRef]
- Liu, M.; Mao, D.; Wang, Z.; Li, L.; Man, W.; Jia, M.; Ren, C.; Zhang, Y. Rapid Invasion of Spartina alterniflora in the Coastal Zone of Mainland China: New Observations from Landsat OLI Images. Remote Sens. 2018, 10, 1933. [Google Scholar] [CrossRef]
- Berni, J.A.J. Thermal and Narrowband Multispectral Remote Sensing for Vegetation Monitoring From an Unmanned Aerial Vehicle. IEEE Trans. Geosci. Remote Sens. 2009, 27, 722–738. [Google Scholar] [CrossRef]
- Watts, A.C.; Ambrosia, V.G.; Hinkley, E.A. Unmanned Aircraft Systems in Remote Sensing and Scientific Research: Classification and Considerations of Use. Remote Sens. 2012, 4, 1671–1692. [Google Scholar] [CrossRef] [Green Version]
- Anderson, K.; Gaston, K.J. Lightweight unmanned aerial vehicles will revolutionize spatial ecology. Front. Ecol. Environ. 2013, 11, 138–146. [Google Scholar] [CrossRef] [Green Version]
- Gonçalves, J.; Henriques, R. UAV photogrammetry for topographic monitoring of coastal areas. ISPRS J. Photogramm. Remote Sens. 2015, 104, 101–111. [Google Scholar] [CrossRef]
- Van Iersel, W.; Straatsma, M.; Addink, E.; Middelkoop, H. Monitoring height and greenness of non-woody floodplain vegetation with UAV time series. ISPRS J. Photogramm. Remote Sens. 2018, 141, 112–123. [Google Scholar] [CrossRef]
- Morris, J.T.; Porter, D.; Neet, M.; Noble, P.A.; Schmidt, L.; Lapine, L.A.; Jensen, J.R. Integrating LIDAR elevation data, multi-spectral imagery and neural network modelling for marsh characterization. Int. J. Remote Sens. 2005, 26, 5221–5234. [Google Scholar] [CrossRef]
- Wannasiri, W.; Nagai, M.; Honda, K.; Santitamnont, P.; Miphokasap, P. Extraction of Mangrove Biophysical Parameters Using Airborne LiDAR. Remote Sens. 2013, 5, 1787–1808. [Google Scholar] [CrossRef] [Green Version]
- Lagomasino, D.; Fatoyinbo, T.; Lee, S.; Feliciano, E.; Trettin, C.; Simard, M. A Comparison of Mangrove Canopy Height Using Multiple Independent Measurements from Land, Air, and Space. Remote Sens. 2016, 8, 327. [Google Scholar] [CrossRef]
- Fatoyinbo, T.L.; Feliciano, E.A.; Lagomasino, D.; Lee, S.K.; Trettin, C. Estimating mangrove aboveground biomass from airborne LiDAR data: A case study from the Zambezi River delta. Environ. Res. Lett. 2018, 13, 025012. [Google Scholar] [CrossRef]
- Zhu, X.; Hou, Y.; Weng, Q.; Chen, L. Integrating UAV optical imagery and LiDAR data for assessing the spatial relationship between mangrove and inundation across a subtropical estuarine wetland. ISPRS J. Photogramm. Remote Sens. 2019, 149, 146–156. [Google Scholar] [CrossRef]
- Tseng, K.-H.; Kuo, C.-Y.; Lin, T.-H.; Huang, Z.-C.; Lin, Y.-C.; Liao, W.-H.; Chen, C.-F. Reconstruction of time-varying tidal flat topography using optical remote sensing imageries. ISPRS J. Photogramm. Remote Sens. 2017, 131, 92–103. [Google Scholar] [CrossRef]
- Liu, M.; Li, H.; Li, L.; Man, W.; Jia, M.; Wang, Z.; Lu, C. Monitoring the Invasion of Spartina alterniflora Using Multi-source High-resolution Imagery in the Zhangjiang Estuary, China. Remote Sens. 2017, 9, 539. [Google Scholar] [CrossRef]
- Lin, P. The Comprehensive Report of Science Investigation on the Natural Reserve of Mangrove Wetland of Zhangjiang Estuary in Fujian; Xiamen University Press: Xiamen, China, 2001. [Google Scholar]
- Sonnentag, O.; Hufkens, K.; Teshera-Sterne, C.; Young, A.M.; Friedl, M.; Braswell, B.H.; Milliman, T.; O’Keefe, J.; Richardson, A.D. Digital repeat photography for phenological research in forest ecosystems. Agric. For. Meteorol. 2012, 152, 159–177. [Google Scholar] [CrossRef]
- Klosterman, S.; Richardson, A.D. Observing Spring and Fall Phenology in a Deciduous Forest with Aerial Drone Imagery. Sensors 2017, 17, 2852. [Google Scholar] [CrossRef]
- Meng, X.; Currit, N.; Zhao, K. Ground Filtering Algorithms for Airborne LiDAR Data: A Review of Critical Issues. Remote Sens. 2010, 2, 833–860. [Google Scholar] [CrossRef] [Green Version]
- Hladik, C.; Alber, M. Accuracy assessment and correction of a LIDAR-derived salt marsh digital elevation model. Remote Sens. Environ. 2012, 121, 224–235. [Google Scholar] [CrossRef]
- Zhang, Y.; Huang, G.; Wang, W.; Chen, L.; Lin, G. Interactions between mangroves and exotic Spartina in an anthropogenically disturbed estuary in southern China. Ecology 2012, 93, 588–597. [Google Scholar] [CrossRef]
- Li, Z.; Wang, W.; Zhang, Y. Recruitment and herbivory affect spread of invasive Spartina alterniflora in China. Ecology 2014, 95, 1972–1980. [Google Scholar] [CrossRef]
- Daehler, C.C.; Strong, D.R.; Carey, J.R.; Moyle, P.; Rejmánek, M.; Vermeij, G.J. Status, prediction and prevention of introduced cordgrass Spartina spp. invasions in Pacific estuaries, USA. Biol. Conserv. 1996, 78, 51–58. [Google Scholar] [CrossRef]
- Balke, T.; Stock, M.; Kai, J.; Bouma, T.J.; Kleyer, M. A global analysis of the seaward salt marsh extent: The importance of tidal range. Water Resour Res 2016, 52, 3775–3786. [Google Scholar] [CrossRef] [Green Version]
- Metcalfe, W.S.; Ellison, A.M.; Bertness, M.D. Survivorship and Spatial Development of Spartina alterniflora Loisel. (Gramineae) Seedlings in a New England Salt Marsh. Ann. Bot. 1986, 58, 249–258. [Google Scholar] [CrossRef]
- Feist, B.E.; Simenstad, C.A. Expansion rates and recruitment frequency of exotic smooth cordgrass, Spartina alterniflora (Loisel), colonizing unvegetated littoral flats in Willapa Bay, Washington. Estuaries 2000, 23, 267–274. [Google Scholar] [CrossRef]
- Rosso, P.H.; Ustin, S.L.; Hastings, A. Use of lidar to study changes associated with Spartina invasion in San Francisco Bay marshes. Remote Sens. Environ. 2006, 100, 295–306. [Google Scholar] [CrossRef]
- Langley, J.A.; Megonigal, J.P. Ecosystem response to elevated CO2 levels limited by nitrogen-induced plant species shift. Nature 2010, 466, 96. [Google Scholar] [CrossRef]
- Adam, L.J.; Mozdzer, T.J.; Shepard, K.A.; Hagerty, S.B.; Patrick, M.J. Tidal marsh plant responses to elevated CO2, nitrogen fertilization, and sea level rise. Glob. Chang. Biol. 2013, 19, 1495–1503. [Google Scholar] [CrossRef]
- Wang, M.; Zhang, J.; Tu, Z.; Gao, X.; Wang, W. Maintenance of estuarine water quality by mangroves occurs during flood periods: A case study of a subtropical mangrove wetland. Mar. Pollut. Bull. 2010, 60, 2154–2160. [Google Scholar] [CrossRef]
- Wu, H.; Peng, R.; Yang, Y.; He, L.; Wang, W.; Zheng, T.; Lin, G. Mariculture pond influence on mangrove areas in south China: Significantly larger nitrogen and phosphorus loadings from sediment wash-out than from tidal water exchange. Aquaculture 2014, 426, 204–212. [Google Scholar] [CrossRef]
- Shelford, V.E. Some Concepts of Bioecology. Ecology 1931, 12, 455–467. [Google Scholar] [CrossRef]
- Krauss, K.W.; Lovelock, C.E.; Mckee, K.L.; López-Hoffman, L.; Ewe, S.M.L.; Sousa, W.P. Environmental drivers in mangrove establishment and early development: A review. Aquat. Bot. 2008, 89, 105–127. [Google Scholar] [CrossRef]
- Voss, C.M.; Christian, R.R.; Morris, J.T. Marsh macrophyte responses to inundation anticipate impacts of sea-level rise and indicate ongoing drowning of North Carolina marshes. Mar. Biol. 2013, 160, 181–194. [Google Scholar] [CrossRef]
- Vasquez, E.A.; Glenn, E.P.; Guntenspergen, G.R.; Brown, J.J.; Nelson, S.G. Salt tolerance and osmotic adjustment of Spartina alterniflora (Poaceae) and the invasive M haplotype of Phragmites australis (Poaceae) along a salinity gradient. Am. J. Bot. 2006, 93, 1784–1790. [Google Scholar] [CrossRef]
- Mo, Y.; Momen, B.; Kearney, M.S. Quantifying moderate resolution remote sensing phenology of Louisiana coastal marshes. Ecol. Model. 2015, 312, 191–199. [Google Scholar] [CrossRef]
- Peña-Barragán, J.M.; Ngugi, M.K.; Plant, R.E.; Six, J. Object-based crop identification using multiple vegetation indices, textural features and crop phenology. Remote Sens. Environ. 2011, 115, 1301–1316. [Google Scholar] [CrossRef]
- Cao, J.; Leng, W.; Liu, K.; Liu, L.; He, Z.; Zhu, Y. Object-Based Mangrove Species Classification Using Unmanned Aerial Vehicle Hyperspectral Images and Digital Surface Models. Remote Sens. 2018, 10, 89. [Google Scholar] [CrossRef]
- Mizunuma, T.; Koyanagi, T.; Mencuccini, M.; Nasahara, K.N.; Wingate, L.; Grace, J. The comparison of several colour indices for the photographic recording of canopy phenology of Fagus crenata Blume in eastern Japan. Plant Ecol. Divers. 2011, 4, 67–77. [Google Scholar] [CrossRef]
- Kulawardhana, R.W.; Popescu, S.C.; Feagin, R.A. Fusion of lidar and multispectral data to quantify salt marsh carbon stocks. Remote Sens. Environ. 2014, 154, 345–357. [Google Scholar] [CrossRef]
- Zhang, T.-T.; Zeng, S.-L.; Gao, Y.; Ouyang, Z.-T.; Li, B.; Fang, C.-M.; Zhao, B. Using hyperspectral vegetation indices as a proxy to monitor soil salinity. Ecol. Indic. 2011, 11, 1552–1562. [Google Scholar] [CrossRef]
Figure 1.
The overview map (a) of the intertidal wetland in Zhangjiang estuary, Fujian, China, from RGB orthophoto (April 14th, 2017) and typical wetland landscapes of mangrove forests (b), mangrove-Spartina alterniflora ecotone (c), and isolated S. alterniflora patches (d). The locations of ground camera and flux tower are also shown.

Figure 2.
Spatial distribution of mean annual expansion rates of isolated Spartina alterniflora patches, with histogram shown in inset, over the intertidal wetland in the Zhangjiang estuary, Fujian, China. Expansion rate was calculated as change in patch diameter for those isolated patches with at least three consecutive years (N = 452).

Figure 3.
Seasonal dynamics of diameter expansion rate (a) and greenness (b) of isolated Spartina alterniflora patches over one-year period from March 2017 to February 2018. The statistical metrics including median (central mark of the box) and upper/lower quartiles (edges of the box) were calculated from all isolated patches within the year (N = 252) over the intertidal wetland in the Zhangjiang estuary, Fujian, China.

Figure 4.
Spatial distributions of patch-mean greenness of isolated Spartina alterniflora patches (N = 252) with corresponding histograms shown in insets for four seasons: (a) spring (March~May, 2017), (b) summer (June~July, 2017), (c) autumn (October~November, 2017), and (d) winter (December 2017~February 2018).

Figure 5.
Temporal variation in daily camera-based greenness of Spartina alterniflora and in-situ environmental variables (air temperature, precipitation, and salinity) from March 2017 to February 2018. A ground camera installed at a fixed position (see Figure 1) was used to record daily images of a particular region of contiguous Spartina alterniflora with typical images shown for each season, and camera-based greenness of Spartina alterniflora was calculated from image subsets indicated by red boxes. Monthly greenness from UAV imagery is also shown for comparison. Salinity was not recorded from mid-summer to early autumn due to instrument failure.

Figure 6.
The changing pattern of patch diameter expansion rate of Spartina alterniflora (N = 452) versus inundation time and elevation across the vegetated intertidal zone, Zhangjiang estuary, Fujian, China. The number of isolated patches at each inundation time is shown in parentheses. The vertical dashed line denotes local mean sea level corresponding to a relative elevation of zero.

Figure 7.
Schematic diagram of the influences of tidal and meteorological regimes on the growth potential of Spartina alterniflora over the intertidal wetland in the Zhangjiang estuary, Fujian, China. Darker colors denote higher magnitude of different factors as shown in axes of the three-dimensional (3-D) plot. The growth potential of S. alterniflora is co-regulated by tidal (z-axis) and meteorological (x- and y-axis) regimes, in which spatial heterogeneity is controlled by inundation or elevation, while temporal variation is subject to temperature-precipitation dual controls. Note that the range of elevation here is limited to vegetated intertidal zone with S. alterniflora (lower than the optimal elevation of the parabolic expansion-elevation relationship).


Table 1.
Change in number and mean expansion rate of isolated Spartina alterniflora patches from 2014 to 2017 for patches with diameter > 0.5 m. The values between second and fifth columns denote the number of patches remained isolated from a year (2014−2016) to another year (2015−2017). The number of isolated patches decreased as adjacent patches coalesced.
| Number of Isolated Patches Starting From | Expansion Rate (Diameter Growth) of Isolated Patches (Mean ± SD; m/year) | |||
|---|---|---|---|---|
| 2014 | 2015 | 2016 | ||
| Remaining by 2015 | 902 | / | / | 4.8 ± 1.6 (N = 902) |
| Remaining by 2016 | 412 | 80 | / | 4.5 ± 1.3 (N = 492) |
| Remaining by 2017 | 196 | 41 | 88 | 3.8 ± 1.2 (N = 325) |
Table 2.
Pearson correlations among weekly-smoothed time series (seven-day moving average) of camera-based greenness of Spartina alterniflora and in-situ environmental factors (air temperature, precipitation, and tidal surface water salinity) from March 2017 to February 2018 (see Figure 5 for original daily time series). All correlation coefficients are statistically significant with p < 0.001.
| Greenness | Air Temperature | Precipitation | |
|---|---|---|---|
| Air temperature | 0.76 | ||
| Precipitation | 0.68 | 0.41 | |
| Surface water salinity | −0.34 | −0.38 | −0.23 |
© 2019 by the authors. Licensee MDPI, Basel, Switzerland. This article is an open access article distributed under the terms and conditions of the Creative Commons Attribution (CC BY) license (http://creativecommons.org/licenses/by/4.0/).
Share and Cite
MDPI and ACS Style
Zhu, X.; Meng, L.; Zhang, Y.; Weng, Q.; Morris, J. Tidal and Meteorological Influences on the Growth of Invasive Spartina alterniflora: Evidence from UAV Remote Sensing. Remote Sens. 2019, 11, 1208. https://doi.org/10.3390/rs11101208
AMA Style
Zhu X, Meng L, Zhang Y, Weng Q, Morris J. Tidal and Meteorological Influences on the Growth of Invasive Spartina alterniflora: Evidence from UAV Remote Sensing. Remote Sensing. 2019; 11(10):1208. https://doi.org/10.3390/rs11101208
Chicago/Turabian StyleZhu, Xudong, Lingxuan Meng, Yihui Zhang, Qihao Weng, and James Morris. 2019. "Tidal and Meteorological Influences on the Growth of Invasive Spartina alterniflora: Evidence from UAV Remote Sensing" Remote Sensing 11, no. 10: 1208. https://doi.org/10.3390/rs11101208
Note that from the first issue of 2016, this journal uses article numbers instead of page numbers. See further details here.