Global Satellite Retrievals of the Near-Surface Atmospheric Vapor Pressure Deficit from AMSR-E and AMSR2

 , ,
, ,
Abstract
:1. Introduction
2. Datasets
2.1. AMSR LPDR
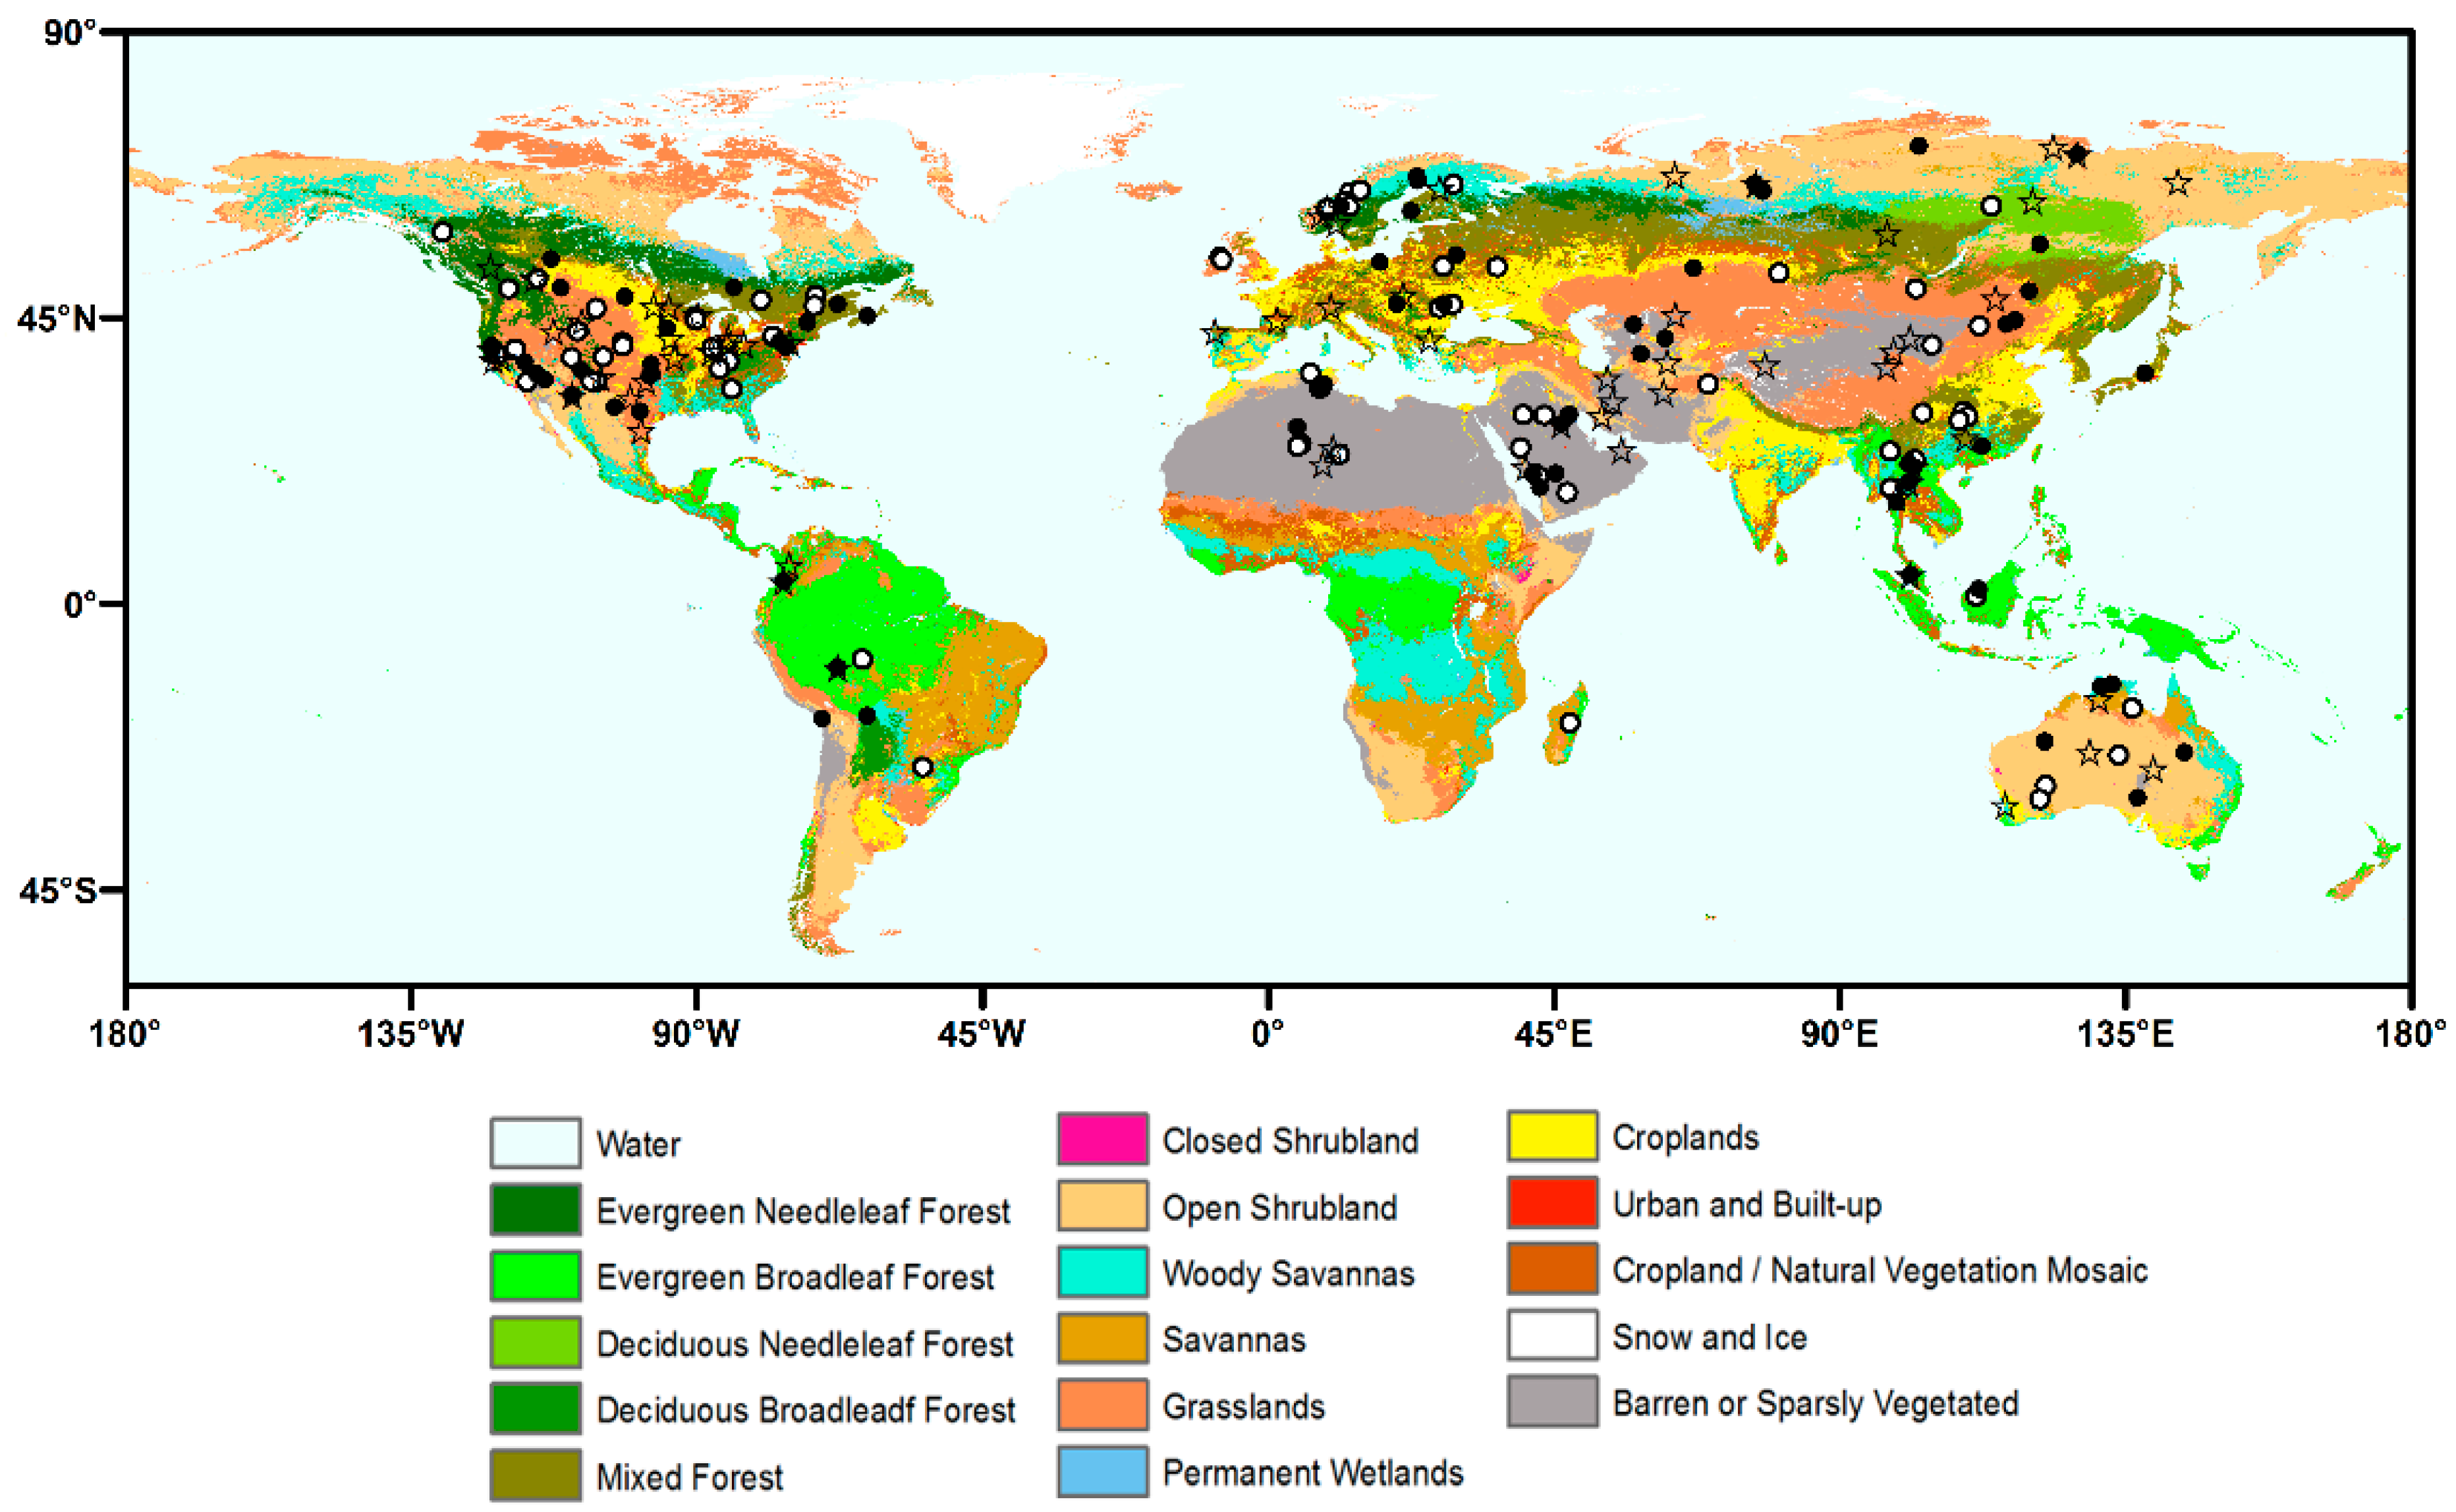
2.2. ISH Record
2.3. MERRA-2 Reanalysis
3. Methods
3.1. Theoretical Basis
3.2. AMSR VPD Calculation
4. Results
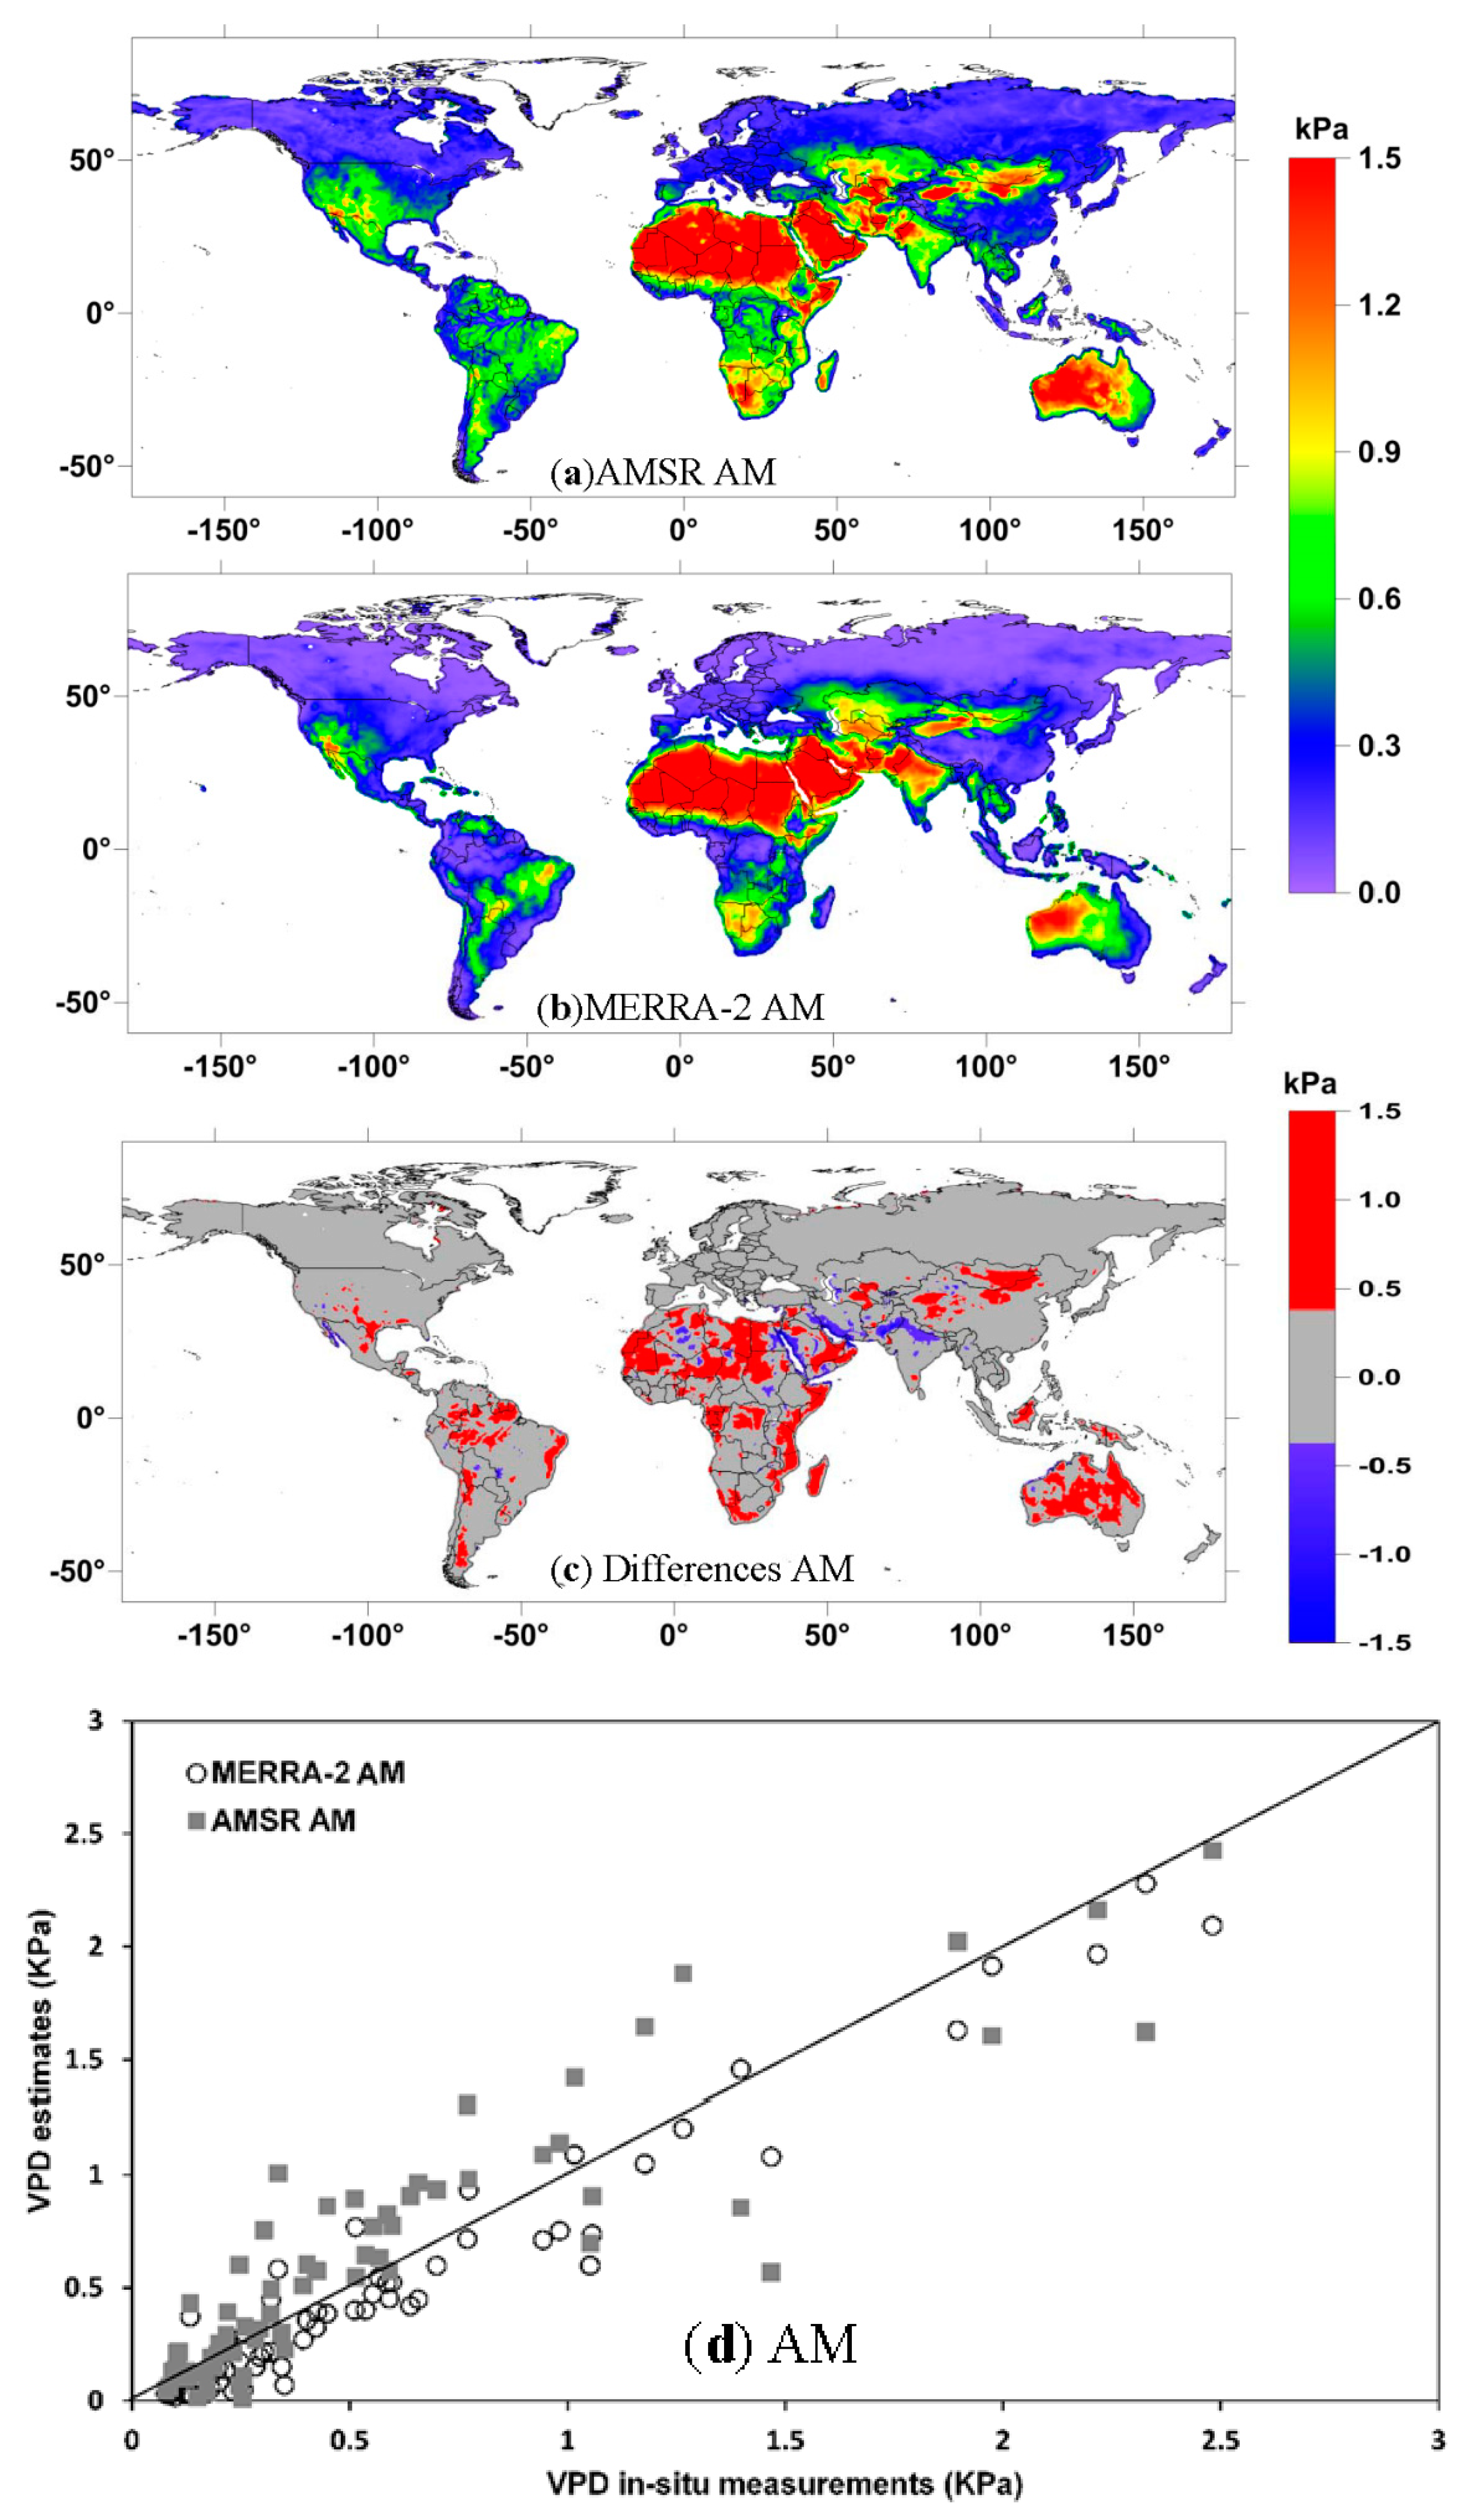
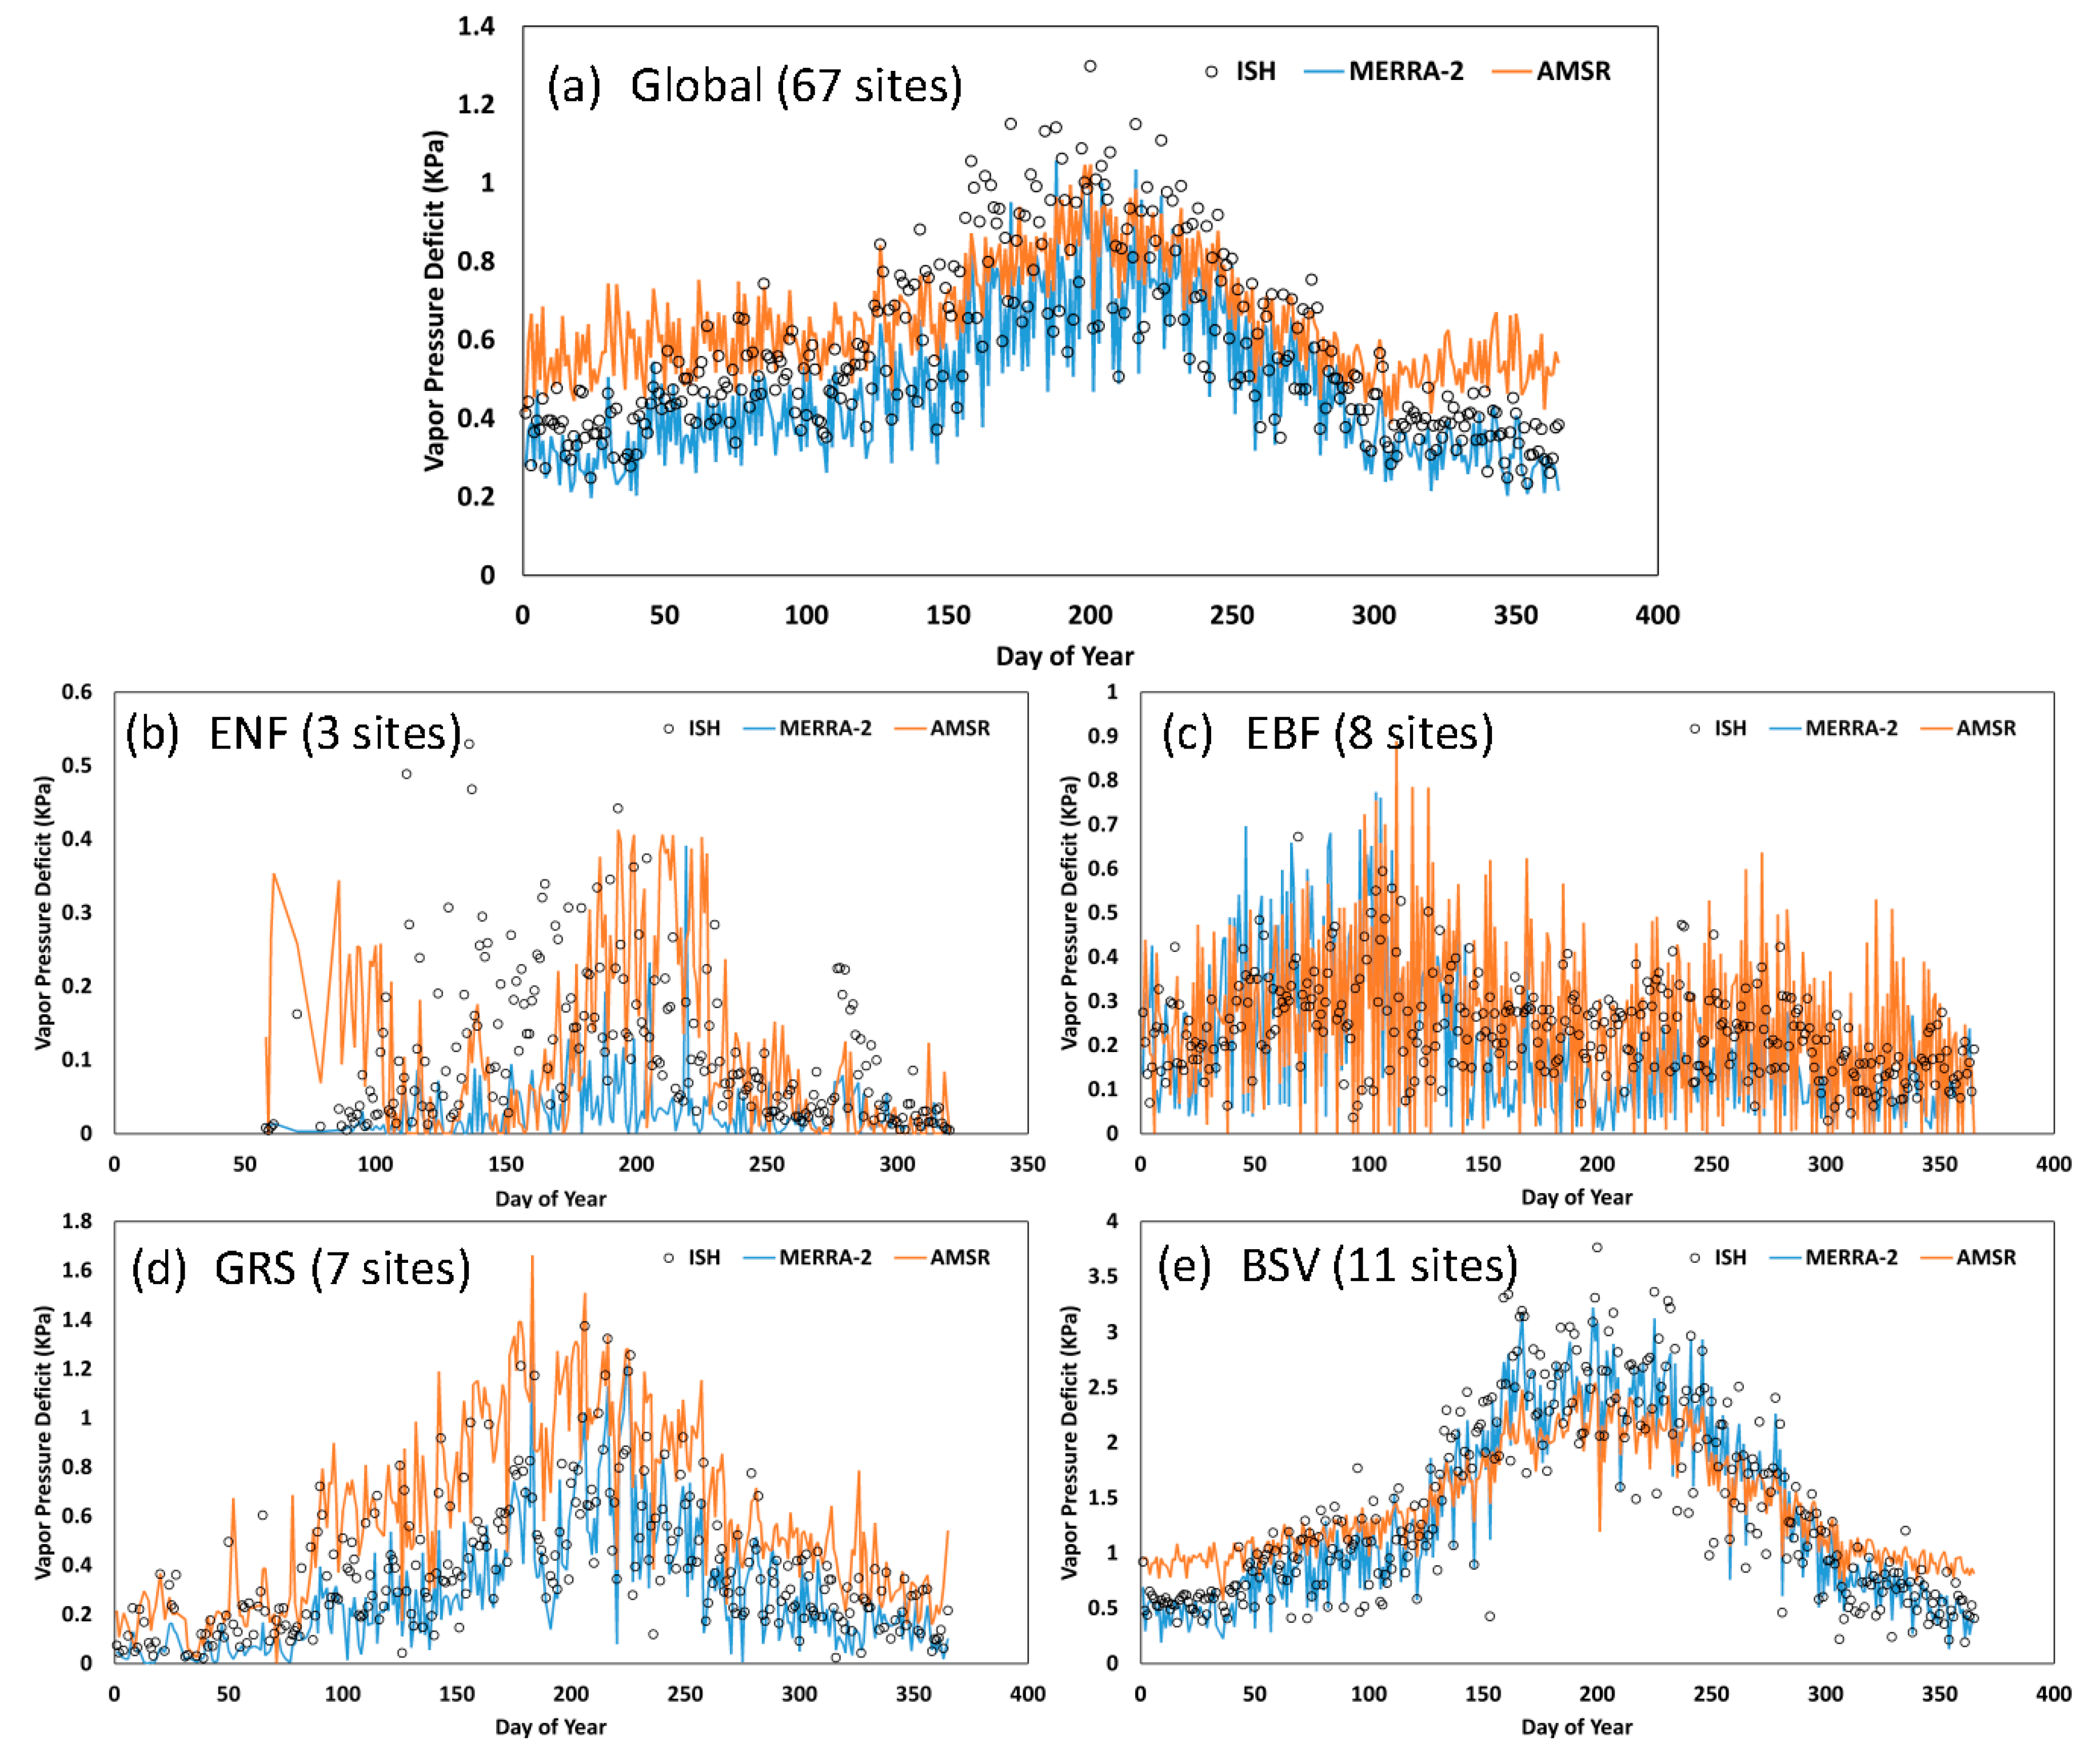
4.1. AMSR Global VPD Mapping
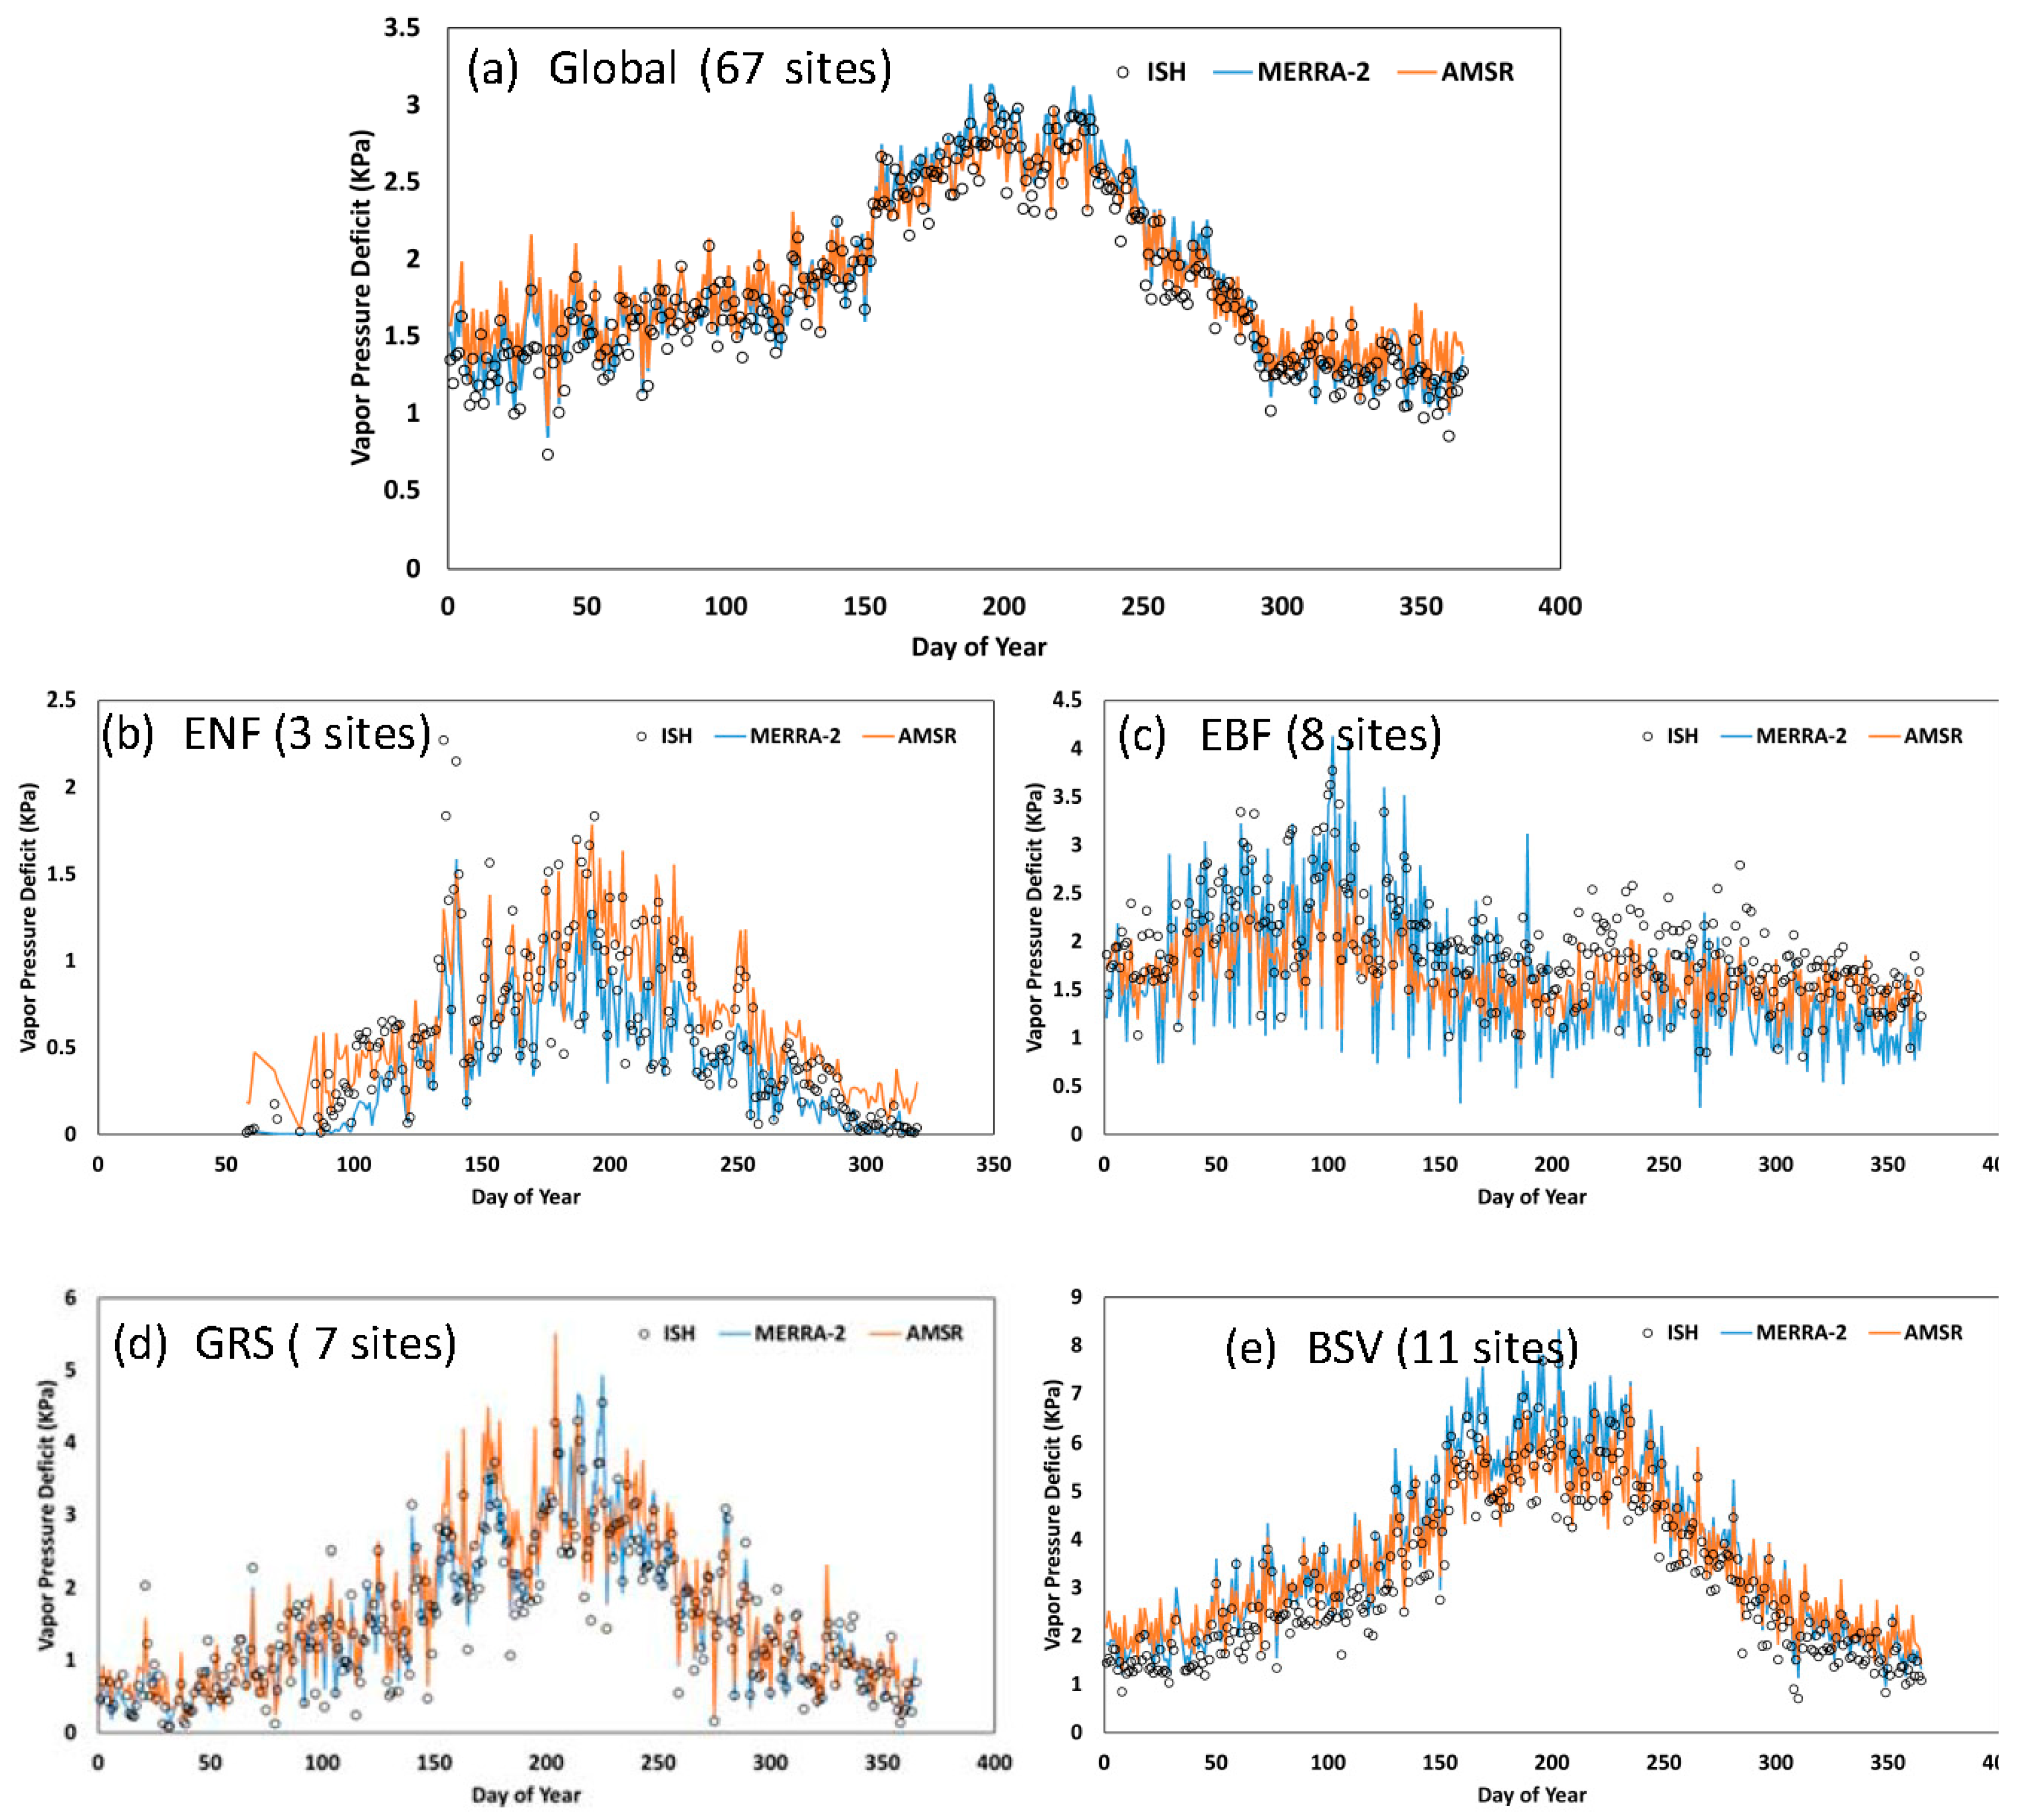
4.2. Quantitative Comparisons between AMSR and ISH VPD
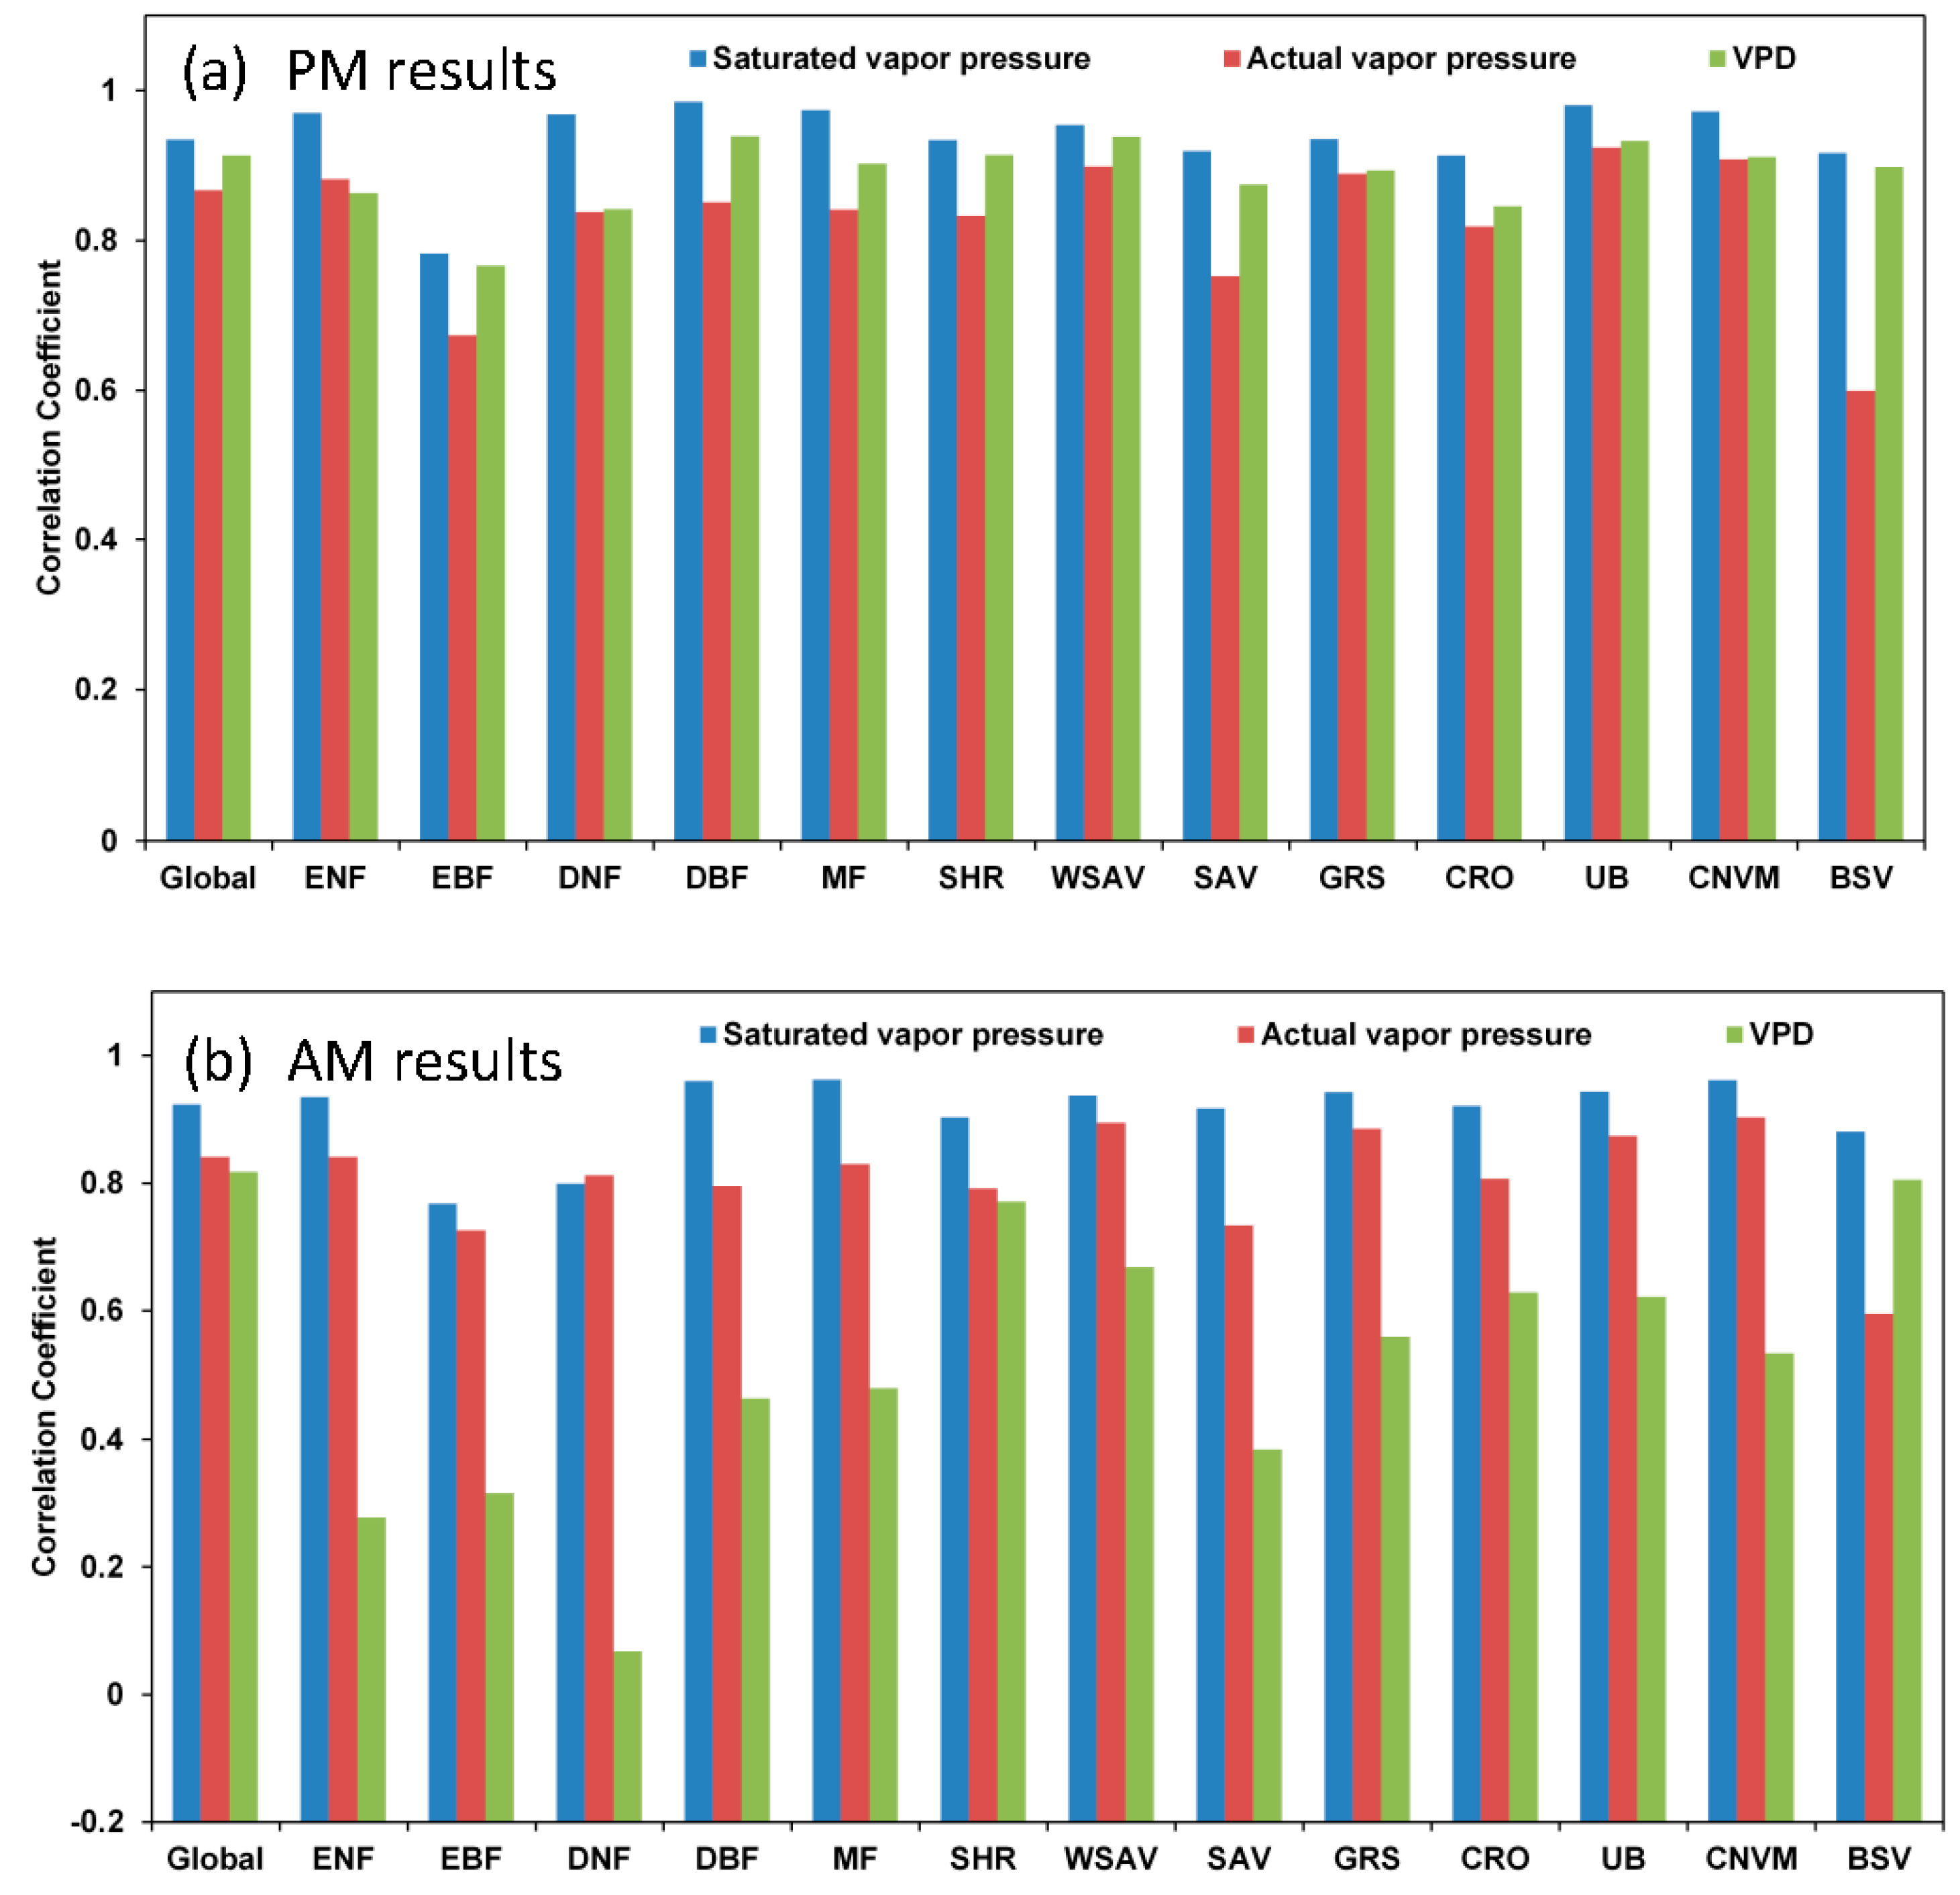
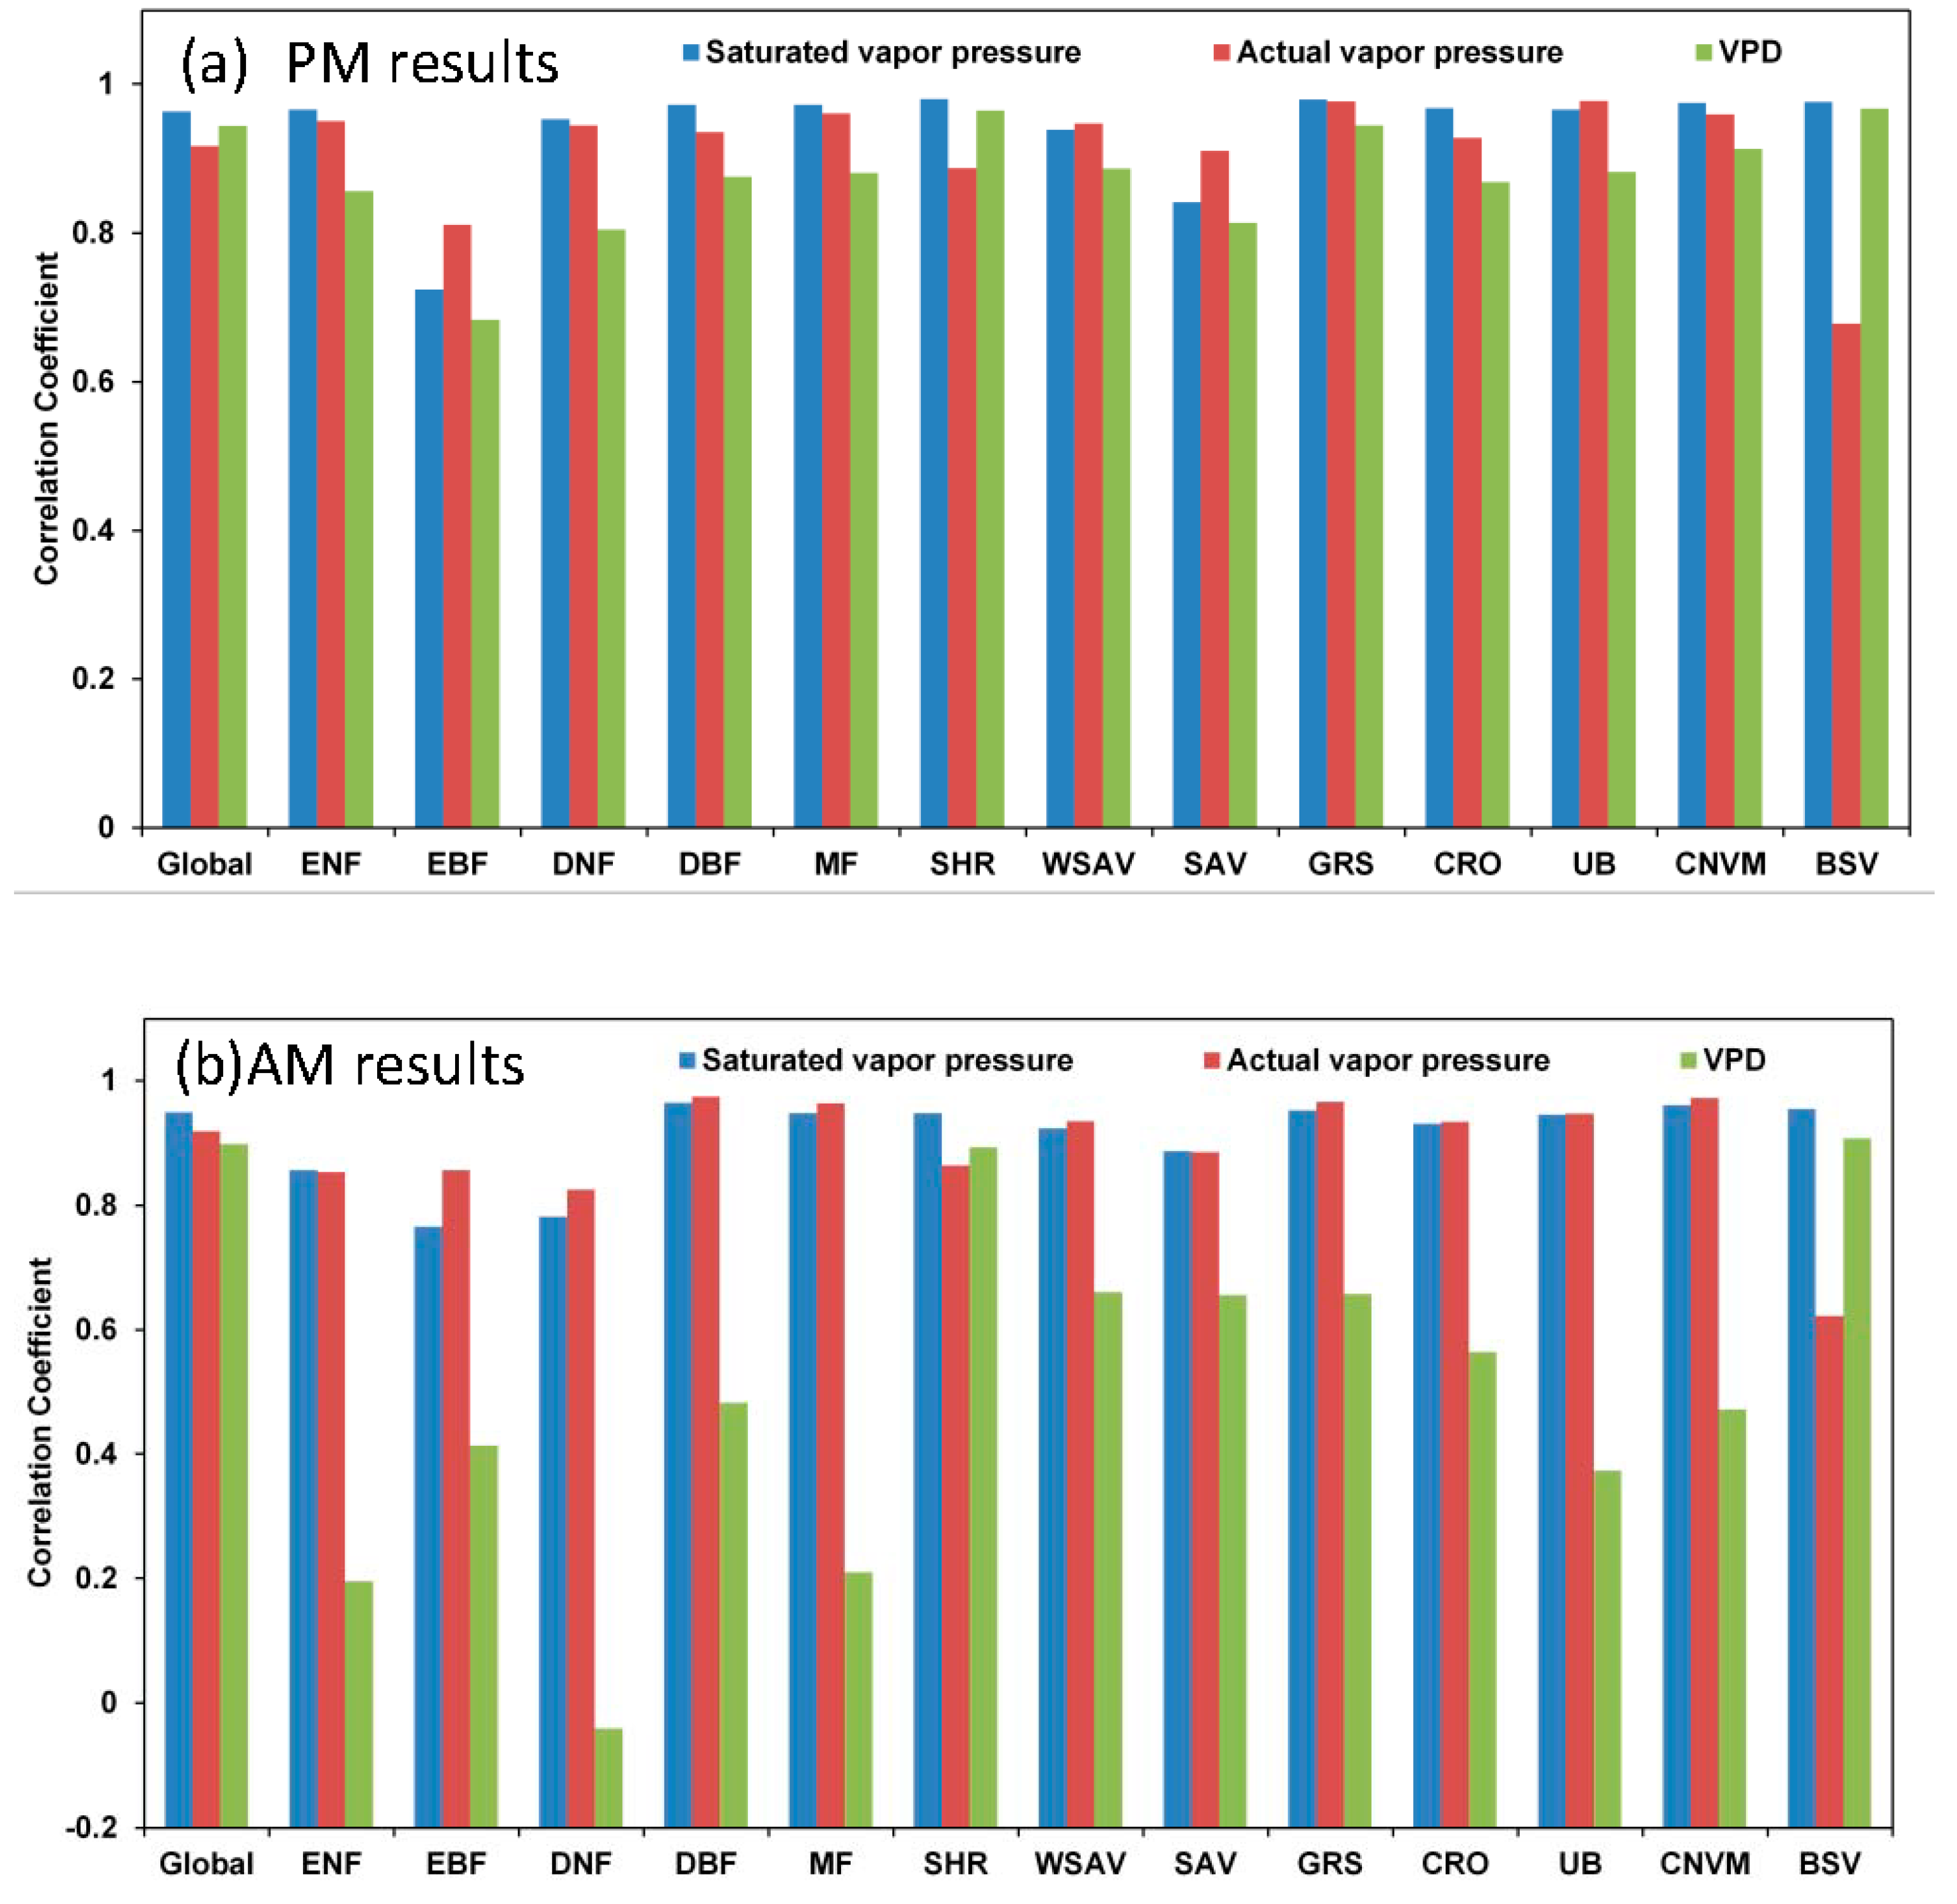
4.3. Evaluations of AMSR and Estimates
5. Discussion
5.1. Retrieval Uncertainties of AMSR VPD, , and
5.2. Consistency of the AMSR VPD Data Record
6. Conclusions
Author Contributions
Funding
Acknowledgments
Conflicts of Interest
References
- Murray, F.W. On the computation of saturation vapor pressure. J. Appl. Meteorol. 1967, 6, 203–204. [Google Scholar] [CrossRef]
- Running, S.W.; Nemani, R.R. Relating seasonal patterns of the AVHRR vegetation index to simulate photosynthesis and transpiration of forests in different climates. Remote Sens. Environ. 1988, 24, 347–367. [Google Scholar] [CrossRef]
- Gu, L.; Meyers, T.; Pallardy, S.G.; Hanson, P.J.; Yang, B.; Heuer, M.; Hosman, K.P.; Riggs, J.S.; Sluss, D.; Wullschleger, S.D. Direct and indirect effects of atmospheric conditions and soil moisture on surface energy partitioning revealed by a prolonged drought at a temperate forest site. J. Geophys. Res. Atmos. 2006, 111. [Google Scholar] [CrossRef] [Green Version]
- Day, M.E. Influence of temperature and leaf-to-air vapor pressure deficit on net photosynthesis and stomatal conductance in red spruce (Picea rubens). Tree Physiol. 2000, 20, 57–63. [Google Scholar] [CrossRef] [PubMed]
- Zhao, M.; Running, S.W. Drought-induced reduction in global terrestrial net primary production from 2000 through 2009. Science 2010, 329, 940–943. [Google Scholar] [CrossRef] [PubMed]
- Monteith, J.L. Evaporation and environment. In The State and Movement of Water in Living Organisms; Fogg, C.E., Ed.; Cambridge Univerity Press: Cambridge, UK, 1965; pp. 205–234. [Google Scholar]
- Shuttleworth, W.J. Evaporation. In Handbook of Hydrology; Maidment, D.R., Ed.; McGraw Hill: New York, NY, USA, 1993. [Google Scholar]
- Running, S.W.; Nemani, R.R.; Heinsch, F.A.; Zhao, M.; Reeves, M.; Hashimoto, H. A continuous satellite-derived measure of global terrestrial primary production. Bioscience 2004, 54, 547–560. [Google Scholar] [CrossRef]
- Mu, Q.; Jones, L.A.; Kimball, J.S.; McDonald, K.C.; Running, S.W. Satellite assessment of land surface evapotranspiration for the pan-Arctic domain. Water Resour. Res. 2009, 45. [Google Scholar] [CrossRef] [Green Version]
- Jones, L.A.; Kimball, J.S.; Reichle, R.H.; Madani, N.; Glassy, J.M.; Ardizzone, J.V.; Colliander, A.; Cleverly, J.; Desai, A.R.; Eamus, D.; et al. The SMAP level 4 carbon product for monitoring ecosystem land-atmosphere CO₂ exchange. IEEE Trans. Geosci. Remote Sens. 2017, 55. [Google Scholar] [CrossRef]
- Lobell, D.B.; Roberts, M.J.; Schlenker, W.; Braun, N.; Little, B.B.; Rejesus, R.M.; Hammer, G.L. Greater sensitivity to drought accompanies maize yield increase in the US Midwest. Science 2014, 344, 516–519. [Google Scholar] [CrossRef] [PubMed]
- Jones, M.O.; Kimball, J.S.; Small, E.E.; Larson, K.M. Comparing land surface phenology derived from satellite and GPS network microwave remote sensing. Int. J. Biometeorol. 2014, 58, 1305–1315. [Google Scholar] [CrossRef] [PubMed]
- Williams, A.P.; Allen, C.D.; Macalady, A.K.; Griffin, D.; Woodhouse, C.A.; Meko, D.M.; Swetnam, T.W.; Rauscher, S.A.; Seager, R.; Grissino-Mayer, H.D.; et al. Temperature as a potent driver of regional forest drought stress and tree mortality. Nat. Clim. Chang. 2013, 3, 292–297. [Google Scholar] [CrossRef]
- Konings, A.G.; Williams, A.P.; Gentine, P. Sensitivity of grassland productivity to aridity controlled by stomatal and xylem regulation. Nat. Geosci. 2017, 10, 284–288. [Google Scholar] [CrossRef]
- Lucchesi, R. File Specification for GEOS-5 FP (Forward Processing); GMAO Office Note 4 (Version 1.0); NASA: Washington, DC, USA, 2013. Available online: https://gmao.gsfc.nasa.gov/products/documents/GEOS_5_FP_File_Specification_ON4v1_0.pdf (accessed on 10 March 2018).
- Yi, Y.; Kimball, J.S.; Jones, L.A.; Reichle, R.H.; McDonald, K.C. Evaluation of MERRA land surface estimates in preparation for the soil moisture active passive mission. J. Clim. 2011, 24, 3797–3816. [Google Scholar] [CrossRef]
- Gelaro, R.; McCarty, W.; Suárez, M.J.; Todling, R.; Molod, A.; Takacs, L.; Randles, C.A.; Darmenov, A.; Bosilovich, M.G.; Reichle, R.; et al. The modern-era retrospective analysis for research and applications, version 2 (MERRA-2). J. Clim. 2017, 30, 5419–5454. [Google Scholar] [CrossRef]
- Dee, D.P.; Uppala, S.M.; Simmons, A.J.; Berrisford, P.; Poli, P.; Kobayashi, S.; Andrae, U.; Balmaseda, M.A.; Balsamo, G.; Bauer, P.; et al. The ERA-interim reanalysis: Configuration and performance of the data assimilation system. Q. J. R. Meteorol. Soc. 2011, 137, 553–597. [Google Scholar] [CrossRef]
- Kalnay, E.; Jenne, R. The NMC/NCAR 40-year reanalysis project. Bull. Am. Meteorol. Soc. 1996, 77, 437–471. [Google Scholar] [CrossRef]
- Kistler, R.; Kalnay, E.; Collins, W.; Saha, S.; White, G.; Woollen, J.; Chelliah, M.; Ebisuzaki, W.; Kanamitsu, M.; Kousky, V.; et al. The NCEP-NCAR 50-year reanalysis: Monthly means CD-ROM and documentation. Bull. Am. Meteorol. Soc. 2001, 82, 247–268. [Google Scholar] [CrossRef]
- Zhang, K.; Kimball, J.S.; Nemani, R.R.; Running, S.W. A continuous satellite-derived global record of land surface evapotranspiration from 1983 to 2006. Water Resour. Res. 2010, 46. [Google Scholar] [CrossRef] [Green Version]
- Prince, S.D.; Goetz, S.J.; Dubayah, R.O.; Czajkowski, K.P.; Thawley, M. Inference of surface and air temperature, atmospheric precipitable water and vapor pressure deficit using advanced very high-resolution radiometer satellite observations: Comparison with field observations. J. Hydrol. 1998, 212, 230–249. [Google Scholar] [CrossRef]
- Hashimoto, H.; Dungan, J.L.; White, M.A.; Yang, F.; Michaelis, A.R.; Running, S.W.; Nemani, R.R. Satellite-based estimation of surface vapor pressure deficits using MODIS land surface temperature data. Remote Sens. Environ. 2008, 112, 142–155. [Google Scholar] [CrossRef]
- Zhang, H.; Wu, B.; Yan, N.; Zhu, W.; Feng, X. An improved satellite-based approach for estimating vapor pressure deficit from MODIS data. J. Geophys. Res. Atmos. 2014, 119. [Google Scholar] [CrossRef]
- Green, R.M.; Hay, S.I. The potential of pathfinder AVHRR data for providing surrogate climatic variables across Africa and Europe for epidemiological applications. Remote Sens. Environ. 2002, 79, 166–175. [Google Scholar] [CrossRef]
- Sahin, M.; Yildiz, B.Y.; Senkal, O.; Pestemalci, V. Estimation of the vapour pressure deficit using NOAA-AVHRR data. Int. J. Remote Sens. 2013, 34, 2714–2729. [Google Scholar] [CrossRef]
- Susskind, J.; Blaisdell, J.M.; Iredell, L. Improved methodology for surface and atmospheric soundings, error estimates, and quality control procedures: The atmospheric infrared sounder science team version-6 retrieval algorithm. J. Appl. Remote Sens. 2014, 8. [Google Scholar] [CrossRef]
- Levine, P.A.; Randerson, J.T.; Swenson, S.C.; Lawrence, D.M. Evaluating the strength of the land-atmosphere moisture feedback in Earth system models using satellite observations. Hydrol. Earth Syst. Sci. 2016, 20. [Google Scholar] [CrossRef]
- Jones, L.A. Satellite Microwave Remote Sensing of Boreal-Arctic Land Surface State and Meteorology from AMSR-E. Master’s Thesis, University of Montana, Missoula, MT, USA, 2007. [Google Scholar]
- Jones, L.A.; Ferguson, C.R.; Kimball, J.S.; Zhang, K.; Chan, S.T.K.; McDonald, K.C.; Njoku, E.G.; Wood, E.F. Satellite microwave remote sensing of daily land surface air temperature minima and maxima from AMSR-E. IEEE J. Sel. Top. Appl. Earth Obs. Remote Sens. 2010, 3, 111–123. [Google Scholar] [CrossRef]
- Du, J.; Kimball, J.S.; Jones, L.A. Satellite microwave retrieval of total precipitable water vapor and surface air temperature over land from AMSR2. IEEE Trans. Geosci. Remote Sens. 2015, 53, 2520–2531. [Google Scholar] [CrossRef]
- Du, J.; Kimball, J.S.; Jones, L.A.; Kim, Y.; Glassy, J.; Watts, J.D. A global satellite environmental data record derived from AMSR-E and AMSR2 microwave Earth observations. Earth Syst. Sci. Data 2017, 9. [Google Scholar] [CrossRef]
- Kimball, J.S.; White, M.A.; Running, S.W. Biome-BGC simulations of stand hydrologic processes for BOREAS. J. Geophys. Res. Atmos. 1997, 102, 29043–29051. [Google Scholar] [CrossRef]
- MERRA-2 tavg1_2d_slv_Nx: 2d, 1-Hourly, Time-Averaged, Single-Level, Assimilation, Single-Level Diagnostics V5.12.4; Global Modeling and Assimilation Office (GMAO), Goddard Earth Sciences Data and Information Services Center (GES DISC): Greenbelt, MD, USA, 2015; Available online: 10.5067/VJAFPLI1CSIV (accessed on 12 April 2018).
- Knowles, K. EASE-Grid Elevation Data Resampled from the Global Land One-km Base Elevation (GLOBE) Project; National Snow and Ice Data Center, Digital Media: Boulder, CO, USA, 2001. [Google Scholar]
- Koike, T.; Nakamura, Y.; Kaihotsu, I.; Davva, G.; Matsuura, N.; Tamagawa, K.; Fujii, H. Development of an Advanced Microwave Scanning Radiometer (AMSR-E) algorithm of soil moisture and vegetation water content. Proc. Hydraul. Eng. 2004, 48, 217–222. [Google Scholar] [CrossRef]
- Imaoka, K.; Takashi, M.; Misako, K.; Marehito, K.; Norimasa, I.; Keizo, N. Status of AMSR2 instrument on GCOM-W1, earth observing missions and sensors: Development, implementation, and characterization II. Proc. SPIE 2012, 8528, 852815. [Google Scholar]
- Kim, Y.; Kimball, J.S.; Glassy, J.; Du, J. An extended global earth system data record on daily landscape freeze-thaw status determined from satellite passive microwave remote sensing. Earth Syst. Sci. Data 2017, 9, 133–147. [Google Scholar] [CrossRef]
- Global Surface Hourly. NOAA National Centers for Environmental Information; Global Surface Hourly: Asheville, NC, USA, 2001; Available online: https://www.ncdc.noaa.gov/isd/data-access (accessed on 12 April 2018).
- Justice, C.O.; Townshend, J.R.G.; Vermote, E.F.; Masuoka, E.; Wolfe, R.E.; Saleous, N.; Roy, D.P.; Morisette, J.T. An overview of MODIS land data processing and product status. Remote. Sens. Environ. 2002, 83, 3–15. [Google Scholar] [CrossRef]
- Rienecker, M.M.; Keppenne, C.L.; Kovach, R.; Jacob, J.P.; Marshak, J. The GMAO’s Ensemble Kalman Filter Ocean Data Assimilation System. In Proceedings of the Third WCRP International Conference on Reanalysis, Tokyo, Japan, 28 January–1 February 2008. [Google Scholar]
- Bosilovich, M.G.; Akella, S.; Coy, L.; Cullather, R.; Draper, C.; Gelaro, R.; Kovach, R.; Liu, Q.; Molod, A.; Norris, P.; et al. MERRA-2: Initial Evaluation of the Climate, Technical Report Series on Global Modeling and Data Assimilation; NASA: Washington, DC, USA, 2015.
- Kim, Y.; Kimball, J.S.; Zhang, K.; McDonald, K.C. Satellite detection of increasing northern hemisphere non-frozen seasons from 1979 to 2008: Implications for regional vegetation growth. Remote Sens. Environ. 2012, 121, 472–487. [Google Scholar] [CrossRef]
- Du, J.; Kimball, J.S.; Azarderakhsh, M.; Dunbar, R.S.; Moghaddam, M.; McDonald, K.C. Classification of Alaska spring thaw characteristics using satellite L-band radar remote sensing. IEEE Trans. Geosci. Remote Sens. 2015, 53, 542–556. [Google Scholar]
- Reichle, R.H.; Liu, Q.; Koster, R.D.; Draper, C.S.; Mahanama, S.P.P.; Partyka, G.S. Land surface precipitation in MERRA-2. J. Clim. 2017, 30, 1643–1664. [Google Scholar] [CrossRef]
- Reichle, R.H.; Draper, C.S.; Liu, Q.; Girotto, M.; Mahanama, S.P.P.; Koster, R.D.; De Lannoy, G.J.M. Assessment of MERRA-2 land surface hydrology estimates. J. Clim. 2017, 30, 2937–2960. [Google Scholar] [CrossRef]
- Draper, C.S.; Reichle, R.H.; Koster, R.D. Assessment of MERRA-2 land surface energy flux estimates. J. Clim. 2018, 31, 671–691. [Google Scholar] [CrossRef]
- Allen, R.G.; Pereira, L.S.; Raes, D.; Smith, M. Crop Evapotranspiration-Guidelines for Computing Crop Water Requirements-FAO Irrigation and Drainage Paper 56; FAO: Rome, Italy, 1998. [Google Scholar]
- Lawrence, M.G. The relationship between relative humidity and the dewpoint temperature in moist air: A simple conversion and applications. Bull. Am. Meteorol. Soc. 2005, 86, 225–233. [Google Scholar] [CrossRef]
- Monteith, J.; Unsworth, M.H. Principles of Environmental Physics, 3rd ed.; Academic Press: London, UK, 2008. [Google Scholar]
- Smith, W.L. Note on the relationship between precipitable water and surface dew point. J. Appl. Meteorol. 1966, 5, 726–727. [Google Scholar] [CrossRef]
- Recondo, C.; Pendás, E.; Moreno, S.; Ga de Vicuña, C.; García-Martínez, A.; Abajo, A.; Zapico, E. A simple empirical method for estimating surface water vapour pressure using MODIS near-infrared channels: Applications to northern Spain’s Asturias region. Int. J. Remote Sens. 2013, 34, 3248–3273. [Google Scholar] [CrossRef]
- Ashcroft, M.B.; Gollan, J.R. Moisture, thermal inertia, and the spatial distributions of near-surface soil and air temperatures: Understanding factors that promote microrefugia. Agric. For. Meteorol. 2013, 176, 77–89. [Google Scholar] [CrossRef] [Green Version]
- Hughes, L. Climate change and Australia: Trends, projections and impacts. Austral. Ecol. 2003, 28, 423–443. [Google Scholar] [CrossRef]
- Jeffrey, S.J.; Carter, J.O.; Moodie, K.B.; Beswick, A.R. Using spatial interpolation to construct a comprehensive archive of Australian climate data. Environ. Model. Softw. 2001, 16, 309–330. [Google Scholar] [CrossRef]
- Cook, E.R.; Anchukaitis, K.J.; Buckley, B.M.; D’Arrigo, R.D.; Jacoby, G.C.; Wright, W.E. Asian monsoon failure and megadrought during the last millennium. Science 2010, 328, 486–489. [Google Scholar] [CrossRef] [PubMed]
- Lewis, S.L.; Brando, P.M.; Phillips, O.L.; van der Heijden, G.M.; Nepstad, D. The 2010 amazon drought. Science 2011, 331, 554. [Google Scholar] [CrossRef] [PubMed]
- Du, J.; Kimball, J.S.; Shi, J.; Jones, L.A.; Wu, S.; Sun, R.; Yang, H. Inter-calibration of satellite passive microwave land observations from AMSR-E and AMSR2 using overlapping FY3B-MWRI sensor measurements. Remote Sens. 2014, 6, 8594–8616. [Google Scholar] [CrossRef]


| Land Cover # | Sites # | Obs. # | R# | ACC # | Bias (kPa) | RMSE # (kPa) | rRMSE # (%) |
|---|---|---|---|---|---|---|---|
| MERRA-2/AMSR (2010 representing AMSR-E period) | |||||||
| ENF | 3 | 648 | 0.86/0.86 | 0.78/0.84 | −0.15/0.11 | 0.31/0.29 | 52%/47% |
| EBF | 8 | 1599 | 0.68/0.77 | 0.62/0.73 | −0.23/−0.25 | 0.84/0.61 | 43%/31% |
| DNF | 1 | 174 | 0.80/0.84 | 0.74/0.82 | −0.34/0.12 | 0.54/0.41 | 52%/39% |
| DBF | 1 | 248 | 0.88/0.94 | 0.82/0.89 | 0.02/−0.18 | 0.54/0.38 | 39%/28% |
| MF | 4 | 978 | 0.88/0.90 | 0.81/0.85 | −0.15/0.11 | 0.36/0.31 | 43%/37% |
| SHR | 15 | 3323 | 0.96/0.91 | 0.97/0.92 | 0.08/0.09 | 0.53/0.74 | 26%/36% |
| WSAV | 5 | 1116 | 0.89/0.94 | 0.81/0.90 | −0.20/−0.17 | 0.84/0.56 | 38%/25% |
| SAV | 1 | 221 | 0.81/0.87 | 0.80/0.87 | 0.71/0.17 | 1.02/0.53 | 52%/27% |
| GRS | 7 | 1553 | 0.94/0.89 | 0.90/0.81 | 0.08/0.18 | 0.41/0.58 | 24%/34% |
| CRO | 8 | 1988 | 0.87/0.85 | 0.78/0.76 | 0.01/0.03 | 0.44/0.51 | 44%/49% |
| UB | 1 | 179 | 0.88/0.93 | 0.71/0.85 | −0.63/−0.46 | 0.85/0.61 | 68%/48% |
| CNVM | 2 | 512 | 0.91/0.91 | 0.87/0.87 | 0.00/−0.11 | 0.40/0.41 | 32%/33% |
| BSV | 11 | 2651 | 0.97/0.90 | 0.94/0.82 | 0.55/0.34 | 0.82/1.06 | 25%/32% |
| Overall | 67 | 15190 | 0.94/0.91 | 0.94/0.91 | 0.07/0.07 | 0.63/0.69 | 33%/36% |
| MERRA-2/AMSR (2013 representing AMSR2 period) | |||||||
| ENF | 3 | 707 | 0.87/0.90 | 0.81/0.86 | −0.29/−0.23 | 0.48/0.42 | 63%/55% |
| EBF | 8 | 1524 | 0.67/0.70 | 0.65/0.69 | −0.16/−0.14 | 0.78/0.63 | 50%/40% |
| DNF | 1 | 176 | 0.90/0.92 | 0.87/0.91 | −0.06/−0.23 | 0.36/0.41 | 32%/37% |
| DBF | 1 | 216 | 0.85/0.93 | 0.81/0.86 | 0.15/0.18 | 0.38/0.29 | 49%/38% |
| MF | 4 | 817 | 0.87/0.90 | 0.81/0.86 | −0.15/0.02 | 0.44/0.37 | 44%/37% |
| SHR | 15 | 2671 | 0.97/0.95 | 0.97/0.95 | −0.15/−0.07 | 0.50/0.67 | 27%/35% |
| WSAV | 5 | 1171 | 0.94/0.92 | 0.93/0.91 | 0.20/−0.12 | 0.68/0.61 | 34%/31% |
| SAV | 1 | 182 | 0.78/0.88 | 0.80/0.84 | −0.50/−0.64 | 1.08/0.89 | 27%/23% |
| GRS | 7 | 1471 | 0.93/0.92 | 0.88/0.87 | 0.26/0.14 | 0.59/0.56 | 32%/30% |
| CRO | 8 | 1681 | 0.84/0.88 | 0.72/0.75 | 0.11/−0.03 | 0.50/0.40 | 49%/38% |
| UB | 1 | 223 | 0.89/0.94 | 0.80/0.83 | 0.03/−0.03 | 0.39/0.28 | 39%/28% |
| CNVM | 2 | 433 | 0.81/0.88 | 0.70/0.78 | 0.09/−0.06 | 0.45/0.32 | 54%/39% |
| BSV | 11 | 2247 | 0.94/0.88 | 0.89/0.81 | 0.18/−0.10 | 0.71/0.95 | 22%/30% |
| Overall | 67 | 13519 | 0.94/0.92 | 0.93/0.92 | 0.01/−0.07 | 0.60/0.64 | 33%/35% |
| Land Cover # | Site # | Obs. # | R# | ACC # | Bias (kPa) | RMSE # (kPa) | rRMSE # (%) |
|---|---|---|---|---|---|---|---|
| MERRA-2/AMSR (2010 representing AMSR-E period) | |||||||
| ENF | 3 | 607 | 0.19/0.28 | 0.11/0.22 | −0.08/−0.01 | 0.15/0.16 | 133%/135% |
| EBF | 8 | 1614 | 0.41/0.32 | 0.37/0.27 | −0.02/0.06 | 0.30/0.31 | 123%/130% |
| DNF | 1 | 150 | −0.04/0.07 | −0.09/−0.05 | −0.05/0.11 | 0.16/0.24 | 155%/231% |
| DBF | 1 | 242 | 0.48/0.46 | 0.42/0.34 | −0.13/−0.01 | 0.28/0.29 | 100%/102% |
| MF | 4 | 950 | 0.21/0.48 | 0.20/0.49 | −0.11/−0.03 | 0.20/0.19 | 135%/124% |
| SHR | 15 | 3086 | 0.89/0.77 | 0.89/0.78 | −0.17/0.07 | 0.42/0.54 | 55%/72% |
| WSAV | 5 | 1200 | 0.66/0.67 | 0.50/0.46 | −0.11/0.11 | 0.43/0.40 | 83%/78% |
| SAV | 1 | 214 | 0.66/0.38 | 0.42/0.22 | 0.25/0.03 | 0.47/0.39 | 91%/76% |
| GRS | 7 | 1512 | 0.66/0.56 | 0.55/0.37 | −0.10/0.26 | 0.31/0.45 | 73%/105% |
| CRO | 8 | 1775 | 0.56/0.63 | 0.49/0.59 | −0.06/0.05 | 0.22/0.21 | 101%/97% |
| UB | 1 | 236 | 0.37/0.62 | 0.05/0.16 | −0.28/−0.12 | 0.36/0.24 | 104%/70% |
| CNVM | 2 | 493 | 0.47/0.54 | 0.40/0.48 | −0.08/0.06 | 0.24/0.22 | 86%/79% |
| BSV | 11 | 2527 | 0.91/0.80 | 0.85/0.69 | −0.08/0.05 | 0.53/0.78 | 37%/54% |
| Overall | 67 | 14606 | 0.90/0.82 | 0.89/0.81 | −0.10/0.07 | 0.37/0.48 | 63%/80% |
| MERRA-2/AMSR (2013 representing AMSR2 period) | |||||||
| ENF | 3 | 642 | 0.29/0.22 | 0.23/0.14 | −0.14/−0.07 | 0.23/0.22 | 133%/123% |
| EBF | 8 | 1492 | 0.32/0.15 | 0.31/0.12 | −0.07/0.05 | 0.26/0.32 | 121%/153% |
| DNF | 1 | 156 | 0.17/0.29 | 0.04/0.26 | −0.10/−0.18 | 0.32/0.32 | 124%/125% |
| DBF | 1 | 208 | 0.23/0.24 | 0.23/0.08 | −0.13/−0.01 | 0.19/0.24 | 102%/125% |
| MF | 4 | 762 | 0.10/0.42 | 0.05/0.36 | −0.08/0.06 | 0.22/0.25 | 130%/149% |
| SHR | 15 | 2474 | 0.89/0.82 | 0.89/0.82 | −0.23/−0.08 | 0.51/0.58 | 63%/71% |
| WSAV | 5 | 1059 | 0.72/0.72 | 0.70/0.71 | −0.16/−0.09 | 0.45/0.42 | 76%/71% |
| SAV | 1 | 181 | 0.58/0.47 | 0.11/0.17 | −0.04/0.23 | 0.58/0.60 | 60%/62% |
| GRS | 7 | 1424 | 0.76/0.66 | 0.68/0.54 | −0.06/0.27 | 0.30/0.45 | 62%/93% |
| CRO | 8 | 1596 | 0.40/0.52 | 0.31/0.41 | −0.06/0.09 | 0.24/0.26 | 107%/119% |
| UB | 1 | 199 | 0.56/0.62 | 0.48/0.43 | −0.20/0.04 | 0.28/0.22 | 90%/70% |
| CNVM | 2 | 359 | 0.20/0.35 | 0.21/0.31 | −0.03/0.02 | 0.24/0.24 | 127%/130% |
| BSV | 11 | 2162 | 0.82/0.70 | 0.69/0.60 | −0.27/−0.02 | 0.72/0.82 | 49%/56% |
| Overall | 67 | 12714 | 0.87/0.80 | 0.86/0.80 | −0.15/0.02 | 0.44/0.50 | 72%/82% |
© 2018 by the authors. Licensee MDPI, Basel, Switzerland. This article is an open access article distributed under the terms and conditions of the Creative Commons Attribution (CC BY) license (http://creativecommons.org/licenses/by/4.0/).
Share and Cite
Du, J.; Kimball, J.S.; Reichle, R.H.; Jones, L.A.; Watts, J.D.; Kim, Y. Global Satellite Retrievals of the Near-Surface Atmospheric Vapor Pressure Deficit from AMSR-E and AMSR2. Remote Sens. 2018, 10, 1175. https://doi.org/10.3390/rs10081175
Du J, Kimball JS, Reichle RH, Jones LA, Watts JD, Kim Y. Global Satellite Retrievals of the Near-Surface Atmospheric Vapor Pressure Deficit from AMSR-E and AMSR2. Remote Sensing. 2018; 10(8):1175. https://doi.org/10.3390/rs10081175
Chicago/Turabian StyleDu, Jinyang, John S. Kimball, Rolf H. Reichle, Lucas A. Jones, Jennifer D. Watts, and Youngwook Kim. 2018. "Global Satellite Retrievals of the Near-Surface Atmospheric Vapor Pressure Deficit from AMSR-E and AMSR2" Remote Sensing 10, no. 8: 1175. https://doi.org/10.3390/rs10081175
APA StyleDu, J., Kimball, J. S., Reichle, R. H., Jones, L. A., Watts, J. D., & Kim, Y. (2018). Global Satellite Retrievals of the Near-Surface Atmospheric Vapor Pressure Deficit from AMSR-E and AMSR2. Remote Sensing, 10(8), 1175. https://doi.org/10.3390/rs10081175