Animal Detection Using Thermal Images and Its Required Observation Conditions


1
Artificial Intelligence Research Center, National Institute of Advanced Industrial Science and Technology, 2-4-7 Aomi, Koto, Tokyo 135-0064, Japan
2
Department of Planning and Coordination, Headquarter, National Agriculture and Food Research, Organization, 3-1-1 Kannondai, Tsukuba 305-8517, Ibaraki, Japan
3
Center for Environmental Biology and Ecosystem Studies, National Institute for Environmental Studies, 16-2 Onogawa, Tsukuba 305-8506, Ibaraki, Japan
4
Research and Survey Department, Nakanihon Air Service Co., Ltd., 17-1 Wakamiya, Nishikasugai 480-0202, Aichi, Japan
5
Center for Global Environmental Research, National institute for Environmental Studies, 16-2 Onogawa, Tsukuba 305-8506, Ibaraki, Japan
*
Author to whom correspondence should be addressed.
Remote Sens. 2018, 10(7), 1050; https://doi.org/10.3390/rs10071050
Submission received: 28 May 2018
/
Revised: 20 June 2018
/
Accepted: 2 July 2018
/
Published: 3 July 2018
Abstract
:Information about changes in the population sizes of wild animals is extremely important for conservation and management. Wild animal populations have been estimated using statistical methods, but it is difficult to apply such methods to large areas. To address this problem, we have developed several support systems for the automated detection of wild animals in remote sensing images. In this study, we applied one of the developed algorithms, the computer-aided detection of moving wild animals (DWA) algorithm, to thermal remote sensing images. We also performed several analyses to confirm that the DWA algorithm is useful for thermal images and to clarify the optimal conditions for obtaining thermal images (during predawn hours and on overcast days). We developed a method based on the algorithm to extract moving wild animals from thermal remote sensing images. Then, accuracy was evaluated by applying the method to airborne thermal images in a wide area. We found that the producer’s accuracy of the method was approximately 77.3% and the user’s accuracy of the method was approximately 29.3%. This means that the proposed method can reduce the person-hours required to survey moving wild animals from large numbers of thermal remote sensing images. Furthermore, we confirmed the extracted sika deer candidates in a pair of images and found 24 moving objects that were not identified by visual inspection by an expert. Therefore, the proposed method can also reduce oversight when identifying moving wild animals. The detection accuracy is expected to increase by setting suitable observation conditions for surveying moving wild animals. Accordingly, we also discuss the required observation conditions. The discussions about the required observation conditions would be extremely useful for people monitoring animal population changes using thermal remote sensing images.

1. Introduction
Problems related to wild animals in Japan are classified as human–wildlife conflict, endangered species, invasive alien species, or overabundant species. Human–wildlife conflict refers to sudden attacks resulting from unexpected encounters with wild animals and to agricultural damage by animals. Endangered species are threatened with extinction by hunting or human activities, such as land-use changes. Invasive alien species were introduced intentionally or unintentionally by humans from overseas or from other areas in the country. Overabundant species cause serious damage to agriculture and forestry and affect ecosystems by their considerable population increases and expanding distributions. These problems are not independent, but rather are connected [1]. In particular, conflict between wildlife and humans is a serious problem at the blurred boundary between species near urban areas in Japan. These imprecise boundaries are caused by abandoned farmlands and depopulation by hunters accompanying the rapidly decreasing and ageing rural population. ‘Satoyama’ is defined as a unique human-influenced natural environment that has been shaped and sustained over a long period by diverse human activity. Studies are needed to determine how to manage satoyama landscapes in such a way that the balance between the needs of humans and nature can be restored, particularly in regard to damage to forests and farmland caused by wild animals [2]. In particular, sika deer (Cervus nippon) have caused serious damage to the agricultural and forestry industries by tree bark-stripping and ecosystem changes. The amount of damage to agriculture by wild animals totaled about 166 million US dollars, and that by sika deer was about 57 million US dollars in 2014 (1 US dollar = 115 Japanese yen) [3].
To address these problems, the conservation and management of wild animals is necessary. The adaptive management of wild animals, a systematic approach for improving resource management by learning from management outcomes [4,5], is essential. Adaptive management of wild animals consists of the prediction of increases and decreases, plans for hunting goals, abundance adjustment, and monitoring abundance using population indices to determine changes in the population size of wild animals. However, there is insufficient population information for sika deer, which are crepuscular animals with large habitat areas [6]. Although wild animal populations have been estimated using statistical methods, it is difficult to apply such methods to large areas because they require man power and are tremendously laborious. To resolve these issues, remote sensing is a promising method. However, even in open areas, it is difficult to identify animals in remote sensing images because the shapes of objects may differ markedly when viewed from above instead of from the side, as humans are accustomed to doing. Moreover, there is the potential for oversight because an enormous amount of data must be analyzed [7].
To address this issue, we have developed several support systems for the automated detection of wild animals in remote sensing images. These systems reduce the number of person-hours required to survey wild animals from large numbers of remote sensing images. One of these is the computer-aided detection of moving wild animals (DWA) algorithm [8]. The algorithm automatically extracts moving wild animals using the time difference between two overlapping visible images. The advantages of the algorithm are as follows. (i) Almost no detection errors occur, even in sparse forest areas: In forest areas, a tip of a tree appears in different positions when viewed from different points. Accordingly, simple differences between two images can cause detection errors. The DWA algorithm can be applied to sparse forests because relief displacement effects do not cause false detection; (ii) Applicable to large areas: The DWA algorithm does not require fixed cameras because it uses overlapping areas in photographs taken from a flying platform.
Thus far, the use of the algorithm has been limited to the daytime because visible and near-infrared images have been used. However, many large mammals, such as sika deer, are crepuscular. For this reason, we used thermal images, in which animals can be identified in semi-dark conditions. Very few studies have used thermal remote sensing images to monitor wild animals [9,10,11,12]. Furthermore, it is difficult to distinguish animals from trees in thermal images in some observation conditions [9,10] because surface temperature contrast between detection targets and the background is essential to extract targets from thermal images. Therefore, existing studies of the application of thermal remote sensing images to monitor wild animals [11,12] are limited to open, cool areas. Urban areas contain many hotspots, such as streetlights; thus, we attempted to use pairs of overlapping thermal images obtained at different times to automatically extract only moving animals.
The three major goals of the present study were as follows. First, we evaluated the applicability of the DWA algorithm; if it could extract moving wild animals from thermal images; and the conditions necessary to apply the algorithm to thermal images. Secondly, we designed an experimental method based on the DWA algorithm to extract moving wild animals from thermal remote sensing images and applied the method to airborne thermal images in a wide area around Nara Park. Because sika deer are important for Japan’s native religion, Shinto, they are sometimes kept on the grounds of Shinto Shrines, such as Nara Park in Nara [6]. Therefore, sika deer at Nara Park have been preserved for a long time. However, agricultural damage near Nara Park has become more serious, and abundance adjustment of sika deer near Nara Park was initiated on 17 August 2017. Then, we established the required observation conditions to monitor animal population changes using thermal remote sensing images through the results of the airborne experiment.
2. Methods
2.1. Applicable Evaluation
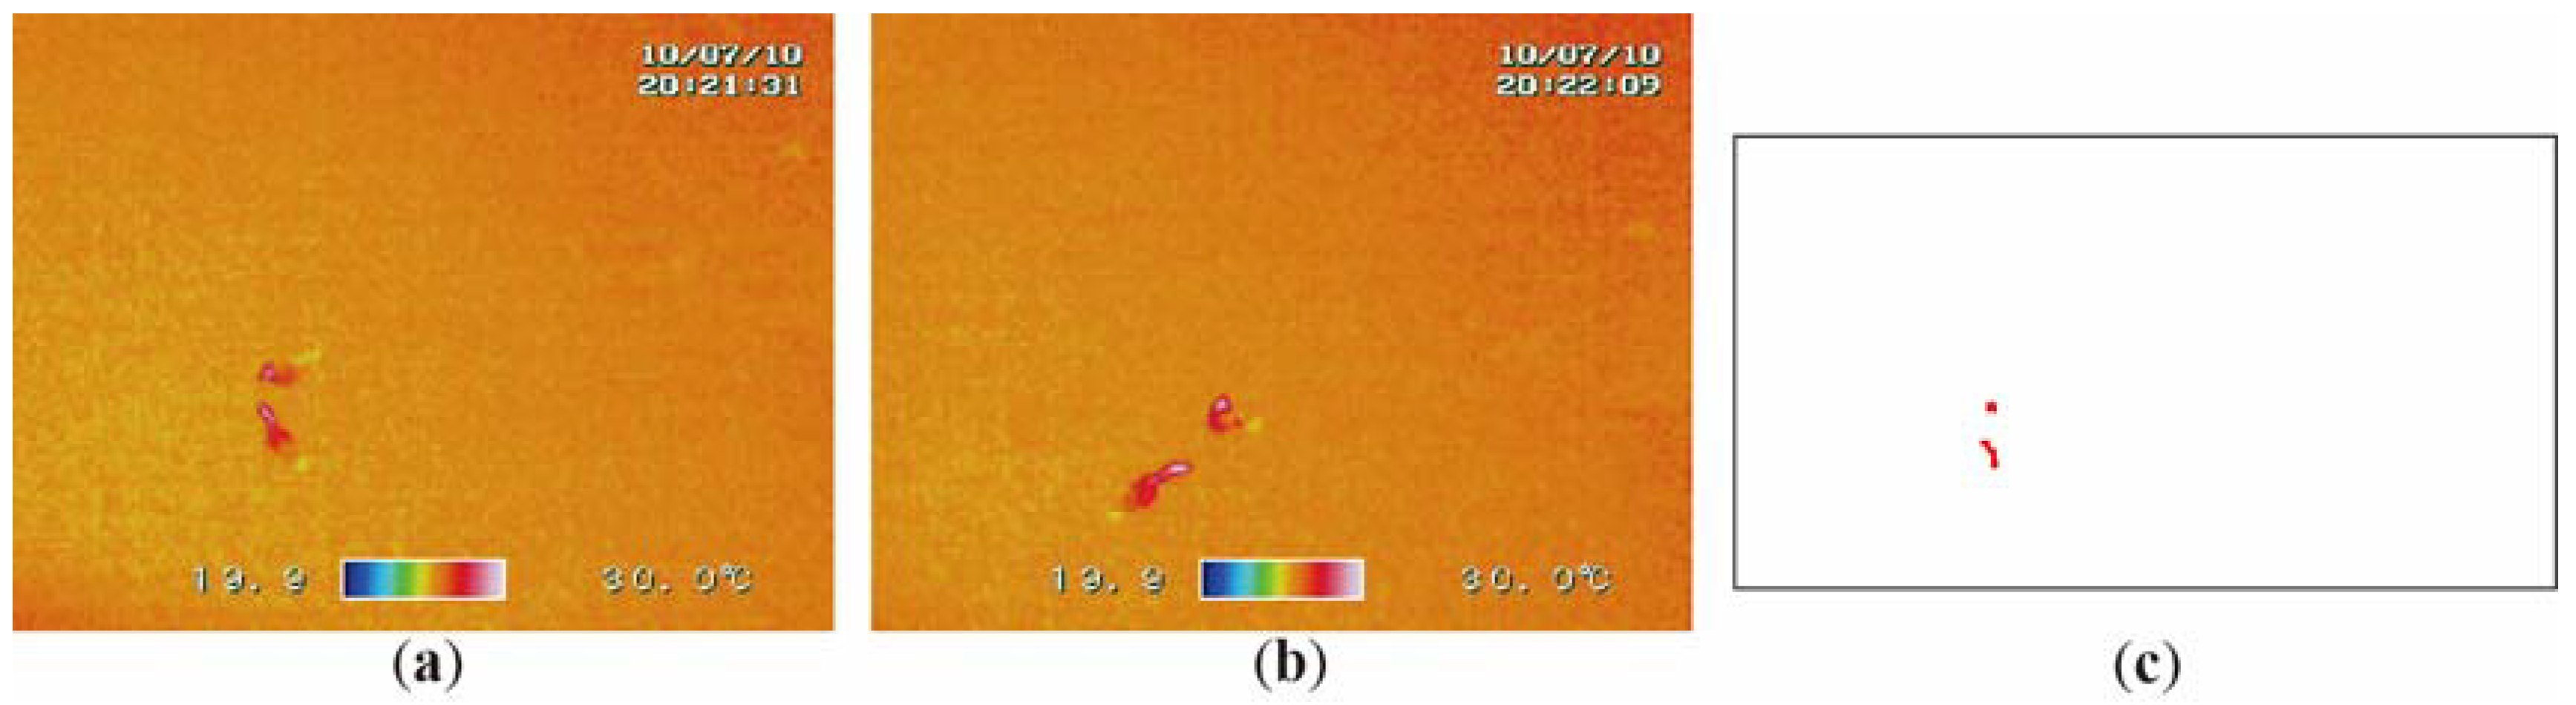
We evaluated whether the DWA algorithm automatically extracts moving wild animals from thermal images. First, swimming wild ducks were captured at intervals of 30 s using a fixed thermal camera (Thermo Shot F30; NEC Avio Infrared Technologies Co., Ltd., Tokyo, Japan), on the parapet of a bridge in central Tokyo, Japan, on the night of 10 June 2010. The pixel resolution of images was approximately 3 cm, and the image area was 7 m × 10 m.
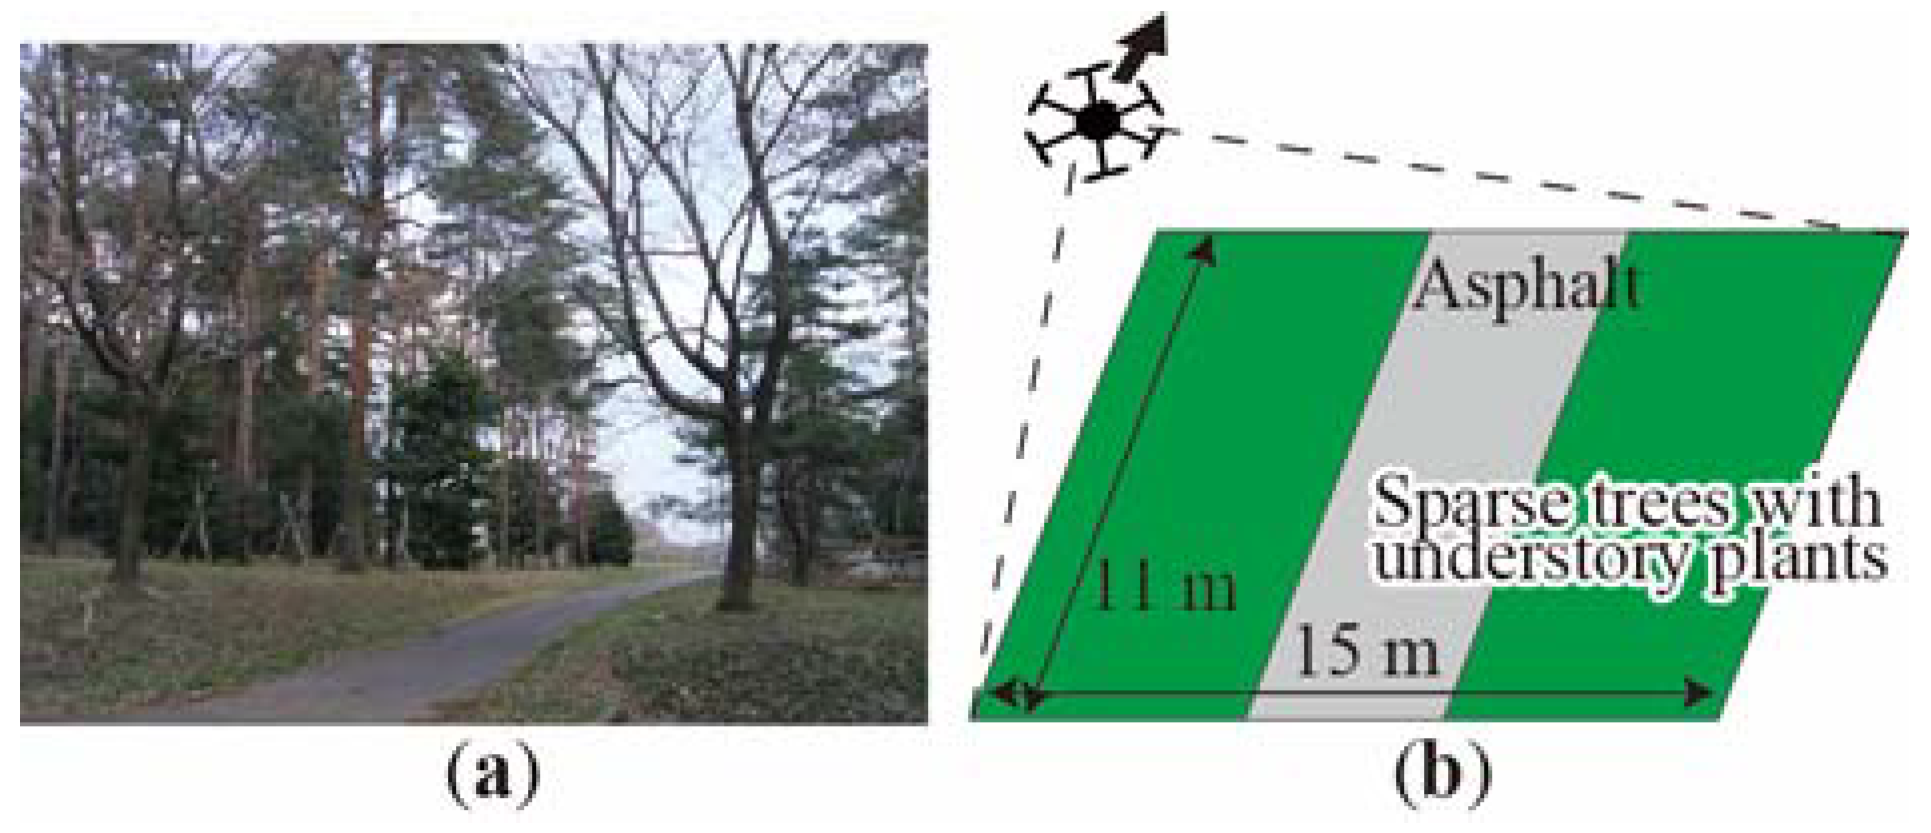
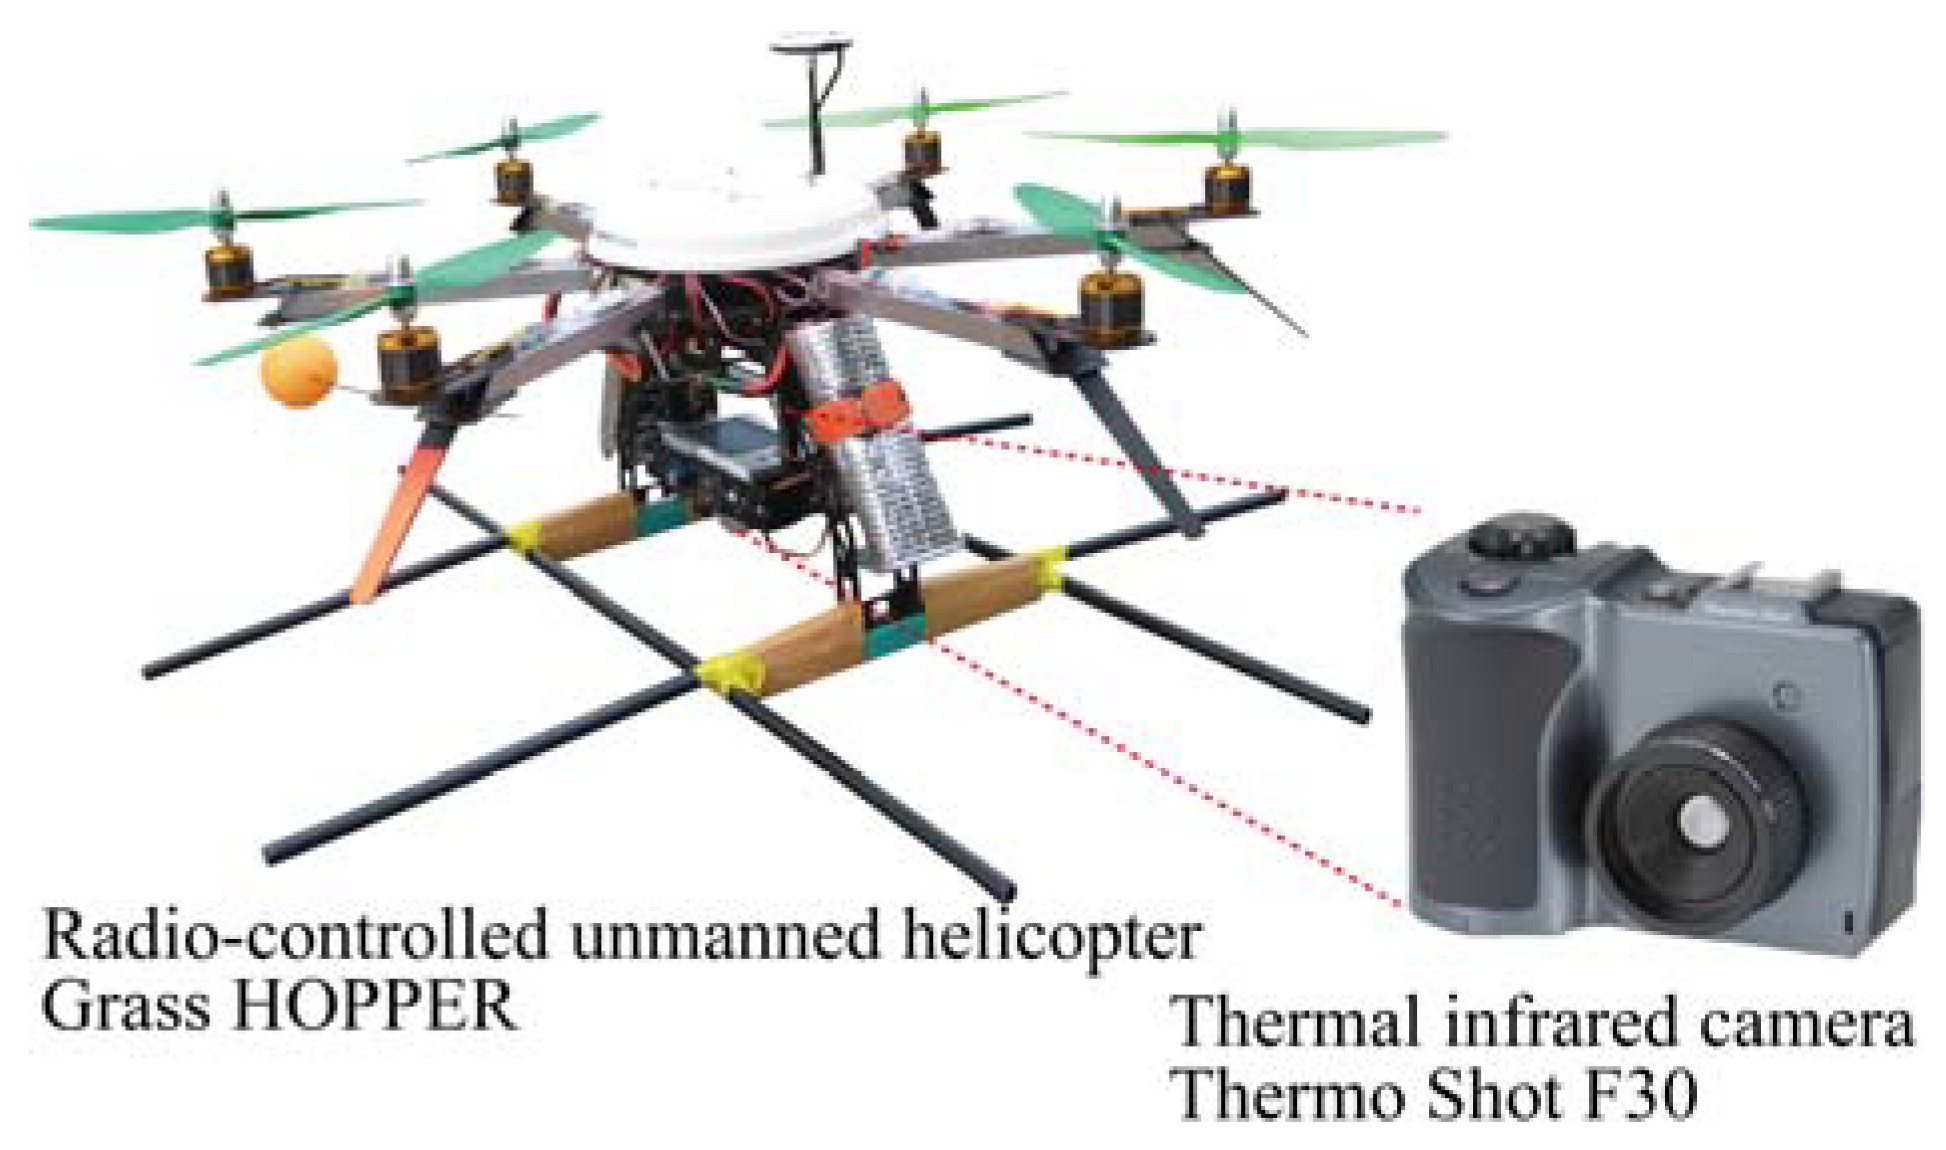
We performed an unmanned air vehicle (UAV) experiment at the National Institute for Environmental Studies, which is located in Tsukuba, Japan (Figure 1). The details of the UAV experiment are described later. We collected thermal images on the morning of 6 April 2012 at an altitude of 30 m with 60% image overlap and a 4 sec interval using the Thermo Shot F30 loaded on a UAV (Grass HOPPER; Information & Science Techno-System Co., Ltd., Tsukuba, Japan; Figure 2). Grass HOPPER has two automatic modes: An automatic hovering mode and an automatic return and landing mode. The UAV can capture images by operation on the ground. The pixel resolution of the images was approximately 5 cm. The image region was 15 m × 11 m.
Furthermore, we measured the change in the surface temperature of several objects during the day using a radiation-thermometer (i-square ii-1064; HORIBA, Ltd., Kyoto, Japan) to evaluate the conditions necessary to obtain thermal images.
2.2. Airborne Platform Imagery
Four pairs of airborne thermal images were collected using a thermal sensor (ITRES TABI-1800) by Nakanihon Air Service Co., Ltd. at Nara Park in Nara, Japan at 19:22–20:22 h on 11 September 2015 (Figure 3). The air temperature at the time was approximately 20 °C. Images were obtained twice at an altitude of about 1000 m and 1300 m. The shooting time difference was 30 min. The pixel resolutions of the images were approximately 40 cm and 50 cm, and the image area was 2.9 km × 1.9 km. The image size was approximately 11,000 × 8000 pixels. The airborne thermal images were already map projected in the following procedure. (i) Positioning decision of the aircraft using the Global Navigating Satellite System (GNSS) and the Inertial Measurement Unit (IMU); (ii) Map projection using free Digital Elevation Model (DEM) of 5 m resolution which is provided by the Geospatial Information Authority of Japan [13], after rearranging every pixel to be 40 cm per pixel. We also used the visual inspection results of the airborne thermal images by an expert using pairs of the thermal images for the evaluation of the proposed method. The visual inspection results were verified by ground observation counting at the same time in a previous study. In the comparative result, the averaged accuracy of the visual inspection was over 88% [14].
2.3. Methods for the Ground Experiment
At the first, we confirm that the DWA algorithm can automatically extract moving targets from thermal images. We captured swimming wild ducks with thermal camera fixed to a bridge. The shooting time difference was 30 s.
2.4. Methods for the Unmanned Air Vehicle Unmanned Air Vehicle (UAV) Experiment
To evaluate the application of the method, it is necessary to confirm the following two points:
- Detection of moving targetsIt is necessary to confirm that the DWA algorithm can automatically extract moving targets from thermal UAV images.
- Detection error of non-moving objectsThe DWA algorithm was designed to avoid the extraction of non-moving objects. Accordingly, it is necessary to confirm that the DWA algorithm does not extract non-moving objects, which only change in shape in thermal images.
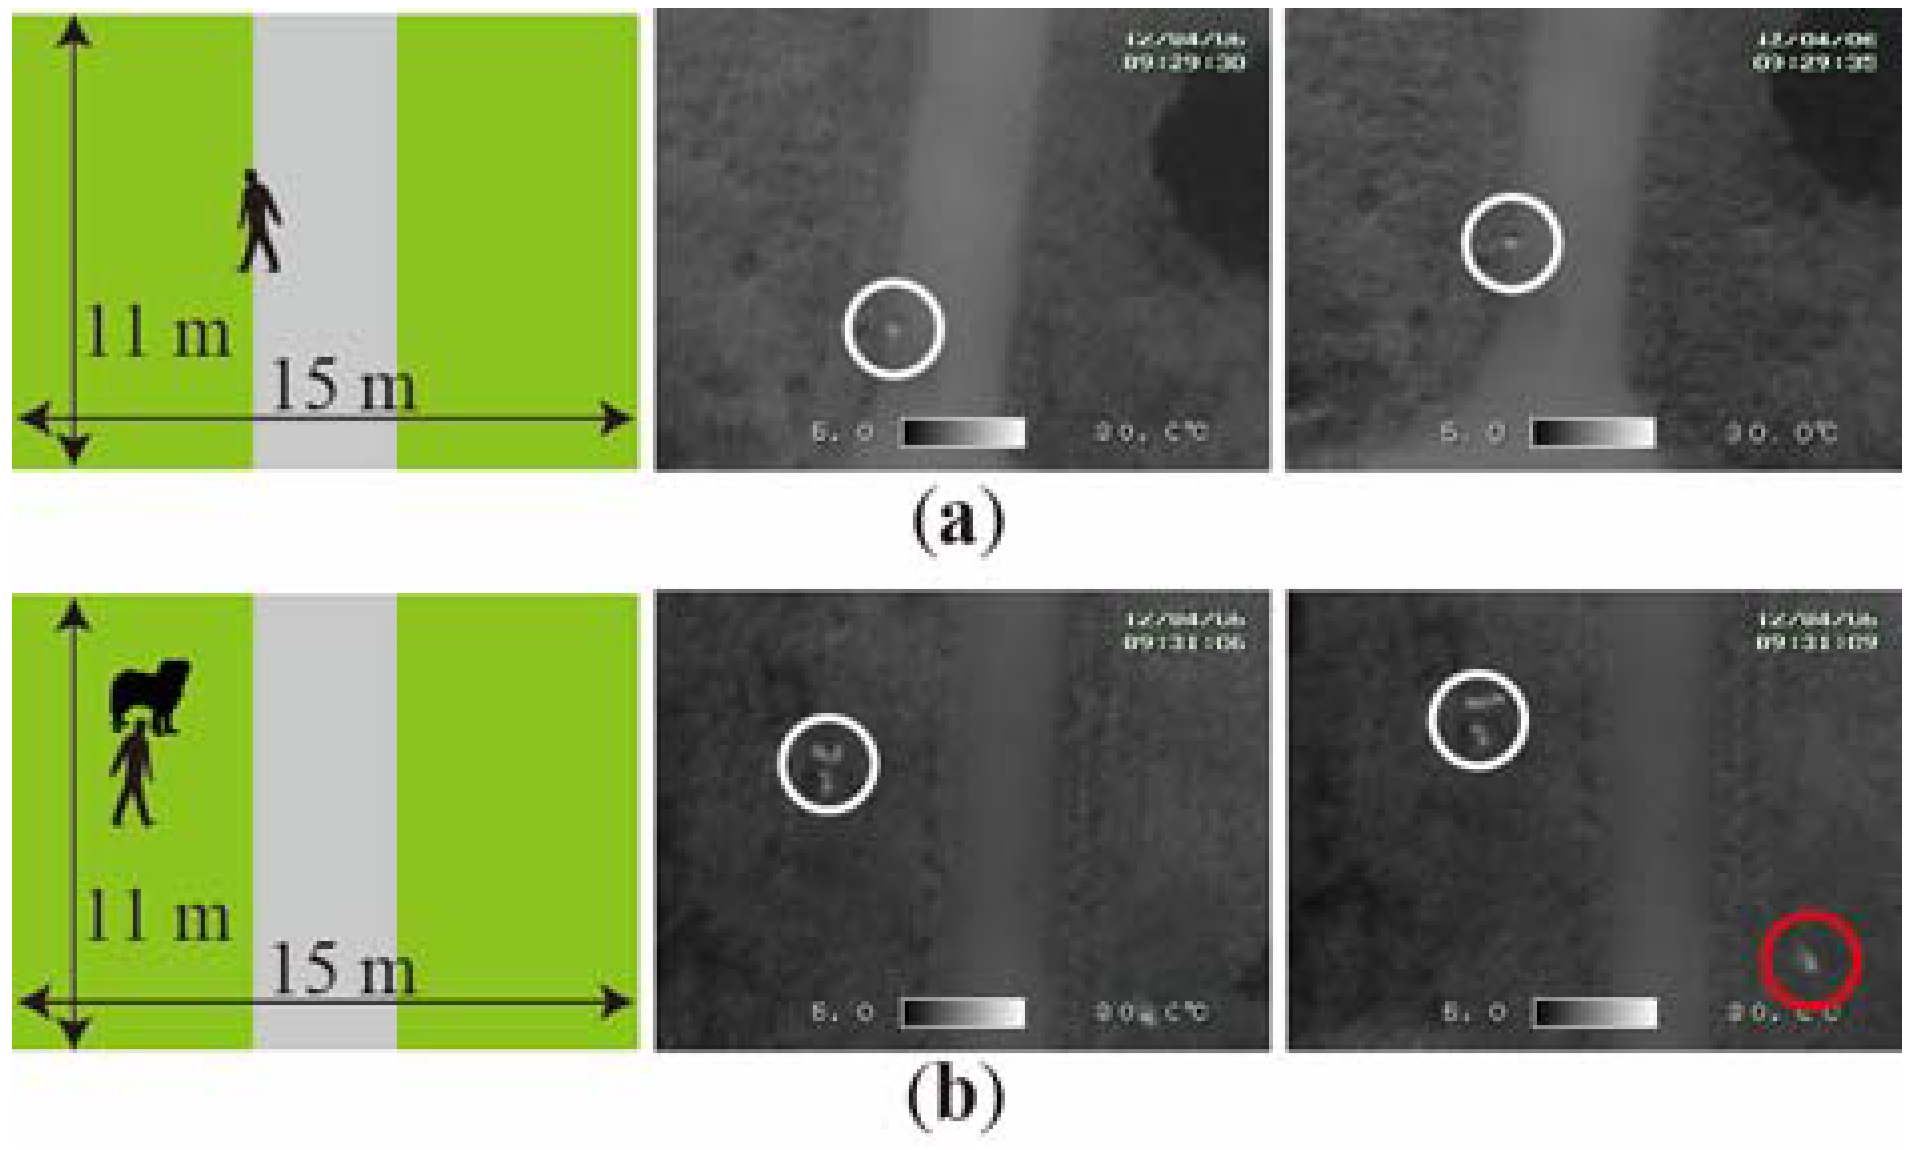
We used two pairs of thermal images obtained the following shooting procedure (Figure 4).
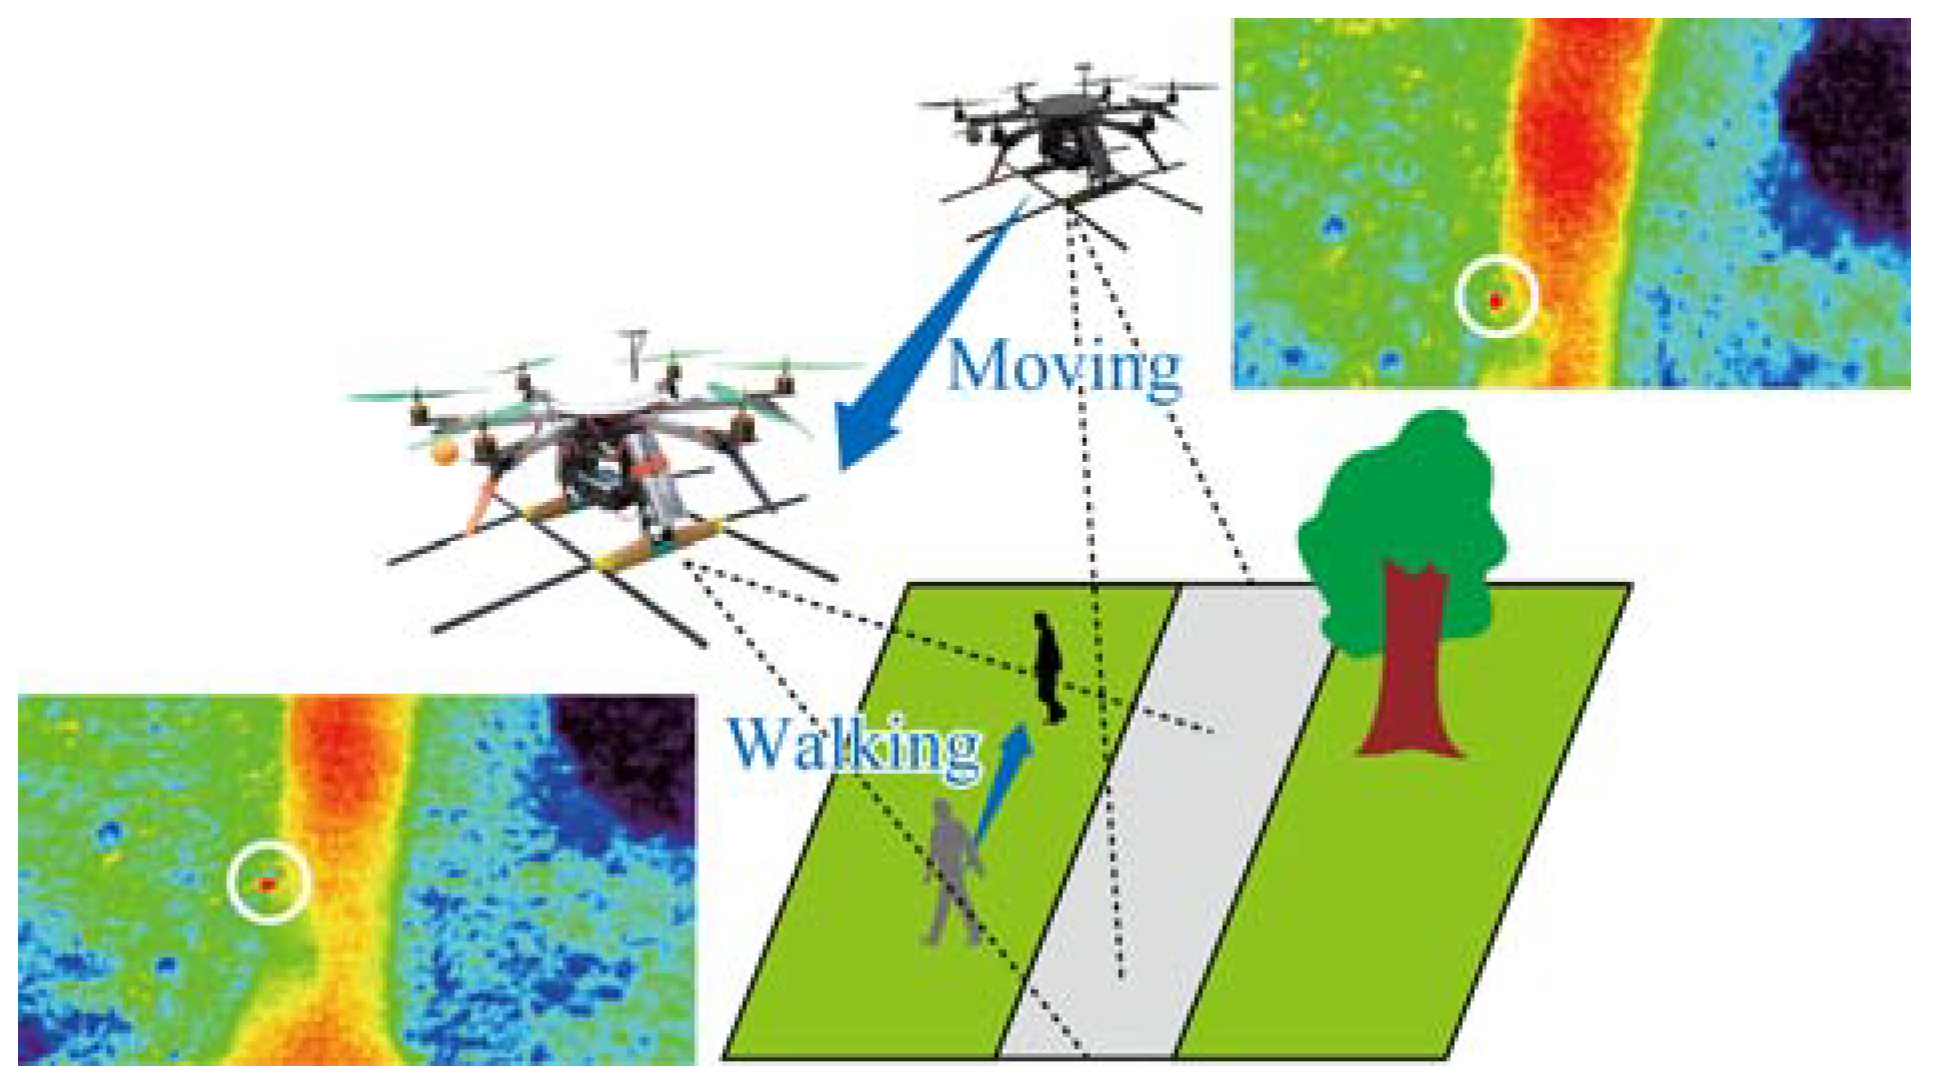
- A walking humanA standing human on the road was photographed by a hovering UAV. The same walking human on the road was photographed again by the hovering UAV after the position of the UAV was moved.
- A standing human and dog that only change their posesA standing human and dog on the grass were photographed by the hovering UAV. After only changing poses, they were photographed again by the hovering UAV after the position of the UAV was moved.
2.5. Outline of the Computer-Aided Detection of Moving Wild Animals (DWA) Algorithm
Several studies have been conducted to extract moving objects from images, which were captured with a fixed camera, using logical operations on positional differences [15]. However, because these methods misidentify trees as moving objects due to displacement caused by the movement of the observer, such as UAV or aircraft, these methods cannot be applied to aerial images. Therefore, to eliminate trees as candidate moving objects, we developed a logical operation that considers displacement.
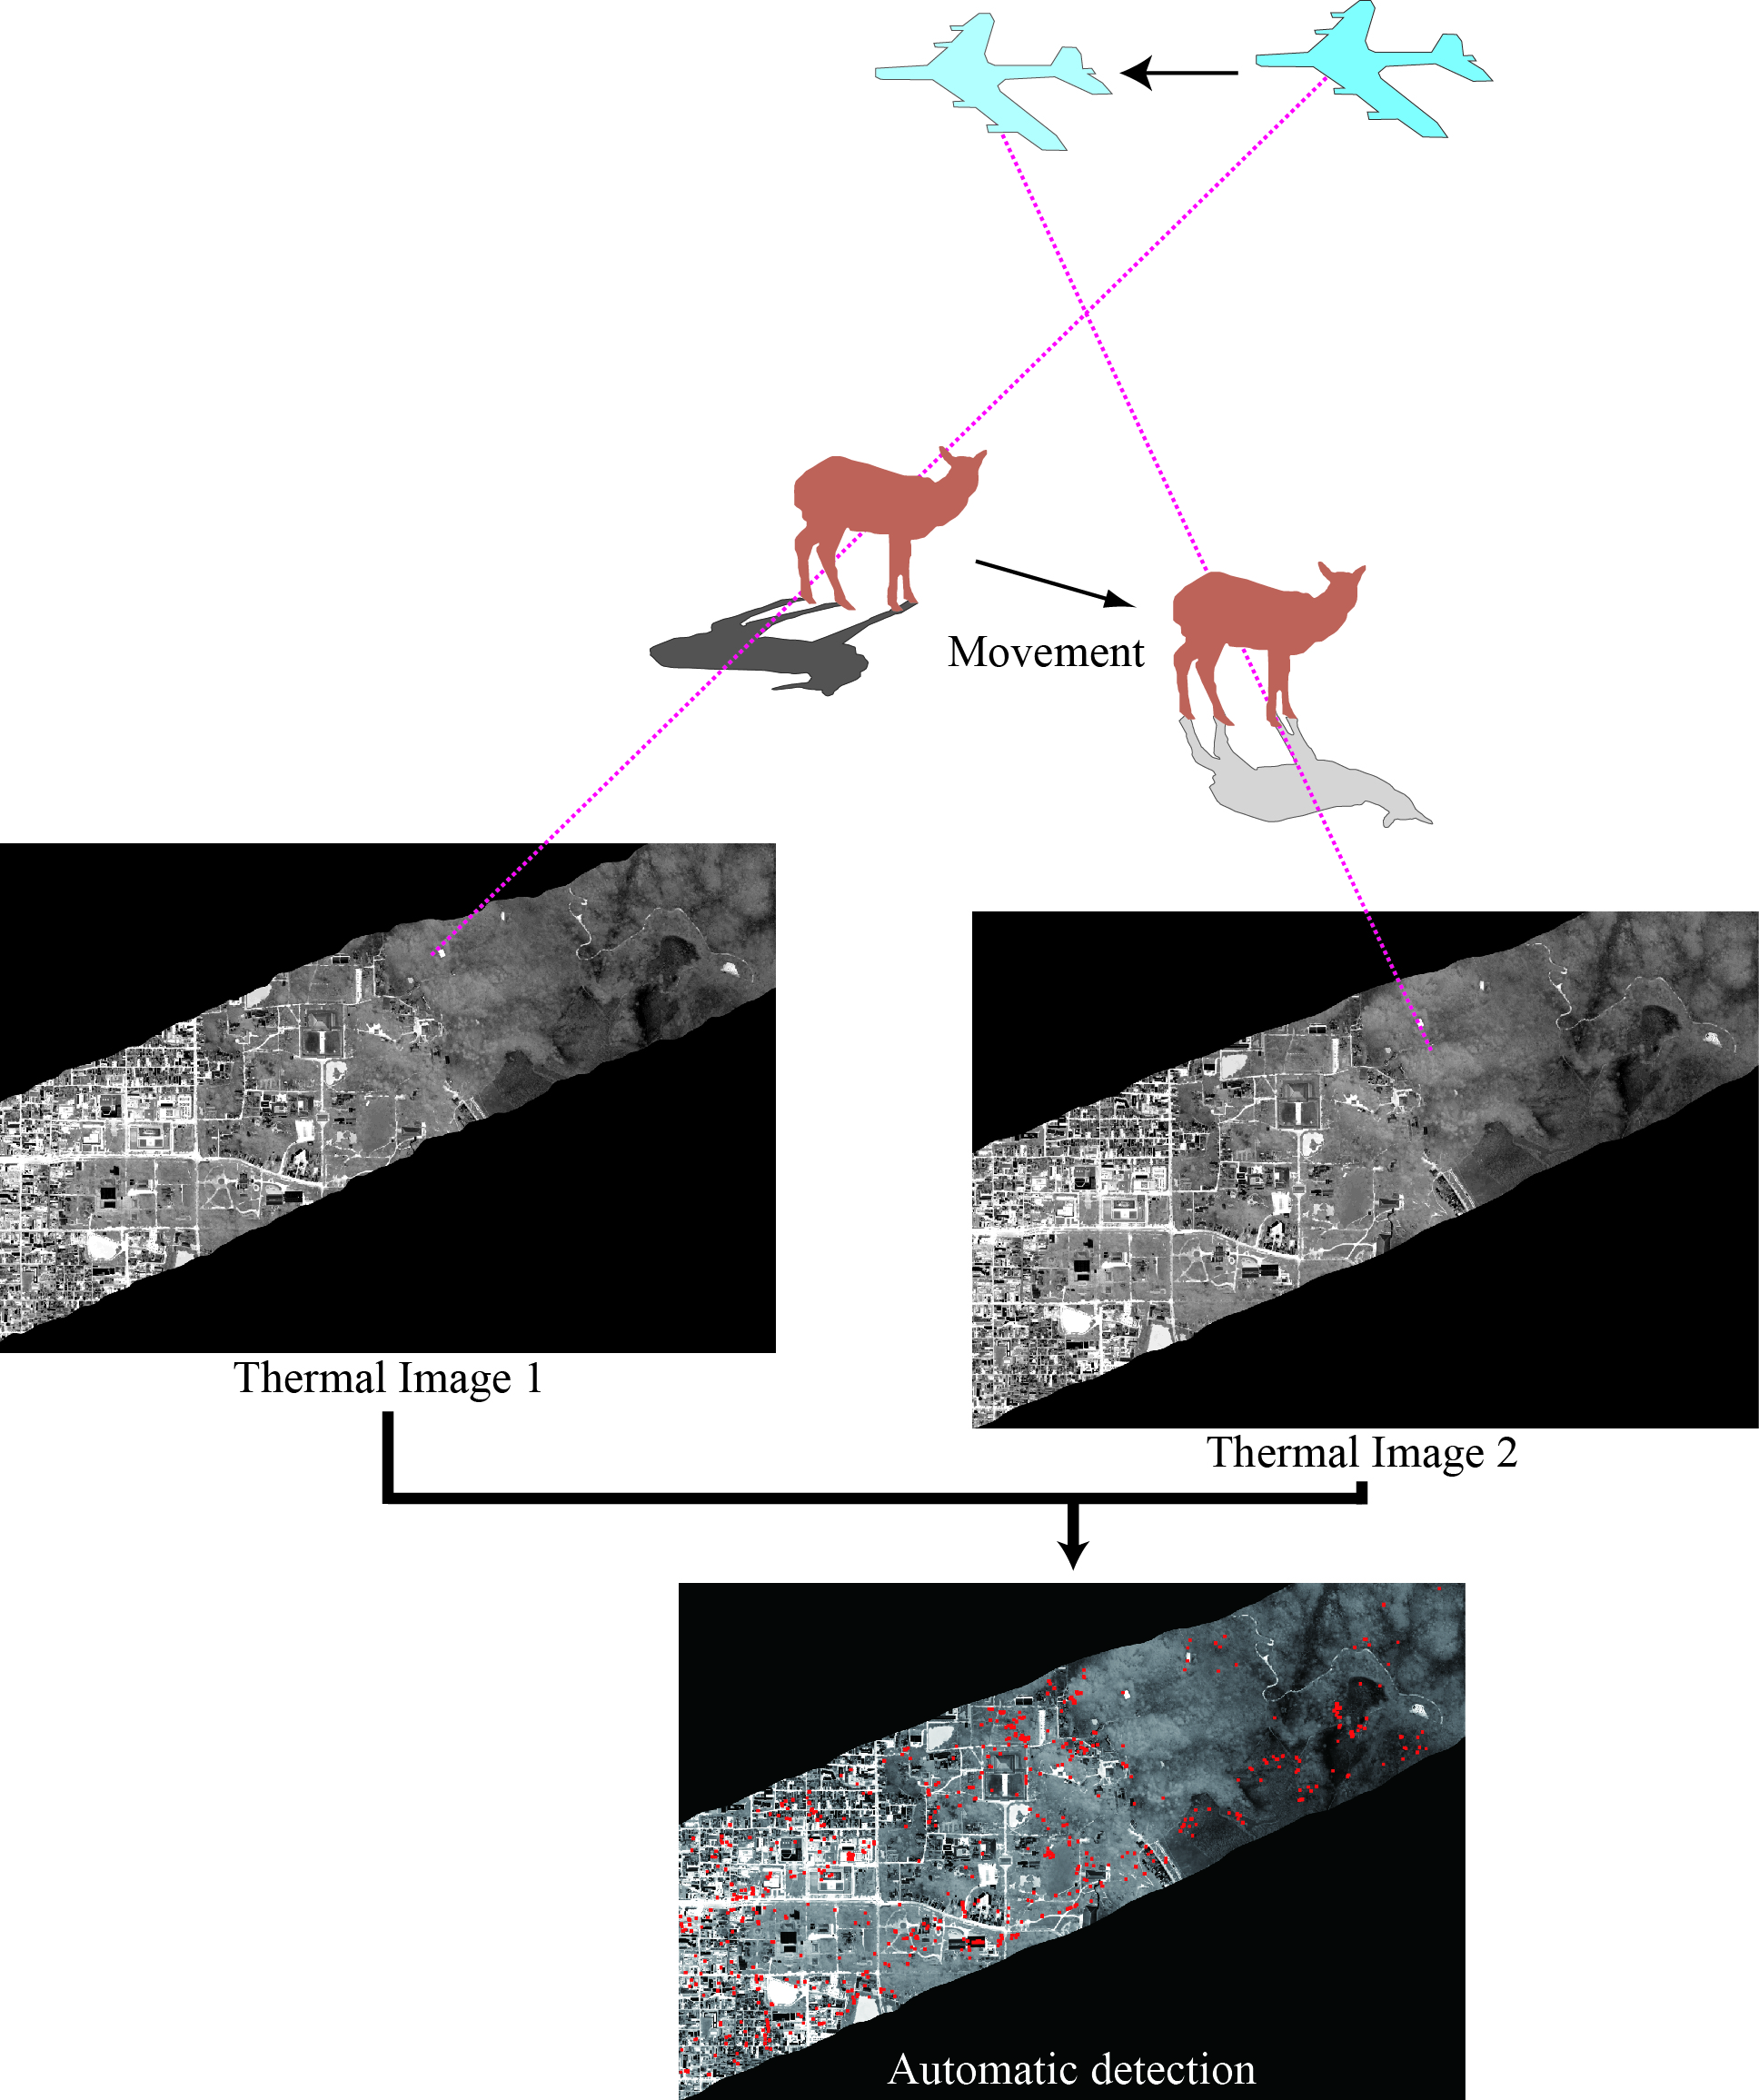
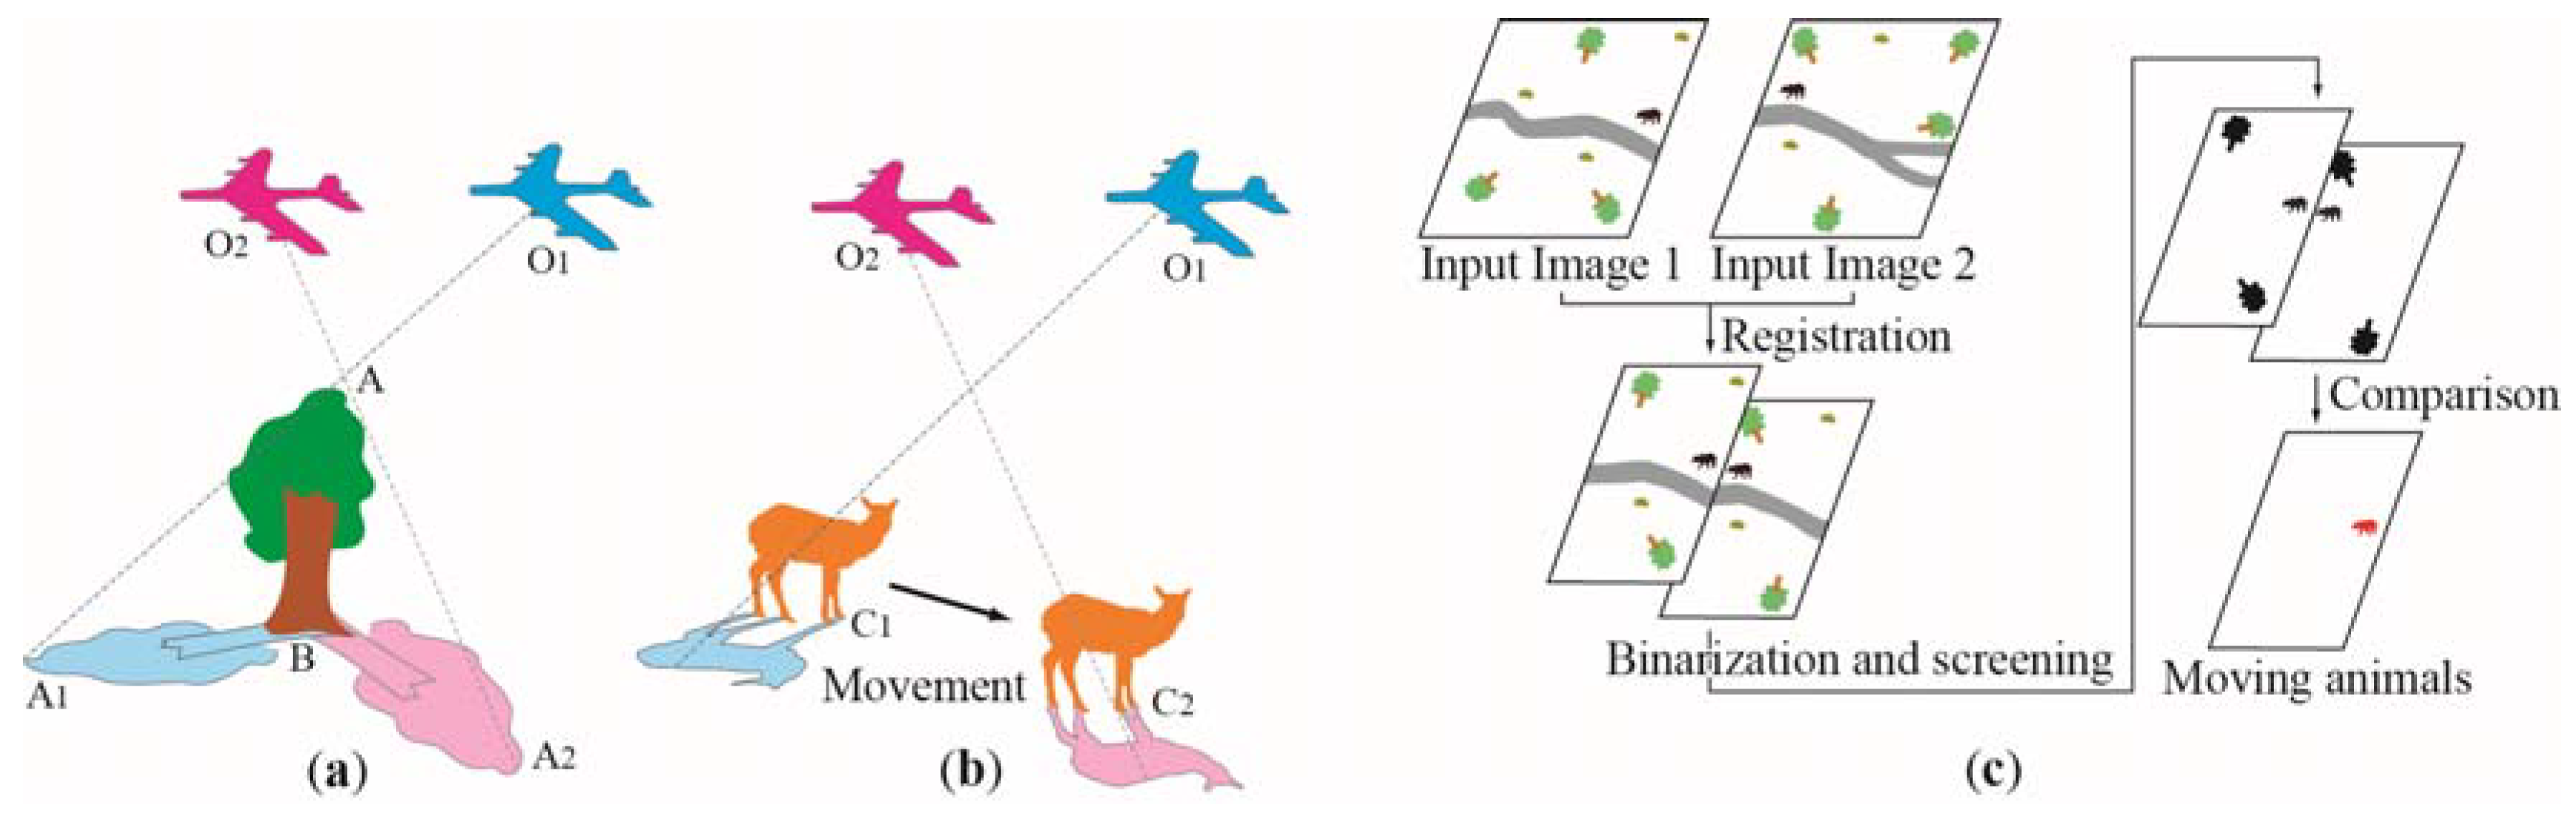
Figure 5 shows the relief displacement effects and the outline of the DWA algorithm. The top of a tree (A) is observed at different positions (A1 and A2) in overlapping images due to the movement of the observer. This is referred to as the relief displacement effect. However, the base of the tree (B) does not move. In the case of a moving animal, the toes of the animal (C1 and C2) appear at different positions. If part of a candidate-object overlaps in different images, then this candidate is rejected; the object is not a moving object. This is a simple, but highly effective method [8].
2.6. Application of the Method to Thermal Images
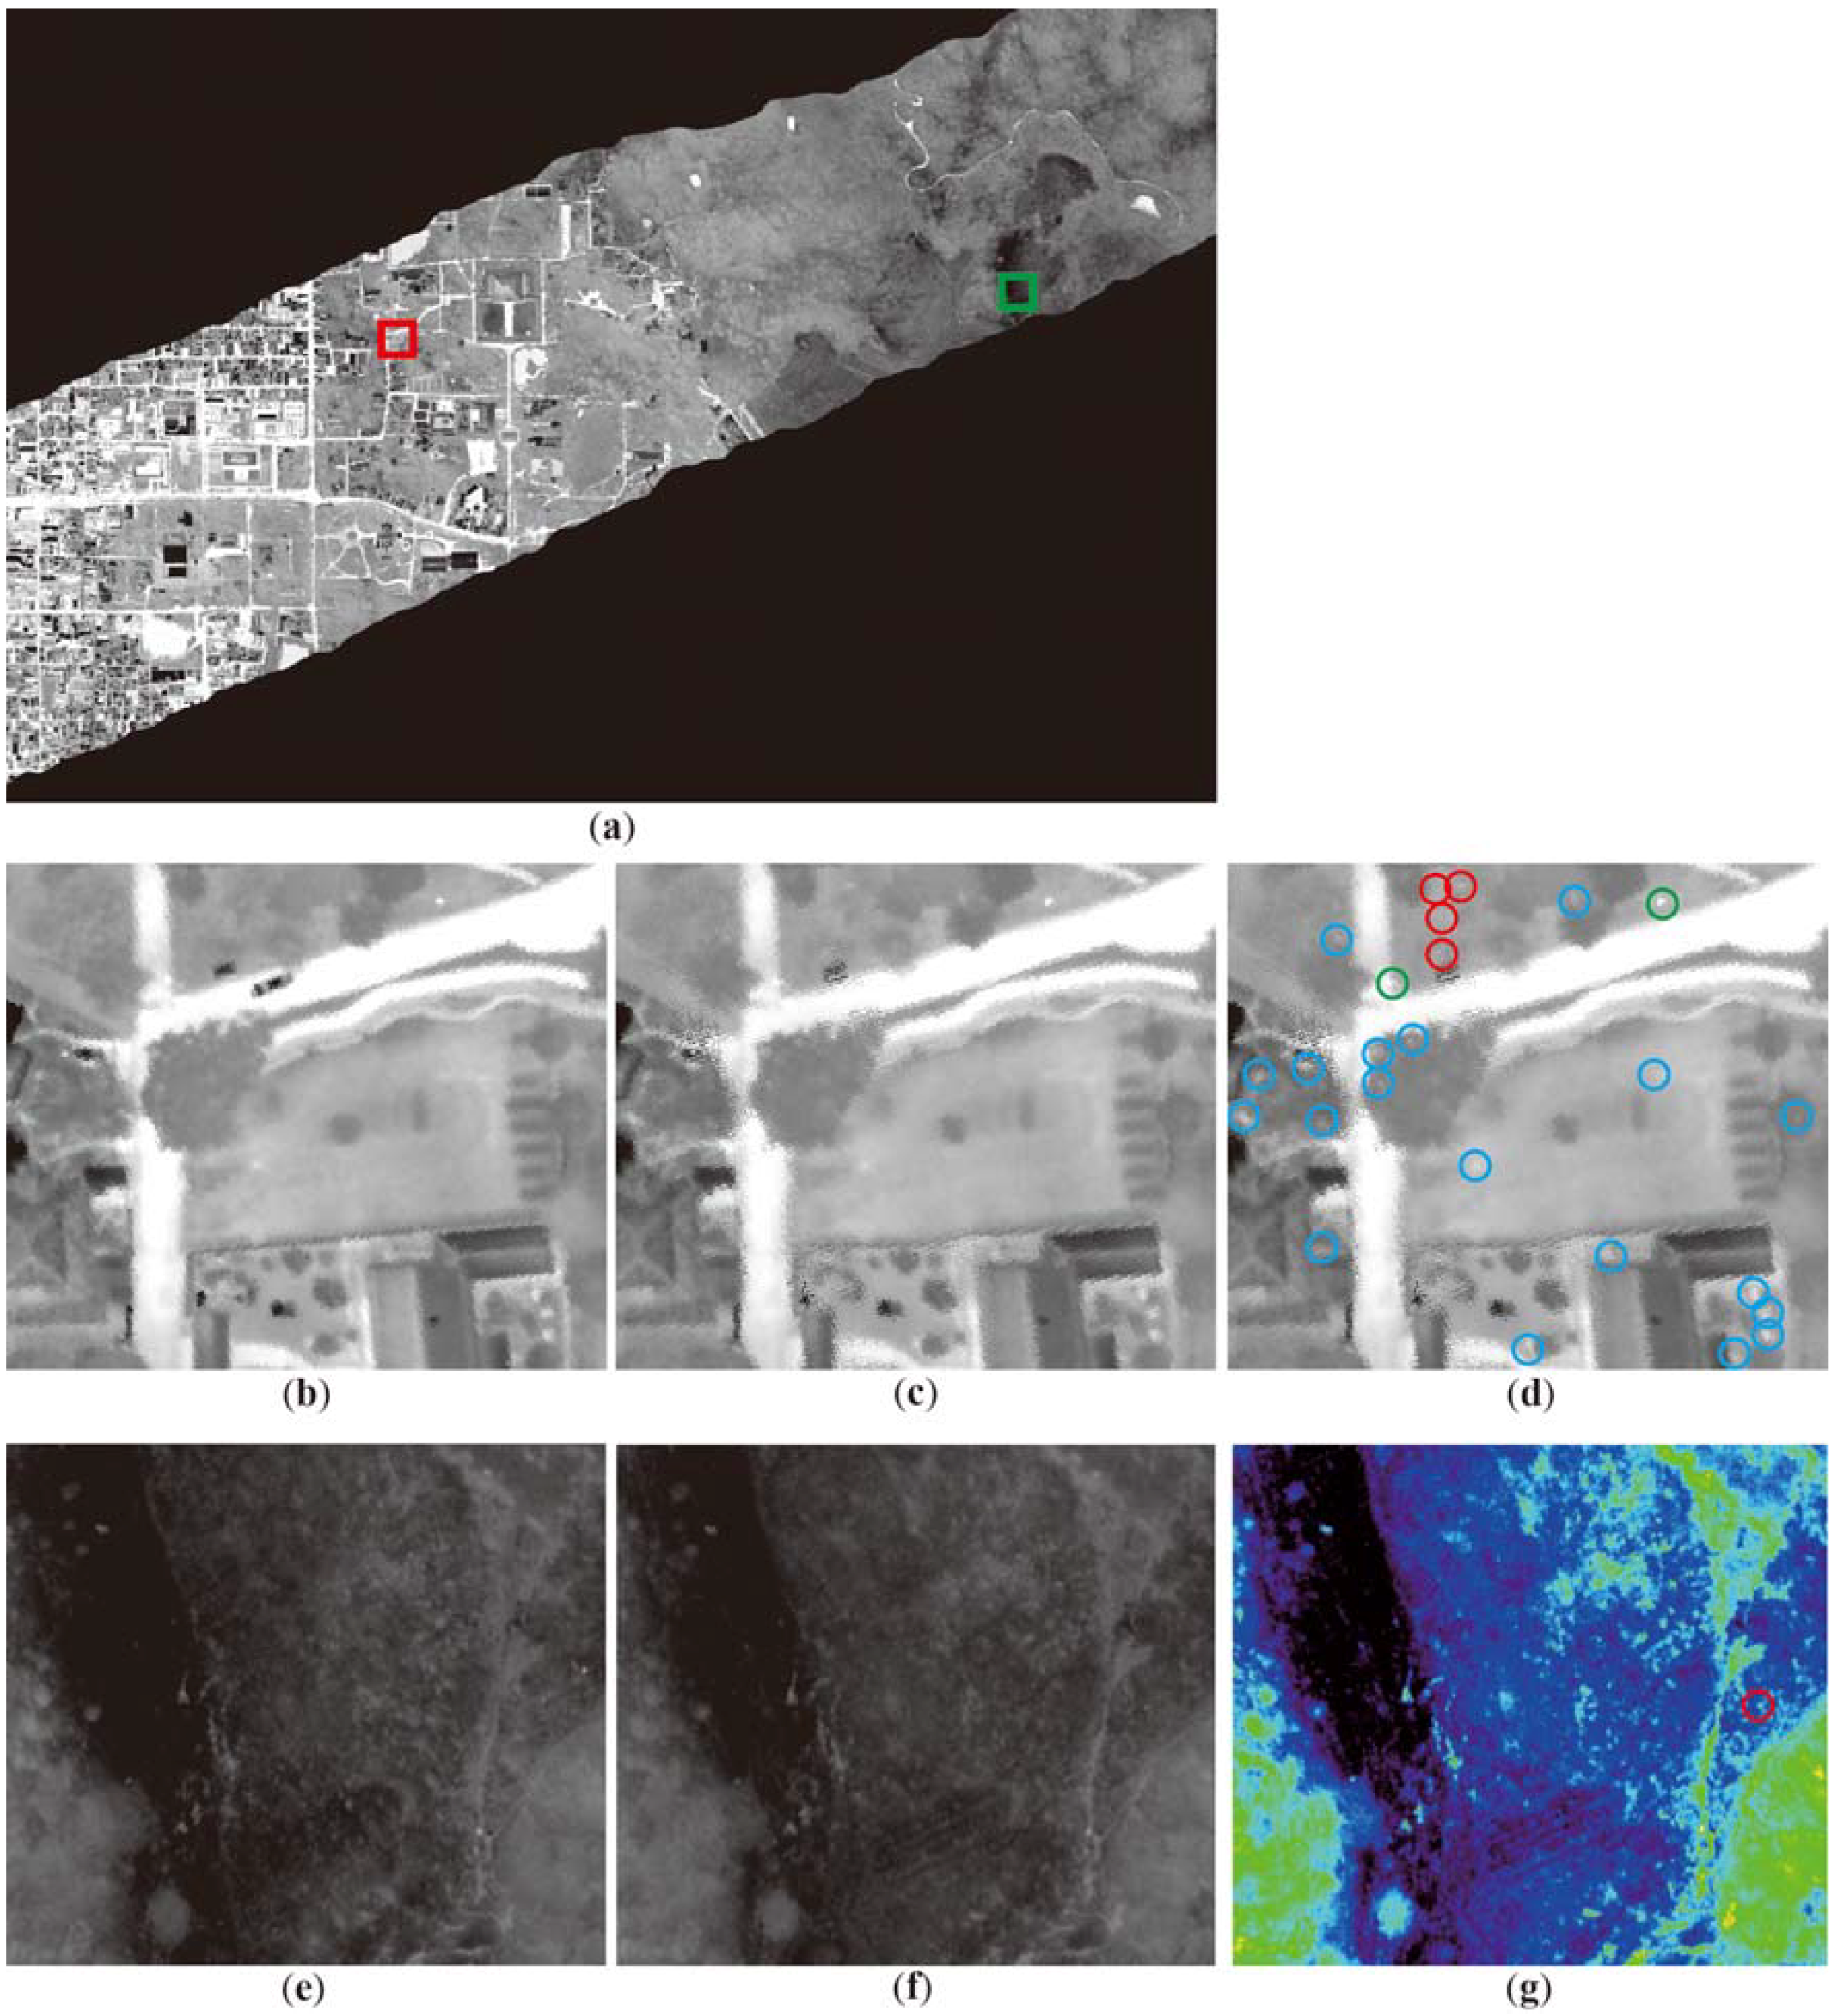
Figure 6 shows examples of thermal images and their corresponding images for comparison. It is impossible to identify wild animals only using a single thermal image because there are several kinds of hot objects and many local hot spots. Therefore, we must extract hot moving objects using the gap in a pair of thermal images obtained at different time points.
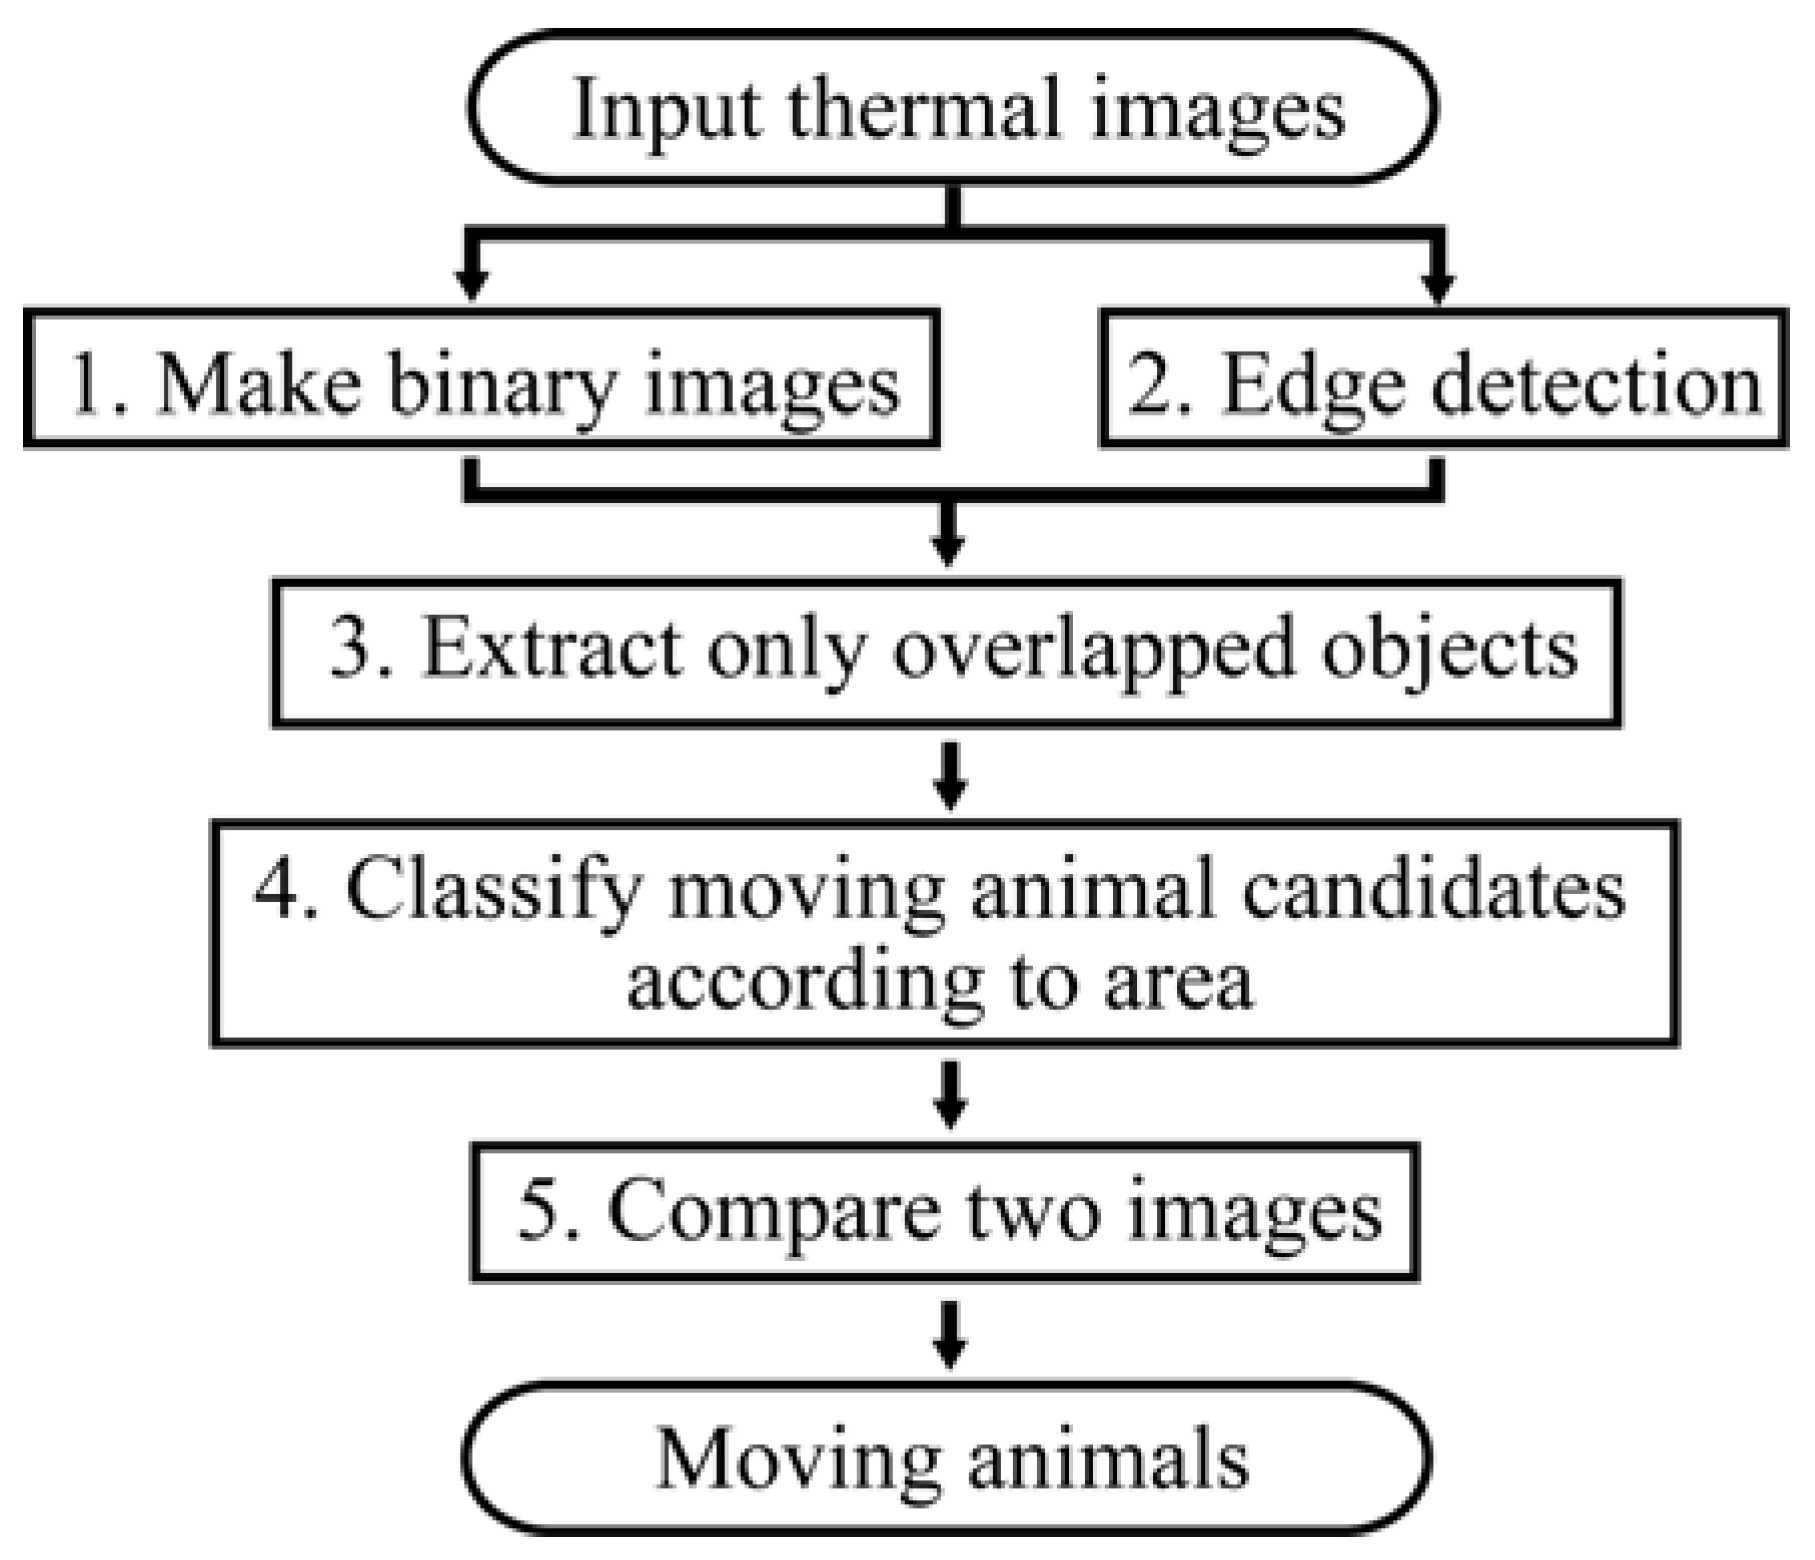
Figure 7 shows the flowchart of moving animal detection from thermal remote sensing images. The method can be used to extract moving sika deer in the thermal images as follows:
- Make binary imagesInitially, binary images are constructed using the Laplacian histogram method [16] with a moving window function, the P-tile method [17], and the Otsu method [18] to extract objects whose surface temperature is higher than the surrounding temperature. The binarization is performed only for pixels in the possible surface temperature range of sika deer. In this study, we set thresholds surface temperature range of 15.0–20.0 °C based on the previous study that showed the surface temperature range of sika deer in the airborne thermal images was 17.0–18.0 °C [14].
- Edge detectionAlthough the surface temperatures in many regions are higher than the surrounding temperature, the curve of the change in surface temperature is typically gentle. However, the contours of sika deer are more distinct. Therefore, edge detection using the Laplacian filter is performed.
- Extract only overlapping objectsTo integrate the results of (1) and (2), we extract only objects that overlap between (1) and (2).
- Classify moving animal candidates according to areaWe reject the extracted objects which are different size from target objects in the thermal images, such as cars, artifacts, and human. In this study, we set thresholds size range of 3–25 pixels because the pixel resolution of the airborne thermal images (40 cm and 50 cm) and head and body length of sika deer is 90–190 cm [6].
- Compare two imagesIf part of a candidate object overlaps in different images or the surface temperature of the candidate object is almost equal for the same pixels in different images, then this candidate is rejected, and the object is not considered a moving object. In this study, we set a threshold surface temperature gap of 0 °C. Furthermore, we changed the threshold surface temperature gap from 0 to 0.5, according to the gap in the average surface temperatures in each image.
3. Results
3.1. Applicability Results
We applied the DWA algorithm to wild ducks swimming in the river in thermal images to confirm whether the algorithm automatically extracts moving wild animals in thermal images. Figure 8 shows that the algorithm successfully extracted two wild ducks.
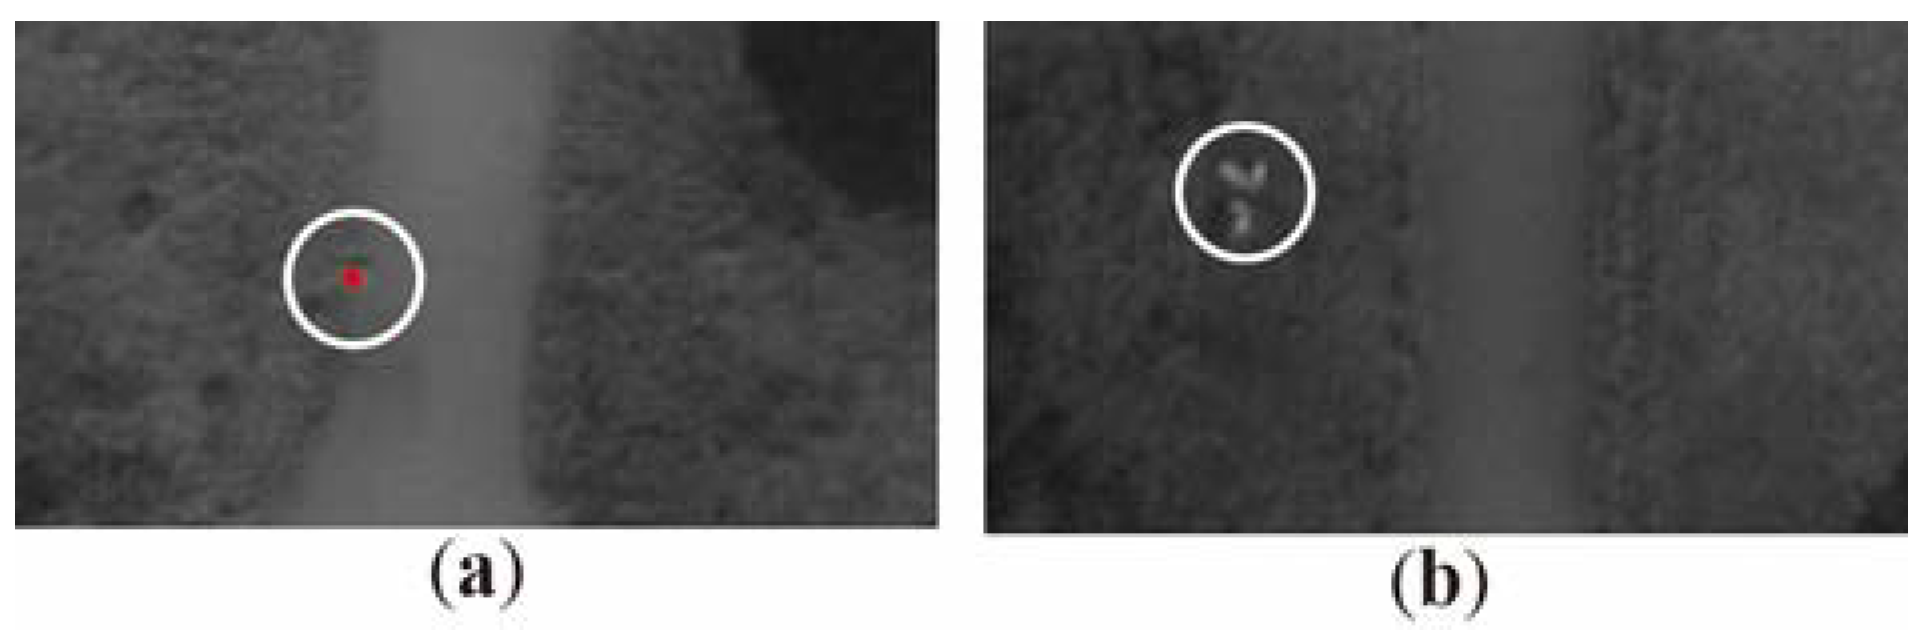
Next, we performed a UAV experiment using two pairs of thermal images obtained by two shooting plans. Figure 9 shows the input images and Figure 10 shows the results. We were able to automatically extract a walking human in the area of overlap in a pair of thermal images by applying the algorithm (Figure 10a), and the algorithm did not extract a human and a dog that changed their poses but did not move (Figure 10b).
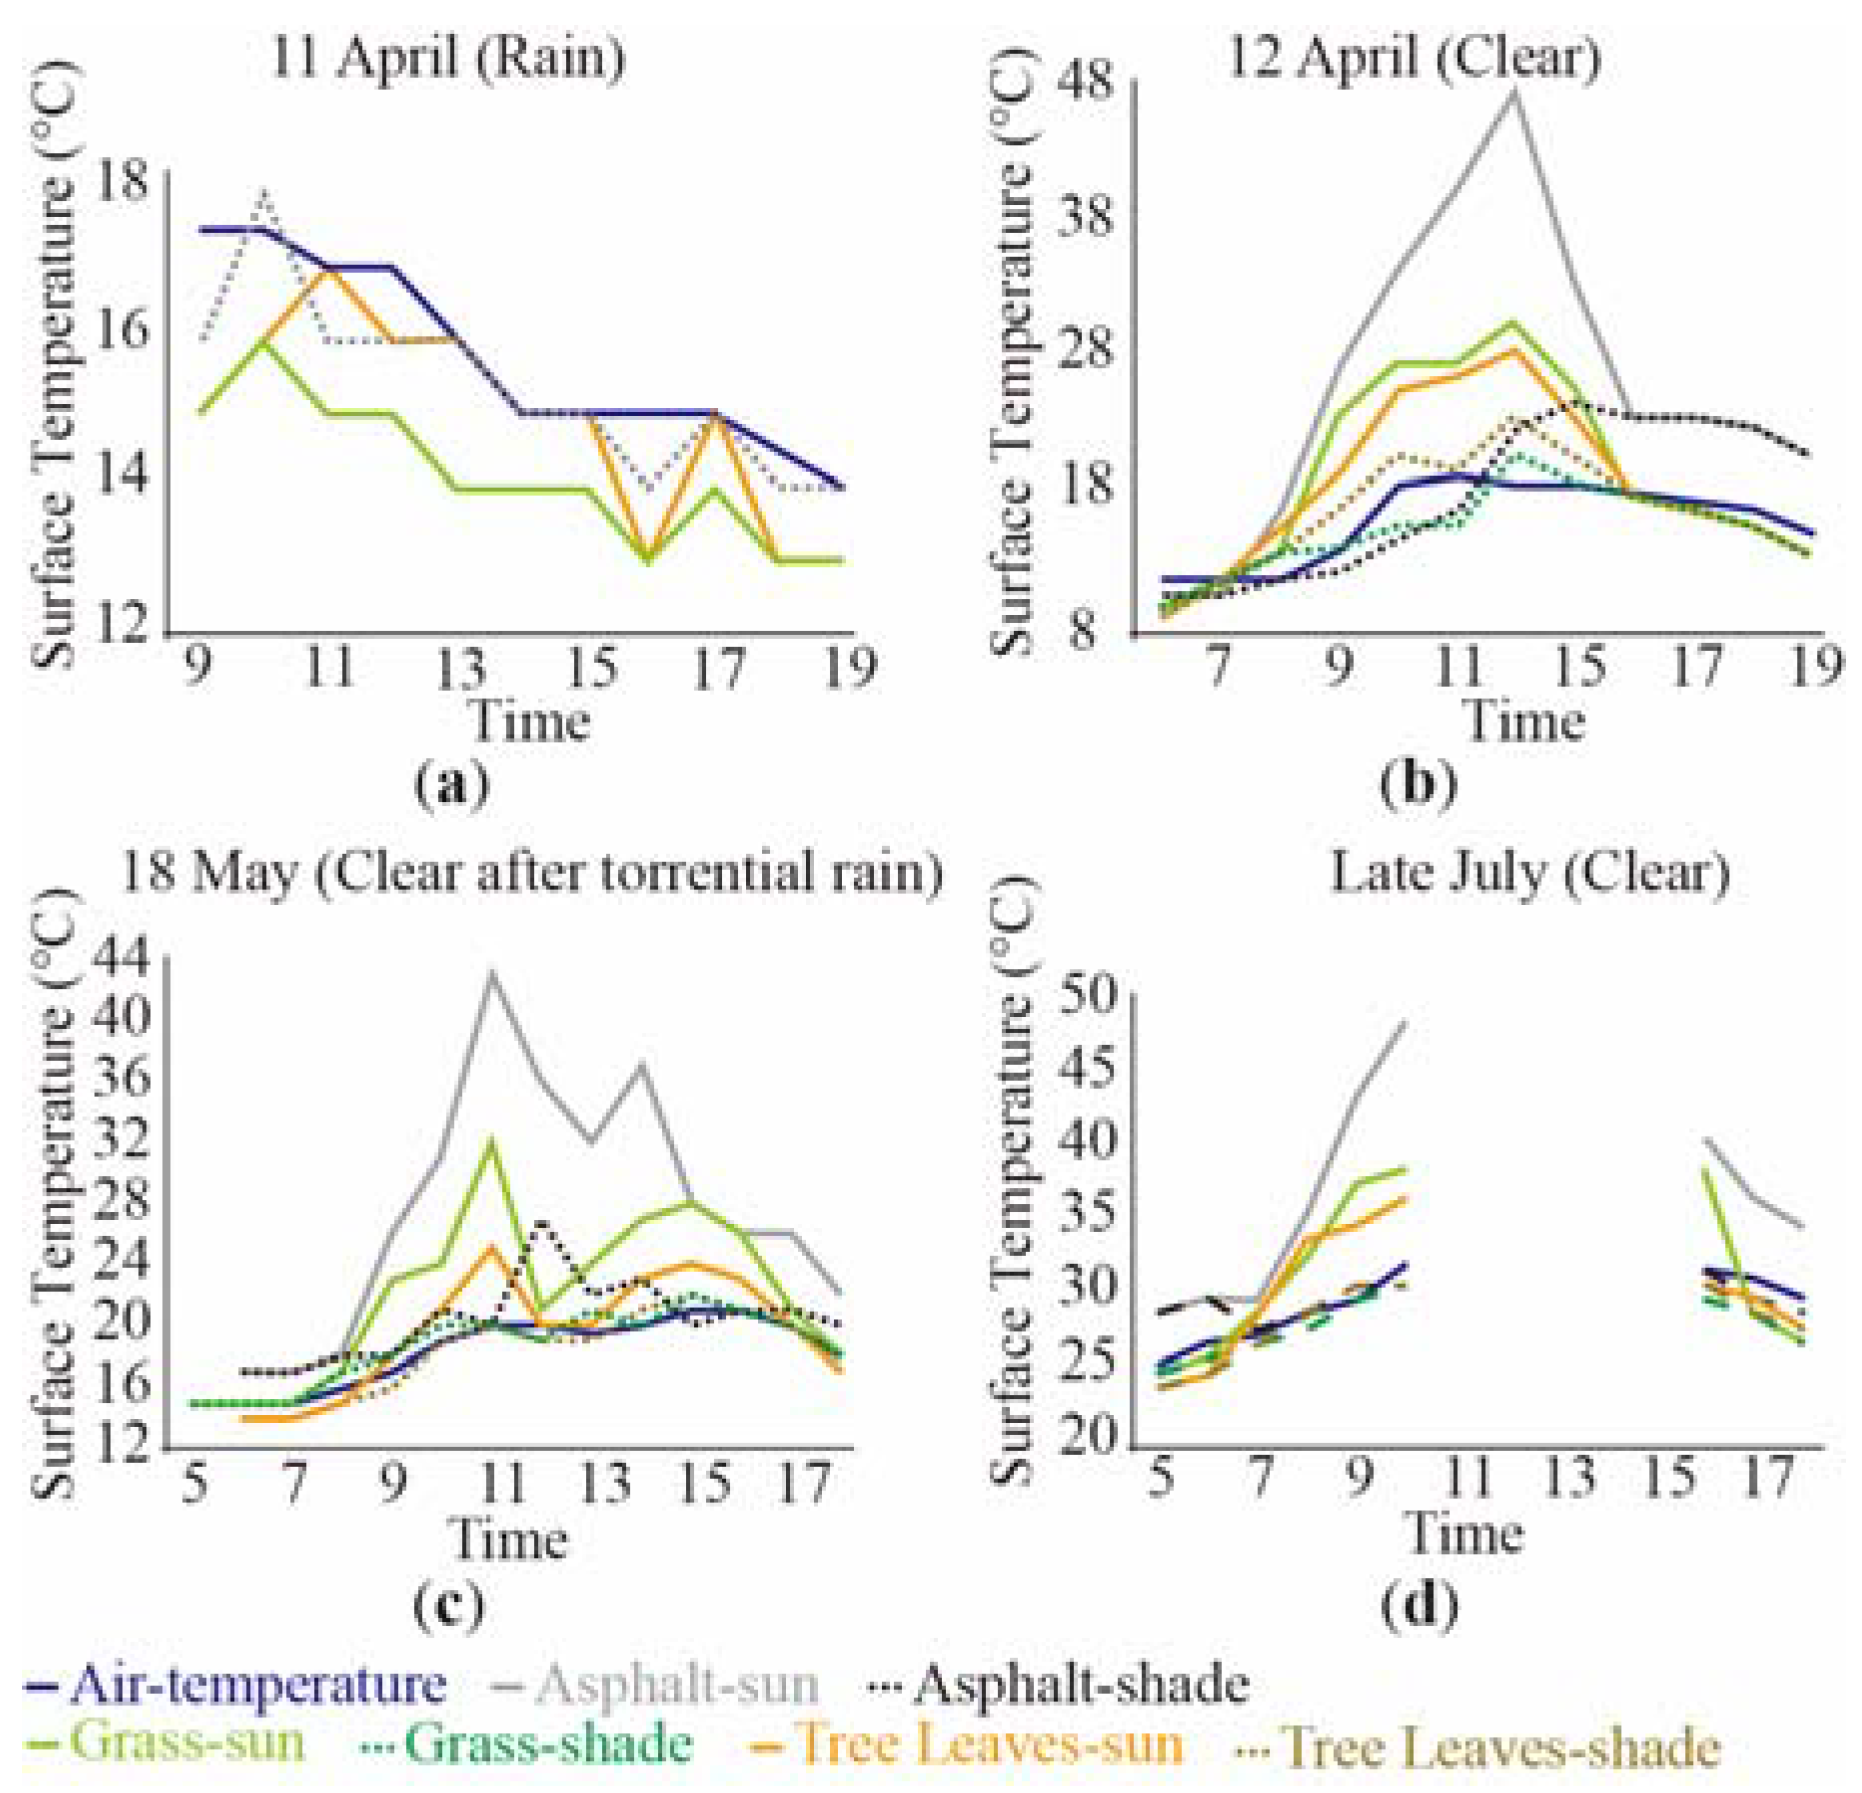
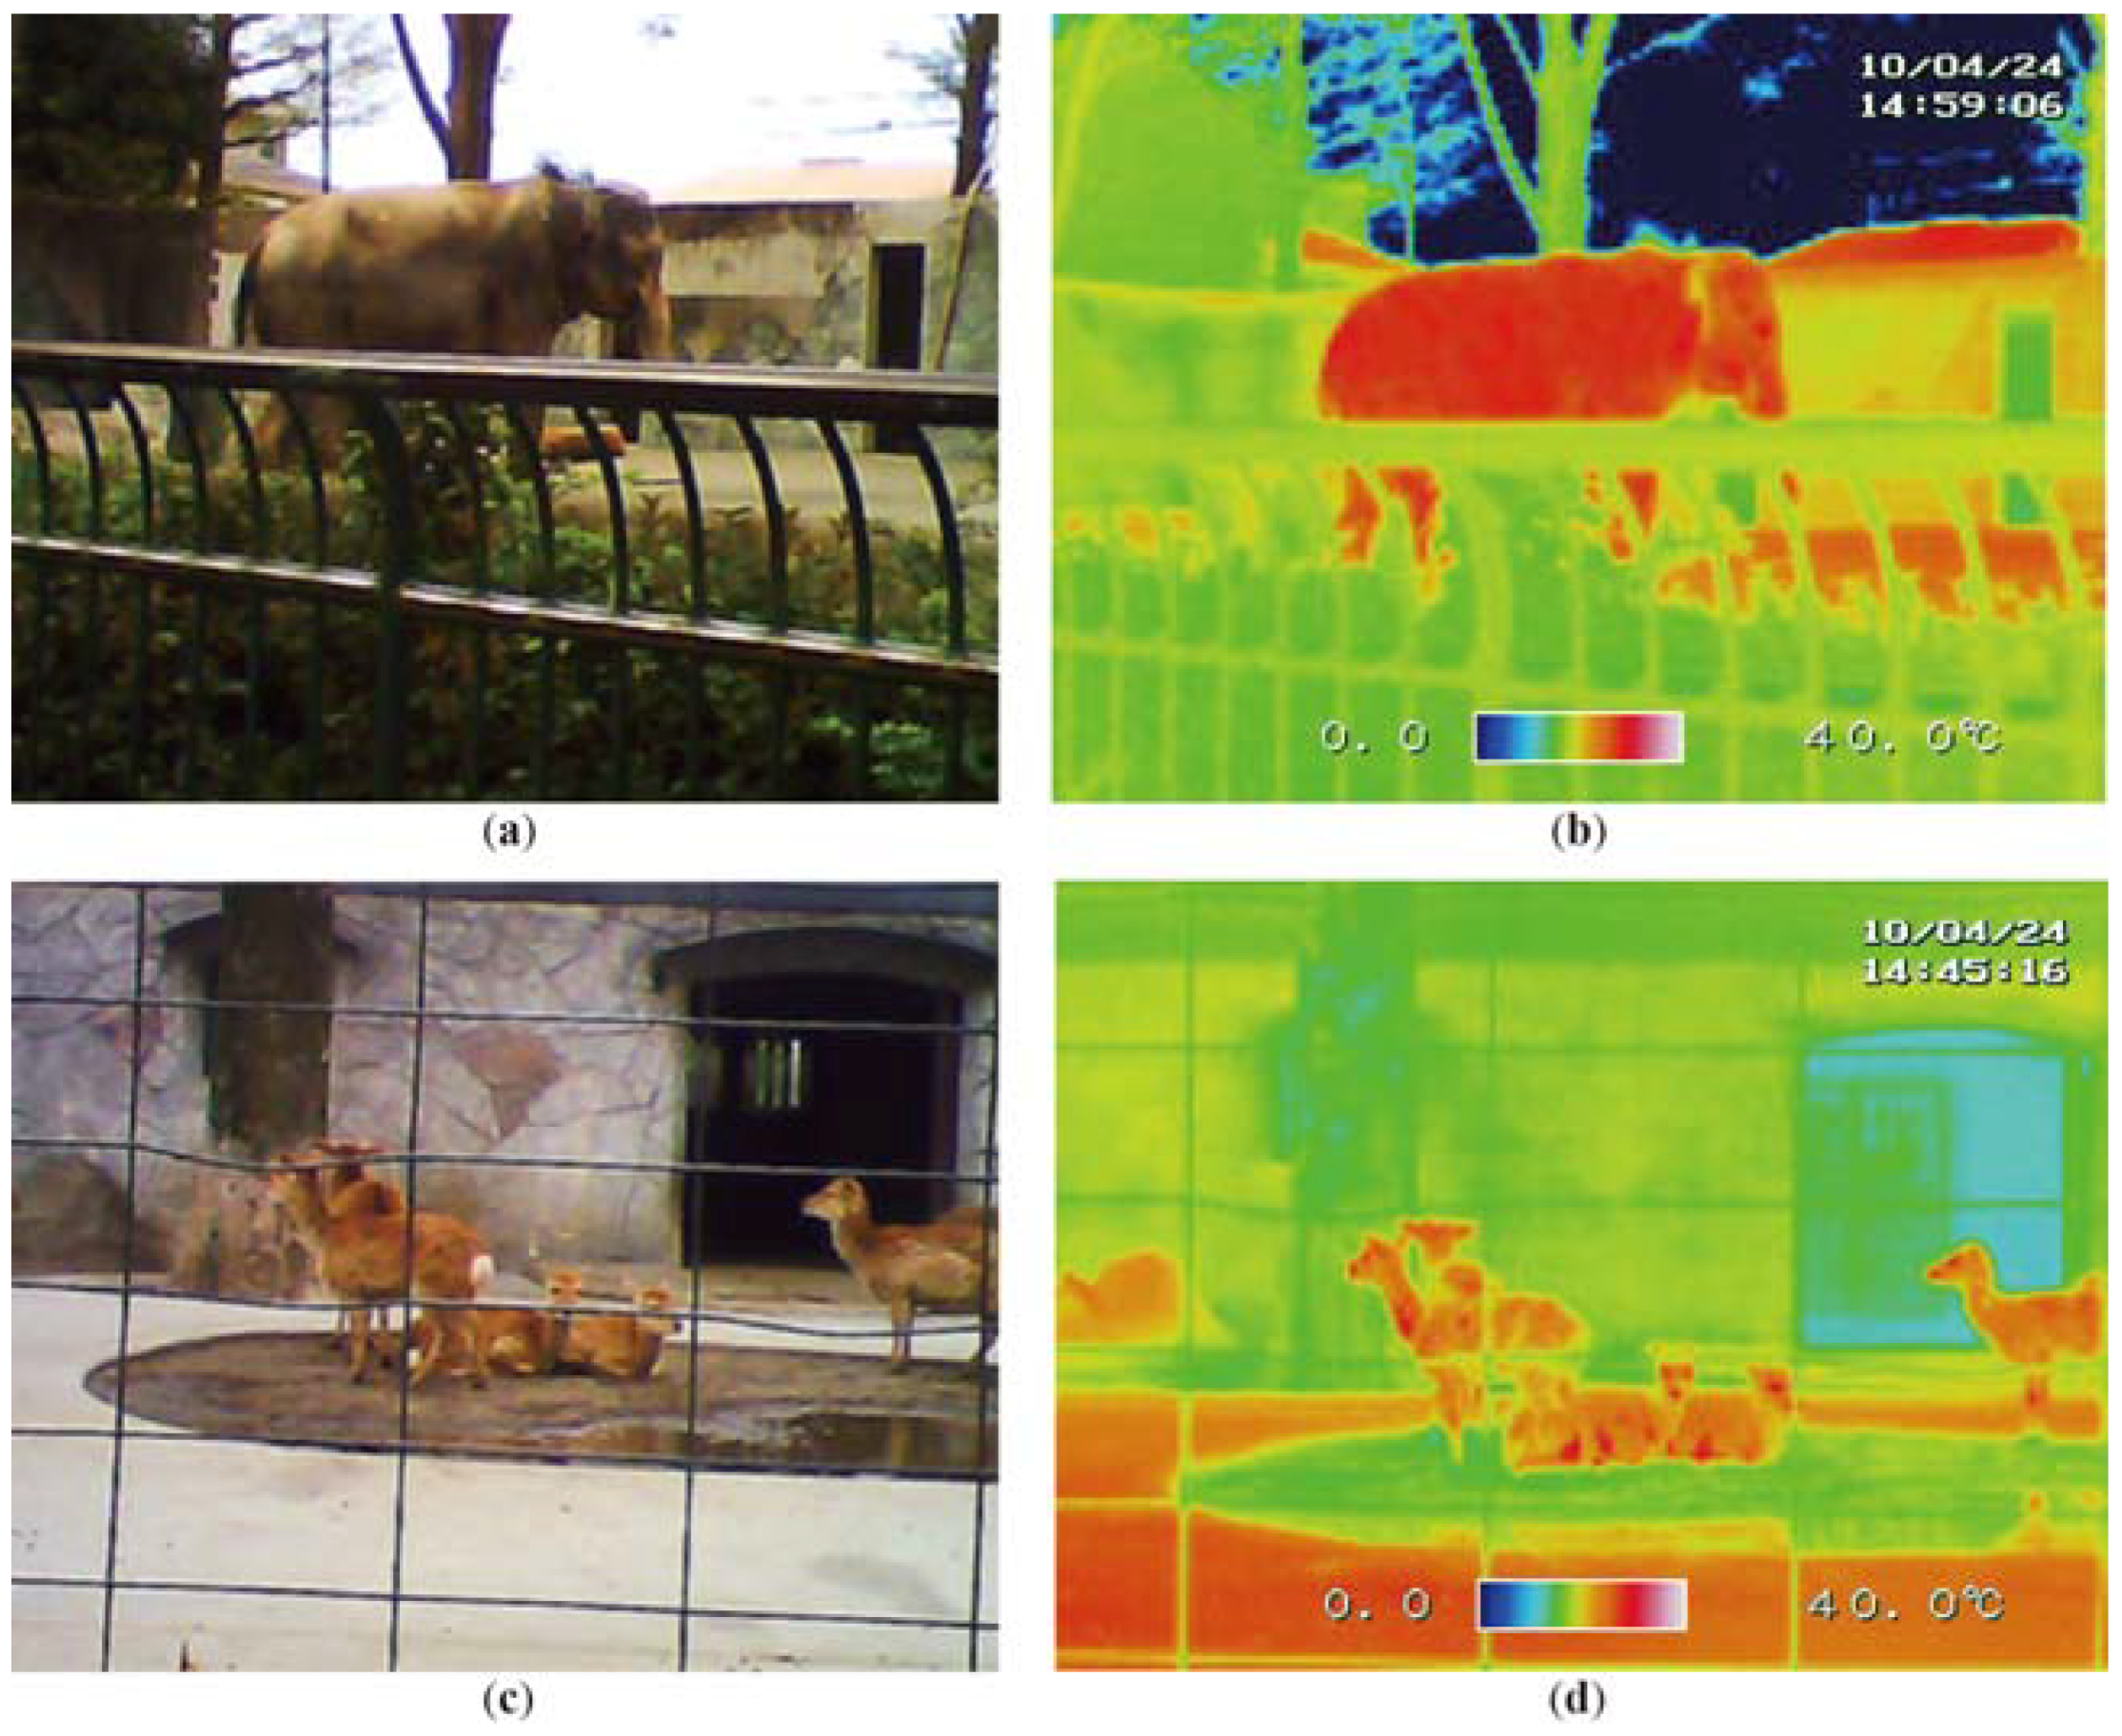
In this experimental case, it was easy to distinguish the detection target from the background because the surface temperatures of understory plants and tree leaves were lower than those of a human and a dog. However, thermal contrast might be small depending on the observation conditions. We examined difficult cases for the application of thermal images by measuring the surface temperature of objects as background using a radiation thermometer. Figure 11a shows data obtained on a rainy spring day. The surface temperature of the human is approximately 25 °C. Animals can be identified in thermal images throughout the day. Figure 11b,c show data obtained on two clear spring days. On both days, the surface temperature of the human is over 25 °C. In these cases, animals can be identified in thermal images in the morning or evening. Figure 11d shows data obtained on a summer day. The surface temperature of the human was approximately 35 °C in the early morning and over 40 °C at 10:00 h. Animals can be identified in thermal images only in the morning. Figure 12 shows visible and thermal images of an elephant and deer at Inokashira Park Zoo in Tokyo, Japan. The surface temperature of the elephant is higher than that of the deer. Since animals covered with their hair can suppress heat radiation, their surface temperature, which is close to the outside air temperature, is lower than their body temperature (Figure 12d). However even in the deer the surface temperature of eyes and nose was higher than that of other body parts (Figure 12d).
3.2. Airborne Examination Results
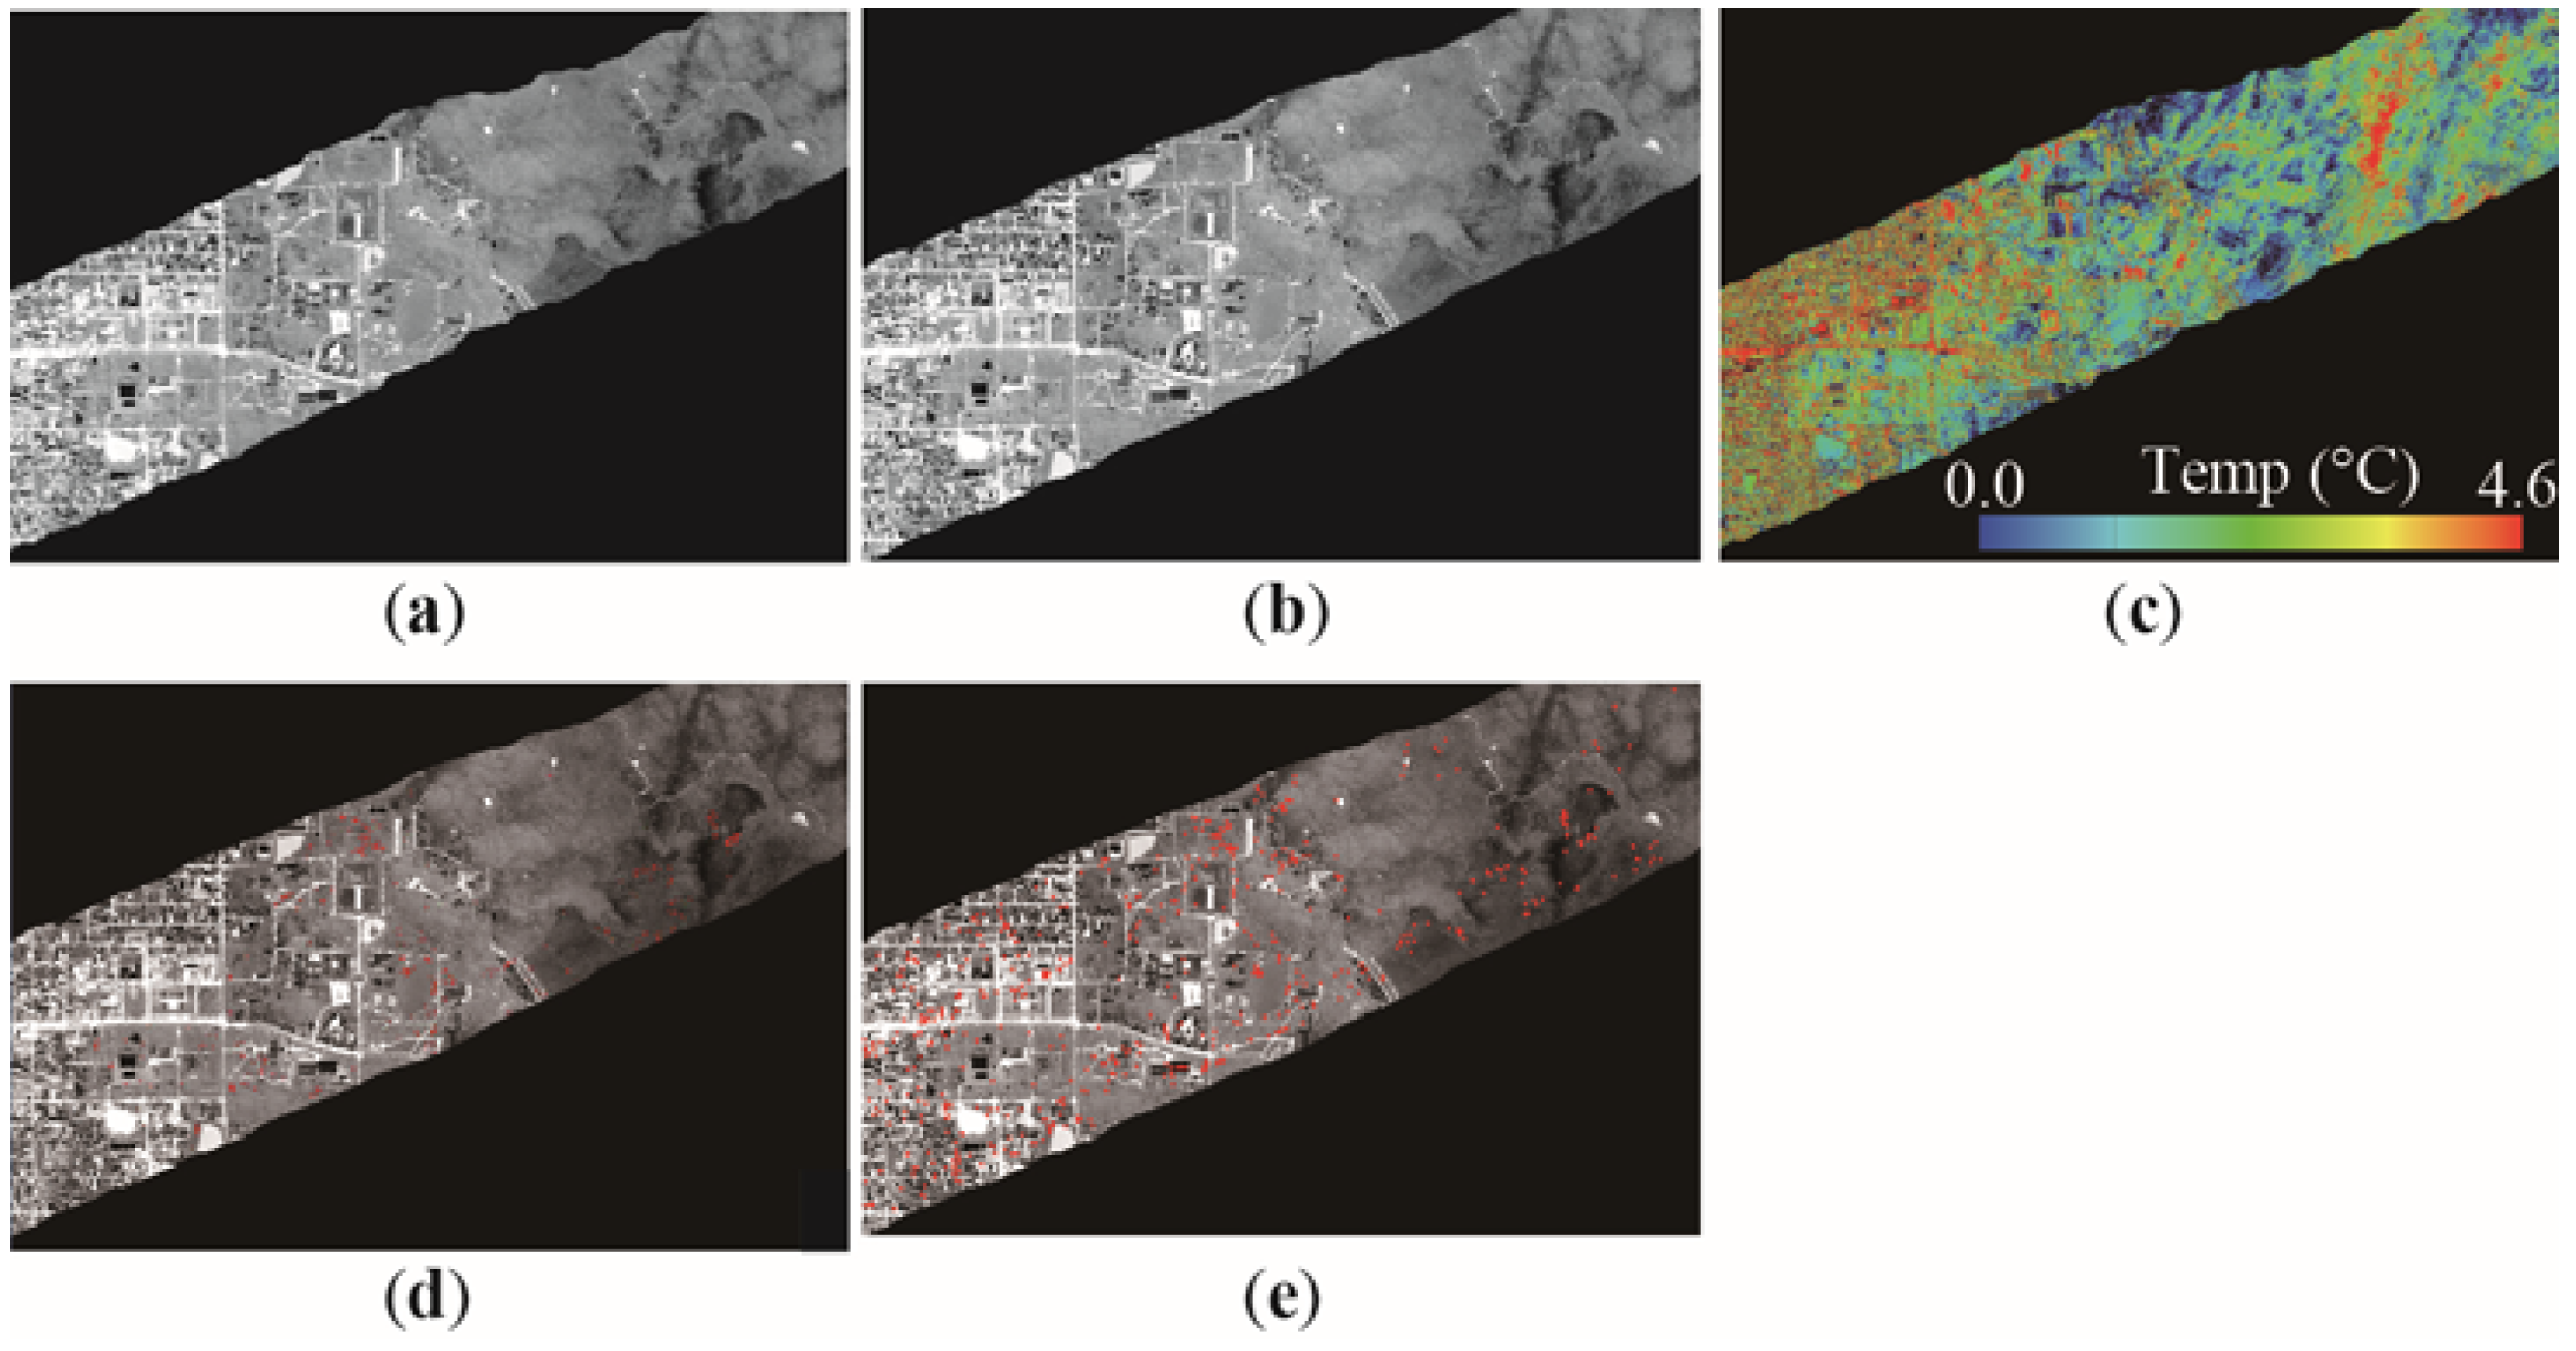
We applied the proposed method to four pairs of airborne thermal images (Figure 13a,b), and then compared the processed results with results obtained by visual inspection by an expert (Figure 13d). Figure 13e shows an extracted result obtained by the proposed method. Red dots represent the extracted results as moving animal candidates. The producer’s accuracies, which correspond to the error of omission, were 75.3%, 77.5%, 78.8%, and 77.7%. Moreover, we confirmed the extracted objects by the proposed method for a pair of thermal images (Table 1). The user’s accuracy, which corresponds to the error of commission, was 29.3%. Additionally, we found 24 moving objects that were not identified by visual inspection by an expert. These oversights were mainly explained by the threshold surface temperature gap being too restrictive for the comparison between two images. There were many cases in which objects were distinguishable by only the expert. The main causes of detection errors were noise, aberrant positions, and local hot spots.
Furthermore, we changed the threshold surface temperature gap from 0 to 0.5, according to the gap in the average surface temperatures in each image (Figure 12) because there are tradeoffs in maximizing accuracy while minimizing oversight and overestimate. In this analysis, the producer’s accuracy was 84.2%, but the user’s accuracy was 3.4%.
4. Discussion
In this section we discuss the required observation conditions for monitoring animal population changes using thermal remote sensing images through issues and methods for improving detection.
The main causes of overabundances were noise, aberrant positions, and local hot spots. This indicates that some pre-processing for noise reduction is necessary. There are two potential explanations for the aberration of a position, registration errors of two images and the relief displacement effect. With respect to registration errors, the addition of pre-processing may be useful. The direction of relief displacement is determined by the geometry between a sensor position and a target position. However, to determine the distance of relief displacement, height information for the target is necessary. Thus, there is almost no case in which distance can be determined from only thermal images. This is particularly difficult for objects such as streetlights, for which only the top is hot; although streetlights were rejected by their surface temperature, over 20 °C, in this study. Therefore, a major area for improvement is to use the same observation geometry to obtain both images. The overabundances, which include local hot spots, are related to oversights caused by a threshold surface temperature gap in comparing two images. To solve this problem, it is necessary to optimize thresholds and perform additional processing.
The factors that determine the extraction of moving wild animals from remote sensing images have been discussed previously [8]. These previous analyses indicated the importance of the following factors:
- The spatial resolution must be finer than one-fifth of the body length of the target species to automatically extract targets from remote sensing images.
- Objects under tree crowns do not appear in aerial images. The possibility of extracting moving wild animals decreases as the area of tree crowns in an image increases.Although a correction of the number of extracted moving wild animals using the proportion of forest is necessary for population estimates, the correction is not necessary to grasp the population change by using the number of extracted animals as a population index.
- Wild animals exhibit well-defined activity patterns, such as sleeping, foraging, migration, feeding, and resting. To extract moving wild animals, the target species should be moving when the survey is conducted.
- When shooting intervals are too long, targets can move out of the area of overlap between two images. In contrast, when shooting intervals are too short, targets cannot be extracted because the movement distance in a given interval must be longer than the body length. Thus, shooting intervals are decided after a survey of the movement speed of the target species in observation period.
The pixel resolution of airborne thermal images in this study (40 cm and 50 cm) was rather low because the head and body length of sika deer show striking variation, at 90–190 cm [6]. Meanwhile, approximately one-third of sika deer were not moving. Thus, we should reconsider the best time for obtaining images. Moreover, we must consider another factor, radiative cooling, when determining shooting intervals. The surface temperature of animals covered with hair differs from the air temperature because the hair isolates the external heat. Although the gap in the surface temperature between sika deer and the background temperature was not large, the shooting intervals cause a thermal gap between two images by radiative cooling. Furthermore, conductivity is related to thermal conductivity, which differs according to materials (Figure 12c). Therefore, we firmly recommend that shooting be performed in the predawn hours or early morning. The proposed method in consideration of these is potentially capable to extract moving wild animals in thermal remote sensing images to monitor animal population changes.
In the image recognition field, some related studies were presented [19,20]. These studies about saliency detection method for thermal images. It is considered that these methods are useful to extract moving animal candidates from thermal images in open areas not like Figure 6. Meanwhile, the latter study applies steering kernel regression [21], which is a robust method to random noise in a thermal image. In the future, we will try to use the image texture to screen the noise because we were able to judge noise using the image texture based on visual inspection; and apply the steering kernel regression. Furthermore, some existing studies use deep learning methods for saliency detection [22]. Therefore, we will try to use machine learning methods, including deep learning, to resolve these issues and achieve quasi-real-time processing. Nakanihon Air Service Co., Ltd. (Aichi, Japan) operates a combination system, which consists of a hyper spectral sensor, a thermal sensor, a Light Detection and Ranging (LiDAR), and an RGB camera. In the future, we will consider data fusion in the morning because CAST can obtain these data and images simultaneously. We might be able to detect no-moving animals by data fusion of thermal images and LiDAR data. Data acquisition of animal spectra is carried out by our team at the National Institute of Advanced Industrial Science and Technology in collaboration with Ueno Zoological Gardens for the purpose of discriminating animal species; hence, we also consider the use of hyperspectral data.
5. Conclusions
In this study, we applied an existing algorithm, the DWA algorithm, to thermal airborne remote sensing images. We found that the producer’s accuracy of the method was approximately 77.3% and the user’s accuracy of the method was approximately 29.3%. This means that the proposed method can reduce the person-hours required to survey moving wild animals from large numbers of thermal remote sensing images. Furthermore, we confirmed the extracted sika deer candidates in a pair of images and found 24 moving objects that were not identified by visual inspection by an expert. Therefore, the proposed method can also reduce oversights when identifying moving wild animals. The detection accuracy is expected to increase by setting suitable observation conditions for surveying moving wild animals. Accordingly, we also discuss the required observation conditions. The discussions about the required observation conditions would be extremely useful for people to monitor animal population changes using thermal remote sensing images. The factors that determine the extraction of moving wild animals from thermal remote sensing images are the following:
- Using the same observation geometry to obtain pairs of thermal images.
- The spatial resolution must be finer than one-fifth of the body length of the target species.
- Wild animals exhibit well-defined activity patterns, such as sleeping, foraging, migration, feeding, and resting. To extract moving wild animals, the target species should be moving when the survey is conducted.
- When shooting intervals are too long, targets can move out of the area of overlap between two images. In contrast, when shooting intervals are too short, targets cannot be extracted because the movement distance in a given interval must be longer than the body length. Thus, shooting intervals are decided after a survey of the movement speed of the target species in observation period.
- The shooting intervals cause a thermal gap between two images by radiative cooling. Furthermore, conductivity is related to thermal conductivity, which differs according to materials. Therefore, we firmly recommend that shooting be performed in the early morning.
The proposed method in consideration of these is potentially capable to extract moving wild animals in thermal remote sensing images to monitor animal population changes.
Author Contributions
Y.O., H.O., R.N. and T.M. conceived and designed the studies; Y.O. and H.O. performed applicable evaluation; A.T. took airborne imagery and performed visual inspection for airborne imagery; Y.O. performed evaluations, analyzed the results, and wrote the paper.
Funding
This research is based on results obtained from a project commissioned by the New Energy and Industrial Technology Development Organization (NEDO), Japan.
Acknowledgments
This research is based on results obtained from a project commissioned by the New Energy and Industrial Technology Development Organization (2017). The authors would like to thank Information & Science Techno-System Co., Ltd., Y. Watabe, K. Sakurai, A. Kamei, and S. Kato for help obtaining thermal images using Grass HOPPER, and Nakanihon Air Service Co., Ltd. for providing airborne images.
Conflicts of Interest
The authors declare no conflict of interest. The founding sponsor had no role in the design of the study; in the collection, analyses, or interpretation of data; in the writing of the manuscript; or in the decision to publish the results.
References
- Oishi, Y. The use of remote sensing to reduce friction between human and wild animals and sustainably manage biodiversity. J. Remote Sens. Soc. Jpn. 2016, 36, 152–155, (In Japanese with English Abstract). [Google Scholar] [CrossRef]
- Watanabe, T.; Okuyama, M.; Fukamachi, K. A review of Japan’s environmental policies for Satoyama and Satoumi landscape restoration. Glob. Environ. Res. 2012, 16, 125–135. [Google Scholar]
- Annual Report on Food, Agriculture and Rural Area in Japan FY 2015. Available online: http://www.maff.go.jp/e/data/publish/attach/pdf/index-34.pdf (accessed on 17 August 2017).
- Adaptive Management. Available online: http://www2.usgs.gov/sdc/doc/DOI-Adaptive ManagementTechGuide.pdf (accessed on 21 August 2017).
- Lancia, R.A.; Braun, C.E.; Collopy, M.W.; Dueser, R.D.; Kie, J.G.; Martinka, C.J.; Nichols, J.D.; Nudds, T.D.; Porath, W.R.; Tilghman, N.G. ARM! For the future: Adaptive resource management in the wildlife profession. Wildl. Soc. Bull. 1996, 24, 436–442. [Google Scholar]
- Ohdachi, S.D.; Ishibashi, Y.; Iwasa, M.A.; Saito, T. The Wild Mammals of Japan; Shoukadoh Book Sellers: Kyoto, Japan, 2009; ISBN 9784879746269. [Google Scholar]
- Oishi, Y.; Matsunaga, T.; Nakasugi, O. Automatic detection of the tracks of wild animals in the snow in airborne remote sensing images and its use. J. Remote Sens. Soc. Jpn. 2010, 30, 19–30, (In Japanese with English Abstract). [Google Scholar] [CrossRef]
- Oishi, Y.; Matsunaga, T. Support system for surveying moving wild animals in the snow using aerial remote-sensing images. Int. J. Remote Sens. 2014, 35, 1374–1394. [Google Scholar] [CrossRef]
- Kissell, R.E., Jr.; Tappe, P.A. Assessment of thermal infrared detection rates using white-tailed deer surrogates. J. Ark. Acad. Sci. 2004, 58, 70–73. [Google Scholar]
- Chretien, L.; Theau, J.; Menard, P. Visible and Thermal Infrared Remote Sensing for the Detection of White-tailed Deer Using an Unmanned Aerial System. Wildl. Soc. Bull. 2016, 40, 181–191. [Google Scholar] [CrossRef]
- Christiansen, P.; Steen, K.A.; Jorgensen, R.N.; Karstoft, H. Automated detection and recognition of wildlife using thermal cameras. Sensors 2014, 14, 13778–13793. [Google Scholar] [CrossRef] [PubMed]
- Terletzky, P.A.; Ramsey, R.D. Comparison of three techniques to identify and count individual animals in aerial imagery. J. Signal Inf. Process. 2016, 7, 123–135. [Google Scholar] [CrossRef]
- Maps and Geospatial Information. Available online: http://www.gsi.go.jp/kiban/index.html (accessed on 4 December 2017).
- Tamura, A.; Miyasaka, S.; Yoshida, N.; Unome, S. New approach of data acquisition by state of the art airborne sensor: Detection of wild animal by airborne thermal sensor system. J. Adv. Surv. Technol. 2016, 108, 38–49. (In Japanese) [Google Scholar]
- Steen, K.A.; Villa-Henriksen, A.; Therkildsen, O.R.; Green, O. Automatic detection of animals in mowing operations using thermal cameras. Sensors 2012, 12, 7587–7597. [Google Scholar] [CrossRef] [PubMed]
- Weszka, J.S.; Nagel, R.N.; Rosenfeld, A. A threshold selection technique. IEEE Trans. Comput. 1974, C-23, 1322–1326. [Google Scholar] [CrossRef]
- Doyle, W. Operation useful for similarity-invariant pattern recognition. J. Assoc. Comput. Mach. 1962, 9, 259–267. [Google Scholar] [CrossRef]
- Otsu, N. A threshold selection method from gray-level histograms. IEEE Trans. Syst. Man Cybern. 1979, SMC-9, 62–66. [Google Scholar] [CrossRef]
- Li, Y.; Zhang, Y.; Yu, J.; Tan, Y.; Tian, J.; Ma, J. A novel spatio-temporal saliency approach for robust dim moving target detection from airborne infrared image sequences. Inf. Sci. 2016, 369, 548–563. [Google Scholar] [CrossRef]
- Li, Y.; Zhang, Y. Robust infrared small target detection using local steering kernel reconstruction. Pattern Recognit. 2018, 77, 113–125. [Google Scholar] [CrossRef]
- Takeda, H.; Farsiu, S.; Milanfar, P. Kernel regression for image processing and reconstruction. IEEE Trans. Image Process. 2007, 16, 346–366. [Google Scholar] [CrossRef]
- Imamoglu, N.; Zhang, C.; Shimoda, W.; Fang, Y.; Shi, B. Saliency Detection by Forward and Backward Cues in Deep-CNN. In Proceedings of the Computer Vision and Pattern Recognition 2017, Honolulu, HI, USA, 21–26 July 2017. [Google Scholar]
Figure 1.
Study area of the unmanned air vehicle (UAV) experiment. (a) Photo of the area; (b) Land cover of the area.
Figure 1.
Study area of the unmanned air vehicle (UAV) experiment. (a) Photo of the area; (b) Land cover of the area.

Figure 2.
Photography instruments used for the UAV experiment.

Figure 3.
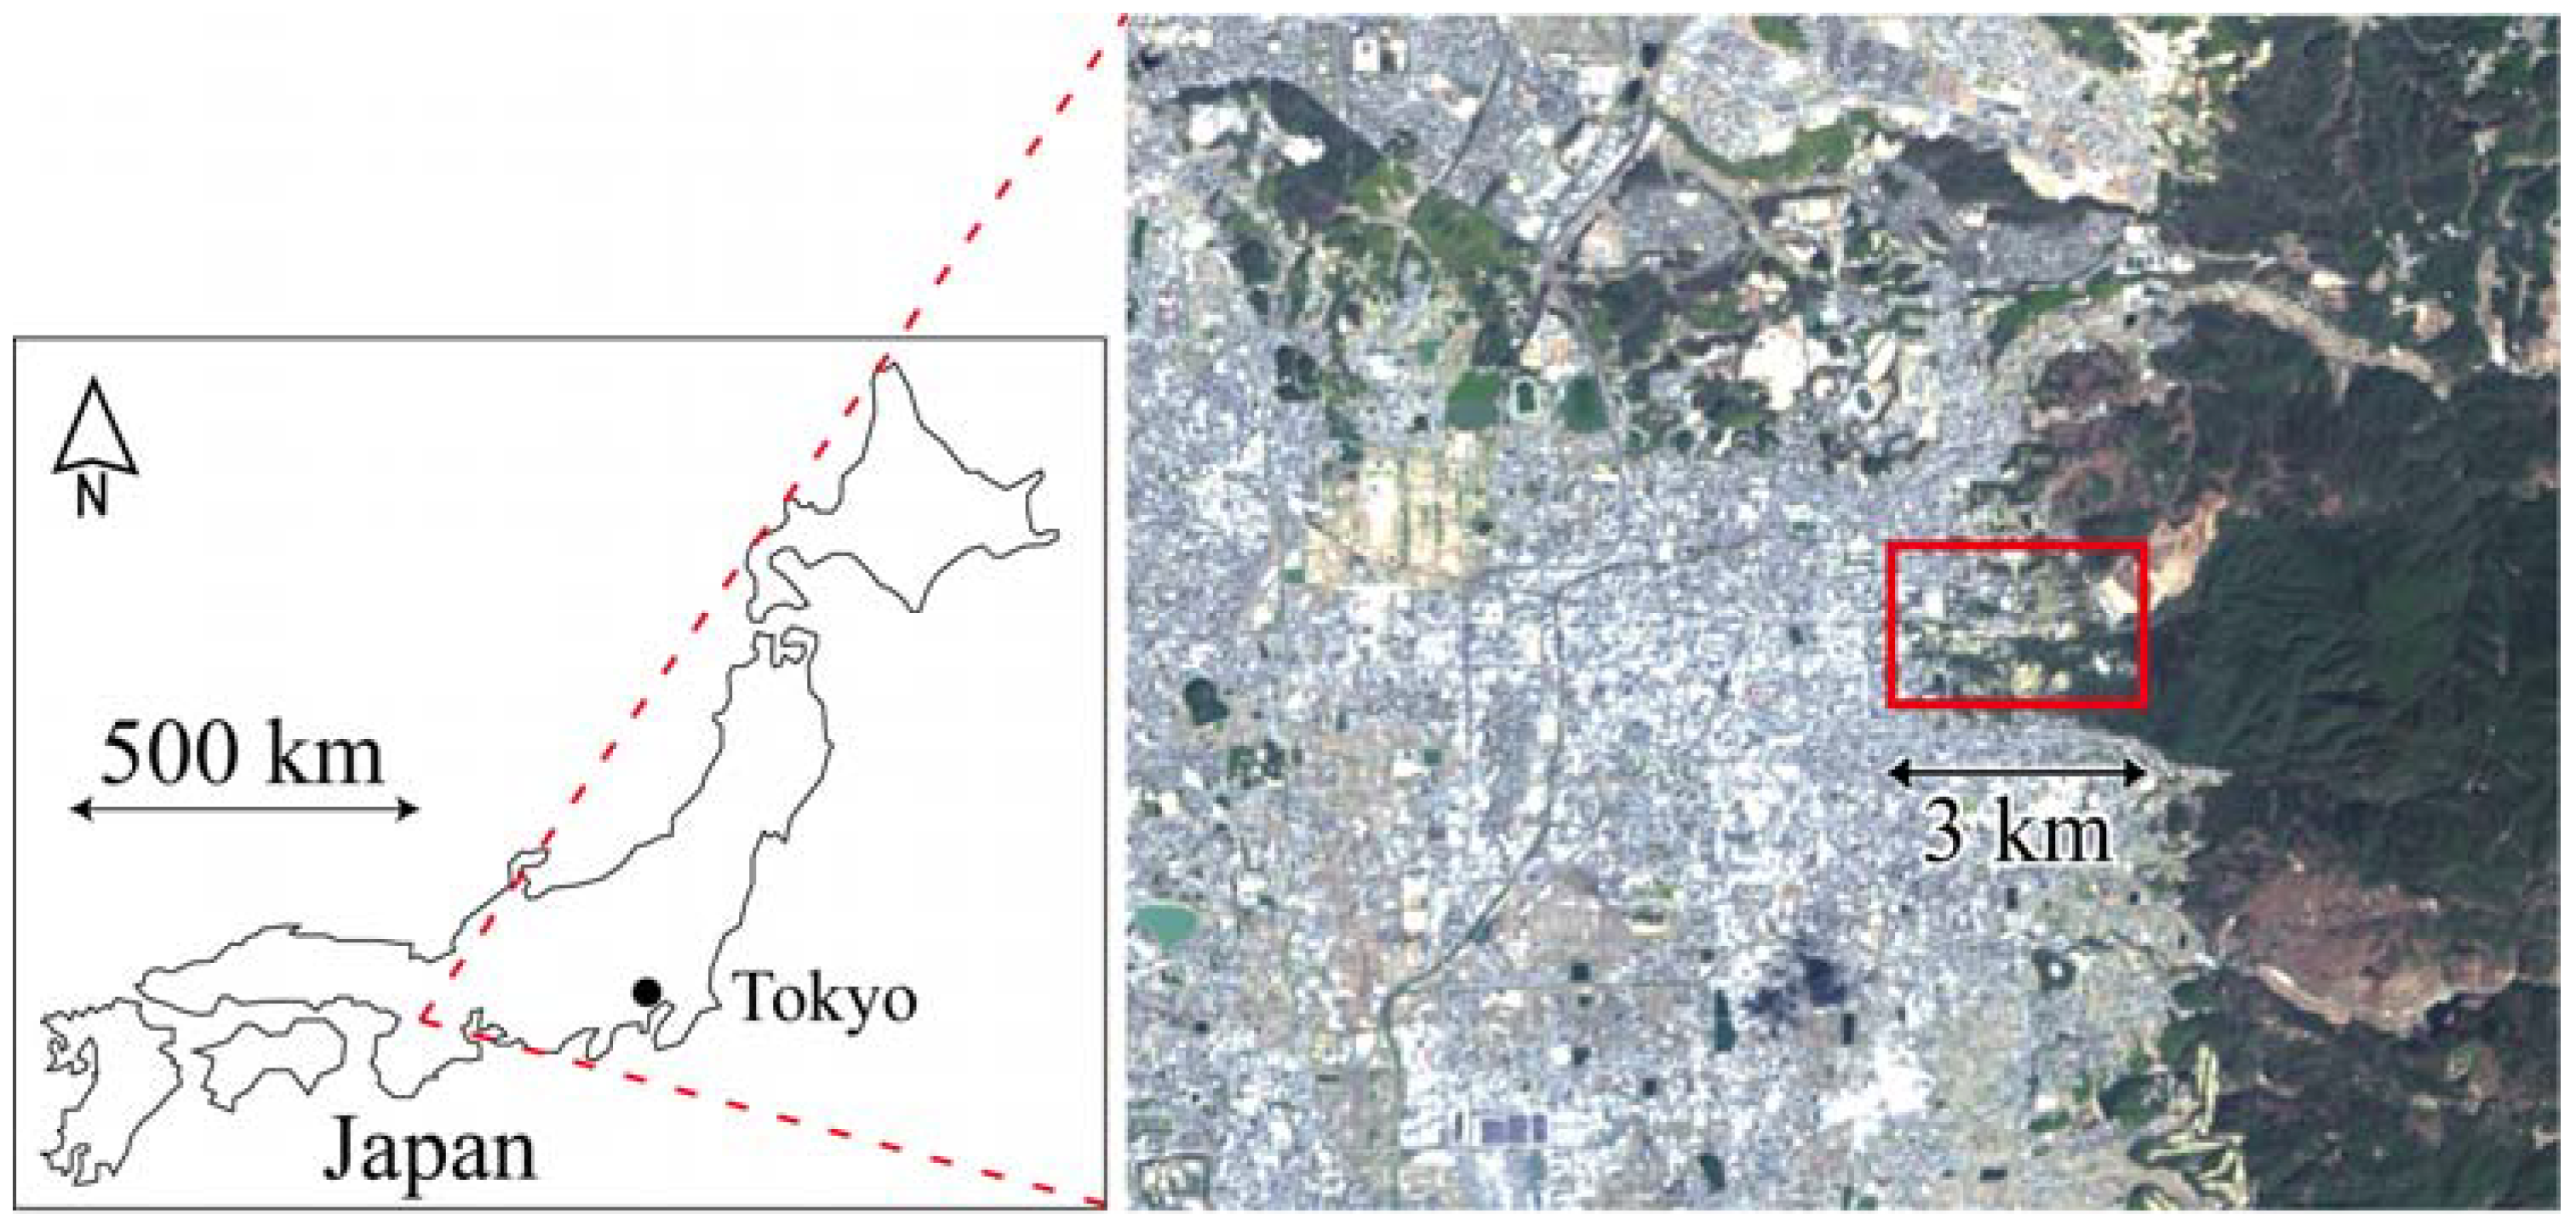
Location of the study area of the airborne experiment; the red rectangle on a Landsat 8 Pan-sharpen image shows the range used for aerial photography at Nara Park, Japan. Nara Park is located in the boundary between an urban region and a mountainous region.
Figure 3.
Location of the study area of the airborne experiment; the red rectangle on a Landsat 8 Pan-sharpen image shows the range used for aerial photography at Nara Park, Japan. Nara Park is located in the boundary between an urban region and a mountainous region.

Figure 4.
Shooting plan for a pair of thermal images in the UAV experiment.

Figure 5.
Difference between a fixed object and a moving animal in the time-series images by the movement of the observer. (a) Schematic diagram: The top of a tree (A) captured from point O1 is located at A1, whereas the top of the same tree captured from point O2 is located at A2. The base of the tree (B) captured from points O1 and O2 is always located in the same position; (b) In the case of a moving animal, the toes of the animal appear in different positions when viewed from points O1 and O2; (c) Schematic diagram of the computer-aided detection of moving wild animals (DWA) algorithm.

Figure 6.
Example input images and comparative images. Expanded image size is approximately 900 × 1000 pixels. (a) An original image. The red rectangle indicates the location of (b–d) and the green rectangle indicates the location of (e–g); (b) Input image 1 in an urban area; (c) Input image 2, corresponding to image 1; (d) Results obtained by the visual inspection of input image 2. Red circles indicate sika deer identified by an expert. Blue circles indicate local hot spots that are not sika deer. Green circles likely indicate streetlights; (e) Input image 3 in a forest area; (f) Input image 4, corresponding to image 3; (g) Input image 4 in color. The red circle indicates sika deer identified by an expert.

Figure 7.
Flowchart of the proposed method to extract moving animals from thermal remote sensing images.
Figure 7.
Flowchart of the proposed method to extract moving animals from thermal remote sensing images.

Figure 8.
Thermal images of two wild ducks swimming in the river captured with a fixed thermal camera (320 × 240 pixels) fixed to a bridge in Tokyo. (a,b) Thermal images 1 and 2; (c) Two ducks were automatically extracted by the DWA algorithm.
Figure 8.
Thermal images of two wild ducks swimming in the river captured with a fixed thermal camera (320 × 240 pixels) fixed to a bridge in Tokyo. (a,b) Thermal images 1 and 2; (c) Two ducks were automatically extracted by the DWA algorithm.

Figure 9.
Two pairs of thermal images used for an UAV experiment. (a) White circles indicate a walking human; (b) White circles indicate a standing human and a dog. A red circle indicates a human who is a non-target for detection because the human is not in an overlapping area.
Figure 9.
Two pairs of thermal images used for an UAV experiment. (a) White circles indicate a walking human; (b) White circles indicate a standing human and a dog. A red circle indicates a human who is a non-target for detection because the human is not in an overlapping area.

Figure 10.
Results of an UAV experiment. (a) A walking human was automatically extracted by the DWA algorithm; (b) A standing human and dog were not extracted by the DWA algorithm.
Figure 10.
Results of an UAV experiment. (a) A walking human was automatically extracted by the DWA algorithm; (b) A standing human and dog were not extracted by the DWA algorithm.

Figure 11.
The change in air temperature and surface temperature of the background. (a) 11 April 2012. Conditions were rainy and cool. The surface temperature of the human was approximately 25 °C; (b) 12 April 2012. Conditions were clear and warm in the daytime. The surface temperature of the human was over 25 °C; (c) 18 May 2012. Conditions were clear after torrential rain in the morning. The surface temperature of the human was over 25 °C; (d) Late July 2012. Conditions were clear and hot. The surface temperature of the human was approximately 35 °C in the early morning and over 40 °C at 10:00 h.

Figure 12.
Visible and thermal images of an elephant and deer at Inokashira Park Zoo in Tokyo, Japan. (a) Visible image of an elephant; (b) Thermal image of an elephant; (c) Visible image of deer; (d) Thermal image of deer.
Figure 12.
Visible and thermal images of an elephant and deer at Inokashira Park Zoo in Tokyo, Japan. (a) Visible image of an elephant; (b) Thermal image of an elephant; (c) Visible image of deer; (d) Thermal image of deer.

Figure 13.
A pair of airborne thermal images. (a) The average surface temperature of thermal image 1 was 17.0 °C and (b) the average of surface temperature of thermal image 2 was 16.5 °C; (c) Gap in the surface temperature between (a,b); (d) Visual inspection results obtained by an expert. Red dots represent the moving sika deer; (e) Extraction results obtained by the proposed method. Red dots represent the extracted results as moving animal candidates.


Table 1.
Producer’s accuracy and User’s accuracy calculated by comparisons between visual inspection results and extraction results using a pair of airborne thermal images.
Table 1.
Producer’s accuracy and User’s accuracy calculated by comparisons between visual inspection results and extraction results using a pair of airborne thermal images.
| The Number of Sika Deer Identified by Visual Inspection | The Number of Sika Deer Extracted by the Proposed Method | ||
|---|---|---|---|
| Total | 357 | 849 | |
| Moving sika deer | 299 | 225 | Producer’s accuracy 75.3% |
| Stopping sika deer | 155 | ||
| Not in an overlapping area | 58 | ||
| User’s accuracy 29.3% |
© 2018 by the authors. Licensee MDPI, Basel, Switzerland. This article is an open access article distributed under the terms and conditions of the Creative Commons Attribution (CC BY) license (http://creativecommons.org/licenses/by/4.0/).
Share and Cite
MDPI and ACS Style
Oishi, Y.; Oguma, H.; Tamura, A.; Nakamura, R.; Matsunaga, T. Animal Detection Using Thermal Images and Its Required Observation Conditions. Remote Sens. 2018, 10, 1050. https://doi.org/10.3390/rs10071050
AMA Style
Oishi Y, Oguma H, Tamura A, Nakamura R, Matsunaga T. Animal Detection Using Thermal Images and Its Required Observation Conditions. Remote Sensing. 2018; 10(7):1050. https://doi.org/10.3390/rs10071050
Chicago/Turabian StyleOishi, Yu, Hiroyuki Oguma, Ayako Tamura, Ryosuke Nakamura, and Tsuneo Matsunaga. 2018. "Animal Detection Using Thermal Images and Its Required Observation Conditions" Remote Sensing 10, no. 7: 1050. https://doi.org/10.3390/rs10071050
Note that from the first issue of 2016, this journal uses article numbers instead of page numbers. See further details here.