Hydro-Meteorological Assessment of Three GPM Satellite Precipitation Products in the Kelantan River Basin, Malaysia


1
Geography Section, School of Humanities, Universiti Sains Malaysia, Penang 11800, Malaysia
2
Department of Agricultural Extension & Information System, Sher-e-Bangla Agricultural University, Dhaka 1207, Bangladesh
*
Author to whom correspondence should be addressed.
Remote Sens. 2018, 10(7), 1011; https://doi.org/10.3390/rs10071011
Submission received: 29 April 2018
/
Revised: 1 June 2018
/
Accepted: 4 June 2018
/
Published: 25 June 2018
(This article belongs to the Special Issue Application of Remote Sensing in Hydrological Modeling and Watershed Management)
Abstract
:The rapid development of Satellite Precipitation Products (SPPs) has heightened the need for a hydro-meteorological assessment of the Integrated Multi-satellite Retrievals for Global Precipitation Measurement (IMERG) products in different climate and geographical regions. Reliability of the IMERG early (IMERG_E), late (IMERG_L) and final (IMERG_F) run products in precipitation estimations was evaluated over the Kelantan River Basin, Malaysia from 12 March 2014 to 31 December 2016. The three IMERG products were then incorporated into a calibrated Soil and Water Assessment Tool (SWAT) model to assess their reliability in streamflow simulations. Overall, monthly precipitation variability is well captured by the three SPPs. The IMERG_F exhibited a smaller systematic bias (RB = 7.14%) compared to the IMERG_E (RB = −10.42%) and IMERG_L (RB = −17.92%) in daily precipitation measurement. All the three SPPs (NSE = 0.66~0.71 and R2 = 0.73~0.75) performed comparably well as precipitation gauges (NSE = 0.74 and R2 = 0.79) in the daily streamflow simulation. However, the IMERG_E and IMERG_L showed a significant underestimation of daily streamflow by 27.6% and 36.3%, respectively. The IMERG_E and IMERG_F performed satisfactory in streamflow simulation during the 2014–2015 flood period, with NSE and R2 values of 0.5~0.51 and 0.62~0.65, respectively. With a better peak flow capture ability, the IMERG_F outperformed the near real-time products in cumulative streamflow measurement. The study has also shown that the point-to-pixel or pixel-to-pixel comparison schemes gave comparable conclusions. Future work should focus on the development of a standardized GPM hydro-meteorological assessment framework, so that a fair comparison among IMERG validation studies can be conducted.
Keywords:
GPM; IMERG; SWAT; Kelantan; Malaysia; precipitation; streamflow; hydrology; meteorology; satellite precipitation product
1. Introduction
Humans cannot survive without water. Precipitation replenishes the water resources on Earth via the hydrological cycle, which are essential for agricultural, industrial, domestic, and drinking purposes. An understanding of precipitation patterns is obviously important in water resources management. Apart from this, reliable precipitation information is also vital in monitoring and forecasting water-related hazards such as flood and drought. Therefore, sustainable development of the economic, agricultural, ecological, and social fields requires accurate precipitation data.
A precipitation gauge is regarded as one of the most reliable approaches of collecting precipitation information, but it is in point form. Various interpolation techniques such as Kringing, Inverse Distance Weighting (IDW), multiquadric-biharmonic (MQB), and Spline have been developed to study the spatial pattern of precipitation [1,2]. In general, a high density of precipitation gauges is essential to produce a good interpolated precipitation pattern. Unfortunately, lack of adequate precipitation gauges is a major issue in many parts of the world, particularly in developing countries, mountains, ocean, and less discovered area (i.e., Amazon rain forest).
In recent decades, satellite precipitation products (SPPs) have been increasingly applied in monitoring precipitation patterns. Continuous measurement, extensive coverage, free of charge, and near real-time are among their advantages [3]. The launch of the Global Precipitation Measurement (GPM) mission began a new generation of SPPs [4]. GPM is a satellite constellation with the core observatory satellite (GPM-CO) launched on 14 February 2014 and equipped with a Dual-frequency Precipitation Radar (DPR) and GPM Microwave Imager (GMI) [4]. Spatial (0.1° × 0.1°) and temporal (30 min) resolutions of GPM are better than the Tropical Rainfall Measurement Mission (TRMM) products (spatial: 0.25° × 0.25°, temporal: three hourly). A prior assessment of GPM products is essential to understand their reliability in a specific region before applying them in any operational system. The findings could also be used for improving the IMERG algorithms and sensors development. For instance, numerous GPM product validation studies have been carried out in China [5], Iran [6], Malaysia [7], Singapore [3], and southern Canada [8]. Most of the studies found that GPM products are applicable to study regional precipitation patterns, but the reliability varies with region, season, elevation, and latitude.
Inaccurate precipitation data might lead to false hydrological model outputs and inappropriate decisions [9]. Therefore, assessment of SPPs in hydrological modelling is essential to understand and reduce these errors. However, a hydrological assessment of the Integrated Multi-Satellite Retrievals for GPM (IMERG) product is still limited because these SPPs are only recently available. Also, a more complicated validation scheme is required as compared to the meteorological assessment. Yuan et al. [10] compared the IMERG final run (IMERG_F) product with the TRMM 3B42V7 product in streamflow simulations of the Chindwin River Basin, Myanmar. They found that both SPPs underestimated the total runoff and high flows of the basin. In Thailand, Pakoksung and Takagi [11] studied the capability of six different SPPs in runoff simulations of the 2014 flood event in the Nan River Basin. Similar studies have also been conducted in the Beijing River Basin [12] and Ganjiang River Basin [13,14] in China, and the Amazon Basin of Peru and Ecuador [15]. These studies reported that the GPM IMERG products have satisfactory performance in hydrology and flood applications. Nevertheless, such evaluation studies should be conducted on different types of basins, such as tropical basins and complex topography basins.
The Kelantan River Basin (KRB) is a tropical basin in the north-eastern part of Peninsular Malaysia. The basin is frequently affected by flood and drought, with a huge loss of infrastructure, property, and human life. For instance, the 2014–2015 flood affected more than 200,000 people, caused multi-million dollar losses and 21 deaths. Meanwhile, a prolonged drought in 2014 reduced the paddy productivity in Kelantan, and led to about 22 million dollars of agricultural losses [16]. Application of the IMERG products undoubtedly provides a better view of climatic conditions for understanding these natural disasters. This study is aims (1) to validate three IMERG products with precipitation gauges, and (2) to assess the reliability of the IMERG products in hydrological modelling.
2. Study Area
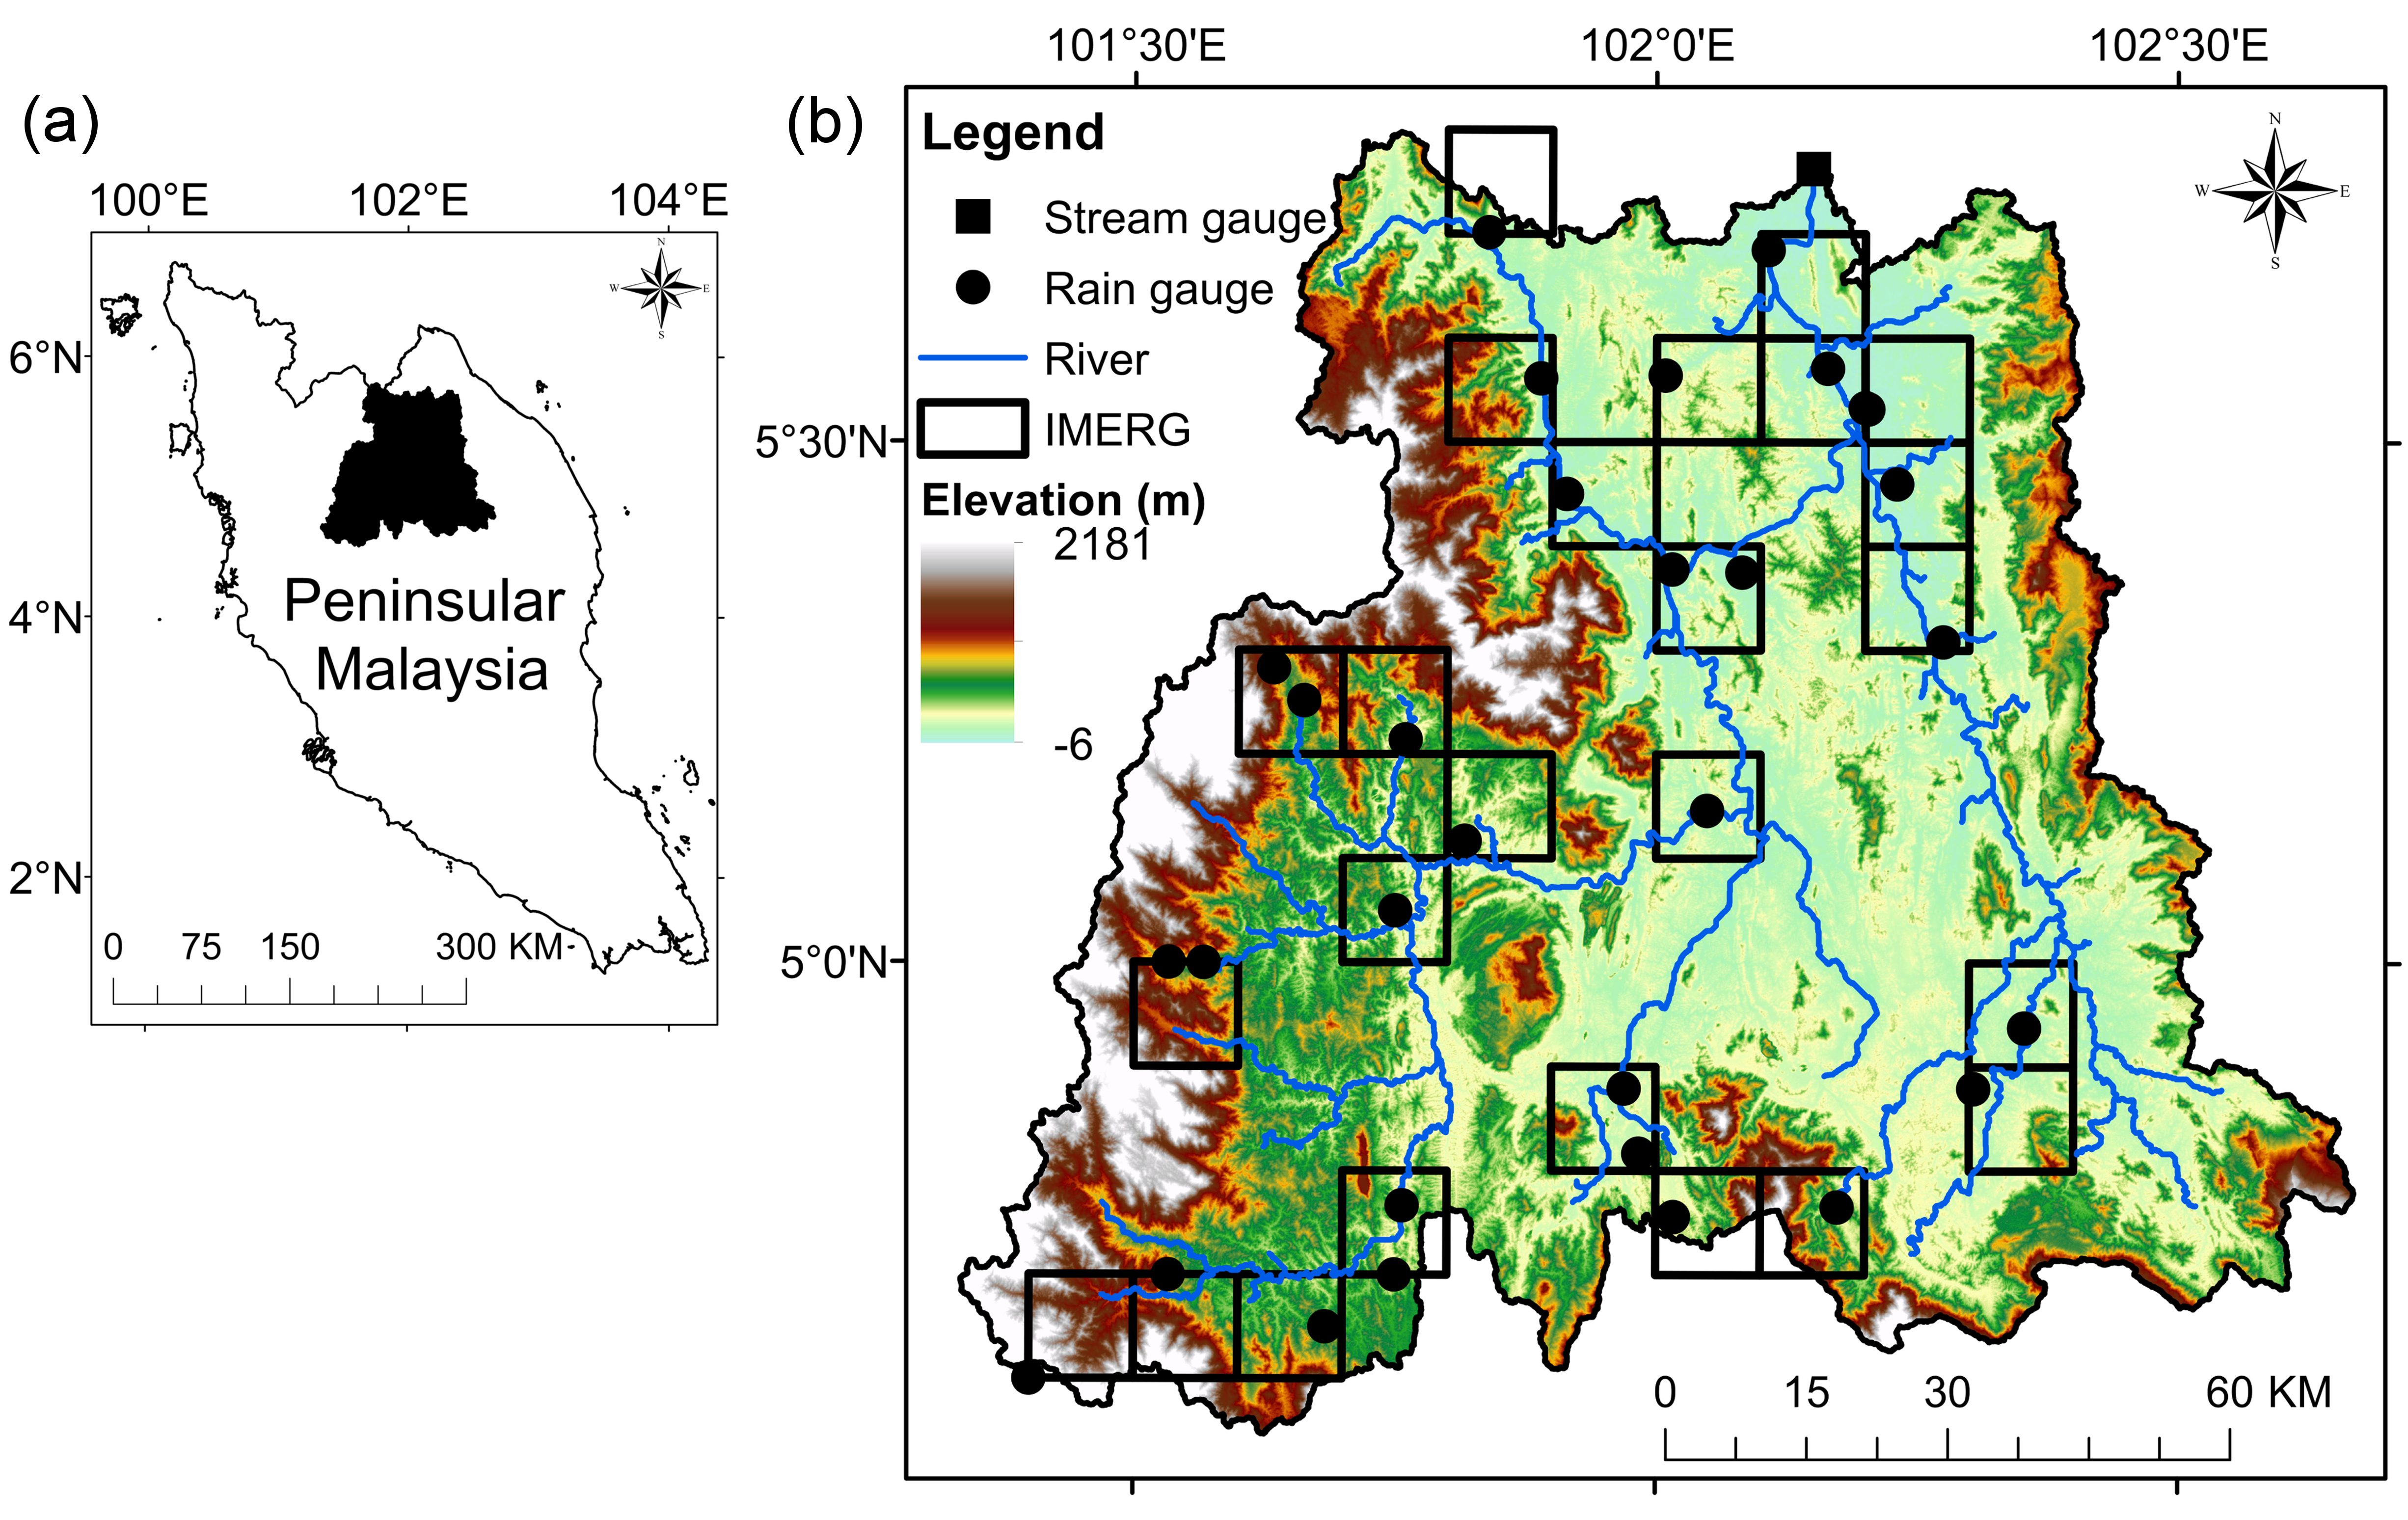
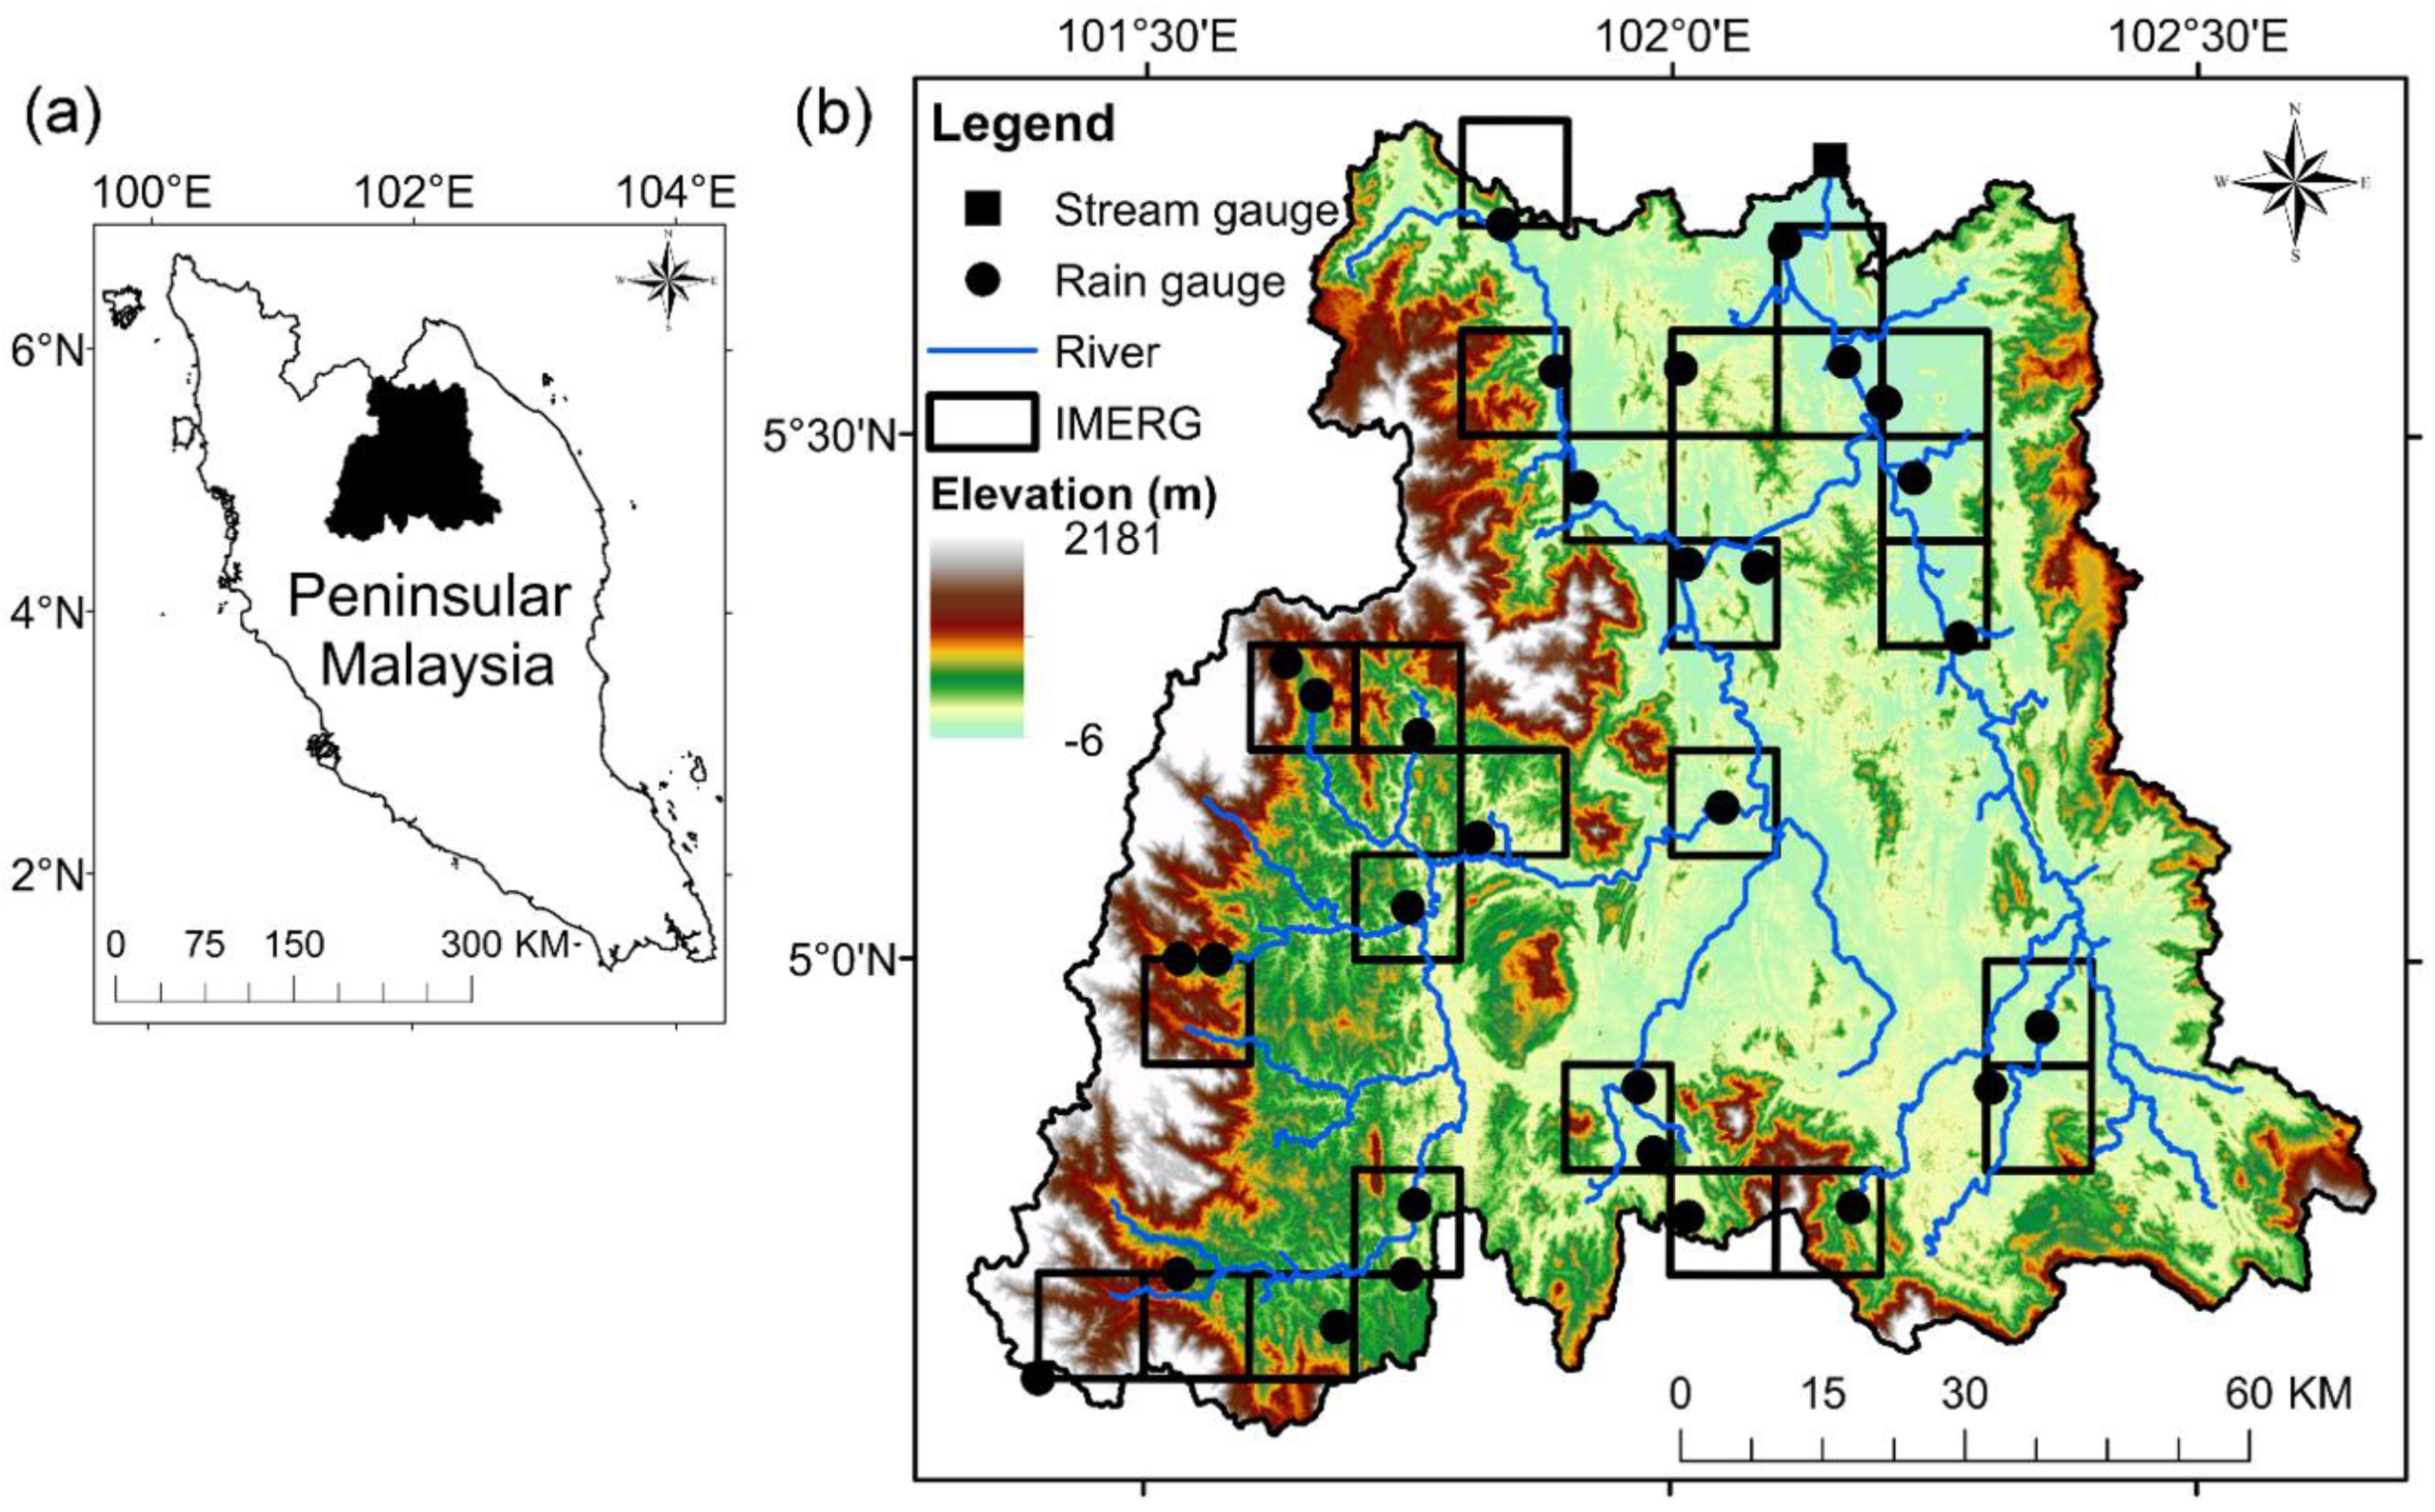
The KRB is located between latitudes 4° to 6° and longitudes 101° to 103° (Figure 1). The basin covers about 85% of the Kelantan state, with a basin area of 12,134 km2 [9]. In 2008, there are three main land uses/land covers in KRB: forest (76%), oil palm (11%) and rubber (11%). Based on the 30 m resolution Shuttle Radar Topography Mission (SRTM) digital elevation model (DEM), elevation of the KRB ranges from −6 to 2181 m a.s.l., with mountains in the western and south-western regions. The Kelantan River originates from the Tahan and Titiwangsa mountain ranges and is the main river of the basin (~248 km). It flows into the South China Sea through Kota Bharu city, which is the most developed area in Kelantan. The KRB has an average annual precipitation and average annual temperature of 2500 mm/year and 27.5 °C, respectively. The northeast monsoon (NEM) season brings heavy precipitation to the basin from November to January. While, the basin receives lesser precipitation during the southwest monsoon (SWM) season between May and August. There are two inter-monsoon seasons between the NEM and SWM seasons, where precipitation forms by the strong surface heating and sea breeze circulation [7].
3. Materials and Methods
3.1. GPM IMERG
The GPM-CO was launched on 14 February 2014 by the United States National Aeronautics and Space Administration (NASA) and the Japan Aerospace Exploration Agency (JAXA). The mission was anticipated to succeed and improve the TRMM, which had ended its 17 years of service on 8 April 2015. The GPM-CO covers a wider region (68°N–68°S) compared to the TRMM (37°N–37°S) [4]. In addition, the sensors of GPM (DPR and GMI) are superior to TRMM. For example, the GMI has 13 channels of frequency ranges, while the TRMM Microwave Imager was only equipped with 9 channels.
The physical retrieval of precipitation rates is made by the DPR data, then a complete suite of algorithms provides other products with increased coverage by using GMI and other microwave radiometers on board other constellation satellites. IMERG also makes use of Infrared (IR) data, and rain gauges. There are three main GPM SPPs: (1) IMERG Early Run (IMERG_E)—near real-time with latency of 6 h; (2) IMERG Late Run (IMERG_L)—reprocessed near real-time with latency of 18 h; and (3) IMERG Final Run (IMERG_F)—gauged-adjusted with latency of four months. The temporal scales of these products are divided into 30 min, daily, and monthly. According to Huffman et al. [17], the IMERG_F is more accurate compared to other IMERG products as it is bias corrected using the Global Precipitation Climatology Centre (GPCC) precipitation gauges. In this study, the IMERG_E, IMERG_L and IMERG_F daily version 5 products that are available from 12 March 2014 were evaluated. These products are freely available on the Precipitation Measurement Missions website [18]. We only considered daily precipitation assessments due to a lack of 30 min observed precipitation and streamflow data.
3.2. Soil and Water Assessment Tool (SWAT) Model
The SWAT semi-distributed hydrological model is developed under the collaboration of the U.S. Department of Agriculture and the Texas A&M University [19]. Based on a web-based popularity comparison of modelling tools in water, soil, and waste applications conducted by Mannschatz et al. [20], the SWAT model is selected as the most popular model. This is because the model can be executed at different time-scales (i.e., sub-daily, daily, monthly, and annual), with extensive hydrology and pollutant transport applications. More information of the SWAT model is available in on-line documentation [21,22].
The model has been successfully applied in several basins of Malaysia; i.e., the Johor River Basin [23,24], Bernam River Basin [25], Bukit Merah Reservoir Catchment [26], and Hulu Langat Basin [27]. To date, the only SWAT modelling of the KRB is conducted by Tan et al. [28] to study the climate change impact on water resources. However, most of the Malaysian SWAT studies validated the model using monthly streamflow data, so the SWAT capability in daily streamflow simulation is less understood. Therefore, this study also intended to understand its reliability in a daily streamflow simulation of the KRB. In this study, we used SWAT version 2012 (Revision 635) with the ArcSWAT interface version 2012.10_2.16.
3.3. Ground Data
Observed precipitation is used to validate the IMERG products and to act as an input into the SWAT model. In this study, 31 precipitation gauges from 2010 to 2016 were collected from the Malaysian Meteorological Department (MMD) and Department of Irrigation and Drainage (DID) Malaysia. Distribution of these precipitation gauges is shown in Figure 1. Daily precipitation data of MMD was collected at 08:00 a.m. local time [29], which is similar to the daily IMERG products collection time at 00:00 Coordinated Universal Time (UTC). Meanwhile, DID’s daily precipitation data were reproduced by summing the hourly precipitation data at 00:00 UTC to match with the IMERG products. In January 2015, Malaysia only supplied precipitation data from 24 gauges for the GPCC product development [7]. Out of these precipitation gauges, only one station is located in the northern region of the Kelantan state. This precipitation gauge is located outside of the KRB, so we assumed that all of the 31 precipitation gauges are independent from the gauge-adjusted IMERG_F product.
Daily maximum and minimum temperature data are available at the Kuala Krai station (longitude: 102.2°E and latitude: 5.53°N). Daily precipitation, maximum, and minimum temperature are the main climate inputs to the SWAT model. In addition, SWAT modelling also requires a DEM, a land use map, and a soil map as geospatial inputs. Tan et al. [30] reported that the SRTM DEM is suitable to be used in SWAT modelling for Malaysian river basins, so the latest SRTM DEM with a spatial resolution of 30 m was used. The land use and soil maps were collected from the Ministry of Agriculture and Agro-based Industry Malaysia (MOA). In addition, the river network data of KRB was digitized from the topographic map collected from the Department of Survey and Mapping Malaysia (JUPEM). The digitized river network was burned into the DEM during the basin delineation to improve the delineation process and river network formation in low elevation regions. Streamflow data at Jambatan Guillermard (Figure 1) was collected from DID for SWAT calibration and validation purposes. Averaging of daily streamflow data at 00:00 UTC was performed to match with the daily precipitation gauges and the IMERG products.
3.4. Hydro-Meteorological Assessment
The reliability assessment of the IMERG products is divided into two main parts: (1) meteorological assessment—comparison with precipitation gauges; and (2) hydrological assessment—validation of the SWAT model simulations with observed streamflow. The assessment was conducted in monthly and daily time-scales. The precipitation evaluation periods were focused for the entire period (12 March 2014 to 31 December 2016) and the 2014–2015 flood period (14 December 2014 to 3 January 2015). Four continuous statistical metrics including Correlation Coefficient (CC), Root Mean Square Error (RMSE), Relative Bias (RB), and Mean Absolute Difference (MAD) were used to evaluate the reliability of the three IMERG products. The main function of CC is to test the degree of linear correlation between the IMERG products and precipitation gauges. The CC value varies between −1 (perfect negative correlation) and 1 (perfect positive correlation), while a value of 0 shows no correlation. The average absolute error magnitude of the IMERG products was tested using RMSE and MAD, where a smaller value indicated a better performance. RB measures the systematic bias of the IMERG products, with positive and negative values showing an overestimation and underestimation, respectively. Generally, the IMERG products can be regarded as a reliable source, if a CC value is greater than 0.7 and a RB value ranges from −10% to 10% [31].
Five categorical statistical metrics including Probability of Detection (POD), False Alarm Rate (FAR), Critical Success Index (CSI), Equitable Threat Score (ETS), and Accuracy (ACC) were used to evaluate the precipitation detection ability of the IMERG products. A threshold of 1 mm/day was used to differentiate precipitation and non-precipitation days in KRB. POD measures the fraction of the SPPs correctly detected precipitation observed in the precipitation gauges. FAR indicates what the fraction of the SPPs detected precipitation did not observe in the precipitation gauges. ACC represents the fraction of the SPPs that correctly detected precipitation and non-precipitation days. CSI and ETS describe how well the precipitation days detected from SPPs correspond to the gauges, and the latter approach considers the hits due to chance. For the perfect score, POD = 1, CSI = 1, ETS = 1, ACC = 1, and FAR = 0. Detailed calculations of the continuous and categorical statistical metrics can be found in several SPPs validation studies [9,32,33].
Hydrological assessment of the IMERG products was conducted using the SWAT model. Initially, the baseline testing period of the SWAT model was set up from 2010 to 2016. The 2010 year was used as the initialization year, while the following three years (2011–2013) were considered as the calibration period. The Sequential Uncertainty Fitting algorithm (SUFI-2) in the SWAT Calibration and Uncertainty (SWAT-CUP) tool was used to calibrate the SWAT model. For an iteration, the SWAT model was calibrated with 500 different parameter combinations. At the same time, the global sensitivity analysis approach was integrated to identify the sensitivity of each parameter. The best parameter combination was obtained after running several iterations. Once the model calibration was completed, the three IMERG products were incorporated into the calibrated SWAT model to validate the daily streamflow for the entire period (12 March 2014 to 31 December 2016) and the 2014–2015 flood period (14 December 2014 to 3 January 2015). For the IMERG products, we only considered the pixels over precipitation gauges (Figure 1) to reduce the uncertainty in this assessment. We incorporated the IMERG products into the SWAT model by replacing the gauges’ precipitation data with the IMERG precipitation data for the period of 12 March 2014 to 31 December 2016.
To evaluate the reliability of SWAT simulations, the Nash-Sutcliffe Coefficient (NSE), Coefficient of Determination (R2), and RB were used. Tan et al. [28] identified that the NSE is the best objective function to be used in the SWAT calibration of the KRB, so it was selected as an optimal objective in this study. In addition, the NSE is commonly used in the SWAT model assessment for measuring the “goodness-of-fit” between simulated and observed streamflows. NSE values range from −∞ to 1, while negative values are known as an unacceptable SWAT performance. On the other hand, the R2 was used to evaluate the collinearity between simulated and observed streamflow, with values ranging from 0 to 1 (perfect). According to Moriasi et al. [34], the performance of the SWAT model can be classified into four different categories: (1) not satisfactory (NSE ≤ 0.5, R2 ≤ 0.6 and RB ≥ ±15%); (2) satisfactory (NSE > 0.5, R2 > 0.6 and RB < ±15%); (3) good (NSE > 0.7, R2 > 0.75 and RB < ±10%); and (4) very good (NSE > 0.8, R2 > 0.85 and RB < ±5%).
4. Results
4.1. Meteorological Assessment
Point-to-pixel approach was used to compare the precipitation between gauges and SPPs. As shown in Figure 1, most of the IMERG pixels are covered by only one precipitation gauge, so the point-to-pixel is an optimal choice in this case. This is because the pixel-to-pixel approach commonly requires a high density of precipitation gauges or ground-based precipitation radar. Figure 2 shows that the three IMERG products well captured the temporal variability of monthly precipitation. For example, a high precipitation amount was found in December 2014, while a low precipitation amount was found in February 2015 and March 2016. Table 1 indicates that all the IMERG products had a good correlation with precipitation gauges in monthly precipitation measurement. Only the IMERG_F was classified as a reliable source, as the CC (0.86) and RB (7.14%) values are beyond the good performance thresholds [31]. The IMERG_E and IMERG_L underestimated the monthly precipitation, with RB values of 10.42% and 17.92%, respectively. The results showed the gauge-corrected IMERG_F performed slightly better than the near real-time products in term of systematic bias.
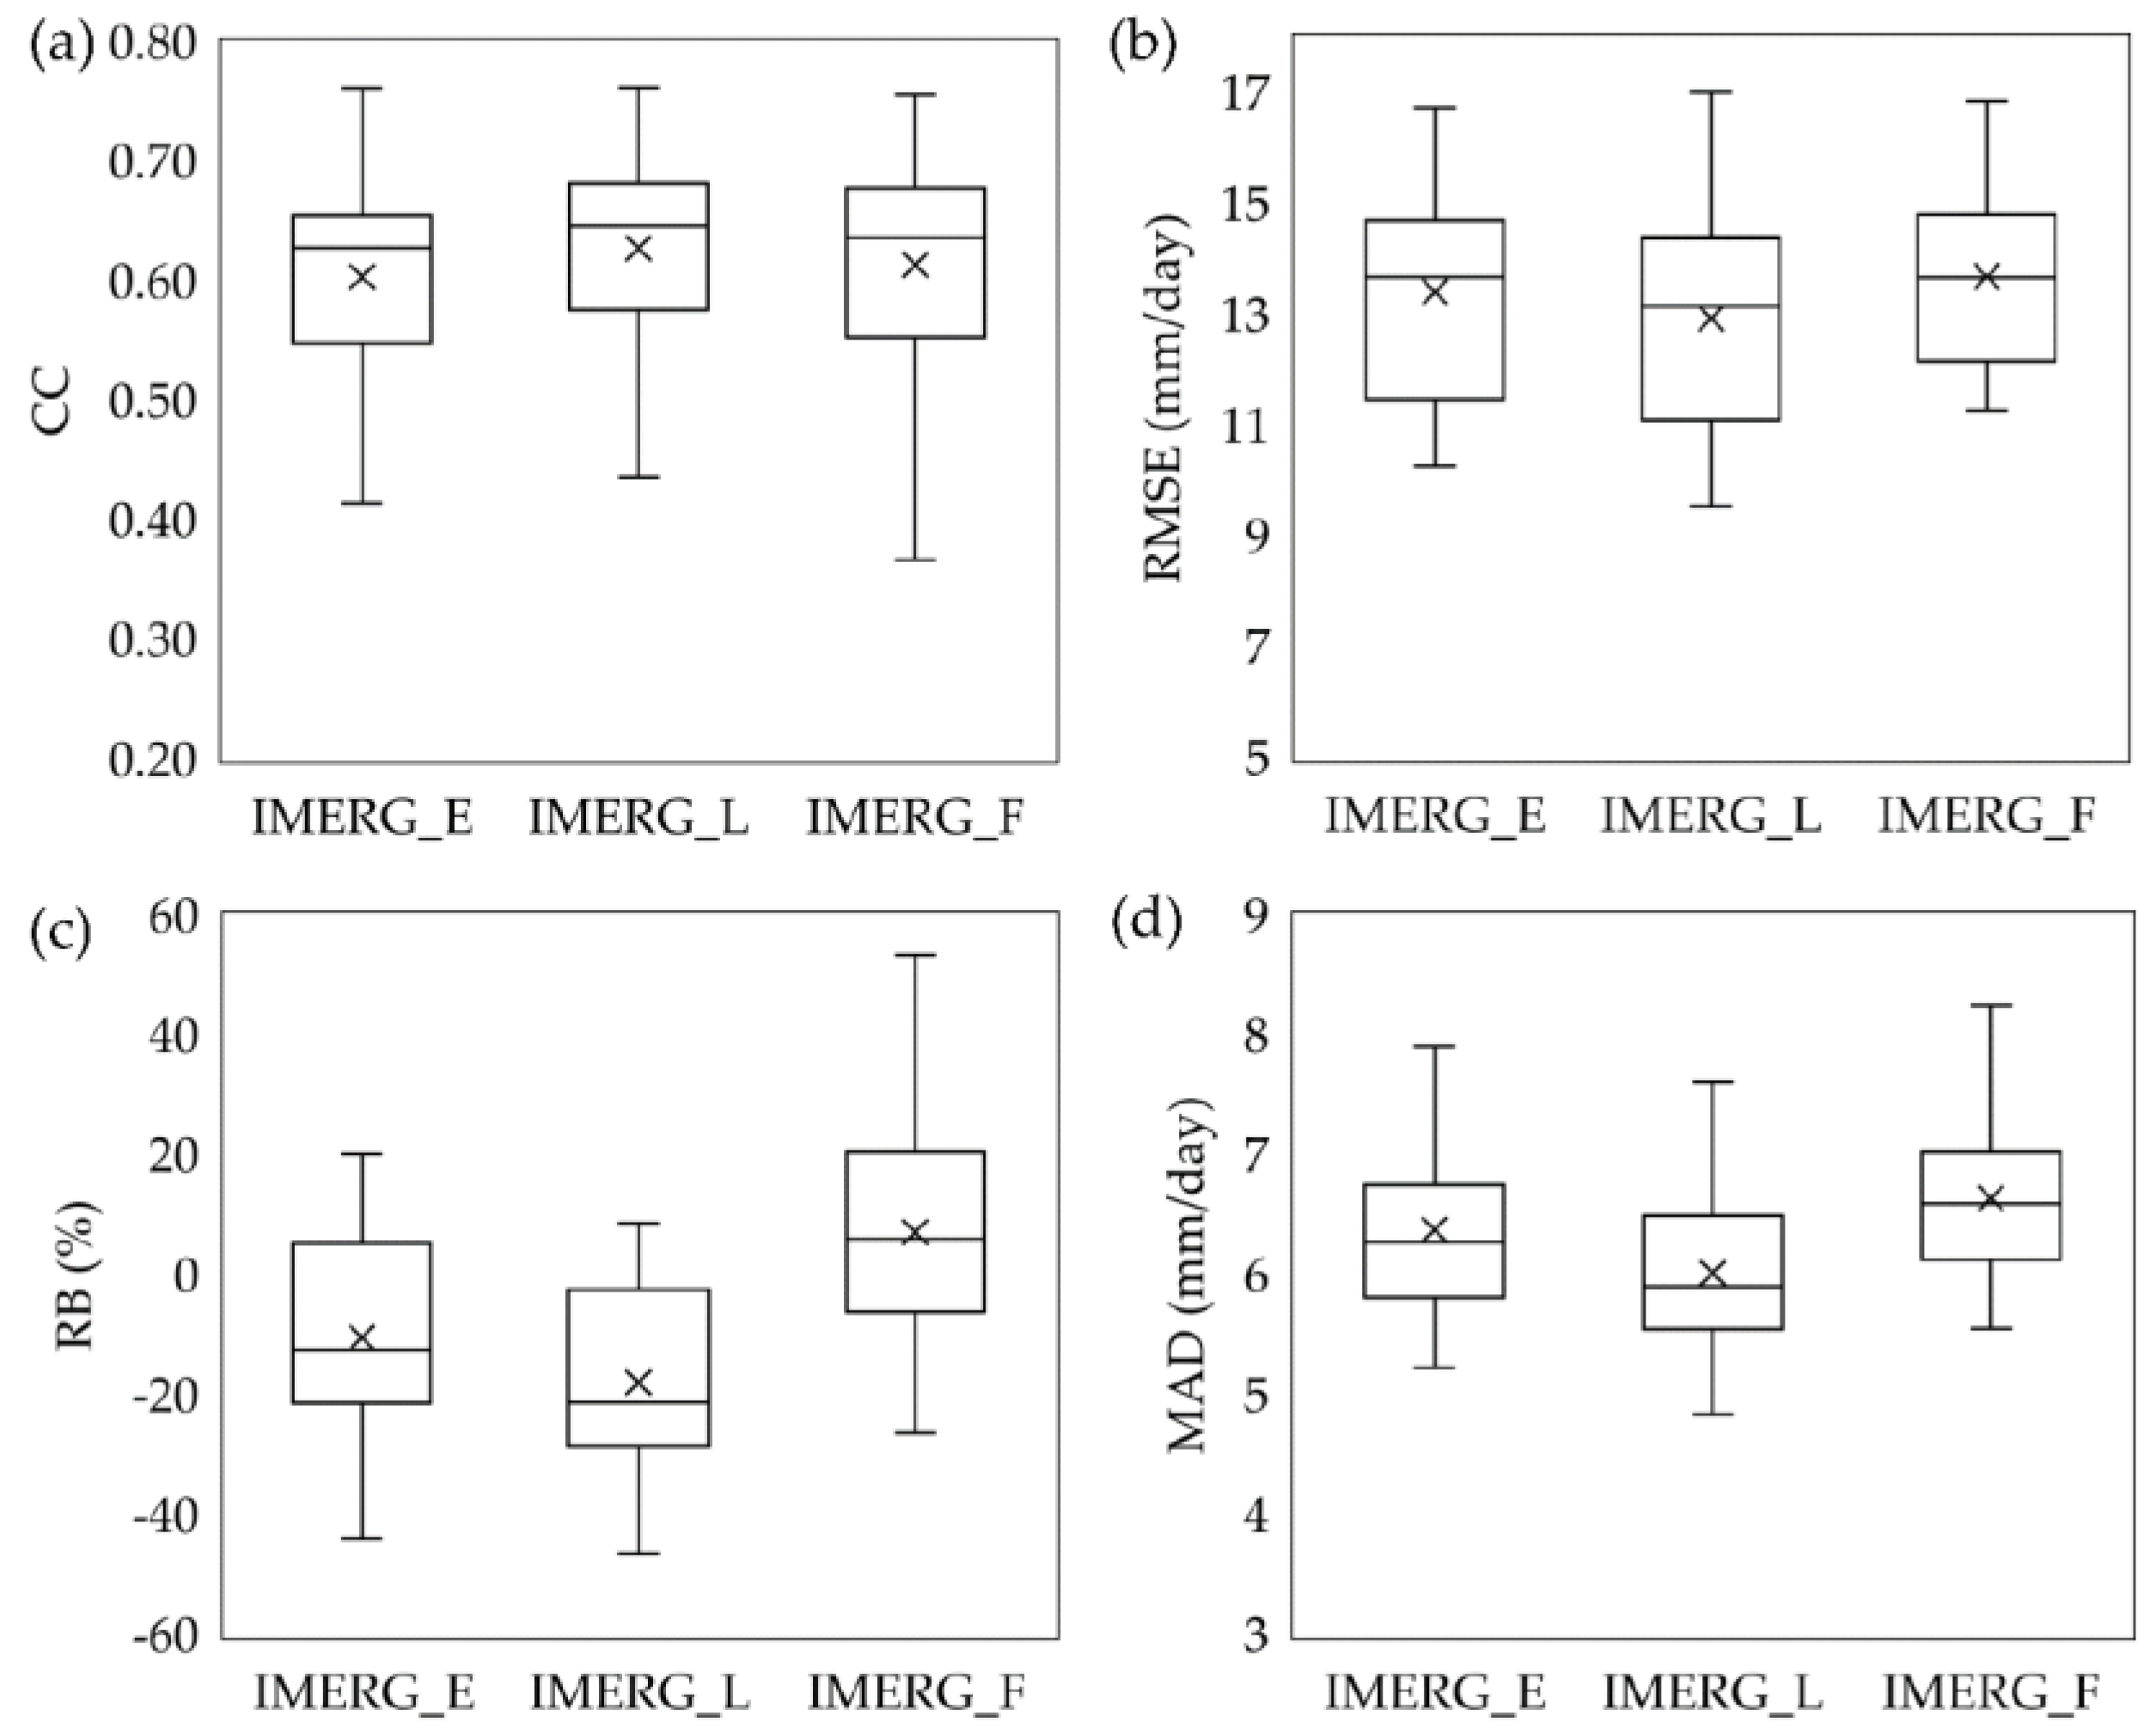
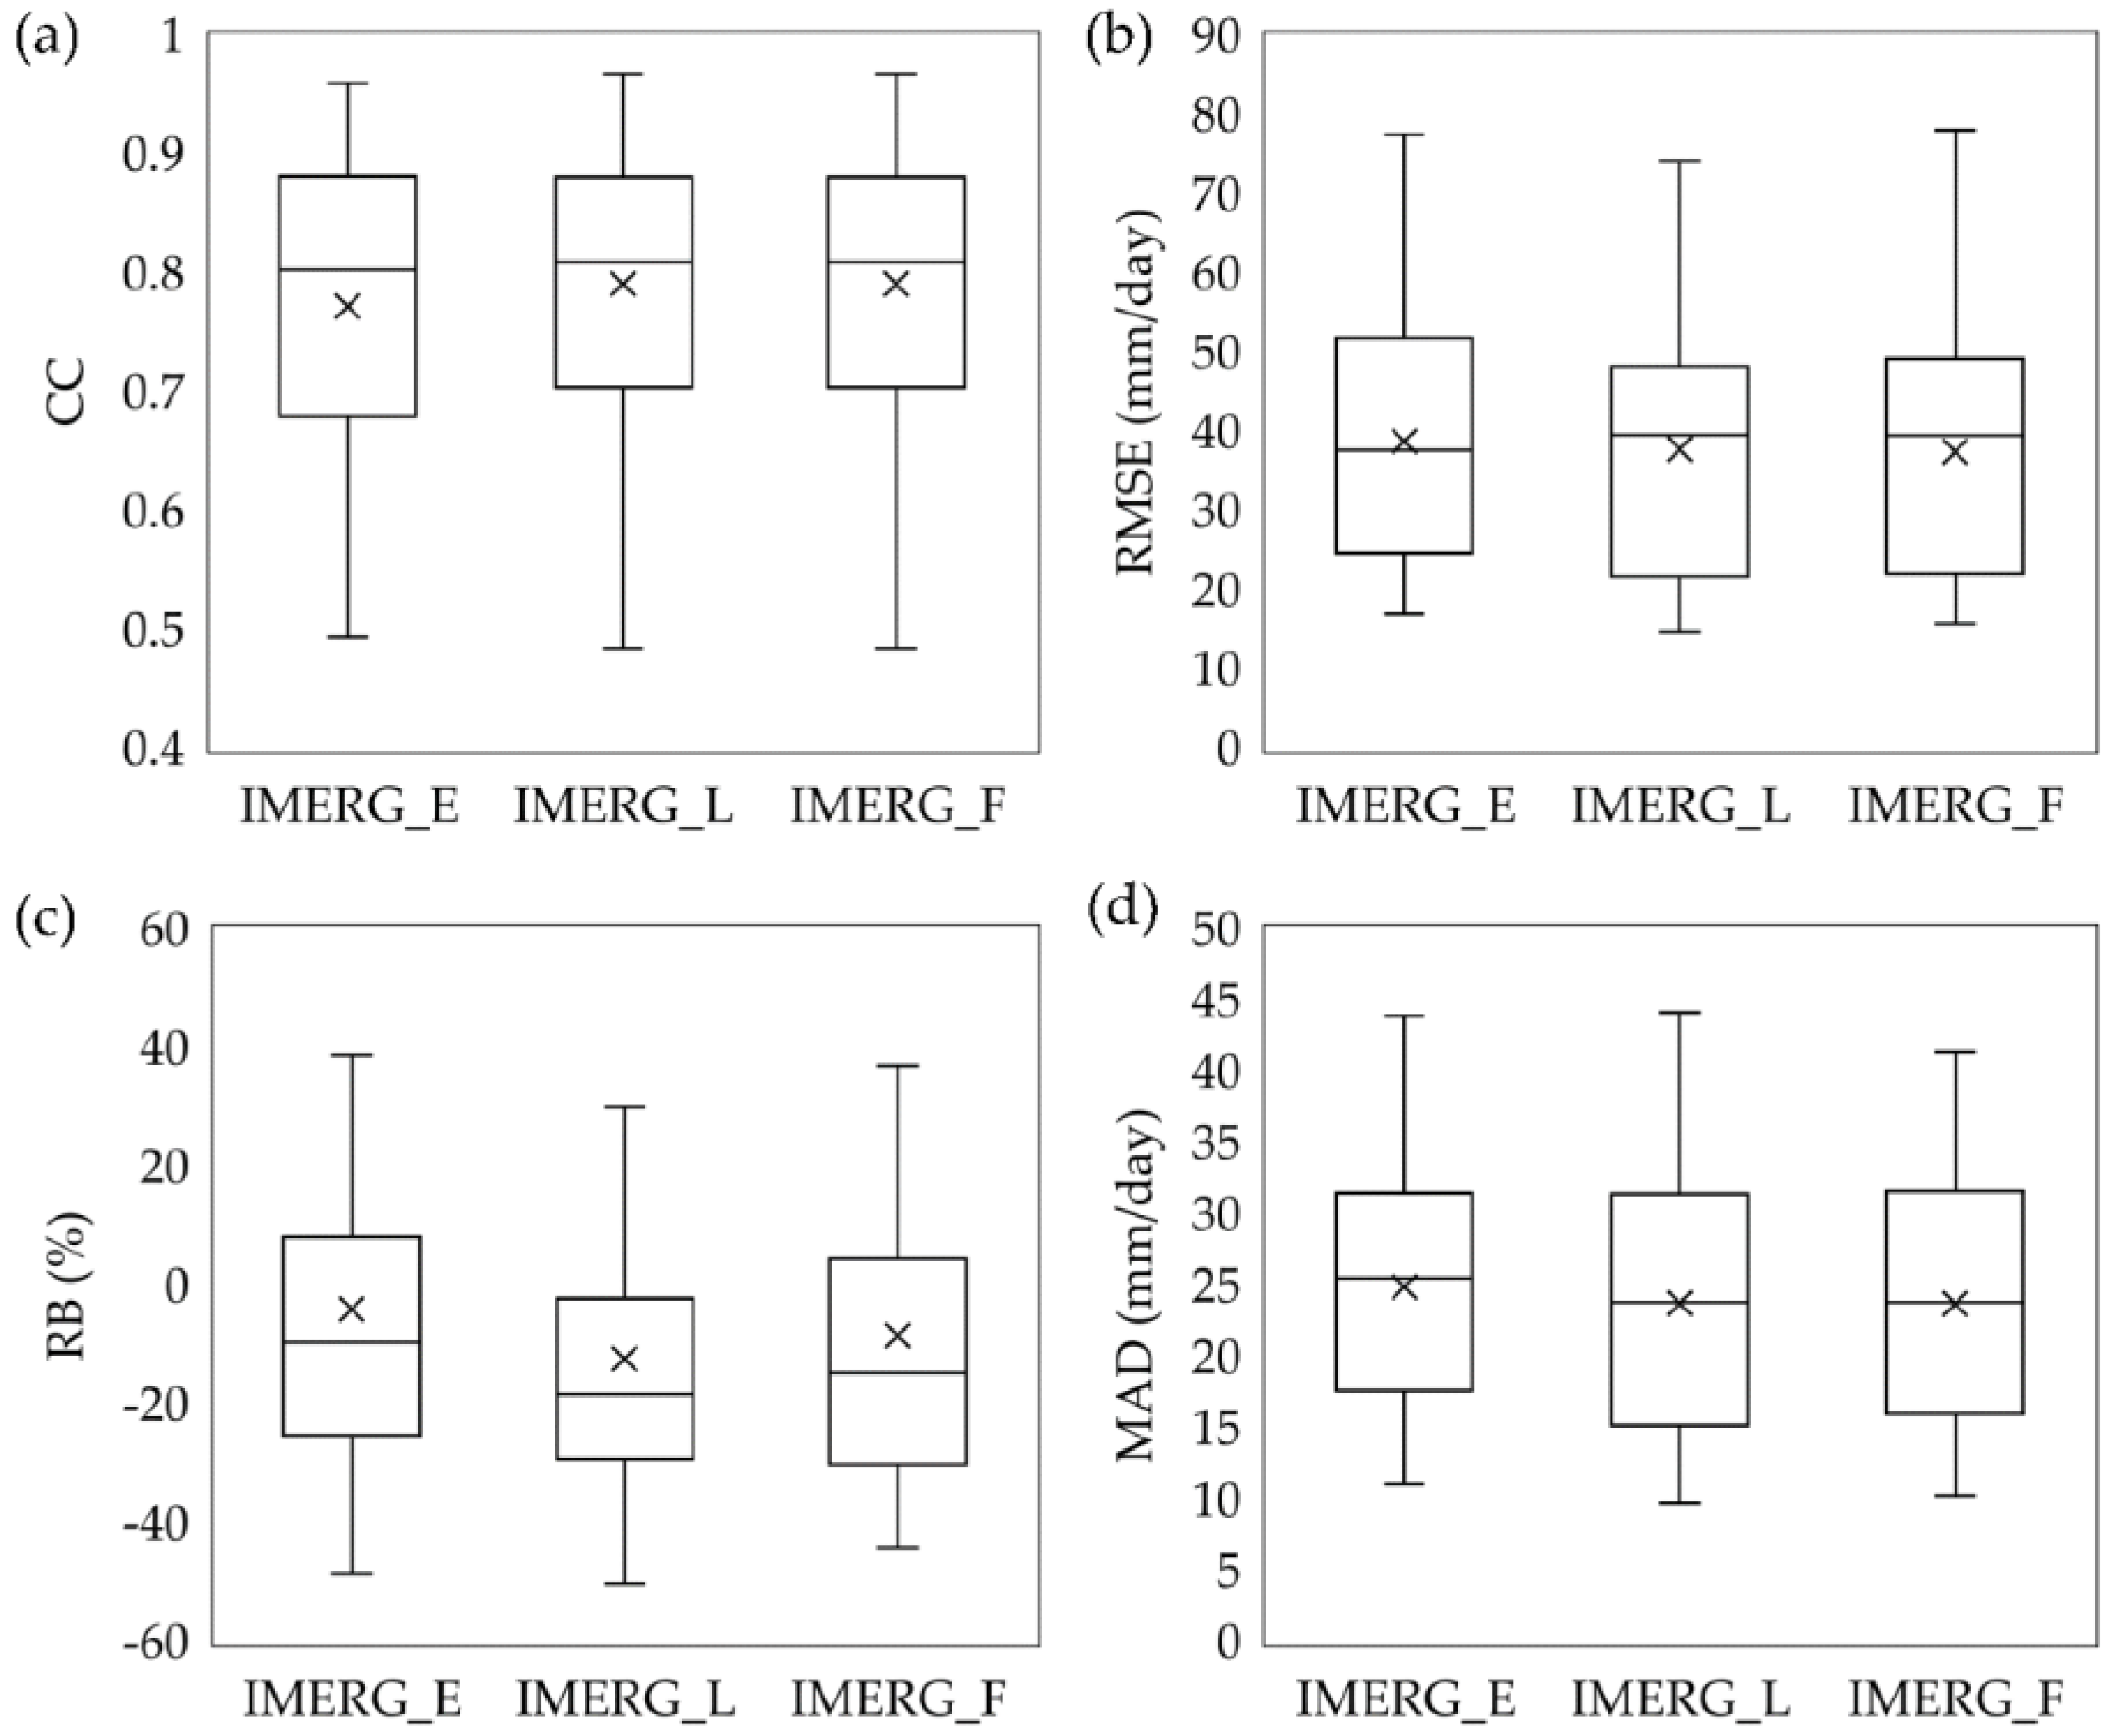
For the daily scale assessment, the three IMERG products had a moderate correlation with precipitation gauges, with CC values ranging between 0.6 and 0.63. The IMERG_L presents a slightly smaller RMSE and MAD values compared to the other two products. Similarly, the IMERG_F presents a slightly better performance than the IMERG_E and IMERG_L in term of systematic bias, with a lower RB (Figure 3 and Table 1). These results are consistent with Wang et al. [12], who also found that the IMERG_E and IMERG_L underestimated daily precipitation, but the IMERG_F showed an overestimation over the Beijing River Basin, China. The GPM IMERG products accurately detected the precipitation days and non-precipitation days as the ACC values varying from 0.7 to 0.71, indicating about 70% of correct detections.
4.2. SWAT Model Calibration and Validation
Table 2 shows that the most sensitive parameter of the SWAT daily streamflow calibration in the KRB was manning’s value for the main channel (CH_N2), followed by the baseflow alpha factor (ALPHA_BF), groundwater “revap” coefficient (GW_REVAP), channel effective hydraulic conductivity (CH_K2), initial SCS CN II value (CN2), threshold water depth in the shallow aquifer for flow (GWQWN), groundwater delay (GW_DELAY), available water capacity (SOL_AWC), threshold depth of water in the shallow aquifer for “revap” to occur (REVAPMN), deep aquifer percolation faction (RCHRG_DP), surface runoff lag time (SURLAG), and soil evaporation compensation factor (ESCO). The result is in agreement with a SWAT monthly streamflow sensitivity analysis of the KRB conducted by Tan et al. [28], where the GW_REVAP, ALPHA_BF, CN2, and CH_K2 are among the sensitive parameters in the basin. In KRB, groundwater related parameters are sensitive because groundwater is being used as one of the main freshwater sources for domestic, agricultural, and industrial uses. However, SWAT is unable to simulate groundwater flow accurately due to its simplified groundwater concept [35]. Hence, continuous improvement of the SWAT groundwater module and amore groundwater parameters for calibration are required to improve SWAT modelling in high groundwater withdrawal regions.
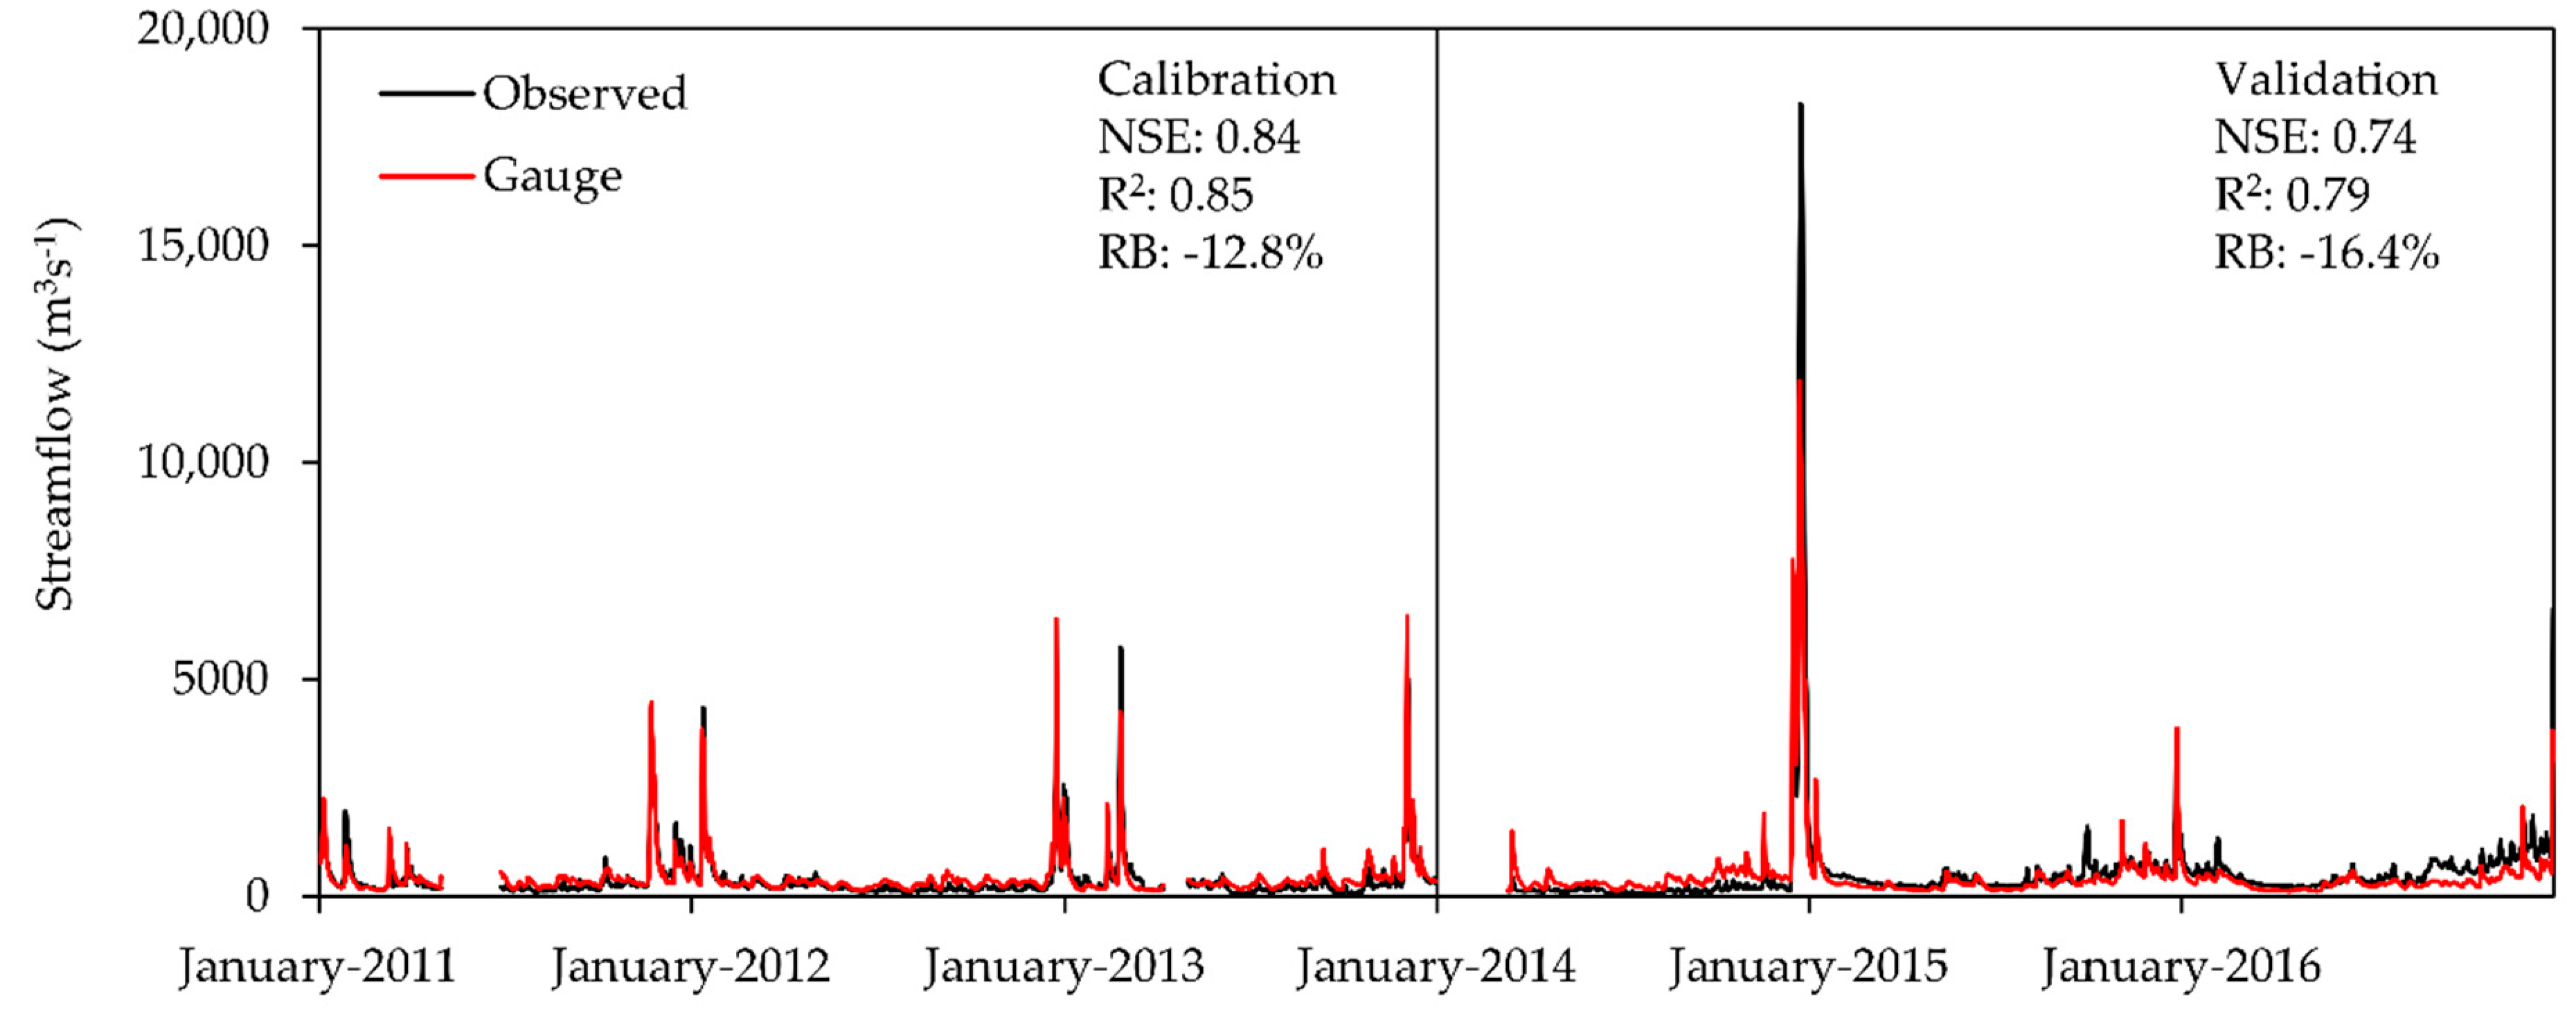
The original and final iterations of the SWAT calibration parameter ranges are listed in Table 2. All the original parameter ranges follow the recommended ranges available in the SWAT-CUP tool, except the GW_REVAP parameter. We slightly increased the GW_REVAP original range from 0.02–0.2 to 0.02–0.4. This is because the SWAT model tends to underestimate the evapotranspiration processes in tropical regions [36], so the range of the GW_REVAP parameter was modified to allow more evapotranspiration process in the KRB. The calibration and validation of the SWAT daily streamflow simulation are illustrated in Figure 4. Based on the NSE and R2 performance rating recommended by Moriasi et al. [34], the SWAT model showed very good and good performances for the calibration (NSE = 0.84 and R2 = 0.85) and validation (NSE = 0.74 and R2 = 0.79) periods, respectively. On top of that, the SWAT model underestimated the daily streamflow of calibration and validation periods by 12.8% and 16.4%, respectively. Figure 4 presents an underestimation of the peak flow during the big yellow flood event in the end of December 2014. These findings further support the results reported in the Johor River Basin [23] and KRB [28] where the SWAT model was unable to match the peak flows.
4.3. Hydrological Assessment
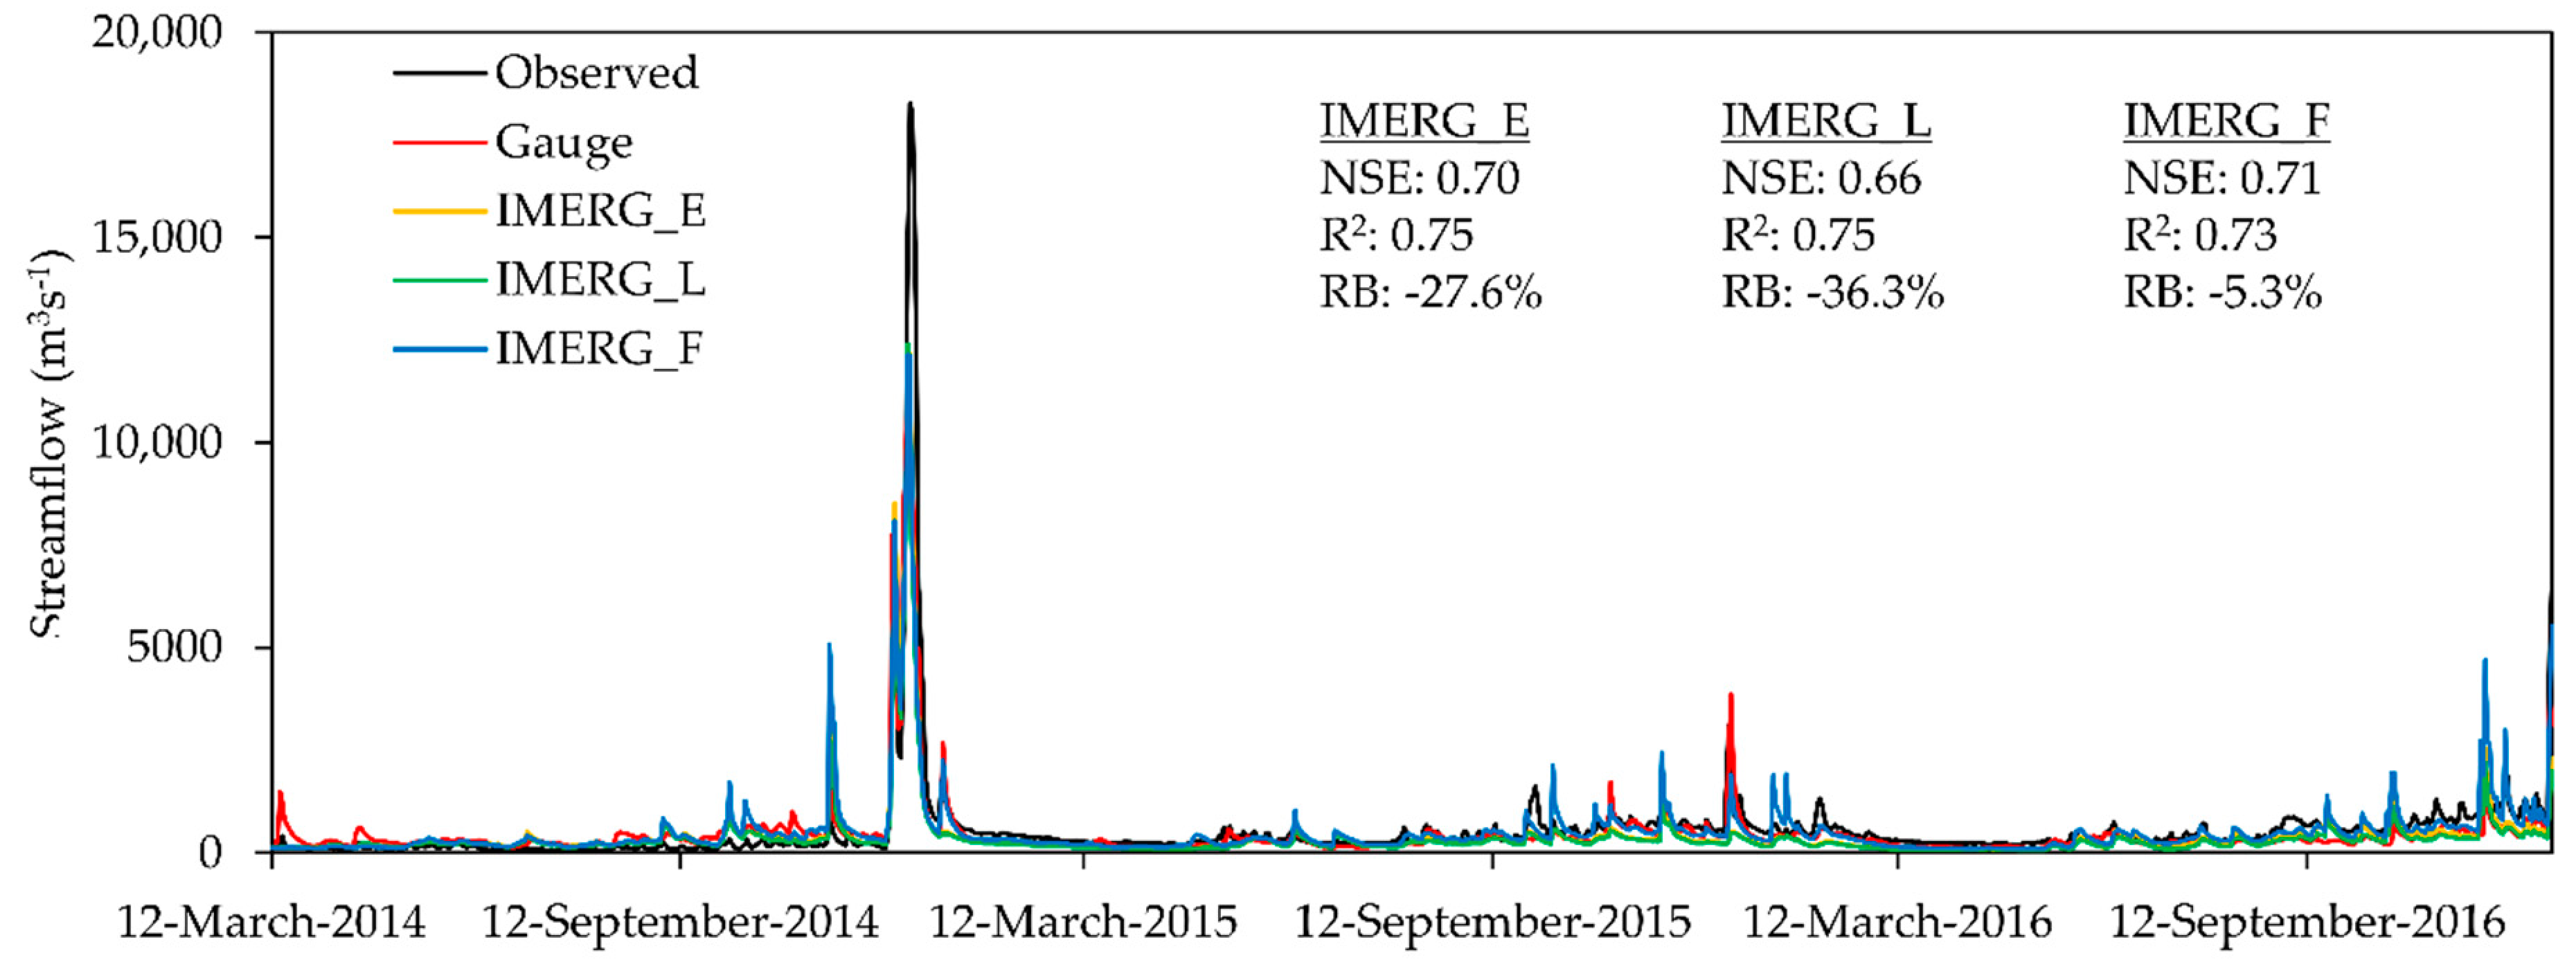
The statistical metrics validation of the IMERG products as shown in Figure 5 indicate that they have great potential for hydrological modelling in the KRB. Generally, the IMERG_F performed the best among the evaluated products in daily streamflow simulation, as indicated by the high NSE (0.71) and R2 (0.73) values and a low RB (−5.3%) value. Meanwhile, the IMERG_E (NSE = 0.7 and R2 = 0.75) showed a slightly better performance than the IMERG_L (NSE = 0.66 and R2 = 0.75). However, both IMERG_E and IMERG_L dramatically underestimated the SWAT daily streamflow by 27.6% and 36.3%, respectively. Therefore, a systematic bias correction scheme will be required before applying the near real-time IMERG products in any operational hydrology applications in this basin.
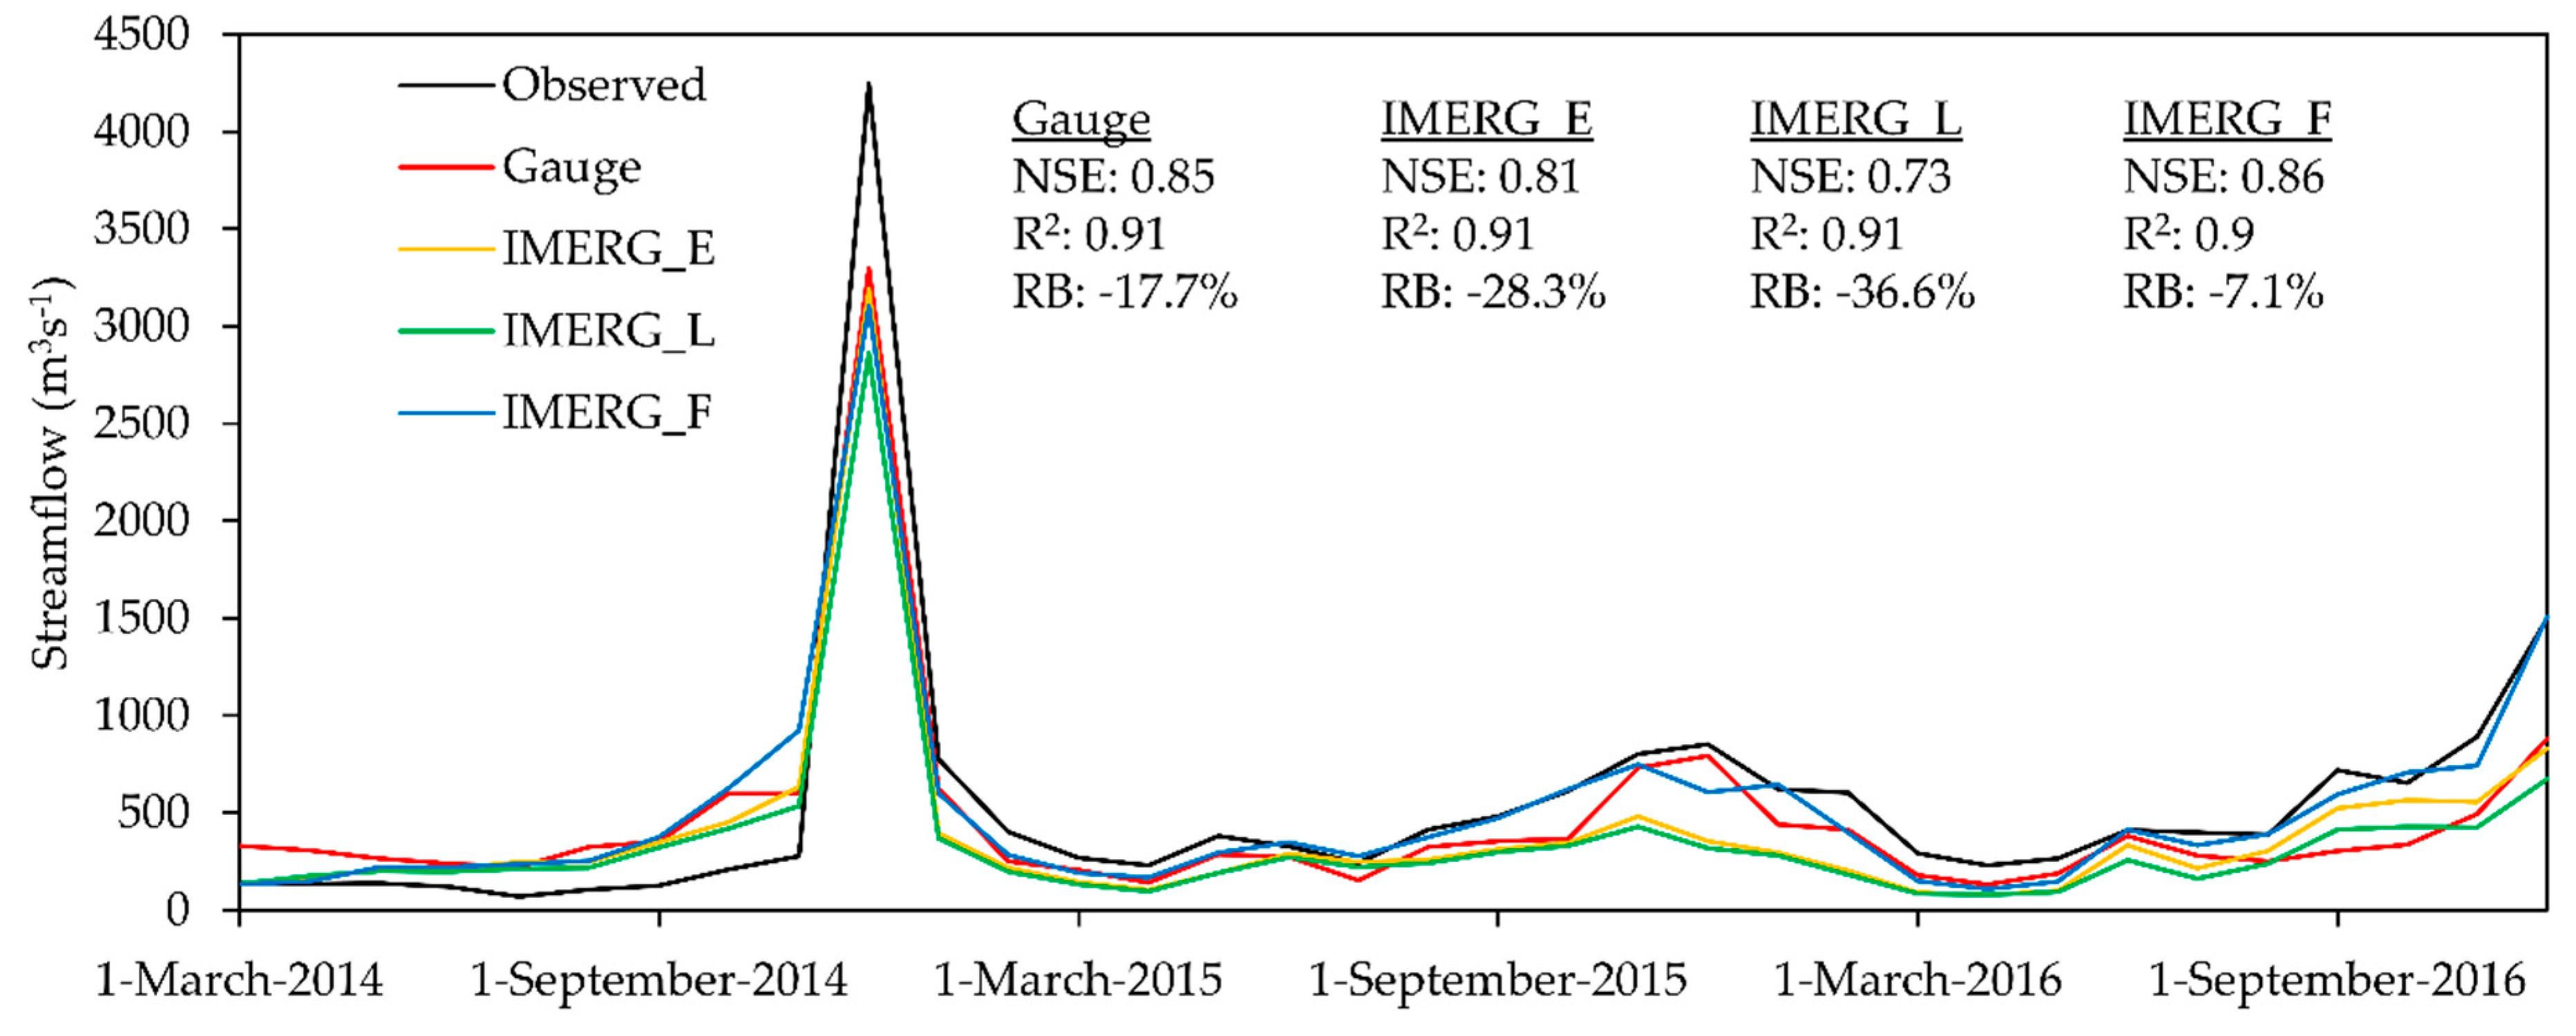
Figure 6 shows the temporal variability and statistical analysis of the SWAT monthly streamflow using the gauge and the three IMERG products. The results show that all the precipitation products had a better performance in the monthly streamflow simulation compared to the daily streamflow simulation. The IMERG_F is the only product that categorized a “very good” performance, with NSE, R2 and RB values of 0.86, 0.9 and −7.1%, respectively. In addition, the IMERG_E outperformed the IMERG_L in the monthly streamflow simulation, indicating the reprocess scheme within the IMERG_L is less beneficial in this tropical basin. Similarly, the IMERG_E and IMERG_L showed a significant underestimation of SWAT monthly streamflow by 28.3% and 36.6%, respectively. Monthly applications of the GPM products will be more useful and widely applicable when a longer GPM measurement period (currently only 4 years) is available. For example, the TRMM monthly precipitation products are recently widely applied in a drought assessment [16,37] that requires long term monthly precipitation information.
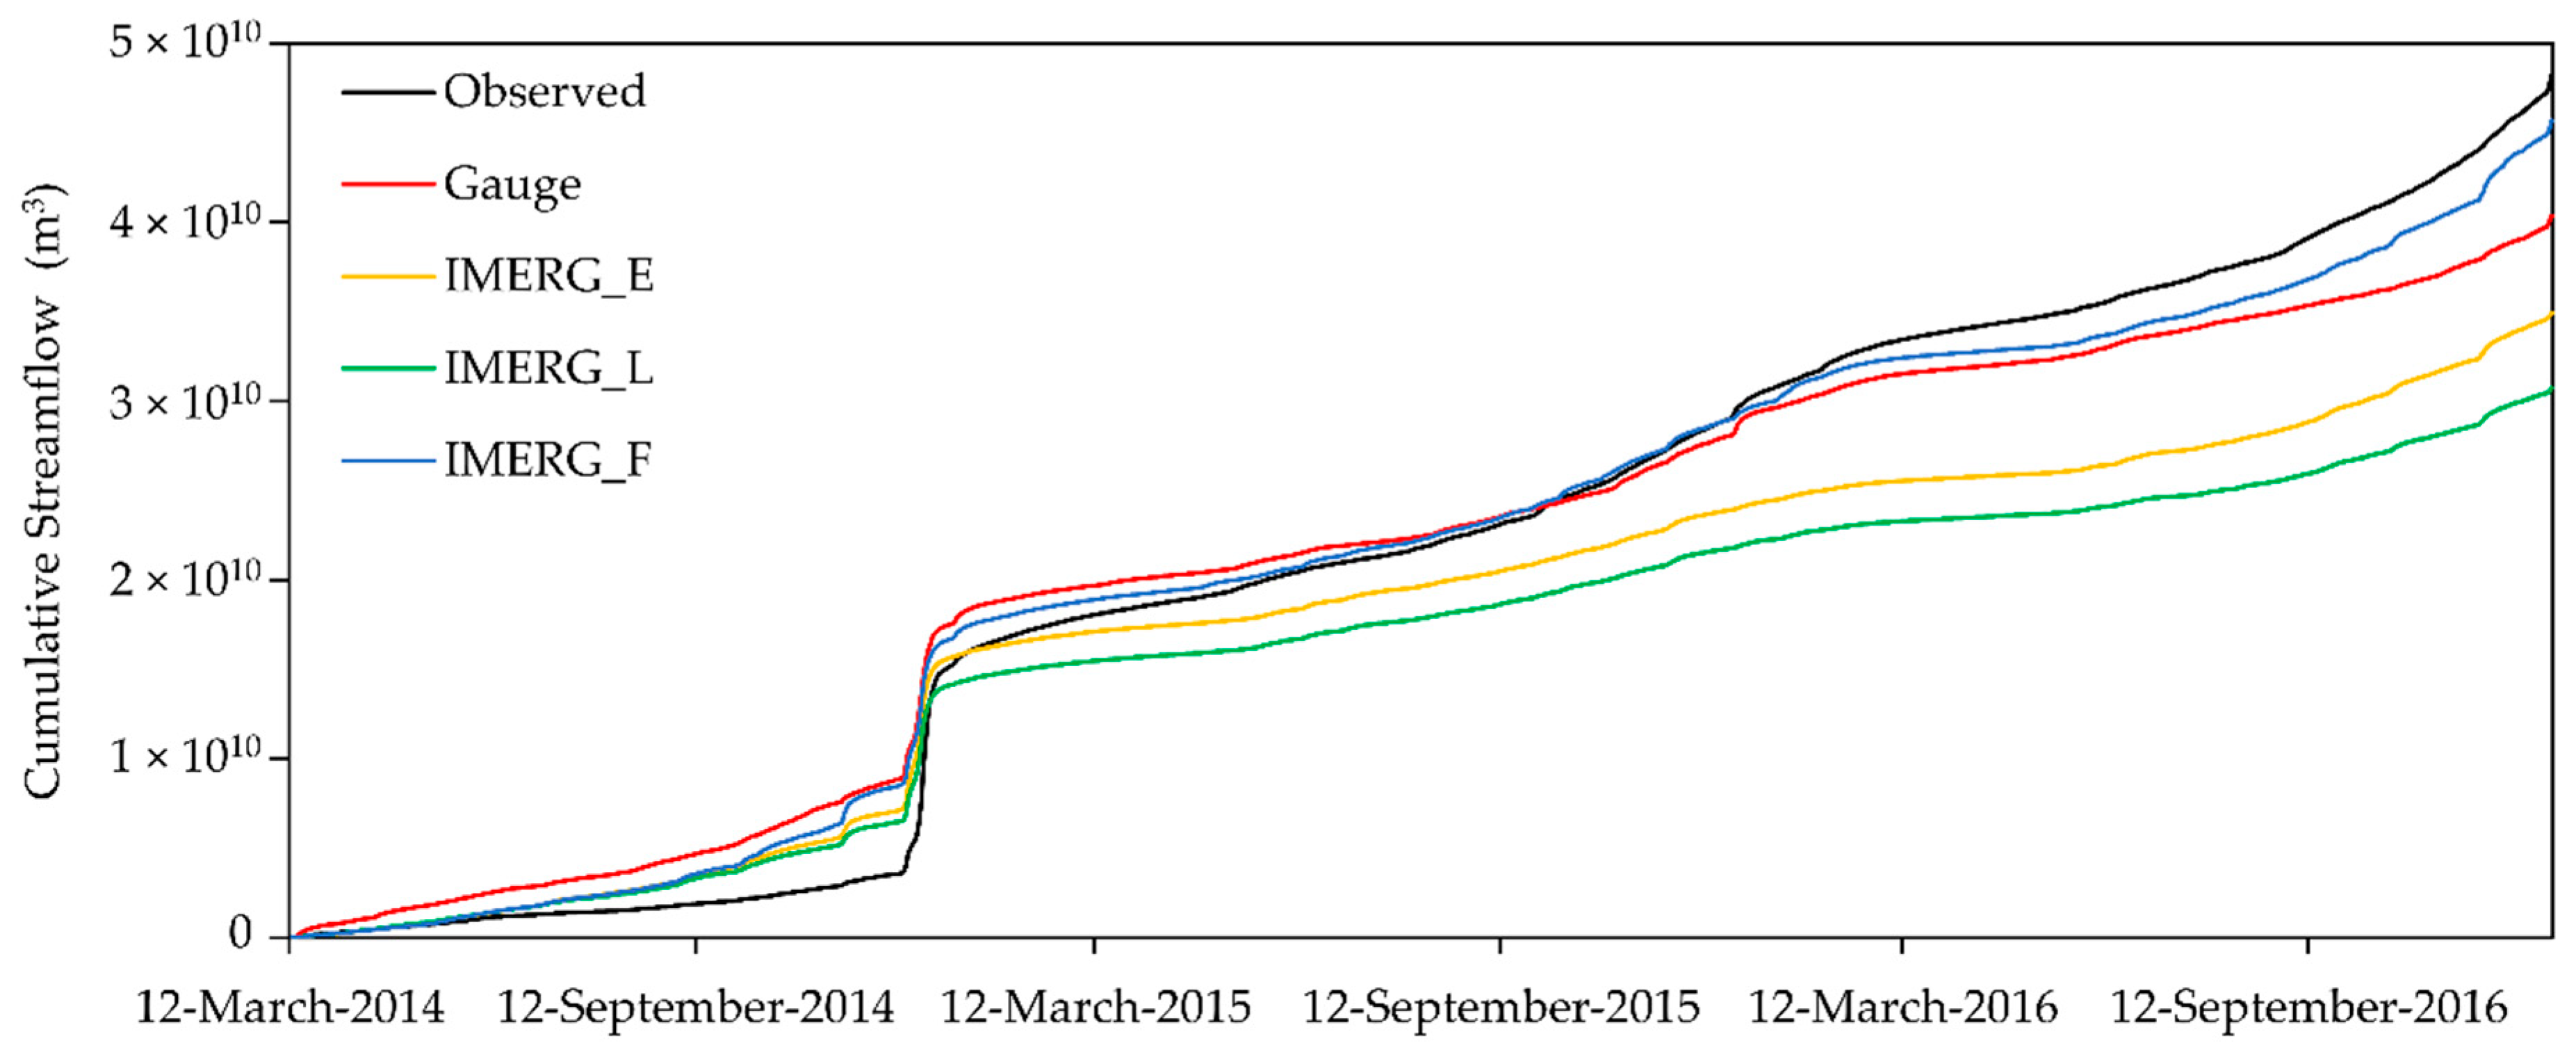
A comparison of the cumulative streamflow as a function of time simulated by the three GPM products at the Jambatan Guillermard was conducted to understand how the streamflow cumulative errors propagate with time. As shown in Figure 7, cumulative streamflow increased dramatically in December 2014 due to the big yellow flood event. The three GPM IMERG products and precipitation gauges overestimated the observed accumulative streamflow from March to December 2014. Meanwhile, a significant underestimation of accumulative streamflow was simulated by the IMERG_E and IMERG_L from January 2015 to December 2016. The IMERG_F had a lower streamflow cumulative error compared to the near real-time products because it captured the peak flows better (Figure 5). This finding, while preliminary, suggests that the gauge-adjustment scheme within IMERG_F improves the peak flows simulations and cumulative streamflow measurements in KRB.
4.4. The 2014–2015 Flood Assessment
The final aspect of the GPM IMERG products hydro-meteorological assessment was to evaluate their reliability during the 2014–2015 flood event from 14 December 2014 to 3 January 2015. Table 1 illustrates that the overall statistical metric values of the daily precipitation measurement during the 2014–2015 flood period are better than the entire period, except for the RMSE and MAD values. For example, the CC and POD values of the IMERG_E for the flood period improved 0.17 and 0.14, respectively, compared to the entire period. As shown in the box plots of Figure 8, the statistical metric values distribution of all three GPM IMERG products are similar, showing that the IMERG_F displays no advantage in daily precipitation measurement during the 2014–2015 flood events. The precipitation detection ability of the IMERG products increased dramatically during the flood period because better score values were found in most of the categorical statistical metrics. For instance, FAR values of the IMERG products decreased from 0.39–0.41 to 0.05–0.06, showing only about 5% of the SPPs detected precipitation events were not observed in the precipitation gauges. CSI and ACC values indicated that about 90% of the precipitation and non-precipitation days were successfully detected by the IMERG products during the 2014–2015 flood period.
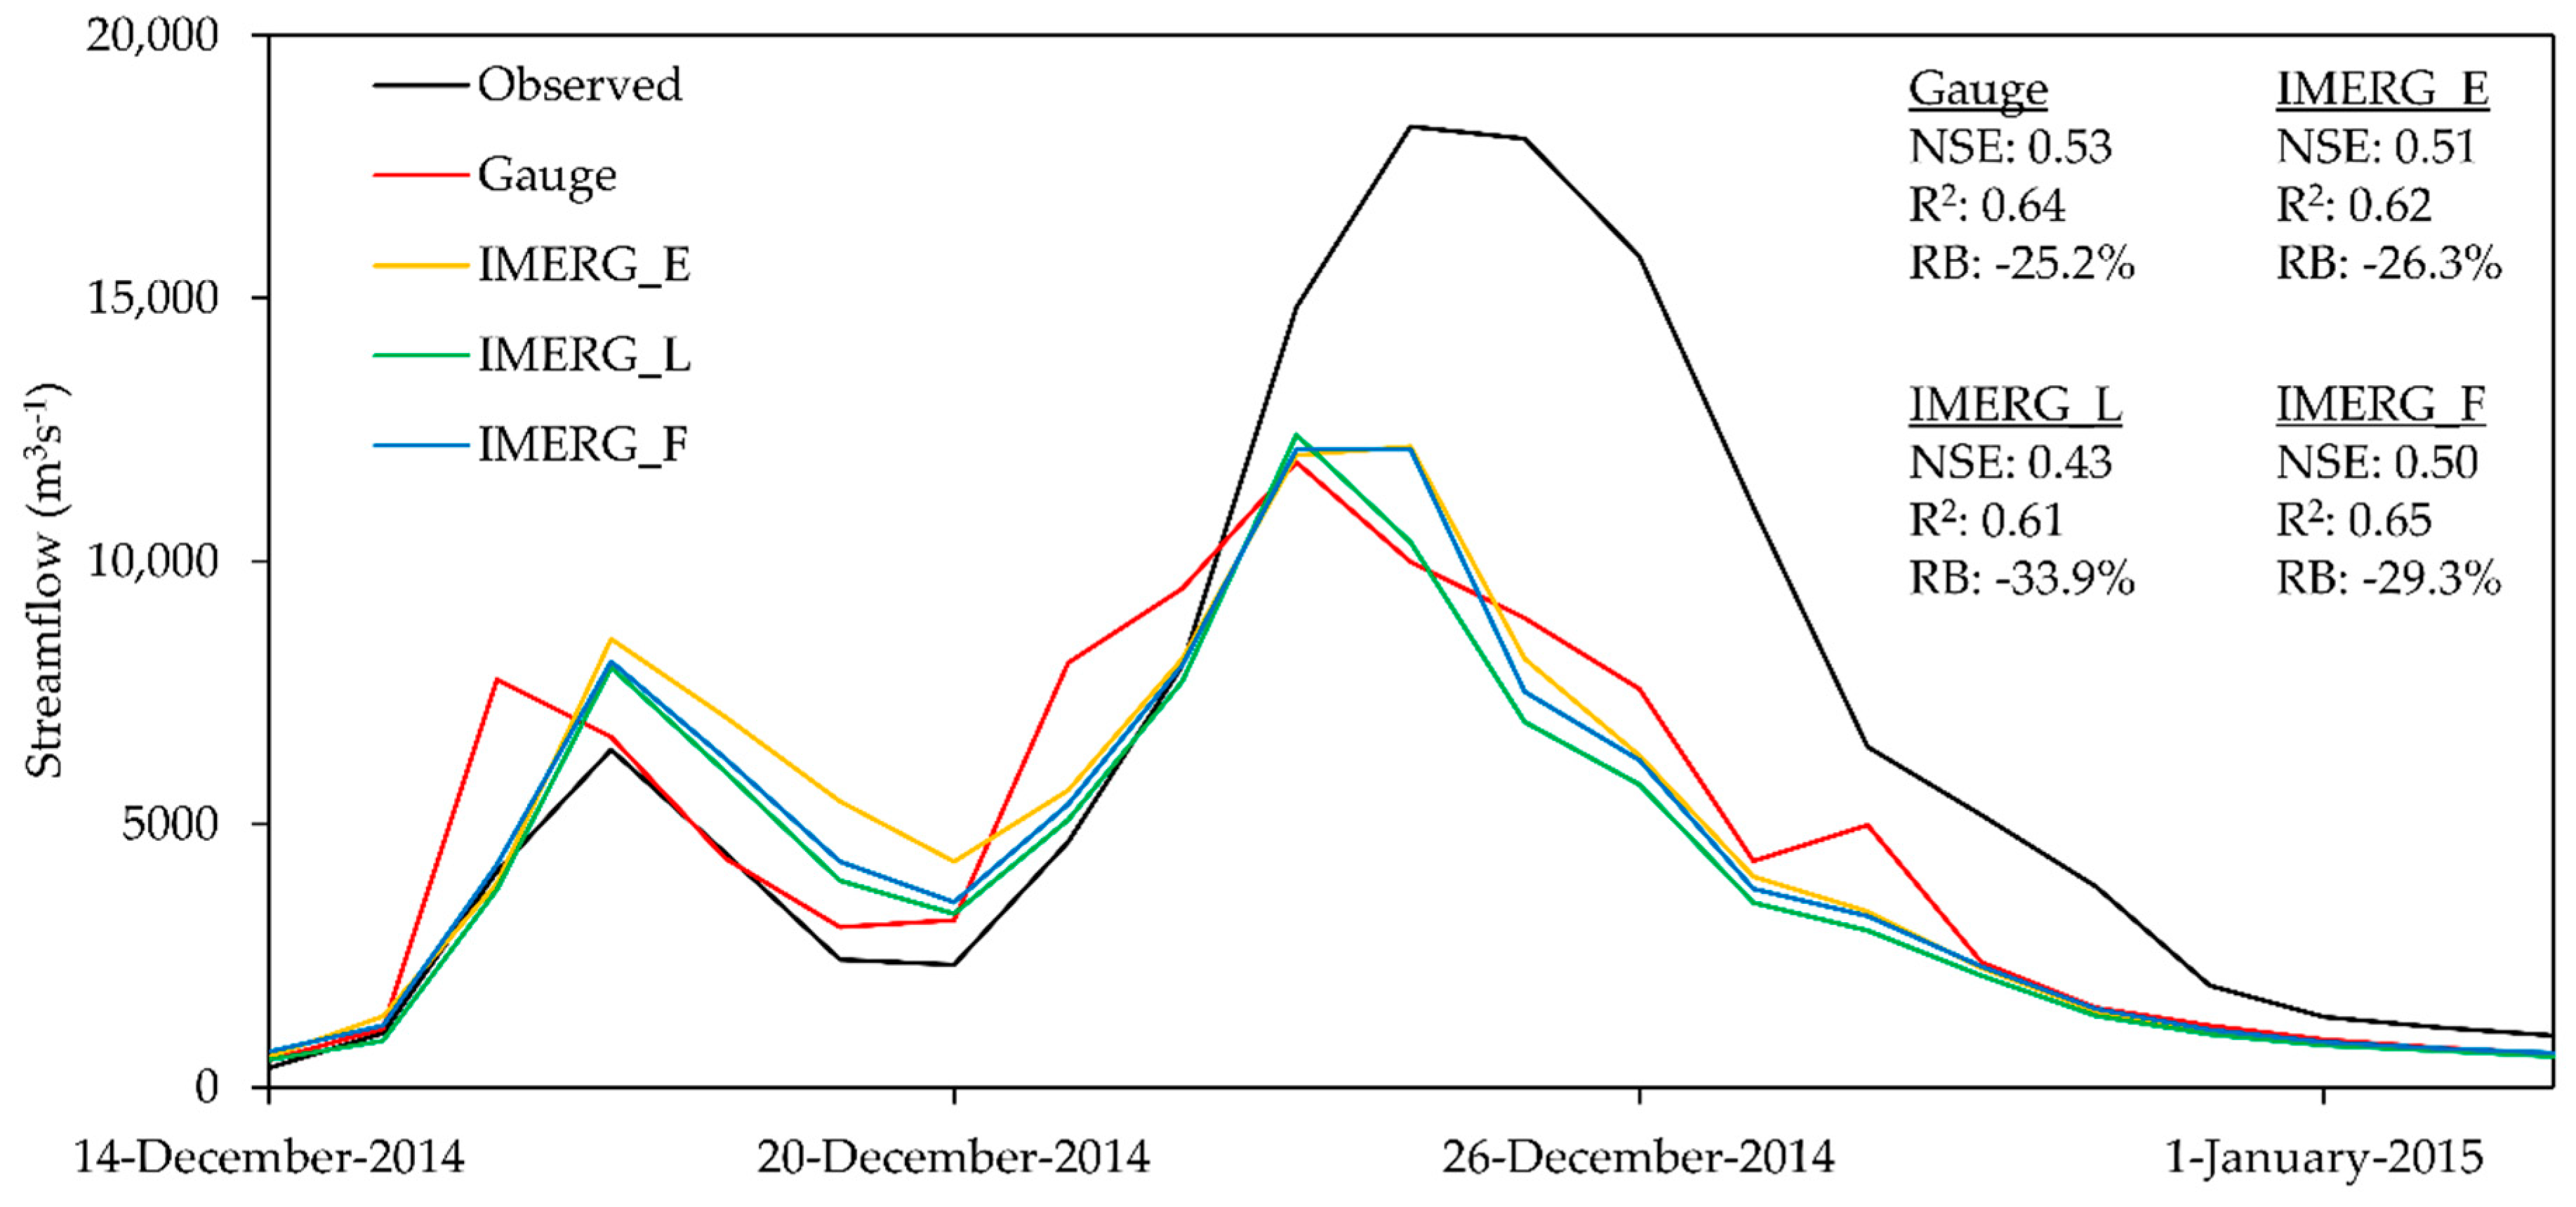
The statistical metrics and temporal variability of the SWAT daily streamflow executed by the three IMERG products are summarized in Figure 9. Interestingly, hydrological assessment showed a contradictory result compared to meteorology assessment, where the performance of all three GPM IMERG products performed comparatively poorer in the 2014–2015 flood period compared to the entire period. A possible explanation for these results may be the NSE and R2 statistical metrics are oversensitive to high extreme values [34,38]. However, the SWAT performance of the IMERG_E and IMERG_F was still regarded as a satisfactory performance based on the NSE and R2 values. In addition, Figure 9 shows that IMERG_E and IMERG_F accurately simulated the peak flow day on 24 December 2014. Meanwhile the peak flow simulated by the IMERG_L was found a day earlier. These findings indicate that the IMERG_E and IMERG_F can be alternative precipitation sources to monitor the flood event of the basin. One thing that needs to be considered is the peak flow rate, as all the IMERG products as well as the precipitation gauges underestimated the peak flow from 23 to 28 December 2014.
5. Discussion
One unanticipated finding was that the gauge-adjusted IMERG_F did not show significant improvement compared to the near real-time products in hydro-meteorological assessment. These results agree with the findings reported in the Beijing River Basin [12] and Malaysia [7]. In the current study, the IMERG_F only shows improvement in term of the bias systematic error for the entire period, while its reliability during the 2014–2015 flood period is similar to those near real-time products. This situation can be explained in part by the usage of the monthly precipitation gauges in the IMERG_F bias correction cannot capture the rapidly-changing daily precipitation. Moreover, only 24~37 precipitation gauges (different every year) distributed over Malaysia were supplied for the GPCC product development [7], and these gauges are insufficient to improve the IMERG_F effectively for a basin-scale application. To increase the reliability of the IMERG_F in hydro-meteorological applications, a comprehensive bias correction scheme with more daily observed precipitation data is needed.
As shown in the hydrological assessment section, the IMERG products could be used to study the hydrological cycle in the KRB. The reason for this is the IMERG products show comparable SWAT daily and monthly simulations with the precipitation gauges. However, improvement of the SWAT modelling in tropical regions is needed as it was initially constructed based on the climate and environmental conditions in the United States. For example, in recent years, some studies have been conducted to improve the paddy module within the SWAT model [39,40]. As oil palm plantation is a major crop in tropical countries including Malaysia, Indonesia, and some African countries, so modification of the oil palm module might be able to increase the reliability of the SWAT model in the tropical regions.
Another suggestion for improving the IMERG products hydro-meteorological assessment is the development of a unification GPM hydro-meteorological reliability assessment framework. For instance, through the application of the same hydrological model and statistical metrics in the assessment. To date, numerous hydrological models were applied in the GPM hydrological assessment, including Xinanjiang model [10], Variable Infiltration Capacity (VIC) model [12], Coupled Routing and Excess Storage (CREST) model [13,14], and SWAT model (this study). Each hydrological model has its own characteristics and computational mechanisms, causing a hydrological model uncertainty. Therefore, it is quite difficult to make a fair comparison among GPM hydro-meteorological assessment studies.
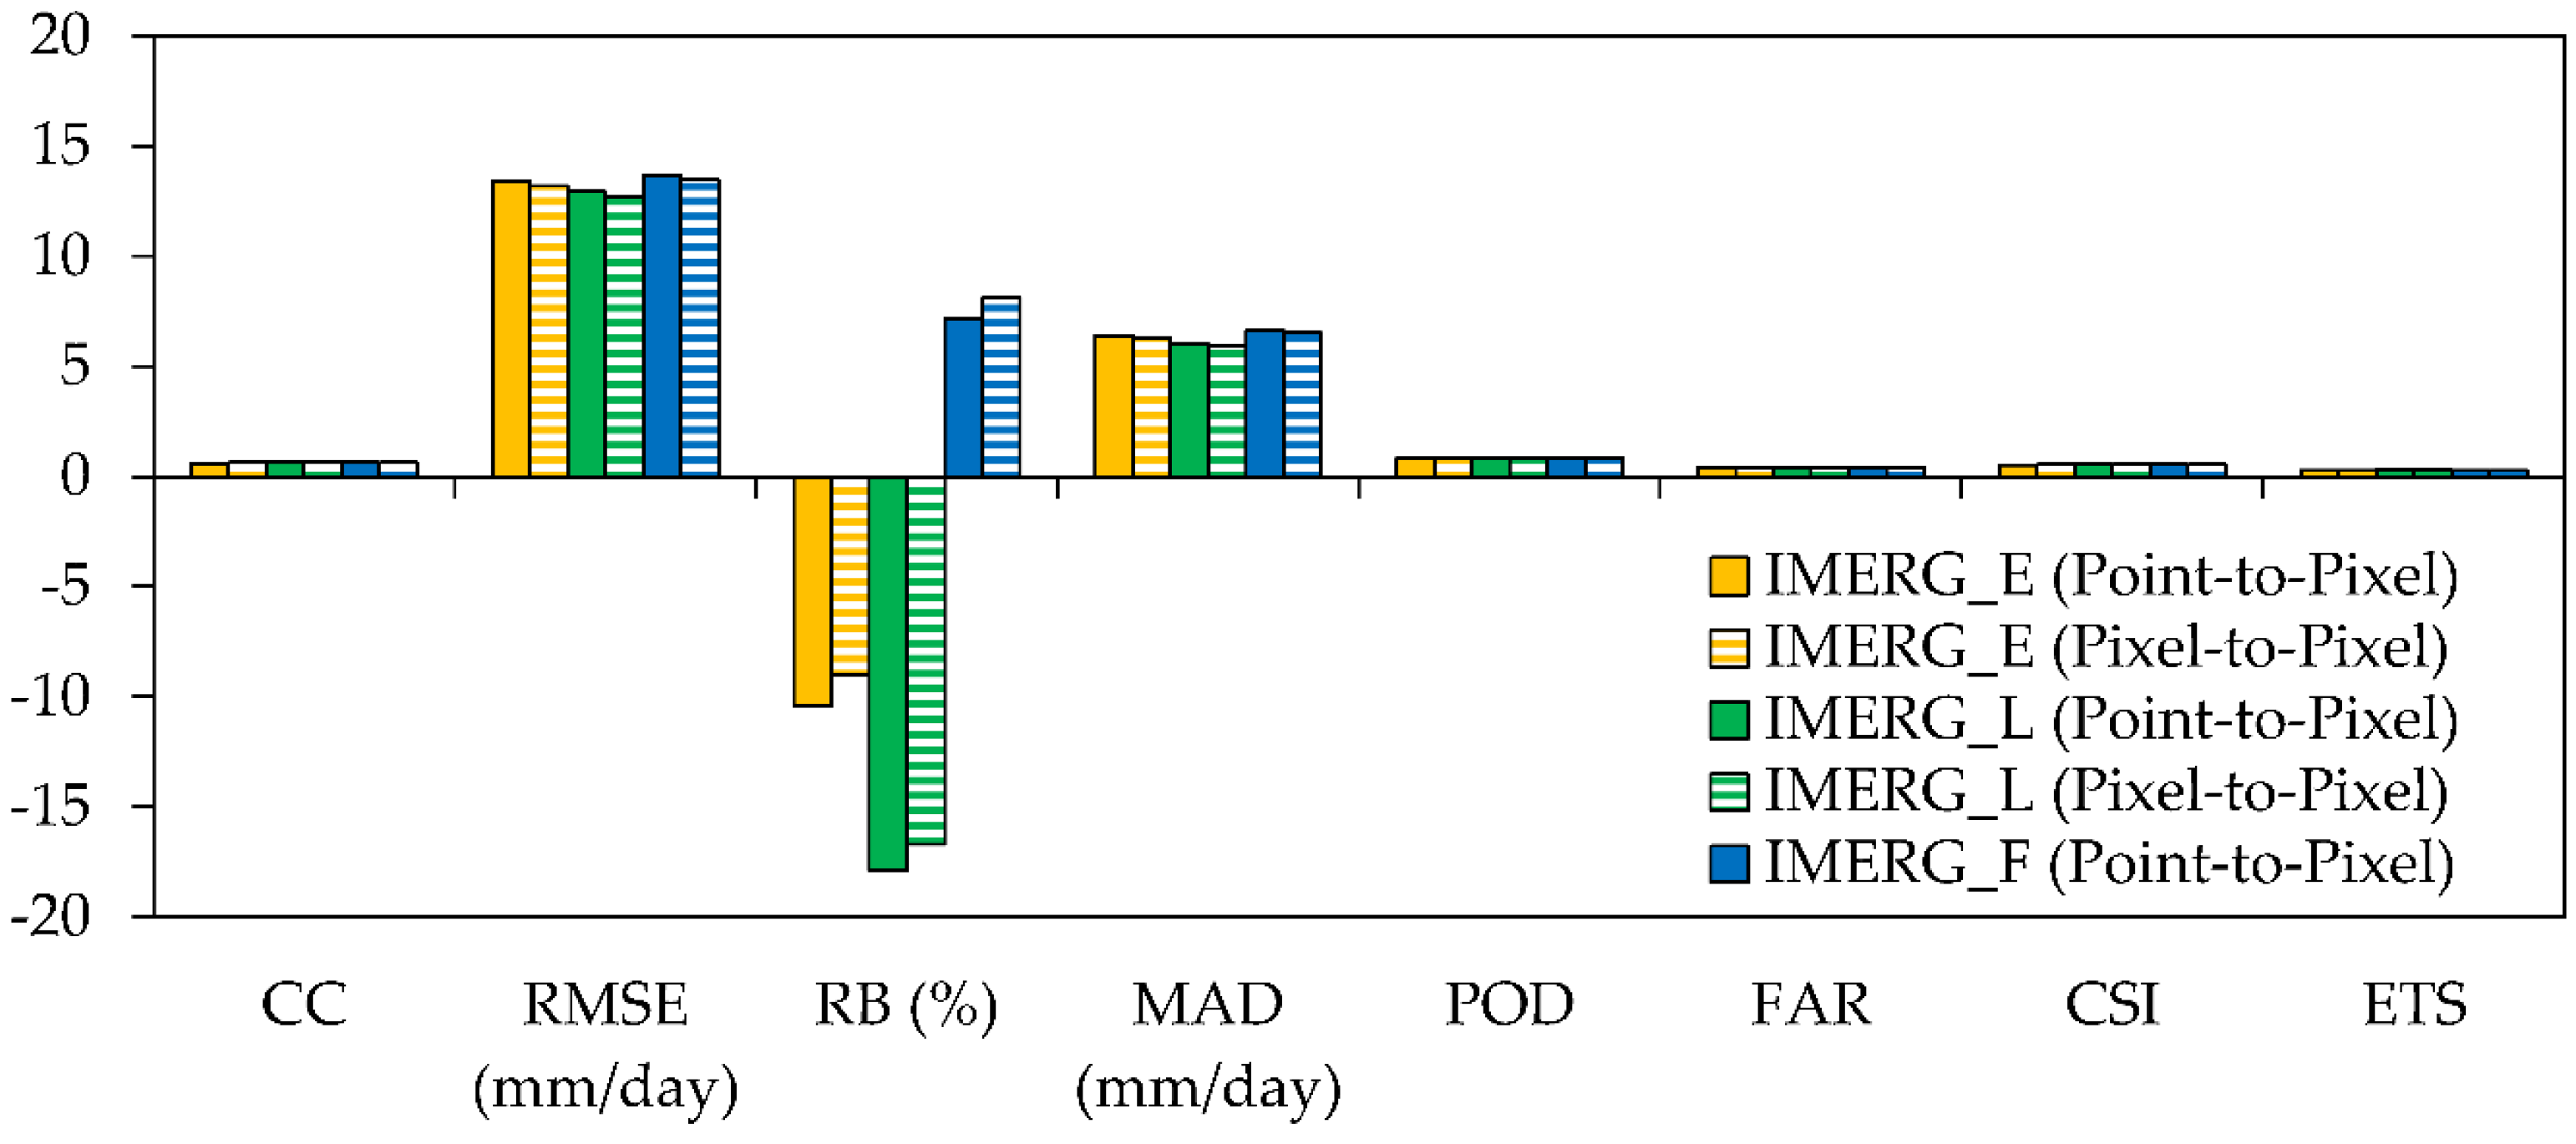
A major issue of SPPs assessment studies is the mismatch between the spatial between gauge (point) and the SPPs (pixel) [3]. Also, satellite measures precipitation from the sky, but gauge collects precipitation on the ground. It is interesting to contemplate whether the comparison approach would influence to the results of SPPs assessment. We compared the point-to-pixel and pixel-to-pixel approaches in the IMERG products validation over KRB. The latter approach was conducted by averaging the precipitation data of two or more gauges within a pixel first before the comparison. Figure 10 shows that the selection of comparison approach did not have much influence on the conclusions of the study. Overall, statistical metric values among the three IMERG products as calculated by the point-to-pixel and pixel-to-pixel approaches are quite similar. Such a comparison should be conducted in other regions as well to identify the uncertainty of the point-to-pixel and pixel-to-pixel approaches in the SPPs validation studies.
6. Conclusions
The purpose of the current study was to assess the reliability of the IMERG products (IMERG_E, IMERG_L and IMERG_F) in hydro-meteorological applications in the KRB, Malaysia. First, a meteorological assessment was conducted using the continuous (CC, RMSE, RB, and MAD) and categorical (POD, FAR, CSI, ETS, and ACC) statistical metrics from 12 March 2014 to 31 December 2016. Second, SWAT model development, a parameters sensitivity analysis, calibration, and validation were conducted. Three statistical metrics (NSE, R2 and RB) were used to validate the SWAT-simulated streamflow. Third, the IMERG products were incorporated into the calibrated SWAT to evaluate their capability in daily, monthly, and cumulative streamflow simulations. The final part involved the hydro-meteorological assessment of the IMERG products in the 2014–2015 flood period from 14 December 2014 to 3 January 2015. The main conclusions are summarized as follows:
- -
- The temporal variability of monthly precipitation was well captured by the IMERG products, with low precipitation amounts in February 2015 and March 2016, and high precipitation amounts in December 2014. The IMERG_F slightly outperformed the IMERG_E and IMERG_L in terms of systematic bias, with a RB value of 7.14%.
- -
- The SWAT model performed “good” in daily streamflow simulations, with NSE and R2 values of 0.74 and 0.79, respectively. However, the model underestimated the daily streamflow by 16.4%, particularly during the peak flows. Because SWAT daily streamflow validation is relatively low in Malaysia, this study could act as a reference to those would like to study the daily scale of the Malaysian hydrological cycle. A modification of the oil palm module within the SWAT module is essential to improve the model’s capability in tropical regions.
- -
- The IMERG products performed comparable with precipitation gauges in streamflow simulations, indicating a great potential in tropical hydrology applications. Overall, the IMERG_F (NSE = 0.71~0.86, R2 = 0.73~0.9 and RB = −5.3%~−7.1%) performed the best in both daily and monthly streamflow simulations, followed by the IMERG_E (NSE = 0.7~0.81, R2 = 0.75~0.91 and RB = −27.6%~−28.3%), and IMERG_L (NSE = 0.66~0.73 and R2 = 0.75~0.91 and RB = −36.3%~−36.6%). The near real-time products underestimated the daily and monthly streamflow significantly, so a systematic bias correction is essential prior to applying them in any operational applications.
- -
- Similar to the findings reported by Tan and Santo [7], the IMERG products have better meteorological performance in the 2014–2015 flood period than the entire period. In contrast to the meteorological assessment, all three products have a poorer hydrological performance in the 2014–2015 flood period compared to the entire period. Nevertheless, the performance of the IMERG_E and IMERG_F was still regarded as “satisfactory” in the flood streamflow simulations based on the NSE and R2 values of 0.5~0.51 and 0.62~0.65, respectively. One thing to be considered is that the IMERG products underestimated the peak flow rate from 23 to 28 December 2014.
Overall, the GPM IMERG products show a great potential for hydro-meteorological applications in the KRB. A further study on the development of a standardized GPM hydro-meteorological assessment framework (i.e., same hydrological model, statistical metrics, and same GPM IMERG products) is essential to make a fair comparison among studies from different climate and geographical conditions. Finally, the assessment of the IMERG products in other applications such as agricultural, ecological, and fish habitat monitoring is also required in the future.
Author Contributions
M.L.T. collected, processed, and analyzed the data, and drafted the manuscript. N.S., N.W.C. and R.R. reviewed and edited the manuscript.
Funding
This research was funded by the Ministry of Higher Education Malaysia grant number [FRGS Grant No. 203/PHUMANITI/6711472] and Universiti Sains Malaysia Short-term Research Grant [Grant No. 304/PHUMANITI/6315166].
Acknowledgments
The authors acknowledge the Malaysian government agencies and the IMERG products developer for providing the data in this study. Also, the authors thank to the SWAT developers for making the SWAT model as a public domain model. The authors greatly appreciate the constructive comments and suggestions from the three anonymous reviewers.
Conflicts of Interest
The authors declare no conflict of interest.
References
- Garcia, M.; Peters-Lidard, C.D.; Goodrich, D.C. Spatial interpolation of precipitation in a dense gauge network for monsoon storm events in the southwestern United States. Water Resour. Res. 2008, 44. [Google Scholar] [CrossRef] [Green Version]
- Yang, X.; Xie, X.; Liu, D.L.; Ji, F.; Wang, L. Spatial interpolation of daily rainfall data for local climate impact assessment over greater sydney region. Adv. Meteorol. 2015, 2015. [Google Scholar] [CrossRef]
- Tan, M.; Duan, Z. Assessment of GPM and TRMM precipitation products over Singapore. Remote Sens. 2017, 9, 720. [Google Scholar] [CrossRef]
- Hou, A.Y.; Kakar, R.K.; Neeck, S.; Azarbarzin, A.A.; Kummerow, C.D.; Kojima, M.; Oki, R.; Nakamura, K.; Iguchi, T. The global precipitation measurement mission. Bull. Am. Meteorol. Soc. 2014, 95, 701–722. [Google Scholar] [CrossRef]
- Tang, G.; Ma, Y.; Long, D.; Zhong, L.; Hong, Y. Evaluation of GPM day-1 IMERG and TMPA version-7 legacy products over mainland China at multiple spatiotemporal scales. J. Hydrol. 2016, 533, 152–167. [Google Scholar] [CrossRef]
- Anjum, M.N.; Ding, Y.; Shangguan, D.; Ahmad, I.; Ijaz, M.W.; Farid, H.U.; Yagoub, Y.E.; Zaman, M.; Adnan, M. Performance evaluation of latest Integrated Multi-satellite Retrievals for Global Precipitation Measurement (IMERG) over the northern highlands of Pakistan. Atmos. Res. 2018, 205, 134–146. [Google Scholar] [CrossRef]
- Tan, M.L.; Santo, H. Comparison of GPM IMERG, TMPA 3B42 and PERSIANN-CDR satellite precipitation products over malaysia. Atmos. Res. 2018, 202, 63–76. [Google Scholar] [CrossRef]
- Asong, Z.E.; Razavi, S.; Wheater, H.S.; Wong, J.S. Evaluation of Integrated Multisatellite Retrievals for GPM (IMERG) over southern Canada against ground precipitation observations: A preliminary assessment. J. Hydrometeorol. 2017, 18, 1033–1050. [Google Scholar] [CrossRef]
- Tan, M.L.; Gassman, P.W.; Cracknell, A.P. Assessment of three long-term gridded climate products for hydro-climatic simulations in tropical river basins. Water 2017, 9, 229. [Google Scholar] [CrossRef]
- Yuan, F.; Zhang, L.; Win, K.; Ren, L.; Zhao, C.; Zhu, Y.; Jiang, S.; Liu, Y. Assessment of GPM and TRMM multi-satellite precipitation products in streamflow simulations in a data-sparse mountainous watershed in Myanmar. Remote Sens. 2017, 9, 302. [Google Scholar] [CrossRef]
- Pakoksung, K.; Takagi, M. Effect of satellite based rainfall products on river basin responses of runoff simulation on flood event. Model. Earth Syst. Environ. 2016, 2, 143. [Google Scholar] [CrossRef]
- Wang, Z.; Zhong, R.; Lai, C.; Chen, J. Evaluation of the GPM IMERG satellite-based precipitation products and the hydrological utility. Atmos. Res. 2017, 196, 151–163. [Google Scholar] [CrossRef]
- Tang, G.; Zeng, Z.; Long, D.; Guo, X.; Yong, B.; Zhang, W.; Hong, Y. Statistical and hydrological comparisons between trmm and gpm level-3 products over a midlatitude basin: Is day-1 IMERG a good successor for TMPA 3B42V7? J. Hydrometeorol. 2016, 17, 121–137. [Google Scholar] [CrossRef]
- Li, N.; Tang, G.; Zhao, P.; Hong, Y.; Gou, Y.; Yang, K. Statistical assessment and hydrological utility of the latest multi-satellite precipitation analysis IMERG in Ganjiang River basin. Atmos. Res. 2017, 183, 212–223. [Google Scholar] [CrossRef]
- Zubieta, R.; Getirana, A.; Espinoza, J.C.; Lavado-Casimiro, W.; Aragon, L. Hydrological modeling of the Peruvian—Ecuadorian Amazon basin using GPM-IMERG satellite-based precipitation dataset. Hydrol. Earth Syst. Sci. 2017, 21, 3543–3555. [Google Scholar] [CrossRef]
- Tan, M.; Tan, K.; Chua, V.; Chan, N. Evaluation of TRMM product for monitoring drought in the Kelantan River Basin, Malaysia. Water 2017, 9, 57. [Google Scholar] [CrossRef]
- Huffman, G.J.; Bolvin, D.T.; Nelkin, E.J. Integrated Multi-Satellite Retrievals for GPM (IMERG) Technical Documentation; NASA/GSFC: Greenbelt, MD, USA, 2017. [Google Scholar]
- Precipitation Measurement Missions. Available online: https://pmm.Nasa.Gov/data-access/downloads/gpm (accessed on 3 April 2018).
- Arnold, J.G.; Srinivasan, R.; Muttiah, R.S.; Williams, J.R. Large area hydrologic modeling and assessment part I: Model development. J. Am. Water Resour. Assoc. 1998, 34, 73–89. [Google Scholar] [CrossRef]
- Mannschatz, T.; Wolf, T.; Hülsmann, S. Nexus tools platform: Web-based comparison of modelling tools for analysis of water-soil-waste nexus. Environ. Model. Softw. 2016, 76, 137–153. [Google Scholar] [CrossRef]
- Arnold, J.G.; Kiniry, J.R.; Srinivasan, R.; Williams, J.R.; Haney, E.B.; Neitsch, S.L. Soil Andwater Assessment Tool Input/Tool File Documentation. Version 2012; Texas Water Resources Institute: College Station, TX, USA, 2012. [Google Scholar]
- Neitsch, S.L.; Arnold, J.G.; Kiniry, J.R.; Grassland, J.R.W. Soil and Water Assessment Tool Theoretical Documentation Version 2009; Agricultural Research Service Blackland Research Center: Temple, TX, USA, 2011. [Google Scholar]
- Tan, M.L.; Ficklin, D.; Ibrahim, A.L.; Yusop, Z. Impacts and uncertainties of climate change on streamflow of the Johor River Basin, Malaysia using a CMIP5 general circulation model ensemble. J. Water Clim. Chang. 2014, 5, 676–695. [Google Scholar] [CrossRef]
- Tan, M.L.; Ibrahim, A.L.; Yusop, Z.; Duan, Z.; Ling, L. Impacts of land-use and climate variability on hydrological components in the Johor River Basin, Malaysia. Hydrol. Sci. J. 2015, 60, 873–889. [Google Scholar] [CrossRef]
- Dlamini, N.S.; Kamal, M.R.; Soom, M.A.B.M.; Mohd, M.S.F.b.; Abdullah, A.F.B.; Hin, L.S. Modeling potential impacts of climate change on streamflow using projections of the 5th assessment report for the Bernam River Basin, Malaysia. Water 2017, 9, 226. [Google Scholar] [CrossRef]
- Hasan, Z.A.; Hamidon, N.; Yusof, M.S.; Ghani, A.A. Flow and sediment yield simulations for Bukit Merah Reservoir catchment, Malaysia: A case study. Water Sci. Technol. 2012, 66, 2170–2176. [Google Scholar] [CrossRef] [PubMed]
- Memarian, H.; Balasundram, S.K.; Abbaspour, K.C.; Talib, J.B.; Boon Sung, C.T.; Sood, A.M. SWAT-based hydrological modelling of tropical land-use scenarios. Hydrol. Sci. J. 2014, 59, 1808–1829. [Google Scholar] [CrossRef] [Green Version]
- Tan, M.L.; Ibrahim, A.L.; Yusop, Z.; Chua, V.P.; Chan, N.W. Climate change impacts under CMIP5 RCP scenarios on water resources of the Kelantan River Basin, Malaysia. Atmos. Res. 2017, 189, 1–10. [Google Scholar] [CrossRef]
- Tan, M.; Ibrahim, A.; Duan, Z.; Cracknell, A.; Chaplot, V. Evaluation of six high-resolution satellite and ground-based precipitation products over Malaysia. Remote Sens. 2015, 7, 1504–1528. [Google Scholar] [CrossRef]
- Tan, M.L.; Ficklin, D.L.; Dixon, B.; Ibrahim, A.L.; Yusop, Z.; Chaplot, V. Impacts of DEM resolution, source, and resampling technique on SWAT-simulated streamflow. Appl. Geogr. 2015, 63, 357–368. [Google Scholar] [CrossRef] [Green Version]
- Condom, T.; Rau, P.; Espinoza, J.C. Correction of TRMM 3B43 monthly precipitation data over the mountainous areas of Peru during the period. Hydrol. Process. 2011, 25, 1924–1933. [Google Scholar] [CrossRef]
- Chokngamwong, R.; Chiu, L.S. Thailand daily rainfall and comparison with TRMM products. J. Hydrometeorol. 2008, 9, 256–266. [Google Scholar] [CrossRef]
- Feidas, H.; Porcu, F.; Puca, S.; Rinollo, A.; Lagouvardos, C.; Kotroni, V. Validation of the h-saf precipitation product H03 over Greece using rain gauge data. Theor. Appl. Climatol. 2018, 131, 377–398. [Google Scholar] [CrossRef]
- Moriasi, D.N.; Gitau, M.W.; Pai, N.; Daggupati, P. Hydrologic and water quality models: Performance measures and evaluation criteria. Trans. ASABE 2015, 58, 1763–1785. [Google Scholar]
- Tam, N.V.; Jörg, D. Modification of the SWAT model to simulate regional groundwater flow using a multicell aquifer. Hydrol. Process. 2018, 32, 939–953. [Google Scholar]
- Krysanova, V.; White, M. Advances in water resources assessment with SWAT—An overview. Hydrol. Sci. J. 2015, 60, 771–783. [Google Scholar] [CrossRef]
- Tan, M.L.; Chua, V.P.; Tan, K.C.; Brindha, K. Evaluation of TMPA 3B43 and NCEP-CFSR precipitation products in drought monitoring over Singapore. Int. J. Remote Sens. 2018, 39, 2089–2104. [Google Scholar] [CrossRef]
- Krause, P.; Boyle, D.; Bäse, F. Comparison of different efficiency criteria for hydrological model assess. Adv. Geosci. 2005, 5, 89–97. [Google Scholar] [CrossRef]
- Sakaguchi, A.; Eguchi, S.; Kato, T.; Kasuya, M.; Ono, K.; Miyata, A.; Tase, N. Development and evaluation of a paddy module for improving hydrological simulation in SWAT. Agric. Water Manag. 2014, 137, 116–122. [Google Scholar] [CrossRef]
- Sakaguchi, A.; Eguchi, S.; Kasuya, M. Examination of the water balance of irrigated paddy fields in SWAT 2009 using the curve number procedure and the pothole module. Soil Sci. Plant Nutr. 2014, 60, 551–564. [Google Scholar] [CrossRef] [Green Version]
Figure 1.
Maps of (a) Peninsular Malaysia and (b) Kelantan River Basin.
Figure 2.
Temporal pattern of monthly precipitation estimated by gauge and the Global Precipitation Measurement Integrated Multi-Satellite Retrievals (GPM IMERG) products from March 2014 to December 2016.
Figure 2.
Temporal pattern of monthly precipitation estimated by gauge and the Global Precipitation Measurement Integrated Multi-Satellite Retrievals (GPM IMERG) products from March 2014 to December 2016.
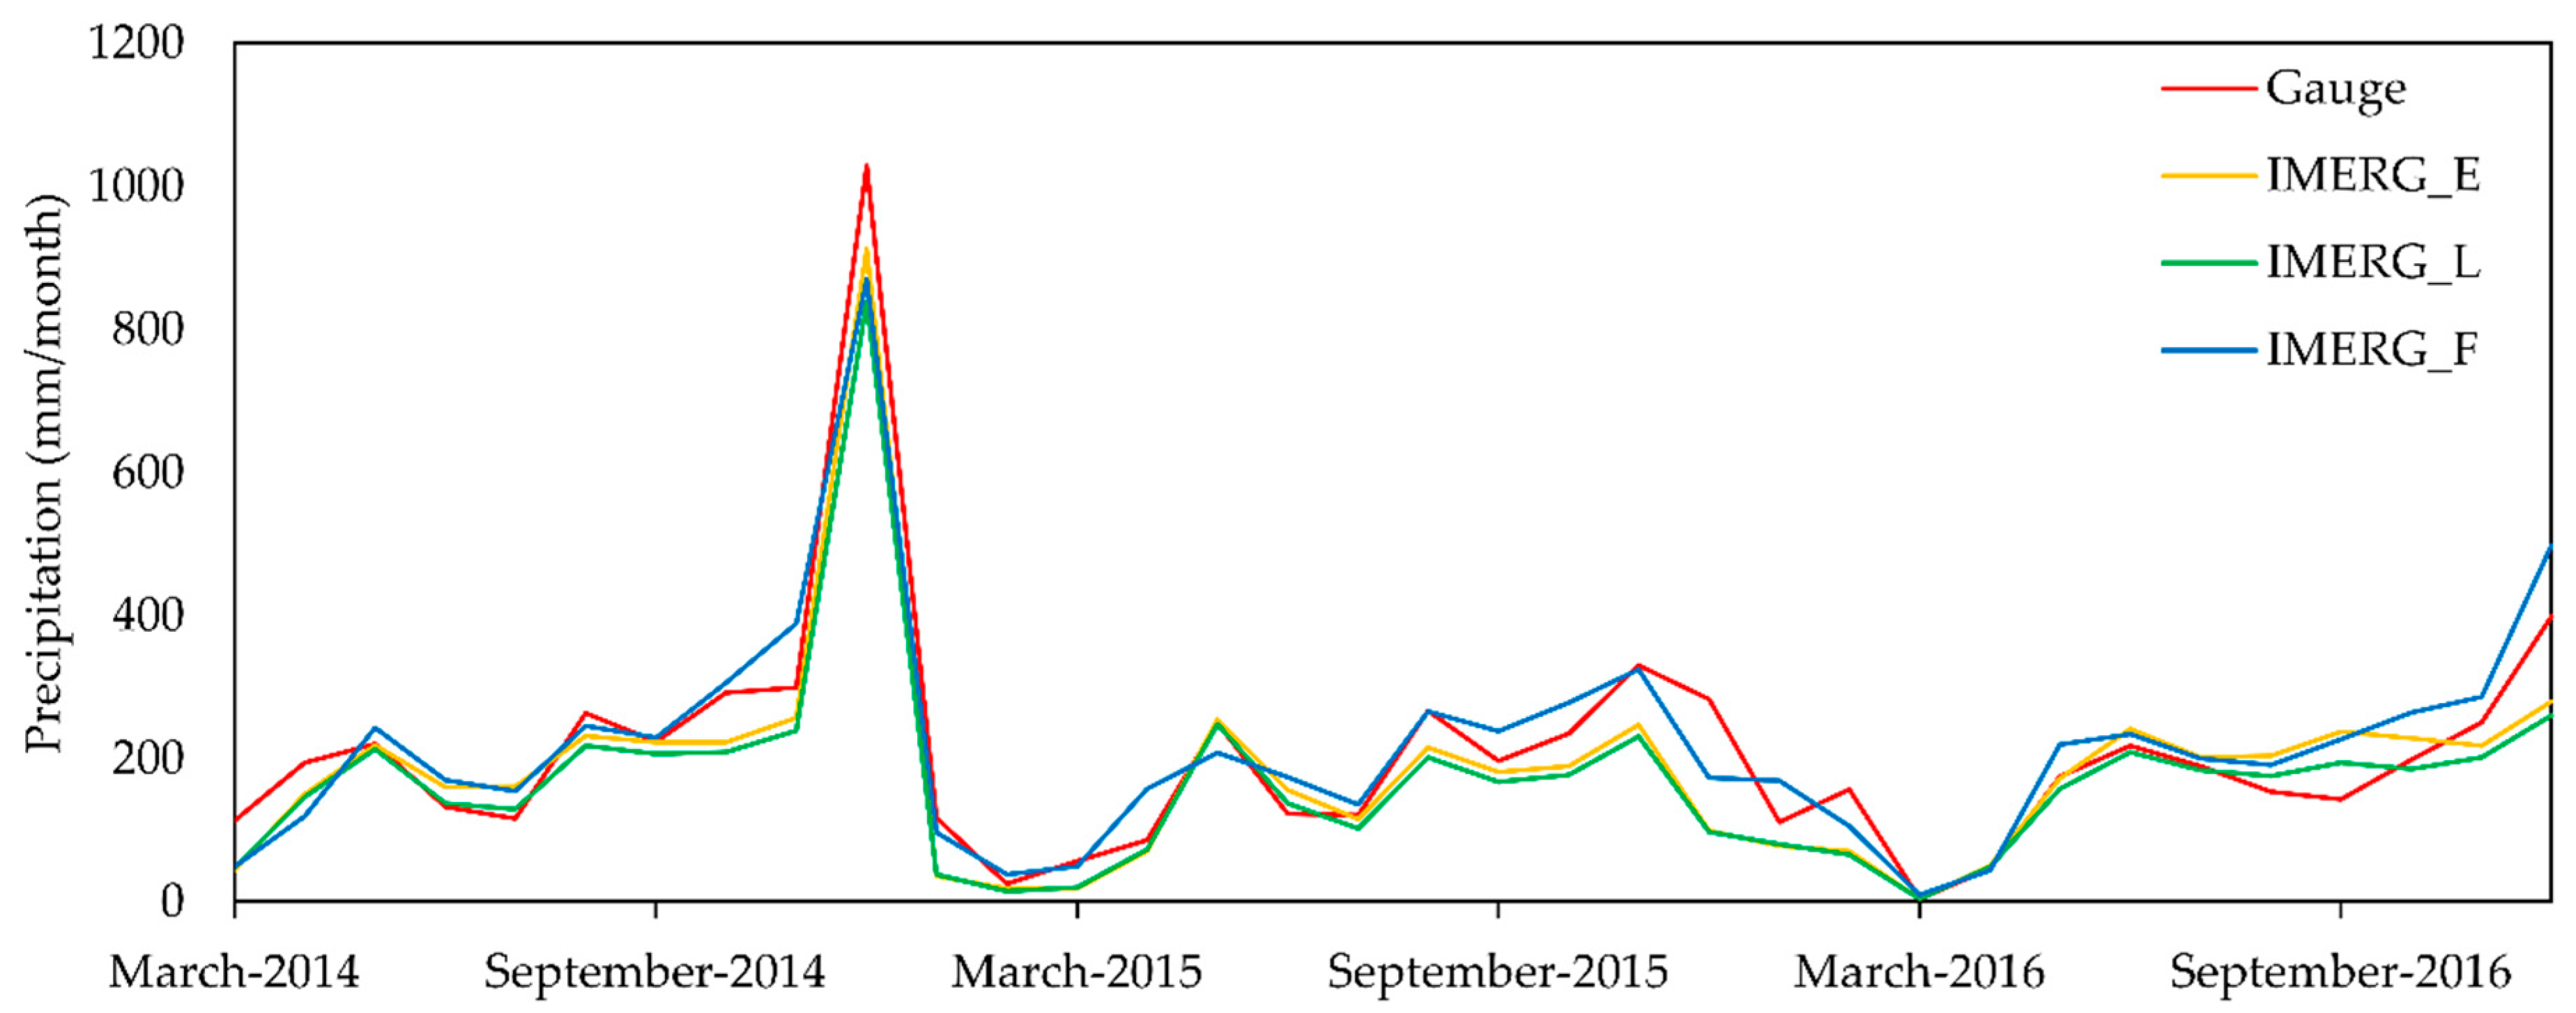
Figure 3.
Box plots of (a) Correlation Coefficient (CC); (b) Root Mean Square Error (RMSE) (c) Relative Bias (RB) and (d) Mean Absolute Difference (MAD) of the GPM IMERG products against gauge for daily precipitation assessment from 12 March 2014 to 31 December 2016.
Figure 3.
Box plots of (a) Correlation Coefficient (CC); (b) Root Mean Square Error (RMSE) (c) Relative Bias (RB) and (d) Mean Absolute Difference (MAD) of the GPM IMERG products against gauge for daily precipitation assessment from 12 March 2014 to 31 December 2016.
Figure 4.
Calibration (1 January 2011–31 December 2013) and validation (12 March 2014–31 December 2016) of the SWAT-simulated daily streamflow with observed streamflow at the Jambatan Guillermard.
Figure 4.
Calibration (1 January 2011–31 December 2013) and validation (12 March 2014–31 December 2016) of the SWAT-simulated daily streamflow with observed streamflow at the Jambatan Guillermard.
Figure 5.
Hydrological reliability assessment of the GPM IMERG products in simulating daily streamflow at the Jambatan Guillermard using the SWAT model from 12 March 2014 to 31 December 2016.
Figure 5.
Hydrological reliability assessment of the GPM IMERG products in simulating daily streamflow at the Jambatan Guillermard using the SWAT model from 12 March 2014 to 31 December 2016.
Figure 6.
Statistical analysis of the GPM IMERG products in SWAT-simulated monthly at the Jambatan Guillermard from March 2014 to December 2016.
Figure 6.
Statistical analysis of the GPM IMERG products in SWAT-simulated monthly at the Jambatan Guillermard from March 2014 to December 2016.

Figure 7.
Comparison of cumulative streamflow simulated by the IMERG products and gauge at the Jambatan Guillermard from 12 March 2014 to 31 December 2016.
Figure 7.
Comparison of cumulative streamflow simulated by the IMERG products and gauge at the Jambatan Guillermard from 12 March 2014 to 31 December 2016.
Figure 8.
Box plots of (a) CC; (b) RMSE; (c) RB and (d) MAD statistical metrics of the GPM IMERG products against gauge during the 2014–2015 flood period.
Figure 8.
Box plots of (a) CC; (b) RMSE; (c) RB and (d) MAD statistical metrics of the GPM IMERG products against gauge during the 2014–2015 flood period.

Figure 9.
Daily SWAT streamflow simulations during the 2014–2015 flood by gauge and three GPM IMERG products at the Jambatan Guillermard.
Figure 9.
Daily SWAT streamflow simulations during the 2014–2015 flood by gauge and three GPM IMERG products at the Jambatan Guillermard.
Figure 10.
Comparison of point-to-pixel and pixel-to-pixel approaches in measuring statistical metrics from 12 March 2014 to 31 December 2016 over Kelantan River Basin.
Figure 10.
Comparison of point-to-pixel and pixel-to-pixel approaches in measuring statistical metrics from 12 March 2014 to 31 December 2016 over Kelantan River Basin.

Table 1.
Statistical analysis of the IMERG products.
| IMERG_E | IMERG_L | IMERG_F | |
|---|---|---|---|
| Daily (1 January 2010–31 December 2016) | |||
| CC | 0.60 | 0.63 | 0.61 |
| RMSE (mm/day) | 13.41 | 12.93 | 13.69 |
| RB (%) | −10.42 | −17.92 | 7.14 |
| MAD (mm/day) | 6.38 | 6.02 | 6.64 |
| POD | 0.81 | 0.82 | 0.84 |
| FAR | 0.4 | 0.39 | 0.41 |
| CSI | 0.52 | 0.53 | 0.53 |
| ETS | 0.27 | 0.28 | 0.26 |
| ACC | 0.70 | 0.71 | 0.70 |
| Monthly (January 2010–December 2016) | |||
| CC | 0.86 | 0.87 | 0.86 |
| RMSE (mm/month) | 106.26 | 108.81 | 103.54 |
| RB (%) | −10.42 | −17.92 | 7.14 |
| MAD (mm/month) | 76.31 | 75.62 | 74.08 |
| The 2014–2015 flood (14 December 2014–3 January 2015) | |||
| CC | 0.77 | 0.79 | 0.79 |
| RMSE (mm/day) | 38.71 | 37.73 | 37.41 |
| RB (%) | −4.02 | −12.39 | −8.46 |
| MAD (mm/day) | 24.89 | 23.73 | 23.69 |
| POD | 0.95 | 0.94 | 0.95 |
| FAR | 0.06 | 0.05 | 0.06 |
| CSI | 0.89 | 0.90 | 0.89 |
| ETS | 0.64 | 0.67 | 0.65 |
| ACC | 0.91 | 0.92 | 0.91 |
Table 2.
Soil and Water Assessment Tool (SWAT) parameters (*1 most sensitive based on final range).
| No | Parameter Name | Parameter | Original | Final | Fitted | ||
|---|---|---|---|---|---|---|---|
| 1 | manning’s value for main channel | CH_N2 | 0.00 | 0.30 | 0.00 | 0.16 | 0.01 |
| 2 | baseflow alpha factor | ALPHA_BF | 0.00 | 1.00 | 0.46 | 1.00 | 0.97 |
| 3 | groundwater “revap” coefficient | GW_REVAP | 0.02 | 0.40 | 0.10 | 0.40 | 0.37 |
| 4 | channel effective hydraulic conductivity | CH_K2 | 0.00 | 500.00 | 234.00 | 500.00 | 483.77 |
| 5 | initial SCS CN II value | CN2 | 35.00 | 98.00 | 57.00 | 98.00 | 86.73 |
| 6 | threshold water depth in the shallow aquifer for flow | GWQMN | 0.00 | 5000.00 | 2276.00 | 5000.00 | 4757.56 |
| 7 | groundwater delay | GW_DELAY | 0.00 | 500.00 | 0.00 | 308.00 | 71.15 |
| 8 | available water capacity | SOL_AWC | 0.00 | 1.00 | 0.00 | 0.64 | 0.17 |
| 9 | threshold depth of water in the shallow aquifer for “revap” to occur | REVAPMN | 0.00 | 500.00 | 0.00 | 296.00 | 54.17 |
| 10 | deep aquifer percolation faction | RCHRG_DP | 0.00 | 1.00 | 0.00 | 0.65 | 0.19 |
| 11 | surface runoff lag time | SURLAG | 0.05 | 24.00 | 0.05 | 13.00 | 0.56 |
| 12 | soil evaporation compensation factor | ESCO | 0.00 | 1.00 | 0.43 | 1.00 | 0.92 |
© 2018 by the authors. Licensee MDPI, Basel, Switzerland. This article is an open access article distributed under the terms and conditions of the Creative Commons Attribution (CC BY) license (http://creativecommons.org/licenses/by/4.0/).
Share and Cite
MDPI and ACS Style
Tan, M.L.; Samat, N.; Chan, N.W.; Roy, R. Hydro-Meteorological Assessment of Three GPM Satellite Precipitation Products in the Kelantan River Basin, Malaysia. Remote Sens. 2018, 10, 1011. https://doi.org/10.3390/rs10071011
AMA Style
Tan ML, Samat N, Chan NW, Roy R. Hydro-Meteorological Assessment of Three GPM Satellite Precipitation Products in the Kelantan River Basin, Malaysia. Remote Sensing. 2018; 10(7):1011. https://doi.org/10.3390/rs10071011
Chicago/Turabian StyleTan, Mou Leong, Narimah Samat, Ngai Weng Chan, and Ranjan Roy. 2018. "Hydro-Meteorological Assessment of Three GPM Satellite Precipitation Products in the Kelantan River Basin, Malaysia" Remote Sensing 10, no. 7: 1011. https://doi.org/10.3390/rs10071011
Note that from the first issue of 2016, this journal uses article numbers instead of page numbers. See further details here.