Article

Microrelief Associated with Gas Emission Craters: Remote-Sensing and Field-Based Study

1
Cryolithology and Glaciology Department, Faculty of Geography, Lomonosov Moscow State University, GSP-1, Leninskie Gory, Moscow 119991, Russia
2
Earth Cryosphere Institute Tyumen Scientific Centre SB RAS, PO Box 1230, Tyumen 625000, Russia
3
International Institute of Cryology and Cryosophy, University of Tyumen, 6 Volodarskogo St., Tyumen 625003, Russia
4
Cartography and Geoinformatics Department, Faculty of Geography, Lomonosov Moscow State University, GSP-1, Leninskie Gory, Moscow 119991, Russia
5
ScanEx Research and Development Center, Office 732, Moscow 108811, Russia
6
Cartography and Geoinformatics Department, Institute of Earth Sciences, St. Petersburg State University, 7/9 Universitetskaya emb., St. Petersburg 199034, Russia
*
Authors to whom correspondence should be addressed.
Remote Sens. 2018, 10(5), 677; https://doi.org/10.3390/rs10050677
Submission received: 1 March 2018 / Revised: 19 April 2018 / Accepted: 24 April 2018 / Published: 26 April 2018
(This article belongs to the Special Issue Remote Sensing of Dynamic Permafrost Regions)

Abstract

:
Formation of gas emission craters (GEC) is a new process in the permafrost zone, leading to considerable terrain changes. Yet their role in changing the relief is local, incomparable in the volume of the removed deposits to other destructive cryogenic processes. However, the relief-forming role of GECs is not limited to the appearance of the crater itself, but also results in positive and negative microforms as well. Negative microforms are rounded hollows, surrounded by piles of ejected or extruded deposits. Hypotheses related to the origin of these forms are put forward and supported by an analysis of multi-temporal satellite images, field observations and photographs of GECs. Remote sensing data specifically was used for interpretation of landform origin, measuring distances and density of material scattering, identifying scattered material through analysis of repeated imagery. Remote-sensing and field data reliably substantiate an impact nature of the hollows around GECs. It is found that scattering of frozen blocks at a distance of up to 293 m from a GEC is capable of creating an impact hollow. These data indicate the influence of GEC on the relief through the formation of a microrelief within a radius of 15–20 times the radius of the crater itself. Our study aims at the prediction of risk zones.

1. Introduction

From the moment of its discovery in the north of West Siberia (Figure 1, Table 1) [1,2], the phenomenon of gas-emission craters (GEC) has been considered as a serious risk to economic infrastructure, settlements and temporary campsites of the nomadic peoples. Predicting the so-called “hot spots” as areas of possible future crater formation should also include an estimation of risk zones around craters, where ejected frozen blocks can be scattered. Our data obtained within the framework of a general GEC study indicates that the role of GEC in a relief changes through the formation of a microrelief around the crater itself.
Research related to GEC occurrence has been carried out by various scientific teams in several directions. Field studies include drilling of boreholes and their equipment for thermometric observations [3]. Geophysical sounding was performed at GEC-1 site [4,5]. Preliminary analyses of remote sensing data (RSD) covering sites with GECs in the North of West Siberia are presented in [6,7]. The work of our group aims at the integrated application of field research methods, including monitoring of the dynamics of crater walls retreat and inner lake formation, sampling of deposits exposed at GEC walls and infilling water, analyzing repeated imagery of high and very high spatial resolution for quantitative assessment of relief changes [2,8,9,10,11,12]. The majority of imagery and field data covers key sites of GEC-1, GEC-2 and AntGEC. Available are also photo and video documents from the newest Se-Yakha GEC (SeYkhGEC) near the Se-Yakha settlement in eastern Yamal [13]. Only a short visit was undertaken to GEC-3.
Research sites where data was obtained are located in the north of West Siberian Plain, Yamal and Gydan Peninsulas, within the continuous permafrost zone [14]. This region is known for the occurrence of thick expansive layers of ground ice (“tabular ground ice”) several to several tens of meters below the surface [14,15,16,17,18], and an enhanced concentration of methane in the upper geological subsurface down to a depth of 130 m [19,20,21]. We consider these two factors as necessary though not sufficient conditions for GEC formation [2].
The relief-forming effect of GEC occurrence is associated with the removal of a large volume of frozen material from inside the GEC and its deposition in the periphery in the form of an accumulative parapet or separate blocks of ejected deposits [1,8,12]. As GECs form due to ejection of the interior deposits to the surface, the cryolithological structure of the site-specific geological section of the site prior to the crater is of importance and reflected by ejected blocks. When frozen, unconsolidated sediments are capable of developing enough forces to form hollows in the ground while dropped onto the land surface.
With reference to the morphological similarity of the internal structure of the GECs under study [10], there are differences in the nature of accumulation of ejected material around the GEC. We observed the parapet, clearly expressed in relief, up to four meters high, surrounding the crater, only around GEC-1 in Central Yamal [1,8]. In other cases, the accumulative forms are much smaller and not so clearly localized around the crater edge.
Both positive forms of microrelief composed of thawed deposits fallen onto the surface (“piles”), and negative forms, such as small rounded depressions (“hollows”), as a rule, filled with water, and in some cases surrounded by a heap or a ridge of extruded deposits, were found during the field work on GECs in 2014–2017 [12]. The origin of negative microforms was associated either with the impact of the ejected frozen deposits and ice blocks [12,22], or interpreted as craters-satellites, through which gas was additionally released [22].
While accumulative forms of microrelief are found around all the known GECs, we recorded clearly expressed hollows, which we associate with the impact, only around three of the GECs under study (Figure 1). This paper considers in detail two of these three GECs with impact hollows: GEC-2 in the Central part of the Yamal Peninsula, and AntGEC in the Gydan Peninsula. We discuss our results in comparison with first reconnaissance data from SeYkhGEC [13]. The objective of this paper is (1) to narrow down the time range of GEC-2 formation through analysis of newly obtained imagery; (2) to detect the distance of positive and negative microforms scattering around the crater; (3) to characterize hollows related to the formation of GECs and surrounding the main crater, and to justify their origin from the impact by ejected frozen deposits and ice (“impactors”).

2. Materials and Methods

Fieldwork at the GEC-2 in September 2015 and 2017, and at the AntGEC in August 2016 included: taking coordinates of the scattered material around GECs, and documenting associated microrelief. These activities helped validating an impact origin of the microrelief mapped using RSD. Impact hollows have been mapped using imagery and unmanned aerial vehicle (UAV) survey and thus were subject to statistical spatial analysis using Polar Scatter Plot. At the same time, the outlines of piles were not clearly recognized and mapped using imagery and UAV survey, and not all of them were mapped in field due to shrubby areas, and wind and rain action which destroyed some by 2017 when the ground based and UAV surveys were undertaken.
The boundary delineating the zone of scattering of impactors outlines the farthest from the GEC center single impact hollows—scattering zone A. The boundary delineating the zone of scattering of ejected material, which formed accumulative piles, connects the farthest of definitely detected piles—scattering zone B. All distances within zones A and B were measured in relation to the apex of the mound-predecessor (AMP).
In 2017, an aerial survey of the GEC-2 location with an UAV was performed to create a detailed orthophotomap and a digital elevation model (DEM). In total, 34 images were selected as being suitable for further use, having a longitudinal overlap of about 70–80%, and transverse overlap of about 60–70%. The total area covered by the images was about 0.1 km2. We processed images in the Agisoft PhotoScan software package.
Very-high resolution satellite images served as planimetric and elevation data base in order to produce a highly detailed DEM and a terrain-corrected orthophotomap out of the UAV images. Satellite image processing was done following the method described in a previous study [12]. Additional ground control points were taken using the waypoint averaging function of handheld GNSS (GLONASS and GPS) instruments. The main objective of the photogrammetric processing of satellite imagery and UAV data was to create a unified topographic base, which could allow correlating multi-scale imagery data and making high-precision morphometric measurements. The resulting orthophotomap and DEM were used to determine the location of the ejected material and to derive geomorphometric parameters of the impact forms by measuring hypsometric profiles.
Processing of data in Agisoft PhotoScan resulted in a relative accuracy of mutual equalization of 0.24 m in plan. DEMs have a cell size of 0.08 m, altitudes relative to the WGS84 ellipsoid and within a range from 28 to 50 m. The UAV orthophotomap is used to map the microrelief forms in a scale of 1:500–1:1000. UAV images on the periphery of the studied area exhibit distortions and are excluded from the analysis.
Data concerning the AntGEC on the Gydan Peninsula were partially obtained earlier [11,12] and were compared to the new information for GEC-2. To analyze the location and determine the origin of hollows filled with water in the surroundings of GEC-2 and AntGEC, we used a series of different images (Table 2), including those obtained from UAV in 2017, a photograph from a helicopter dated 14 November 2012, taken over the recently formed GEC-2, as well as fieldwork data in key areas.
In order to conduct high-precision measurements and comparison of multi-temporal satellite imagery, orthophotomaps were created. Photogrammetric processing was carried out using ScanEx IMAGE Processor software and included the following stages: (1) orthorectification of images based on the rational polynomial coefficient (RPC) for WorldView-2 imagery, rigorous sensor model for SPOT5 imagery, and a DEM created from digitized topographic maps at a scale of 1:100,000; (2) image co-registration in (Universal Transverse Mercator) UTM projection and as false color composites. For some imagery with clouds and shadows, image enhancement transformations were applied.

3. Results

3.1. GEC-2

3.1.1. Dating of GEC Formation

Sizov [6] analyzed Landsat data and determined that GEC-2 had formed no later than 2 May 2013. We have significantly narrowed down the period for the GEC-2 formation by analyzing SPOT5 images available through the “Geoportal of the Lomonosov Moscow State University” [23]. Most recent images showing no crater are dated 24 September 2012 (Figure 2). Due to cloudy conditions on 24 September 2012, we used an earlier image taken on 07 August 2012 and 21 August 2012 to identify possible changes in the pattern on the images for the key site and to confirm the absence of the crater. Although on the images of 21 August 2012 and 24 September 2012 crater site is in cloud shadows, there are no noticeable differences in the spectral brightness between the mound-predecessor or the probable center of the crater and the surrounding territory, which are noticeable in later images.
In the cloudless image of SPOT5 from 07 August 2012, the internal structure of the valley, in which the mound-predecessor of GEC-2 is located, is clearly visible and there is no crater yet. At the same time, the pattern of the valley is similar to that observed on the later shadowed images of 21 August and 24 September, 2012.
In both 15 and 22 October 2012 images, the GEC-2 can be clearly identified as a dark object with a low reflectance, 23 × 30 m in diameter (Figure 2). Around the dark spot of GEC-2 in these images, the zone B, as well as individual objects with high reflectivity 5–10 m in diameter can be distinguished by the spectral characteristics of the surface (taking into account the spatial resolution of the images of 5 m/pixel). Most likely, these are blocks of ice and frozen deposits ejected from the crater, because they do not appear in earlier images. Thus, GEC-2 formed in the interval between 24 September and 15 October 2012. Presence of well-preserved, not yet thawed blocks of ejected ice and frozen deposits in photographs taken from a helicopter on 14 November 2012 supports our conclusion. Thus, the helicopter survey was very close to the time of GEC-2 formation. It was used to find the by sight correspondence between the position of ejected frozen blocks-impactors and large impact hollows.

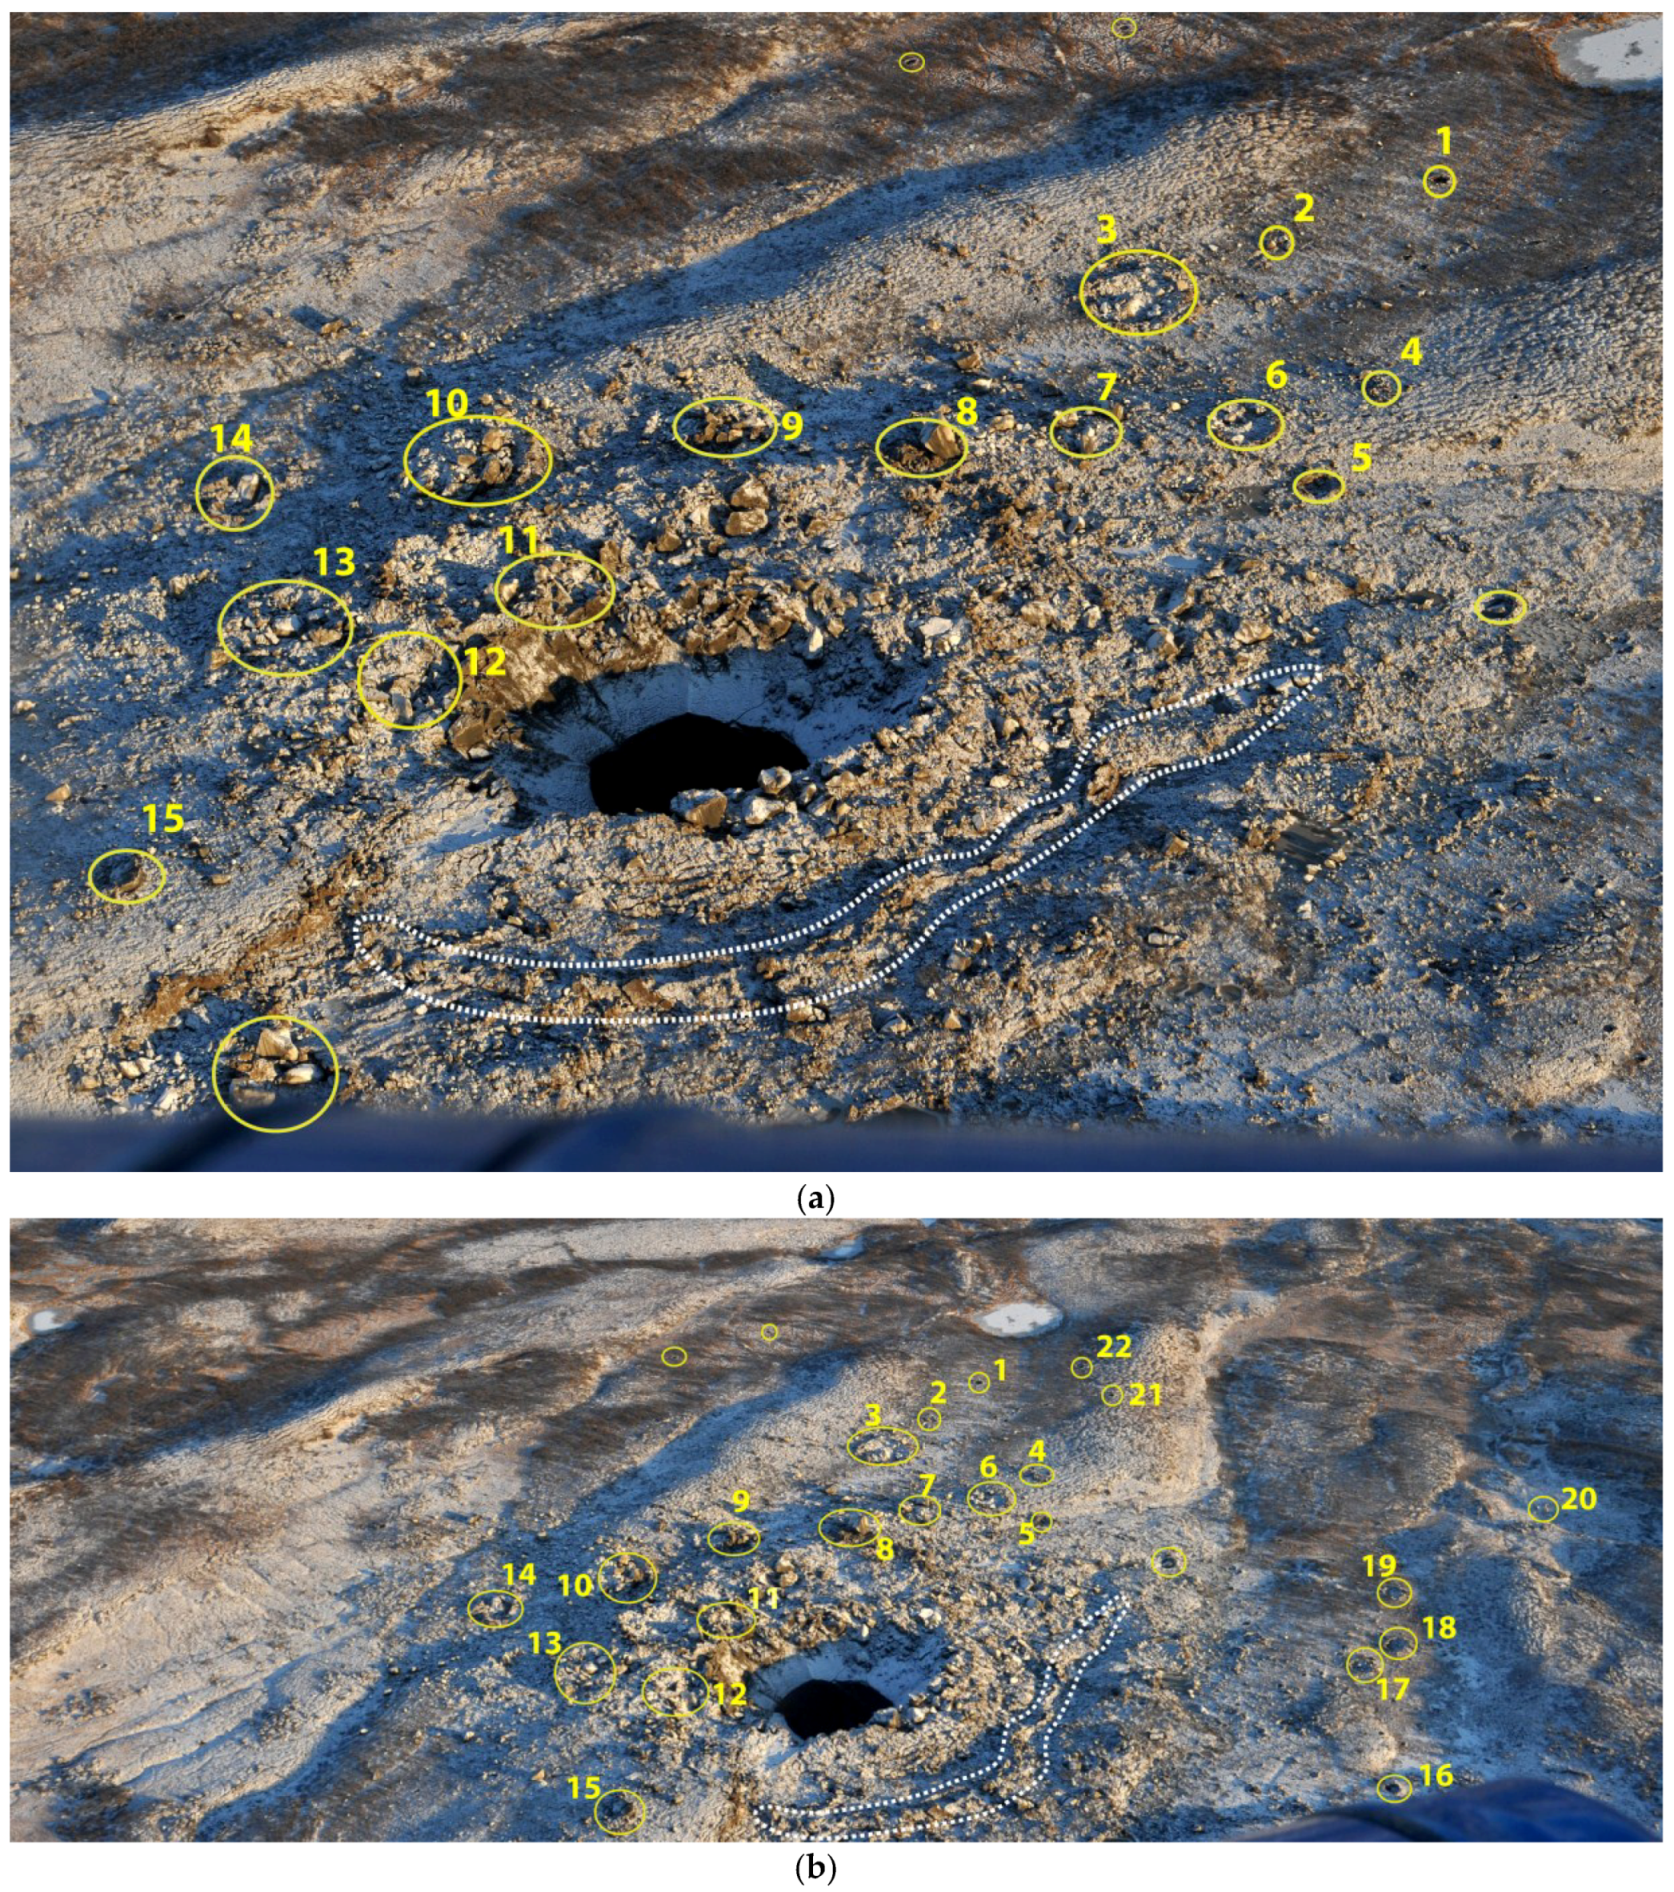
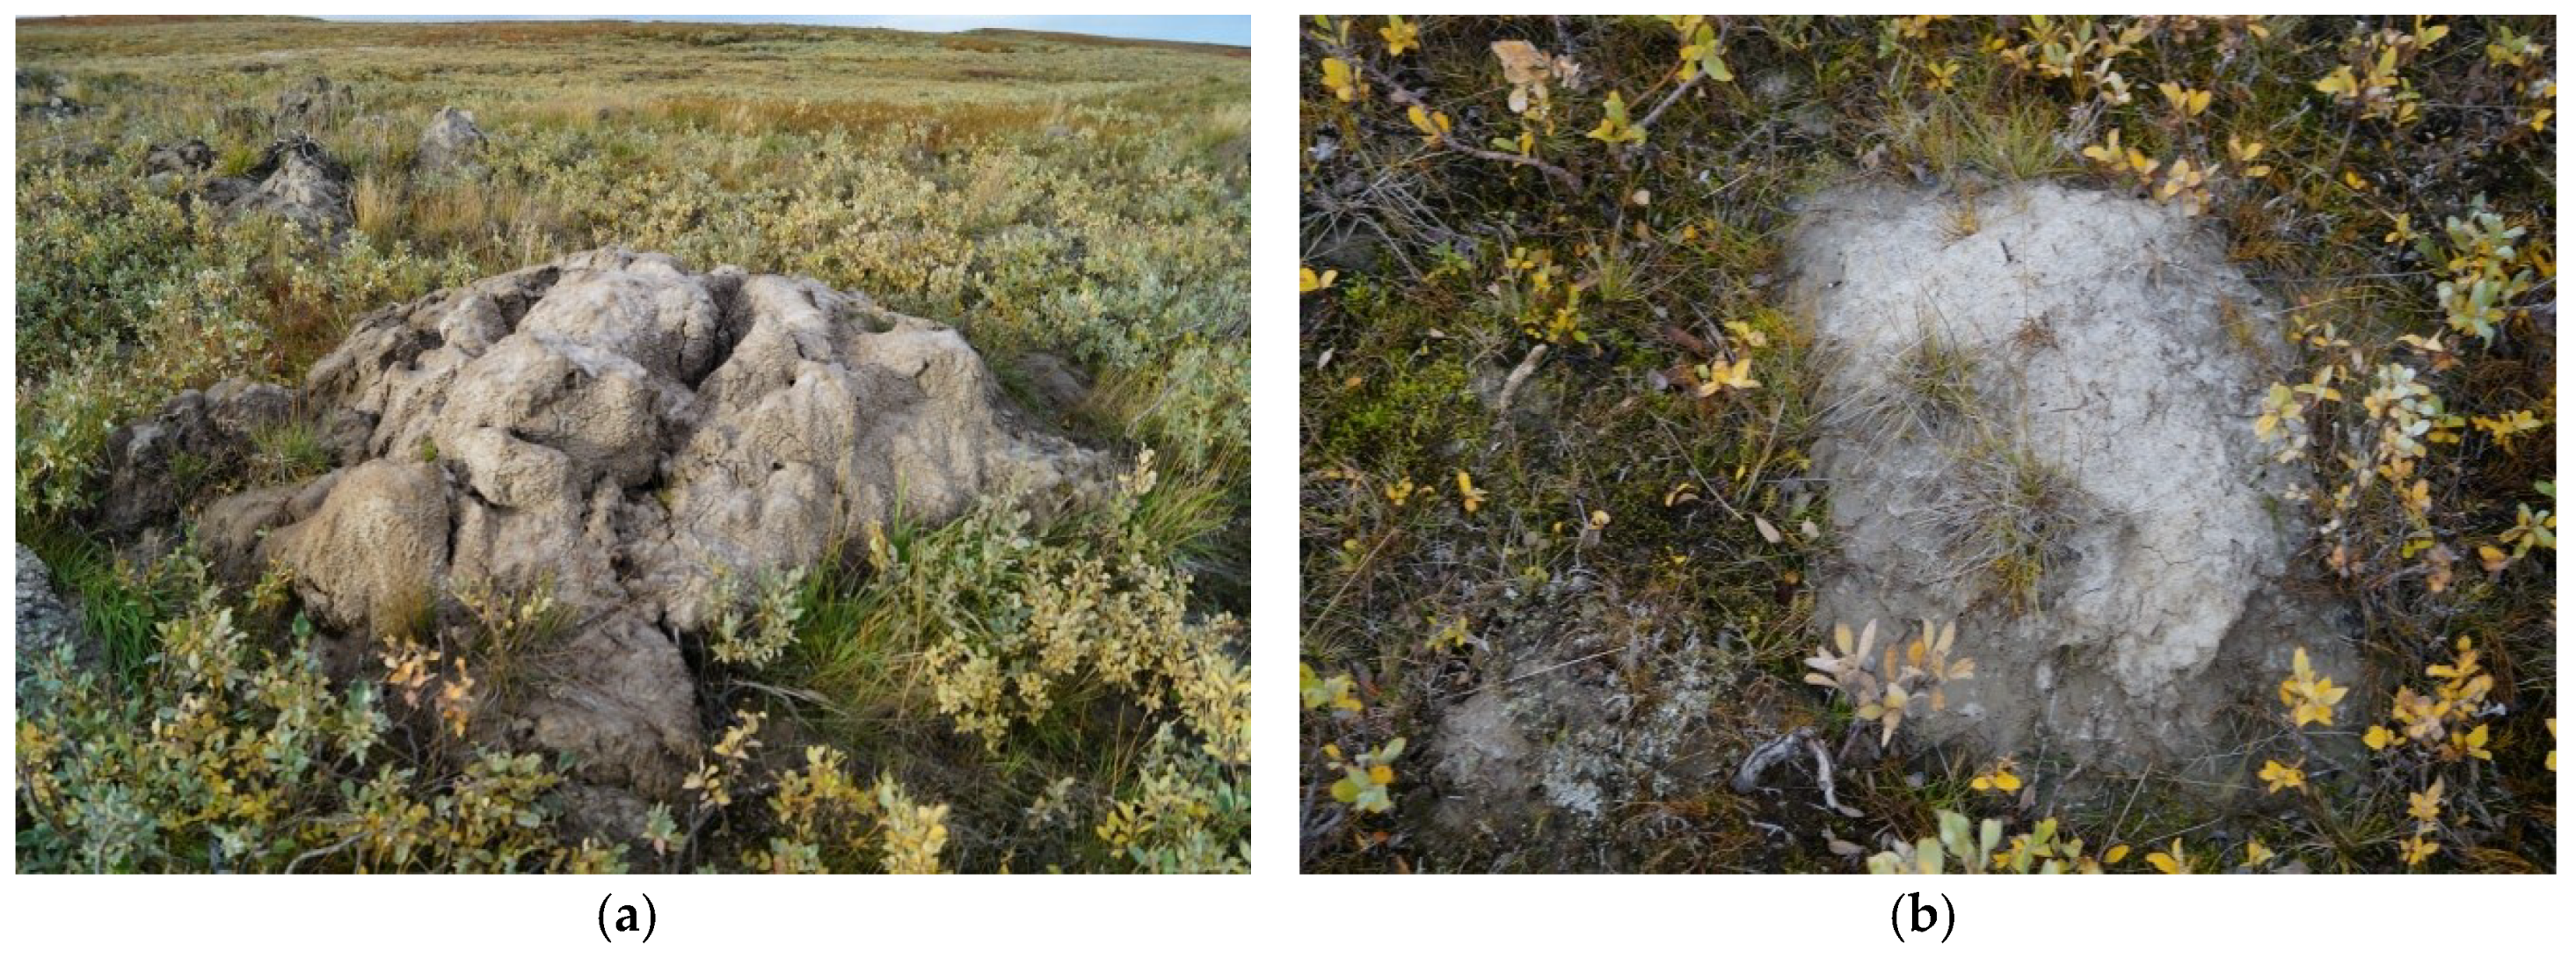
3.1.2. Field Results

During the field work of 2015 and 2017, 344 piles around GEC-2 were recorded. Most of them were small (up to one meter in diameter) fragments of deposits or blocks of turf, which, when falling from above, did not form a hollow (Figure 3). Most of small traces of ejected matter were recorded on a gentle slope to the west of an already existing crater lake by the time of our survey.
Morphometric characteristics of the impact hollows (Figure 4) were measured in the field as well. The diameter of the hollows varied from 0.3 to 13 m, depth from 0.1 to 1.5 m.
In 2017, only four large (more than 10 m in diameter) of the hollows remained outside the crater lake, while other hollows remained smaller with an average of two meters in diameter. Impact forms were surrounded by ridges of thawed deposits splashed out by fallen blocks (Figure 4). Some ridges around hollows located close to each other merged into larger forms. Dimensions of this assemblage of piles were 1.5 m in diameter on average, and up to 3.5 m maximum. The relative height of such piles was within a range of 0.1–1.2 m.
In 2013, hollows 10 and 13 were filled with water (Figure 7), but during the field survey in September 2015, they were found already drained into the inner lake of GEC-2 by the scour of its retreating northern wall (Figure 5 and Figure 6).
Constructed were hypsometric profiles across these hollows based on the UAV DEM of September 2017 (Figure 5 and Figure 6). The depth of hollow 13 relative to the surrounding surface was 1.4–1.5 m, depth to the flat bottom of the hollow 10 (not accounting for erosion cut) was 0.8–1.0 m. Both hollows along the perimeter were surrounded by ridges. The relative height of ridges was 0.15–0.35 m. By 2017, the coverage of the hollow bottoms by vegetation had increased significantly compared to 2015 (Figure 5D).
In the photographs taken from the helicopter on 14 November 2012, several types of microrelief were distinguished (Table 3), associated with the formation of GEC-2 (in addition to the formation of the crater itself).

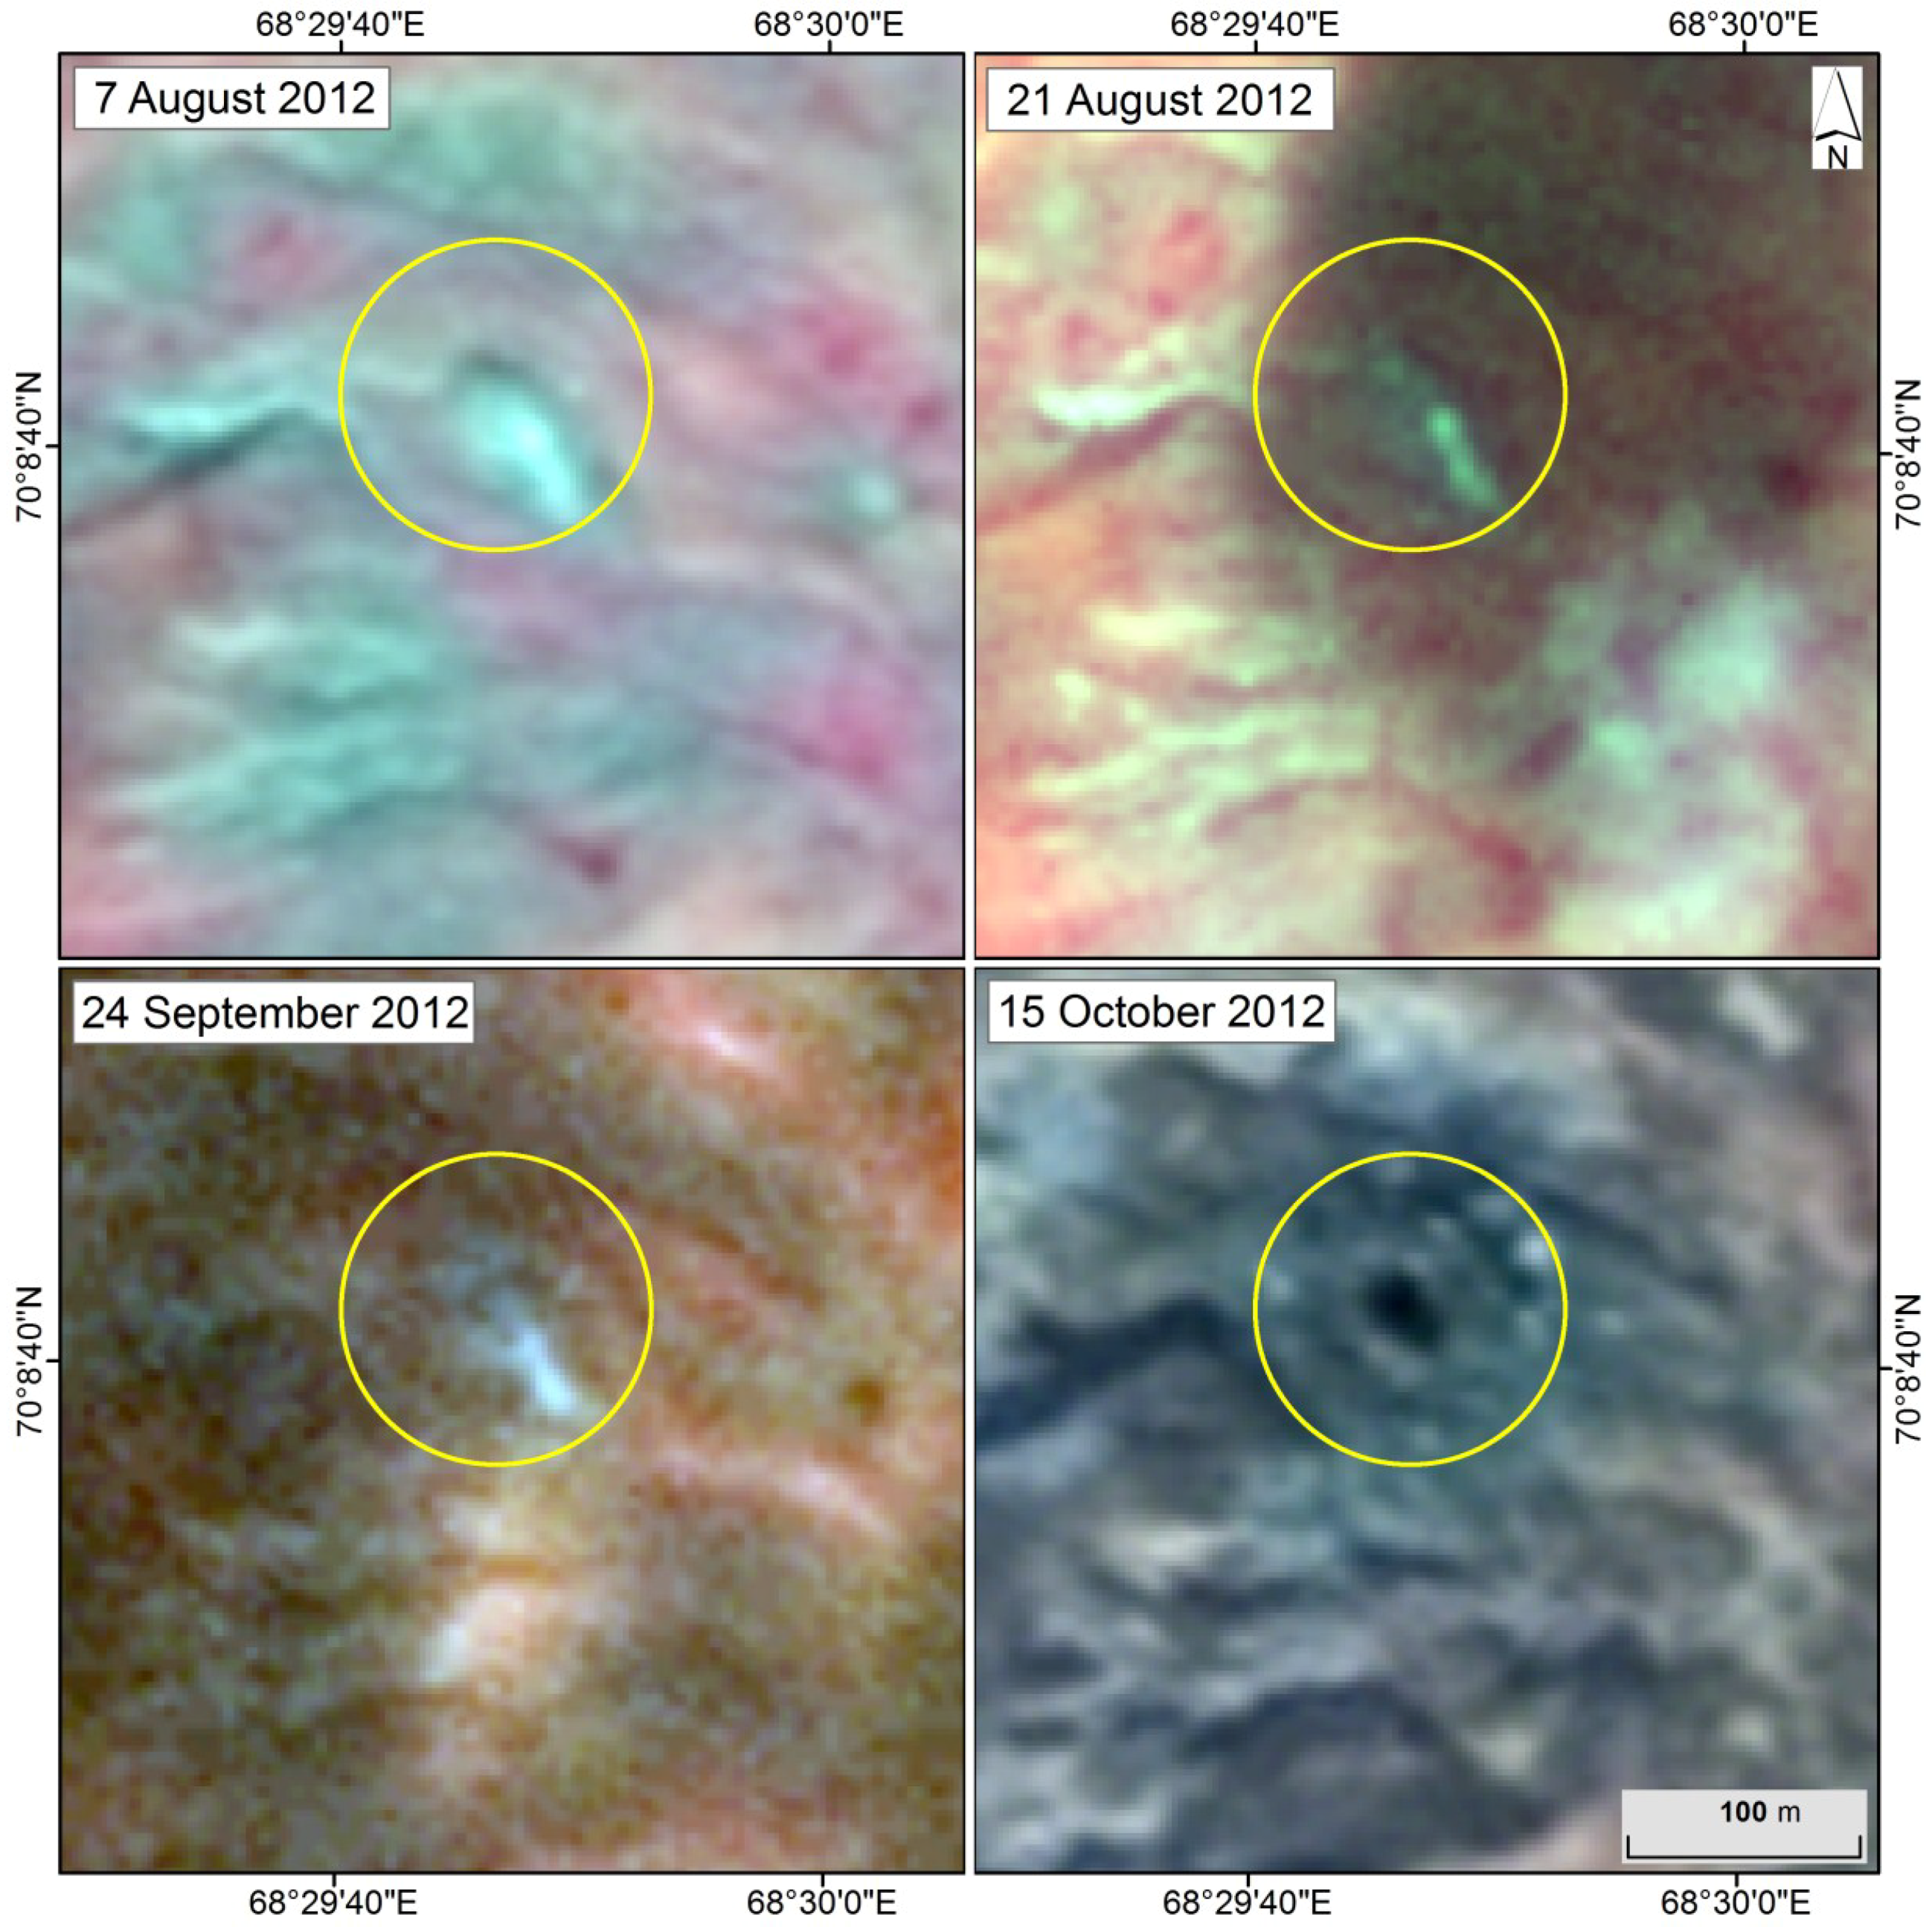
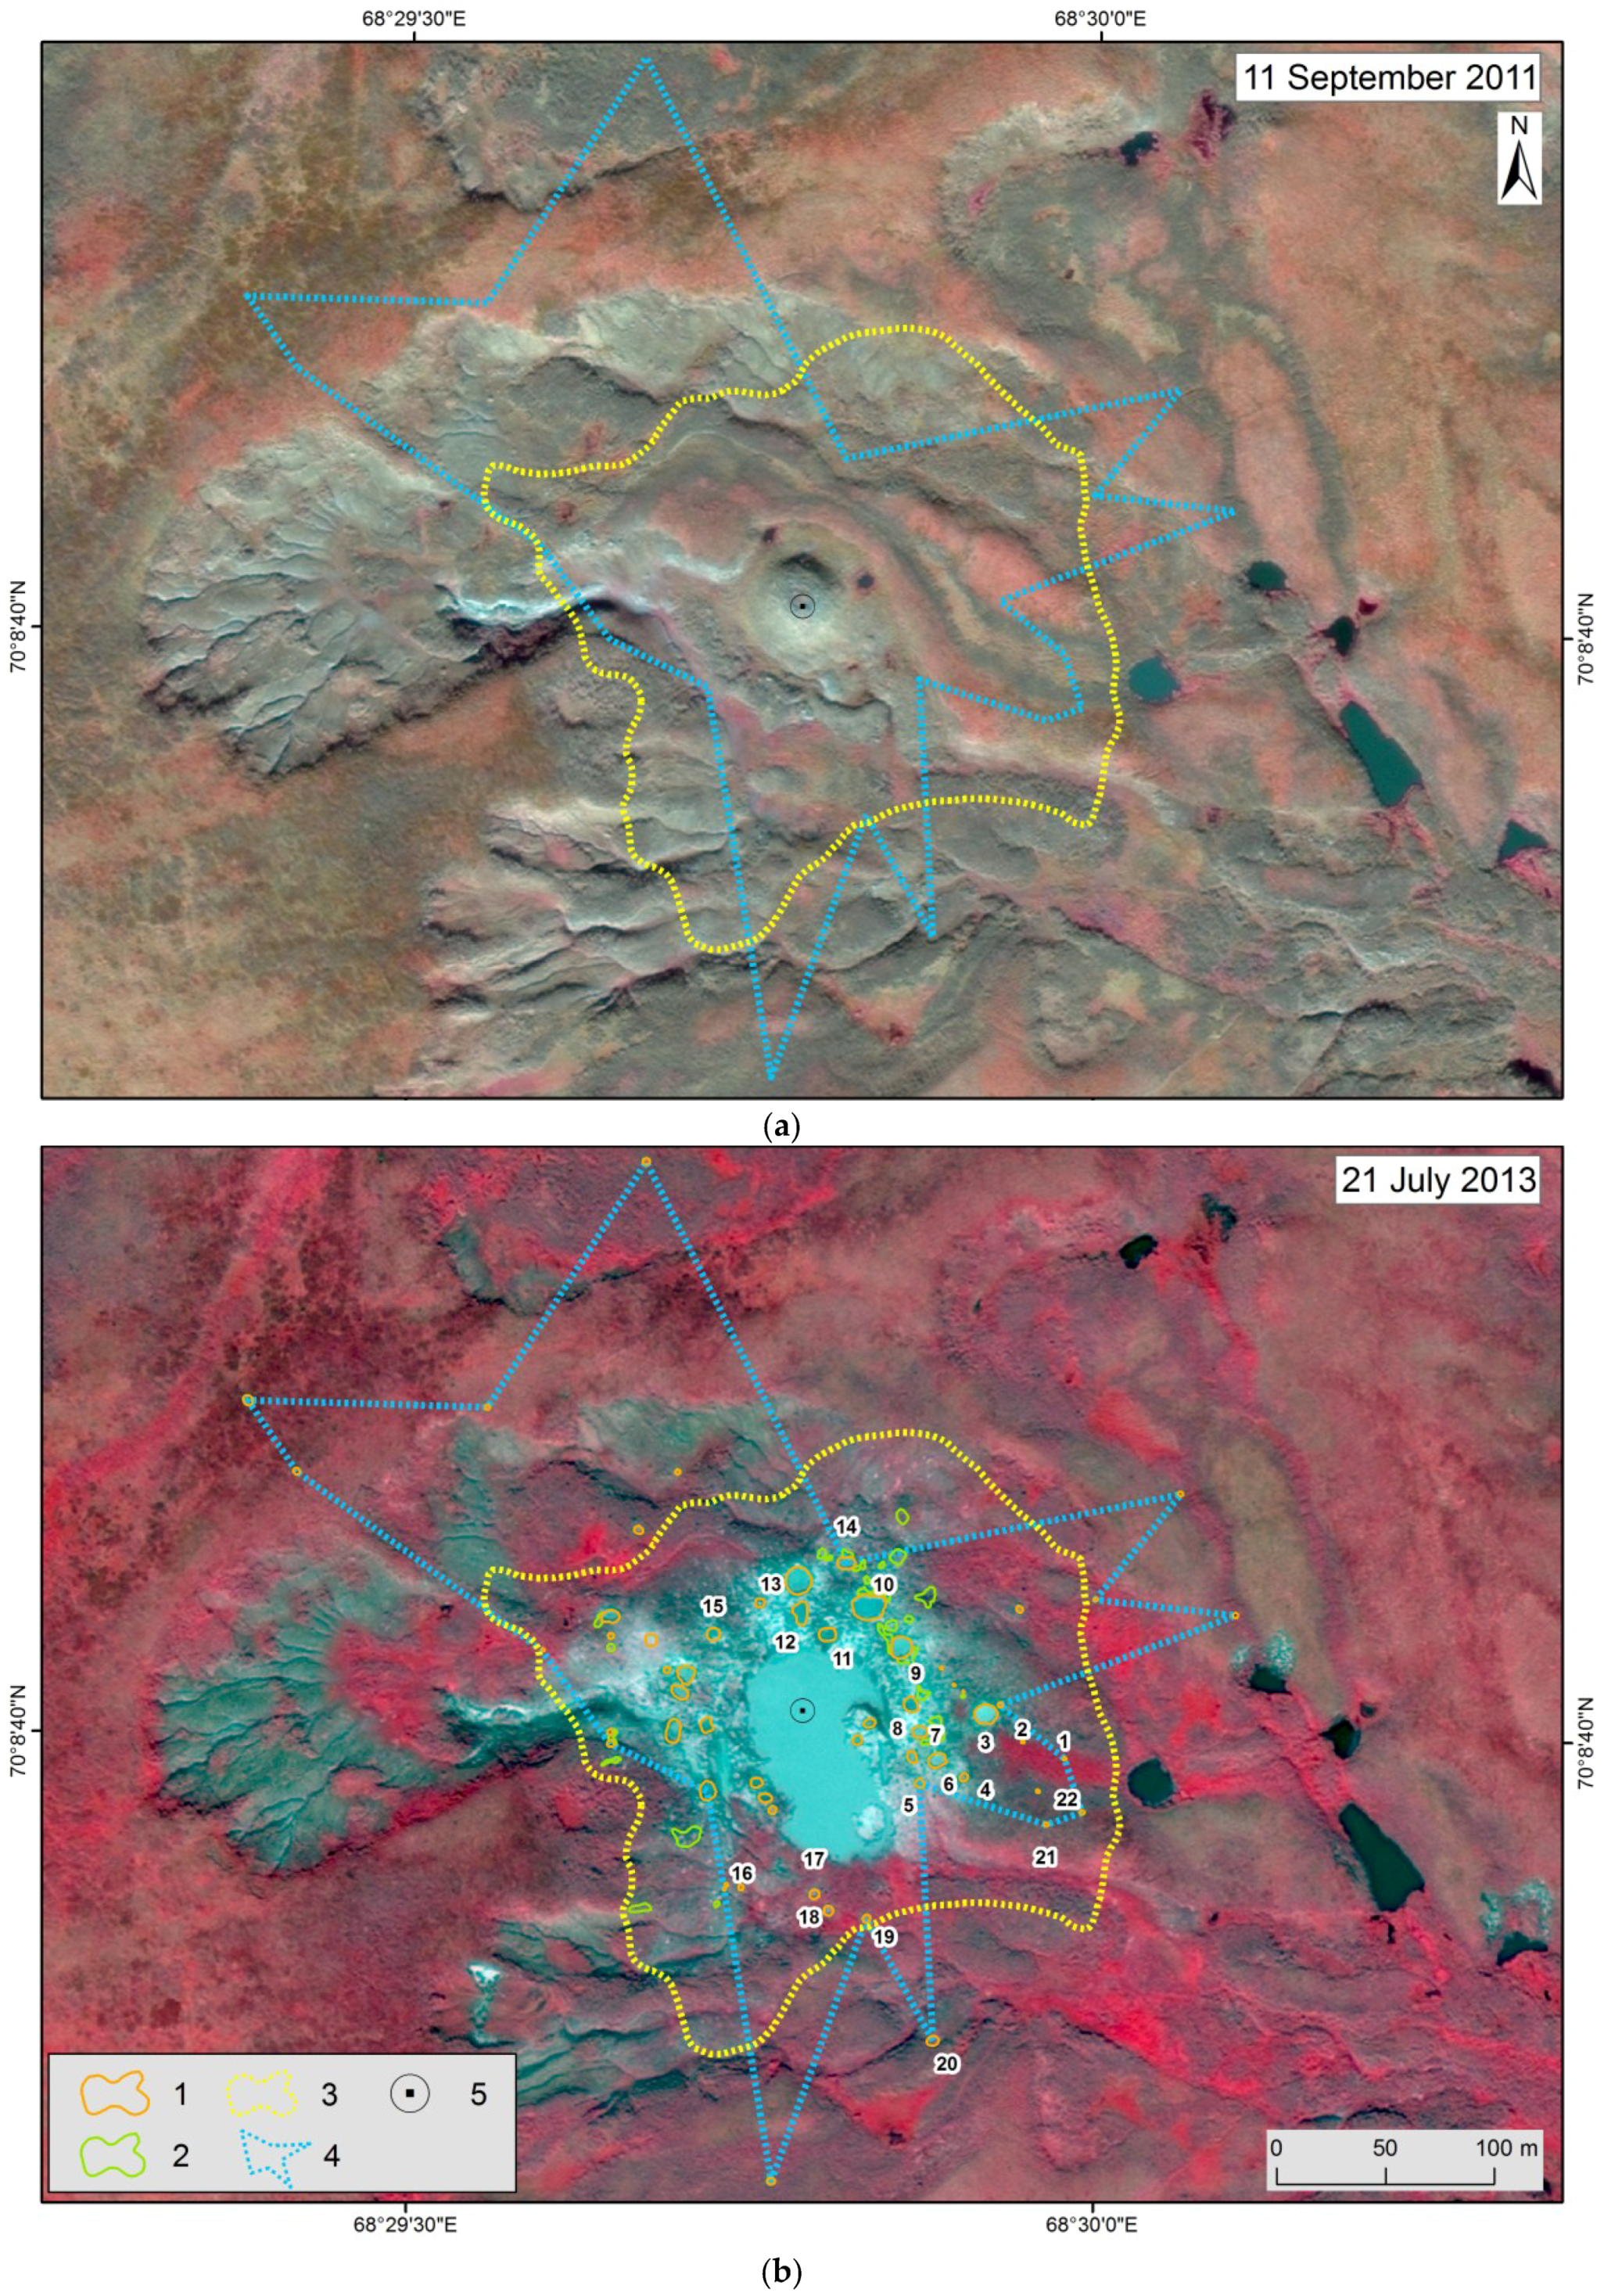
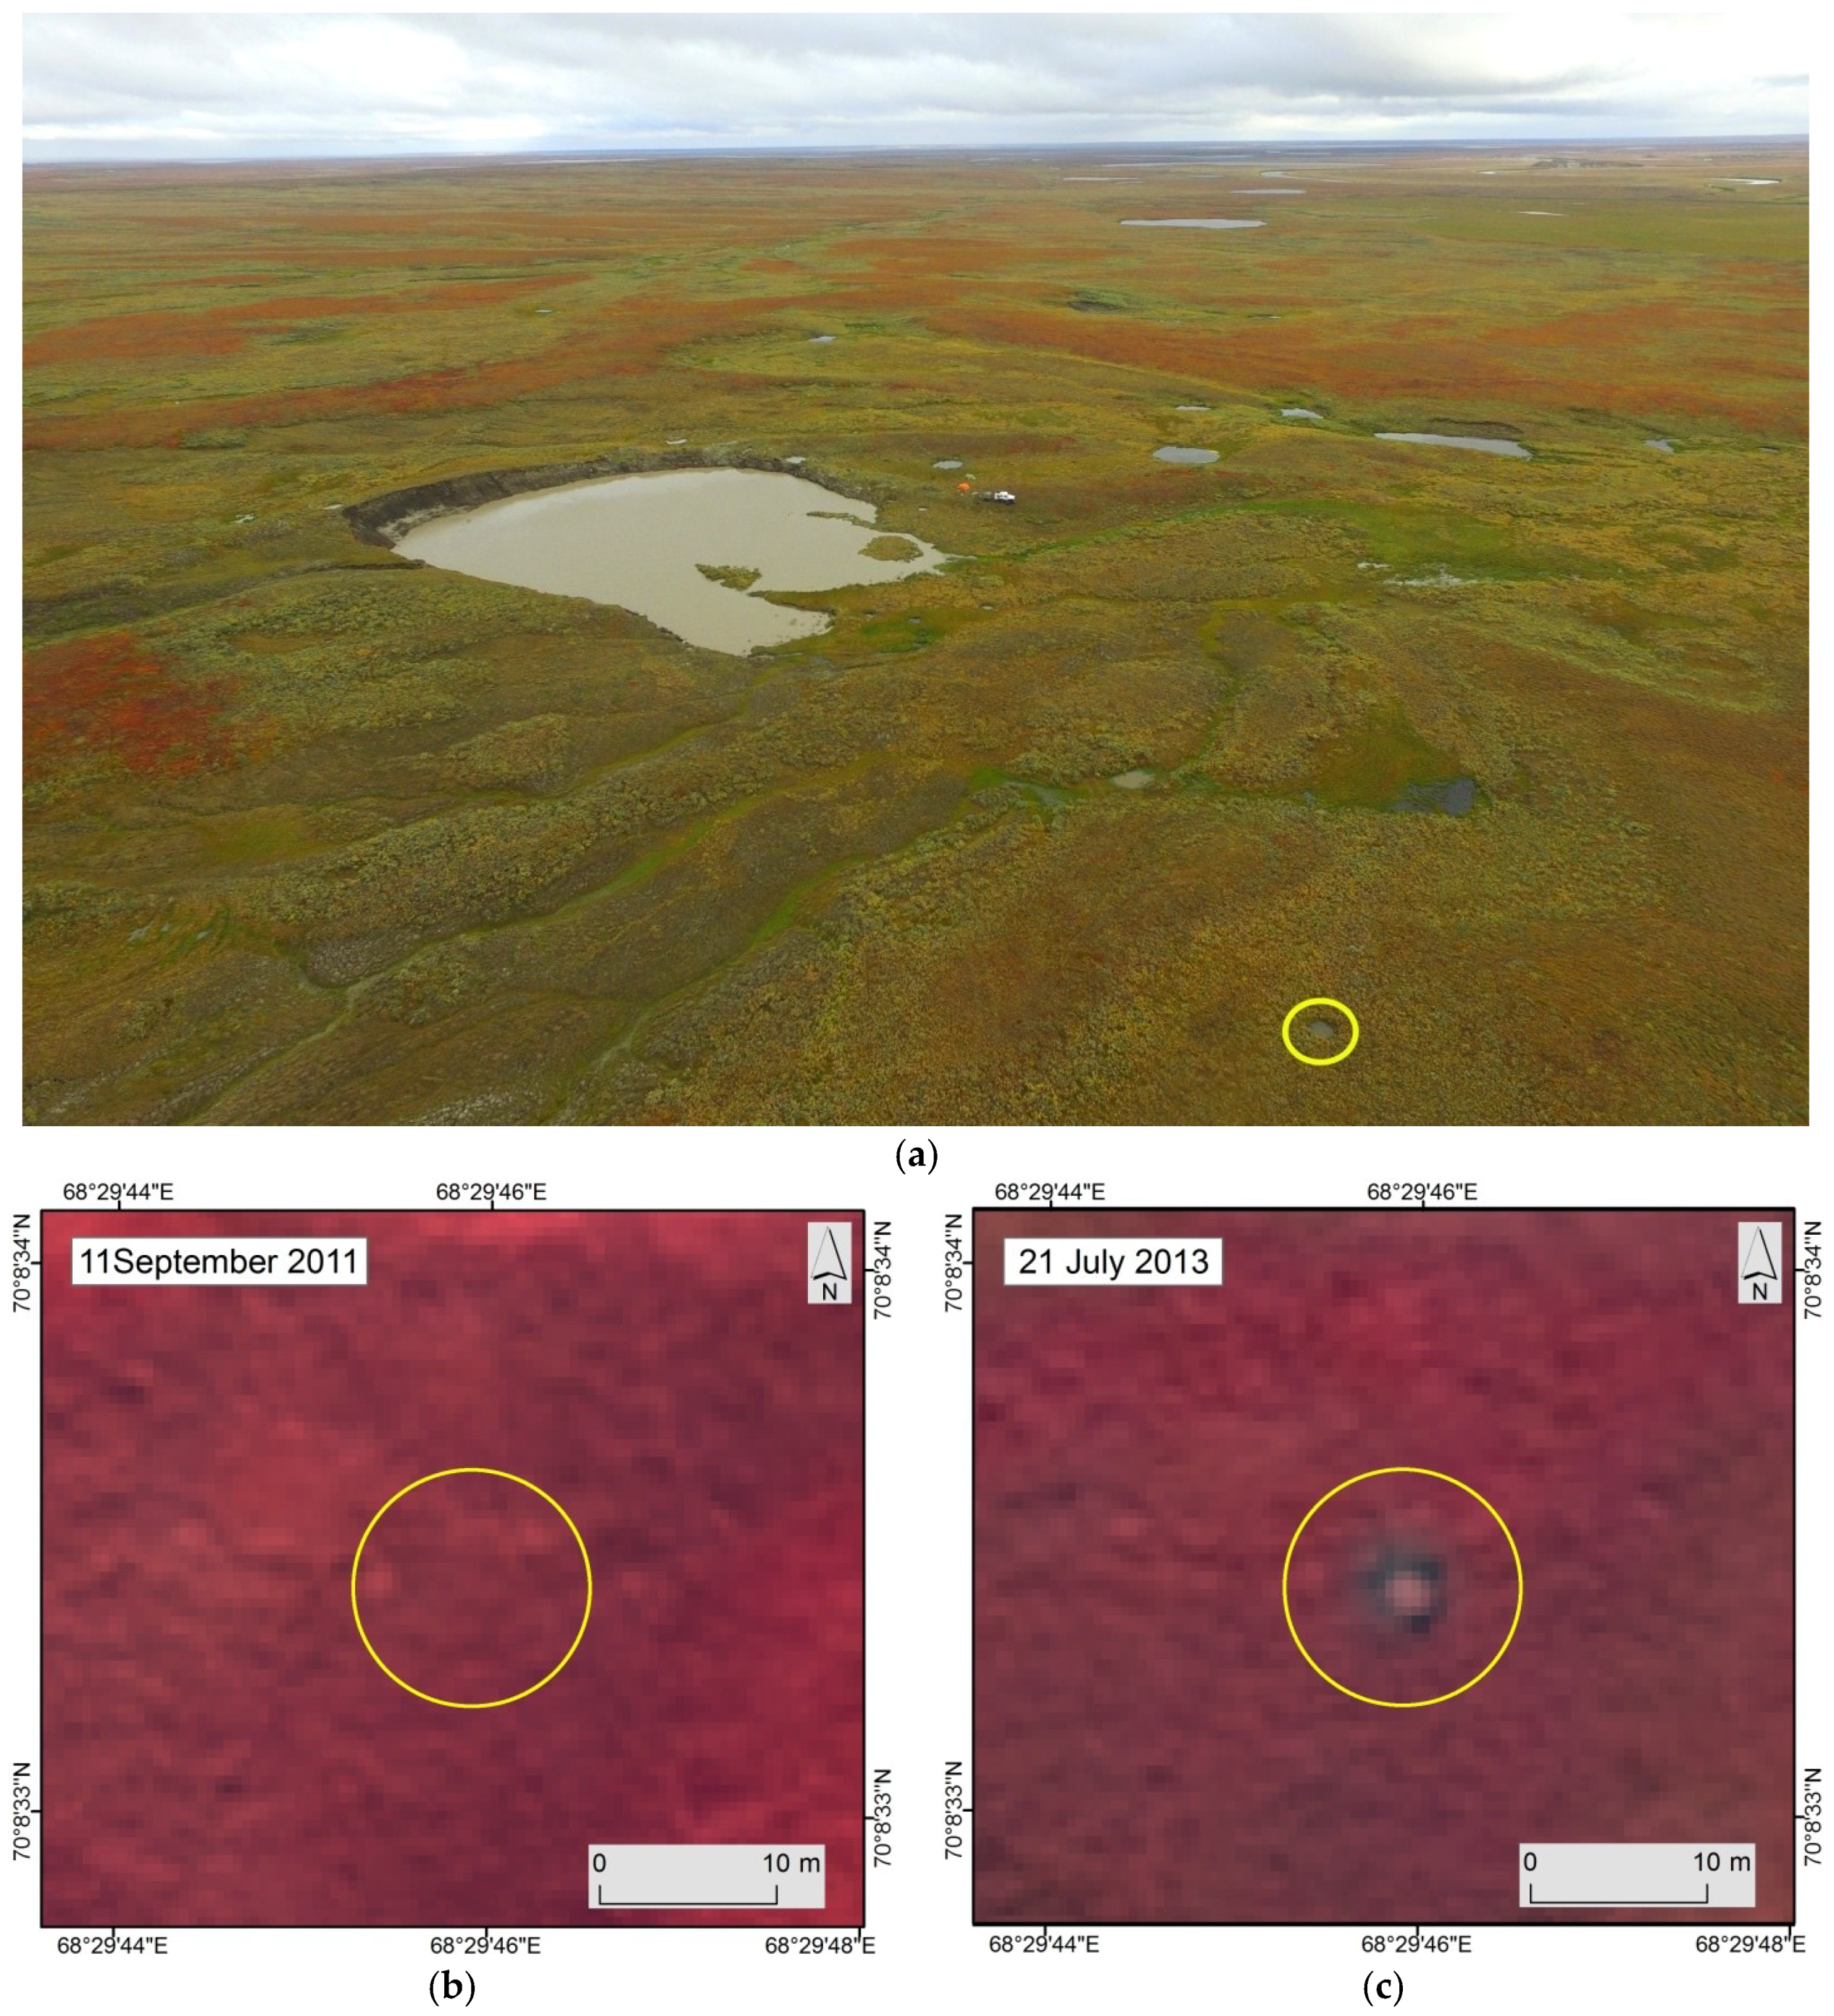
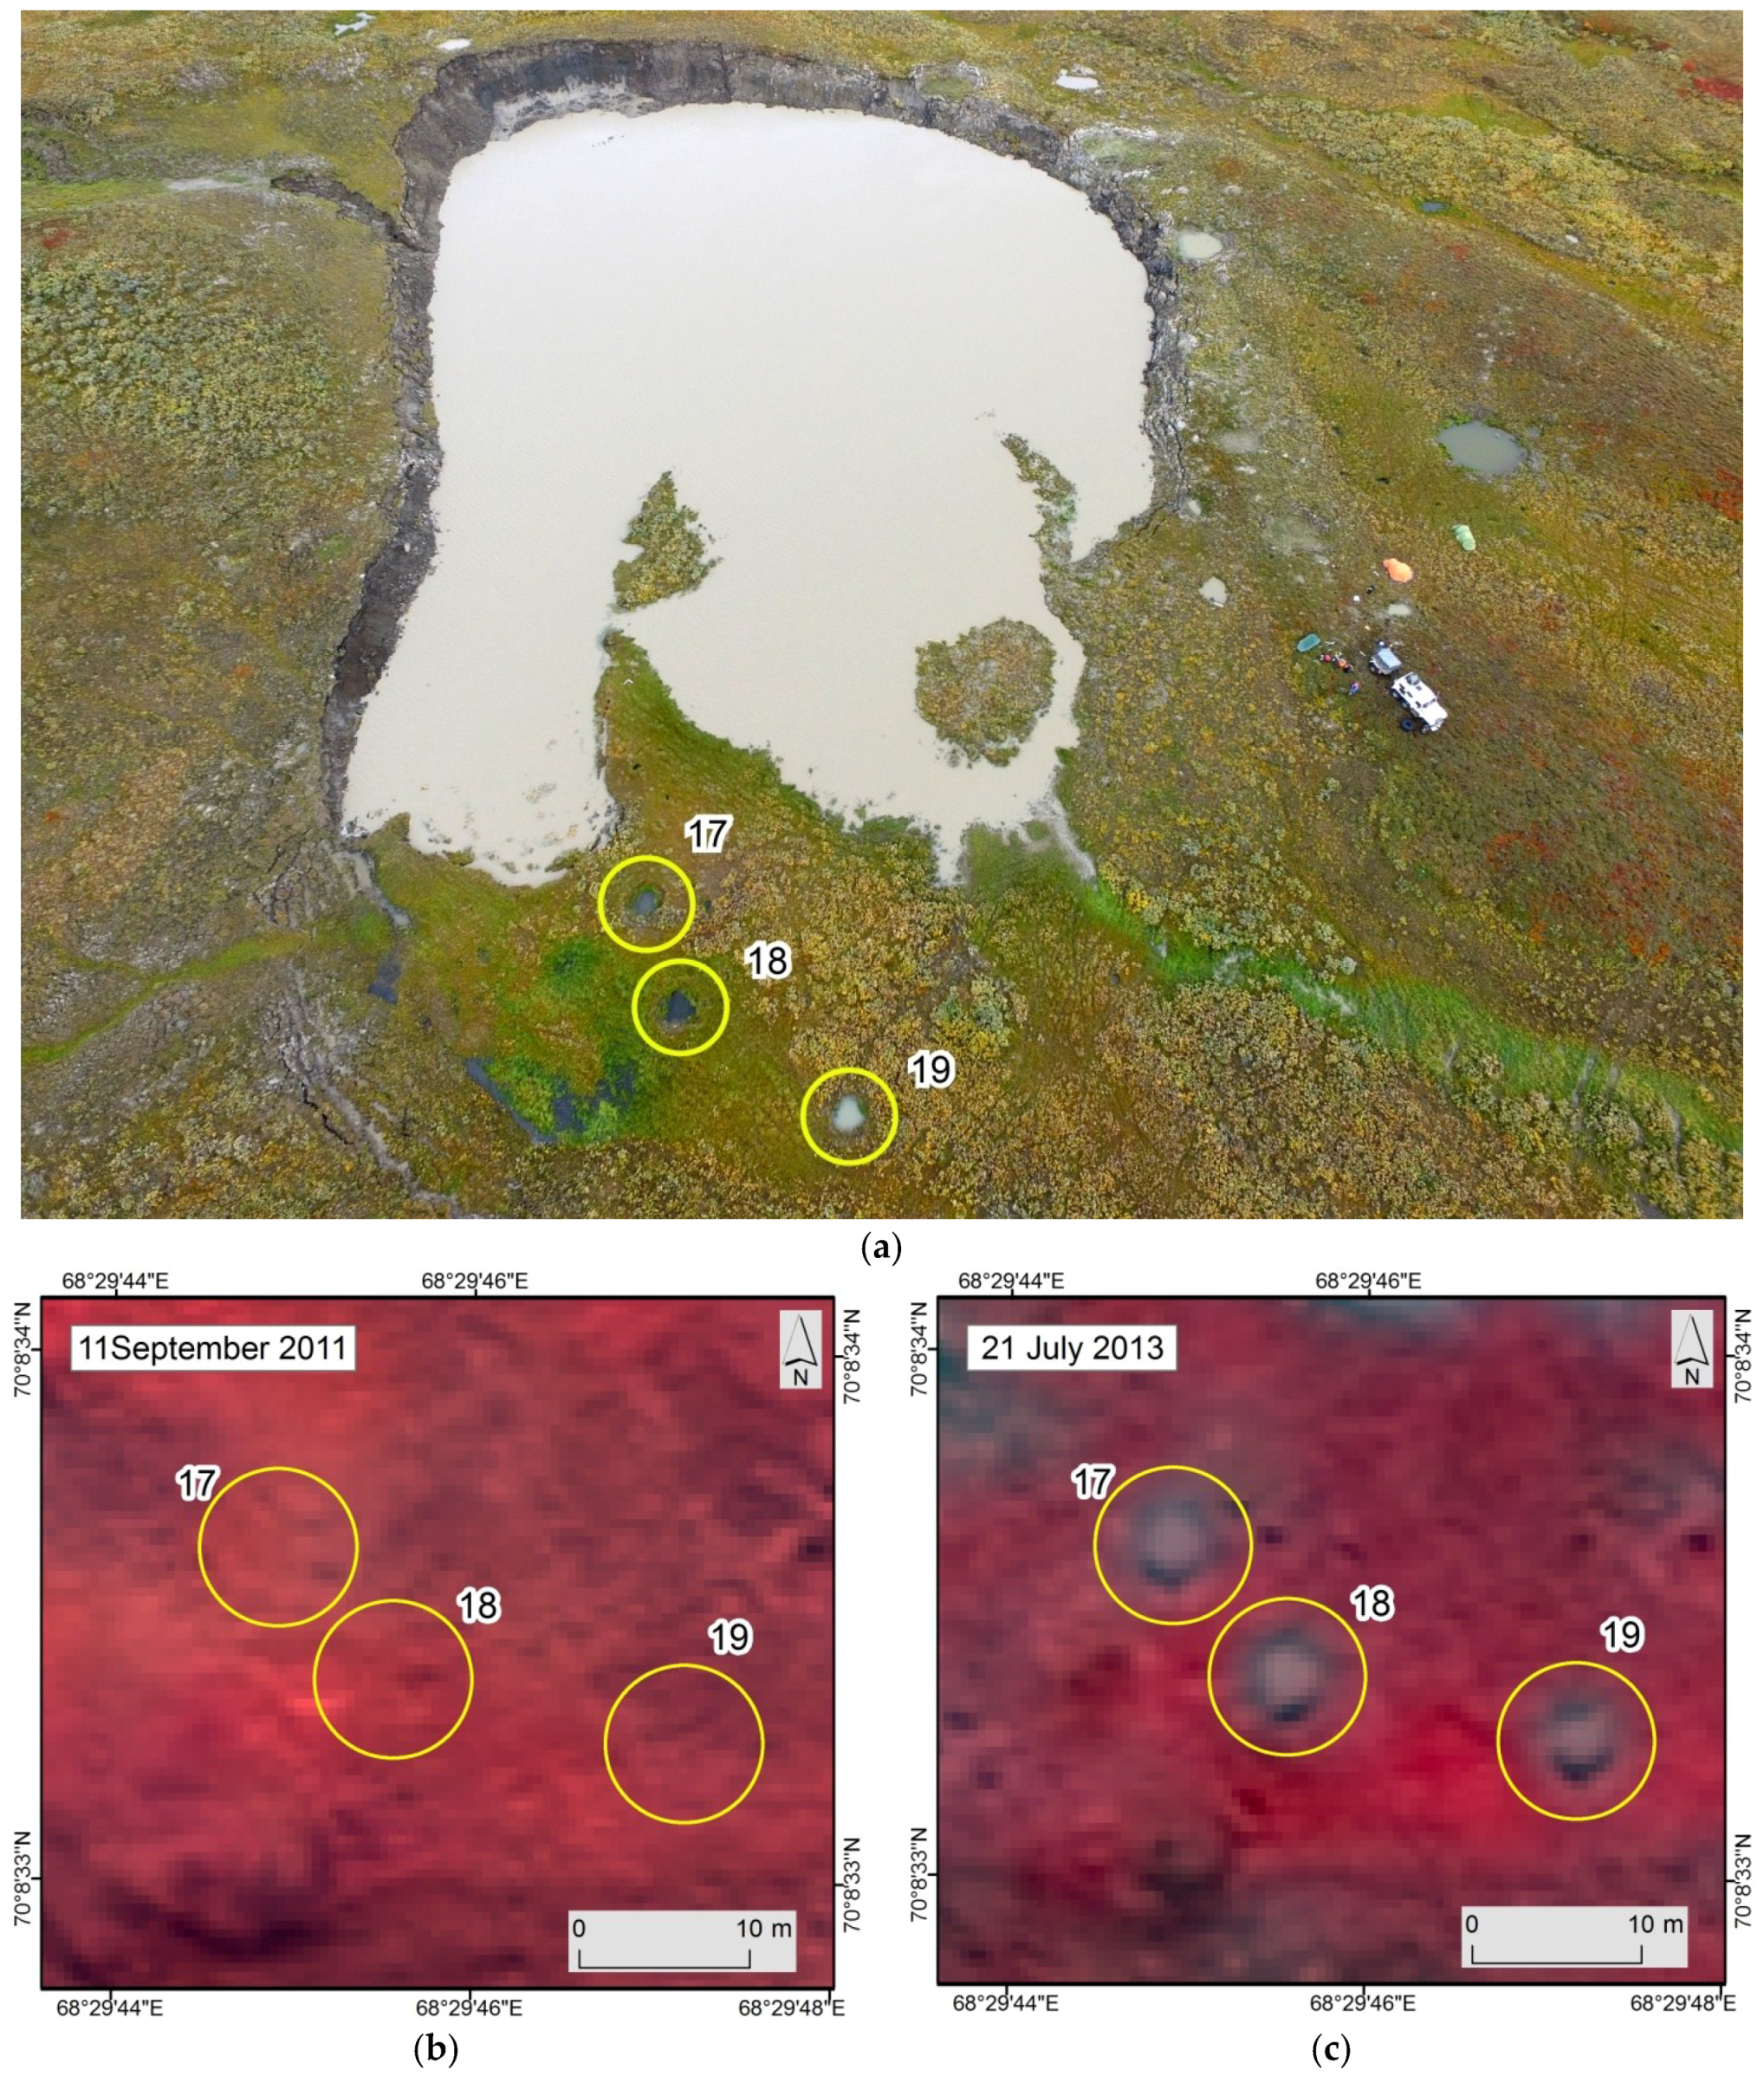
3.1.3. Remote-Sensing Results

When analyzing satellite images of very-high spatial resolution taken after the formation of GEC-2, supported by field data of 2015 and 2017, hollows of 1.5 to 13 m in diameter, dry or filled with water were visually recognized (Figure 7). On satellite images of 2013, hollows filled with water appear as small rounded objects with a high content of suspended particles that reflect the signal even in the near infrared spectrum, in comparison with the “old” water bodies, such as lakes in the immediate surroundings that practically do not reflect (dark objects) in the near infrared spectrum.
The assumption of the impact origin of these forms, and to some extent composition of the ejected blocks (stratified ground ice), are confirmed by photographs from the helicopter made on 14 November 2012, shortly after the formation of GEC-2 (Figure 8). These photographs document the state of microrelief around the crater, shape and composition of the ejected material. Preservation of the crater walls, as well as blocks of ice and frozen deposits then was only possible due to low air temperature in late September–October. Refreezing of the active layer had just started and the impact effect of the falling frozen blocks ejected from the crater had led to the formation of hollows. Both, satellite image and photograph (Figure 7 and Figure 8) present the largest of the impact forms observed in the vicinity of GEC-2. Since the hollows did not get filled with thawed deposits, the blocks were most likely composed of either very icy deposits or almost pure ice.
The farthest from AMP impact hollows were not looked for and thus not described in field. These impact hollows 1.5–4 m in diameter with either disturbed vegetation or filled with water were detected only thanks to image time series. They were found at a distance from 163 to 293 m in the north-west, east and south directions from AMP. These objects are missing on the WorldView-2 2011 images and appear on images of 2013, where they could be clearly recognized. An example of one of such landforms is shown in Figure 9. Impact hollows close to GEC-2 have a similar appearence on the images (Figure 10). Thus, we emphasize the possibility of scattering of material over such long distances, which, however, has not yet been confirmed by field findings. Since these landforms are small, only images with higher spatial resolution than SPOT5 can be used for their analysis.
Zone A has irregular in plan shape relative to the AMP, while scattering zone B is rather isometric. The largest fragments fell to the east and northeast of GEC-2 (Figure 8). The area of zone A is 62,080 m2, and of zone B is 50,250 m2.
The image analysis of WorldView-2 dated 21 July 2013 revealed 59 impact hollows at a distance from 57 m (SW) to 293 m (WNW) from AMP (Figure 11). Most of these hollows (86%) were concentrated within a distance of less then 150 m from AMP. The largest impact hollows (area from 50 to 143 m2) were found at a distance of 45–84 m from AMP.
Most of the accumulative bodies deposited close to the edge of the crater were destroyed by retreating crater walls and inundated by a crater lake.

3.2. AntGEC

3.2.1. Dating of GEC Formation

Dating of AntGEC was undertaken earlier [11]. Information provided by the Administration of Tazovsky settlement based on a report from local citizens stated that AntGEC formed on 27 October 2013. We were unable to confirm this date by imagery because of the cloudiness at the dates of interest. Closest to the date of AntGEC formation images were within a time range of 13.5 months (between WorldView-2 of 21 August 2013 and WorldView-1 of 11 October 2014). Thus, we can rely on the date of crater formation in late October 2013.

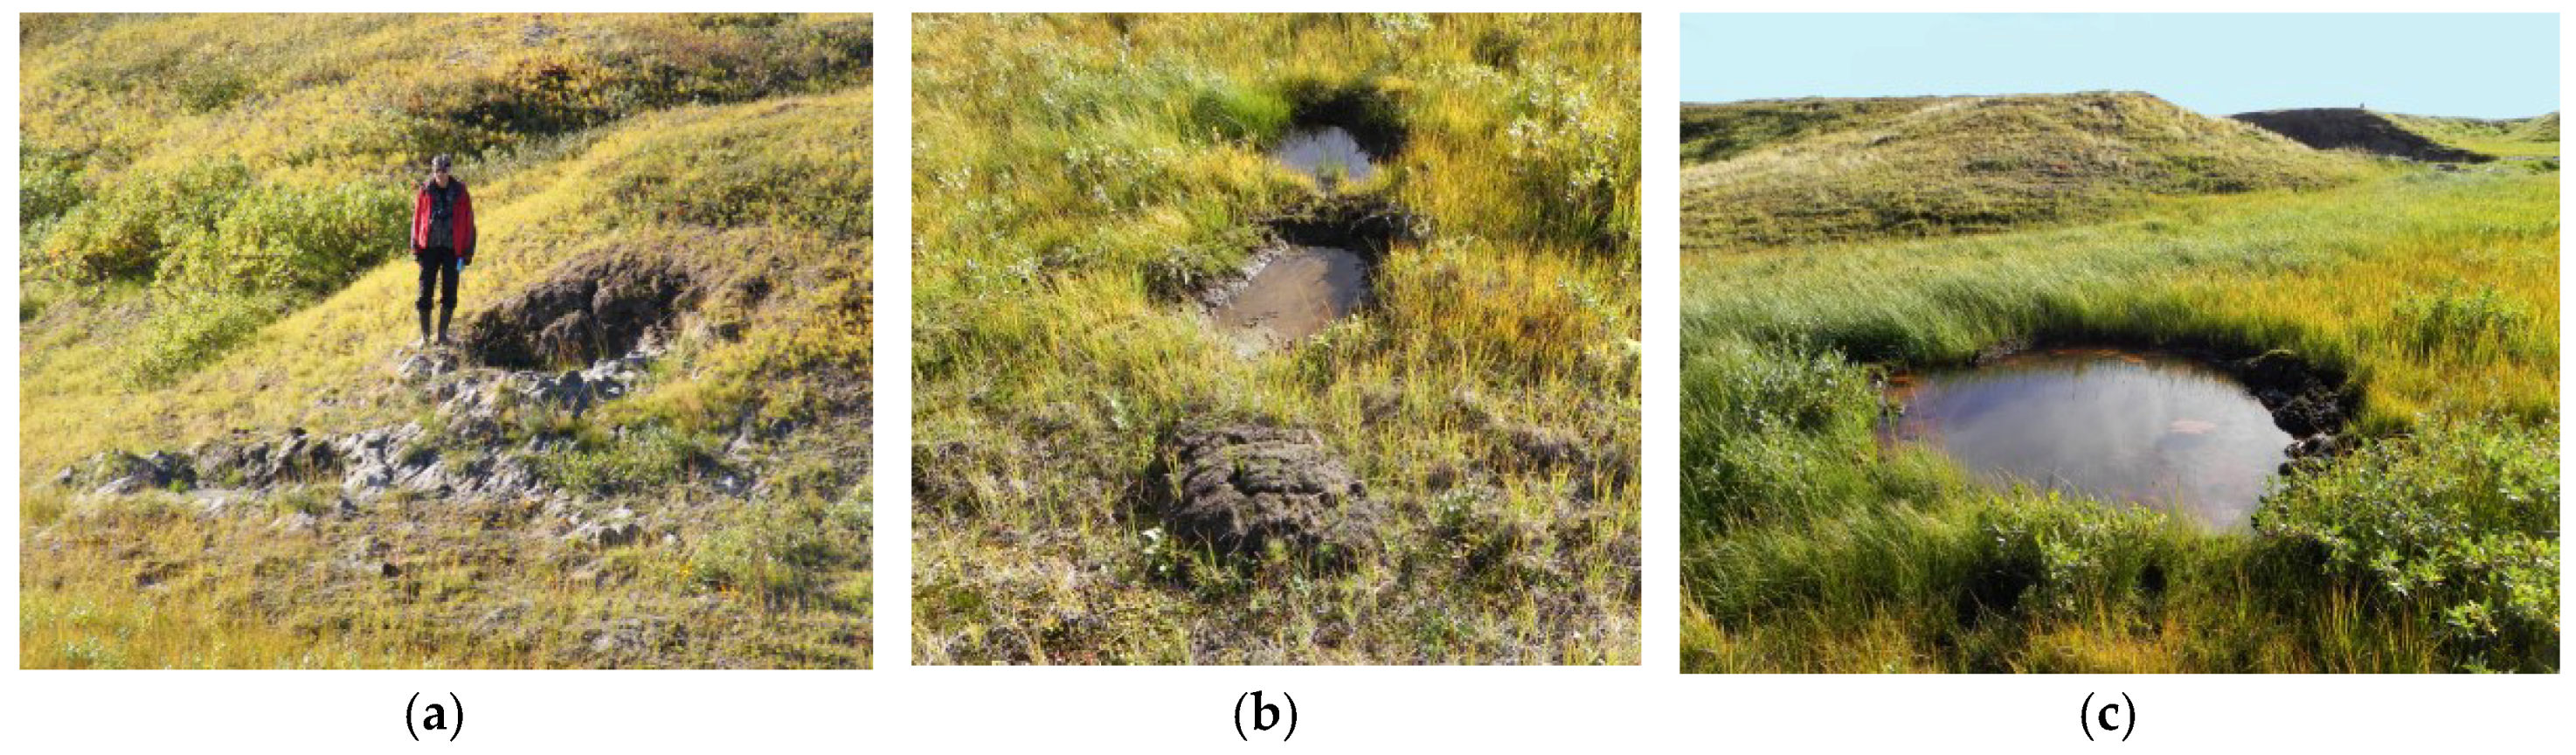
3.2.2. Field Results

Earlier, we performed an analysis of the changes in the relief associated with the formation of AntGEC [11,12]. It was established that all the changes except the crater itself were below the detection limit of the images. Thus even DEMs based on very-high spatial resolution multi-temporal satellite images taken before and after the formation of AntGEC did not allow to distinguish the changes in the microrelief that are less than 0.9 m in height. In this regard, the morphometric characteristics of microforms were obtained only during field full-scale measurements. In addition to the field data, we used imagery to outline the scattering zone and mark piles and impact hollows.
The largest volumes of ejected material were located to the west and northwest of the crater: (1) immediately adjacent to the western side of the crater area sloping to the gully covered by numerous fragments of ejected deposits (2) accumulative forms at the bottom of the gully. The accumulative piles recorded in the vicinity of AntGEC during fieldwork are comparable in size to the impact hollows and range in diameter from 0.06 m to 4 m.
AntGEC occupies the bend of the slope from a terrace edge to the gully. Thus, blocks of sod, piles of deposits, and impact hollows are located on both a terrace surface, and on slopes and bottom of an adjacent gully. Large piles are allocated only in the immediate vicinity of the AntGEC (Figure 12a). By 2016, only two accumulative bodies with a diameter of three to four meters remained to the west of the crater near its rim. Sandy deposits ejected during the formation of AntGEC covered the initial surface of the slope and were clearly recognized on the image of 11 October 2014 by striation pattern formed by erosion [12].
Within the scattering zone B, we noted only small, up to 1.2 m in diameter patches of mineral soil and pieces of sod (Figure 12b). The absence of preserved significant accumulative forms, composed of ejected material is explained by the lithological composition of the ejected blocks. Sandy deposits are covering geological section of the terrace to which AntGEC is linked and are underlain by tabular ground ice [12]. Accordingly, blocks of frozen sand and ice constitute the bulk of the ejected material. Frozen sand is easily washed away, leaving in some cases only sandy patches.
Morphometric characteristics of the impact hollows measured in field are as follows. Diameter varies from 0.2 m to 4 m, depth from 0.1 m to 0.5 m (Figure 13). Water-free hollows are predominantly small, up to 0.5 m in diameter and confined to inclined surfaces, thus providing drainage of water. The largest impact hollow not filled with water is located on the slope of the gully directly opposite of AntGEC (Figure 13a). The diameter of this impact hollow is 2.5 m, depth is 1.3 m.
On sub-horizontal surfaces, the impact hollows are filled with water. Largest impact forms (up to four meters in diameter) are located on the bottom of the adjacent to the AntGEC gully.

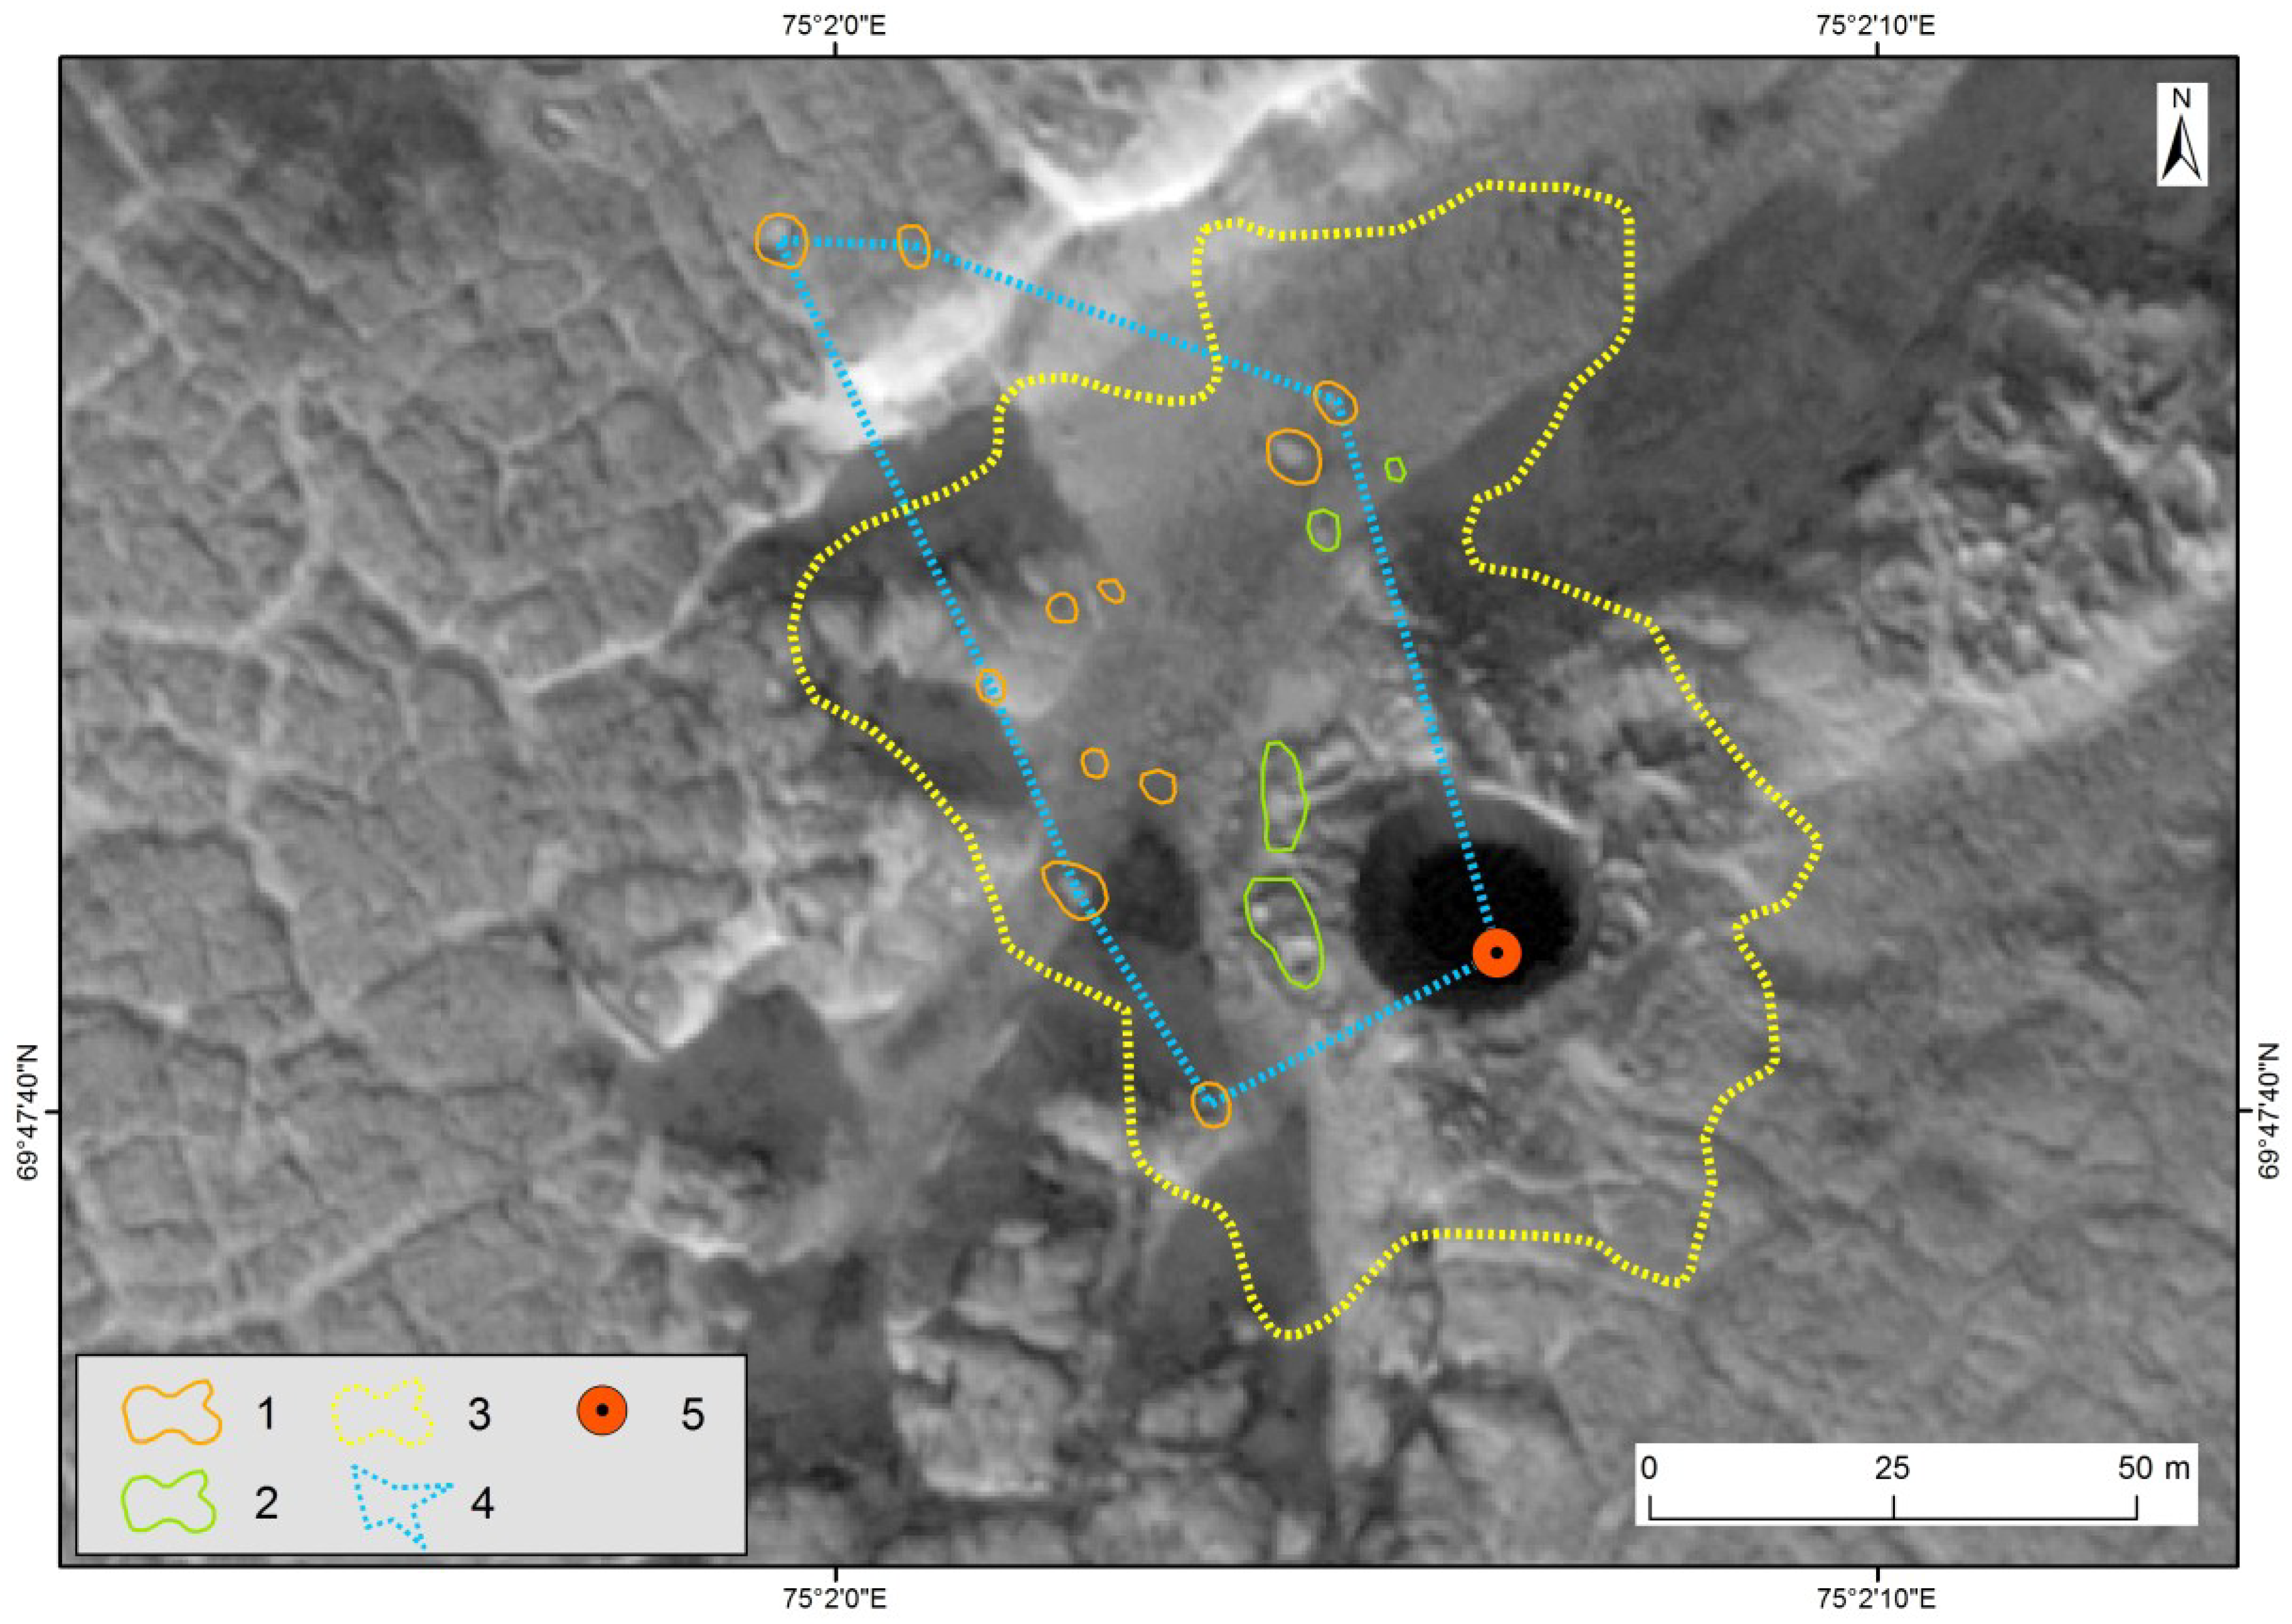
3.2.3. Remote-Sensing Results

RSD for AntGEC were processed earlier [12]. The image of 11 October 2014 best characterizes the state of the surrounding terrain one year after the formation of this crater in October 2013, and thus it was used to delineate the scattering zones (Figure 14). There is no data available for the period of frozen blocks yet preserved in place of later impact forms.
Analysis of the WorldView-1 image dated 11 October 2014 revealed positions of 11 impact hollows at a distance from 33.3 m (WSW) to 104 m (NW) from AMP (Figure 15). Most (82%) of these hollows are concentrated at a distance less then 60 m from AMP. Largest impact hollows (with area exceeding 20 m2) are distributed evenly within the zone A in relation to AMP.
Both zones A and B on the scheme (Figure 14) have an asymmetric shape extended in the NW direction. This asymmetry is also noted for the position of the crater rim relative to AMP, which also shifts to NW. The area of zone A is 3350 m2, of zone B is 7170 m2.

4. Discussion

The impact origin of the rounded hollows was subsequently confirmed by a clear correspondence of the location of these forms and blocks of ice and frozen deposits ejected onto the surface and recorded on photographs taken from a helicopter. The impact effect of ejected blocks of ice and frozen deposits had also manifested in the vicinity of SeYkhGEC formed in summer of 2017, on video and photographs obtained by members of the expedition organized by NP “Russian Center for Arctic Development” two days after this GEC had formed. Thus SeYkhGEC data gave additional evidence for the hypothesis of impact origin of hollows.
The scattering zone surrounds all GECs we studied and is one of the signs that allows us to separate craters from the sinkholes associated with thawing ground ice in collapsed pingo. Hollows associated with the action of impactor are quite unique. Close to the first crater we studied, GEC-1 in the Central Yamal, impact hollows were not detected. The most vividly similar forms are represented in the environments of GEC-2. Around the AntGEC, these forms are much rarer and smaller. The fate of SeYkhGEC hollows is yet unknown but most likely those were inundated by the river channel before impactors were fully thawed.
We assume that the presence of impact hollows in the vicinity of only three of five GECs studied in field may be due to the following natural features of the crater environments:
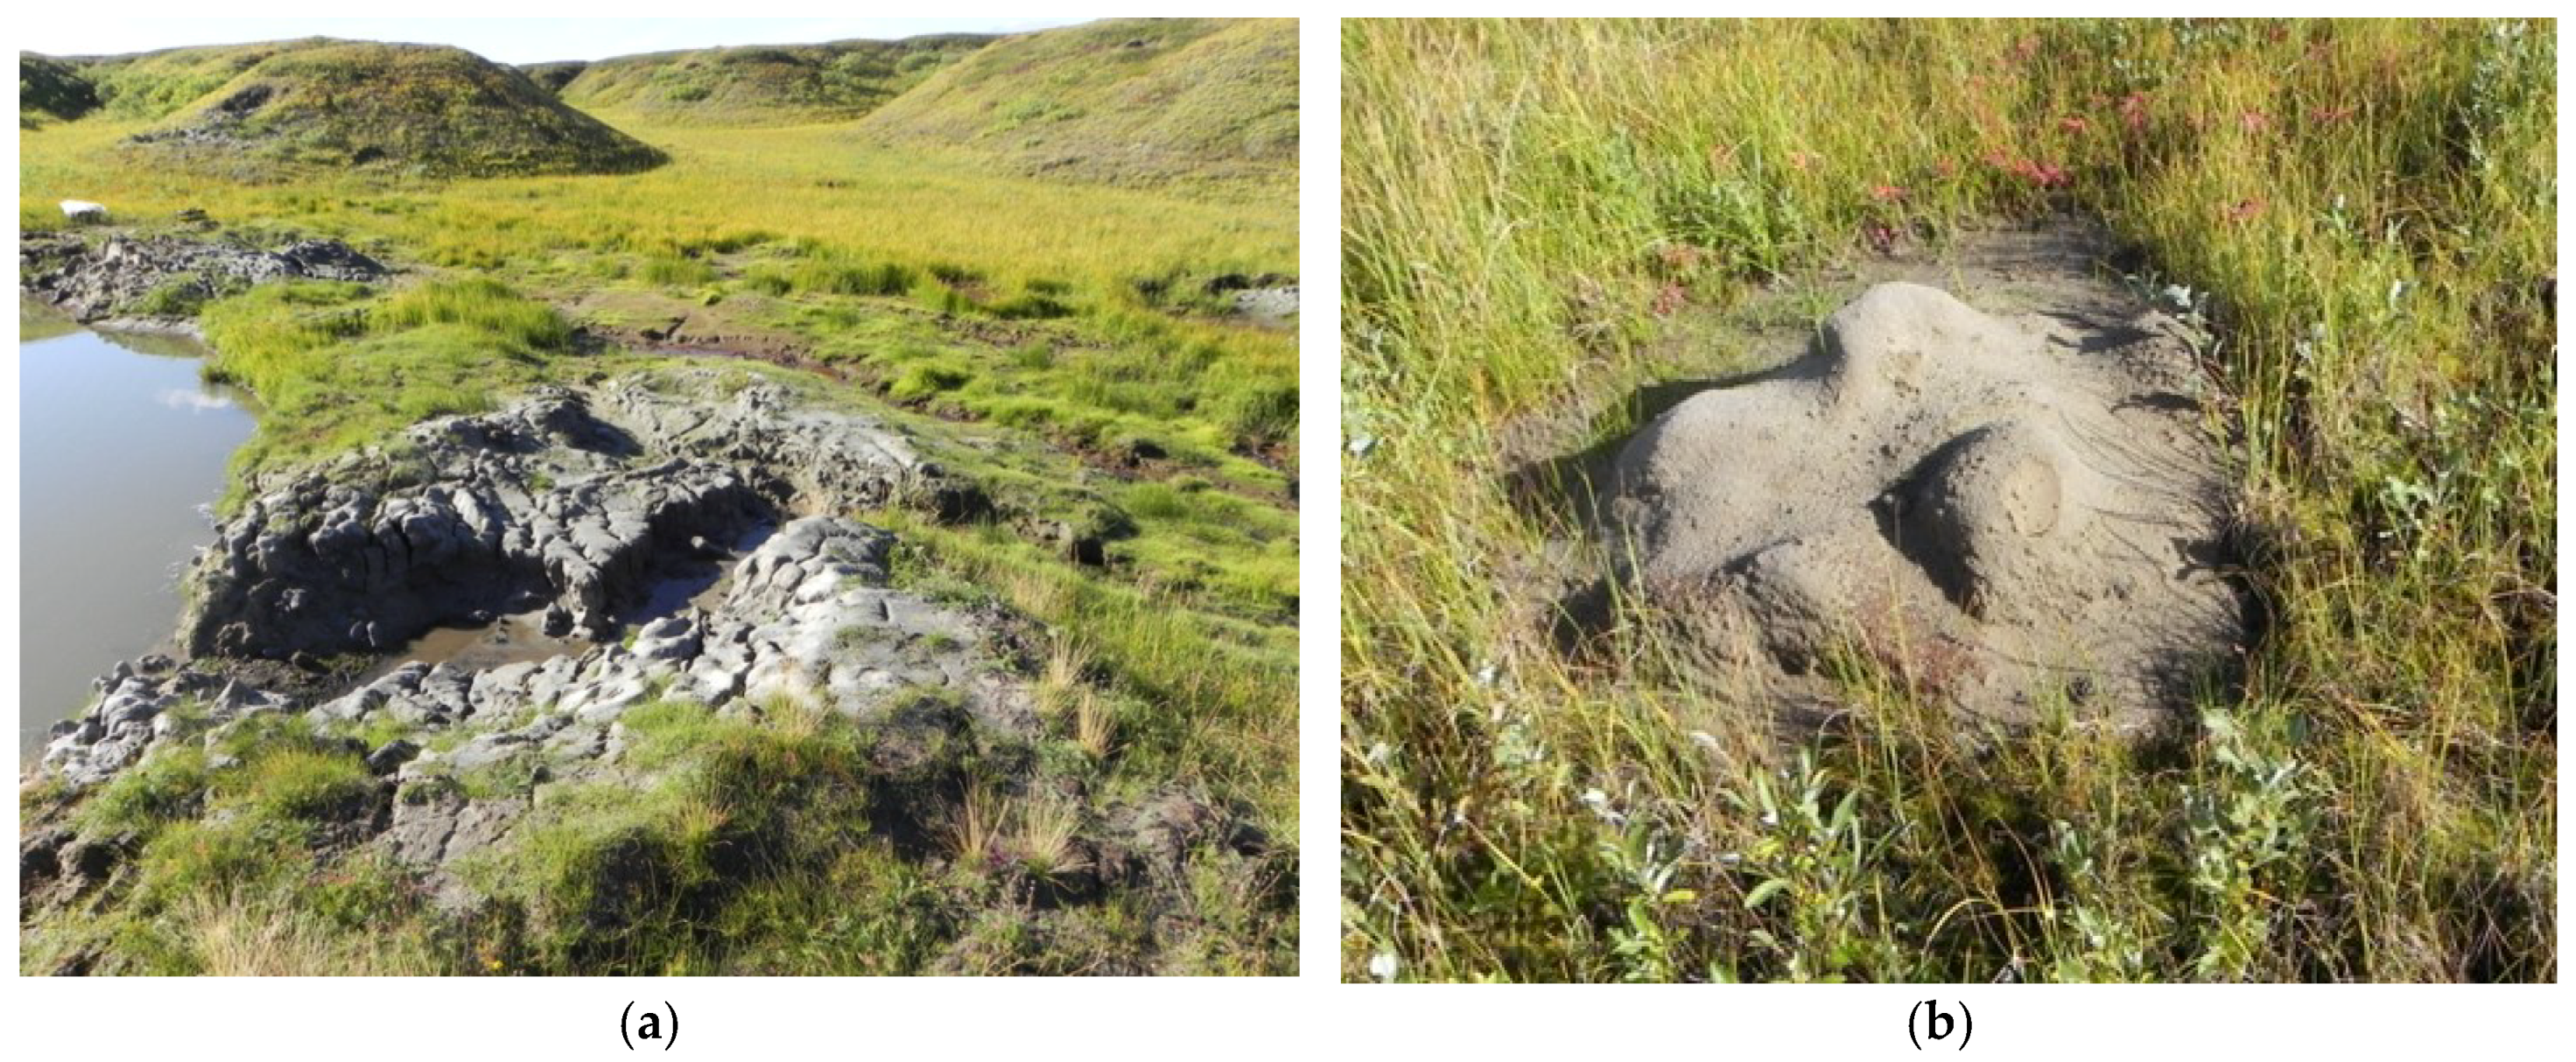
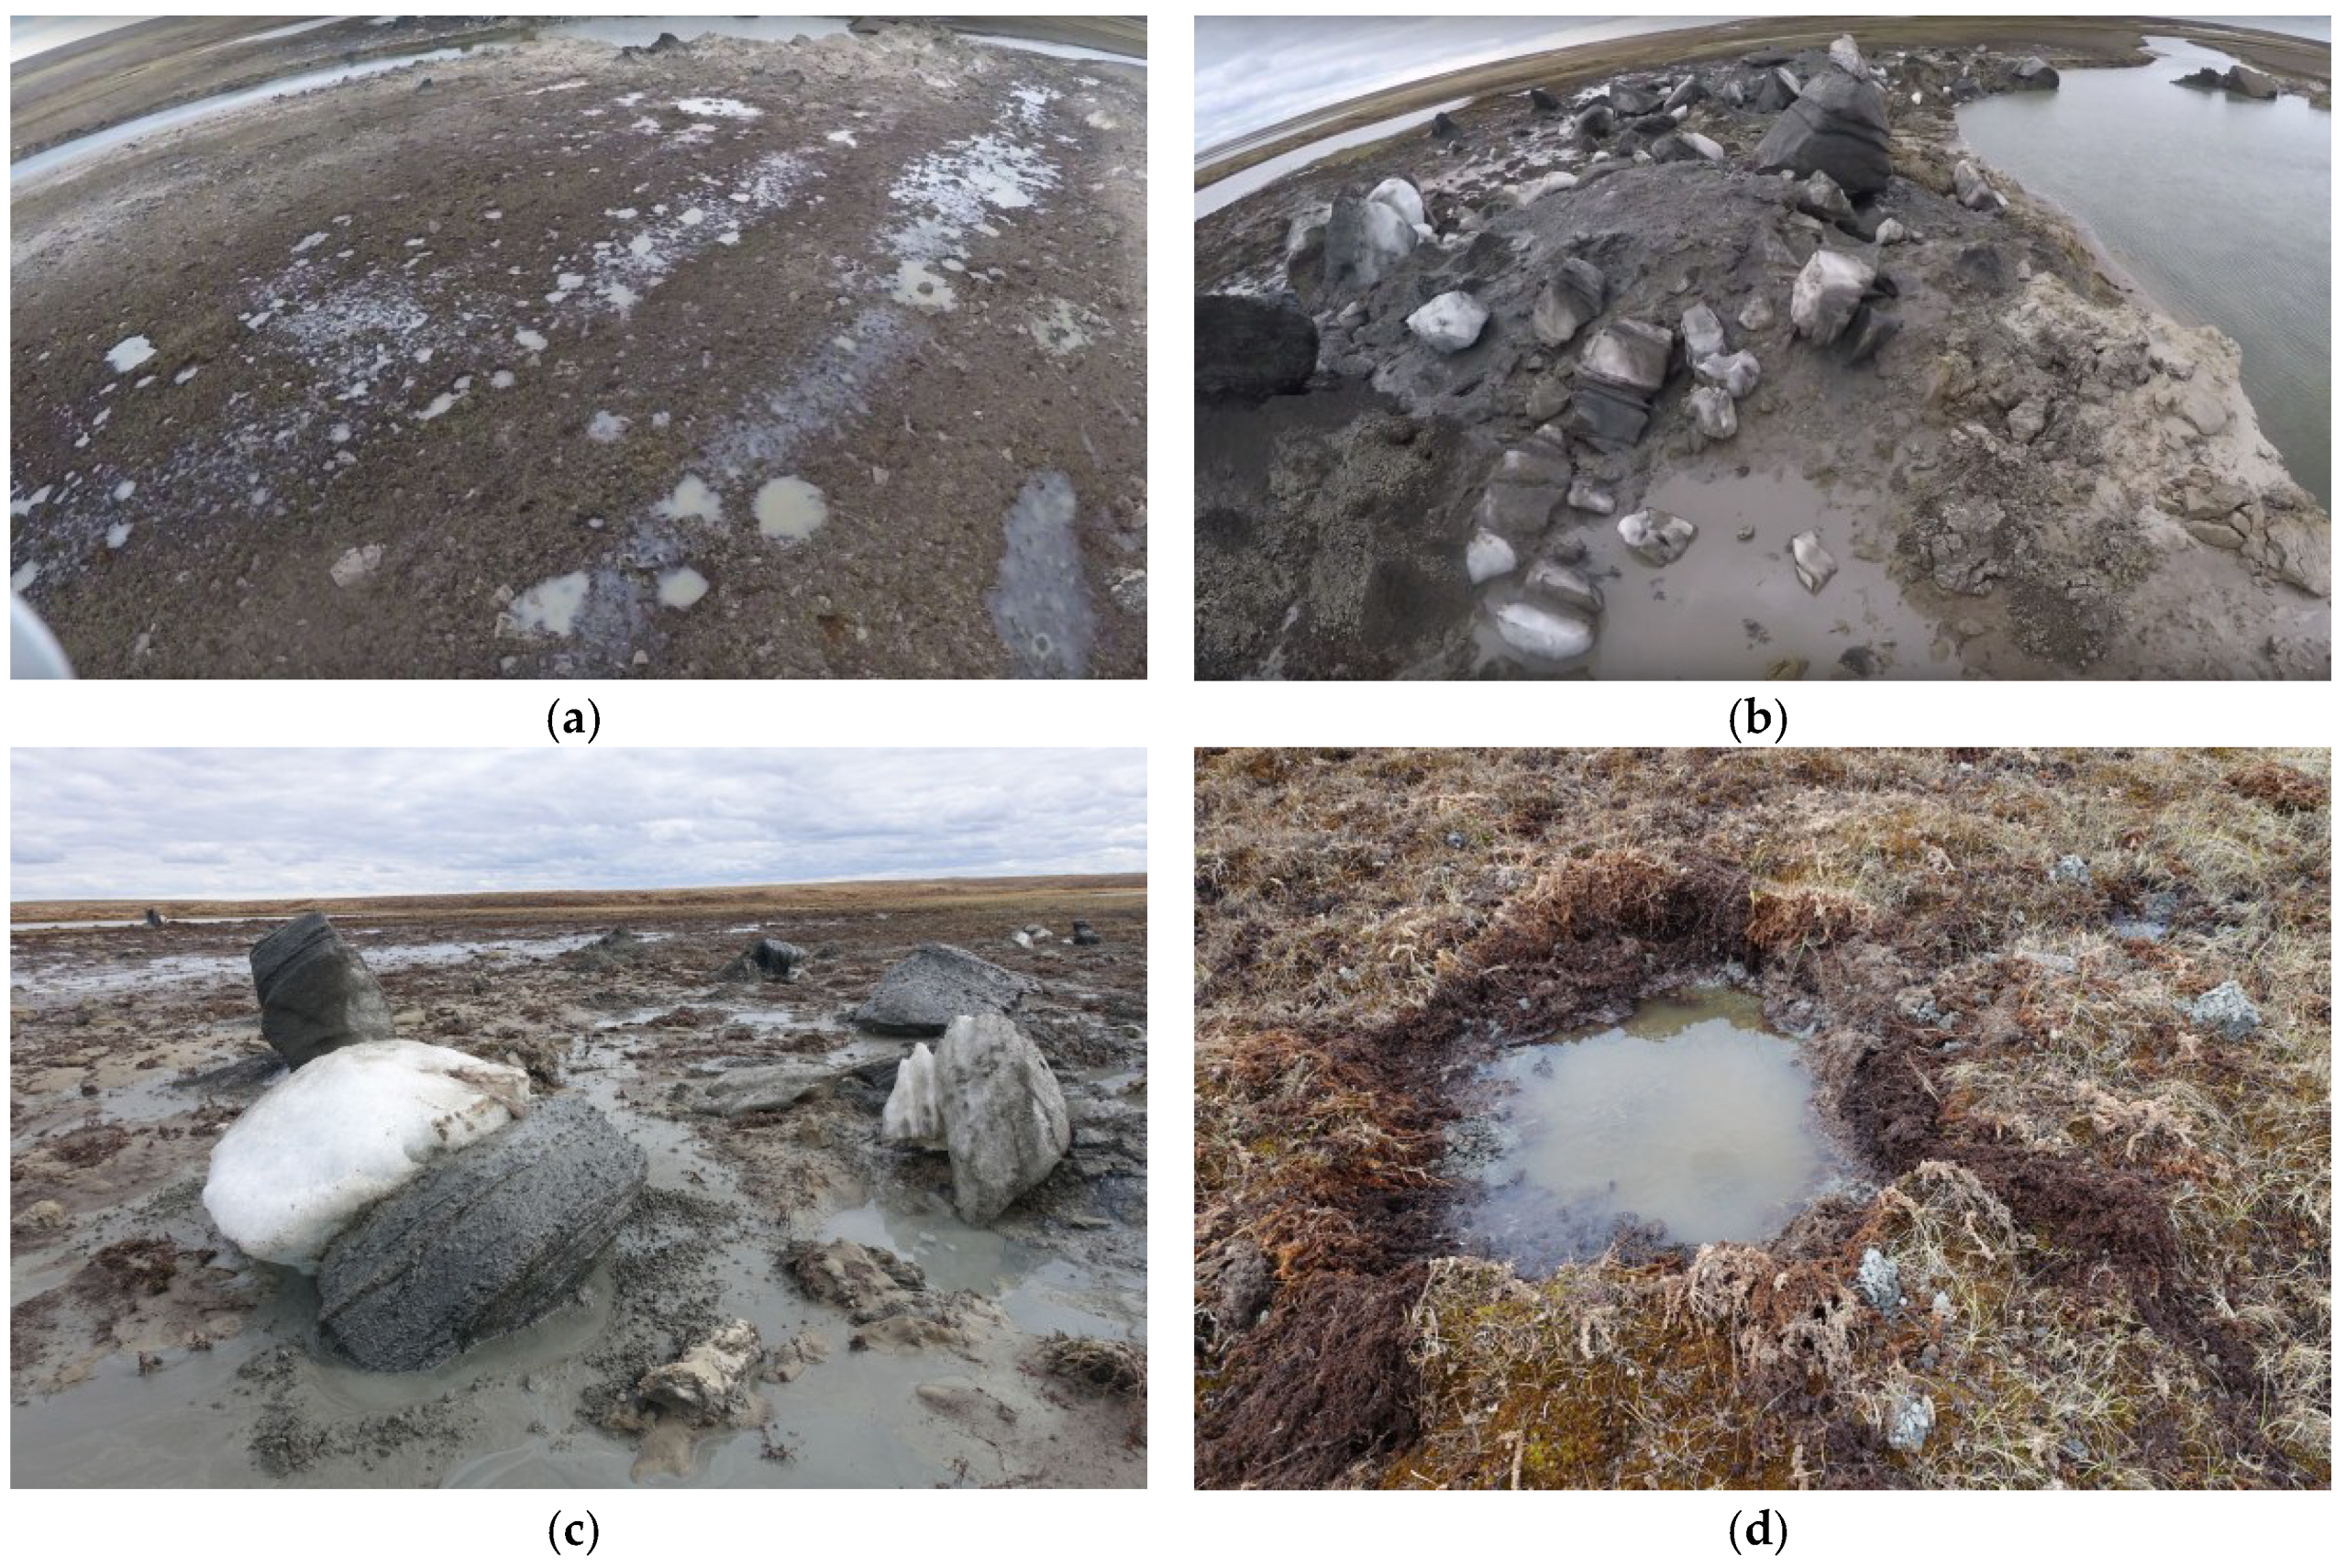
  • Lithological composition of ejected deposits. Only in case of large blocks of icy permafrost or pure ice, the impact pit would not be filled with thawed deposits and preserved as a negative microform; when the blocks of less icy frozen deposits are ejected, the impact pits are masked by thawed material. In addition, cryolithological structure of the geological section in the mound-predecessor probably determines the size of the ejected blocks. Small, fragmented blocks of ejected deposits formed in the initially thin-layered sediments as described in GEC-1 [2] probably do not lead to the ejection of blocks large enough to form impact hollows;
  • Differences in the structure of vegetation cover around GEC. Most pronounced are impact hollows on surfaces covered with moss–lichen–grass vegetation. In shrubby areas, firstly, willows could partially cushion a shock effect of falling blocks as presented on photographs in [1] (p. 14), and secondly, impact forms may not be detected when overshadowed by shrubs.
The hypothesis of the scattering of large blocks of ice and frozen deposits and their relief-forming role related to GEC is confirmed by photographs taken several days after the appearance of the SeYkhGEC (Figure 16) in place of a mound rising over the surface of the floodplain. In these photographs, ice blocks are clearly visible, reaching few meters in the diameter. Impact forms are marked on the low surface of the floodplain with ejected blocks, larger still sitting inside, smaller already thawed.
We compare the size of single impact hollows and zones A and B around GEC-2 and AntGEC (Table 4).
The scattering zone B around GEC-2 is approximately seven times larger than that of AntGEC. Most impact and accumulative microforms are located within a radius of 60 m from AntGEC and within a radius of 110 m from GEC-2. Analysis of different RSD shows that single traces of material transfer to larger distances can be found. The most remote traces of ejected material were found at a distance of 106 m from the AntGEC AMP, and at a distance of 293 m from the GEC-2 AMP.
Thus the radius of established “risk zone” where rather large frozen blocks-impactors is reaching up to 300 m. It should be noted that this zone should be considered as dangerous in terms of possible harm to people and infrastructure facilities in case of GEC formation. The size of this zone is 15–20 times the size of the initial crater radius for both GEC-2 and AntGEC of 12–15 m [12].
The asymmetry of scattering zones A and B around AntGEC, and its rim in the north-west direction from the crater is probably related to the deviation of gas and material ejection axis from the vertical to NW following the slope gradient in the direction of the nearby gully.
Differences in the distribution of impact hollows relative to AMP observed for GEC-2 can be related to the cryolithologic structure of both the mound-predecessor, and specific surface features which control formation of blocks having different size.
Discovered impact hollows near GEC-2 and AntGEC differ in size. The largest of the discovered hollows near GEC-2 are three times larger than those detected near AntGEC. In the first case, the diameter of the hollows is up to 13 m, depth is 0.1–1.5 m, while in the second case diameter is up to four meters, and depth is 0.1–0.5 m. We have no data on the size of the initial impactors for AntGEC, but difference in size of the hollows as well as piles suggests that the size of the ejected from AntGEC fragments was much smaller compared to those from GEC-2.
As a result of the analysis of multi-temporal imagery, single isolated impact hollows farther than average from GEC were found. For the GEC-2 area such forms are located at a distance of up to 293 m from the AMP. Earlier [1], the maximum scattering distance for GEC-1 was measured in the field to be up to 120 m. At this distance, only small fragments of sod and deposits up to 10–20 cm in diameter were found, too small to act as impactors. Most of the ejected material unloaded in the parapet along the crater rim thus largest blocks-possible impactors crowded buffering each other. At AntGEC site, farthest impact hollows were detected closer to the crater compared to both GEC-1 and GEC-2. One reason might be the unfavourable timing of the imagery in late fall 2014 used for their analysis. At that time, when the surface was already partly covered with snow, it was more difficult to allocate these features. On the other hand, the absence of remote traces of impact, which were not found also during fieldwork, may indicate different relative strengths of the ejection when comparing different GECs.
The data obtained at GEC-2 allow us to conclude that the field survey of new GEC should be expanded to at least 300 m when searching for ejected fragments and impact hollows.

5. Conclusions

A comprehensive analysis of RSD supported by field observations leads to the following conclusions:
  • Both positive and negative microforms of the relief associated with GEC formation could be found around GECs.
  • Positive microforms around GECs are characteristic for all craters and consist of the ejected frozen deposits, now thawed. These deposits either form a single parapet, or isolated piles and ridges 0.2–3.5 m in diameter and 0.1–0.8 m in height. Preservation of positive microforms is determined by lithological composition of ejected deposits and their resistance to erosion by rain and meltwater. Microforms composed of loam as compared to sandy loam and sand preserve better.
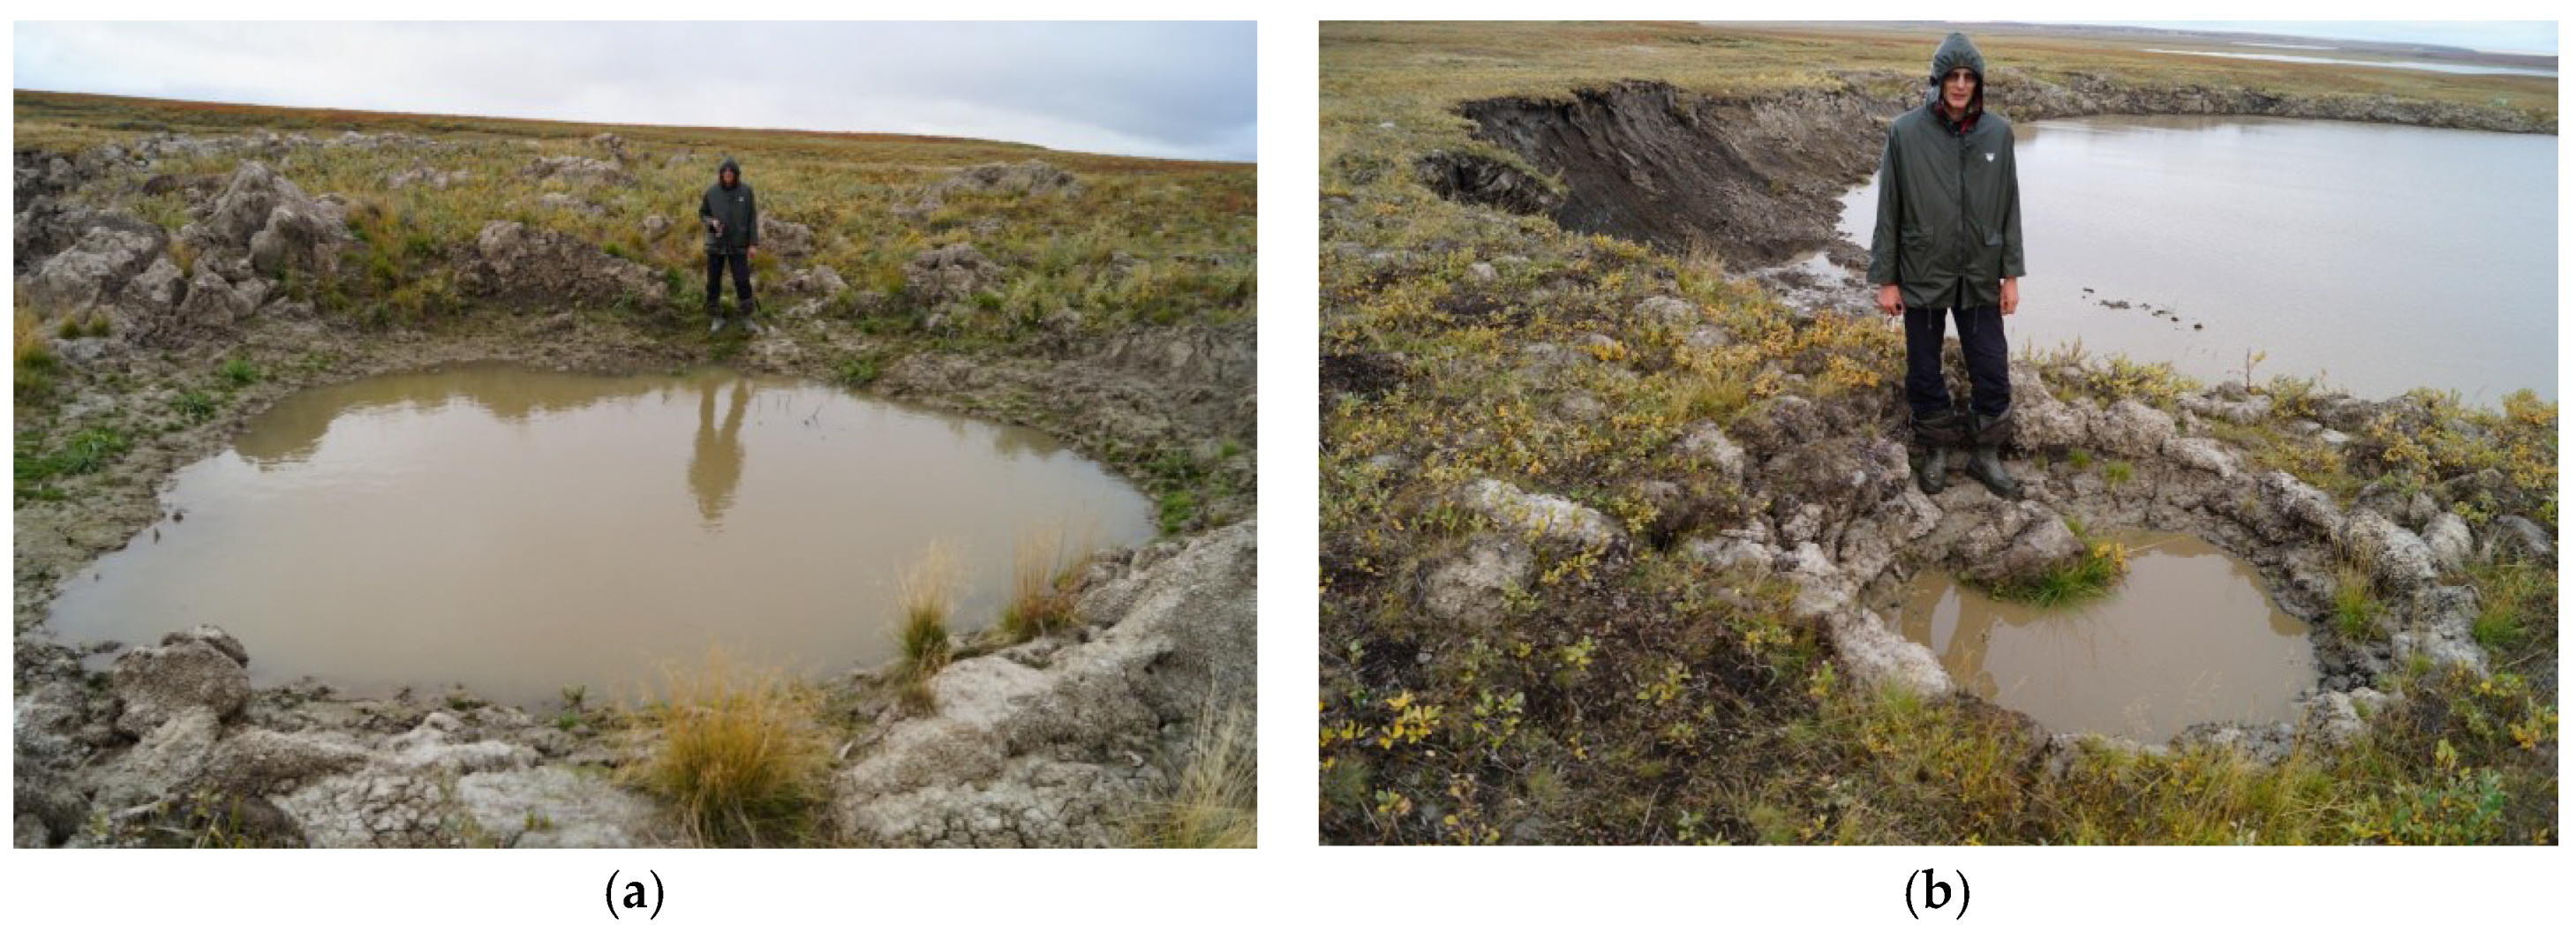
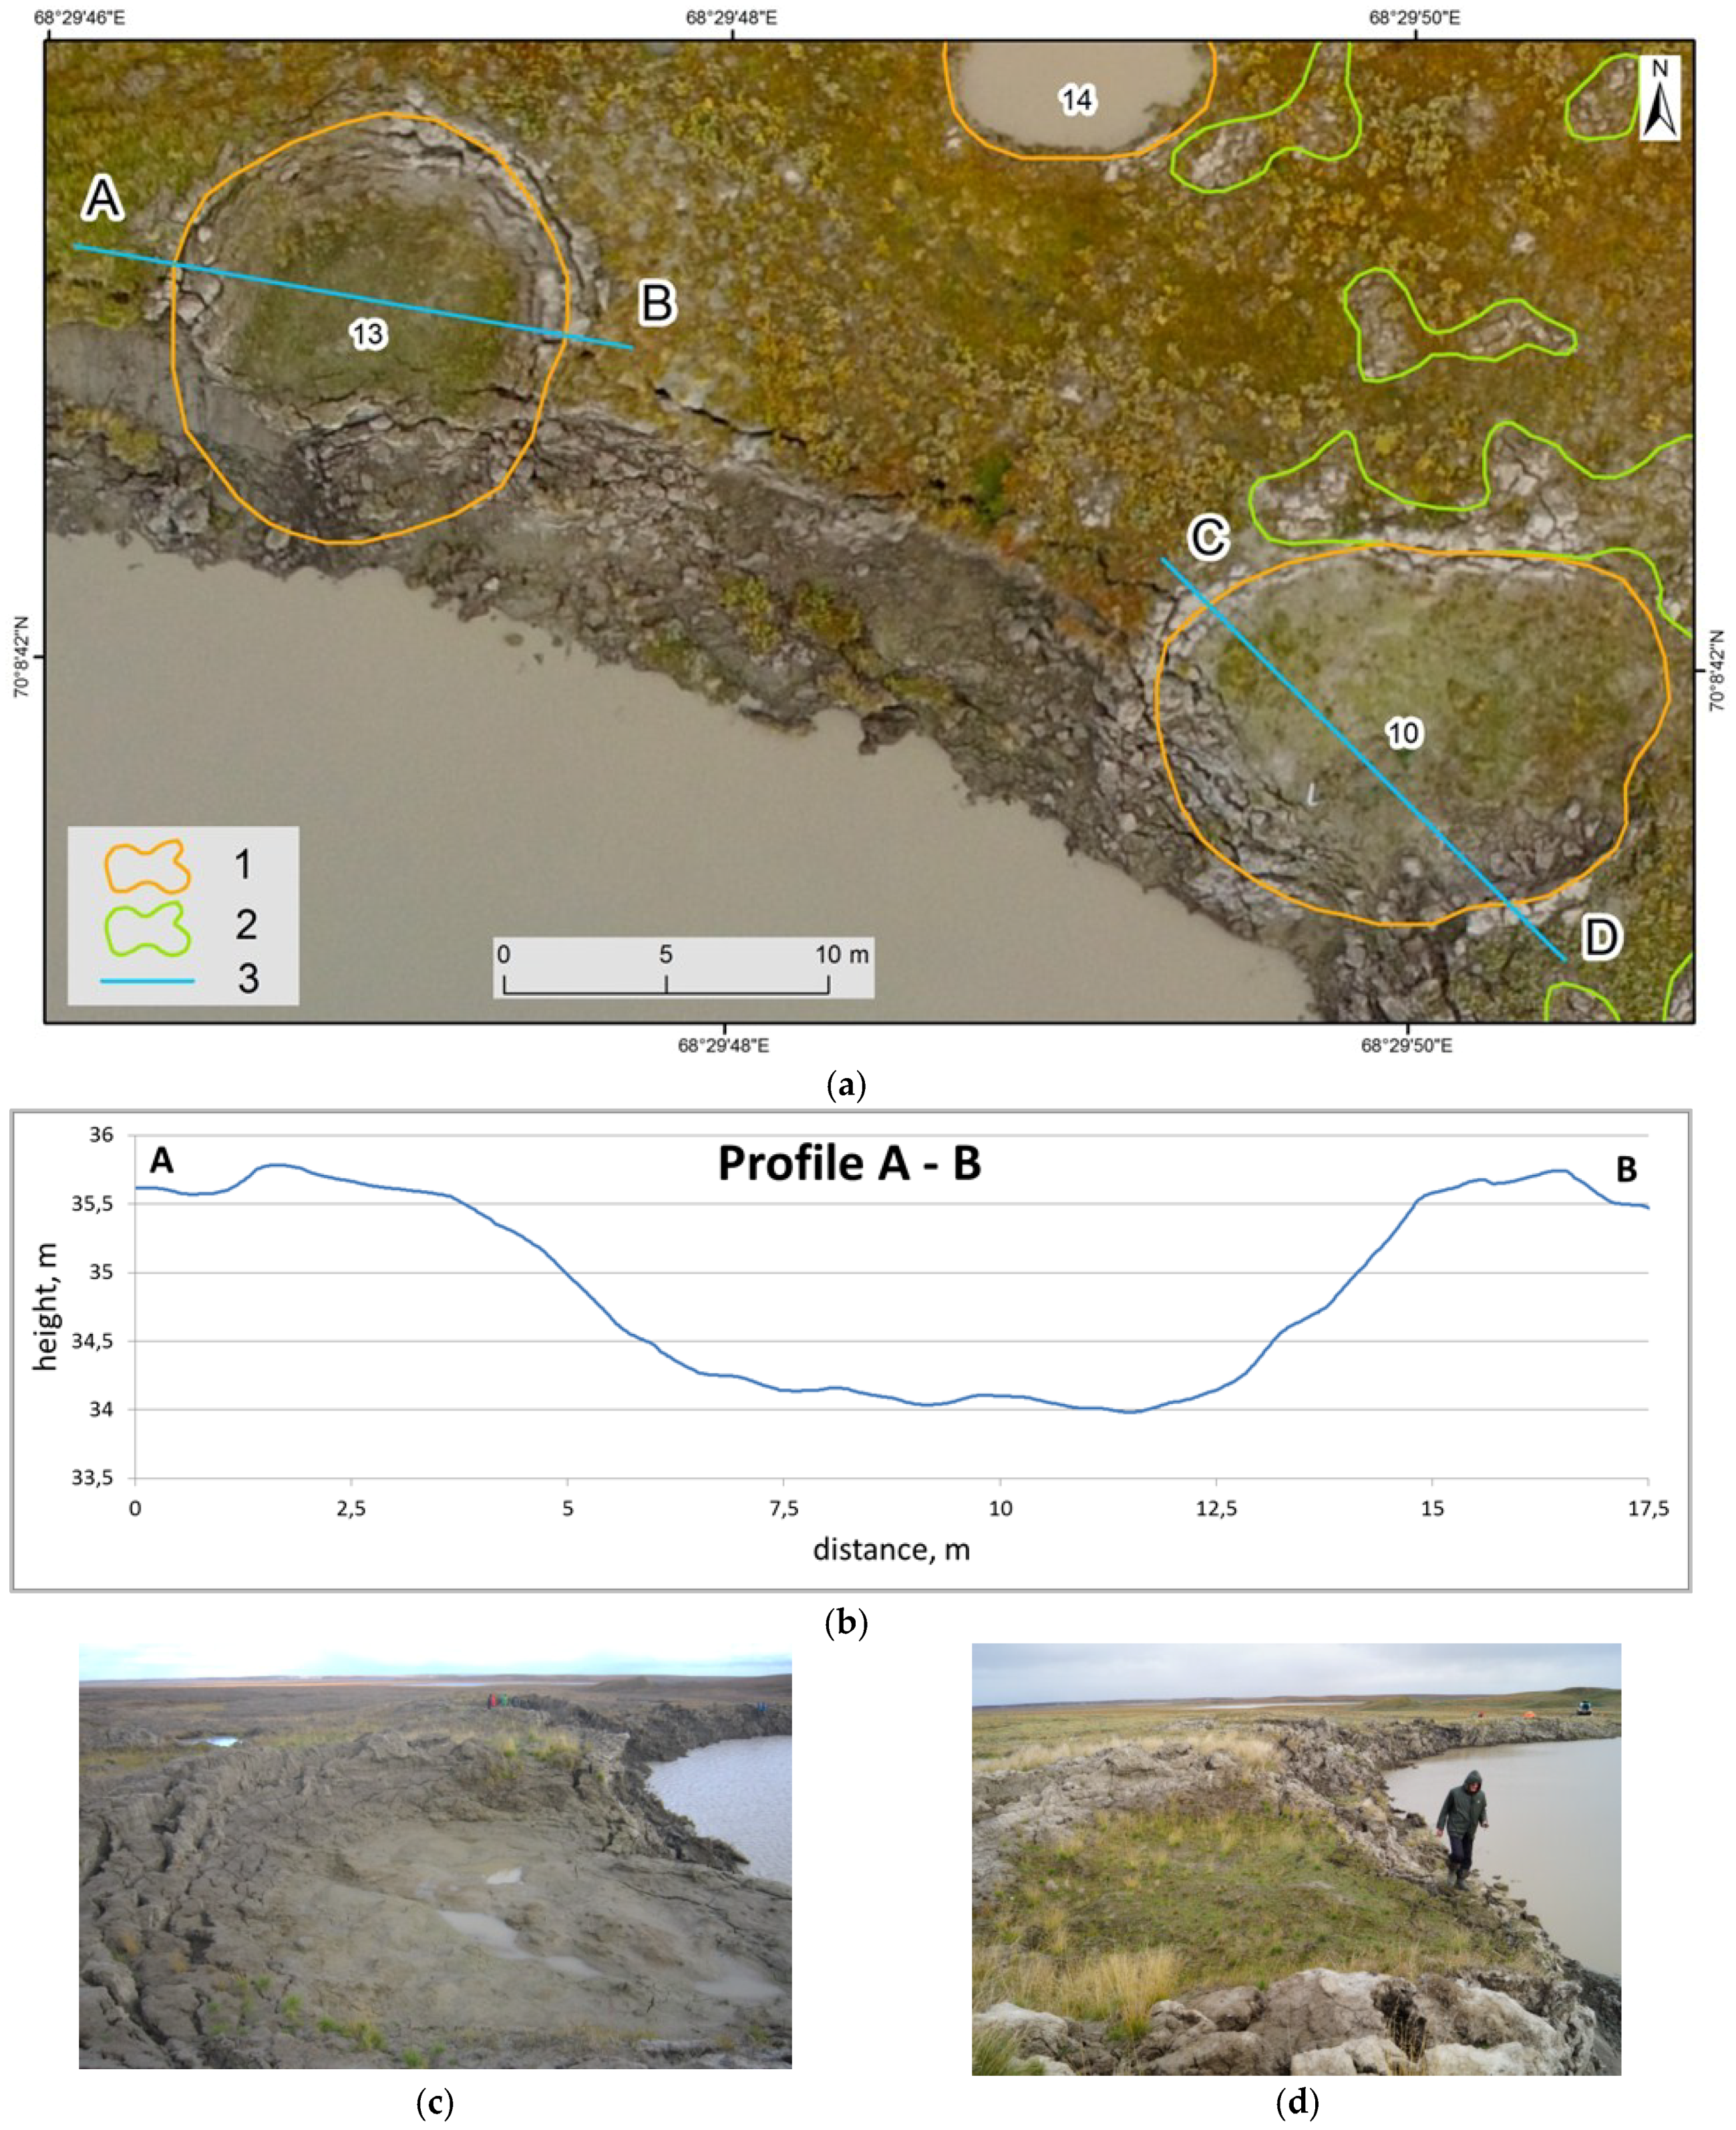
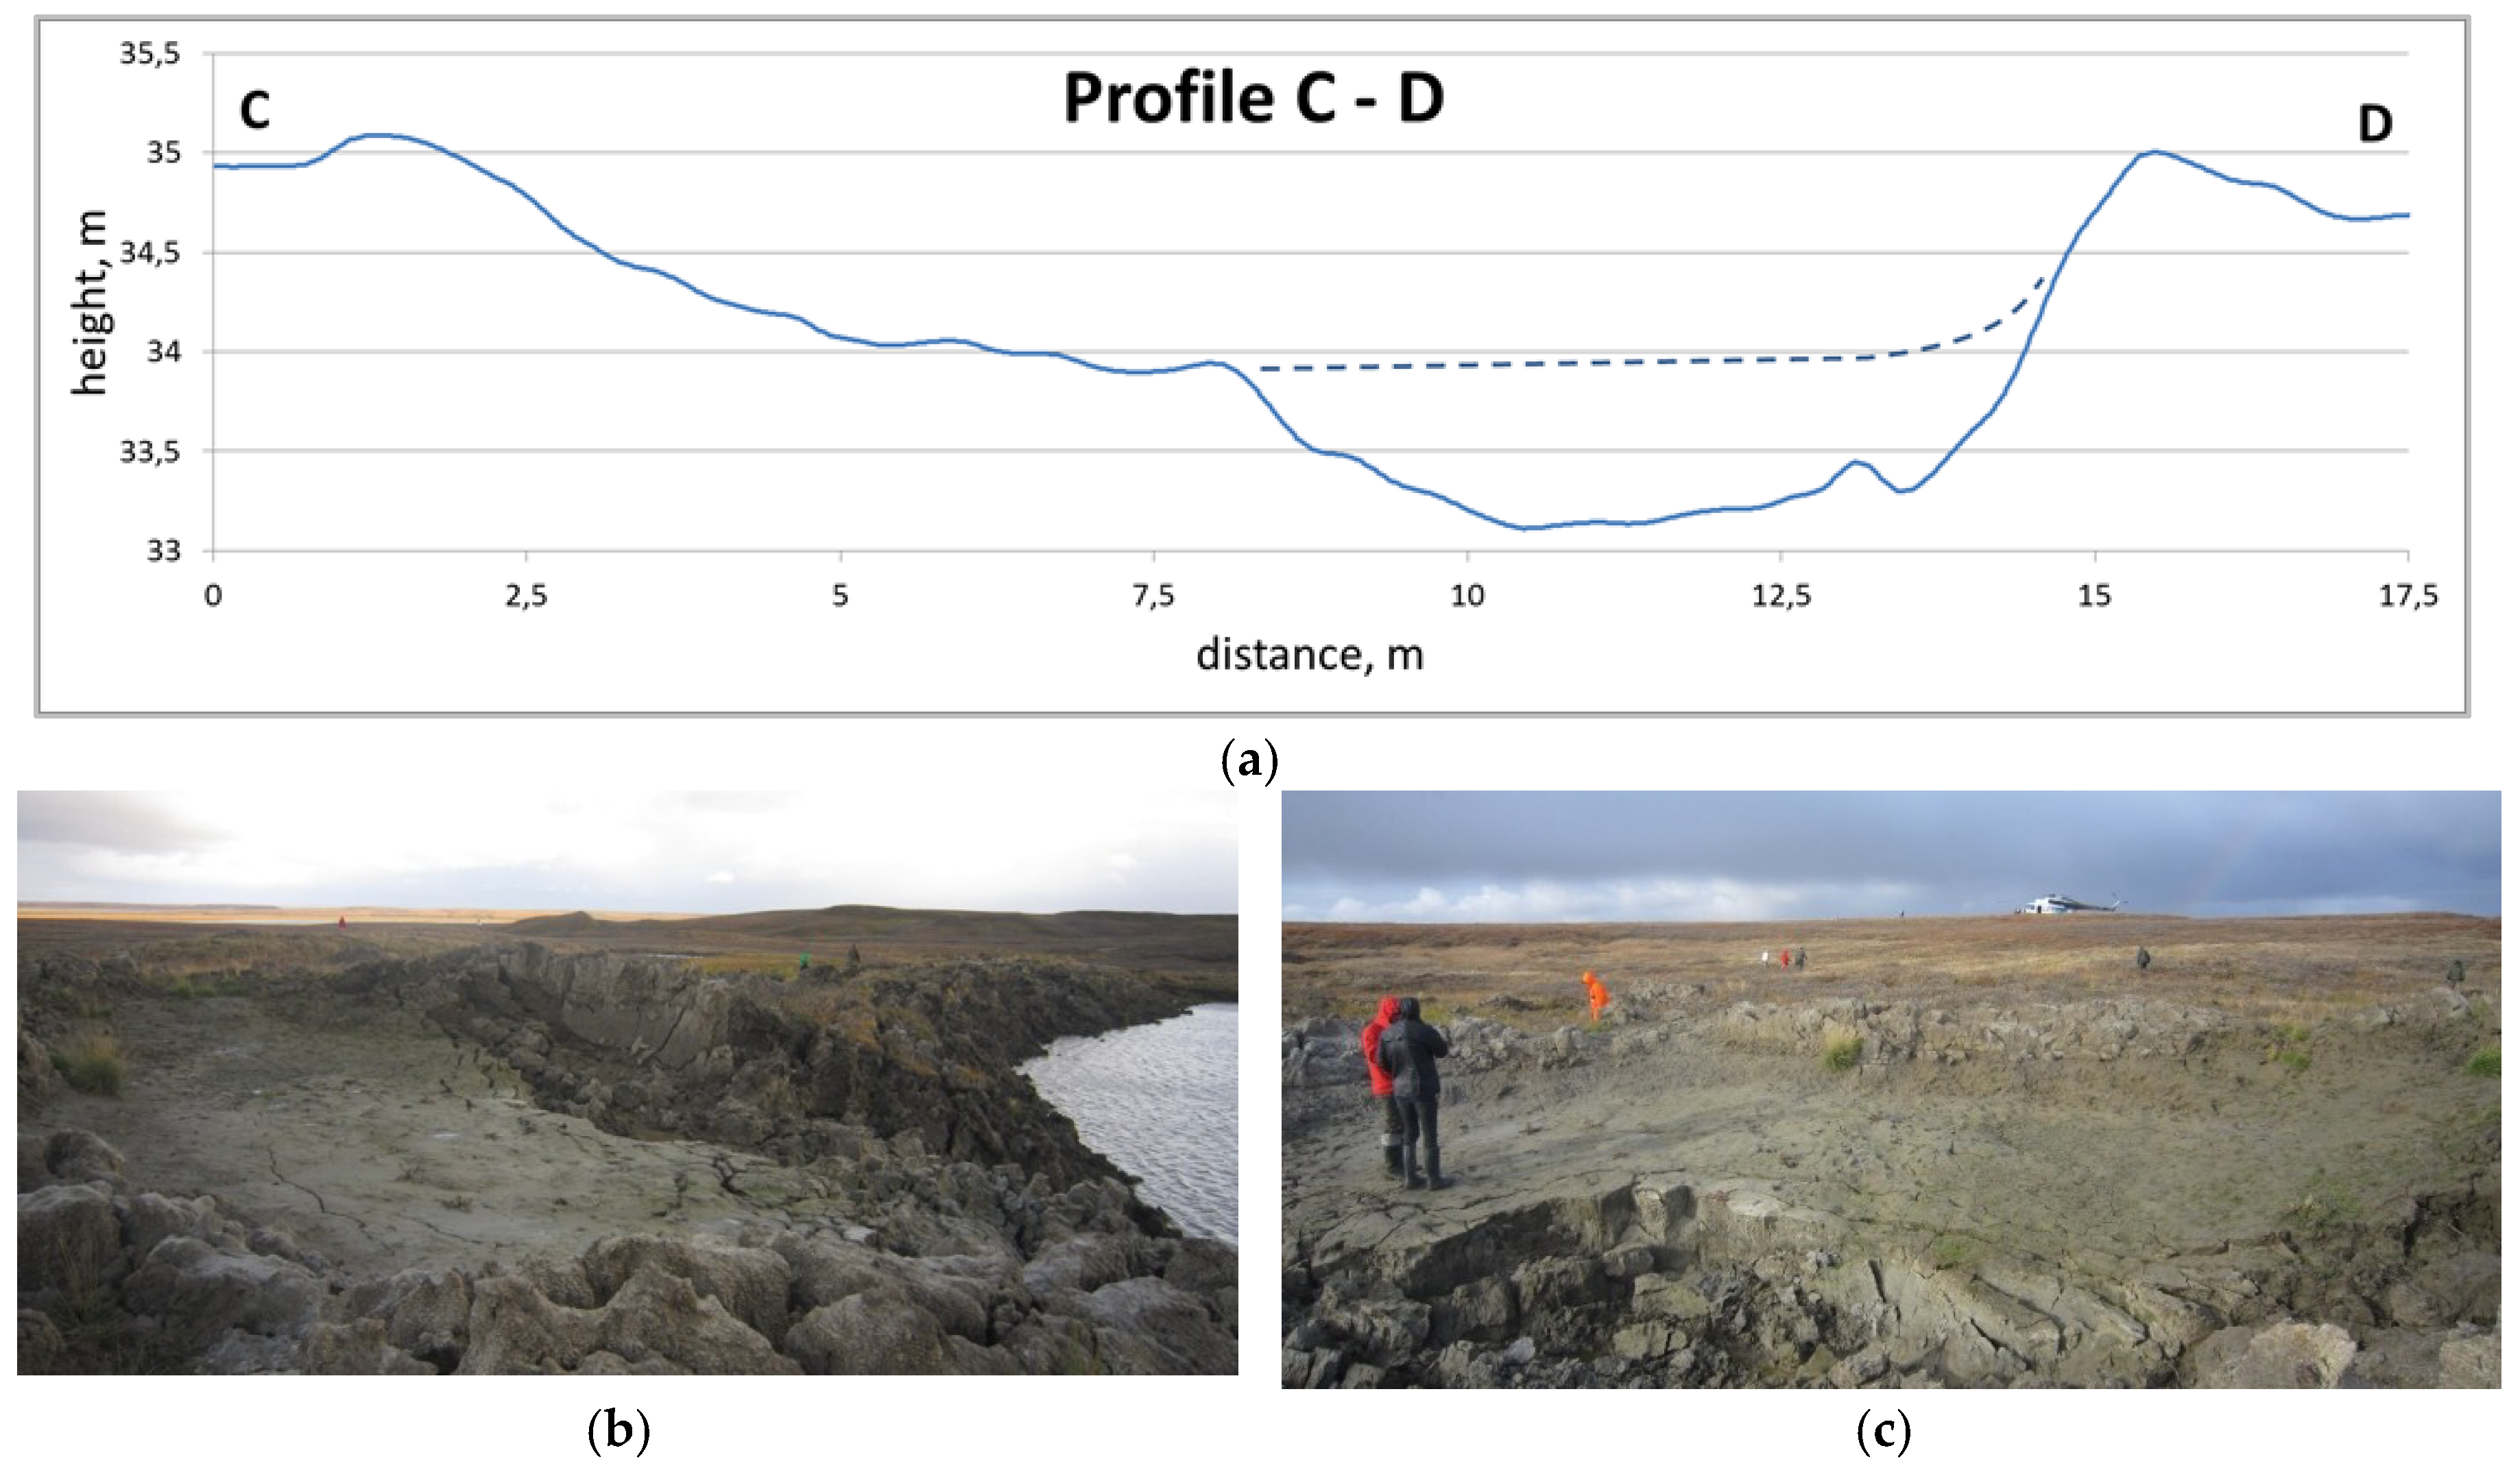
  • Negative microforms were found only around GEC-2, AntGEC and SeYkhGEC, and comprise rounded hollows up to 13 m in diameter and up to 1.5 m in depth, surrounded by an edging of extruded deposits. In most cases, these hollows are filled with water except for hollows on slopes or edges drained by erosion.
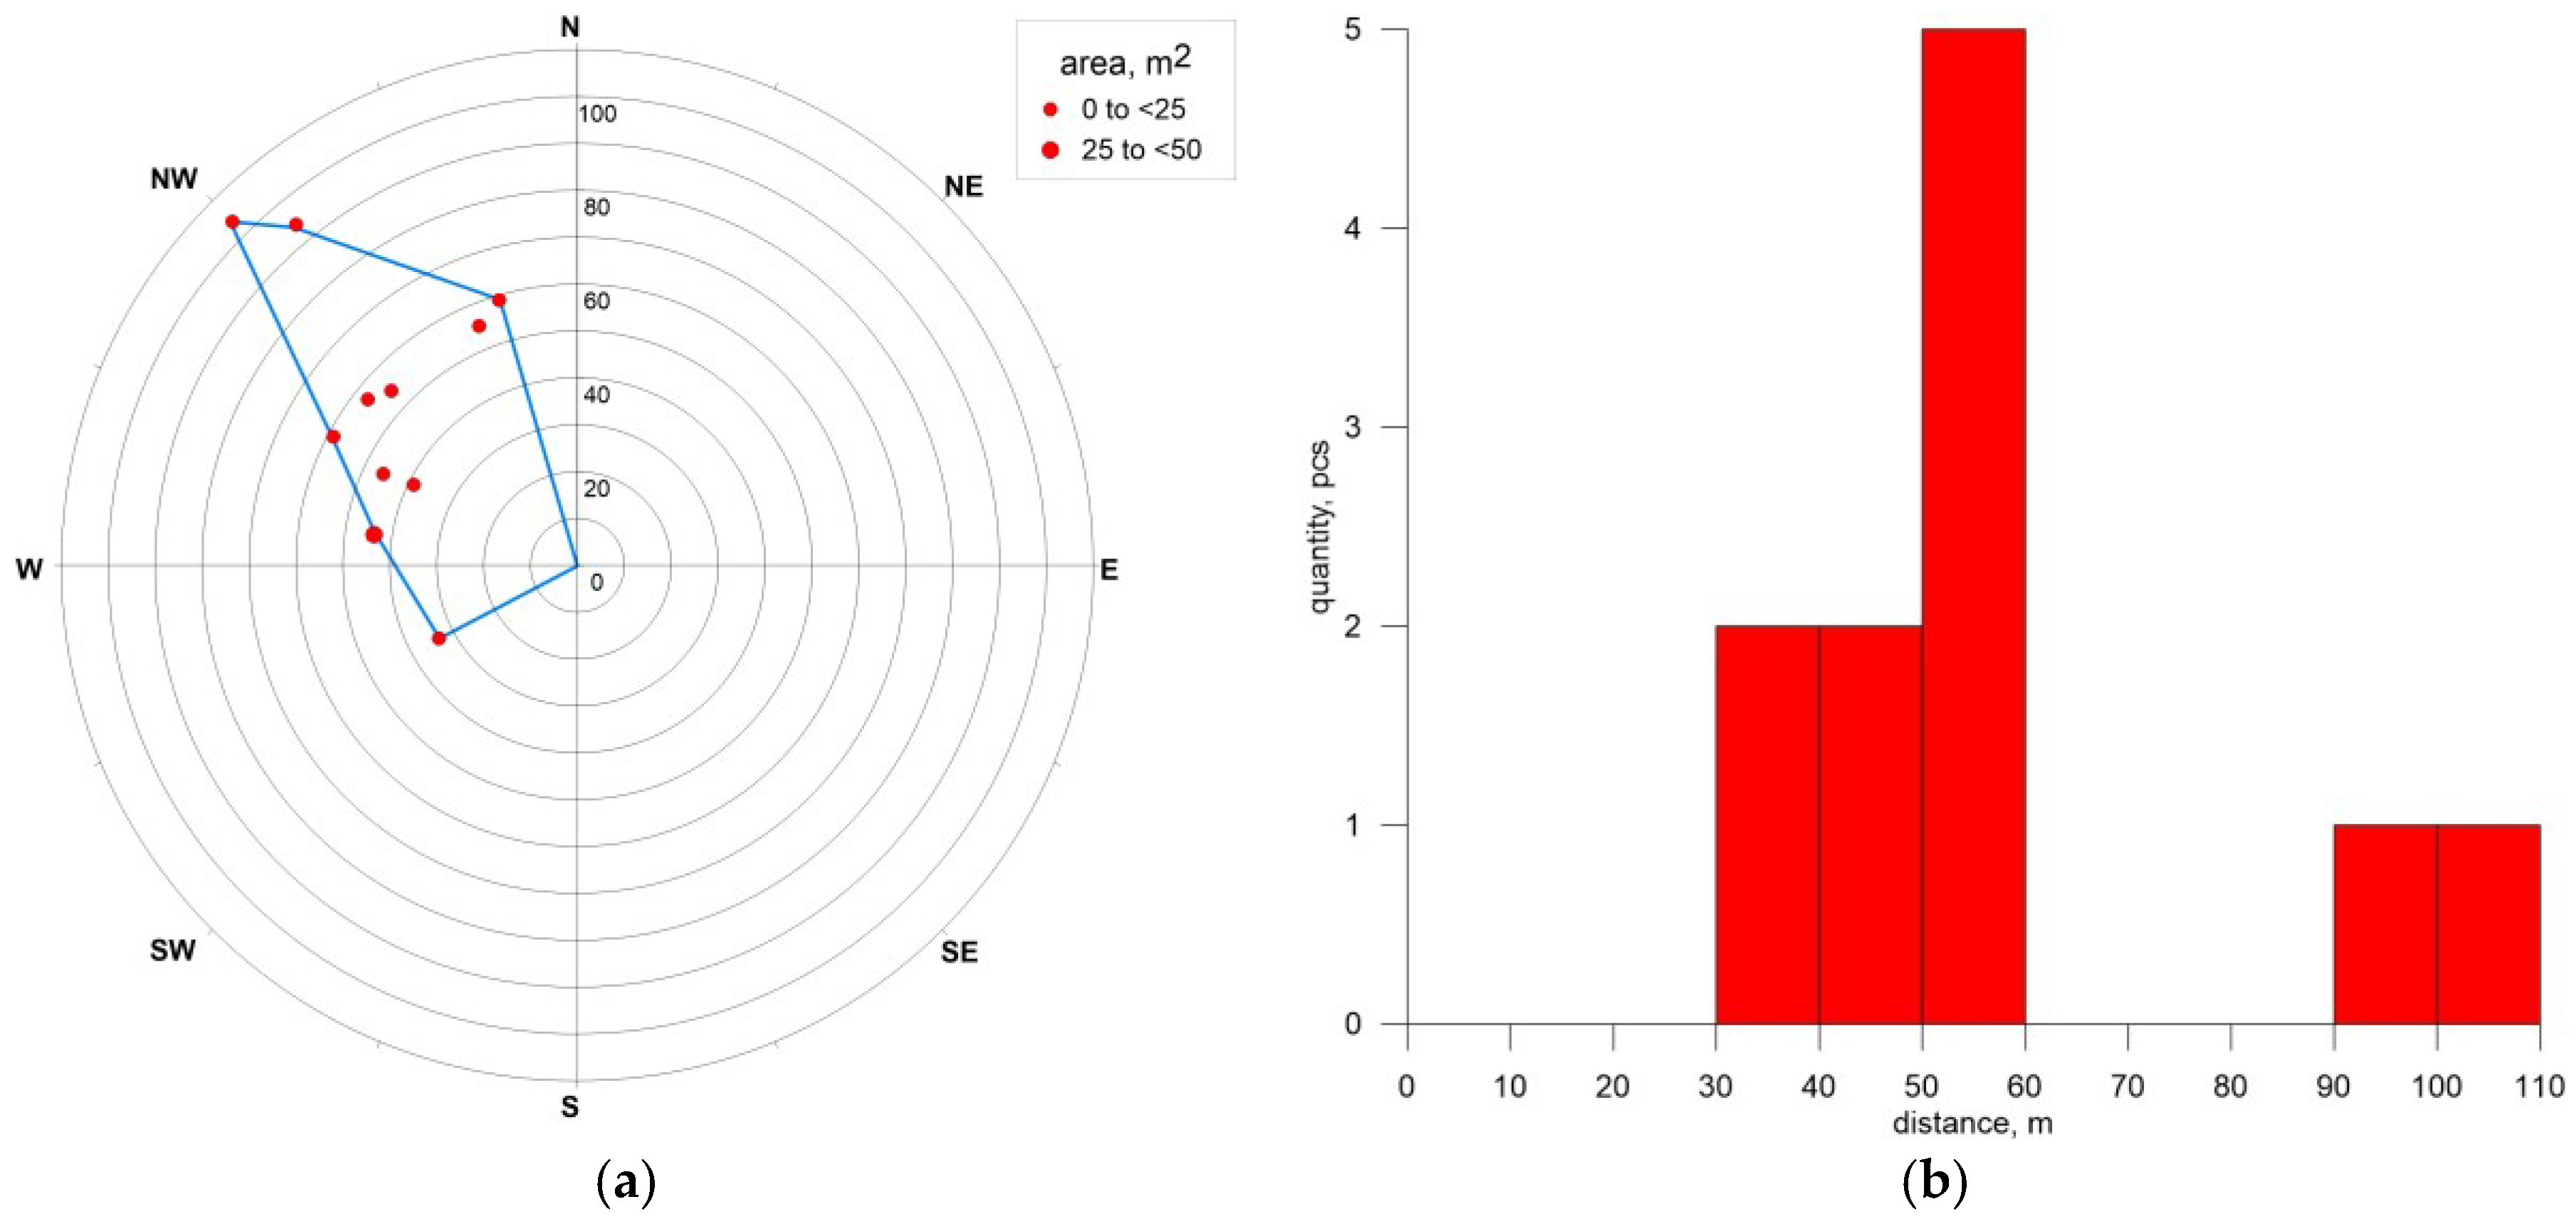
  • While crater walls are retreating, the closest to the crater rim hollows are first drained and then engulfed by the crater lake. Piles and ridges are eroded and fall into the crater lake. Interpretation of multi-temporal imagery allows reconstruction of initial position, size and number of piles and hollows now inundated and thus estimate the amount and iciness of ejected material.
  • We suppose that data obtained by analysis of imagery, photographs and field survey provides sufficient evidence in favor of the hypothesis that the hollows around GECs are impact microforms associated with a hit from large blocks of frozen deposits.
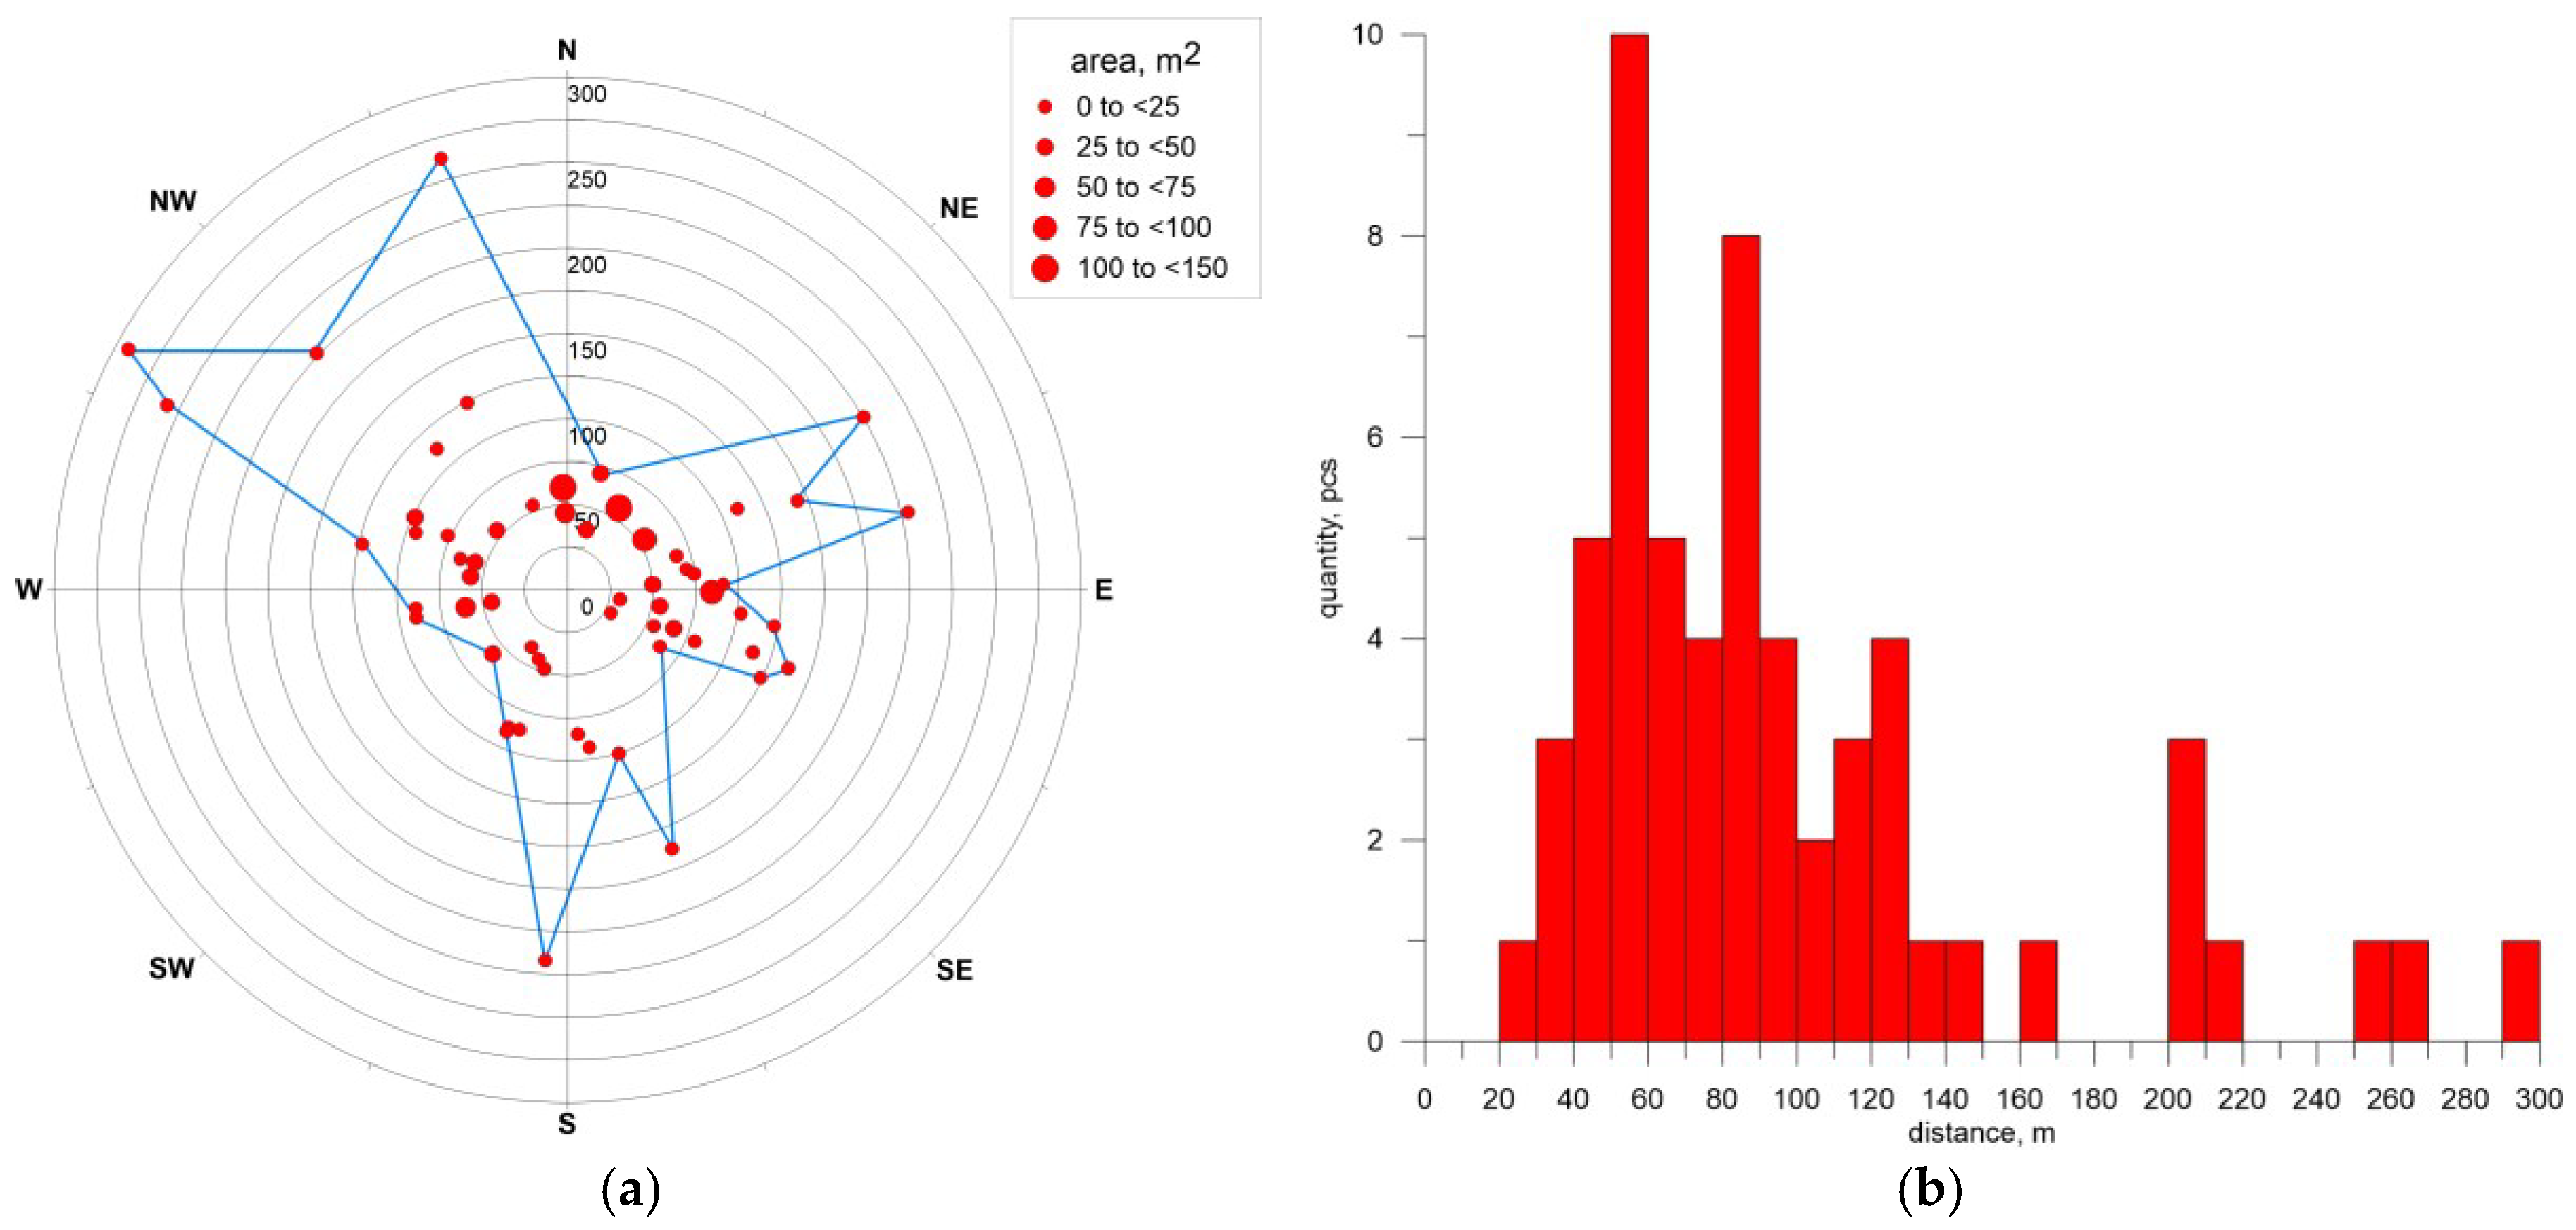
  • RSD application made it possible to identify impact hollows at a distance of up to 293 m from the GEC-2 AMP, which we did not expect based on previous studies and thus did not observe in field. We consider the size of the scattering zones to serve as an indicator of the “eruption” energy. This information can be used in future in modeling the mechanism of GECs formation.
  • During field surveys of new GECs, the search zone for traces of ejected material and possible impact hollows should be expanded to at least 300 m unless there are any other indications of the range by an analysis of operational very-high resolution satellite imagery.
  • Thus, it has been established that the area of the relief-forming effect of GECs (risk zones) extends far wider than the crater with its parapet alone which should be taken into consideration when planning further studies and estimating risks of allocating economic infrastructure and settlements (including temporary camp sites of the indigenous tundra population) close to predicted craters.

Author Contributions

Alexander Kizyakov provided research setting, analyzed the data, and wrote the paper. Artem Khomutov performed and pre-processed UAV and GPS surveys, obtained and processed field data at GECs. Mikhail Zimin did satellite images processing and map design. Rustam Khairullin did UAV data processing. Elena Babkina and Yury Dvornikov obtained and processed field data at GECs. Marina Leibman suggested concept, provided field descriptions, and edited the paper.

Acknowledgments

The work was supported by the Russian Science Foundation (grant 16-17-10203). The authors thank “Russian Center for Arctic Development” for organizing and supporting field work. D. Ehrich, A. V. Baryshnikov (“Russian Center for Arctic Development”) and A. I. Sinitckii (“Scientific Center for Arctic Studies”) for providing photo and video materials from SeYakha crater. Department of Science and Innovation of Yamal-Nenets Autonomous District for providing photos of GEC-2 from the helicopter. Company Total for providing satellite images of GEC-2 area. Authors are indebted to anonymous reviewers whose comments helped improving the manuscript.

Conflicts of Interest

The authors declare no conflict of interest.

References

  1. Leibman, M.O.; Plekhanov, A.V. The Yamal gas emission crater: Results of preliminary survey. KholodOK 2014, 2, 9–15. (In Russian) [Google Scholar]
  2. Leibman, M.O.; Kizyakov, A.I.; Plehanov, A.V.; Streletskaya, I.D. New permafrost feature: Deep crater in Central Yamal, West Siberia, Russia as a response to local climate fluctuations. Geogr. Environ. Sustain. 2014, 4, 68–80. [Google Scholar] [CrossRef]
  3. Khilimonyuk, V.Z.; Ospennikov, E.N.; Buldovich, S.N.; Gunar, A.Y.; Gorshkov, E.I. Geocryological conditions of Yamal crater location. In Proceedings of the Fifth Conference of Russian Geocryologists, Moscow, Russia, 14–17 June 2016; University Book: Moscow, Russia, 2016; Volume 2, pp. 245–255. (In Russian). [Google Scholar]
  4. Epov, M.I.; Eltsov, I.N.; Olenchenko, V.V.; Potapov, V.V.; Kushnarenko, O.N.; Plotnikov, A.E.; Sinitsky, A.I. The Bermuda Triangle of the Yamal Peninsula. Nauka Perv. Ruk 2014, 5, 14–23. (In Russian) [Google Scholar]
  5. Olenchenko, V.V.; Sinitsky, A.I.; Antonov, E.Y.; Eltsov, I.N.; Kushnarenko, O.N.; Plotnikov, A.E.; Potapov, V.V.; Epov, M.I. Results of geophysical researches of the area of new geological formation “Yamal crater”. Kriosf. Zemli 2015, XIX4, 94–106. [Google Scholar]
  6. Sizov, O.S. Remote sensing data analysis of the consequences of gas releases in the north of Western Siberia. Geomatica 2015, 1, 53–68. (In Russian) [Google Scholar]
  7. Bogoyavlenskiy, V.I.; Sizov, O.S.; Bogoyavlenskiy, I.V.; Nikonov, R.A. Remote detection of surface gas releases in the Arctic: The Yamal Peninsula. Arct. Ecol. Econ. 2016, 3, 4–15. (In Russian) [Google Scholar]
  8. Kizyakov, A.I.; Sonyushkin, A.V.; Leibman, M.O.; Zimin, M.V.; Khomutov, A.V. Geomorphological conditions of the gas-emission crater and its dynamics in Central Yamal. Kriosf. Zemli 2015, 2, 13–22. [Google Scholar]
  9. Streletskaya, I.D.; Leibman, M.O.; Kizyakov, A.I.; Oblogov, G.E.; Vasiliev, A.A.; Khomutov, A.V.; Dvornikov, Y.A. Ground Ice and its Role in the Formation of Gas-Emission Crater in the Yamal Peninsula. Mosc. Univ. Bull. Ser. 5 Geogr. 2017, 2, 91–99. (In Russian) [Google Scholar]
  10. Leibman, M.O.; Dvornikov, Y.A.; Khomutov, A.V.; Babkin, E.M.; Babkina, E.A.; Vanshtein, B.G.; Kizyakov, A.I.; Oblogov, G.E.; Semenov, P.B.; Streletskaya, I.D. Hydro-chemical features of water in lakes and gas-emission craters embedded in the marine deposits of West-Siberian north. In Geology of Seas and Oceans, Proceedings of the XXII International Conference on Marine Geology, Russia, Moscow, 20–24 November 2017; Lisitzin, A.P., Politova, N.V., Shevchenko, V.P., Eds.; IO RAS: Moscow, Russia, 2017; Volume IV, pp. 117–121. (In Russian) [Google Scholar]
  11. Kizyakov, A.I.; Sonyushkin, A.V.; Khomutov, A.V.; Dvornikov, Y.A.; Leibman, M.O. Assessment of the relief-forming effect of the Antipayuta gas emission crater formation using satellite stereo pairs. Curr. Probl. Remote Sens. Earth Space 2017, 4, 67–75. [Google Scholar] [CrossRef]
  12. Kizyakov, A.; Zimin, M.; Sonyushkin, A.; Dvornikov, Y.; Khomutov, A.; Leibman, M. Comparison of Gas Emission Crater Geomorphodynamics on Yamal and Gydan Peninsulas (Russia), Based on Repeat Very-High-Resolution Stereopairs. Remote Sens. 2017, 9, 1023. [Google Scholar] [CrossRef]
  13. TV and Radio Company Yamal-Region. Available online: http://yamal-region.tv/news/26092/ (accessed on 4 April 2018).
  14. Dubikov, G.I. Composition and Cryogenic Structure of the Western Siberia Permafrost; GEOS: Moscow, Russia, 2002; p. 246. (In Russian) [Google Scholar]
  15. Badu, Y.B.; Trofimov, V.T.; Vasilchuk, Y.K. The main patterns of distribution and types of tabular ground ice in the northern part of the West Siberian Plate. In Tabular Ground Ice in Cryolithozone; Popov, A.I., Ed.; Permafrost Institute: Yakutsk, Russia, 1982; pp. 13–24. (In Russian) [Google Scholar]
  16. Streletskaya, I.D.; Leibman, M.O. Cryogeochemical interrelation of massive ground ice, cryopegs, and enclosing deposits of Central Yamal. Kriosf. Zemli 2002, 4, 15–24. (In Russian) [Google Scholar]
  17. Vasilchuk, Y.K. Tabular ground ice. In Cryosphere of Oil and Gas Condensate Fields of the Yamal Peninsula; Badu, Y.B., Gafarov, E.A., Podborny, E.E., Eds.; Cryosphere of the Bovanenkovskoye Oil and Gas Condensate Field; Gazprom Expo: Moscow, Russia, 2013; Volume 2, pp. 284–317. (In Russian) [Google Scholar]
  18. Ananyeva, G.V. Specific features of the engineering-geocryological conditions of the northern section of the Obskaya-Bevanenkovo railway under design. In Results of Fundamental Research of the Earth Cryosphere in Arctic and Subarctic; Nauka: Novosibirsk, Russia, 1997; pp. 116–123. (In Russian) [Google Scholar]
  19. Vasiliev, A.A.; Streletskaya, I.D.; Melnikov, V.P.; Oblogov, G.E. Methane in Ground Ice and Frozen Quaternary Deposits of Western Yamal. Dokl. Earth Sci. 2015, 465, 1289–1292. [Google Scholar] [CrossRef]
  20. Kraev, G.; Schulze, E.-D.; Yurova, A.; Kholodov, A.; Chuvilin, E.; Rivkina, E. Cryogenic Displacement and Accumulation of Biogenic Methane in Frozen Soils. Atmosphere 2017, 8, 105. [Google Scholar] [CrossRef]
  21. Yakushev, V.S. Natural Gas and Gas Hydrates in Cryolithozone; VNIIGAS: Moscow, Russia, 2009; p. 192. (In Russian) [Google Scholar]
  22. Bogoyavlenskiy, V.I.; Bogoyavlenskiy, I.V.; Nikonov, R.A. Results of aerial, space and field investigations of large gas blowouts near Bovanenkovo field on Yamal Peninsula. Arct. Ecol. Econ. 2017, 3, 4–17. [Google Scholar] [CrossRef]
  23. Project “Geoportal of the Lomonosov Moscow State University”. Available online: http://www.geogr.msu.ru/science/projects/geoportal/about/ (accessed on 15 January 2018).
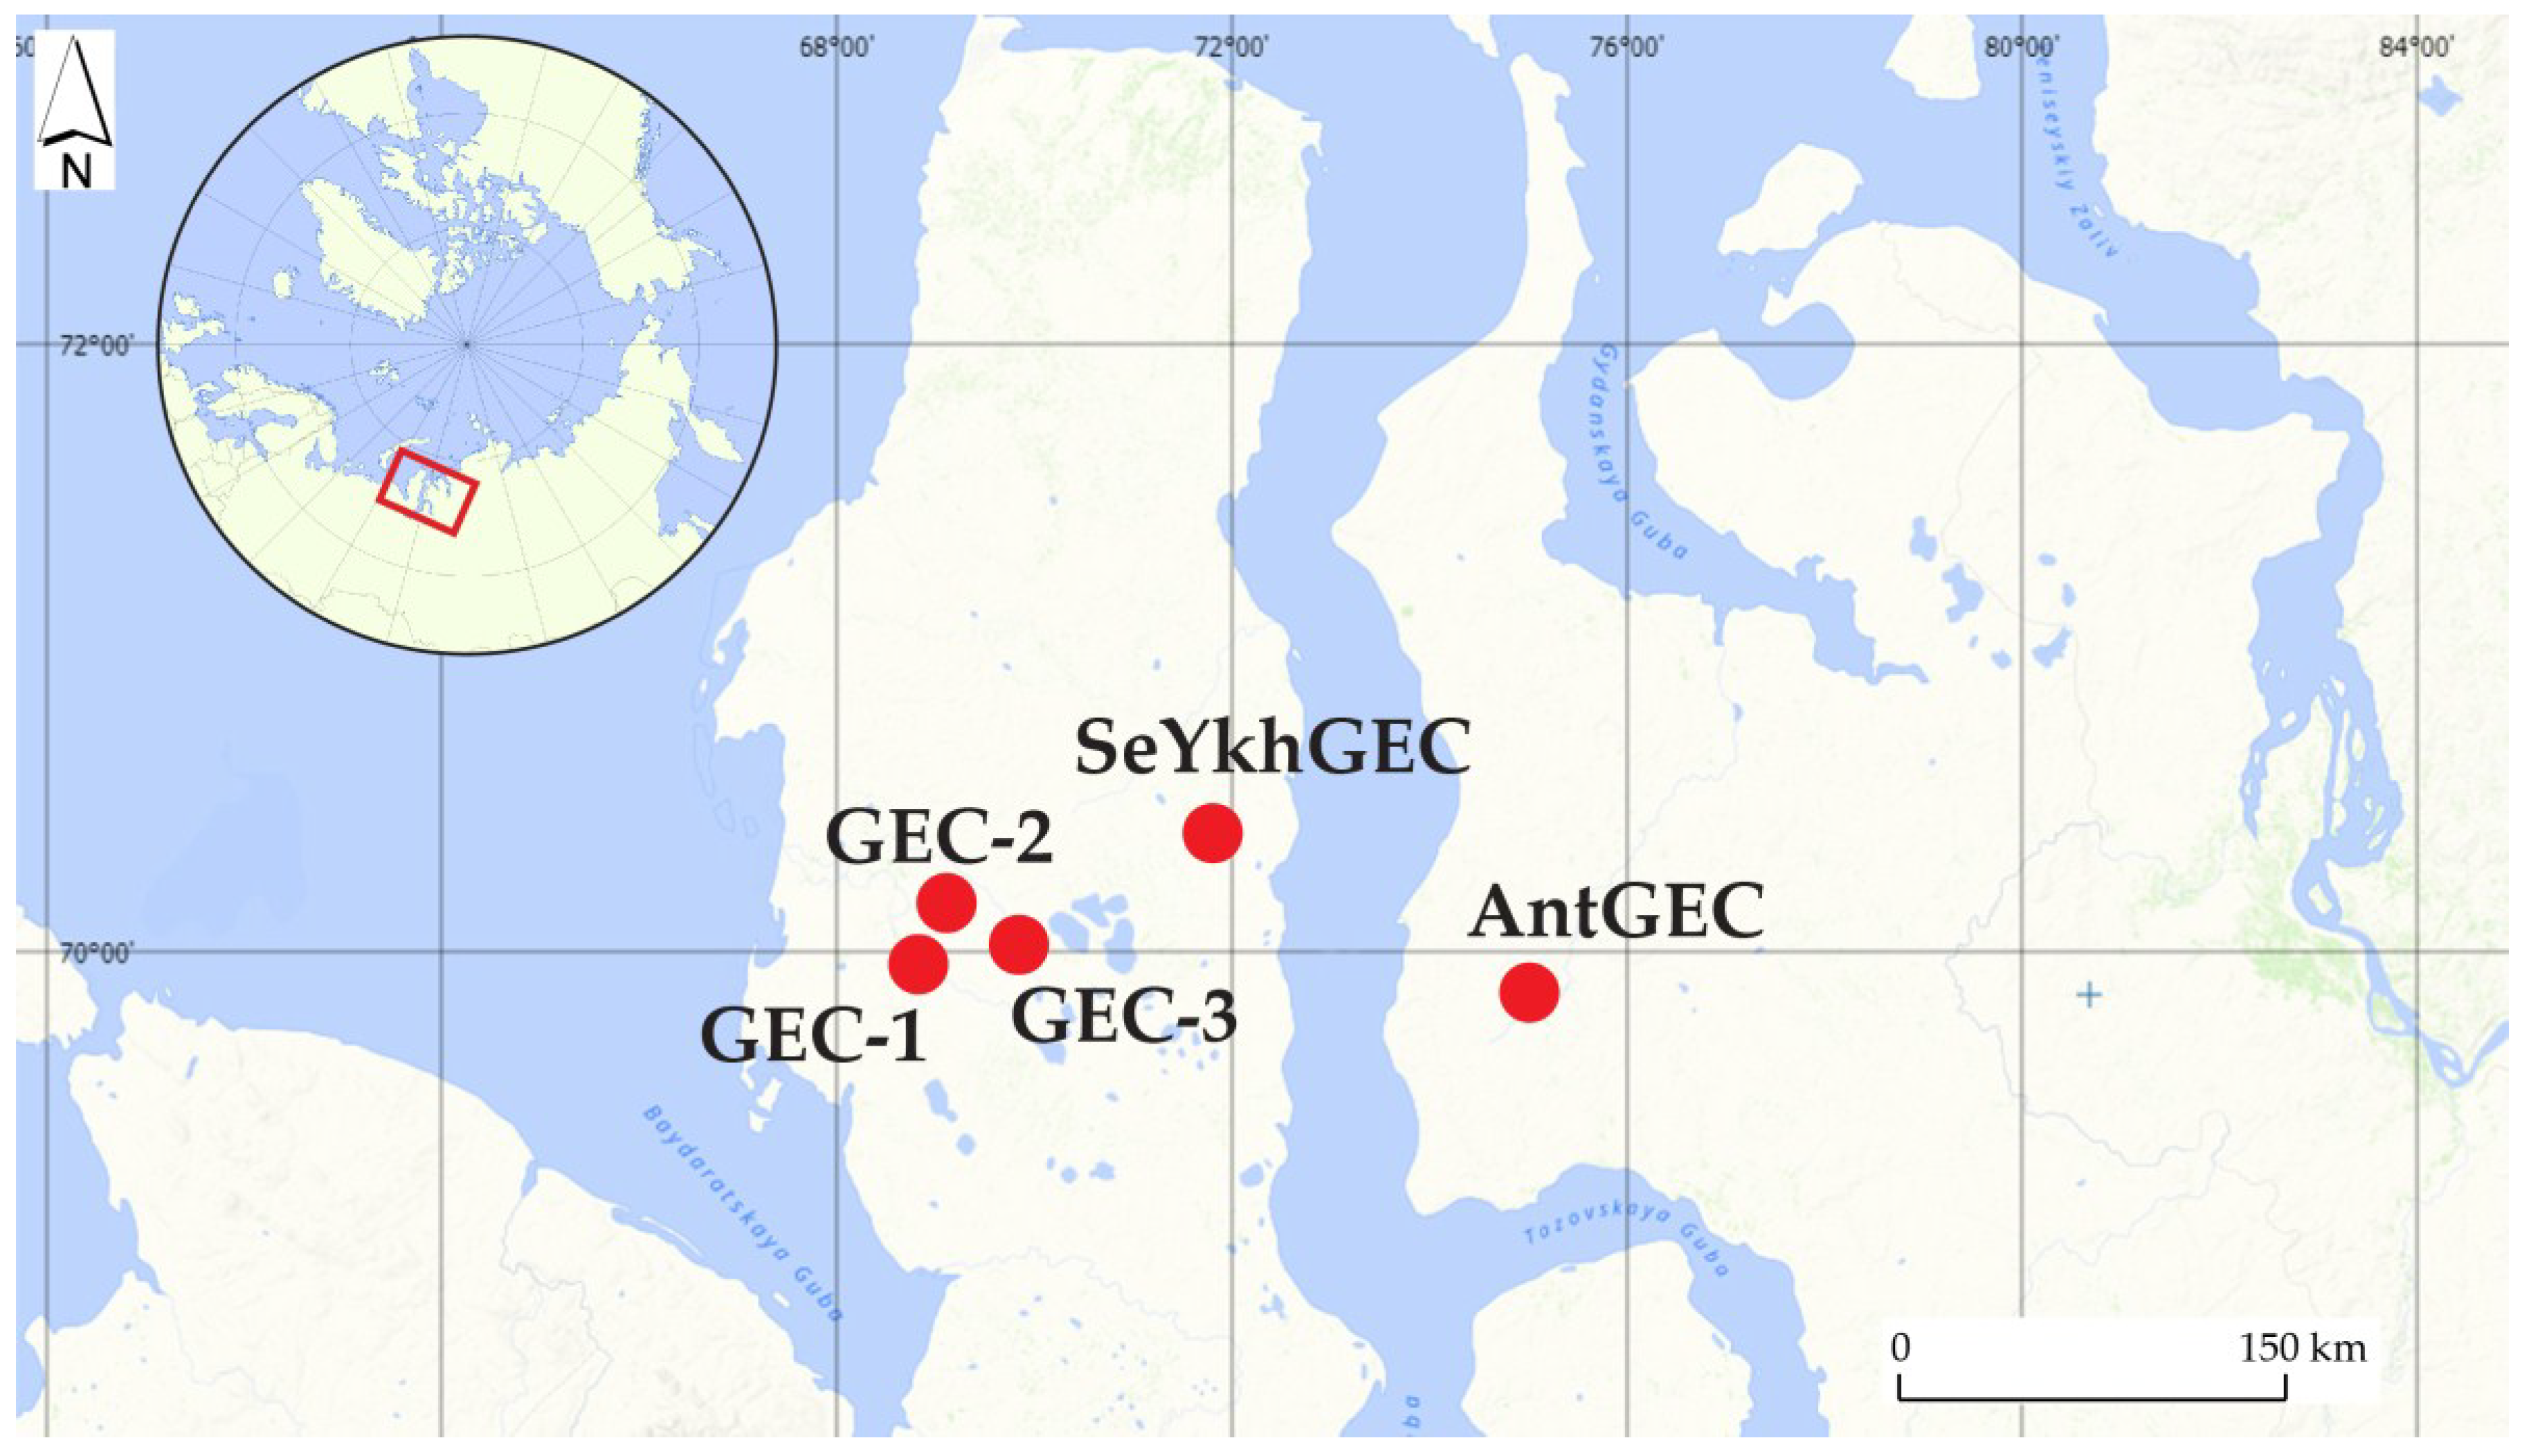
Figure 1. Location of gas-emission craters (GECs), at which field observations were undertaken.
Remotesensing 10 00677 g001
Figure 2. The time range of GEC-2 formation determined using SPOT5 data time series. Outlined is the area where changes in place of the mound-predecessor were observed. GEC-2 appeared between 24th September and 15th October 2012.
Remotesensing 10 00677 g002
Figure 3. Remains of the ejected deposits at GEC-2, which formed piles: (a) pile 2–2.5 m in diameter and relative height of 0.6 m, located between impact hollows 9 and 10 (Figure 7 and Figure 8), 53 m to the NE of the apex of the mound-predecessor (AMP); (b) a pile 0.4 m in diameter, and a relative height of 0.15 m, barely protruding above the surface, located 83 m NW of the AMP (photograph by E. A. Babkina, September 2017).
Remotesensing 10 00677 g003
Figure 4. Hollows filled with water and surrounded by a ridge at GEC-2: (a) 10 m in diameter, 53 m to NE of the AMP (9 in Figure 7 and Figure 8); (b) 1.5 m in diameter, 95 m to the NW of the AMP (photograph by E. A. Babkina, September 2017).
Remotesensing 10 00677 g004
Figure 5. Morphological and morphometric characteristics of impact water-filled hollows at GEC-2: (a) boundaries of impact hollows 13 and 10, and hypsometric profiles plotted on the orthophotomap of 2017. Legend: 1, impact hollows; 2, areas with numerous piles; 3, position of hypsometric profiles; (b) hypsometric profile across impact hollow 13 plotted on digital elevation model (DEM) of 2017; (c) hollow 13 drained by 2015 (photograph by A. I. Kizyakov, September 2015); (d) overgrowth of the bottom of hollow 13 by pioneer vegetation in 2017 (photograph by E. A. Babkina, September 2017).
Remotesensing 10 00677 g005
Figure 6. Morphological and morphometric characteristics of the impact hollow 10 at GEC-2. The location of the hollow and hypsometric profile are shown on Figure 10a: (a) hypsometric profile of the impact hollow 10 plotted on DEM 2017, dotted line refers to the reconstructed (before the start of erosion) bottom of the hollow; (b,c) hollow 10 drained by 2015 (photograph A. I. Kizyakov, September 2015).
Remotesensing 10 00677 g006
Figure 7. Location of impact hollows and accumulative piles around GEC-2. Allocated objects are marked on imagery characterizing the state of the surface of the key site: (a) before the formation of GEC-2 with a mound-predecessor on WorldView-2 image of 11 September 2011, synthesis of NIR + Red + Green; (b) with the existing GEC-2 on WorldView-2 of 21 July 2013, synthesis of NIR + Red + Green. Legend: 1, impact hollows; 2, agglomeration of ejected material or single piles; 3 and 4, scattering zones outlined on the basis of both field data and remote sensing data (RSD): 3, zone B; 4, zone A; 5, the apex of the mound-predecessor of GEC-2. Numbers indicate the impact hollows allocated on imagery and reliably correlated with the blocks of icy deposits in the photograph from the helicopter (Figure 4) with exception of those destroyed due to the retreat of the crater walls and subsequent flooding by the expanding crater lake.
Remotesensing 10 00677 g007
Figure 8. Photographs (a,b) from the helicopter on 14 November 2012, characterizing the location of blocks of ice and frozen deposits ejected from GEC-2. Numbers indicate impact hollows and blocks of icy deposits reliably correlated with these blocks on imagery.
Remotesensing 10 00677 g008
Figure 9. Impact hollow, located 217 m south of the GEC-2 AMP: (a) an oblique photograph from the UAV on 07 September 2017; (b) no impact hollow before the formation of GEC-2 on WorldView-2 image of 11 September 2011, synthesis of NIR + Red + Green; (c) an impact hollow, which appeared on WorldView-2 image of 21 July 2013, synthesis of NIR + Red + Green.
Remotesensing 10 00677 g009
Figure 10. Impact hollows 17, 18 and 19, located 85–100 m south of the GEC-2 AMP: (a) an oblique photograph from the UAV of 07 September 2017; (b) no impact hollow before the formation of GEC-2 on WorldView-2 image of 11 September 2011, synthesis of NIR + Red + Green; (c) impact hollows, which appeared on WorldView-2 of 21 July 2013, synthesis of NIR + Red + Green. Numbers indicate impact hollows in accordance with Figure 7 and Figure 8.
Remotesensing 10 00677 g010
Figure 11. Distribution of impact hollows around GEC-2: (a) position of impact hollows around AMP; diameter of the red circle is proportional to the area of the hollow; the line connecting the farthest points outlines the impactor scattering zone—zone A; (b) distribution of the number of impact hollows in relation to the distance from the AMP.
Remotesensing 10 00677 g011
Figure 12. Accumulative piles in the vicinity of AntGEC: (a) fragments of a partially washed away large accumulative form immediately adjacent to the crater rim; (b) a washed out residue of an ejected sand block with a diameter of 1 m to 1.2 m in a gully bottom (both photographs by A. V. Khomutov, August 2016).
Remotesensing 10 00677 g012
Figure 13. Impact hollows in the vicinity of AntGEC: (a) impact hollow with a diameter of 2.5 m on the slope of the gully directly opposite AntGEC, 34 m to SW of the AMP. Below the impact hollow are fragments of deposits, either ejected from AntGEC, or extruded out of the slope forced by the impactor (photograph by M. O. Leibman, August 2016); (b) two impact hollows 0.5–0.8 m in diameter filled with water, in the foreground a block of sod, either squashed out of the surface by the impactor, or ejected from AntGEC (photograph by A. V. Khomutov, August 2016); (c) the largest (diameter four meters) impact hollow filled with water in the bottom of the gully, 55 m to the NNW of the AMP (photograph by A. V. Khomutov, August 2016).
Remotesensing 10 00677 g013
Figure 14. Location of the impact hollows and accumulative piles in the vicinity of AntGEC allocated in the satellite image of WorldView-1 as of 11 October 2014, and during the field work of 2016. Legend: 1, impact hollows; 2, agglomeration of ejected material or single piles; 3, 4, zones, allocated on the basis of both field data and RSD, 3, zone B; 4, zone A; 5, position of the AntGEC AMP.
Remotesensing 10 00677 g014
Figure 15. Distribution of impact hollows around AntGEC: (a) position of impact hollows around AMP; the diameter of the red circle is proportional to the area of the hollow; the line connecting the farthest points outlines the impactor scattering zone—zone A; (b) distribution of the number of impact hollows in relation to the distance from the AMP.
Remotesensing 10 00677 g015
Figure 16. SeYkhGEC two days after formation: (a,d), impact hollows in the vicinity of SeYkhGEC; (b,c), ice blocks. Freeze frame from UAV video dated 02 July 2017, provided by A. V. Baryshnikov, “Russian Center for Arctic Development” are shown on (a,b); photograph by D. Ehrich, 02 July 2017 in (c,d).
Remotesensing 10 00677 g016
Table 1. Coordinates (WGS84) of gas emission craters presented in the paper.
Gas Emission CraterLatitude (N)Longitude (E)
GEC-169.971168.3702
GEC-270.144668.4959
GEC-370.062469.1002
SeYkhGEC70.302171.7458
AntGEC69.794775.035
Table 2. The list of used remote sensing data.
SensorDatePan Ground Sample Distance, mKey-Site
WorldView-2 111 September 20110.5GEC-2
WorldView-2 121 July 20130.5
SPOT5 207 August 20122.5
SPOT5 221 August 20125.0
SPOT5 224 September 20125.5
SPOT5 215 October 20125.3
SPOT5 222 October 20125.0
UAV07 September 20170.04
WorldView-221 August 20130.5AntGEC
WorldView-111 October 20140.6
1 images were provided by Total company; 2 images were obtained within the framework of the project “Geoportal of the Lomonosov Moscow State University” [23]. UAV: Unmanned aerial vehicle.
Table 3. Appearance of landforms associated with the formation of GEC-2 in the photographs as of 14 November 2012.
Description of MicroreliefExamples in the Photographs
Hollows without observed impactors, empty, later filled with water Remotesensing 10 00677 i001 Remotesensing 10 00677 i002
Hollow 1 in Figure 7 and Figure 8Hollow 5 in Figure 7 and Figure 8
Hollows with observed impactors, later filled with water Remotesensing 10 00677 i003 Remotesensing 10 00677 i004
Hollow 3 in Figure 7 and Figure 8Hollow 14 in Figure 7 and Figure 8
Remotesensing 10 00677 i005
Hollow 10 in Figure 7 and Figure 8
Blocks (impactors), later appeared as hollows filled with water Remotesensing 10 00677 i006 Remotesensing 10 00677 i007
Hollow 8 in Figure 7 and Figure 8Hollow 9 in Figure 7 and Figure 8
A ridge of ejected material along the SE side of GEC-2, the shadow of which is clearly visible in the photograph Remotesensing 10 00677 i008
Bank outlined by a white dashed line in Figure 8
Table 4. Different parameters of impact hollows and scattering zones around GEC-2 and AntGEC.
Parameters of Material ScatteringGEC-2AntGEC
max distance of impact hollows relative to the AMP, m293104
min distance of impact hollows relative to the AMP, m28.633.3
max impact hollow area, m2143.426.5
min impact hollow area, m20.040.04
zone A area, m2620803350
zone B area, m2502507170

