Article

Evaluation and Hydrologic Validation of Three Satellite-Based Precipitation Products in the Upper Catchment of the Red River Basin, China

1
Yunnan Key Laboratory of International Rivers and Transboundary Eco-Security, Yunnan University, Kunming 650091, China
2
School of Geography and Planning, Sun Yat-sen University, Guangzhou 510275, China
*
Author to whom correspondence should be addressed.
Remote Sens. 2018, 10(12), 1881; https://doi.org/10.3390/rs10121881
Submission received: 15 October 2018 / Revised: 16 November 2018 / Accepted: 21 November 2018 / Published: 24 November 2018
(This article belongs to the Special Issue Remote Sensing of Precipitation)

Abstract

:
Satellite-based precipitation products (SPPs) provide alternative precipitation estimates that are especially useful for sparsely gauged and ungauged basins. However, high climate variability and extreme topography pose a challenge. In such regions, rigorous validation is necessary when using SPPs for hydrological applications. We evaluated the accuracy of three recent SPPs over the upper catchment of the Red River Basin, which is a mountain gorge region of southwest China that experiences a subtropical monsoon climate. The SPPs included the Tropical Rainfall Measuring Mission (TRMM) 3B42 V7 product, the Climate Prediction Center (CPC) Morphing Algorithm (CMORPH), the Bias-corrected product (CMORPH_CRT), and the Precipitation Estimation from Remotely Sensed Information using Artificial Neural Networks (PERSIANN) Climate Data Record (PERSIANN_CDR) products. SPPs were compared with gauge rainfall from 1998 to 2010 at multiple temporal (daily, monthly) and spatial scales (grid, basin). The TRMM 3B42 product showed the best consistency with gauge observations, followed by CMORPH_CRT, and then PERSIANN_CDR. All three SPPs performed poorly when detecting the frequency of non-rain and light rain events (<1 mm); furthermore, they tended to overestimate moderate rainfall (1–25 mm) and underestimate heavy and hard rainfall (>25 mm). GR (Génie Rural) hydrological models were used to evaluate the utility of the three SPPs for daily and monthly streamflow simulation. Under Scenario I (gauge-calibrated parameters), CMORPH_CRT presented the best consistency with observed daily (Nash–Sutcliffe efficiency coefficient, or NSE = 0.73) and monthly (NSE = 0.82) streamflow. Under Scenario II (individual-calibrated parameters), SPP-driven simulations yielded satisfactory performances (NSE >0.63 for daily, NSE >0.79 for monthly); among them, TRMM 3B42 and CMORPH_CRT performed better than PERSIANN_CDR. SPP-forced simulations underestimated high flow (18.1–28.0%) and overestimated low flow (18.9–49.4%). TRMM 3B42 and CMORPH_CRT show potential for use in hydrological applications over poorly gauged and inaccessible transboundary river basins of Southwest China, particularly for monthly time intervals suitable for water resource management.

1. Introduction

Precipitation is one of the most important water balance components of the global water cycle, and has great variability across different spatial and temporal scales [1,2]. The accurate observation or estimation of precipitation has important theoretical and practical significance for flood warnings, drought monitoring, and water resource management [3,4]. Gauge observations provide relatively accurate point-based measurements of precipitation [5]; however, owing to significant precipitation heterogeneity across a variety of spatiotemporal scales, rain gauge observations only represent local conditions, and can result in potential errors when interpolated to larger scales, especially in mountainous areas with complex terrain [6]. Moreover, the spatial distribution of rain gauges is extremely uneven, with sparse gauges in remote areas, less developed regions, or areas with complex terrain [7]. Therefore, in situ gauge data usually cannot meet the requirements of applications that depend on high spatial–temporal resolution precipitation data (e.g., hydrological simulations [5]).
Satellite-based precipitation estimates have the advantage of adequate temporal resolution and fine spatial resolution with wide coverage, enabling accurate precipitation estimates in data-scarce or ungauged regions [5,8,9,10]. A number of satellite-based precipitation products (SPPs) are currently available, including the Global Precipitation Climatology Project (GPCP) [11], the Precipitation Estimation from Remotely Sensed Information using Artificial Neural Networks (PERSIANN) [12], the Climate Prediction Center (CPC) morphing algorithm (CMORPH) [13], the Tropical Rainfall Measuring Mission (TRMM) Multi-satellites Precipitation Analysis (TMPA) [14], the Global Precipitation Measurement (GPM) [3], and the global gridded precipitation dataset Multi-Source Weighted-Ensemble Precipitation (MSWEP) [15]. With wide coverage and high spatial–temporal resolution (mostly finer than 0.25° × 0.25°at spatial and three-hour temporal scales), SPPs have been extensively applied in many fields, including hydrological simulation [16,17,18], extreme event analysis [19,20,21], and water resource management [22,23].
Since SPPs are based on an indirect approach that utilizes sensors, the results inevitably contain uncertainties caused by measurement errors, sampling, retrieval algorithms, and bias correction processes [17,24,25]. Furthermore, the error characteristics change depending on the climate region, season, altitude, and other factors [10,26]. In general, quantitative statistical and hydrological modelling evaluations are effective tools that are used to evaluate the precision of SPPs [4,17]. The former focuses on the comparison and evaluation of SPPs against gauge data or ground-based radar estimates. By this principle, temporal characteristics and spatial distributions of SPPs are not only investigated, but can also be quantitatively analyzed; however, the scale discrepancy problem remains when using rain gauge data for validation. The latter evaluates SPPs based on their predictive ability of streamflow rate in a hydrological modeling framework; precipitation products are evaluated at the watershed scale with respect to a specific application [27].
Over the past decades, numerous studies have improved our understanding of SPP performance at global and regional scales [8,28,29,30,31]. For example, TMPA products were validated in various parts of the world [32,33,34,35,36], and those results showed that TMPA products perform reasonably well over most regions. Following the successful TMPA, the Integrated Multisatellite Retrievals for GPM (IMERG), which incorporates observations from several satellites, offers improvements over the TMPA in quality and spatiotemporal resolution of precipitation data [3]. A range of studies comparing the TMPA and GPM products for the United States [37], Brazil [38], Africa [39], Iran [40], India [41], Pakistan [42], Malaysia [43], Singapore [44], and China [45] indicated that GPM is superior to TMPA products. In China, evaluation and validation using hydrologic simulations have been explored over many basins, including the Ganzi River basin [46], the upper Yangtze River and upper Yellow River basins over the Tibetan Plateau [47], the Huaihe River basin of eastern China [18], the Beijiang and Dongjiang River basins of southern China [5], the Luanhe River basin of northern China [4], the Tiaoxi watershed, which is part of the southern catchment of Taihu Lake in southeastern China [48], the Lancang River basin of southwest China [49], and the Huifa River basin of northeast China [50]. These studies all highlighted the great potential of different SPPs in hydrologic simulations, although SPPs have variable accuracy and distinct hydrological performance in different basins.
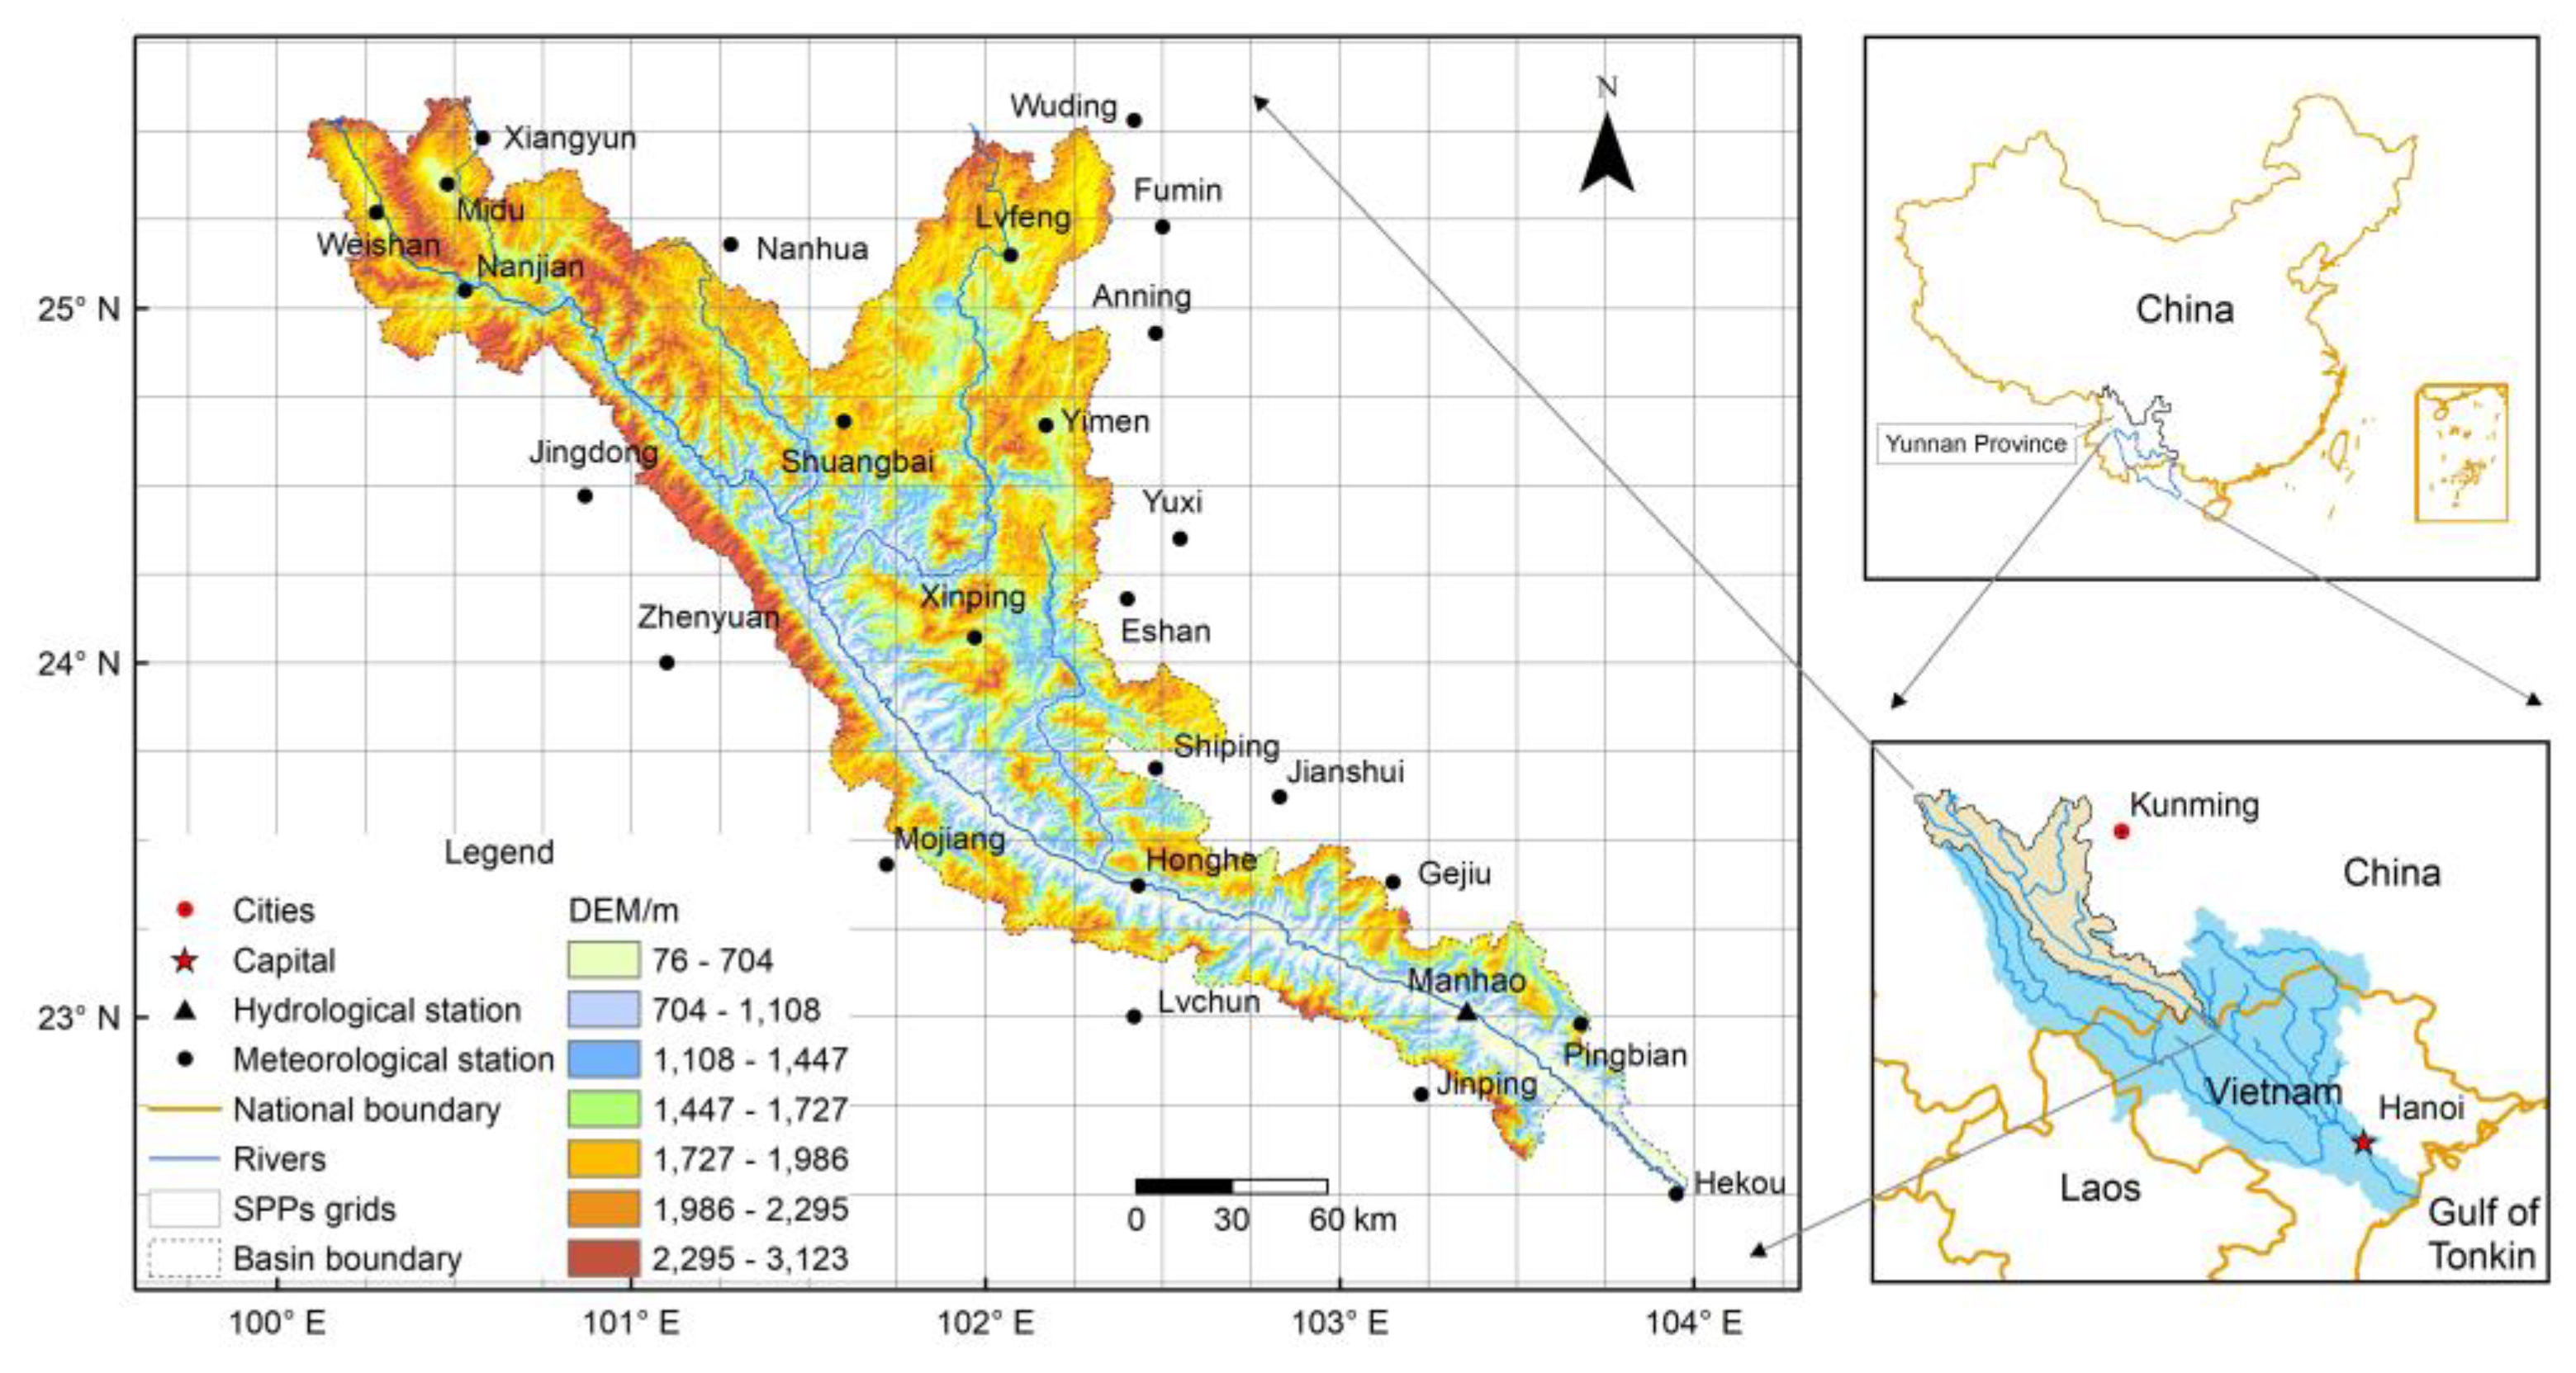
The Red River is an important transboundary river in Southeast Asia. Precipitation distribution is significantly uneven across the basin due to the complex terrain and subtropical monsoon climate [51]. About 85% of the annual total precipitation falls during the summer season [52]. Consequently, the Red River has an irregular flow regime. The high variability of river discharge in space and time leads to substantial challenges related to flooding and water stress, particularly in the Red River delta, which is a densely populated area of great importance to Vietnam for its agricultural productivity and economic activity [35]. The upstream region in China has a mean annual flow of 48.3 billion m3, which contributes 37% of total flow of the Red River (131.4 billion m3) [53]. The transboundary water resource is virtual for agriculture irrigation, hydropower, and ecosystem services. However, the rain gauge network has a low density (around 300 km2 per rain gauge in Yunnan province, China), spatially uneven distribution, and is insufficient over mountainous areas. The scarcity and mismatch of the precipitation observations from upstream and downstream countries make it imperative to use SPPs in hydrological modeling, drought monitoring, and water resources management. Unfortunately, there is little work focusing on the evaluation of SPPs and their hydrological applicability over the Red River Basin in China.
This study aimed to assess the performance of three latest SPPs over the upper catchment of the Red River Basin for the time period 1998–2010. The SPPs included TRMM 3B42 V7, CMORPH_CRT (CMORPH Bias-corrected product), and PERSIANN_CDR (PERSIANN Climate Data Record). The main objectives were to: (1) statistically evaluate the quality of the three SPPs through comparison with rain gauge observations; and (2) comprehensively explore and compare the capability of these three SPPs in streamflow simulations using GR (Génie Rural) hydrological models at daily and monthly scales. This study will improve our understanding of the reliability of the three latest SPPs, and provide a reference for their applications in hydrological simulation and transboundary water resource management in the Red River Basin.

2. Materials and Methods

2.1. Study Area

The Red River originates in a mountainous area of Yunnan Province, China; it flows 1200 km to the southeast, and ends in the Gulf of Tonkin, in the South China Sea [54,55]. The Red River Basin drains an area of 156,451 km2, of which 50.3% is in Vietnam, 48.8% is in China, and 0.9% is in Laos [52].The upper catchment of the Red River Basin (URRB) refers to the catchment north of the China–Vietnam border (Figure 1). The catchment covers an approximate area of 33,614 km2. The elevation of the catchment ranges from 76 m to 3123 m above sea level, and decreases from the northwest to the southeast [51]. It is characterized by a subtropical monsoon climate [52], with annual average temperatures of 14.8–23.8°C. The annual average precipitation over the URRB from 1998 to 2010 was about 1044 mm, ranging from 772 mm to 1276 mm; approximately 85% of the annual precipitation is concentrated in the rainy season (May to October) [52]. The climate confers the typical hydrologic regime characterized by large runoff during the summer and low runoff during the winter [56]. The annual average discharge at Manhao Station for the period 1998–2010 was 282 m3/s.

2.2. Datasets

Daily observed discharge data for the period 1998–2010 at the Manhao hydrological station was obtained from the Hydrological Year Book and the Hydrological Bureau of Yunnan Province (HBYP). Daily precipitation data from 25 rain gauges were provided by the Meteorological Agency of Yunnan Province (MAYP) (Figure 1). It is noteworthy that these rain gauges are independent from the Global Precipitation Climatology Centre (GPCC) gridded gauge-analysis precipitation dataset. Daily meteorological observations at 21 stations for the same period were collected from the China Meteorological Administration (CMA), including mean air temperature, mean relative humidity, mean wind speed at 10-m height, and hours of bright sunshine. The quality of the above datasets has been checked by the HBYP, MAYP, and CMA. We also performed routine quality assessment including statistical tests, visual data plots, and histograms, to ensure that there were no missing or erroneous records. The descriptive statistics of precipitation and discharge during 1998–2010 are provided in the supplementary material (Table S1 and Table S2). The daily potential evapotranspiration for each station was estimated using the Penman–Monteith equation, as recommended by the Food and Agriculture Organization of the United Nations (FAO) [57]. The FAO Penman–Monteith method is provided in the supplementary material (S1). Areal average rainfall and potential evapotranspiration over the catchment were produced by using the Thiessen polygon approach [58].
Three SPPs (TRMM 3B42 V7, CMORPH_CRT, and PERSIANN_CDR) were considered. The TRMM 3B42 V7 product is one of the TMPA products, which were designed based on a wide variety of satellite datasets and are supplied by the National Aeronautics and Space Administration (NASA) [14]. This product provides precipitation at a spatial resolution of 0.25° and a three-hour temporal resolution; it has quasi-global coverage of 50°N–50°S from 1998 to the present, combining information from calibrated passive microwave (PMW) and infrared (IR) data. The 3B42 V7 product was adjusted using monthly rain gauge precipitation data from the GPCC [59]. Here, the 3B42 V7 with a daily temporal resolution and a 0.25° spatial resolution from 1998 to 2010 was employed. Daily precipitation was obtained by the accumulation of three-hour precipitation data.
NOAA’s (National Oceanic and Atmospheric Administration) CPC CMORPH contains global satellite-based precipitation generated by integrated PMW and IR data [13]. The latest CMORPH V1.0 product includes a raw satellite-only precipitation product (CMORPH_RAW), CMORPH_CRT, and a satellite-gauge blended product (CMORPH_BLD), covering 60°S–60°N and 180°W–180°E. The CMORPH_CRT product is generated by adjusting the CMORPH_RAW product against the CPC unified daily gauge analysis over land, and the pentad GPCP over ocean using the probability density function (PDF) matching bias correction method [60]. Three combinations of spatial–temporal resolutions are available: eight km and 30 min, 0.25° and 3 h, and 0.25° and daily. Here, the CMORPH_CRT product with 0.25° and daily spatial–temporal resolution for the period 1998–2010 was used.
The original PERSIANN is one of the popular global precipitation estimations for estimating historical precipitation from March 2000 to present; it was developed by combining PMW observations and IR data. The latest PERSIANN_CDR product used the archive of the GridSat-B1 IR data [61] as input to the trained PERSIANN model; then, the biases in the PERSIANN estimated precipitation were adjusted using GPCP 2.5° monthly data version 2.2 [12,27]. Since no PMW is used in the PERSIANN_CDR product, the PERSIANN model parameters were pretrained using National Centers for Environmental Prediction (NCEP) stage-IV hourly precipitation data. Currently, this version of PERSIANN_CDR provides daily precipitation estimates at a spatial resolution of 0.25° for quasi-global coverage (60°N–60°S) from 1983 to the present. In this study, a subset of data for the period 1998–2010 was employed.

2.3. Methods

2.3.1. Evaluation Indices

Comparisons between the three SPPs and rain gauge data were performed both on grid and basin scales. For the grid scale, the SPPs precipitation at the grid boxes with rain gauge stations are extracted and compared with the corresponding rain gauge precipitation. For the basin scale, spatially averaged pixel values of the SPPs precipitation were compared with the areal-averaged precipitation from rain gauge stations using the Thiessen polygon approach [58].
Several widely used statistical indices were adopted to quantify the performance of the three SPPs against rain gauge observations, including Spearman’s Rank correlation coefficient (CC) [62], root mean squared error (RMSE), mean absolute error (MAE), and relative bias (Bias). In addition, the probability of detection (POD), frequency of hit (FOH), false alarm ratio (FAR), critical success index (CSI), and the Heidke skill score (HSS) indices were calculated to evaluate the precipitation detection ability of the three SPPs [63]. POD provides the fraction of precipitation events that the satellite products detect among all the actual precipitation events; FOH measures how often the satellite products detect rainfall when there is actually rainfall; FAR measures the fraction of unreal events among all the events that the satellite products detected; CSI represents the overall fraction of precipitation events correctly detected by the satellite products; and HSS measures the accuracy of the estimates accounting for matches due to random chance. Furthermore, CC, Bias, and the Nash–Sutcliffe efficiency coefficient (NSE) [64] were employed to evaluate the performance of the hydrological model in streamflow simulations. NSE describes the prediction skill of the simulated streamflow as compared to the observed. The formulas to calculate the indices mentioned above are listed in Table 1.

2.3.2. GR Hydrological Models

The GR hydrological models were developed by Irstea, which is a national applied research institute of France; they are lumped rain–runoff models that can be applied at various time steps, ranging from hourly to annual [65,66]. In this study, only the daily (GR4J) and monthly (GR2M) models were employed.
(1) GR4J model
The GR4J model was originally developed and tested on 429 different catchments in France, the United States of America (USA), Brazil, and the Côte d’Ivoire [67]. GR4J simulates runoff via two functions. First, a production function accounts for precipitation (P) and potential evapotranspiration (PET), and determines the effective precipitation that contributes to flow and supplies the production reservoir. Second, a routing function calculates runoff at the catchment outlet. The quantity of water feeding the routing part of the model comprises the percolation that is added to the remaining fraction of water. This flow is divided into two components according to a fixed split: 90% is routed by a unit hydrograph, UH1, and then a non-linear routing store, and the remaining 10% are routed by a single unit hydrograph, UH2. The purpose of the unit hydrographs is to account for differences in runoff delays between the two conceptual reservoirs. GR4J requires the calibration of four free parameters (Table 2). The median values and approximate 80% confidence intervals for the four parameters are provided in Table 2, which were obtained using a large variety of catchments [68].
(2) GR2M Model
The GR2M has two parameters and has been shown to have the best performance among several similar models when using a benchmark test consisting of 410 basins around the world [69,70]. The production function of the GR2M model has strong similarities with the daily version, but uses a simplified routing scheme [66]. This model is characterized by two functions: (1) a function of production that revolves around a reservoir ground of a maximum capacity (x1), which is the first parameter to be wedged (transferring a percolation of reservoir ground is ensured by the dependent feature of the stock status ‘S’), and (2) a transfer function represented by a quadratic draining reservoir with a capacity fixed at 60 mm. This reservoir is modified by an underground exchange, whose coefficient (x2) is the second parameter to optimize [71].
(3) Hydrological Simulation Scenarios
In this study, both models were warmed up for one year (1998), and then split into calibration (1999–2004) and validation (2005–2010) periods. Model calibration was achieved with the aid of the default algorithm provided in the airGR package developed at Irstea [66]. Two parameterization scenarios were conducted to evaluate the effect of precipitation uncertainty on runoff simulation results. In Scenario I, model parameters were first calibrated using gauged rainfall data in the calibration period, and then the model was rerun using gauged rainfall data and the three SPPs in both the calibration and validation periods. Scenario I was mainly used to evaluate the streamflow simulation utility of the different SPPs using gauge-calibrated parameters [72]. In Scenario II, model parameters were recalibrated with individual satellite rainfall data during the calibration period; then, streamflow was simulated for both the calibration and validation periods using the three individual satellite-based parameters. Scenario II was adopted to determine whether the evaluated SPPs have the potential to be alternative data sources for hydrological simulations in data-poor or ungauged basins [9,10]. Table 3 shows calibrated parameter values in the GR4J model for different precipitation data inputs.

3. Results

3.1. Comparison of Rain Gauge and Satellite-Based Precipitation Data

3.1.1. Evaluation at the Grid and Basin Scales

Figure 2 and Figure 3 present scatterplots of daily and monthly precipitation, respectively, from TRMM 3B42, CMORPH_CRT, and PERSIANN_CDR against rain gauge data at the grid scale. Intuitively, Figure 2 shows that the TRMM 3B42 product performed the best among the three SPPs for all metrics at the daily scale. Throughout the year, TRMM 3B42 had a much larger CC, but a smaller RMSE, MAE, and Bias than that of the other two products, with the CC = 0.62, RMSE = 7.7, MAE = 2.9, and Bias = 1.6%. Meanwhile, PERSIANN_CDR performed the worst, with the exception of the Bias (Bias = −5.4%), for which it was marginally better than that of CMORPH_CRT (Bias = −8.0%). The performances of the three products were also compared seasonally. According to the climate of the Red River Basin, May to October was considered to be the wet season, and November to April was considered to be the dry season [73]. For both the dry and wet seasons, TRMM 3B42 still showed a better performance than the other two products. All three SPPs achieved better estimations during the wet season than during the dry season.
On a monthly scale (Figure 3), the TRMM 3B42 product showed the best performance, regardless of season. Moreover, all three SPPs performed better for the wet season than for the dry season. In terms of Bias, TRMM 3B42, CMORPH_CRT, and PERSIANN_CDR products all showed underestimations during the dry season; such an underestimation in SPPs during the dry season has been reported in many studies [7,74,75]. In addition, the monthly results show much higher CC values with the observations than do the daily comparisons. This is because errors in the daily values are offset to some extent when added to the monthly values [4].
At the basin scale (Table 4), the daily and monthly CC values of the three SPPs improved, and the MAEs significantly decreased, respectively. Meanwhile, except for TRMM 3B42, the Bias values also showed a corresponding decreasing trend. From Table 4, the relative performances of the SPPs are similar to those at the grid scale. A distinct exception is that the TRMM 3B42 showed the largest overestimation in precipitation. Overall, all three SPPs had comparable and good performances for the monthly precipitation estimations.

3.1.2. Evaluation of Contingency

Figure 4 shows box plots of rainfall-detecting skill scores, including POD, FOH, FAR, CSI, and HSS, which were used to measure the contingency of the three SPPs. Among the three SPPs, TRMM 3B42 performed the best, having the highest FOH, CSI, and HSS values, and the lowest FAR value; PERSIANN_CDR performed the worst in terms of all five rainfall-detecting skill scores. These results illustrate that TRMM 3B42 yields the highest frequency of successful hits when rainfall really occurs, and the lowest erroneous detection rate when there is actually no rainfall. For the POD, TRMM 3B42 had a median value of 0.65, while that of CMORPH_CRT was 0.72; this implies that CMORPH_CRT is more likely to detect a larger fraction of precipitation events among all of the actual precipitation events. Note that the POD, FOH, FAR, CSI, and HSS of CMORPH_CRT tended to have slightly larger variations than they did for the other two products, indicating the considerable data instability of CMORPH_CRT. This instability can be partially attributed to the morphing processes in the CMORPH_RAW data, which determines the precipitation values as a weighted mean of PMW estimates from multiple sensors [74].

3.1.3. Evaluation of Rainfall Intensity Distribution

Figure 5 displays the occurrence frequency distribution of daily precipitation for different rain intensity classes and their relative contributions to the amount of total rainfall. Non-rainy days have the largest occurrence frequency, accounting for 58–67% of the total days. TRMM 3B42 identified significantly more non-rainy days (67%) than did the gauged data (63%); this is because the TRMM data have less skill in correctly specifying moderate and light rain rates on short time intervals [48,50,76] identified less non-rainy days (58%), but more light rain (0–1 mm) days. PERSIANN_CDR identified a similar number of no-rain events (64%) as the observation; however, it deviated the most for the light rain event. In addition, all three SPPs overestimated the moderate rain intensity class (1–25 mm) and underestimated heavy rainfall (25–50 mm) and hard rainfall events (>50 mm), with the exception of the TRMM 3B42 product, which slightly overestimated the heavy rainfall event.
For the distribution of relative contribution, PERSIANN_CDR showed the largest discrepancy, while the other two SPPs were very similar to the gauged data. It was found that although the frequency of light rainfall event was 4–15% of the total days, its contribution to the total rainfall amount was only 1.3% on average. On the contrary, although high rainfall occurred on only a small percentage of the total days, they had a significant contribution to the total rainfall amount. For example, the hard rainfall event had a frequency of just about 0.5%, but its contribution to the total rainfall amount was 10.7% on average. For the rain intensity of 10–25 mm, there was a similarly small percentage (6.5%) of total days for all four datasets, but this class contributed the most (35.2%) to the total rainfall amount. The different volume contribution performances greatly impacted the hydrologic simulations, since most of the hydrological processes within the models are sensitive to the total precipitation amount and rainfall intensity distribution [18,77].

3.2. Hydrologic Validation Using GR Models

3.2.1. Daily and Monthly Streamflow Simulations under Scenario I

Table 5 shows the model performance results simulated using different precipitation inputs with gauge-calibrated parameters under Scenario I. Generally, the streamflow simulated by rain gauge data agreed well with the observed hydrographs on both daily (NSE = 0.82, CC = 0.92, Bias = 0.6%) and monthly scales (NSE = 0.87, CC = 0.96, Bias = 1.8%). The GR4J and GR2M models were found to be robust and provided a sound basis for testing the applicability of the three SPPs.
On a daily scale (Table 5 and Figure 6), CMORPH_CRT showed the best performance for streamflow simulations over the entire period, with relatively desirable NSE (0.73) and CC (0.92), and a high but acceptable Bias of −7.5%; PERSIANN_CDR had the lowest NSE (0.53) and CC (0.88), and a Bias of −2.9%. The TRMM 3B42 had better NSE (0.62) and CC (0.93) than did PERSIANN_CDR; however, a significant overestimation (24.2%) was found for the TRMM forced simulation. It is possible that the Bias (9.6%) of the daily TRMM 3B42 precipitation was magnified by the hydrological model, causing this large overestimation [17]. Moreover, all the three SPP-based streamflow simulations underestimated some high peak flows (e.g., 2001 and 2007) of the rainy season. This phenomenon can mainly be attributed to the precipitation estimate uncertainty of SPPs at the daily scale during heavy and hard rainfall events [72].
Figure 7 illustrates flow duration curves (FDCs) for the four simulations on the daily scale from 1999 to 2010 under Scenario I. The rain gauge, CMORPH_CRT, and PERSIANN_CDR simulations were all consistent with the observations. However, the FDC produced by the TRMM 3B42 simulation was apparently higher than that of the observations, which is consistent with the large Bias (24.2%; Table 5).
The monthly streamflow simulations were generally found to be more accurate than the daily simulations in terms of NSE and CC values (Table 5 and Figure 8). Similar to the daily results, the CMORPH_CRT forced simulation had the best performance, with the highest NSE (0.82) and the lowest Bias (−0.9%). PERSIANN_CDR performed the second best (NSE = 0.76, Bias = 5.5%), while TRMM 3B42 performed the worst (NSE = 0.72, Bias = 24.2%) on the monthly scale. All the three SPPs’ forced simulations had good agreements with the observed data, with CC values above 0.94. As shown in Figure 8, the monthly streamflow hydrographs from the three SPPs reasonably well matched the observed streamflow, predicting peak flow and low flow conditions perfectly. These results indicated that all three SPPs are suitable for monthly streamflow simulation purposes in the study area. In general, considering the results for the daily and monthly scales, the CMORPH_CRT product is most suitable for streamflow simulations using gauge-calibrated parameters over the URRB.

3.2.2. Daily and Monthly Streamflow Simulations under Scenario II

Table 6 shows the model performance results for the three SPPs when using their own optimal parameters calibrated under Scenario II. The simulation results under Scenario II were clearly improved when compared with those under Scenario I, which is consistent with former studies [5,10,18,78]. For the daily scale (Table 6), the NSE values of streamflow simulated by the TRMM 3B42, CMORPH_CRT, and PERSIANN_CDR products increased to 0.76, 0.77, 0.63, and the CC kept its high values of 0.92, 0.92, and 0.88, respectively. Furthermore, the Bias values were also significantly reduced, except for the PERSIANN_CDR forced simulation. Even so, the underestimation problem for peak flow (e.g., 2001 and 2007) remained after the recalibration (Figure 9). Figure 10 shows the FDCs for the three SPP-driven simulations on a daily scale from 1999 to 2010 under Scenario II. The three individual simulations all agreed well with the FDC produced by observations.
For the monthly scale (Table 6 and Figure 11), the NSE values for the three SPP-forced simulations also increased (0.86 for TRMM 3B42, 0.83 for CMORPH_CRT, and 0.79 for PERSIANN_CDR). Furthermore, the high CC values (>0.94) also indicated the good agreements between the three simulations and the observed data. However, only the TRMM 3B42 forced simulation saw a significant reduction in terms of Bias (from 24.2% to 0.8%). Additionally, it was found that the TRMM 3B42 forced simulation had the greatest improvements in NSE and Bias values from Scenario I to Scenario II for both the daily and monthly scales. Overall, the three SPP forced daily and monthly simulations all exhibited good performance, matching well with observations in this study area. The better agreement was achieved using TRMM 3B42 and CMORPH_CRT products, making them more suitable for performing hydrologic simulations with inadequate surface precipitation observations (e.g., in ungauged catchments).

3.2.3. Capability of Simulating Extreme Events

To further investigate the capability of the three SPPs to simulate extreme events, we defined the observed daily streamflow, exceeding its 90% quantile as high flow, and that less than its 50% quantile as low flow [79]. The observed high-flow and low-flow data were compared with the corresponding simulated flow with various precipitation inputs. In this section, the three simulations under Scenario II, plus the rain gauge simulation under Scenario I, were evaluated. The model performance results of high-flow and low-flow simulations were presented in Table 7. For the high-flow simulations, the gauged-based simulation generally had the best performance with desirable NSE (0.50), CC (0.67), and Bias (−11.6%) values. TRMM 3B42 and CMORPH_CRT products exhibited comparable performance of similar NSE (0.31 and 0.36), CC (0.65 and 0.68), and Bias values (−19.1% and −18.1%), whereas PERSIANN_CDR performed poorly with the NSE <0 and the largest underestimation (28.0%). For the low-flow simulations, the model performances of the four precipitation inputs were unacceptable, with the NSE values all below 0, indicating their poor value for low-flow simulation in this region. Additionally, there was an underestimation of the four precipitation inputs for the high-flow simulations, and an overestimation for the low-flow simulations, which is consistent with many other studies [5,10,78]. This is largely due to the underestimation or overestimation of different precipitation products during extreme rainfall events. As discussed, all three SPPs have poor modeling capabilities for extreme hydrologic events over the URRB.

4. Discussion

SPPs have difficulty representing precipitation in mountainous regions, where precipitation is controlled by the orography and characterized by high spatiotemporal variability [8,80]. PMW data measured from low-orbit satellites and IR data from geostationary satellites are the main data sources for SPPs [17,81]. Specifically, PMW provides direct and accurate precipitation estimates at the cost of coarse temporal resolution, while IR provides useful information mainly about storm clouds based on the low temperatures of the top of these clouds: these data has fine temporal resolutions, but less accuracy [10,60]. In the mountainous regions, IR retrievals generally fail to capture light precipitation events and underestimate orographic rains, whereas PMW retrievals face challenges detecting orographic precipitation, especially in the cold season [
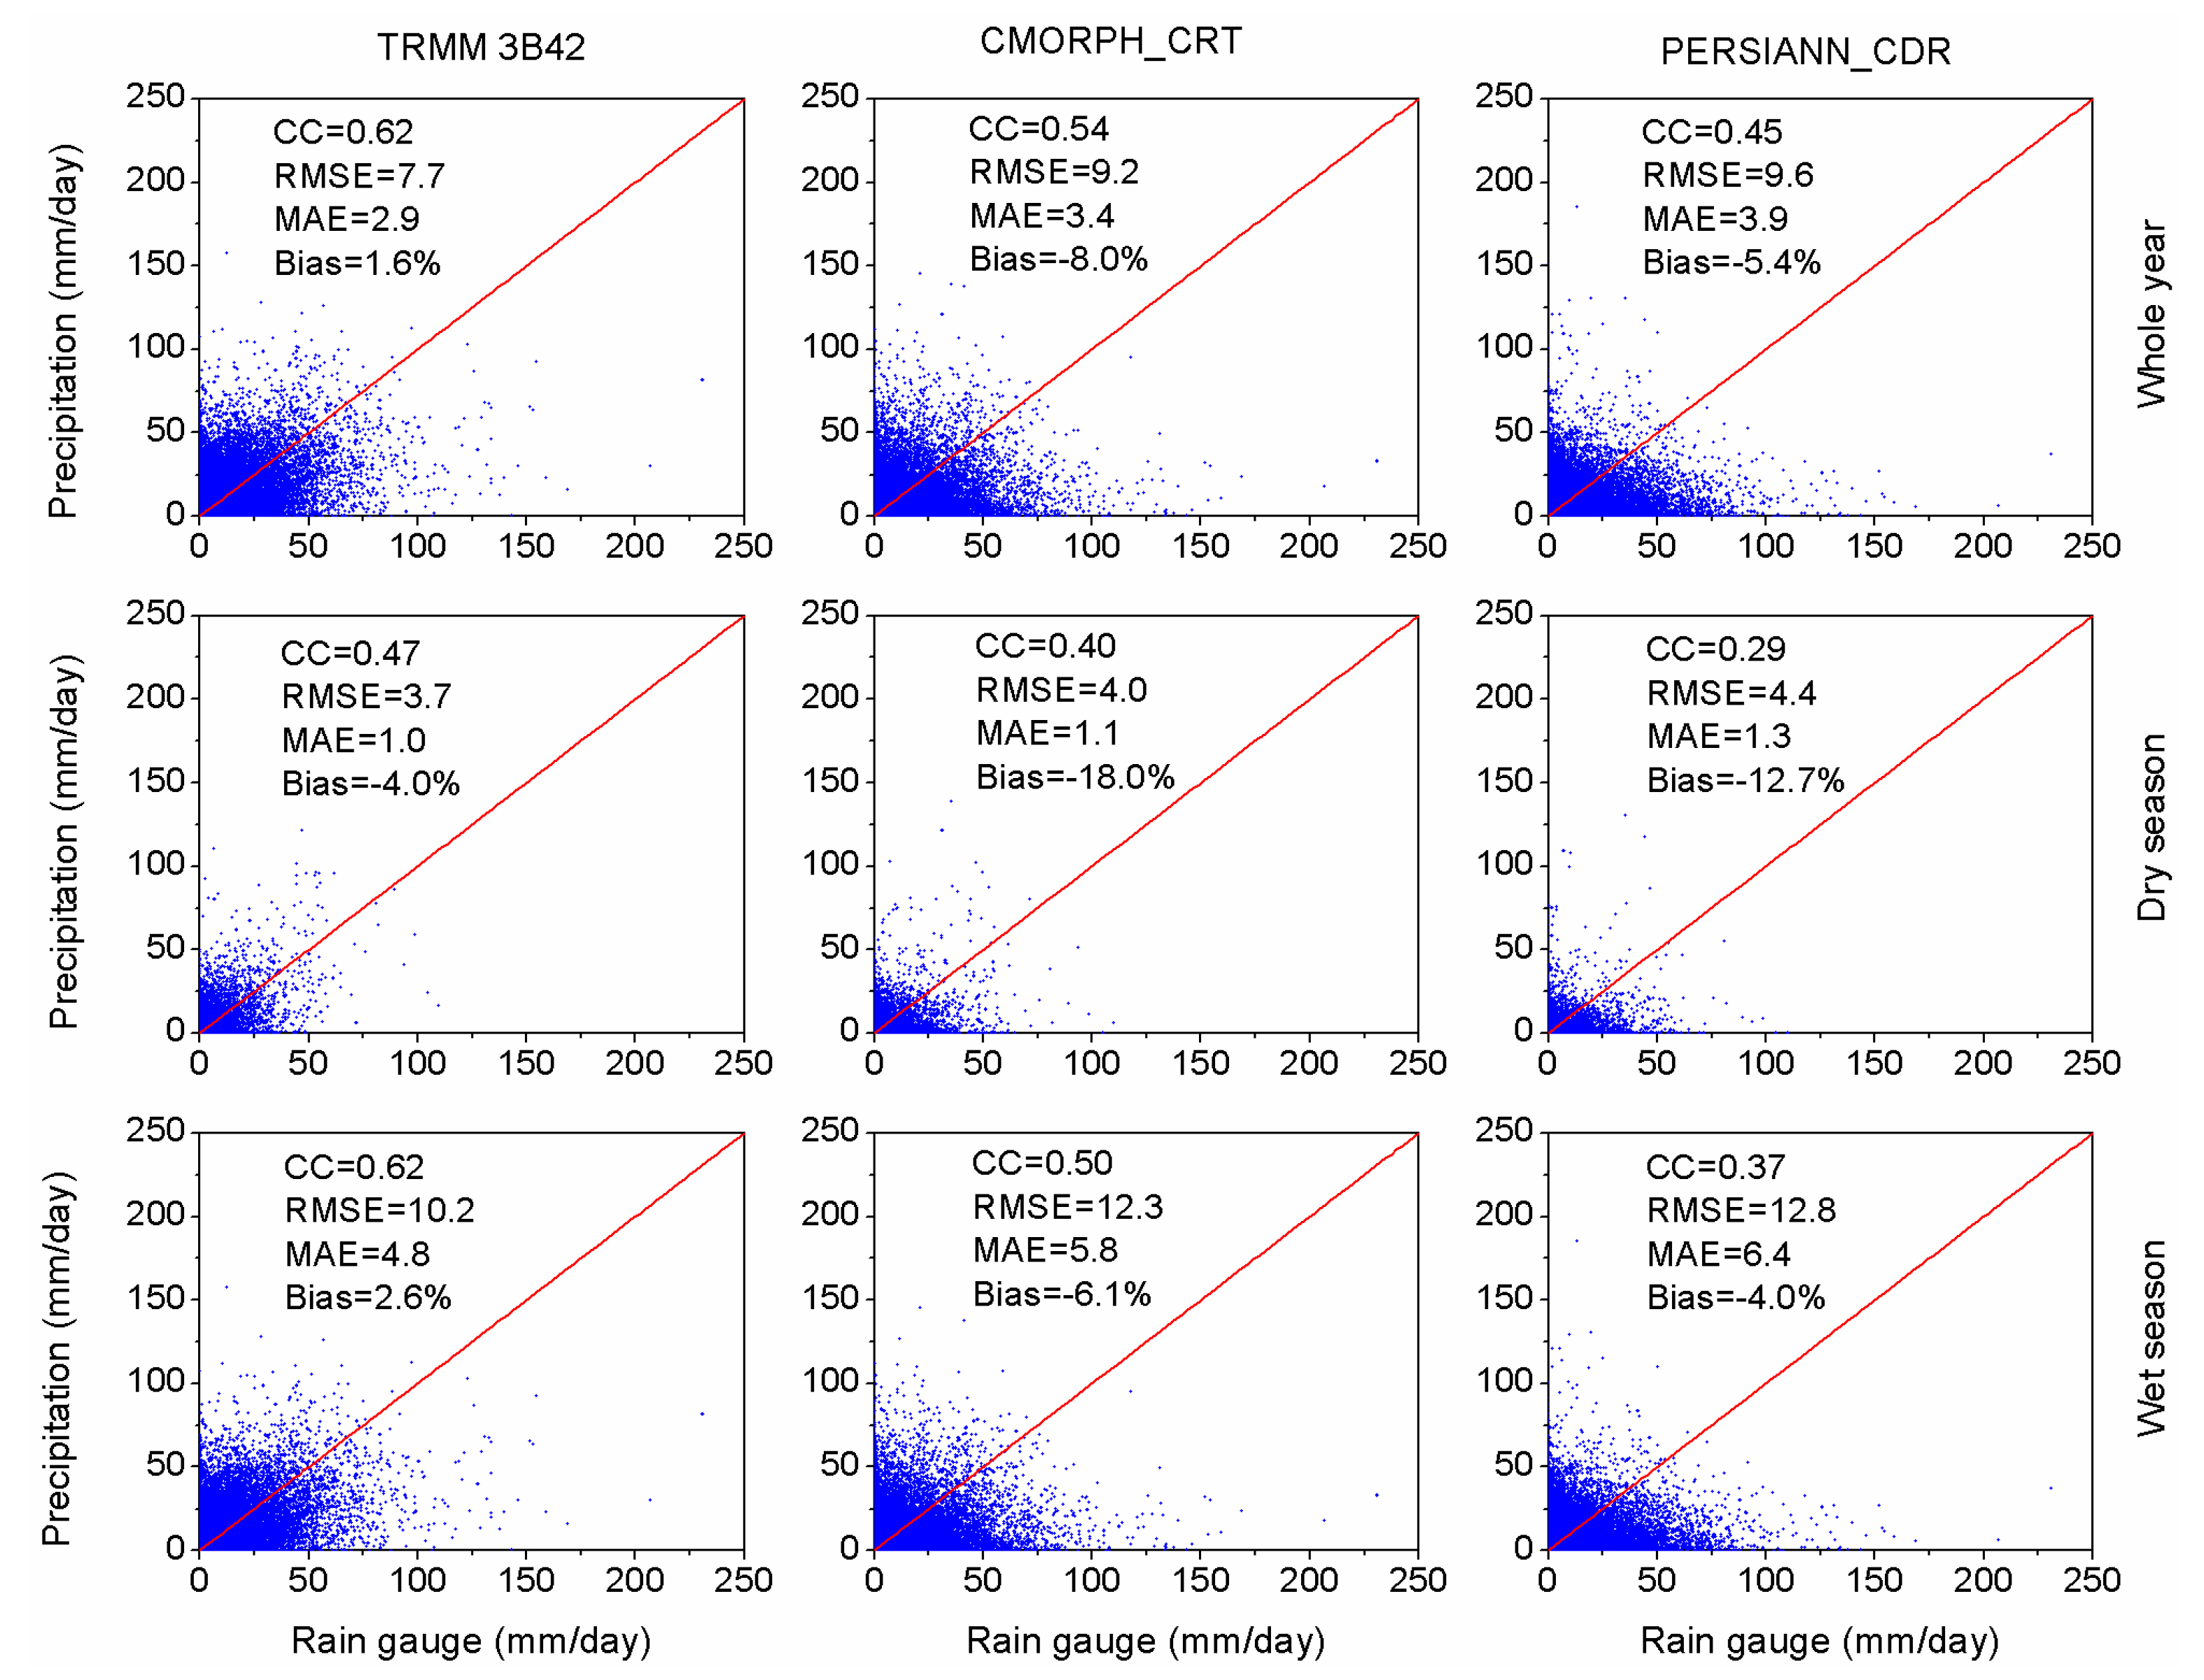
82]. Therefore, all SPPs suffer from systematical overestimations or underestimations over the URRB, which is explained by the negative and positive values of Bias (Figure 2, Figure 3, and Table 4). In addition, SPPs perform better in the wet season than in the dry season.
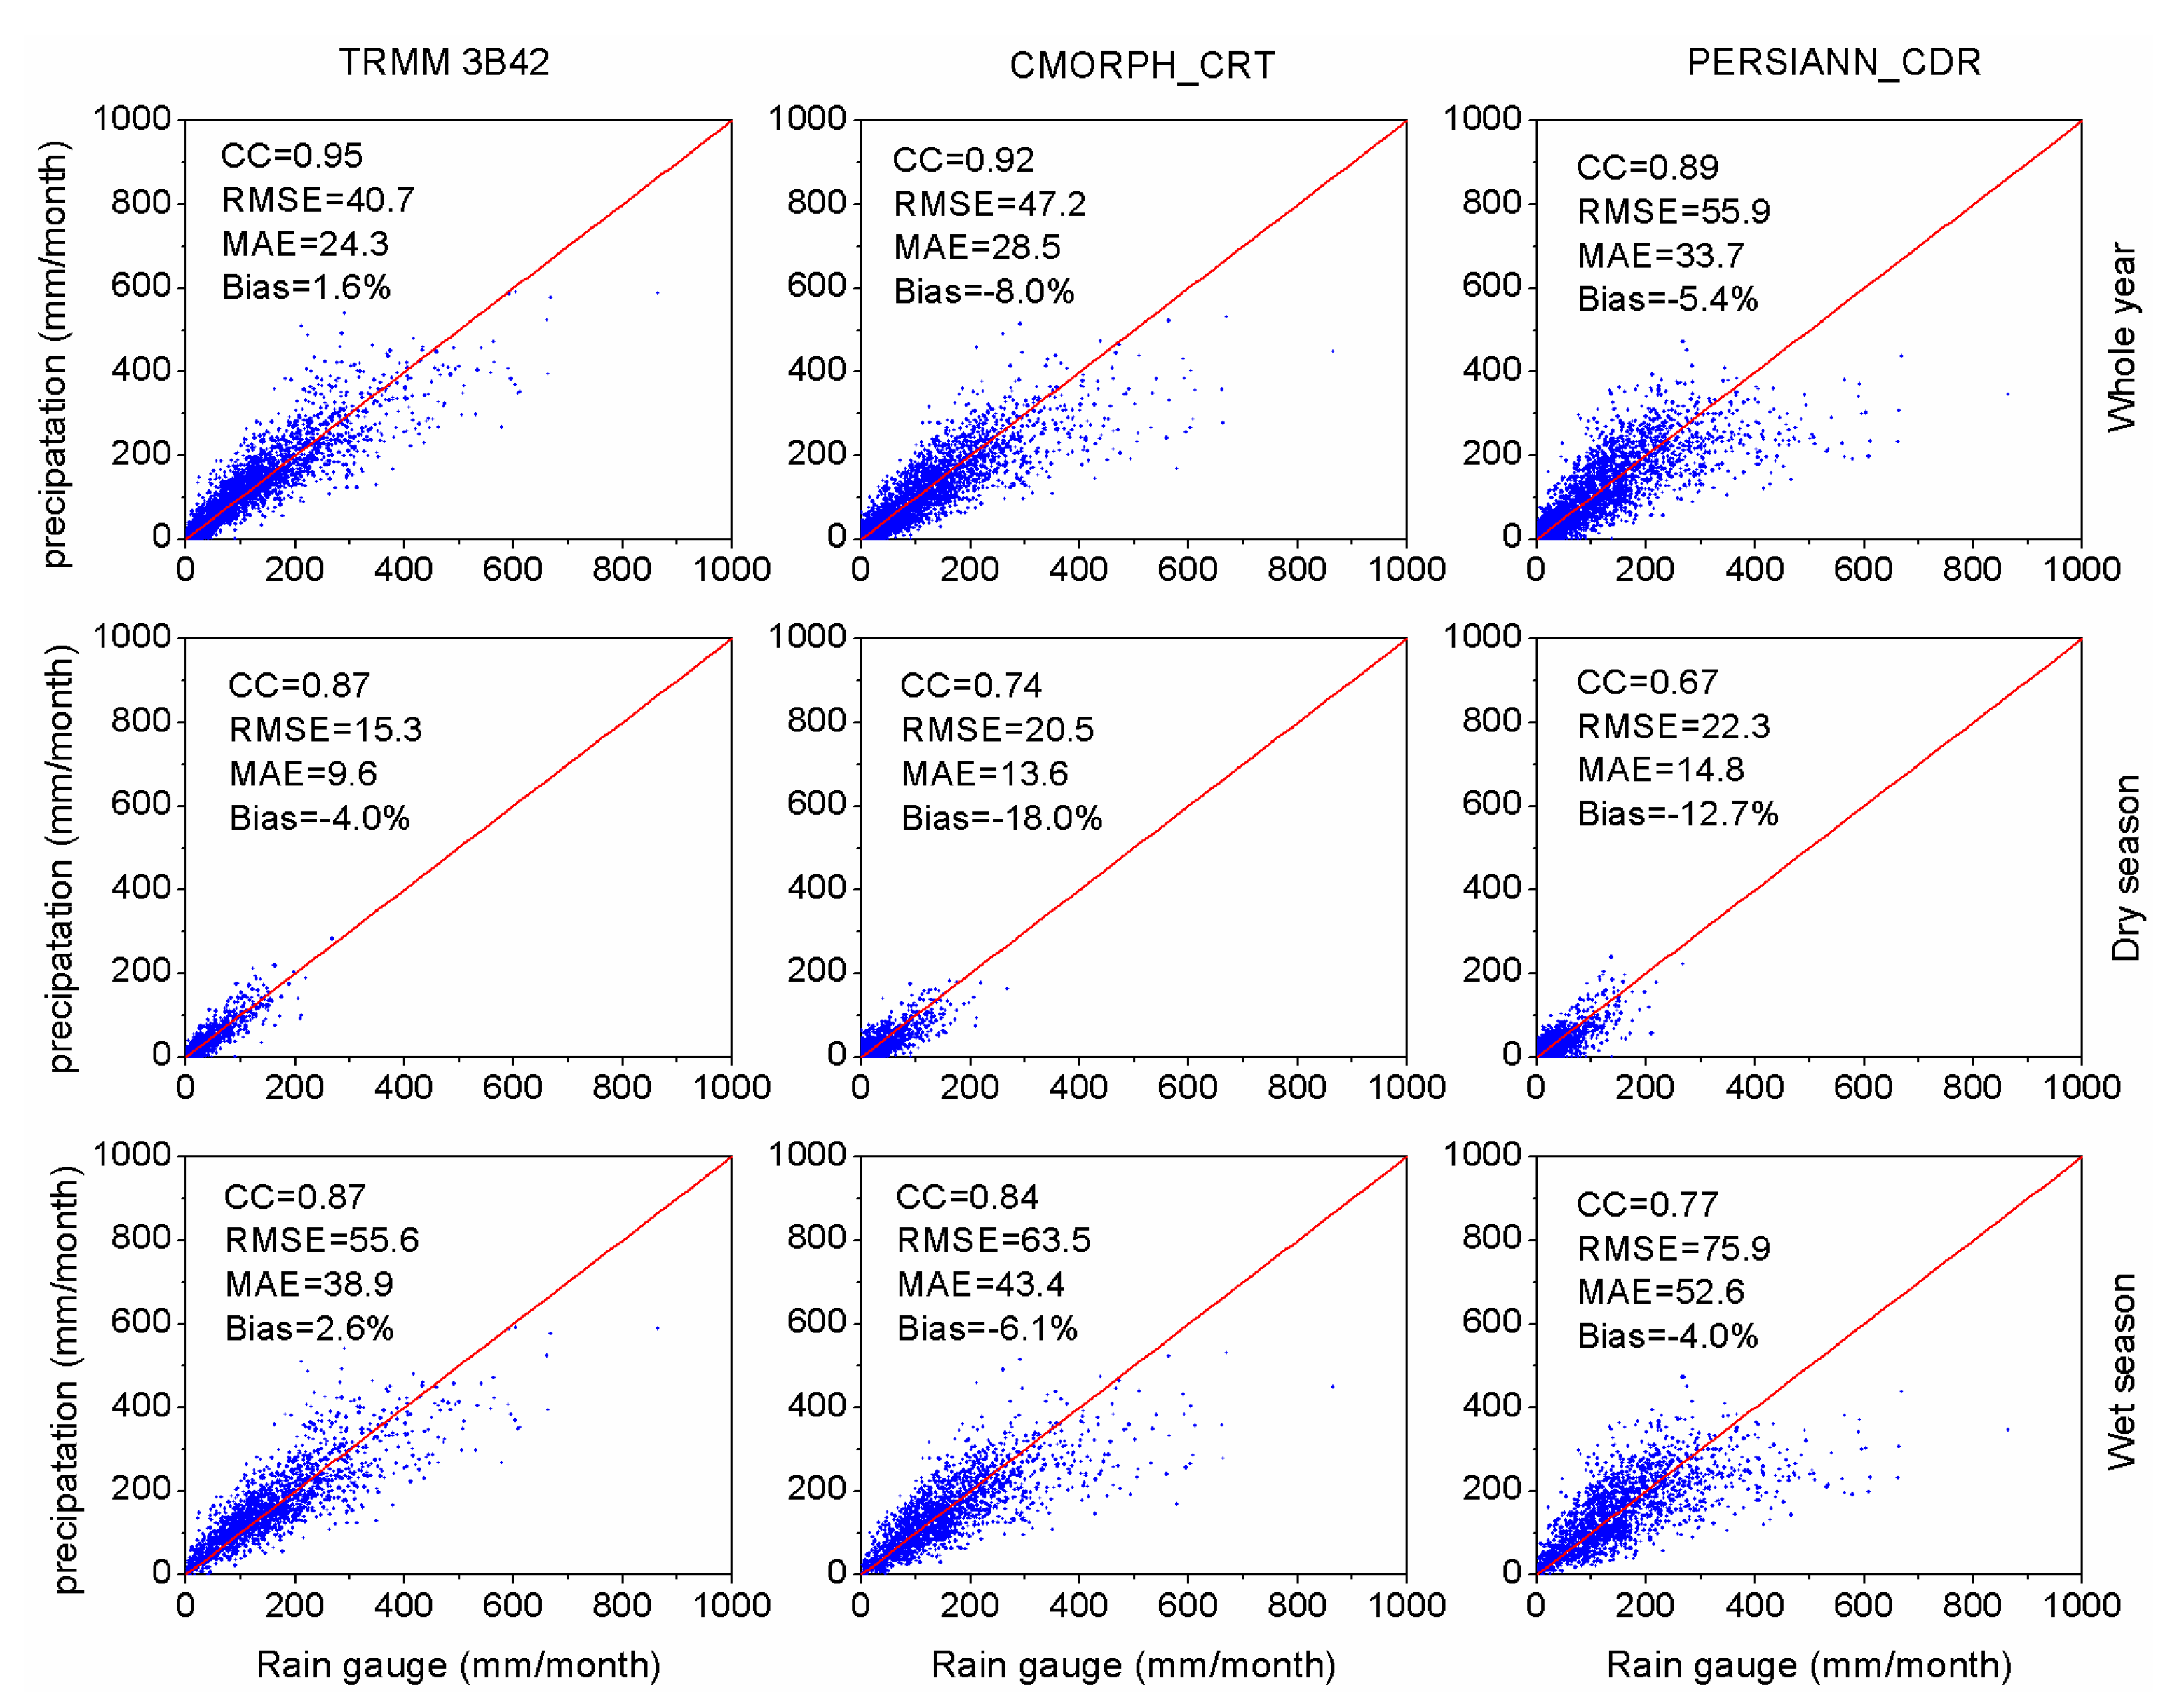
According to our results of accuracy analyses, PERSIANN_CDR performs unsatisfactorily compared with the other two products (Figure 2 and Figure 3), which is probably because PERSIANN_CDR is mainly based on IR data, while TRMM 3B42 and CMORPH_CRT combine PMW and IR data. The main difference between TRMM 3B42 and CMORPH_CRT is the gauge adjustment algorithm that is adopted. To develop CMORPH, PDF matching against the CPC unified daily gauge analysis was used to adjust the biases. Monthly GPCC rain gauge analyses and inverse-error variance weighting were used for the TRMM to adjust the biases [60]. However, the accuracy of TRMM generally outperforms that of CMORPH (Figure 2 and Figure 3), which is probably due to the monthly gauge adjustment algorithm that is used in TRMM being superior to the PDF matching adopted in CMOPRH over this region. A similar finding was obtained in the previous studies over the Huaihe River basin in China [18]. At the basin scale, as expected, the CC and MAE values for SPPs improved, and the relative performances of the SPPs are similar to those at the grid scale (Table 4). Some distinct exceptions are that the TRMM 3B42 showed the largest overestimation in precipitation, while the PERSIANN_CDR showed underestimation in precipitation. This result indicated that the performance of these SPPs are not uniform with an increasing spatial scale, as a consequence of topographical variations [83]. Mei et al. [84] also stated that the size of catchments influences the satellite rainfall errors. Another possible reason is that there may not be enough rain gauges in the area to provide accurate estimates of rainfall for comparisons with satellite estimates at the basin scale.
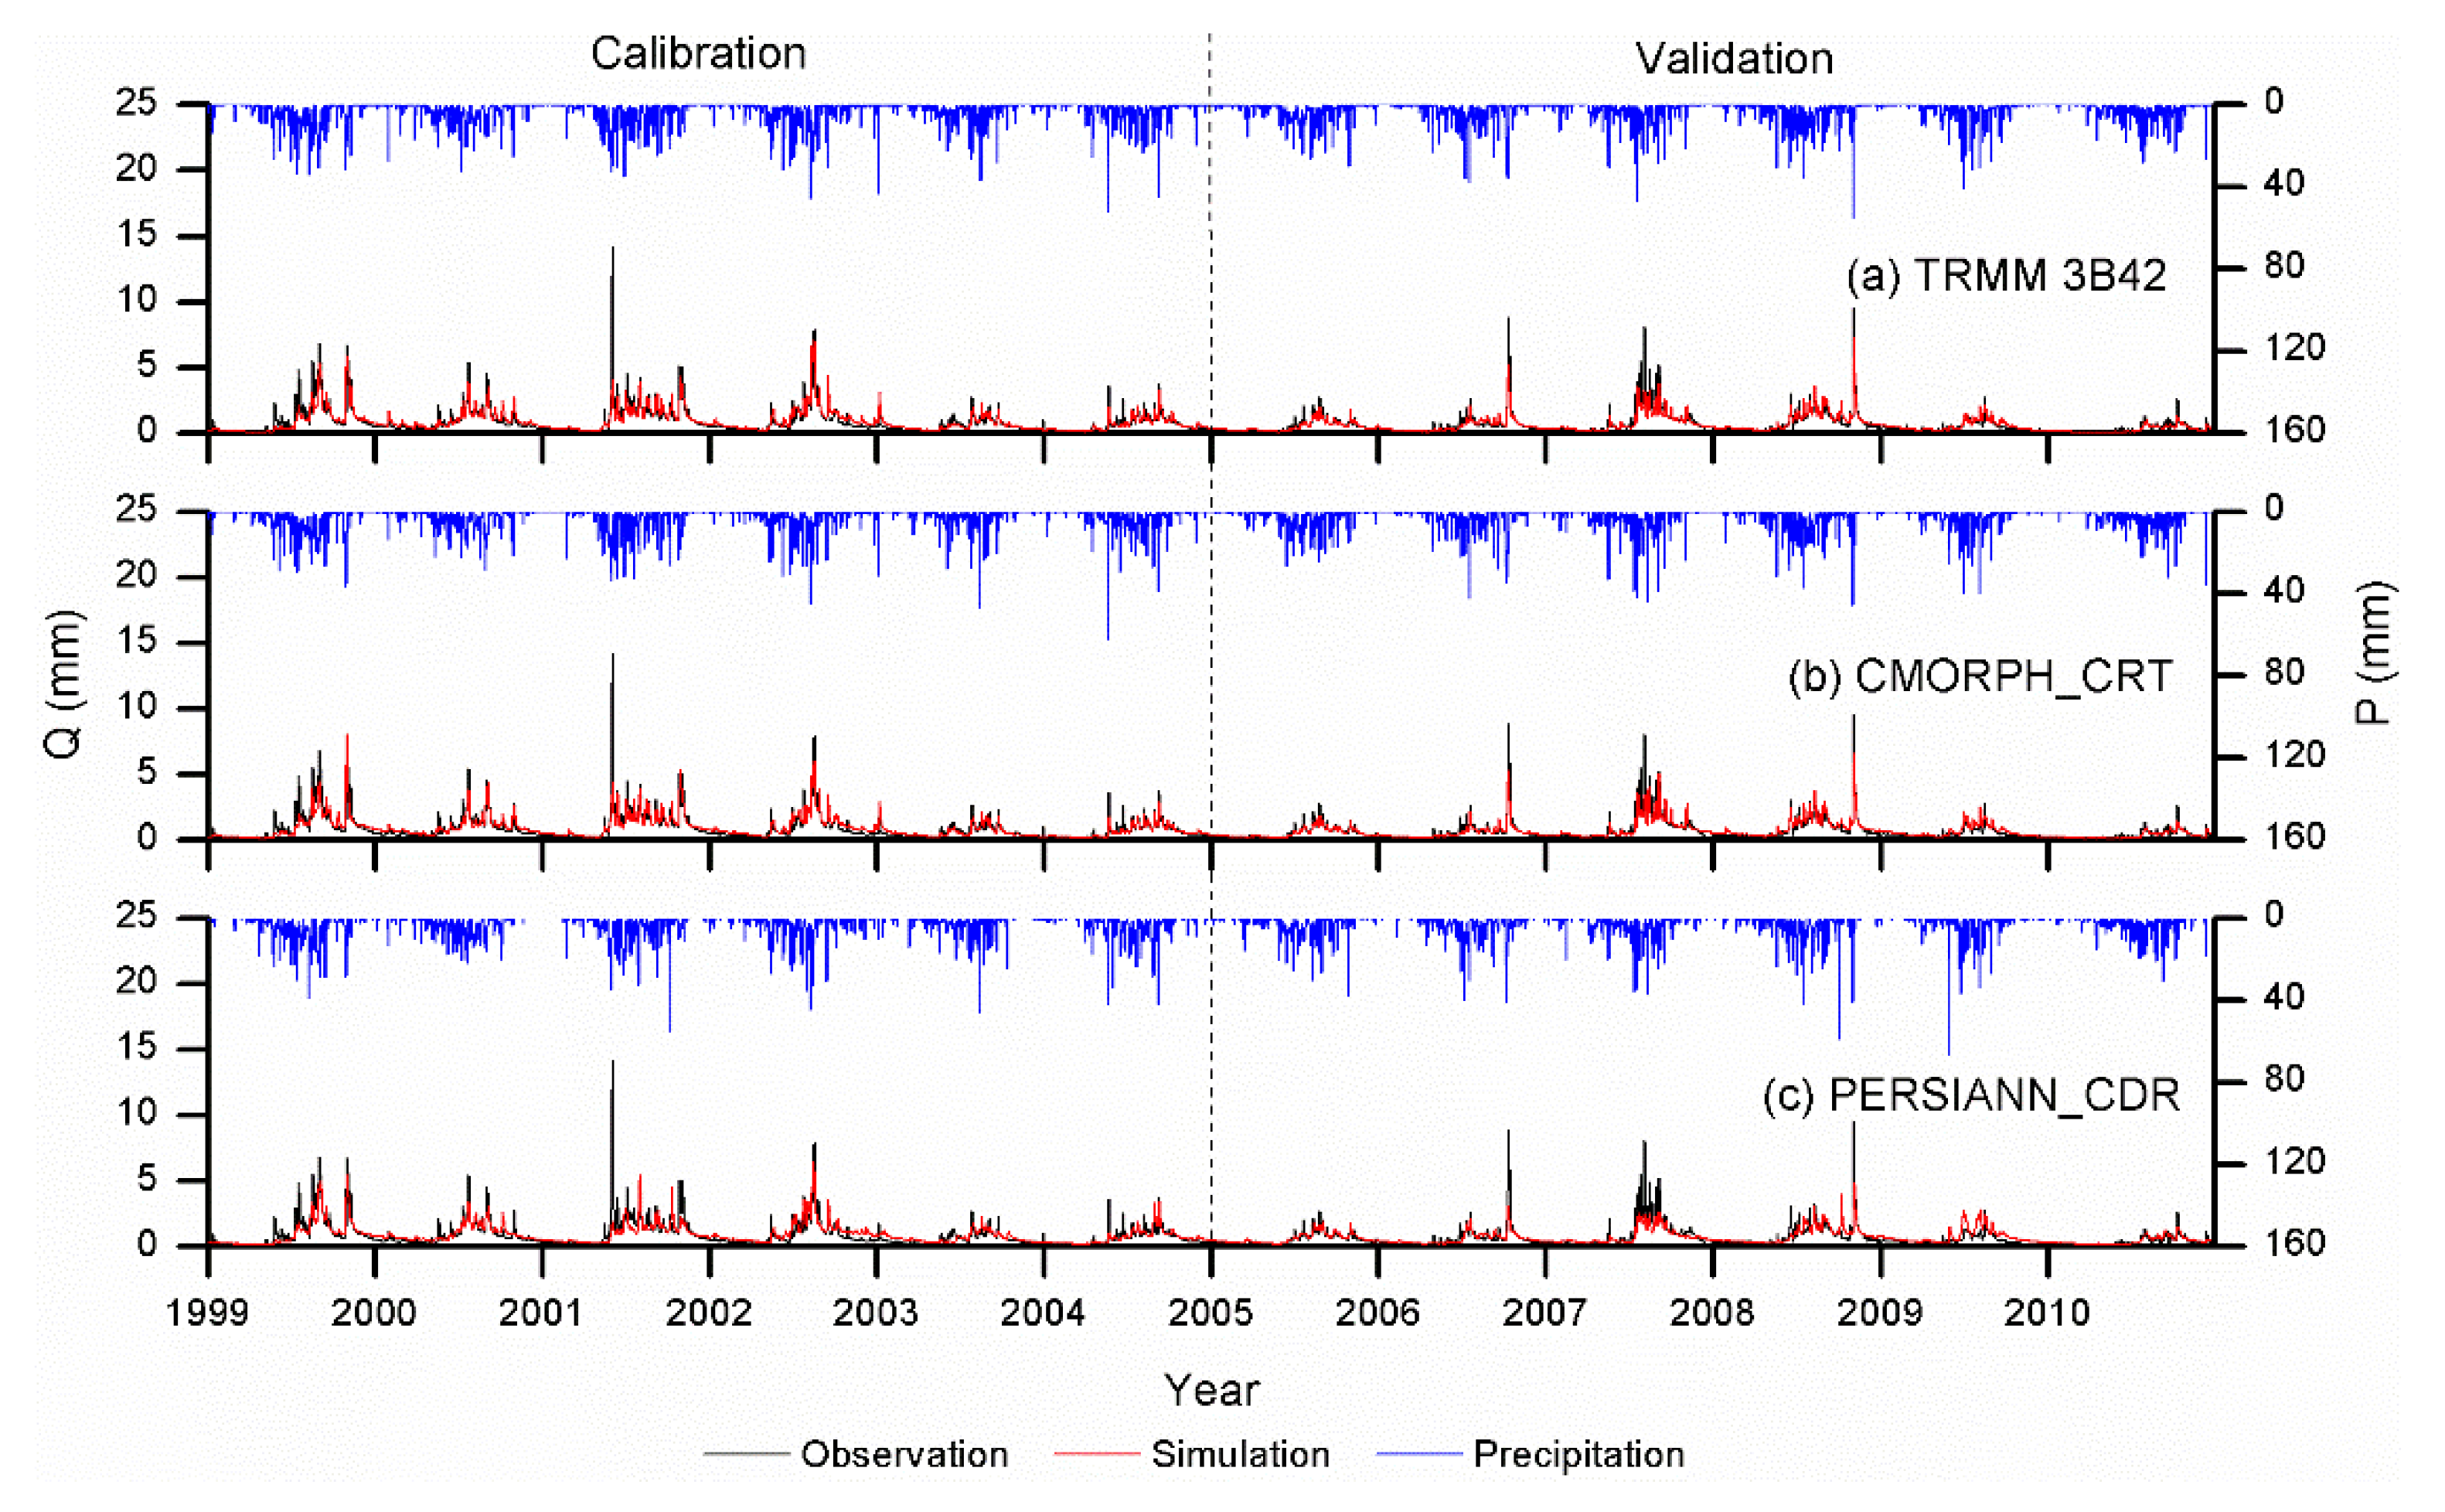
Two parameters scenarios were designed to evaluate the effect of precipitation uncertainty on streamflow simulations. Under Scenario I (Table 5), CMORPH_CRT showed the best performance among the SPPs, which is mostly due to the relatively low Bias in precipitation input. In contrast, the TRMM 3B42-driven simulations overestimate the streamflow by 24.2% (Table 5), which is attributed to the large overestimation in the TRMM 3B42 precipitation input. Another possible explanation is that CMORPH_CRT used daily rain gauge analysis, and all of the bias correction algorithms were conducted at the daily scale directly, while the other two products conducted bias correction with rain gauge analysis at the monthly scale. Therefore, CMORPH_CRT performs better in streamflow simulation using the gauge-calibrated parameters. Previous studies have reported that the errors of SPPs are propagated into hydrological simulations [10,17,79]. An overestimation/underestimation of precipitation estimates can be transformed into a larger overestimation/underestimation in the simulated streamflow. In this study, the basin-scale 
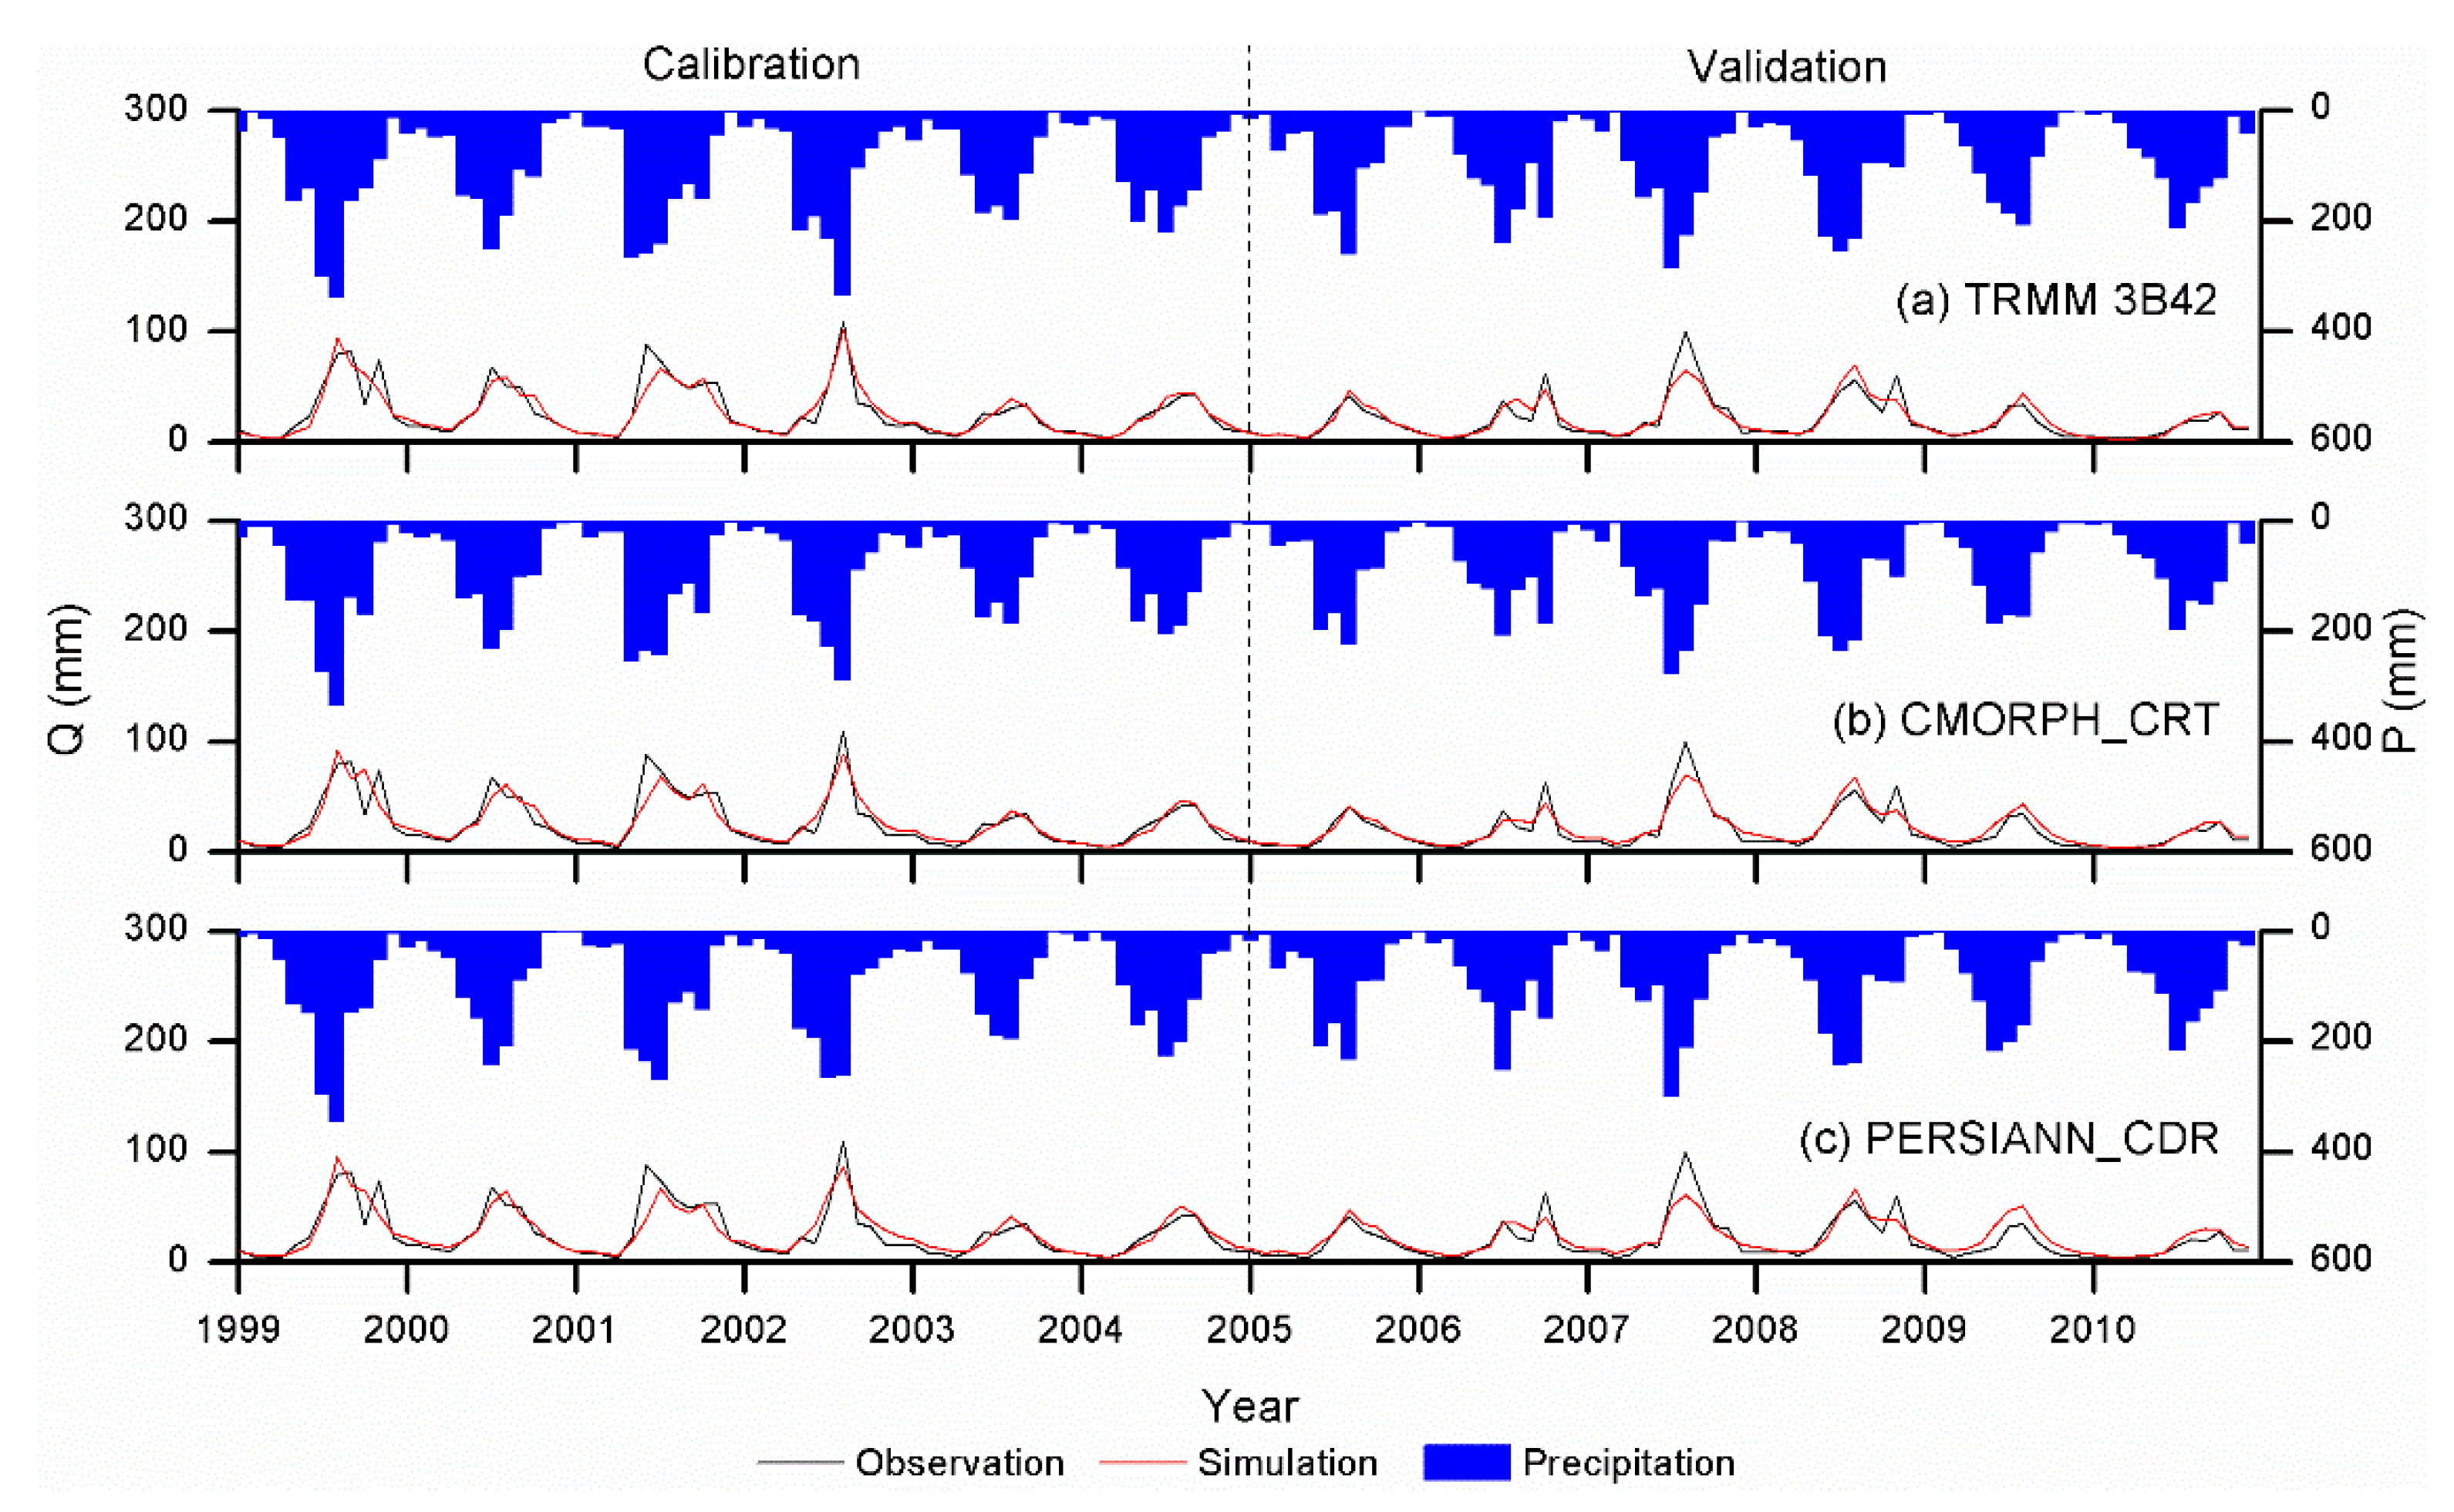
Bias of TRMM 3B42 (9.6%), CMORPH_CRT (−0.9%), and PERSIANN_CDR (2.2%) resulted in corresponding Bias values for streamflow simulations of 24.2%, −7.5%, and −2.9% at the daily scale, and 24.2%, −0.9%, and 5.5% at the monthly scale, respectively. This comparison between the input and output Bias values in GR models indicates that there is a non-linear error propagation pattern [16].
Under Scenario II, a recalibrated hydrological model using the SPPs can greatly improve streamflow simulation performance, as the different parameter settings can compensate for errors in the satellite rainfall data (Table 6). However, a few studies have indicated that recalibration can sometimes cause parameter values to exceed their reasonable ranges [16,79]. The calibrated model parameters for rain gauge are all within the 80% confidence interval (Table 2 and Table 3). However, some model parameters (i.e., x1 and x4) for SPP-forced calibration greatly exceed the 80% confidence interval, which may be attributed to the GR models being sensitive to the precipitation data and the size of catchments. However, for a specific catchment, since the underlying surface condition remains unchanged, the hydrological model parameters largely depend on the input data. If the forcing data change, the sensitive parameters will change accordingly in order to match the streamflow (Table 3). In spite of the influence of cancellation between parameter differences and precipitation bias on streamflow simulation, the three SPPs are able to produce a reasonably good streamflow under scenario II. For instance, TRMM 3B42-driven results presented a satisfactory model efficiency (NSE = 0.86) and smaller Bias (0.8% relative to the observations) than that of the rain gauge data at the monthly scale. However, the uncertainty in satellite-based precipitation data, together with parameter uncertainty and the structural uncertainty of hydrologic models, will result in uncertainty in streamflow predictions [85]. Therefore, a better understanding of parameter uncertainties and a comparison of different hydrological models will be the focus of future research.
Many studies have explored the applicability of different SPPs using hydrological models over basins of different scales. When the studied SPPs included TRMM 3B42, CMORPH_CRT, and PERSIANN_CDR, similar results were obtained as this study: the streamflow simulations of TRMM 3B42 and CMORPH_CRT performed better than that of PERSIANN_CDR. For example, Su et al. [27] found that TRMM 3B42 and CMORPH_CRT products showed acceptable performance in four SPPs, while PERSIANN_CDR showed little potential for streamflow simulations over the upper Yellow River Basin in China. For the Xixian Basin (upstream of the Huai River Basin), streamflow simulations using the Xinanjiang model found that TRMM 3B42 forced simulation fitted best with the observed streamflow series among three post-real-time research products; this was followed by the CMORPH_CRT-based simulation, and then the PERSIANN_CDR-based simulation [72]. Alazzy et al. [46] also drew similar conclusions according to the results of hydrologic simulation, testing four SPPs, including the three used in our study. According to Moriasi et al. [86], the models can be considered satisfactory if the NSE >0.5 and the absolute Bias <25%. In this study, the daily NSE and absolute Bias of PERSIANN_CDR were 0.53 and 2.9% under Scenario I, and 0.63 and 3.4% under Scenario II, indicating that the PERSIANN_CDR product also has the capability to produce acceptable streamflow simulation results by using the GR hydrological model in the URRB.
Inevitably, a few limitations were present in this study. First, compared to the dense rain gauge networks of previous studies [10,18], the rain gauge stations in our study region are relatively sparse and unevenly distributed, which may cause uncertainties in the rain gauge comparison and streamflow simulations. Moreover, it is difficult to ensure that the observed streamflow data for the Manhao station of the URRB is not affected by human activities and regional economic development, although the results of the hydrologic simulation for the study basin were reliable. For instance, the human consumption of water can lead to much lower observed discharge than actual natural discharge, particularly during droughts.

5. Conclusions

This study provides a comprehensive assessment of the three latest SPPs (TRMM 3B42 V7, CMORPH_CRT, and PERSIANN_CDR) based on rain gauge observations over the URRB for the period 1998–2010. The primary conclusions can be summarized as follows.
(1) On the grid scale, TRMM 3B42 performs the best, while PERSIANN_CDR performs the worst. Moreover, monthly SPP data have a much better correlation with gauge rainfall data than daily SPP data. Similar results are obtained at the basin scale, but with a high Bias for TRMM 3B42 (9.6%) and a much-improved Bias for CMORPH_CRT (−0.9%) and PERSIANN_CDR (2.2%).
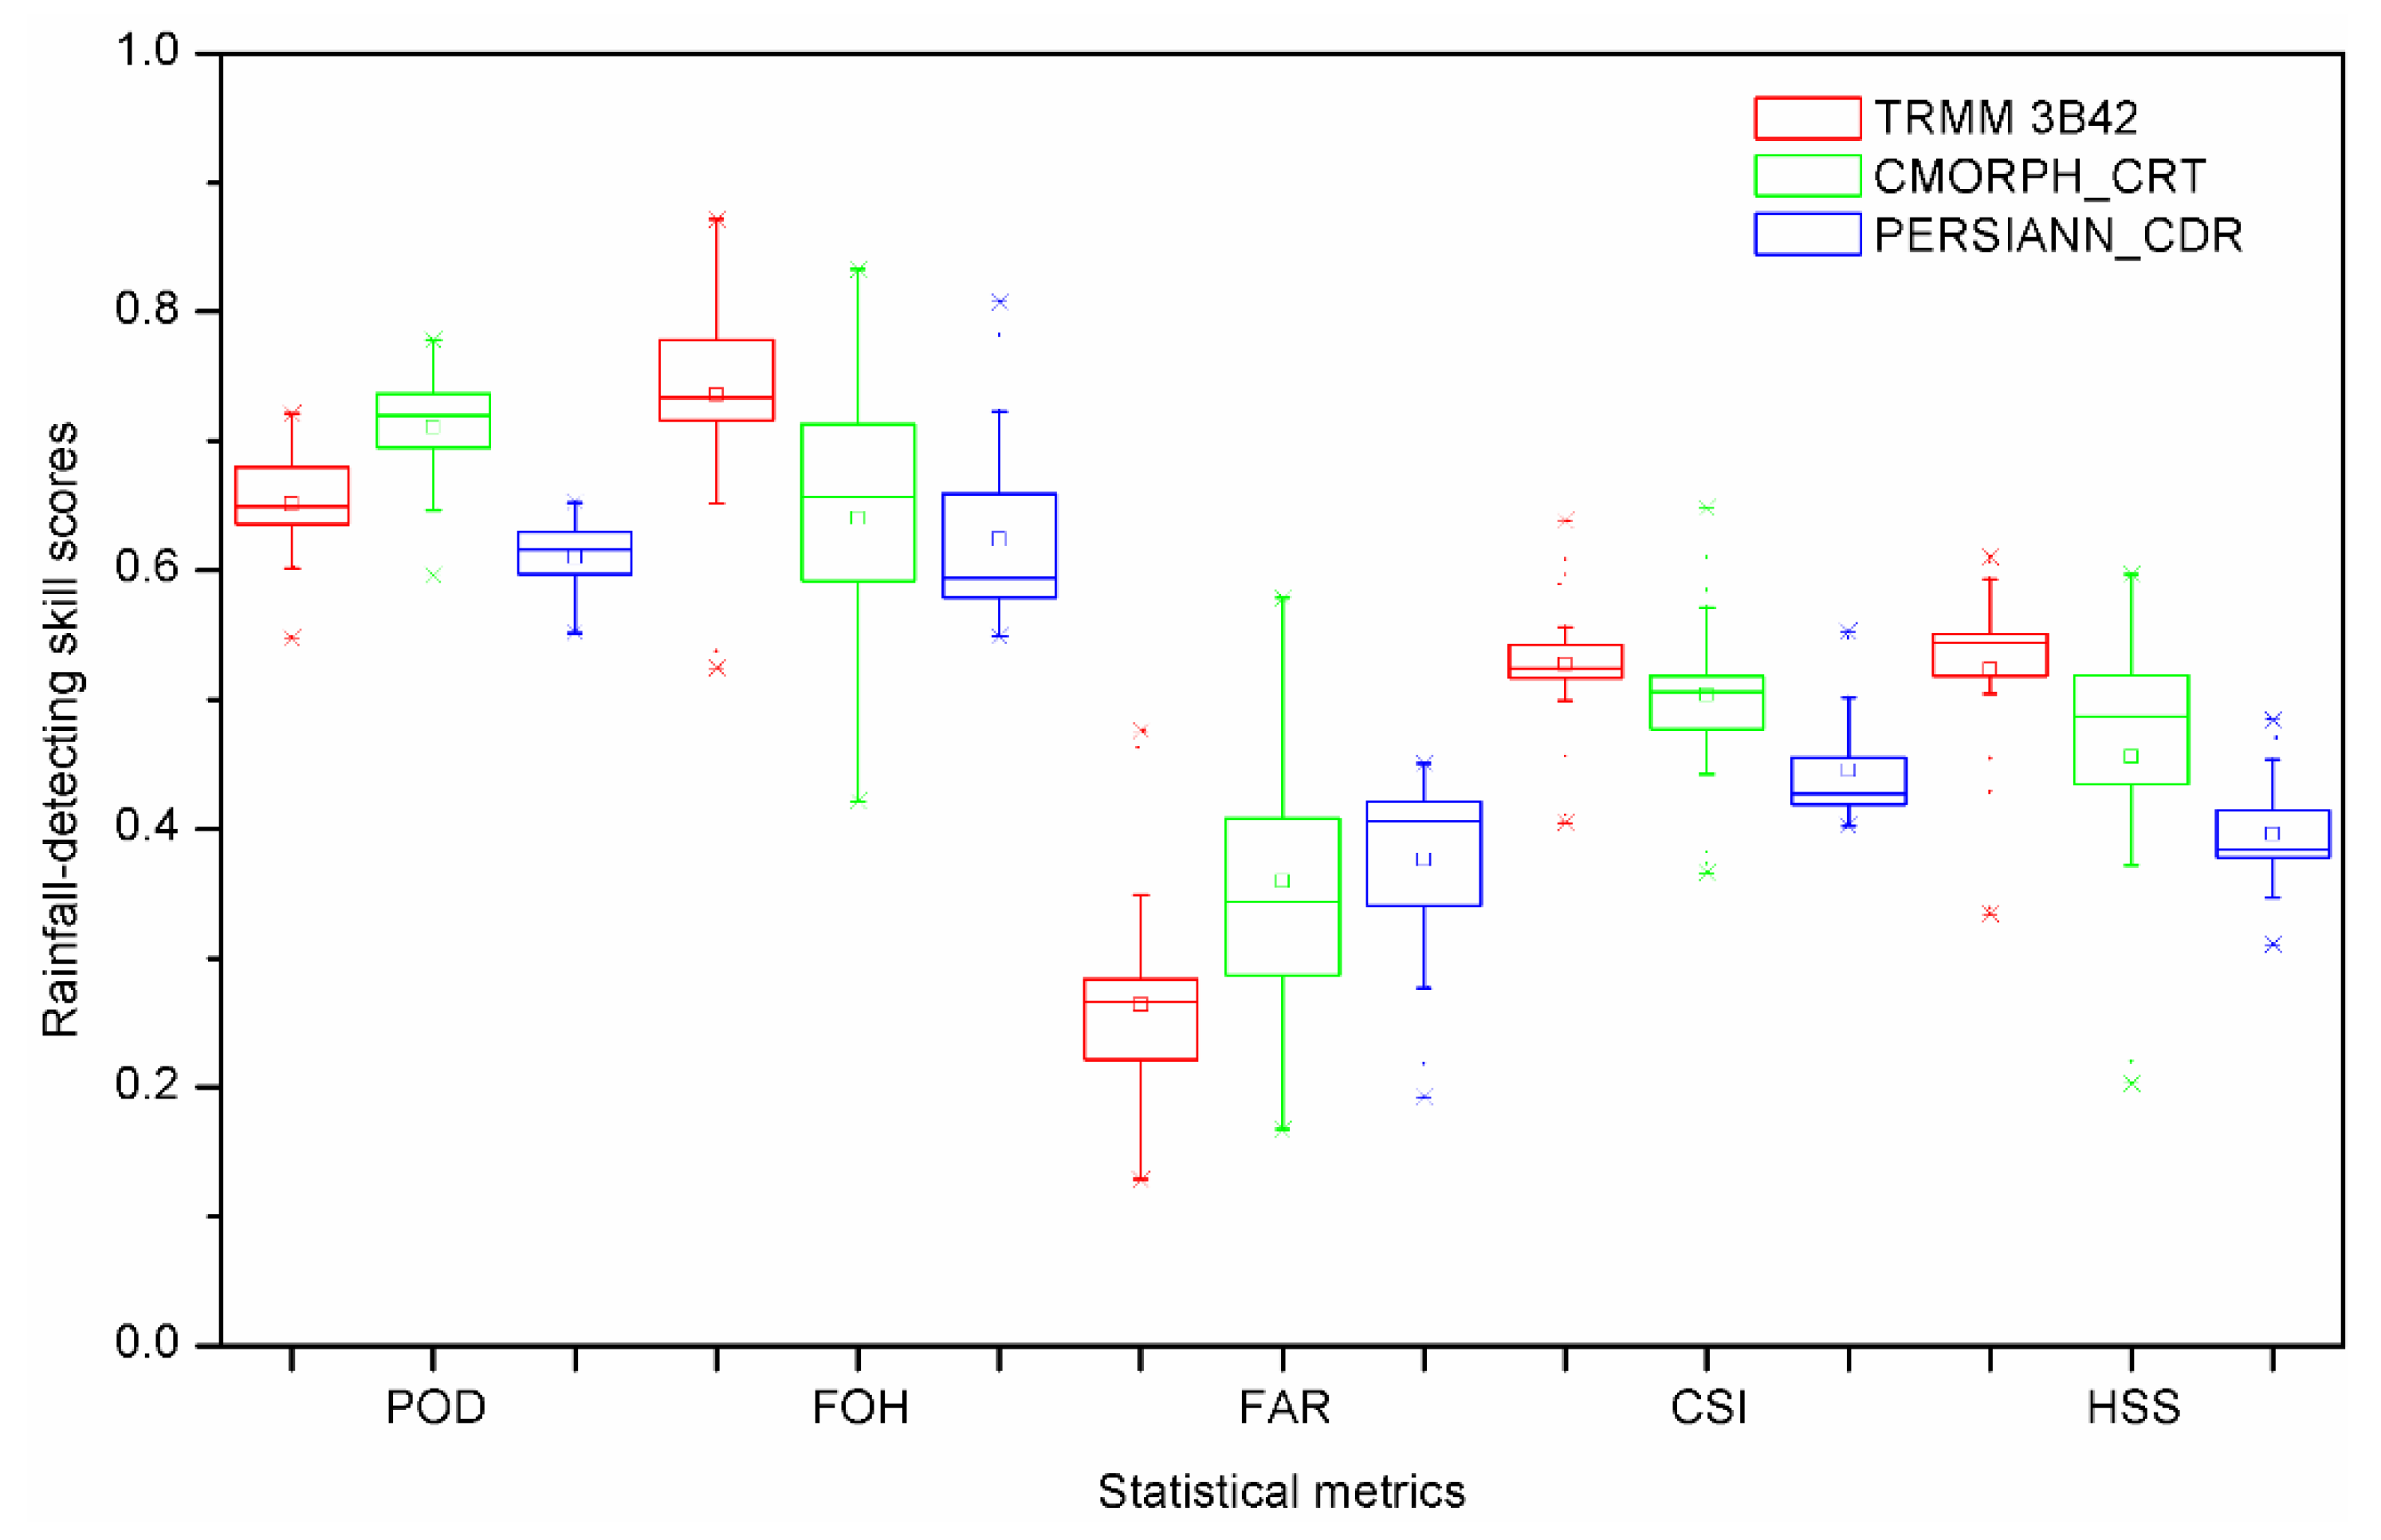
(2) For the detection capability of precipitation events, TRMM 3B42 performs the best, while PERSIANN_CDR exhibits the worst performance. By comparison, CMORPH_CRT shows relatively better capability, but with larger fluctuation among different rain gauge stations.
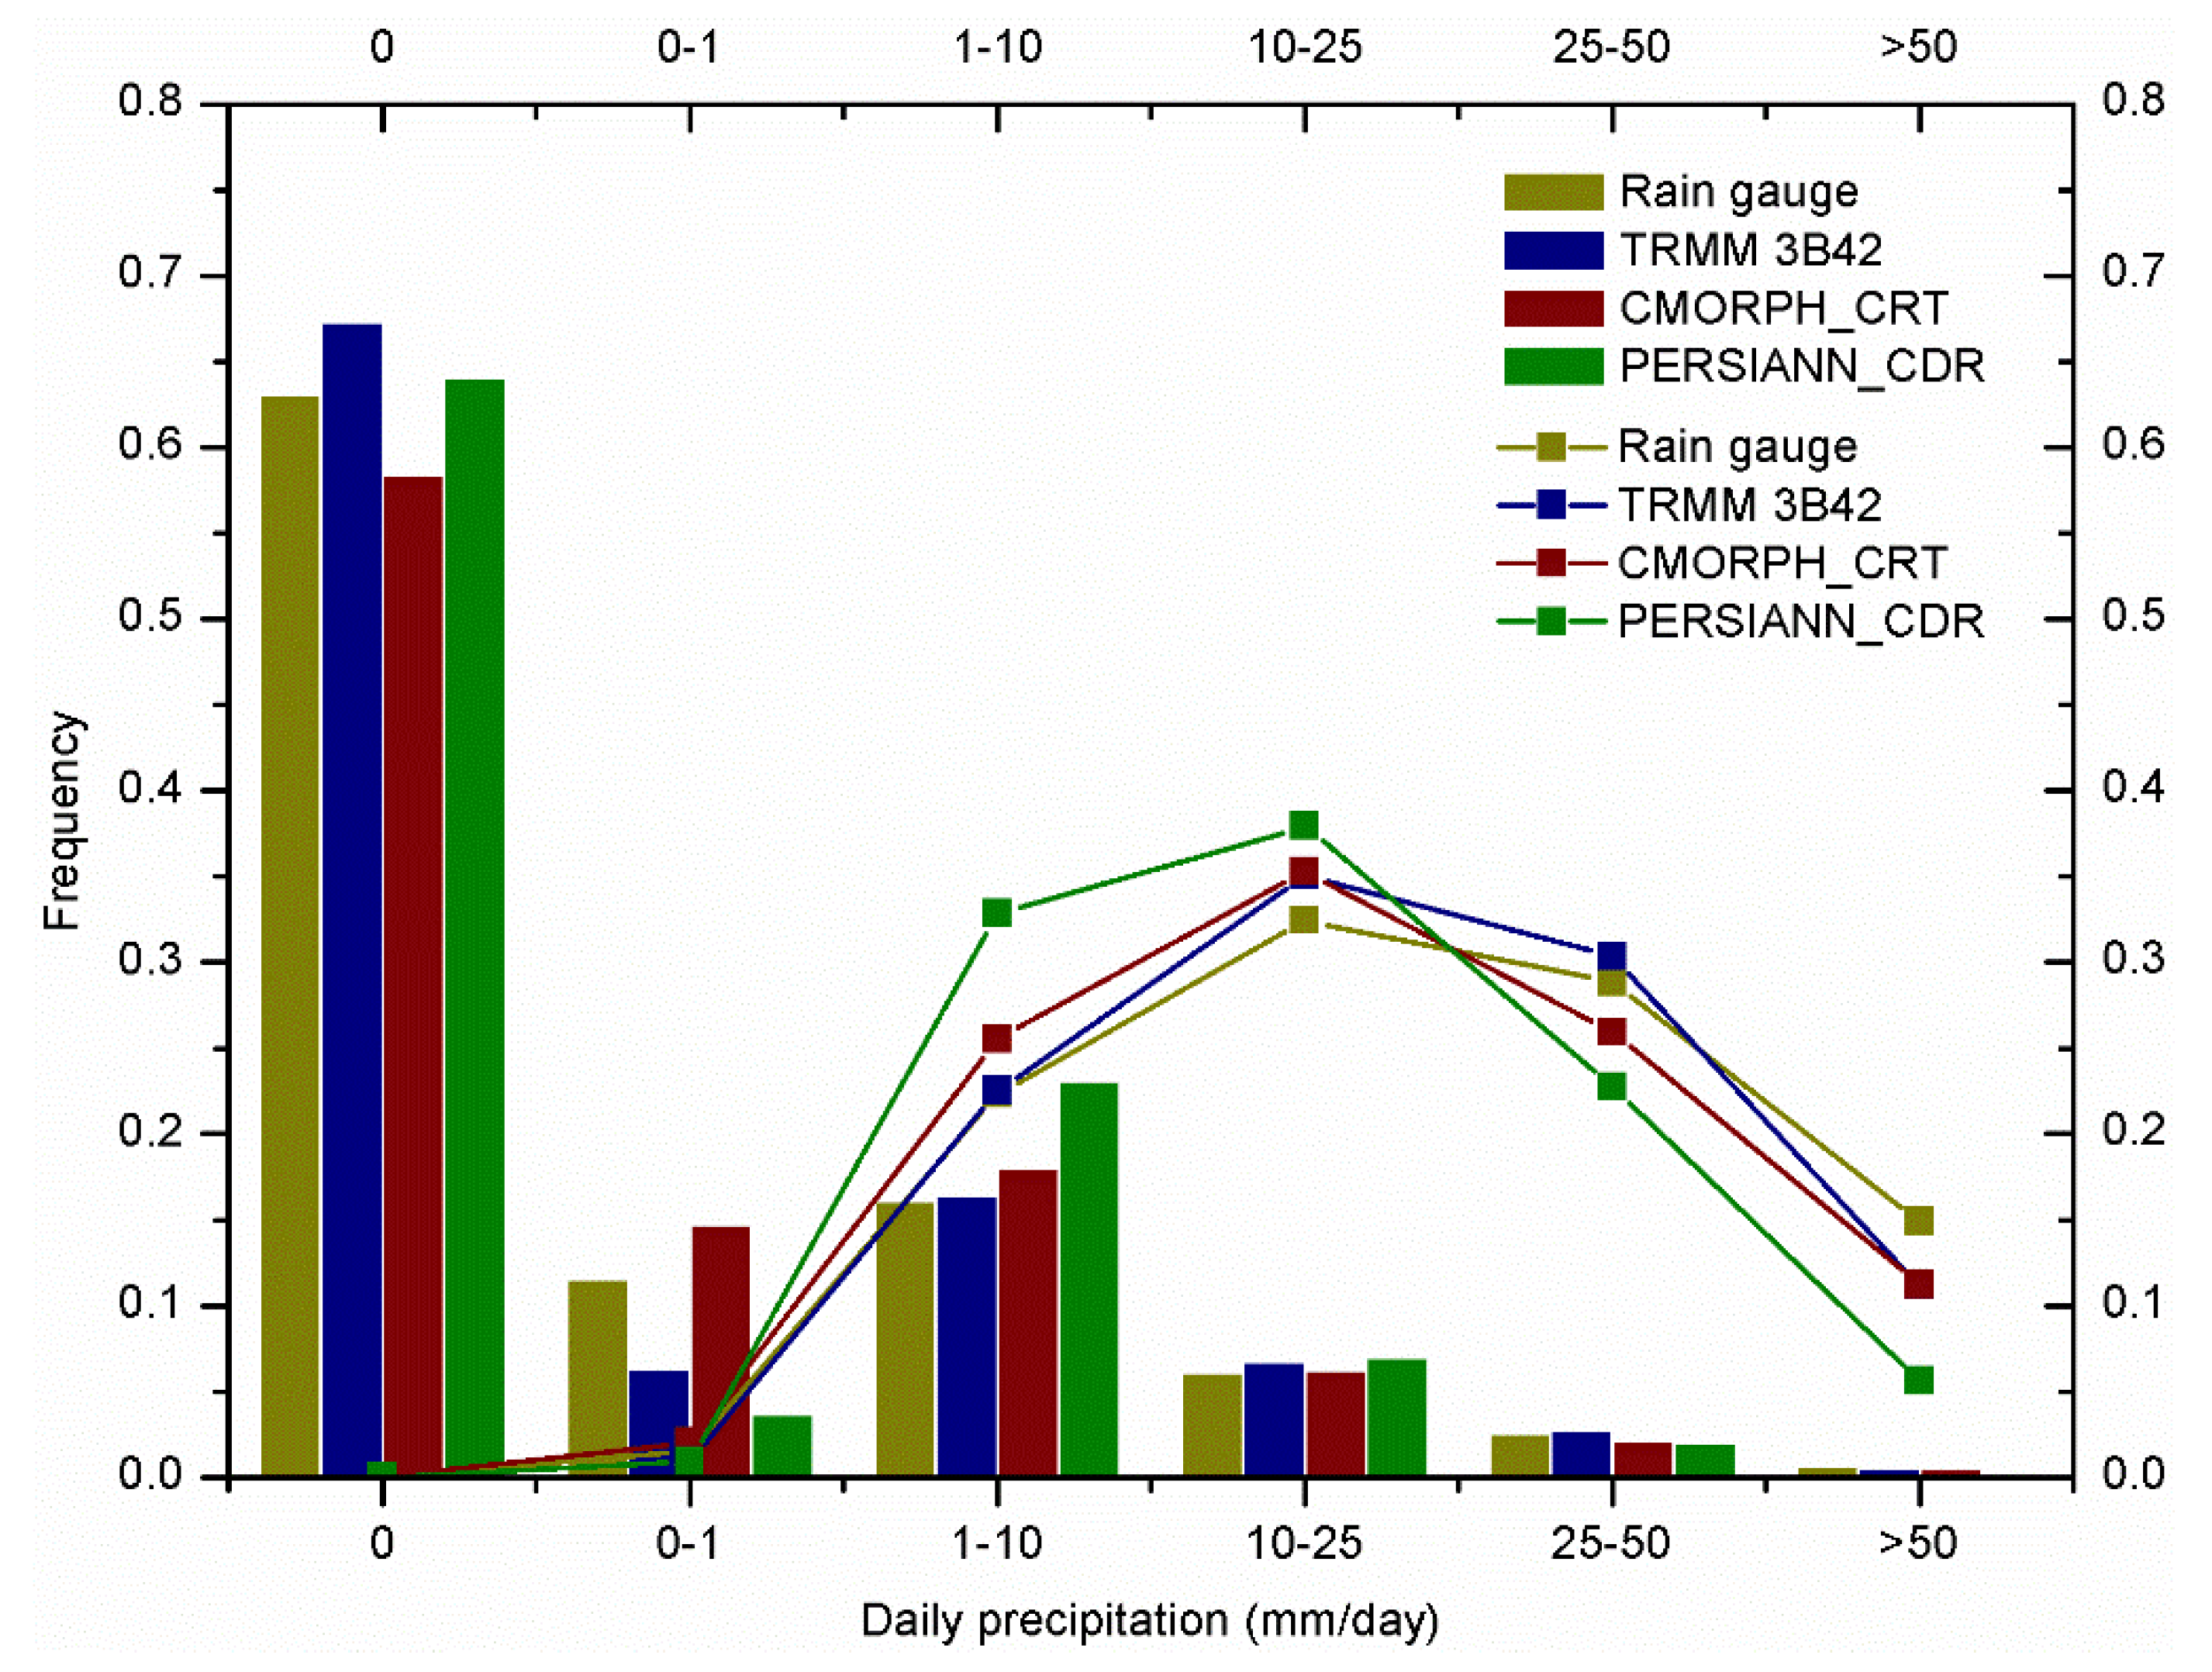
(3) To different degrees, all three SPPs overestimate or underestimate no-rain (0 mm) and light rainfall (0–1 mm) events. Additionally, there is an overestimation of moderate rainfall events (1–25 mm) and an underestimation of heavy and hard rainfall events (>25 mm), indicating their poor ability to reflect extreme precipitation. For the distribution of relative contribution, the PERSIANN_CDR product deviates the most from gauge data.
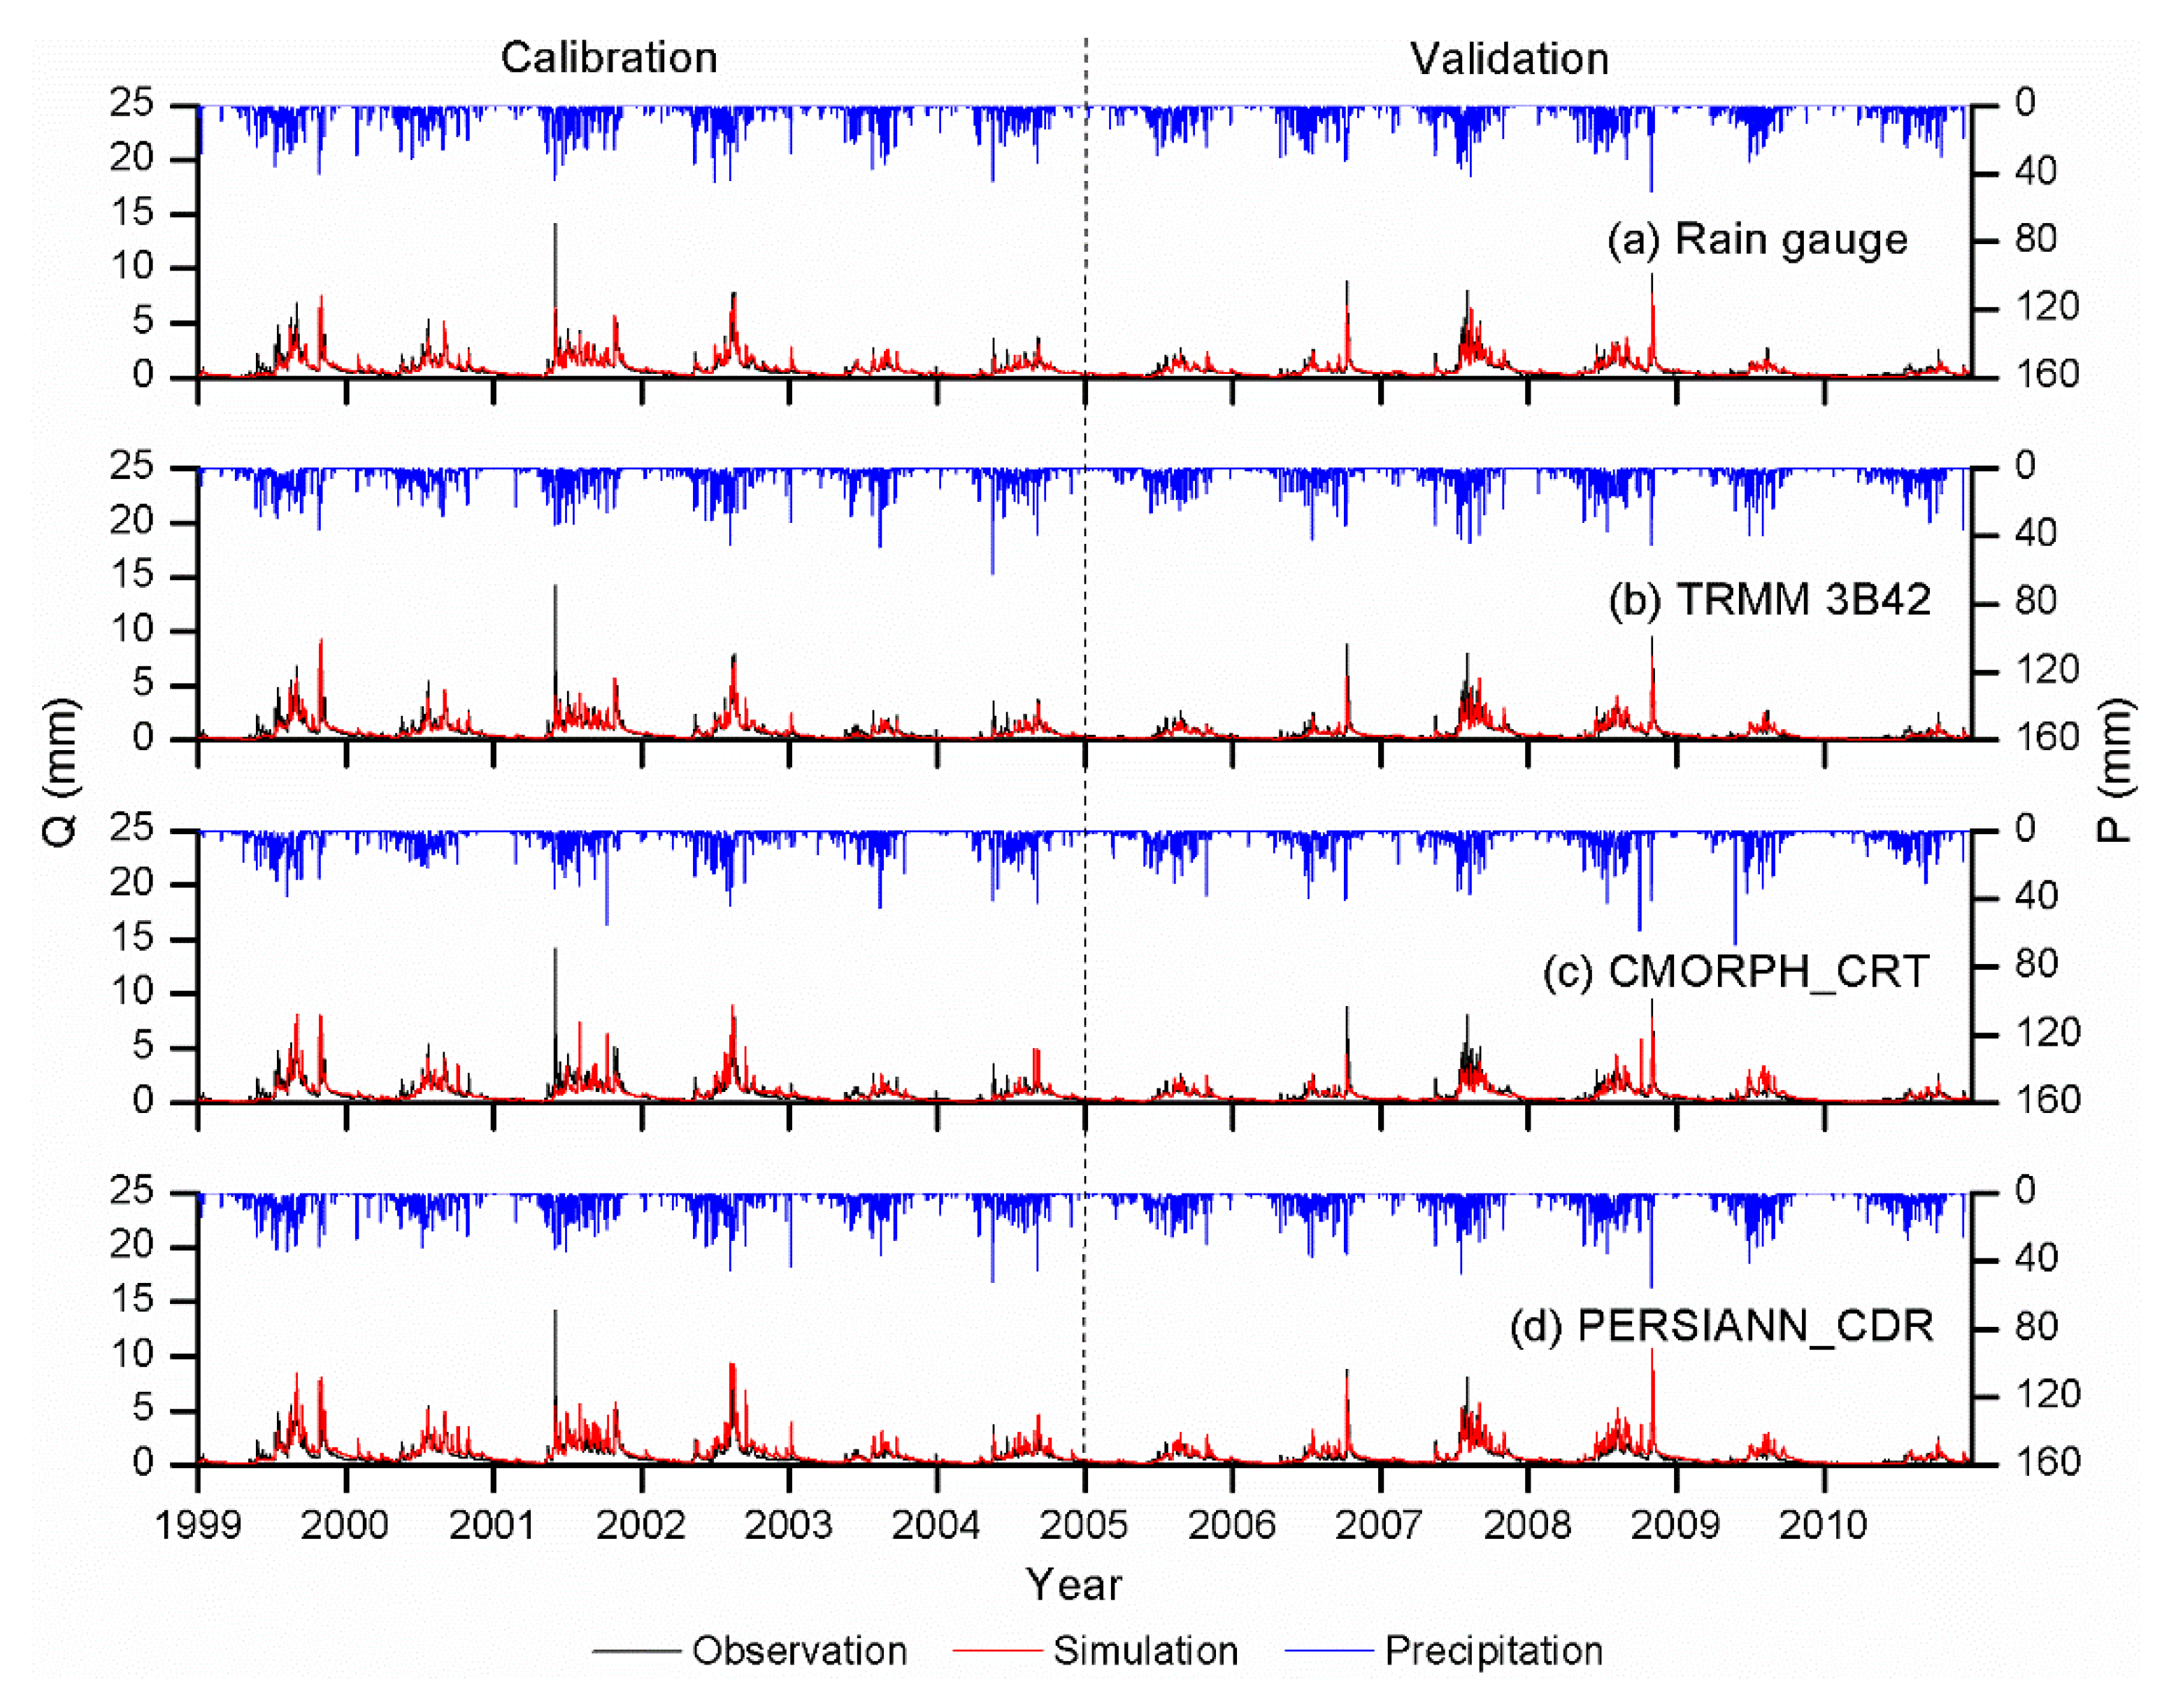
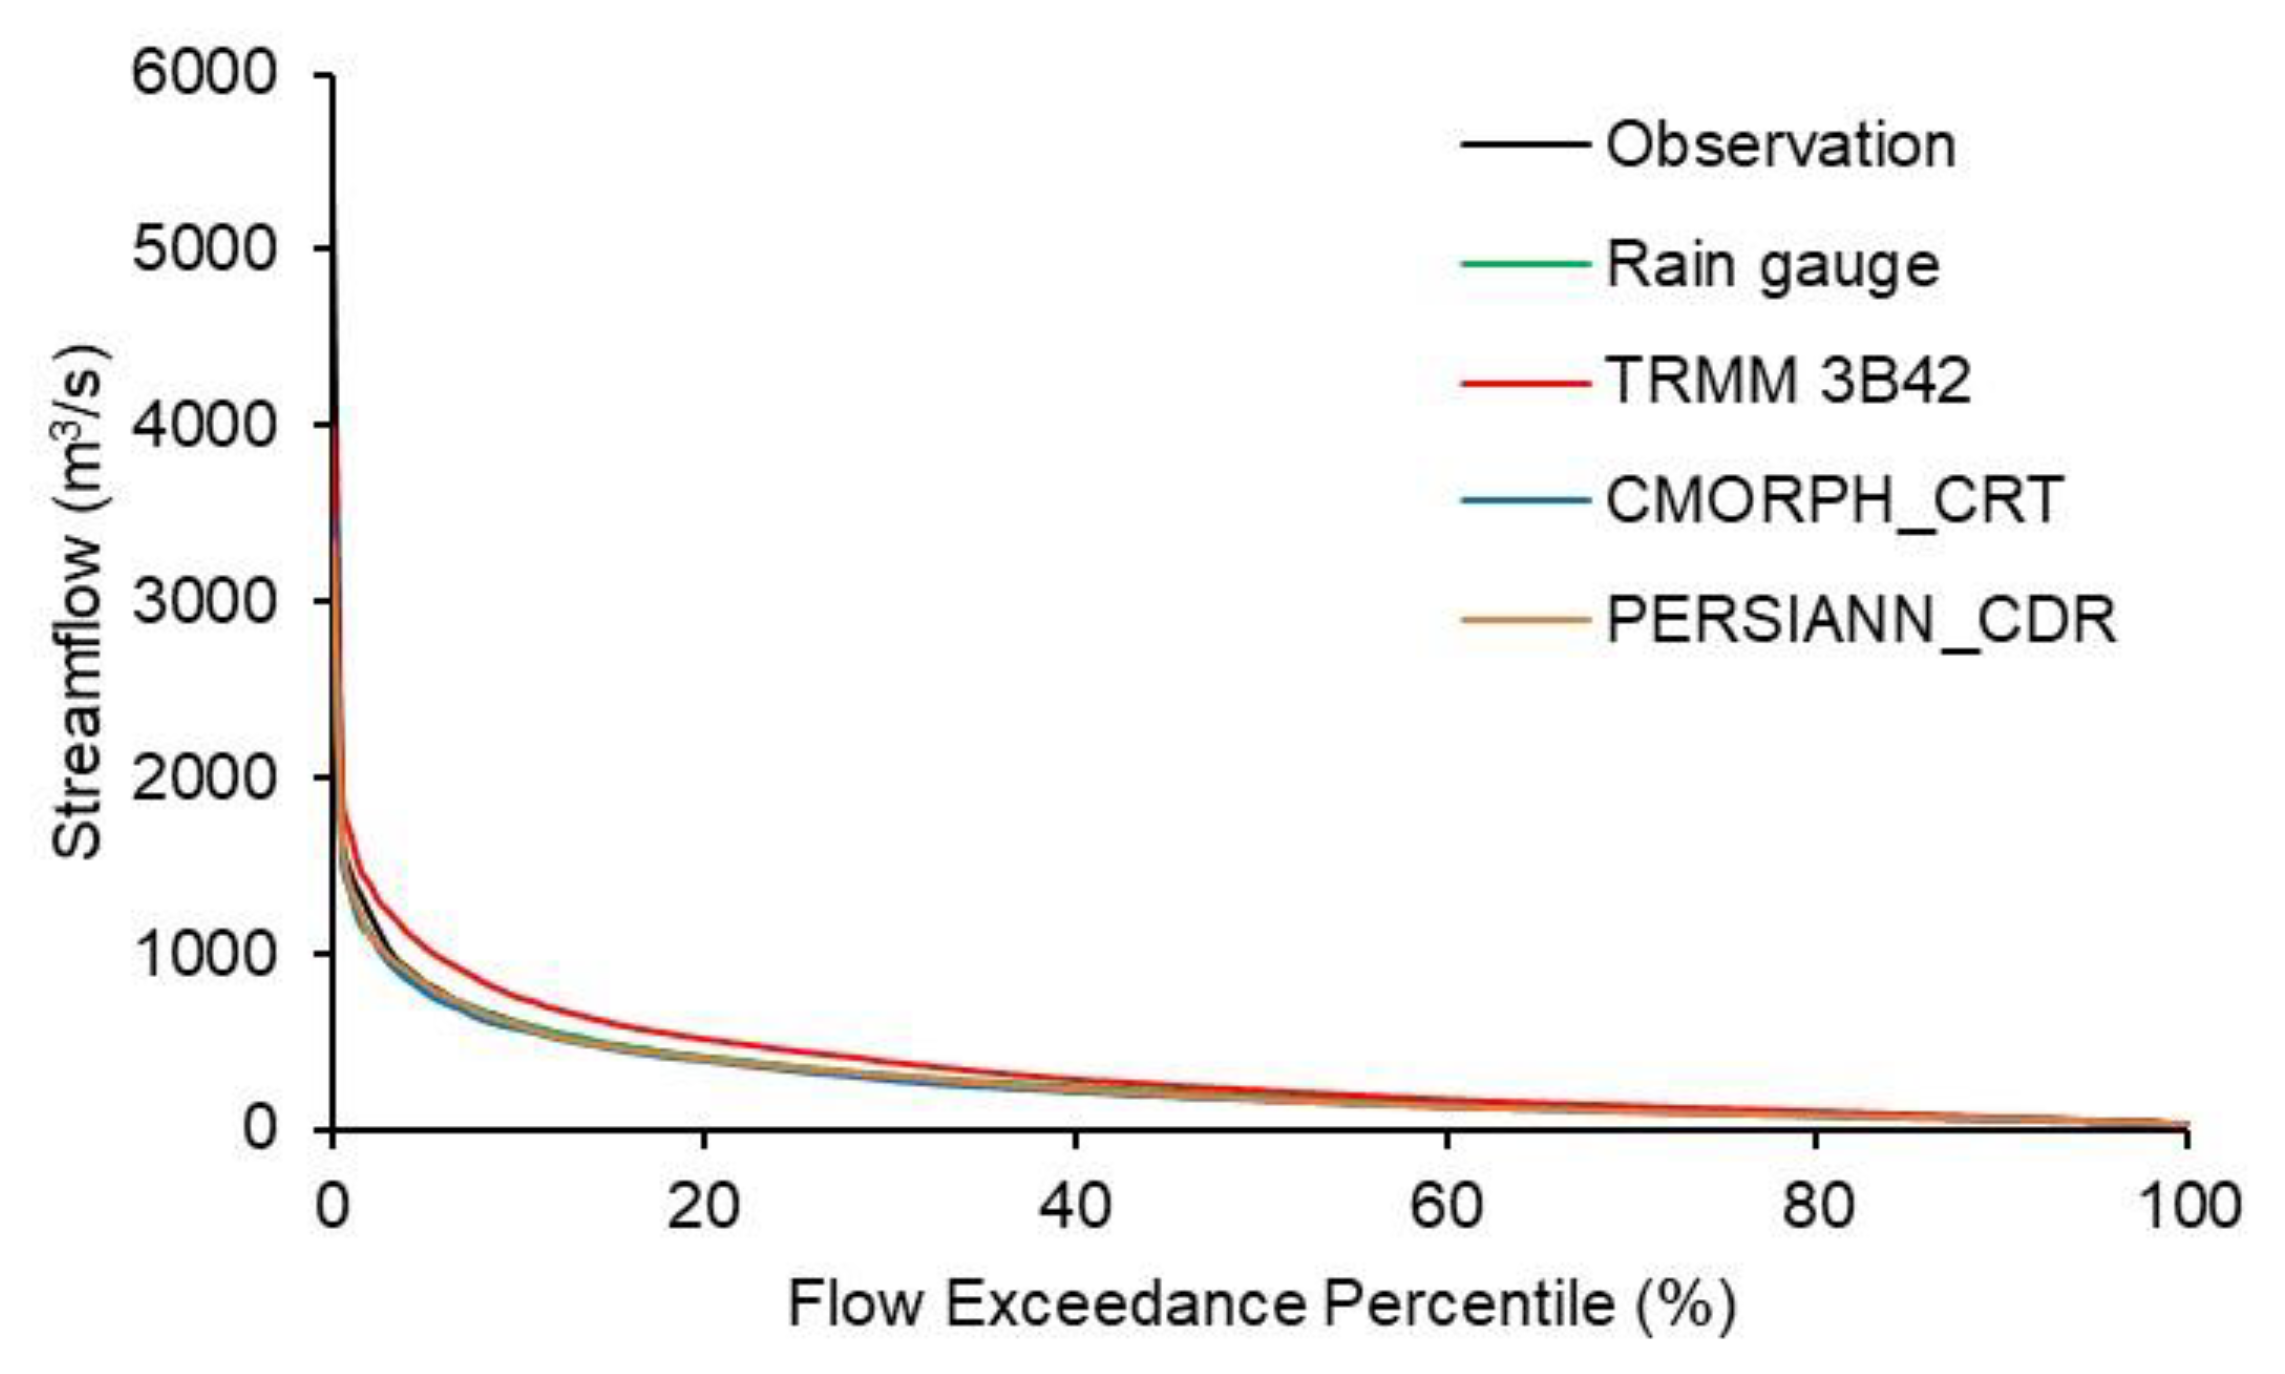
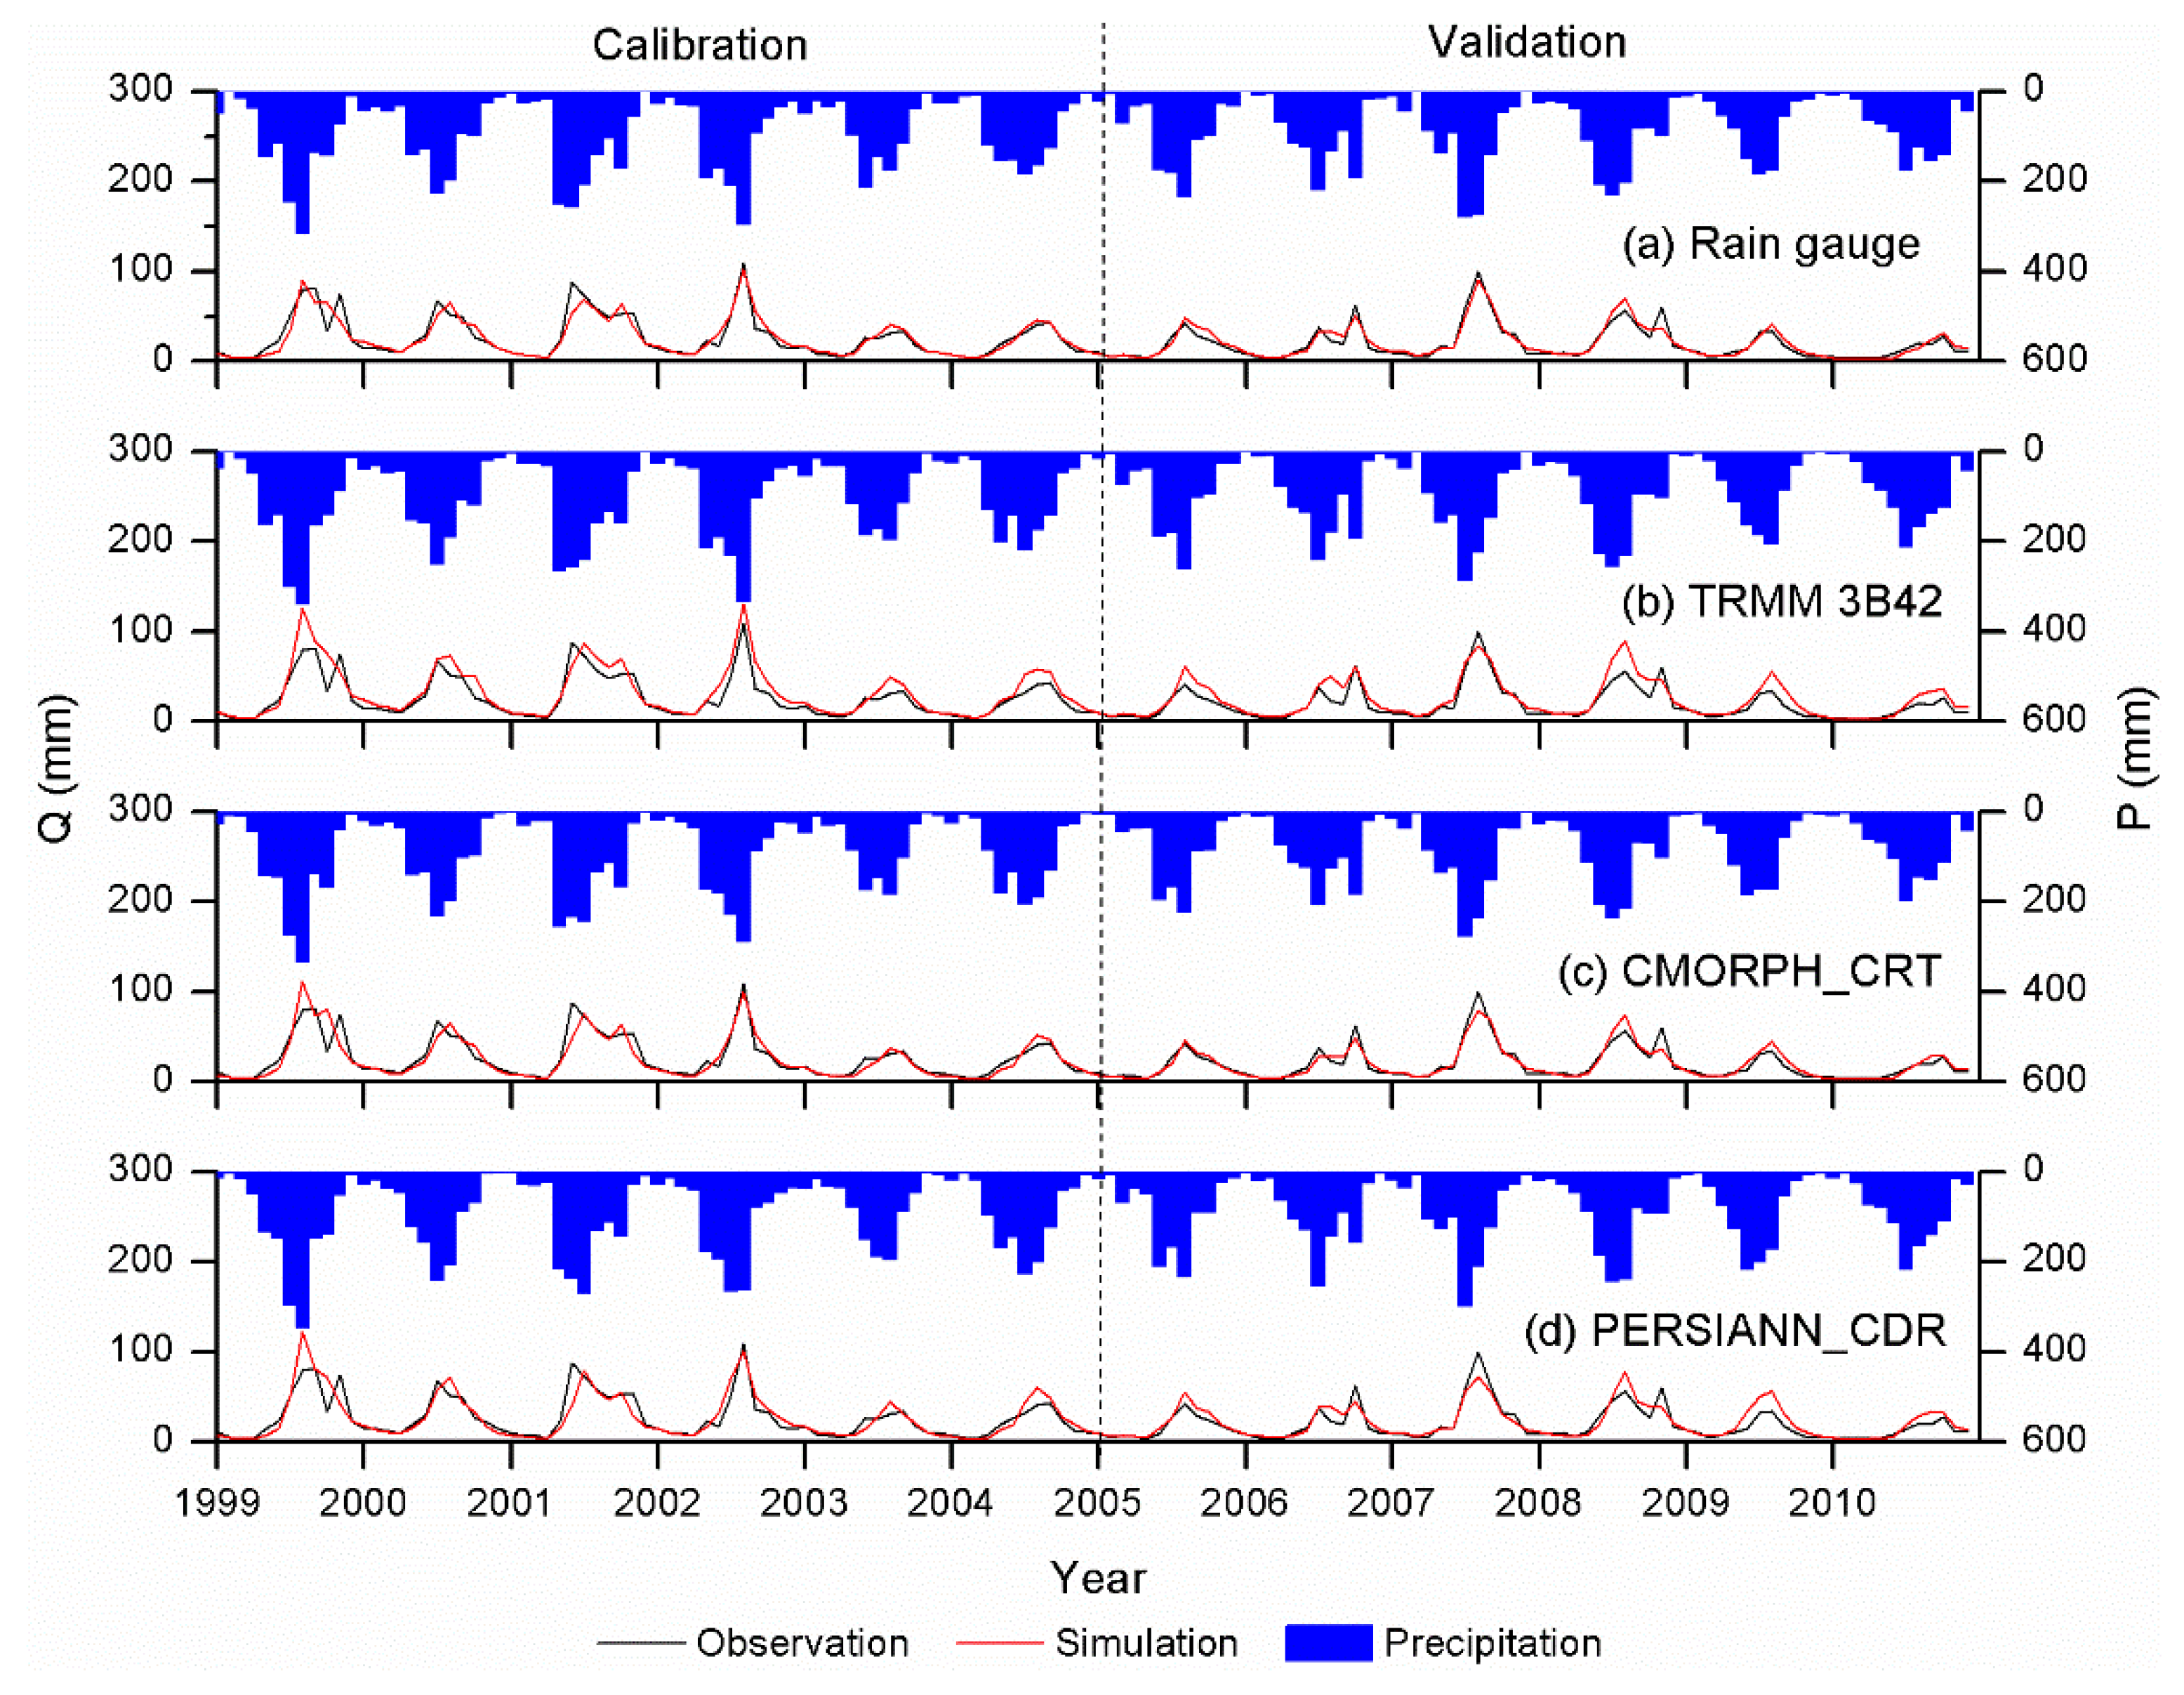
(4) During hydrologic validation under Scenario I (gauge-calibrated parameters), the CMORPH_CRT product had the best consistency with observed streamflow series at both daily (NSE = 0.73) and monthly scales (NSE = 0.82), while TRMM 3B42 showed obvious overestimation (24.2%) for both daily and monthly streamflow simulations. Under Scenario II (individual-calibrated parameters), the performance of the recalibrated models significantly improved (NSE >0.63 for daily, NSE >0.79 for monthly); TRMM 3B42 and CMORPH_CRT performed better than PERSIANN_CDR. All three SPP-forced simulations showed underestimation for high-flow (18.1%–28%) and overestimation for low-flow (18.9–49.4%).
These findings clearly show the great potential for TRMM 3B42 and CMORPH_CRT products in hydrological applications over poorly gauged and inaccessible transboundary river basins in Southwest China, particularly for monthly time intervals, which are suitable for water resource management. However, all three SPPs underestimate and overestimate the occurrence frequency of daily precipitation for some rain intensity classes. Therefore, the local calibration of satellite-derived rainfall estimates and the merging of satellite estimates with rain gauge observations could be employed to alleviate these problems [87,88]. Future work will focus on the validation of higher-resolution SPPs (i.e., GPM), error corrections, spatial downscaling techniques, and their application in distributed hydrological modeling [9,89].

Supplementary Materials

The following are available online at https://www.mdpi.com/2072-4292/10/12/1881/s1, Table S1: precipitation statistics of the upper catchment of the Red River Basin during 1998–2010, Table S2: discharge statistics of the upper catchment of the Red River Basin during 1998–2010.

Author Contributions

Y.L. conceived and designed the study. Y.Z. performed the calculations and assessments. X.J., X.L., and X.L. participated in data processing. Y.Z. wrote the manuscript. All authors contributed to editing and reviewing the manuscript.

Funding

This work was funded by the Applied Basic Research Programs of Yunnan Province (Grant Number 2017FB071) and the National Key Research and Development Program of China (Grant Number 2016YFA0601601).

Acknowledgments

The authors would like to acknowledge the TRMM, CMORPH, and PERSIANN research communities for making the data available to international users. Also, the authors acknowledge the GR model developers for making the suite of lumped GR hydrological models available in an R package. The authors would also like to extend their acknowledgements to the editors and anonymous reviewers for their valuable comments and advice.

Conflicts of Interest

The authors declare no conflict of interest.

References

  1. Hu, Q.; Yang, D.; Wang, Y.; Yang, H. Accuracy and spatio-temporal variation of high resolution satellite rainfall estimate over the Ganjiang River Basin. Sci. China Technol. Sci. 2013, 56, 853–865. [Google Scholar] [CrossRef]
  2. Bai, P.; Liu, X. Evaluation of Five Satellite-Based Precipitation Products in Two Gauge-Scarce Basins on the Tibetan Plateau. Remote Sens. 2018, 10, 1316. [Google Scholar] [CrossRef]
  3. Hou, A.Y.; Kakar, R.K.; Neeck, S.; Azarbarzin, A.A.; Kummerow, C.D.; Kojima, M.; Oki, R.; Nakamura, K.; Iguchi, T. The Global Precipitation Measurement Mission. Bull. Am. Meteorol. Soc. 2014, 95, 701–722. [Google Scholar] [CrossRef] [Green Version]
  4. Ren, P.; Li, J.; Feng, P.; Guo, Y.; Ma, Q. Evaluation of Multiple Satellite Precipitation Products and Their Use in Hydrological Modelling over the Luanhe River Basin, China. Water 2018, 10, 677. [Google Scholar] [CrossRef]
  5. Wang, Z.; Zhong, R.; Lai, C. Evaluation and hydrologic validation of TMPA satellite precipitation product downstream of the Pearl River Basin, China. Hydrol. Process. 2017, 31, 4169–4182. [Google Scholar] [CrossRef]
  6. Boegh, E.; Thorsen, M.; Butts, M.B.; Hansen, S.; Christiansen, J.S.; Abrahamsen, P.; Hasager, C.B.; Jensen, N.O.; Keur, P.V.D.; Refsgaard, J.C. Incorporating remote sensing data in physically based distributed agro-hydrological modelling. J. Hydrol. 2004, 287, 279–299. [Google Scholar] [CrossRef]
  7. Wang, W.; Lu, H.; Zhao, T.; Jiang, L.; Shi, J. Evaluation and Comparison of Daily Rainfall From Latest GPM and TRMM Products over the Mekong River Basin. IEEE J. Sel. Top. Appli. Earth Obs. Remote Sens. 2017, PP, 1–10. [Google Scholar] [CrossRef]
  8. Sun, Q.H.; Miao, C.Y.; Duan, Q.Y.; Ashouri, H.; Sorooshian, S.; Hsu, K.L. A Review of Global Precipitation Data Sets: Data Sources, Estimation, and Intercomparisons. Rev. Geophys. 2018, 56, 79–107. [Google Scholar] [CrossRef] [Green Version]
  9. Wang, Z.; Zhong, R.; Lai, C.; Chen, J. Evaluation of the GPM IMERG satellite-based precipitation products and the hydrological utility. Atmos. Res. 2017, 196, 151–163. [Google Scholar] [CrossRef]
  10. Wu, Z.; Xu, Z.; Wang, F.; He, H.; Zhou, J.; Wu, X.; Liu, Z. Hydrologic Evaluation of Multi-Source Satellite Precipitation Products for the Upper Huaihe River Basin, China. Remote Sens. 2018, 10, 840. [Google Scholar] [CrossRef]
  11. Huffman, G.J.; Adler, R.F.; Arkin, P.; Chang, A.; Ferraro, R.; Gruber, A.; Janowiak, J.; Mcnab, A.; Rudolf, B.; Schneider, U. The Global Precipitation Climatology Project (GPCP) Combined Precipitation Dataset. Bull. Am. Meteorol. Soc. 1997, 78, 5–20. [Google Scholar] [CrossRef] [Green Version]
  12. Ashouri, H.; Hsu, K.-L.; Sorooshian, S.; Braithwaite, D.K.; Knapp, K.R.; Cecil, L.D.; Nelson, B.R.; Prat, O.P. PERSIANN-CDR: Daily Precipitation Climate Data Record from Multisatellite Observations for Hydrological and Climate Studies. Bull. Am. Meteorol. Soc. 2015, 96, 69–83. [Google Scholar] [CrossRef]
  13. Joyce, R.J.; Janowiak, J.E.; Arkin, P.A.; Xie, P. CMORPH: A Method That Produces Global Precipitation Estimates From Passive Microwave and Infrared Data at High Spatial and Temporal Resolution. J. Hydrometeorol. 2004, 5, 287–296. [Google Scholar] [CrossRef]
  14. Huffman, G.J.; Adler, R.F.; Bolvin, D.T.; Gu, G.; Nelkin, E.J.; Bowman, K.P.; Hong, Y.; Stocker, E.F.; Wolff, D.B. The TRMM Multisatellite Precipitation Analysis (TMPA): Quasi-Global, Multiyear, Combined-Sensor Precipitation Estimates at Fine Scales. J. Hydrometeorol. 2007, 8, 38–55. [Google Scholar] [CrossRef]
  15. Beck, H.E.; van Dijk, A.I.J. M.; Levizzani, V.; Schellekens, J.; Miralles, D.G.; Martens, B.; de Roo, A. MSWEP: 3-hourly 0.25° global gridded precipitation (1979–2015) by merging gauge, satellite, and reanalysis data. Hydrol. Earth Syst. Sci. 2017, 21, 589–615. [Google Scholar] [CrossRef] [Green Version]
  16. Yong, B.; Ren, L.-L.; Hong, Y.; Wang, J.-H.; Gourley, J.J.; Jiang, S.-H.; Chen, X.; Wang, W. Hydrologic evaluation of Multisatellite Precipitation Analysis standard precipitation products in basins beyond its inclined latitude band: A case study in Laohahe basin, China. Water Resour. Res. 2010, 46. [Google Scholar] [CrossRef] [Green Version]
  17. Tong, K.; Su, F.; Yang, D.; Hao, Z. Evaluation of satellite precipitation retrievals and their potential utilities in hydrologic modeling over the Tibetan Plateau. J. Hydrol. 2014, 519, 423–437. [Google Scholar] [CrossRef]
  18. Sun, R.; Yuan, H.; Liu, X.; Jiang, X. Evaluation of the latest satellite–gauge precipitation products and their hydrologic applications over the Huaihe River basin. J. Hydrol. 2016, 536, 302–319. [Google Scholar] [CrossRef]
  19. Gao, Z.; Long, D.; Tang, G.; Zeng, C.; Huang, J.; Hong, Y. Assessing the potential of satellite-based precipitation estimates for flood frequency analysis in ungauged or poorly gauged tributaries of China’s Yangtze River basin. J. Hydrol. 2017, 550, 478–496. [Google Scholar] [CrossRef]
  20. Bayissa, Y.; Tadesse, T.; Demisse, G.; Shiferaw, A. Evaluation of Satellite-Based Rainfall Estimates and Application to Monitor Meteorological Drought for the Upper Blue Nile Basin, Ethiopia. Remote Sens. 2017, 9, 669. [Google Scholar] [CrossRef]
  21. Toté, C.; Patricio, D.; Boogaard, H.; van der Wijngaart, R.; Tarnavsky, E.; Funk, C. Evaluation of Satellite Rainfall Estimates for Drought and Flood Monitoring in Mozambique. Remote Sens. 2015, 7, 1758–1776. [Google Scholar] [CrossRef] [Green Version]
  22. Yang, N.; Zhang, K.; Hong, Y.; Zhao, Q.; Huang, Q.; Xu, Y.; Xue, X.; Chen, S. Evaluation of the TRMM multisatellite precipitation analysis and its applicability in supporting reservoir operation and water resources management in Hanjiang basin, China. J. Hydrol. 2017, 549, 313–325. [Google Scholar] [CrossRef]
  23. Awange, J.L.; Gebremichael, M.; Forootan, E.; Wakbulcho, G.; Anyah, R.; Ferreira, V.G.; Alemayehu, T. Characterization of Ethiopian mega hydrogeological regimes using GRACE, TRMM and GLDAS datasets. Adv. Water Resour. 2014, 74, 64–78. [Google Scholar] [CrossRef] [Green Version]
  24. Dinku, T.; Ruiz, F.; Connor, S.J.; Ceccato, P. Validation and Intercomparison of Satellite Rainfall Estimates over Colombia. J. Appl. Meteorol. Climatol. 2010, 49, 1004–1014. [Google Scholar] [CrossRef]
  25. Gebremichael, M.; Bitew, M.M.; Hirpa, F.A.; Tesfay, G.N. Accuracy of satellite rainfall estimates in the Blue Nile Basin: Lowland plain versus highland mountain. Water Resour. Res. 2014, 50, 8775–8790. [Google Scholar] [CrossRef] [Green Version]
  26. Sorooshian, S.; AghaKouchak, A.; Arkin, P.; Eylander, J.; Foufoula-Georgiou, E.; Harmon, R.; Hendrickx, J.M.H.; Imam, B.; Kuligowski, R.; Skahill, B.; et al. Advanced Concepts on Remote Sensing of Precipitation at Multiple Scales. Bull. Am. Meteorol. Soc. 2011, 92, 1353–1357. [Google Scholar] [CrossRef] [Green Version]
  27. Su, J.; Lü, H.; Wang, J.; Sadeghi, A.; Zhu, Y. Evaluating the Applicability of Four Latest Satellite–Gauge Combined Precipitation Estimates for Extreme Precipitation and Streamflow Predictions over the Upper Yellow River Basins in China. Remote Sens. 2017, 9, 1176. [Google Scholar] [CrossRef]
  28. Behrangi, A.; Khakbaz, B.; Jaw, T.C.; Aghakouchak, A.; Hsu, K.; Sorooshian, S. Hydrologic evaluation of satellite precipitation products over a mid-size basin. J. Hydrol. 2011, 397, 225–237. [Google Scholar] [CrossRef]
  29. Miao, C.; Ashouri, H.; Hsu, K.-L.; Sorooshian, S.; Duan, Q. Evaluation of the PERSIANN-CDR Daily Rainfall Estimates in Capturing the Behavior of Extreme Precipitation Events over China. J. Hydrometeorol. 2015, 16, 1387–1396. [Google Scholar] [CrossRef]
  30. Beck, H.E.; Vergopolan, N.; Pan, M.; Levizzani, V.; van Dijk, A.I.J. M.; Weedon, G.P.; Brocca, L.; Pappenberger, F.; Huffman, G.J.; Wood, E.F. Global-scale evaluation of 22 precipitation datasets using gauge observations and hydrological modeling. Hydrol. Earth Syst. Sci. 2017, 21, 6201–6217. [Google Scholar] [CrossRef] [Green Version]
  31. Poméon, T.; Jackisch, D.; Diekkrüger, B. Evaluating the Performance of Remotely Sensed and Reanalysed Precipitation Data over West Africa using HBV light. J. Hydrol. 2017, 547, 222–235. [Google Scholar] [CrossRef]
  32. Kumar, D.; Pandey, A.; Sharma, N.; Flugel, W.A. Evaluation of TRMM-Precipitation with Raingauge Observation Using Hydrological Model J2000. J. Hydrol. Eng. 2015, 115, E5015007. [Google Scholar]
  33. Su, F.; Hong, Y.; Lettenmaier, D.P. Evaluation of TRMM Multisatellite Precipitation Analysis (TMPA) and Its Utility in Hydrologic Prediction in the La Plata Basin. J. Hydrometeorol. 2008, 9, 622–640. [Google Scholar] [CrossRef]
  34. Mantas, V.M.; Liu, Z.; Caro, C.; Pereira, A.J.S. C. Validation of TRMM multi-satellite precipitation analysis (TMPA) products in the Peruvian Andes. Atmos. Res. 2015, 163, 132–145. [Google Scholar] [CrossRef]
  35. Simons, G.; Bastiaanssen, W.; Ngô, L.; Hain, C.; Anderson, M.; Senay, G. Integrating Global Satellite-Derived Data Products as a Pre-Analysis for Hydrological Modelling Studies: A Case Study for the Red River Basin. Remote Sens. 2016, 8, 279. [Google Scholar] [CrossRef]
  36. Wang, W.; Lu, H.; Yang, D.; Sothea, K.; Jiao, Y.; Gao, B.; Peng, X.; Pang, Z. Modelling Hydrologic Processes in the Mekong River Basin Using a Distributed Model Driven by Satellite Precipitation and Rain Gauge Observations. PLoS ONE 2016, 11, e0152229. [Google Scholar] [CrossRef] [PubMed]
  37. Beck, H.E.; Pan, M.; Roy, T.; Weedon, G.P.; Pappenberger, F.; van Dijk, A.I.J. M.; Huffman, G.J.; Adler, R.F.; Wood, E.F. Daily evaluation of 26 precipitation datasets using Stage-IV gauge-radar data for the CONUS. Hydrol. Earth Syst. Sci. Discuss. 2018, 1–23. [Google Scholar] [CrossRef]
  38. Rozante, J.; Vila, D.; Barboza Chiquetto, J.; Fernandes, A.; Souza Alvim, D. Evaluation of TRMM/GPM Blended Daily Products over Brazil. Remote Sens. 2018, 10, 882. [Google Scholar] [CrossRef]
  39. Dezfuli, A.K.; Ichoku, C.M.; Huffman, G.J.; Mohr, K.I.; Selker, J.S.; Nick, V.D.G.; Hochreutener, R.; Annor, F.O. Validation of IMERG Precipitation in Africa. J. Hydrometeorol. 2017, 18. [Google Scholar] [CrossRef]
  40. Sharifi, E.; Steinacker, R.; Saghafian, B. Assessment of GPM-IMERG and Other Precipitation Products against Gauge Data under Different Topographic and Climatic Conditions in Iran: Preliminary Results. Remote Sens. 2016, 8, 135. [Google Scholar] [CrossRef]
  41. Prakash, S.; Mitra, A.K.; Aghakouchak, A.; Liu, Z.; Norouzi, H.; Pai, D.S. A preliminary assessment of GPM-based multi-satellite precipitation estimates over a monsoon dominated region. J. Hydrol. 2016, 556, 865–876. [Google Scholar] [CrossRef]
  42. Anjum, M.N.; Ding, Y.; Shangguan, D.; Ahmad, I.; Ijaz, M.W.; Farid, H.U.; Yagoub, Y.E.; Zaman, M.; Adnan, M. Performance evaluation of latest integrated multi-satellite retrievals for Global Precipitation Measurement (IMERG) over the northern highlands of Pakistan. Atmos. Res. 2018, 205, 134–146. [Google Scholar] [CrossRef]
  43. Tan, M.L.; Santo, H. Comparison of GPM IMERG, TMPA 3B42 and PERSIANN-CDR satellite precipitation products over Malaysia. Atmos. Res. 2018, 202, 63–76. [Google Scholar] [CrossRef]
  44. Tan, M.; Duan, Z. Assessment of GPM and TRMM Precipitation Products over Singapore. Remote Sens. 2017, 9, 720. [Google Scholar] [CrossRef]
  45. Tang, G.; Ma, Y.; Long, D.; Zhong, L.; Hong, Y. Evaluation of GPM Day-1 IMERG and TMPA Version-7 legacy products over Mainland China at multiple spatiotemporal scales. J. Hydrol. 2016, 533, 152–167. [Google Scholar] [CrossRef]
  46. Alazzy, A.A.; Lü, H.; Chen, R.; Ali, A.B.; Zhu, Y.; Su, J. Evaluation of Satellite Precipitation Products and Their Potential Influence on Hydrological Modeling over the Ganzi River Basin of the Tibetan Plateau. Adv. Meteorol. 2017, 2017, 1–23. [Google Scholar] [CrossRef]
  47. Liu, X.; Yang, T.; Hsu, K.; Liu, C.; Sorooshian, S. Evaluating the streamflow simulation capability of PERSIANN-CDR daily rainfall products in two river basins on the Tibetan Plateau. Hydrol. Earth Syst. Sci. 2017, 21, 169–181. [Google Scholar] [CrossRef] [Green Version]
  48. Li, D.; Christakos, G.; Ding, X.; Wu, J. Adequacy of TRMM satellite rainfall data in driving the SWAT modeling of Tiaoxi catchment (Taihu lake basin, China). J. Hydrol. 2018, 556, 1139–1152. [Google Scholar] [CrossRef]
  49. He, Z.; Yang, L.; Tian, F.; Ni, G.; Hou, A.; Lu, H. Intercomparisons of Rainfall Estimates from TRMM and GPM Multisatellite Products over the Upper Mekong River Basin. J. Hydrometeorol. 2017, 18. [Google Scholar] [CrossRef]
  50. Zhu, H.; Li, Y.; Huang, Y.; Li, Y.; Hou, C.; Shi, X. Evaluation and hydrological application of satellite-based precipitation datasets in driving hydrological models over the Huifa river basin in Northeast China. Atmos. Res. 2018, 207, 28–41. [Google Scholar] [CrossRef]
  51. Li, Y.; He, D.; Li, X.; Zhang, Y.; Yang, L. Contributions of Climate Variability and Human Activities to Runoff Changes in the Upper Catchment of the Red River Basin, China. Water 2016, 8, 414. [Google Scholar] [CrossRef]
  52. Le, T.P.Q.; Garnier, J.; Gilles, B.; Sylvain, T.; Minh, C.V. The changing flow regime and sediment load of the Red River, Viet Nam. J. Hydrol. 2007, 334, 199–214. [Google Scholar] [CrossRef]
  53. Le, H.; Sutton, J.; Bui, D.; Bolten, J.; Lakshmi, V. Comparison and Bias Correction of TMPA Precipitation Products over the Lower Part of Red–Thai Binh River Basin of Vietnam. Remote Sens. 2018, 10, 1582. [Google Scholar] [CrossRef]
  54. Dang, T.H.; Coynel, A.; Orange, D.; Blanc, G.; Etcheber, H.; Le, L.A. Long-term monitoring (1960-2008) of the river-sediment transport in the Red River Watershed (Vietnam): Temporal variability and dam-reservoir impact. Sci. Total Environ. 2010, 408, 4654–4664. [Google Scholar] [CrossRef] [PubMed]
  55. Li, Z.; Saito, Y.; Matsumoto, E.; Wang, Y.; Tanabe, S.; Vu, Q.L. Climate change and human impact on the Song Hong (Red River) Delta, Vietnam, during the Holocene. Quat. Int. 2006, 144, 4–28. [Google Scholar] [CrossRef]
  56. Le, T.P.Q.; Seidler, C.; Kändler, M.; Tran, T.B.N. Proposed methods for potential evapotranspiration calculation of the Red River basin (North Vietnam). Hydrol. Process. 2012, 26, 2782–2790. [Google Scholar] [CrossRef]
  57. Allen, R.G.; Pereira, L.S.; Raes, D. Crop Evapotranspiration: Guidelines for Computing Crop Water Requirements; FAO Irrigation and Drainage Paper No. 56; FAO: Rome, Italy, 1998. [Google Scholar]
  58. Thiessen, A.H. Precipitation averages for large areas. Mon. Weather Rev. 1911, 39, 1082–1084. [Google Scholar] [CrossRef]
  59. Huffman, G.J.; Bolvin, D.T. TRMM and Other Data Precipitation Data Set Documentation. Available online: https://pmm.nasa.gov/sites/default/files/document_files/3B42_3B43_doc_V7_180426.pdf (accessed on 10 October 2018).
  60. Duan, Z.; Liu, J.; Tuo, Y.; Chiogna, G.; Disse, M. Evaluation of eight high spatial resolution gridded precipitation products in Adige Basin (Italy) at multiple temporal and spatial scales. Sci. Total Environ. 2016, 573, 1536–1553. [Google Scholar] [CrossRef] [PubMed]
  61. Knapp, K.R. Scientific data stewardship of international satellite cloud climatology project B1 global geostationary observations. J. Appl. Remote Sens. 2008, 2, 023548. [Google Scholar] [CrossRef]
  62. Gautheir, T.D. Detecting Trends Using Spearman’s Rank Correlation Coefficient. Environ. Forensics 2001, 2, 359–362. [Google Scholar] [CrossRef]
  63. Xu, R.; Tian, F.; Yang, L.; Hu, H.; Lu, H.; Hou, A. Ground validation of GPM IMERG and TRMM 3B42V7 rainfall products over southern Tibetan Plateau based on a high-density rain gauge network. J. Geophys. Res. Atmos. 2017, 122, 910–924. [Google Scholar] [CrossRef]
  64. Nash, J.E.; Sutcliffe, J.V. River flow forecasting through conceptual models part I—A discussion of principles. J. Hydrol. 1970, 10, 282–290. [Google Scholar] [CrossRef]
  65. Perrin, C.; Michel, C.; Andréassian, V. A Set of Hydrological Models; John Wiley & Sons, Inc.: Hoboken, NJ, USA, 2013; pp. 493–509. [Google Scholar]
  66. Coron, L.; Thirel, G.; Delaigue, O.; Perrin, C.; Andréassian, V. The suite of lumped GR hydrological models in an R package. Environ. Modell. Softw. 2017, 94, 166–171. [Google Scholar] [CrossRef]
  67. Perrin, C.; Michel, C.; Andréassian, V. Does a large number of parameters enhance model performance? Comparative assessment of common catchment model structures on 429 catchments. J. Hydrol. 2001, 242, 275–301. [Google Scholar] [CrossRef]
  68. Perrin, C.; Michel, C.; Andréassian, V. Improvement of a parsimonious model for streamflow simulation. J. Hydrol. 2003, 279, 275–289. [Google Scholar] [CrossRef]
  69. Mouelhi, S.; Michel, C.; Perrin, C.; Andréassian, V. Stepwise development of a two-parameter monthly water balance model. J. Hydrol. 2006, 318, 200–214. [Google Scholar] [CrossRef]
  70. Okkan, U.; Fistikoglu, O. Evaluating climate change effects on runoff by statistical downscaling and hydrological model GR2M. Theor. Appl. Climatol. 2013, 117, 343–361. [Google Scholar] [CrossRef]
  71. Mouelhi, S.; Madani, K.; Lebdi, F. A Structural Overview through GR(s) Models Characteristics for Better Yearly Runoff Simulation. Open J. Mod. Hydrol. 2013, 03, 179–187. [Google Scholar] [CrossRef]
  72. Jiang, S.; Liu, S.; Ren, L.; Yong, B.; Zhang, L.; Wang, M.; Lu, Y.; He, Y. Hydrologic Evaluation of Six High Resolution Satellite Precipitation Products in Capturing Extreme Precipitation and Streamflow over a Medium-Sized Basin in China. Water 2017, 10, 25. [Google Scholar] [CrossRef]
  73. Li, Y.; He, D.; Ye, C. Spatial and temporal variation of runoff of Red River Basin in Yunnan. J. Geogr. Sci. 2008, 18, 308–318. [Google Scholar] [CrossRef]
  74. Shen, Y.; Xiong, A.; Wang, Y.; Xie, P. Performance of high-resolution satellite precipitation products over China. J. Geophys. Res. Atmos. 2010, 115. [Google Scholar] [CrossRef] [Green Version]
  75. Peng, B.; Shi, J.; Ni-Meister, W.; Zhao, T.; Ji, D. Evaluation of TRMM Multisatellite Precipitation Analysis (TMPA) Products and Their Potential Hydrological Application at an Arid and Semiarid Basin in China. IEEE J. Sel. Top. Appl. Earth Obs. Remote Sens. 2014, 7, 3915–3930. [Google Scholar] [CrossRef]
  76. Michaelides, S.; Levizzani, V.; Anagnostou, E.; Bauer, P.; Kasparis, T.; Lane, J.E. Precipitation: Measurement, remote sensing, climatology and modeling. Atmos. Res. 2009, 94, 512–533. [Google Scholar] [CrossRef]
  77. Li, Z.; Yang, D.; Hong, Y. Multi-scale evaluation of high-resolution multi-sensor blended global precipitation products over the Yangtze River. J. Hydrol. 2013, 500, 157–169. [Google Scholar] [CrossRef]
  78. Jiang, S.; Ren, L.; Hong, Y.; Yong, B.; Yang, X.; Yuan, F.; Ma, M. Comprehensive evaluation of multi-satellite precipitation products with a dense rain gauge network and optimally merging their simulated hydrological flows using the Bayesian model averaging method. J. Hydrol. 2012, 452–453, 213–225. [Google Scholar] [CrossRef]
  79. Yuan, F.; Zhang, L.; Win, K.; Ren, L.; Zhao, C.; Zhu, Y.; Jiang, S.; Liu, Y. Assessment of GPM and TRMM Multi-Satellite Precipitation Products in Streamflow Simulations in a Data-Sparse Mountainous Watershed in Myanmar. Remote Sens. 2017, 9, 302. [Google Scholar] [CrossRef]
  80. Maggioni, V.; Massari, C. On the performance of satellite precipitation products in riverine flood modeling: A review. J. Hydrol. 2018, 558, 214–224. [Google Scholar] [CrossRef]
  81. Bitew, M.M.; Gebremichael, M. Assessment of satellite rainfall products for streamflow simulation in medium watersheds of the Ethiopian highlands. Hydrol. Earth Syst. Sci. 2011, 15, 1147–1155. [Google Scholar] [CrossRef] [Green Version]
  82. Derin, Y.; Yilmaz, K.K. Evaluation of Multiple Satellite-Based Precipitation Products over Complex Topography. J. Hydrometeorol. 2014, 15, 1498–1516. [Google Scholar] [CrossRef] [Green Version]
  83. Gebremicael, T.G.; Mohamed, Y.A.; van der Zaag, P.; Berhe, A.G.; Haile, G.G.; Hagos, E.Y.; Hagos, M.K. Comparison and validation of eight satellite rainfall products over the rugged topography of Tekeze-Atbara Basin at different spatial and temporal scales. Hydrol. Earth Syst. Sci. Discuss. 2017, 1–31. [Google Scholar] [CrossRef] [Green Version]
  84. Mei, Y.; Anagnostou, E.N.; Nikolopoulos, E.I.; Borga, M. Error Analysis of Satellite Precipitation Products in Mountainous Basins. J. Hydrometeorol. 2014, 15, 1778–1793. [Google Scholar] [CrossRef]
  85. Sun, R.; Yuan, H.; Yang, Y. Using multiple satellite-gauge merged precipitation products ensemble for hydrologic uncertainty analysis over the Huaihe River basin. J. Hydrol. 2018, 566, 406–420. [Google Scholar] [CrossRef]
  86. Moriasi, D.N.; Arnold, J.G.; Liew, M.W.V.; Bingner, R.L.; Harmel, R.D.; Veith, T.L. Model Evaluation Guidelines for Systematic Quantification of Accuracy in Watershed Simulations. Trans. Asabe 2007, 50, 885–900. [Google Scholar] [CrossRef]
  87. Cheema, M.J.M.; Bastiaanssen, W.G.M. Local calibration of remotely sensed rainfall from the TRMM satellite for different periods and spatial scales in the Indus Basin. Int. J. Remote Sens. 2012, 33, 2603–2627. [Google Scholar] [CrossRef]
  88. Hashemi, H.; Nordin, M.; Lakshmi, V.; Huffman, G.J.; Knight, R. Bias correction of long-term satellite monthly precipitation product (TRMM 3B43) over the conterminous United States. J. Hydrometeorol. 2017, 18. [Google Scholar] [CrossRef]
  89. Zhang, Y.; Li, Y.; Ji, X.; Luo, X.; Li, X. Fine-Resolution Precipitation Mapping in a Mountainous Watershed: Geostatistical Downscaling of TRMM Products Based on Environmental Variables. Remote Sens. 2018, 10, 119. [Google Scholar] [CrossRef]
Figure 1. Location of the upper catchment of the Red River Basin (URRB) and distribution of meteorological and hydrological stations.
Remotesensing 10 01881 g001
Figure 2. Scatterplots of daily precipitation from TRMM 3B42, CMORPH_CRT, and PERSIANN_CDR against ground observations at the grid scale: the three panels show the results from the whole year (upper panel), dry season (mid panel), and wet season (lower panel). The red line indicates a 1:1 correspondence.
Remotesensing 10 01881 g002
Figure 3. Scatterplots of monthly precipitation from TRMM 3B42, CMORPH_CRT, and PERSIANN_CDR against ground observations at the grid scale: the three panels show the results from the whole year (upper panel), dry season (mid panel), and wet season (lower panel). The red line indicates a 1:1 correspondence.
Remotesensing 10 01881 g003
Figure 4. Box plots of rainfall-detecting skill scores for 25 rain gauges. The upper and lower edges of the large box mark the upper and lower quartiles (75% and 25%, respectively), the small box and the solid line within mark the mean and median value, and the upper and lower horizontal lines out of the large box mark the maximum and minimum, respectively.
Remotesensing 10 01881 g004
Figure 5. Occurrence frequency distribution (bars) of daily precipitation for different rain intensity classes and their relative contributions (lines) to total rainfall amount during 1998–2010.
Remotesensing 10 01881 g005
Figure 6. Simulated (red) and observed (black) daily streamflow under Scenario I from: (a) rain gauge data; (b) TRMM 3B42; (c) CMORPH_CRT; and (d) PERSIANN_CDR. Blue lines show precipitation data.
Remotesensing 10 01881 g006
Figure 7. Daily discharge flow duration curves (FDCs) for observations, rain gauge simulation, TRMM 3B42 simulation, CMORPH_CRT simulation, and PERSIANN_CDR simulation under Scenario I.
Remotesensing 10 01881 g007
Figure 8. Simulated (red) and observed (black) monthly streamflow under Scenario I from: (a) rain gauge data; (b) TRMM 3B42; (c) CMORPH_CRT); and (d) PERSIANN_CDR. Blue bars show precipitation data.
Remotesensing 10 01881 g008
Figure 9. Simulated (red) and observed (black) daily streamflow under Scenario II from: (a) TRMM 3B42; (b) CMORPH_CRT; and (c) PERSIANN_CDR. Blue lines show precipitation data.
Remotesensing 10 01881 g009
Figure 10. Daily discharge flow duration curves (FDCs) for observations, TRMM 3B42 simulation, CMORPH_CRT simulation, and PERSIANN_CDR simulation under Scenario II.
Remotesensing 10 01881 g010
Figure 11. Simulated (red) and observed (black) monthly streamflow under Scenario II from: (a) TRMM 3B42; (b) CMORPH_CRT; and (c) PERSIANN_CDR. Blue bars show precipitation data.
Remotesensing 10 01881 g011
Table 1. Indices used to evaluate the performance of satellite precipitation estimates. CC: correlation coefficient, RMSE: root mean squared error, MAE: mean absolute error, Bias: relative bias, POD: probability of detection, FOH: frequency of hit, FAR: false alarm ratio, CSI: critical success index, HSS: Heidke skill score, NSE: Nash–Sutcliffe efficiency coefficient.
Statistical MetricUnitEquationRangePerfect ValueReference
CC- CC = 1 6 i = 1 n [ X ( i ) Y ( i ) ] 2 n ( n 2 1 ) −1 to 11[62]
RMSEmm RMSE = i = 1 n ( S i G i ) 2 n 0   to   0[16]
MAEmm MAE = i = 1 n | S i G i | n 0   to   0[16]
Bias% Bias = i = 1 n ( S i G i ) i = 1 n G i × 100 %   to   0[16]
POD- POD = N 11 N 11 + N 01 0 to 11[63]
FOH- FOH = N 11 N 11 + N 10 0 to 11[63]
FAR- FAR = N 10 N 11 + N 10 0 to 10[63]
CSI- CSI = N 11 N 11 + N 01 + N 10 0 to 11[63]
HSS- HSS = 2 ( N 11 N 00 N 10 N 01 ) ( N 11 + N 01 ) ( N 01 + N 00 ) + ( N 11 + N 10 ) ( N 10 + N 00 ) 0 to 11[63]
NSE- NSE = 1 i = 1 n ( Q o i Q s i ) 2 i = 1 n ( Q o i Q o ¯ ) 2   to   1 1[64]
Notation: n, number of samples; S i , satellite precipitation; G i , gauged observation;   X ( i ) = rank [ S ( i ) ] ; Y ( i ) = rank [ G ( i ) ] ; Q s i , simulated streamflow; Q o i , observed streamflow; Q o ¯ , observed mean streamflow. N 11 , Satellite is > 0 and gauge is > 0; N 10 , Satellite is > 0 and gauge equals 0; N 01 , Satellite equals 0 and gauge is > 0; N 00 , Satellite equals 0 and gauge equals 0.
Table 2. Median values and approximate 80% confidence intervals of four model parameters.
ParameterMedian Value80% Confidence Interval
x1: maximum capacity of the production store (mm)350100–1200
x2: groundwater exchange coefficient (mm)0−5 to 3
x3: maximum capacity of the routing store (mm)9020–300
x4: time base of unit hydrograph UH1 (days)1.71.1–2.9
Table 3. Calibrated parameter values in the GR4J model for different precipitation data inputs.
ParameterRain GaugeTRMM 3B42CMORPH_CRT PERSIANN_CDR
x11200173716671998
x20.770.350.921.09
x325372335
x42.252.453.123.42
Table 4. Statistical indices between three satellite-based precipitation products (SPPs) and rain gauge data at the basin scale.
Basin ScaleDailyMonthly
CCRMSEMAECCRMSEMAEBias
Whole yearTRMM 3B420.8211.31.70.9917.112.09.6%
CMORPH_CRT0.7523.42.30.9814.210.2−0.9%
PERSIANN_CDR0.6634.12.90.9721.115.12.2%
Dry seasonTRMM 3B420.572.70.70.966.24.64.8%
CMORPH_CRT0.494.70.80.9010.37.0−16.6%
PERSIANN_CDR0.426.81.10.8310.68.0−6.2%
Wet seasonTRMM 3B420.8119.82.70.9623.419.310.4%
CMORPH_CRT0.6641.83.80.9717.313.42.0%
PERSIANN_CDR0.5260.94.60.9327.922.23.8%
Table 5. Comparison of daily and monthly observed and simulated streamflow under Scenario I.
Precipitation ProductDailyMonthly
NSECCBias (%)NSECCBias (%)
Rain gauge0.820.920.60.870.961.8
TRMM 3B420.620.9324.20.720.9724.2
CMORPH_CRT0.730.92−7.50.820.96−0.9
PERSIANN_CDR0.530.88−2.90.760.945.5
Table 6. Comparison of daily and monthly observed and simulated streamflow under Scenario II.
Precipitation ProductsDailyMonthly
NSECCBias (%)NSECCBias (%)
TRMM 3B420.760.92−0.80.860.970.8
CMORPH_CRT0.770.923.10.830.963.6
PERSIANN_CDR0.630.883.40.790.945.5
Table 7. Comparison of daily high-flow and low-flow simulations using four precipitation inputs against observations.
Precipitation ProductHigh flowLow flow
NSECCBias (%)NSECCBias (%)
Rain gauge0.500.67 −11.6−0.060.79 15.9
TRMM 3B420.310.65 −19.1−0.170.79 18.9
CMORPH_CRT0.360.68 −18.1−0.910.77 35.3
PERSIANN_CDR−0.060.52 −28.0−2.150.69 49.4

