Article

Multi-Variable Classification Approach for the Detection of Lightning Activity Using a Low-Cost and Portable X Band Radar

by
Vincenzo Capozzi
1,2,3,
Mario Montopoli
2,3,*,
Vincenzo Mazzarella
1,3,
Anna Cinzia Marra
2,
Nicoletta Roberto
2,
Giulia Panegrossi
2,
Stefano Dietrich
2 and
Giorgio Budillon
1
1
Department of Science and Technology, University of Naples “Parthenope”, Centro Direzionale di Napoli, 80143 Napoli, Italy
2
Institute of Atmospheric Sciences and Climate, National Research Council, 00133 Rome, Italy
3
Centre of Excellence CETEMPS, University of L’Aquila, 67100 L’Aquila, Italy
*
Author to whom correspondence should be addressed.
Remote Sens. 2018, 10(11), 1797; https://doi.org/10.3390/rs10111797
Submission received: 1 October 2018 / Revised: 30 October 2018 / Accepted: 8 November 2018 / Published: 13 November 2018
(This article belongs to the Section Atmospheric Remote Sensing)

Abstract

:
This work proposes a multi-parameter method for the detection of cloud-to-ground stroke rate (SRCG) associated to convective cells, based on the measurements of a low-cost single-polarization X-band weather radar. To train and test our procedure, we built up a multi-year dataset, collecting 1575 radar reflectivity volumes that were acquired in the pilot study area of Naples metropolitan environment matched with the LIghtning NETwork (LINET) strokes and meteorological in-situ data. Three radar-based variables are extracted simultaneously for each rain cell and properly merged together, using “ad hoc” classification methods, to produce an estimation of the expected lightning activity for each rain cell. These variables, proxies of mixed-phase particles and ice amount into a convective cell, are combined into a single label to cluster the SRCG into two categories: SRCG = 0 (no production of strokes) or SRCG > 0 (stroke production), respectively. Overall, the main results are comparable with those that were obtained from more advanced radar systems, showing a Critical Success Index of 0.53, an Equitable Threat Score of 0.34, a Frequency Bias Index of 1.00, a Heidke Skill Score of 0.42, a Hanssen-Kuiper Skill Score of 0.42, and an area under the curve of probability of detection as a function of false alarm rate (usually referred as ROC curve) equal to 0.78. The developed technique, although with some limitations, outperforms those based on the use of single stroke proxy parameters.

Graphical Abstract

1. Introduction

Cloud-to-ground (CG) strokes are a natural hazard having a large impact on human activities. They involve, in fact, very strong electrical currents (up to dozen of kAmperes), and, for this reason, they constitute a serious threat for human safety as well, as they may adversely affect industrial productions, transport activities (especially the air traffic routing) and power lines [1,2].
The information about the spatial and temporal occurrence of CG strokes is typically provided by in situ ground-based electromagnetic stroke detection systems, which perform direct measurements through extremely-low (ELF) to very-low (VLF) frequency and very-high (VHF) to extremely-high (EHF) frequency sensors. According to [3,4], the ground-based lightning network systems are able to detect CG stroke discharges with a spatial resolution as high as up to 100 m and with a detection efficiency up to 95%, although these performances depend on the network density and the type of sensors.
The real-time surveillance of stroke occurrence can also rely on weather radar measurements, which are able to track and characterize the three-dimensional (3D) structure of rain cells, thus allowing for identifying the developing cycle of cells and the areas much prone to stroke activity, even before the occurrence of the first lightning event (e.g., [5]). Therefore, the set-up of a reliable, affordable, and accessible radar-based stroke detection system, complementary to traditional ground-based stroke networks, can be very useful for risk prevention and for safety of human life, goods and services. In addition, a stand-alone radar-based stroke detection system could cover those areas where data from lightning networks are not freely accessible or where their detection efficiency levels are not constant over large domains, due to the irregular distribution of lightning sensors.
This work is aimed at proposing a new algorithm for the radar-based detection of stroke activity based on a multi-variable approach.
To explain our approach, it is useful to briefly summarize the atmosphere electrification mechanisms and the radar-based approaches so far proposed in the state of the art literature. Electrification mechanisms in thunderstorms are explained following the widely accepted Non-Inductive Charging (NIC) theory, whose evidences have been supported by many laboratory studies, as well as by field campaigns (e.g., [6,7]). According to NIC theory, the most efficient conditions for charge separation within the updraft of a thunderstorm occur during the collision between graupel and ice crystals [8]. This mechanism takes place in the mixed-phase cloud region, which consists of a proper mix of supercooled liquid droplets, ice crystals, and water vapor [9].
Dual polarization radars have demonstrated, to some extent, to be able to segment a precipitating cloud, allowing for the separation of the mixed-phase regimes from the rest (e.g., [10,11]). In this respect, some previous works have highlighted a correlation between dual polarization radar variables and microphysical processes of stroke initialization [12,13,14,15,16,17,18]. However, most of the local weather services cannot afford dual polarization technology, and, on top of this, the increasing diffusion of small networks of single polarization X band radars for urban and small catchment monitoring is a demonstration of a constant interest toward these systems and the related applications [19].
The measurements that are provided by single polarization weather radars, although with some well-known limitations, can still provide some exploitable information for the hydrometeor detection in the mixed-phase region of a thunderstorm. In this respect, several studies [20,21,22,23,24] have found links between the presence of graupel at different environmental levels and the occurrence of a strong reflectivity core. These relationships have been synthetized into a radar-based stroke forecast criterion, named Isothermal Reflectivity Threshold (IRT), which is based on the occurrence of a determined reflectivity core (Z), usually 30 dBZ or 40 dBZ, at a certain environmental height typically represented by the level of −10 °C, −15 °C or −20 °C isotherms (T). The performance of the IRT method has been extensively evaluated [25,26,27,28,29,30,31,32,33,34,35], especially in the USA, after the introduction of the WSR-88D radar network. As a general result, these studies show that CG strokes occur within a time ranging from 4 to 45 min after the presence of certain reflectivity cores (ranging from 10 dBZ to 40 dBZ) at isothermal heights varying between 0 °C and −20 °C.
The existing literature has also proposed also other radar-derived parameters for the stroke forecast, such as the Vertically Integrated Liquid (VIL) and the Vertically Integrated Ice (VII). The VIL product, introduced in [36], is an estimate of the liquid water mass content (excluding ice) along the convective column. Weather forecasters have traditionally used VIL to discriminate between weak and severe storms; the use of VIL for stroke prediction has been proposed for the first time in [37], for a storm that occurred in Oklahoma in June 1993. Another attempt to use VIL for stroke forecast has been performed in [38], for a dataset including 120 cells. The results of these two studies highlighted a low correlation degree between VIL and CG stroke occurrence. The VII product has been proposed in [14] to improve the low correlation with respect to the stroke activity that was found using VIL alone. VII provides a quantitative estimation of the amount of ice between the −10 °C and −40 °C isothermal levels. VII tool has been tested for stroke forecast purposes in [30,31]. Other approaches discussed in previous literature are the Differential Isothermal Height (DIH) and the “Larsen Area” (LA). The former has been defined in [39] as the difference between the height achieved by a given reflectivity core and a certain isothermal level. This difference can be considered as a proxy for the electric field development and the subsequent stroke discharge. The LA, in its original definition, introduced in [21], corresponds to a nearly horizontal area occupied by reflectivity echoes greater than 43 dBZ above 7 km height. In [5], some simple storm attributes, such as the maximum reflectivity value observed in the storm cell area, the maximum height reached by a determined reflectivity core within a cell and the storm area, have been evaluated as predictors of CG stroke occurrence. In [18], the relationship between ice water content of graupel (IWCg) and CG stroke activity has been investigated for eleven convective events. Finally, some radar-derived variables, such as the maximum reflectivity value, the reflectivity observed at the level of −10 °C isotherm, and the VIL product, have been merged with attributes from ground-based lightning network (i.e., the lightning density and the ideal lightning density) in a multi-sensors algorithm for CG stroke prediction [40]. Such algorithm has been included in the Multi-Radar Multi-Sensor (MRMS) system, developed at the National Severe Storms Laboratory and the University of Okhlahoma [41].
A summary of the results that were achieved by previous works focused on radar-based stroke prediction is summarized in Table 1, in terms of some standard statistical scores, such as the Probability of Detection (POD), the False Alarm Rate (FAR), and the Critical Success Index (CSI). Most of these studies use single-polarization reflectivity measurements collected by S-band or C-band weather radars and evaluate, from a quantitative perspective, only the IRT and VII methods. To our knowledge, dual polarization capability has been used for stroke detection applications only in few studies [5,18,34,35]. Such works have explored the usefulness of some common dual polarization moments (e.g., differential reflectivity, cross-correlation coefficient, specific differential phase, as well as traditional horizontal reflectivity measure), in stroke initiation forecasting. Moreover, the four variables just mentioned have been used in [5,18,32] as input to fuzzy logic systems, such as the Hydrometeor Classification Algorithm (HCA) and the Particle IDentification (PID), designed to detect the first occurrence of the hydrometeors that usually participate in electrification processes (e.g., graupel, hail and supercooled raindrops). From Table 1, it is worth highlighting that the number of rain cells analyzed in previous works is extremely variable (from 20 to 123,360), suggesting that the statistical robustness of the dataset used, especially in terms of the representativeness of the thunderstorm climatology, needs to be taken into account when quantitatively comparing results from different studies. Moreover, it is important specifying that Table 1 uniquely lists the radar-only self-consistent approaches, i.e., it does not include the multi-sensors algorithms, which cannot be directly compared to the algorithm proposed in this study.
The goal of this work is to develop a multi-parametric radar-based algorithm for the detection of CG stroke rate (i.e., the number of strokes per minute, hereafter indicated as SRCG) associated to convective cells, using single-polarization X-band weather radar measurements. The proposed methodology has been trained and tested in the pilot study area of Naples metropolitan environment, located in southern Italy, using a dataset including 1575 radar volumes, stroke observations provided by LIghtning NETwork (LINET) [42], and in-situ meteorological data.
The main novelties and strengths of this study can be synthetized in the following key-points:
  • for the first time, a multi-parameter approach for SRCG detection, based on different radar-based proxy parameters, has been developed (all previous approaches are based on single parameter, as shown in Table 1);
  • the proposed algorithm relies on the reflectivity measurements of a low-cost and portable single-polarization X-band weather radar. The latter, as demonstrated in [43,44], may exhibit acceptable performance at short ranges (i.e., below 80 km) when compared to conventional systems (the S and C-band systems), but with the advantage of more affordable costs in terms of infrastructure, power requirements and maintenance. In this respect, our work fits a research path that in recent years has been devoted to exploit the potential usefulness of low-cost X-band radars in weather surveillance, especially at urban scale (e.g., [43,45,46,47,48]);
  • the radar-based predictors evaluated in this study include the DIH and LA methods, that have been both scarcely tested in previous works;
  • the performance of the stroke detection criteria is assessed through a complete metric that includes some statistical scores scarcely or never used in similar studies, providing a robust and fair evaluation of algorithm skills; and,
  • the dataset used in this study has a reasonable size, including a total of 5754 convective cells, it is well populated, involving a great variety of meteorological scenarios, and it is fairly balanced (i.e., both stroke and non-stroke producing rain cells are reasonably represented in the dataset).
The paper is organized, as follows. Section 2 presents both radar and stroke measurements, giving some information also about the target area. Section 3 provides an overview of the investigated radar-based stroke predicting variables. The algorithm used for the identification of convective cells and the stroke detection methodologies are described in Section 4. The criteria used to select the optimal radar-based stroke predicting variables and the training of the algorithm designed for the clustering detection of stroke activity are presented in Section 5. The results are discussed in Section 6, in terms of score indexes. Finally, the conclusions are drawn in Section 7.

2. Experimental Measurements

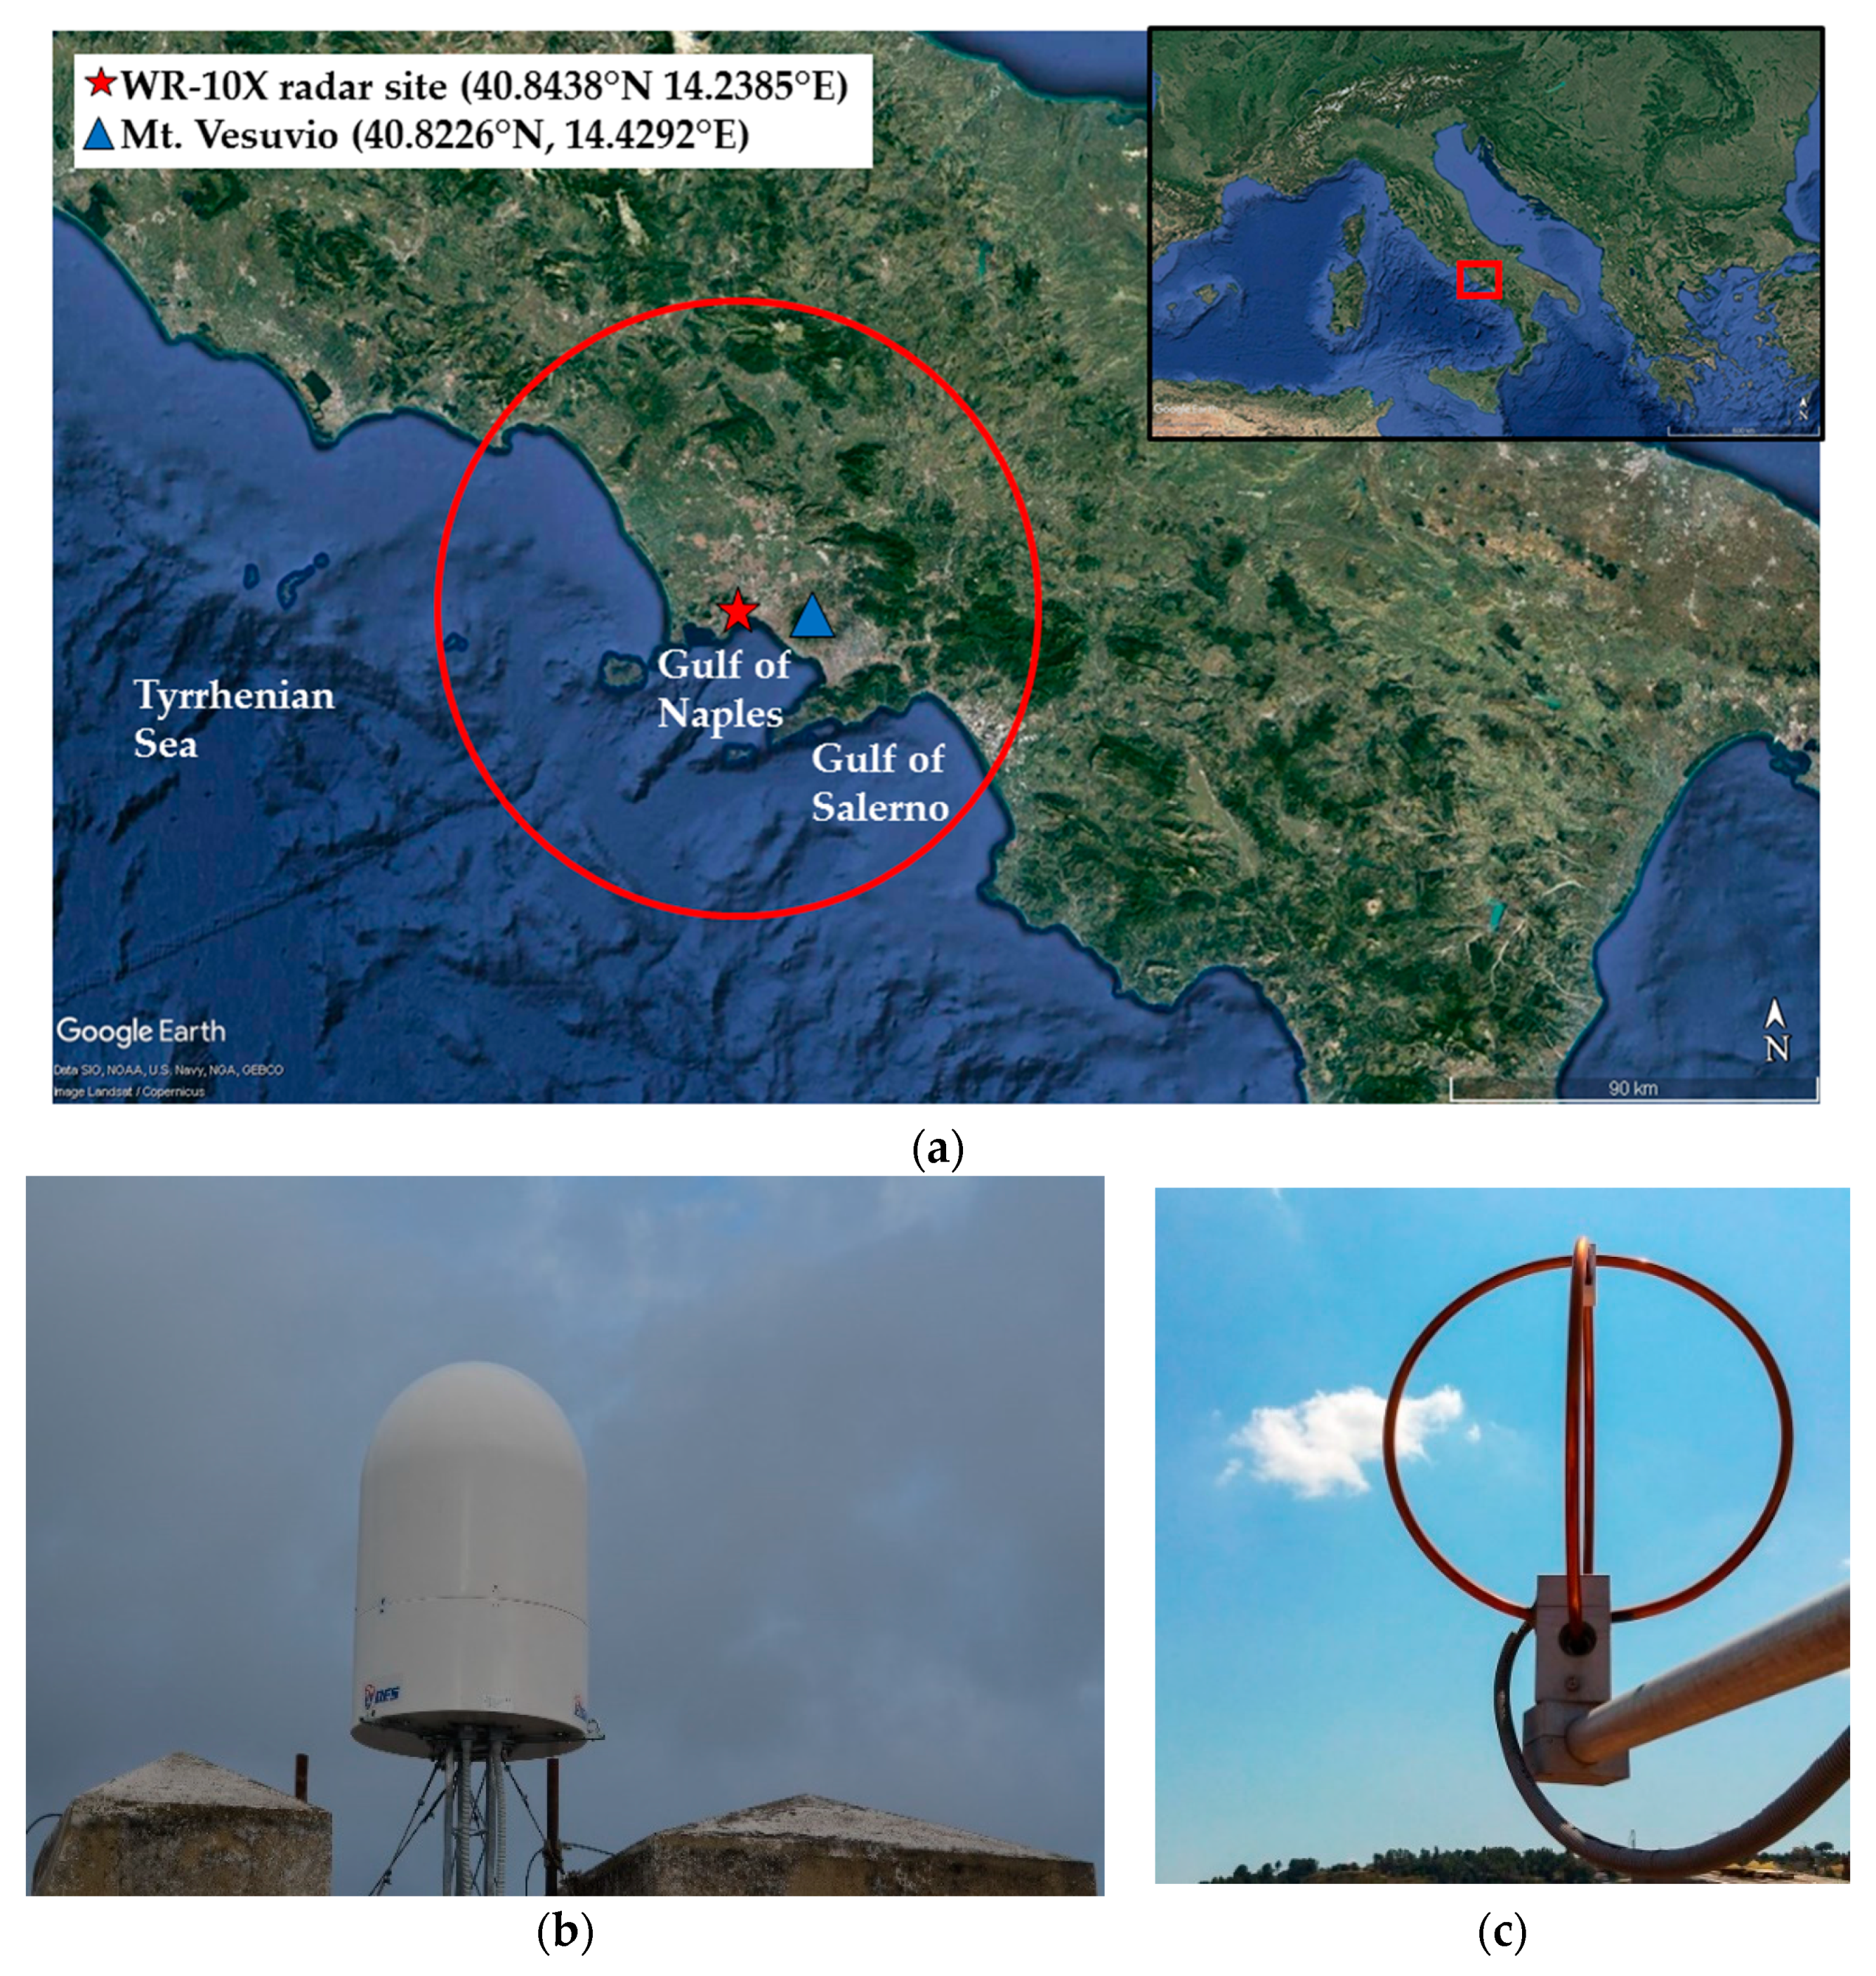
The area investigated in this study, shown in Figure 1a, is the one covered by the X-band weather radar system operating in Naples urban area, in southern Italy. The target region encompasses the western side of Campania region, extending from 40.1893°N to 41.4975°N and from 13.4005°E to 15.0939°E. Such an area is characterized by heterogeneous geographical features: it includes, in fact, the western and the meridional side of Campania Apennines reliefs (Matese, Taburno, and Partenio), which have altitudes ranging between 1400 m and 2000 m, the plain of Caserta, the coastal sector of Naples and Caserta Provinces and the Gulf of Salerno. As highlighted in [44,45], thunderstorm development in the study area might be triggered either by synoptic and small-scale mechanisms or by local interactions between them.
The dataset used to train and test the proposed methodology includes X-band reflectivity volumes, ground-based stroke measurements and in situ-meteorological data collected into 48 different thunderstorm days, occurred between April 2012 and March 2016. These case studies have been carefully selected, in order to take into account periods of strong lightning activity as well as convective events characterized by low atmospheric electrification. Moreover, the selection criteria have been also defined according to some issues that are related to the radar scanning geometry, as better described in the next paragraph.

2.1. X Band Radar Measurements

The radar system that is involved in this study, named WR-10X, is a single-polarization X-band weather radar, manufactured by ELDES srl. The main strengths of WR-10X lie in its reduced size (90–130 cm2) and weight (about 100 kg), as well as in the low electric power consumption (about 300 W), which simplifies the installation facilities, especially in urban contexts. A prototype of this radar system has been installed, at the end of 2011, in Naples metropolitan area (Figure 1b) by the Campania Center for Marine and Atmospheric Monitoring and Modelling (CCMMMA) of the University of Naples “Parthenope”. The WR-10X operating in Naples urban area provides a complete data volume every 10 min. Such temporal sampling, which is used by most weather agencies in Europe, is a compromise among technical reasons (antenna rotation velocity), scan strategy (number of antenna elevations included in the volume scan), and opportunity to observe rapidly evolving events and data processing. More specifically, the reflectivity data are collected in the first two minutes of a WR-10X scan which include six different elevation angles (ranging from 1.0° to 10.0° with respect to horizon), whereas the remaining eight minutes are dedicated to the data processing and to the product generation. Other technical features of WR-10X weather radar are listed in Table 2.
According to the Volume Coverage Pattern (VCP) that is used by WR-10X in operational mode, the thunderstorm events that partially extended over areas closer than 15 km (i.e., over the cone of silence) have been discarded, since the radar may be not able to properly observe the highest portion of convective cells. Moreover, other potential biases in the characterization of thunderstorm vertical structure may arise due to the following issues: (i) the presence of the Volcano Vesuvio (40.8226°N, 14.4292°E), which can totally block the propagation at the three lowest antenna elevation angles (namely at 1°, 2°, and 3°) of WR-10X beam in the southeastern portion of the study area; (ii) the relatively broad beam width (<3° at 3 dB), which may adversely affect the sampling of convective clouds at great distances from the radar site; (iii) residual path attenuation, that in some cases can fade the radar signal compromising quantitative retrievals; and, (iv) radar calibration.
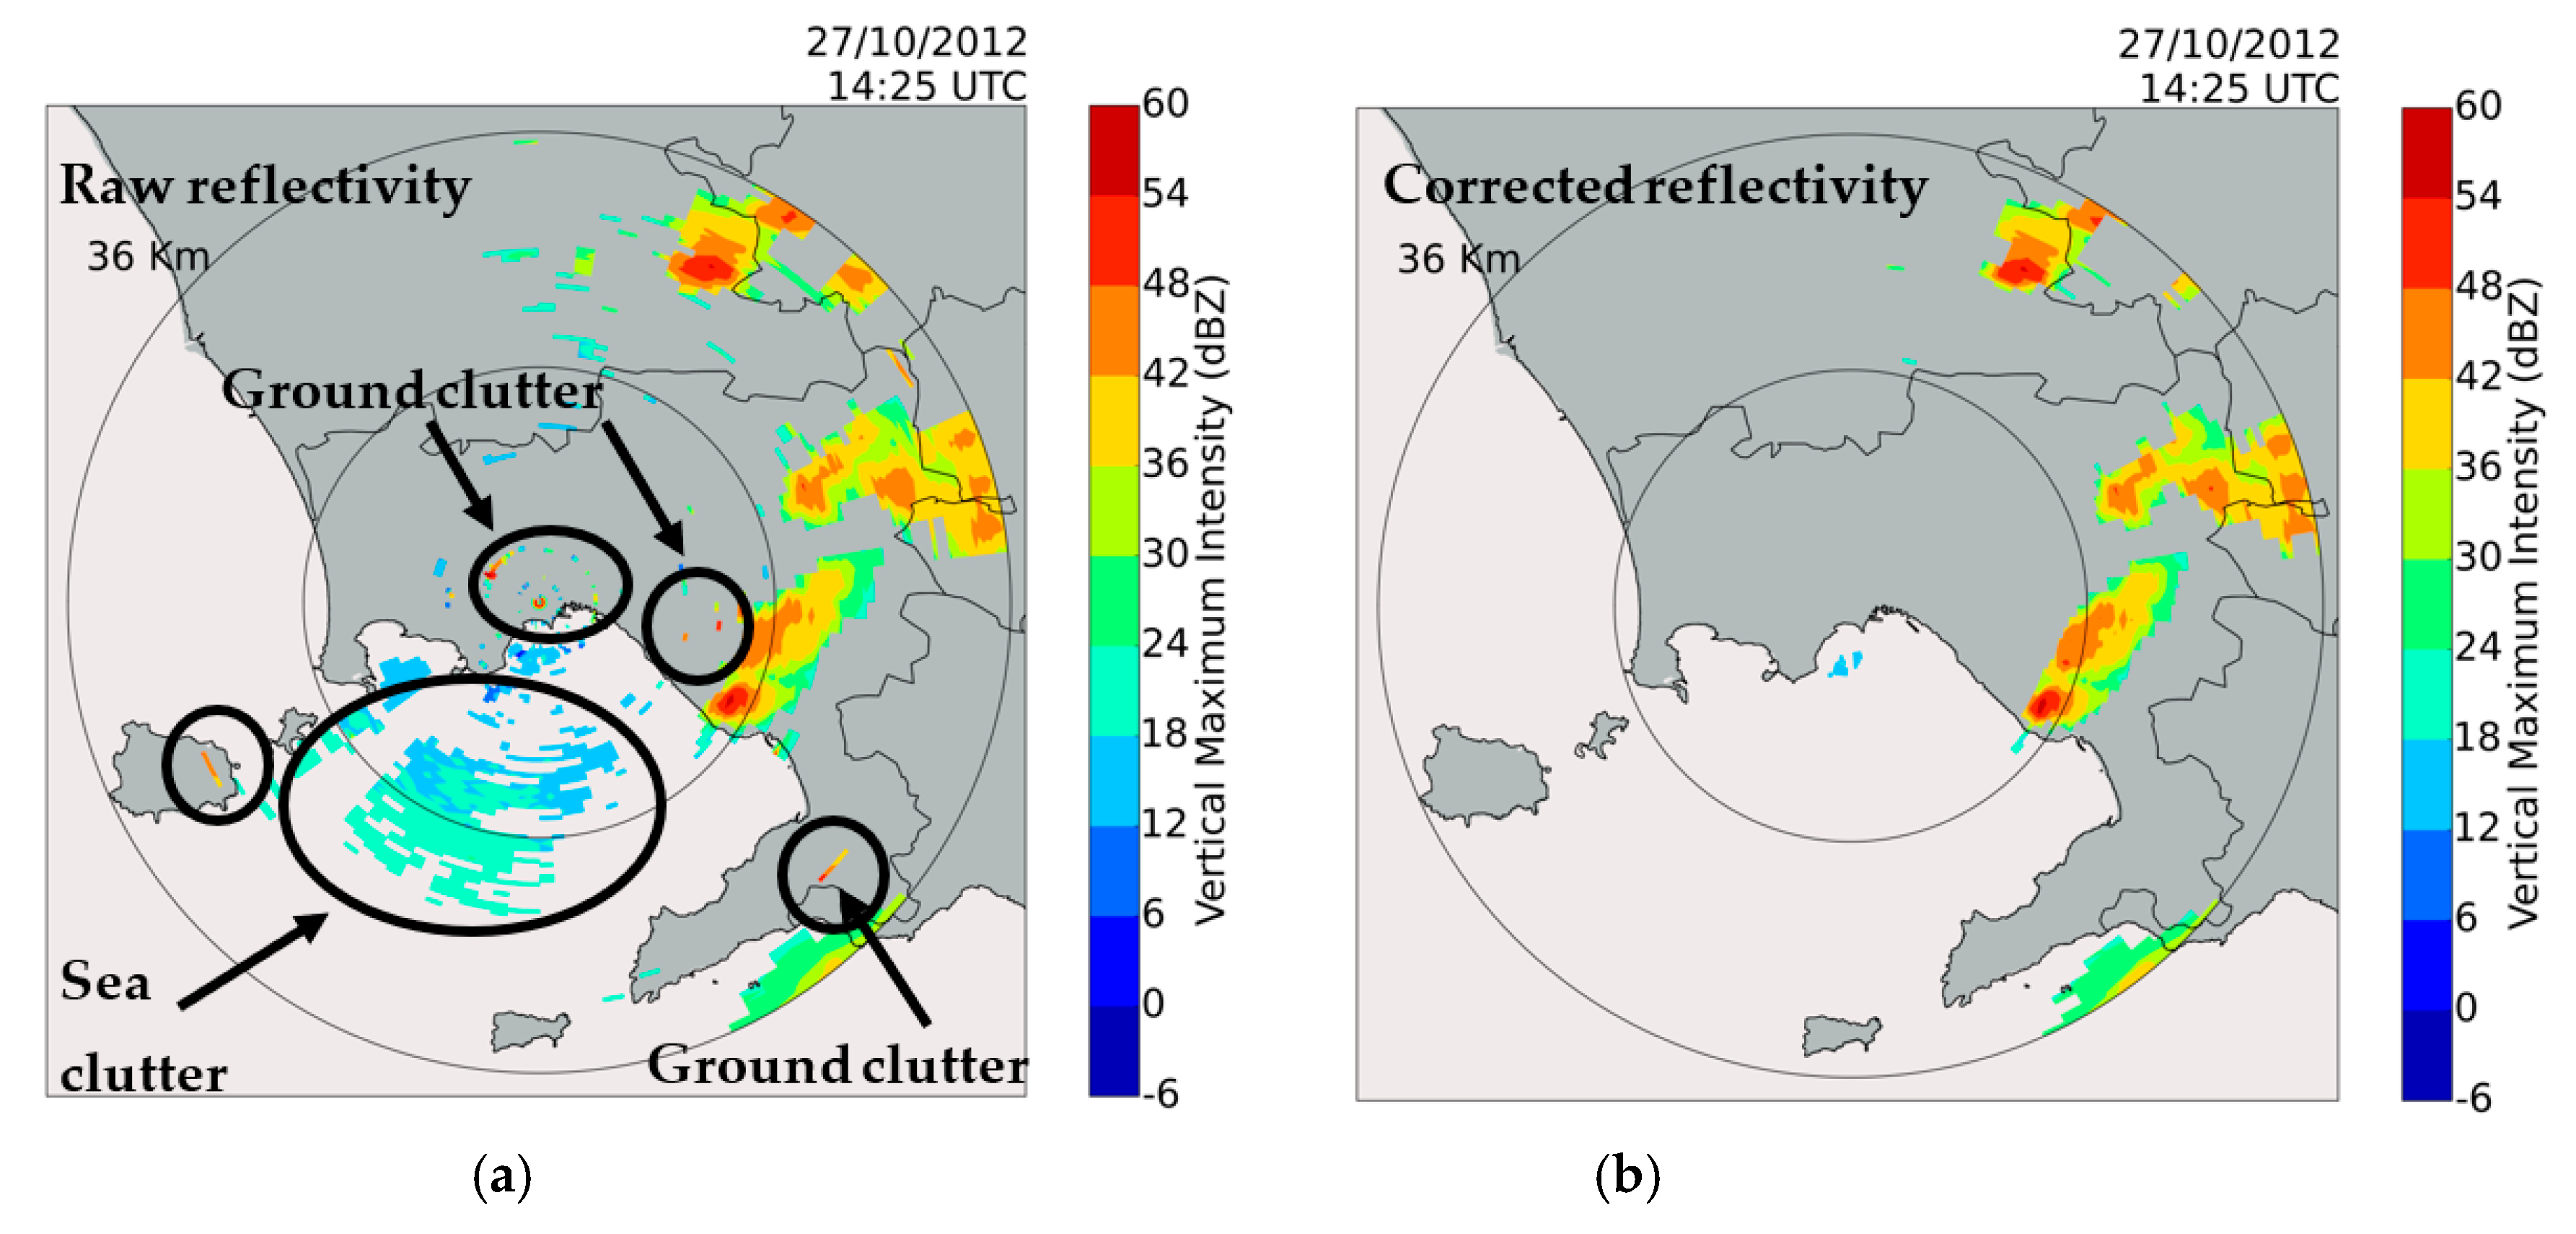
For the period analyzed in this study, 1575 reflectivity radar volumes have been collected and further processed through a quality control chain. The latter is focused to compensate for the following systematic errors: ground and sea clutter, beam attenuation along the path, and beam blocking by surrounding topography. Some details on the strategies and methodologies designed to overcome these issues are provided below.
  • Ground and sea clutter suppression: the statistical declutter filter of WR-10X relies on the different sample statistical distribution between meteorological and non-meteorological echoes. This filtering procedure has been improved through an in-house statistical filter, in order to suppress the noise caused by ground clutter. Such filter is based on entropy and texture calculations, as well as on median filtering [50]. To eliminate sea clutter, an approach that is based on vertical reflectivity profile analysis has been considered [51]. Such analysis involves the difference between the reflectivity measurements at 1° antenna elevation angle and 2° antenna elevation angle; the sea clutter is diagnosed when such difference is above a fixed threshold, determined through the analysis of a large number of case studies. An example of ground clutter and sea clutter suppression for a convective event occurred on 27 October 2012 is provided in Figure 2. The filter for ground clutter removal proves to be very efficient, although it tends to eliminate a few meteorological echoes.
  • Beam blocking by surrounding topography: in order to mitigate such an issue, the correction scheme described in [52], based on the percentage of beam cross section shielded and on a simple interception function between the radar beam cross section and the topography, has been applied.
  • Attenuation along the path: such a challenge has the major impact on the quality of X-band reflectivity measurements (e.g., [53,54]) and may be optimally compensated only through approaches based on dual-polarization features [55]. In our case, the attenuation has been mitigated by means of a classical iterative procedure, tested for heavy and moderate rainfall events, in which attenuation may be relevant [50]. In order to evaluate the impact of such issue and other impairments, a sensitivity analysis has been performed and is shown in Section 6.

2.2. Stroke Measurements

Stroke data from the ground-based low-frequency (VLF/LF) LINET are used to analyze the evolution of the storms. LINET system covers a wide area from approximately 30°N 10°W to 65°N 35°E and allows for discriminating between CG and intra-cloud (IC) strokes, as well as their polarity [42,56,57]. An example of LINET stroke detection sensor, retrieved from [49], is shown in Figure 1c.
LINET is able to register weak stroke events with currents well below 5 kA within the central part of the network, whereby IC events dominate. The 3D-discrimination procedure uses a time-of-arrival method to separate CG from IC (with a position accuracy of 150 m) and its accuracy is higher when the sensor baseline does not exceed ~200 km. More specifically, CG strokes can be discriminated from IC strokes in a more reliable way for distances not exceeding about 120 km from the closest sensor. Moreover, LINET allows for the estimation of IC emission height, although at least four sensors are needed for a reliable determination of the IC stroke height [42,57]. Finally, the network has an optimized location accuracy of strokes, which reaches an average value of about 150 m, whereby false locations (‘outliers’) rarely occur.
The information provided by LINET has been exploited in terms of the position, expressed in geographical coordinates, and the number of IC and CG strokes occurred within the radar domain in a time interval Δt = 2 min from the beginning of each WR-10X volume acquisition time. In this way, the reflectivity data, which are collected in the first two-minute time interval for each radar acquisition, are co-located in time with the LINET data.

2.3. In-Situ Meteorological Data

The conventional in-situ meteorological data have been included in the experimental measurement dataset in order to estimate, for each of the examined thunderstorm days, the isotherm levels, HT, for T = 0 °C, T = −10 °C, and T = −20 °C.
The near-surface temperature has been obtained from three Automatic Weather Stations (AWS), located in Naples, and belonging to the CCMMMA monitoring network. These stations have been selected according to the high percentage of data availability and to their representativeness of the meteorological conditions that affect the study area. For each thunderstorm day, an estimate of HT has been performed extrapolating the temperature from the AWS measured at the time closest to the WR-10X acquisition time, assuming a standard temperature lapse rate of 6.5 °C/km. This approach, ensuring higher time sampling that is comparable with the radar acquisitions and a better representativeness of the spatial domain considered, was preferred over common practice approaches that are based on the use of the nearest (in time and space) radiosounding or on the outputs of numerical weather prediction (NWP) model (e.g., [5,29,31]). In our case, the nearest radiosounding (two lunches per day at 00 and 12 UTC) was 150 km away from the target area, and we wanted to maintain the temperature information used in our algorithm directly derived from measurements.
To check how this procedure agrees with the more customary use of NWP products, a comparison between the isotherm altitudes derived from AWS and NWP model for ten main events in our dataset has been performed. For the NWP model, we considered the Weather Research and Forecasting (WFR) system with a spatial resolution of 6 km in the domain of our interest. The comparison results are satisfactory in terms of Pearson correlation coefficient (=0.98) and Root Mean Square Error (=0.3 km).

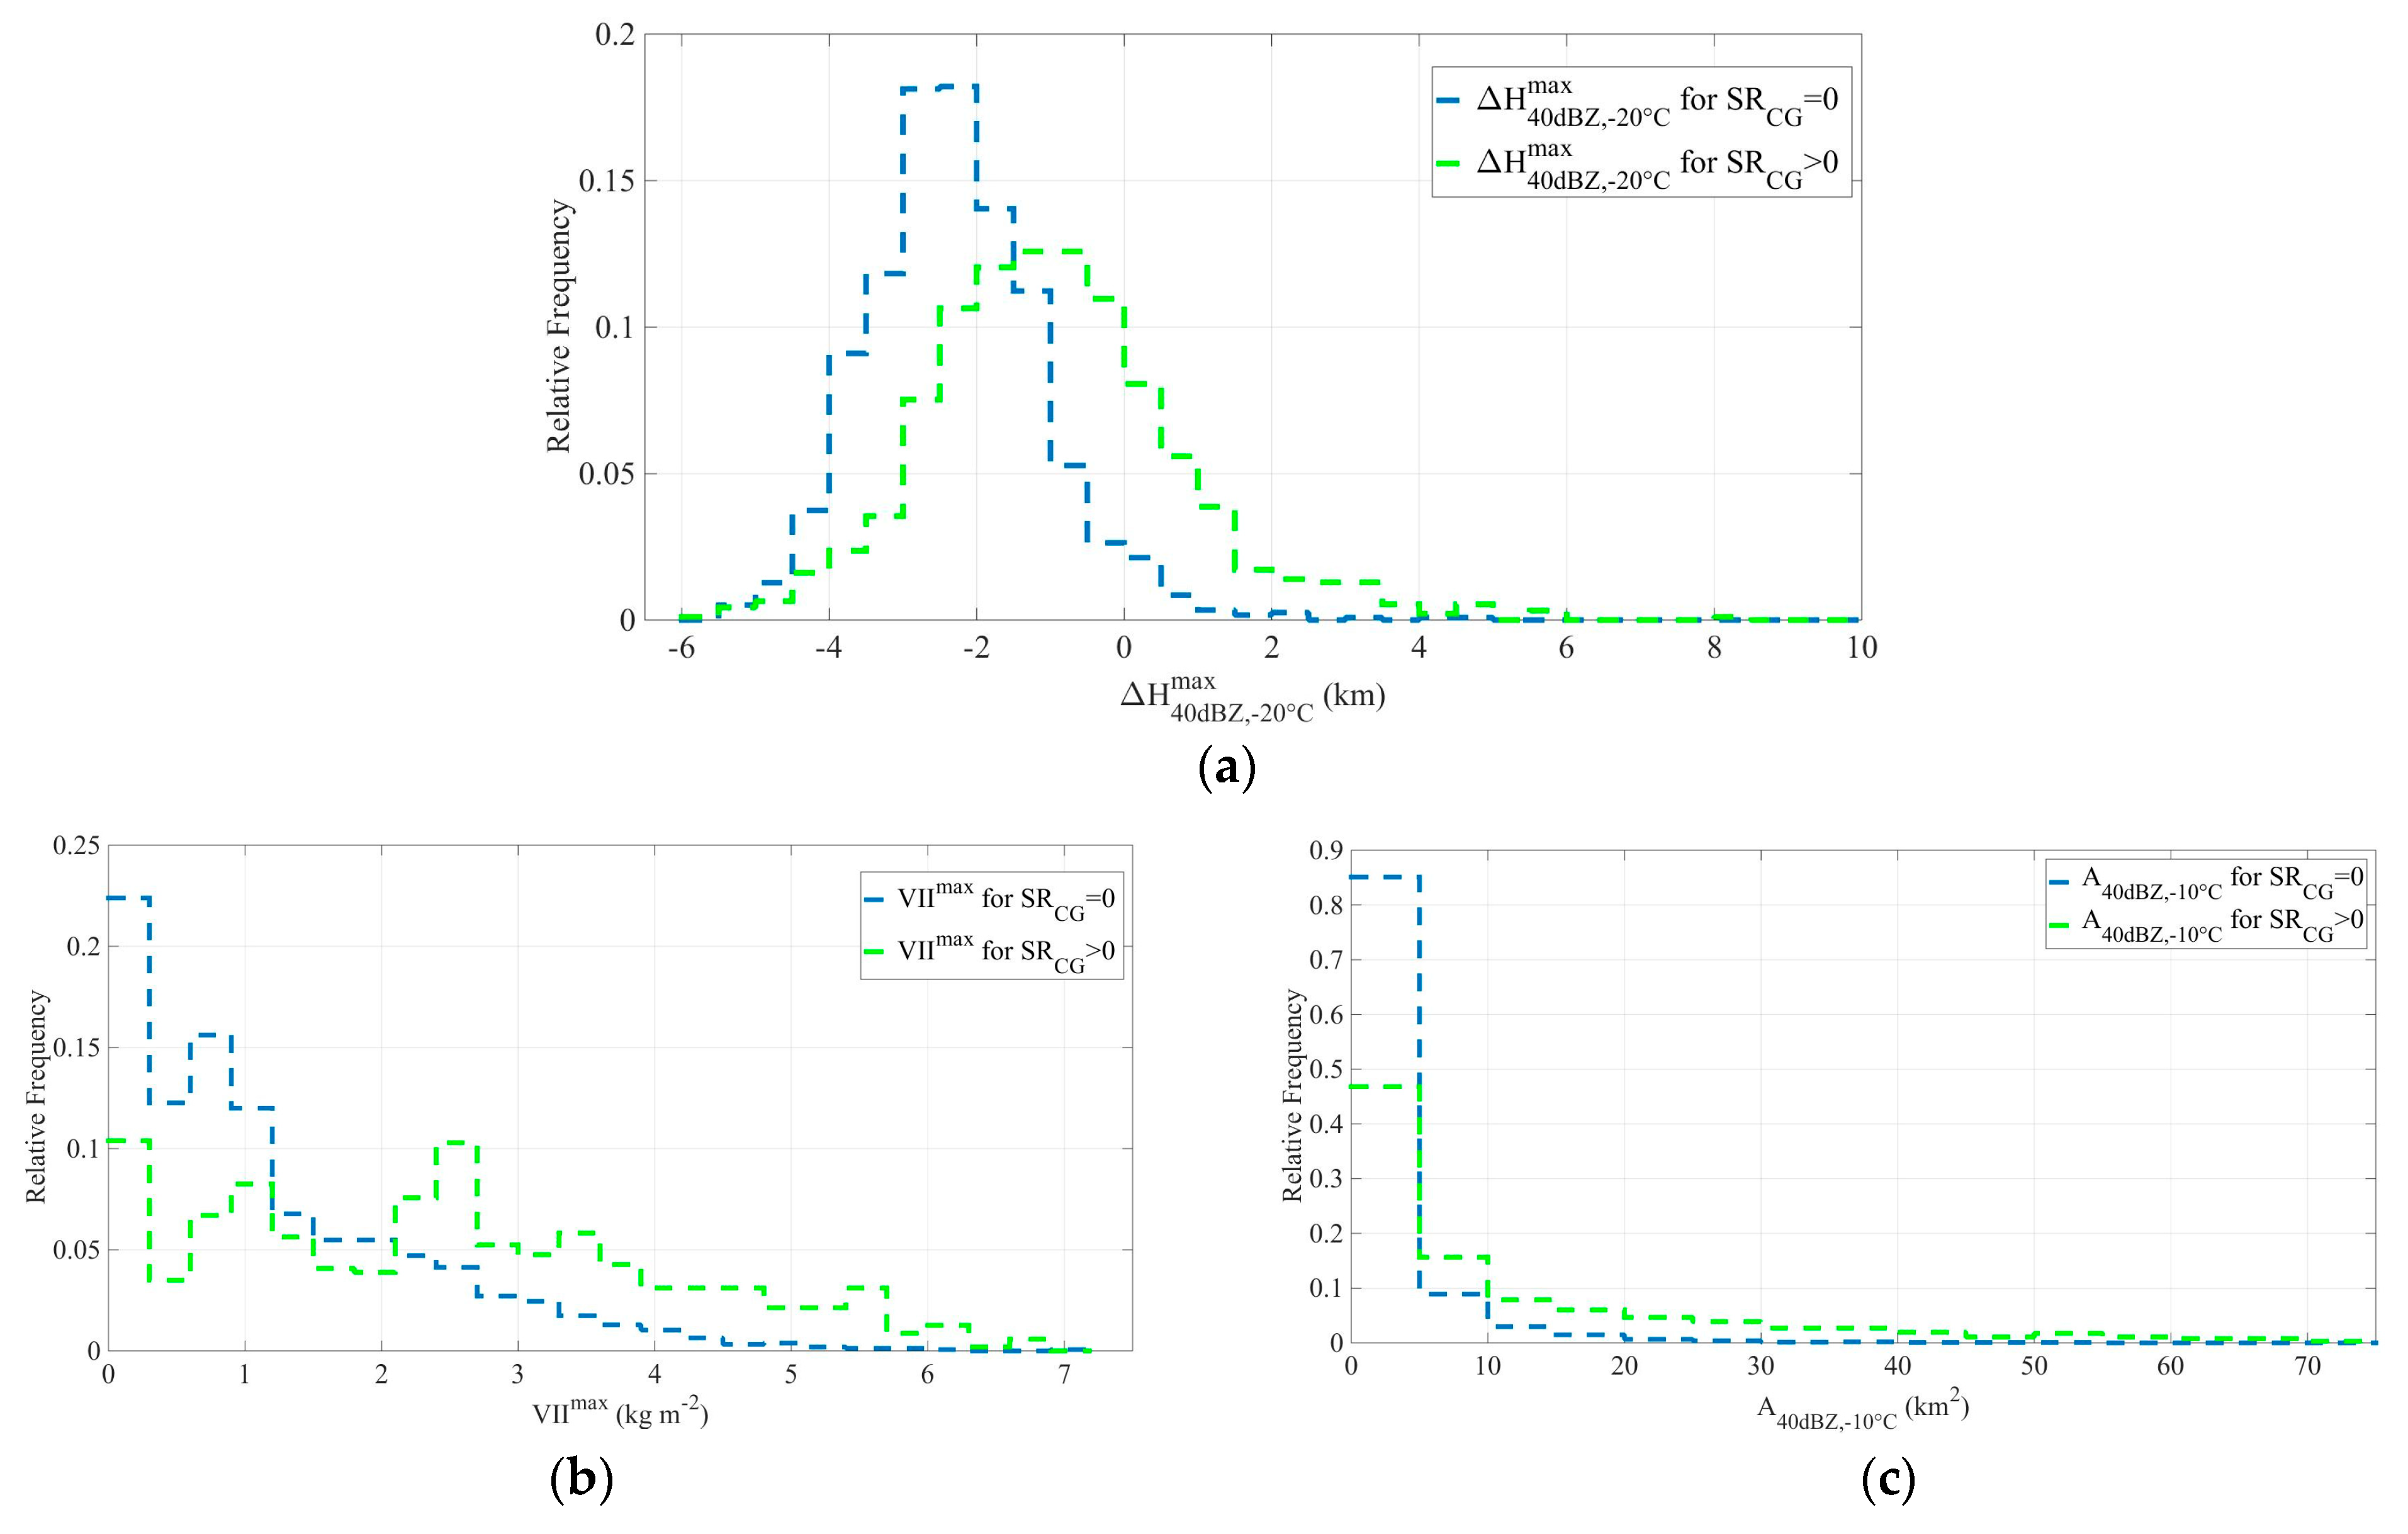
3. Radar-Based Stroke Predicting Variables

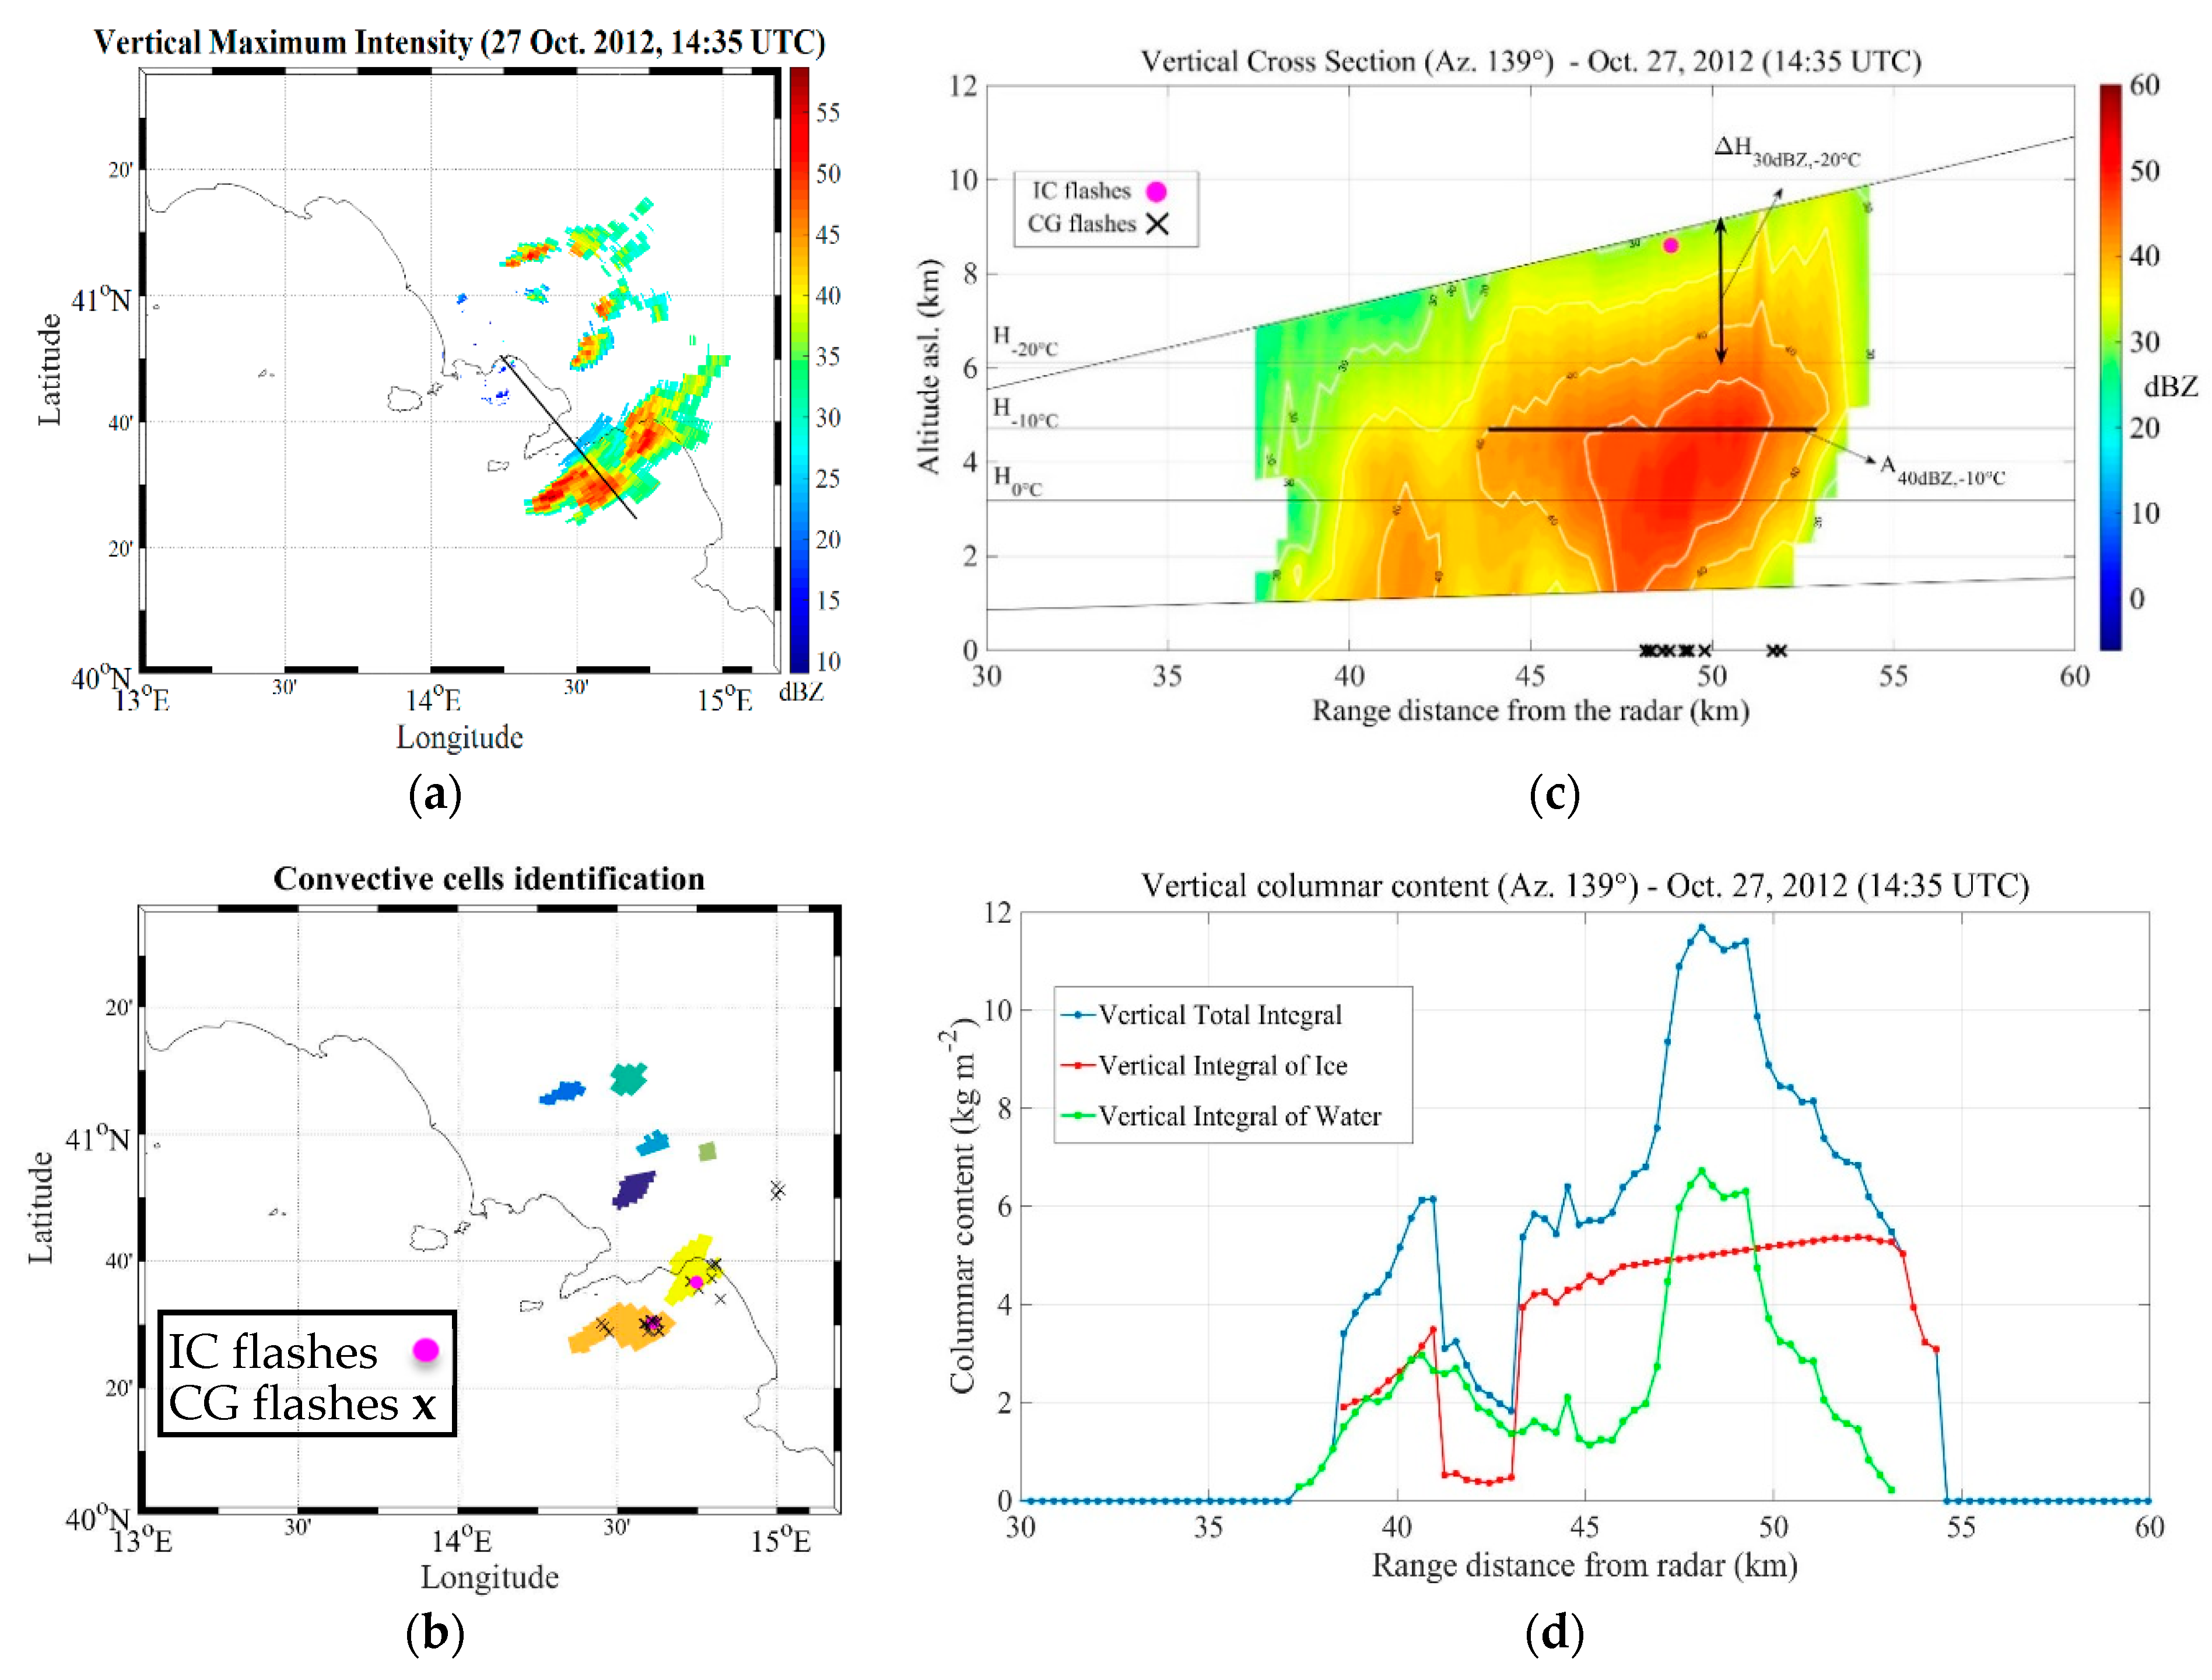
In this study, three radar-based stroke prediction criteria have been evaluated. Such prediction criteria are: the DIH, the Vertical Integral of Reflectivity (VIR) methodology, and the LA technique. Each of the DIH, VIR and LA technique is further fractionated and refined into eighteen different cases by setting proper thresholds. A brief summary of DIH, VIR and LA is given below.
The DIH approach (∆HZ,T) is based on the height difference (H) between a given reflectivity factor level, (HZ) and an isotherm level, (HT):
Δ H Z , T = H Z H T
The thresholds for Z and T have been fixed to 30 dBZ, 40 dBZ and 0 °C, −10 °C, −20 °C, respectively, leading to five selected values of ∆HZ,T: ∆Hmax30dBZ,−20°C, ∆Hmax30dBZ,−10°C, ∆Hmax40dBZ,−20°C, ∆Hmax40dBZ,−10°C, and ∆Hmax40dBZ,0°C. Note that for each rain cell we can have a distribution of values of ∆HZ,T, one for each grid point associated to a convective cell. The superscript “max” in ∆HmaxZ,T indicates that, for each rain cell, we have selected the maximum value among those that are available. It is worth highlighting that the thresholds of Z and T used have been extensively examined in the previous studies, being representative of graupel occurrence in the mixed-phase region of a cumulonimbus (e.g., [27,28,31]).
The VIR approach relates to the radar-derived estimates of VIL and VII into a vertical column. VIL and VII have been tested for stroke forecast purposes in some previous studies, which highlighted a low relationship between VIL and CG strokes events. Therefore, we propose a slight different version of the original VIL and VII products, by modifying the boundaries of the integration layer, in order to better separate the liquid and frozen mass contributions and to better characterize their relationship with cloud electrification processes. More specifically, we have introduced the Vertical Integral of Water concentration (VIW), expressed in kg m−2, which is the vertical integral of equivalent liquid water content (Cwat) in the rain layer of a convective cell:
V I W = H B H R C w a t   d H
where HR is the top height of the rain layer (i.e., the depth of the convective cell below the freezing level H0°C), HB is the lowest height sampled by weather radar. Cwat is obtained from Z measurements through a power-law relationship, using the coefficients that are provided by [58].
To compute the VII, which is also expressed in kg m−2, we have constrained the vertical integration of ice water content (Cice) to the layer between H0°C and HTOP. The latter is the observed cloud top height within a convective cell.
V I I = H 0 ° C H T O P C i c e   d H
According to [59], we have used three different Z-Cice relationships, depending on the temperature value at the reflectivity measurement height. From VIW and VII products, we have derived additional predicting criteria: the Vertical Total Integral of equivalent water (VTI), which is simply the sum between VIW and VII, and the density of VIW, VII and VTI (VIWD, VIID, and VTID), that have been obtained by normalizing them to HR, (HTOPH0°C) and HTOP, respectively. Moreover, for each of the identified convective cells, we have also computed the Total Water Content (TWC) and the Total Ice Content (TIC), defined as:
T W C = p = 1 n V I W ( p ) × Δ A ( p ) A c
T I C = p = 1 n V I I ( p ) × Δ A ( p ) A c
where p = 1, …., n is the number of radar pixels within a convective cell, ∆A is the discrete area element (obtained from ∆A = r × ∆r × 2 × tan(∆ϕ/2), where r is the distance from radar site, ∆ϕ and ∆r are the radar azimuth and range resolutions, respectively) and Ac is the area covered by a rain cell. Therefore, for VIR method, eight predictors have been evaluated: VIWmax, VIImax, VTImax, VIWDmax, VIIDmax, VTIDmax, TWC, and TIC. The superscript max indicates the maximum value within a convective cell.
The LA approach has been applied using the same reflectivity Z and temperature T combinations involved in DIH criteria. The resulting AZ,T predictive variable is defined for five predictive sets (A30dBZ,−20°C, A30dBZ,−10°C, A40dBZ,−20°C, A40dBZ,−10°C, and A40dBZ,0°C) as the horizontal area at the isotherm T level with a reflectivity value greater than or equal to Z.

4. Algorithm Description

The stroke detection methodology is aimed at establishing the degree of maturity of a rain cell in terms of its likelihood to produce strokes. The detection strategy is based on two steps: (i) the contouring of rain cells in a radar map and (ii) the categorization of each rain cell to establish its likelihood to produce strokes or not. The first step uses a radar-based storm cell identification algorithm, whereas the second step uses certain classification techniques, which involve some of the radar-based stroke predicting variables that are introduced in Section 3.

4.1. Contouring of Rain Cells and Stroke Features Extraction

The identification of convective cells from corrected WR-10X reflectivity measurements has been performed using a simplified and modified version of the Storm Cell Identification and Tracking (SCIT) algorithm, as introduced in [60]. The key parameter settings of SCIT algorithm adopted in this study are sketched in Table 3. For the purposes of our study, it is very important to detect the 30 dBZ and 40 dBZ boundaries of the convective cells. Radar-based criteria for lightning nowcasting, such as the DIH and the LA methods, are typically based on the occurrence of 30 and 40 dBZ echoes at −10 °C and −20 °C environmental temperature levels or above them (e.g., [28,31,39]). Our modified version of SCIT algorithm runs with the lowest reflectivity threshold (30 dBZ) for convective systems detection. The 30 dBZ threshold allows for identifying the early stages of a convective cell development that may be related to the physical processes that are associated to thunderstorm electrification. The thresholds above 40 dBZ, used in the original version of SCIT algorithm are not useful in the context of our work, because the rain cells identified with such thresholds cannot be used for a reliable assessment of the radar-based criteria for lightning nowcasting. However, the 35 and 40 dBZ reflectivity thresholds mentioned in Table 3 have been used to refine the detection procedure in the case of convective cells characterized by a very large area (>200 km2).
The convective cell detection procedure has been applied to each of the six elevation scans. Subsequently, a vertical association of the identified two-dimensional (2D) structure has been performed, starting with the highest elevation angle; in this respect, our algorithm follows the strategy designed in [61].
From the available WR-10X reflectivity volumes, 8257 convective cells have been identified. For each cell, the centroid, the vertex positions (expressed in geographical coordinates) and the area (in km2) have been determined and stored. Subsequently, the radar-based stroke predicting variables that are presented in Section 3 have been extracted for each rain cell.
The process of association of CG and IC strokes registered by the LINET network with the convective cells detected from WR-10X starts with identifying all strokes that occurred in the area that is covered by the radar in the two minutes after the beginning of radar acquisition. If a certain stroke is within the boundaries of a convective cell, then it is associated with that cell. Otherwise, the distance between the stroke and the nearest convective cell centroid is evaluated: if this distance is less than 10 km, then the stroke is associated with the nearest cell. In rare circumstance, a stroke appears quite far away (>10 km) from defined cells and this may occur due to the following reasons:
  • radar issues, specifically: (i) Strong attenuation of WR-10X signal along the path, which can lead to a signal extinction and, therefore, to a missing detection of a convective cell that produces CG stroke activity; or, (ii) Partial or total beam blockage by orography at lower antenna elevation angles, which can determine an erroneous estimation of the horizontal and vertical extension of convective systems;
  • physical reasons: CG lightning can occur also between the anvil of the cloud and the ground. The anvil can be displaced from cell core, and usually, it is not fully detected by X-band weather radars due to sensitivity problems.
The stroke activity produced by a given rain cell registered by the LINET network has been characterized using the position and numerosity of the CG and IC strokes. It has been assumed that a stroke event occurs when a convective cell identified by WR-10X produces at least one LINET CG stroke (i.e., SRCG > 0) in the two minutes interval coincident with the one of radar acquisition. It should be noted that the 10 min WR-10X temporal sampling is likely not sufficient to track lightning during convection: this is the main reason why we did not consider a lead-time in our analysis and we focused on the detection issue rather than the forecast.
An example of rain cell identification and stroke feature extraction is provided in Figure 3. In Figure 3a, the reflectivity field collected by WR-10X on 27 October 2012 at 14:35 UTC, synthetized by the Vertical Maximum Intensity (VMI) product, is shown. In this example, the detection algorithm has recognized seven different convective structures, which are presented in Figure 3b. The CG and IC LINET strokes detected from 14:35 to 14:36 UTC are superimposed. A strong CG stroke production has been observed for orange and yellow-coded cells (Figure 3b), which affected the Gulf of Salerno: the former produced a SRCG of 10.5 min−1, whereas the other one generated a SRCG of 4.0 min−1. The vertical slice representation shown in Figure 3c allows to highlight some stroke predictors extracted from rain cell, such as ∆H30dBZ,−20°C and A40dBZ,−10°C, as well as 0 °C, −10 °C, and −20 °C isotherm levels (derived from AWS measurements at 14:30 UTC). Finally, Figure 3d shows the VIW, VII, and VTI horizontal profiles along the 139° azimuth. Such profiles exhibit their peak values between 45 km and 55 km, where stroke production has been mainly observed.

4.2. Single-Variable Clustering Detection of Stroke Activity

In order to perform comparisons with more customary techniques, a single-parameter radar-based stroke detection criterion has been implemented. For the j-th stroke radar-based predictive variable (xj), as introduced in Section 3, the stroke detection criterion can be formalized, as follows:
x j c k t h j , k l w < x j   t h j , k u p  
where ck is the k-th class of stroke rate levels and t h j , k l w , t h j , k u p are the lower and the upper thresholds that define the boundary limits for the k-th class and the input variable xj. In our case, two classes are foreseen: c1 for stroke rates SRCG = 0 (i.e., no production of strokes) and c2, SRCG > 0 (i.e., stroke production). The criterion that is used to objectively select t h j , k l w and t h j , k u p is described later on in Section 5.3.

4.3. Multi-Variable Clustering Detection of Stroke Activity

The multi-variable detection of stroke activity implemented relies on a classification approach where an input radar-based stroke predictor vector x = [1, … xj, … xn]T, with “T” standing for transpose operator, associated to each rain cell, needs to be associated to one of the k-th output class (ck). To this goal, we have investigated the performance of three classifiers among the most popular and easy to implement, which are: the Fuzzy Logic (FL), the Quadratic Discriminant Analysis (QDA), and the Support Vector Machine (SVM). In selecting the classification approaches, we privileged those that: (i) involve a minimization/maximization of a cost function; (ii) require low or reasonable computational cost; and, (iii) are widely used in radar meteorology. According to [62], a classifier system can be thought as a method to find a boundary separation in the input variable space (represented by the vector x in our case), among several regions, each of them representative of one of the target output classes. The flexibility in the definition of the boundary separation of x depends on the specific classifier considered. A detailed description of the considered classifiers can be found in [62,63,64,65,66,67]. The training of the classification algorithms is described in Section 5.

5. Algorithm Training

The training phase of the algorithm is aimed at: (i) selecting the components of the input vector x of the radar-based predicting variables that are more correlated with stroke occurrence and (ii) selecting the parameters for the clustered detection of stroke activity.

5.1. Selection of the Radar-Based Stroke Predicting Variables

Prior to selecting the radar-predictors of SRCG, a preliminary correlation analysis between the investigated radar-based detection variables and the SRCG measured by LINET has been performed considering five different distance (r) intervals, i.e., (rminrmax): 15–30, 30–40, 40–50, 50–60, and distances larger than 60 km. Such analysis has revealed a very low correlation for convective events occurred between 15 and 30 km. According to this result, we concluded that the WR-10X scan strategy used does not provide an adequate sampling of the mixed-phase region of thunderstorm clouds within this distance interval. Therefore, the dataset used for the selection of the radar-based CG strokes predicting variables and in the subsequent analyses includes 5754 convective cells, i.e., only the rain cells occurred at a distance >30 km from the radar site.
To select the radar-predictors of SRCG, we have performed an objective screening that is structured into two different steps: (i) the maximization of Pearson correlation coefficient between LINET observations and each of the radar-based stroke predictors introduced in Section 3, namely: DIH, VIR, and LA; and, (ii) the maximization of the separation degree among the histograms of DIH, VIR, and LA for the two classes SRCG = 0 and SRCG > 0. The latter criterion is important, because it should maximize the independence of the information content brought by each of the selected radar-based stroke predictors.
Table 4 lists the correlation coefficients between LINET CG, IC, and overall (All) stroke rates, SRCG, SRIC, and SRAll, respectively, and each of the DIH, VIR, and LA radar-based stroke variables. As a general result, we have found better correlation levels when only CG strokes are considered. The relatively low detection efficiency of IC strokes may be the main reason for the scarce correlation of SRIC with radar-based variables. As highlighted in [56], the detection of IC strokes by LINET is challenging, due to the following main reasons: (i) they are associated to a lower energetic values than CG strokes; and, (ii) they occur at a certain height above the ground. In the light of such issues, IC strokes can be correctly detected only through a three-dimensional localization system. The latter would require the availability of a lightning detection network with a homogeneous baseline (which is the mean distance between sensors), not exceeding 120 km [42]. Unfortunately, such a requirement may be not satisfied in some regions, due to the irregular distribution of lightning sensors, and especially in coastal areas, such as the one investigated in this study, because of the lack of sensors over the sea. Therefore, due to the scarce relationships between the investigated radar-variables and the detected IC lightning, hereafter we have decided to focus our study only on the detection of CG strokes. For the LA method, A40dBZ,−10°C and A40dBZ,0°C outperform the other variables, whereas for VIR, only the predictors based on ice amount estimates show comparable levels of correlation with respect to LA and DIH. In this respect, the results of this study confirm the achievements of the few previous studies [37,38] that investigate the relationship between liquid water content estimates and lightning occurrence. According to the results that are shown in Table 4, nine different predicting variables have been pre-selected, including all DIH criteria, VIImax, TIC, A40dBZ,−10°C, and A40dBZ,0°C.
The second selection criterion is based on a joint probability distribution function (PDF) analysis, which has been carried out after partitioning the training dataset into the two categories, c1 and c2. For a j-th predicting variable xj, we have calculated the joint probability p ( x j c 1 ,   x j c 2 ) , which gives an estimate of the overlapping area between the two classes in terms of the predicting variable x j only. We have repeated the calculation of the joint probability for all nine predicting variables that have been previously pre-selected and the results are listed in Table 5. Lower values of the joint probability mean small overlaps and an higher probability of separation between the two classes used. The results highlight that, in each homogeneous variable set, the lower overlap is obtained for the following predictors: x = [∆Hmax40dBZ,20°C, VIImax, A40dBZ,−10°C], whose frequency distribution for the two classes is shown in Figure 4. It is worth highlighting that the variables listed in Table 5, being already optimized with respect to the linear correlation criterion, exhibit slight differences in joint probability values. Moreover, the frequency distributions of the variable A40dBZ,−10°C (Figure 4c) appear to be very similar. However, the overlapping degree between histograms found for this parameter is comparable to the other two variables. It should be noted, in fact, that A40dBZ,−10°C has the largest dynamic range if compared with the other two variables in Figure 4a,b and this tends to mask the discrimination of the events with and without strokes in Figure 4c.
As a result of this analysis, the three predicting variables just mentioned have been selected as inputs to the detection procedure. After selecting the optimal radar-based stroke predicting variables, we have partitioned the convective cell dataset into a 45% training dataset and a 55% test dataset. The two non-overlapping sets have been selected randomly, after assigning a progressive integer number to each rain cell detected at a given time and position. Using this selection strategy, the same rain cell, considered throughout its time evolution (i.e., tracked in time), may belong to the training set for some radar acquisition time intervals and to the test one for others. It has been implicitly assumed that each rain cell (and then its selected predicting parameters) at a given time is independent from itself at a different time. Under this assumption, the training and test subsets can be reasonably considered as two independent datasets with a balanced proportion between stroke and non-stroke producing rain cells. We have also tested other training/test ratios, like 55%/45%, 60%/40%, and 40%/60%, and we did not find any significant variation in terms of the results that were achieved in training and test phases. Detailed information about the number of convective cells assigned by random selection to the training and test dataset is provided in Appendix A (Table A1), for each thunderstorm day analyzed in this work.
The training set has been used to find the coefficients that are needed to run Equation (6) and the best multi-variable separation functions, whereas the test dataset has been considered for verifying the stroke detection performance.

5.2. Threshold Selections for the Single Variable Approaches

The training of the single-variable detection methods consists in identifying the discriminatory thresholds t h j , k l w and t h j , k u p introduced in Equation (6) that best separates the two classes c1 and c2 of SRCG = 0 and SRCG > 0, respectively. However, since we have only two classes (i.e., k = 1 or k = 2), it holds that t h j = t h j , k l w = t h j , k u p and only one threshold needs to be fixed for each predicting variable xj. To pursue this aim, a traditional two-by-two contingency table (e.g., [62]) has been used; the latter has lead to the definition of CSI, Equitable Threat Score (ETS), Frequency Bias Index (FBI), Heidke Skill Score (HSS), Hanssen-Kuiper Skill Score (KSS), and Area Under the Receiver Operating Characteristic (ROC) Curve (AUC). The definition of these scores is provided in Appendix B.
According to an approach that is widely used in literature (e.g., [5,28,31,47]), for each of the components of the input vector x = [x = ∆Hmax40dBZ,−20°C, x2 = VIImax, x3 = A40dBZ,10°C] of the radar-based predicting variables, we have looked for the respective thresholds, th1, th2, th3, which maximize the CSI. The CSI maximization process is shown in Figure 5, where we have expressed the CSI as a function of various percentile levels of xj to present the result in a single plot. From the same figure, the optimal threshold values, highlighted by black circles, have been obtained for th1 = −2.3 km (CSI = 0.50), th2 = 0.9 kg m−2 (CSI = 0.46), and th3 = 0.7 km2 (CSI = 0.45).

5.3. Threshold Selections for the Multi Variable Approaches

The classification techniques that are presented in Section 4.3 have been trained for the multi-variable detection of SRCG (i.e., the two classes c1 and c2), assuming that the input vector x has components x1 = ∆Hmax40dBZ,−20°C, x2 = VIImax and x3 = A40dBZ,−10°C. The predictive radar variables, before being used as input to the various classification schemes, have been scaled by the corresponding mean and standard deviation.
To train the FL method, we have designed the membership functions by fitting the normalised histograms presented in Figure 4 using trapezoidal functions. The weights for each membership function have been fixed by considering the overlapping levels between the two classes that were obtained for each predicting variables, xj (Table 5). According to this criterion, a larger weight has been assigned to the predicting variable showing a lower overlap value.
For the training of the QDA method, we have previously calculated the covariance matrices, the mean vector and the a-priori probabilities for each of the two classes of SRCG.
For the SVM, two different classifiers have been developed, one based on a linear kernel function (SVM-L) and the other one on a Gaussian model (SVM-G).
A graphical example of the classification performed through FL, QDA, and SVM methods is provided in Figure 6. This figure shows the distribution of ∆Hmax40dBZ,−20°C vs. VIImax for the SRCG > 0 cases and SRCG = 0 samples while keeping A40-dBZ,−10°C constant to 1.0 km2. The boundary functions derived after training the classification methods are superimposed to the scatter plot of Figure 6. A clear overlap between the two SRCG classes is noted, although this is partially due to both the 2D representation of a 3D plot and to the numerous meteorological scenarios that were included in our dataset, which reflect different mechanisms of convection triggering and hence a great variety of atmospheric electrification conditions. In particular, some electrification conditions may be not always adequately represented by the considered radar-based proxies of stroke events. From a qualitative perspective, the trained decision functions do not exhibit relevant discrepancies, although those that are based on QDA and SVM-G seem to better mimic the separation between the two classes.

6. Results

The robustness of the trained single and multi-parameters method for SRCG detection has been evaluated trough the test dataset, using a metric that includes the CSI, the ETS, the FBI, the HSS, the KSS, and the AUC score. These indexes take into account at least three of the four contingency table categorical events and, therefore, we believe they provide a robust and objective assessment of each proposed method skills.
The verification analysis outcomes are summarized in Table 6. It lists the score indexes when the variables x1 = ∆Hmax40dBZ,−20°C, x2 = VIImax, and x3 = A40dBZ,−10°C are used independently from each other (single variable approach) or merged using various classification techniques (multi-variable approach). Firstly, it is important to highlight that the QDA-based method outperforms the other detection criteria, showing a CSI of 0.53, an ETS of 0.34, a FBI of 1.00, a KSS of 0.42, and an AUC score of 0.78. On the other hand, the SVM-G technique exhibits the best performance in terms of HSS (0.43). Thus, none of the single-parameter criteria is able to maximize the considered statistical scores, even when the detection thresholds of each single variable approach are optimized using the training dataset. This result is important, because it justifies the multi-variable approach and encourages the use of different radar-based predicting variables, since they may bring benefits in the detection of stroke activity that is associated to convective cells.
A quantitative evaluation of the improvements introduced by the QDA method with respect to the worst and the best single-variable criterion is presented in the last two columns of Table 6. The improvement has been expressed in percentages, computed from the normalized difference between the score obtained with the QDA method and the best and worst score among the single variable methods. The improvement percentage varies between 2% and 70%, depending on the specific skill score and the stroke radar-based proxy parameter considered. It is worth emphasizing the improvement that is obtained for HSS increasing from 7.0% to 27.0%, as well as that observed for KSS, varying between 10.5% and 16.0%. The HSS, in fact, may be considered a form of generalized skill score [62], evaluating the accuracy of detection with respect to a random choice. The KSS score gives equal emphasis to the ability of the detection method in identifying both the correct and correct negative of SRCG (see Appendix A for details). Therefore, when considering HSS and KSS indexes, the use of the multi-parameter approach enhances the SRCG detection capability with respect to a random choice.
The scatter diagram in Figure 7 provides a further evidence of the QDA method performance, showing a comparison between ground-based LINET observations and radar-based estimates, in terms of daily number of convective cells that produce SRCG > 0. LINET and radar data exhibit a good agreement, synthetized by the linear correlation coefficient, whose value is 0.95. However, the radar-based algorithm generally underestimates the number of SRCG > 0 events, especially in thunderstorm days that are characterized by a strong atmospheric electrification, i.e., by a great number of stroke-producing convective cells. Such a result may be related to a residual influence of radar issues discussed in Section 2.1, whose quantitative impact on detection scores is discussed in the next paragraph.
The results of our study may be compared, with some caution because of the difference in weather radar systems and in climatic contexts, only to previous works, including a number of convective cells of the order of 103, which is the case of four studies [5,29,31,32], and only in terms of CSI score (Table 1). In [29], 1164 rain cells have been analyzed using the occurrence of 40 dBZ at −10 °C updraft level as proxy of stroke activity; this work found a CSI of 0.86, which is much higher than CSI determined in our study and in [5,31,32]. As highlighted in [31], such discrepancy may be explained by local convection features, which, in some climatic contexts, may better fit the radar-based proxies of stroke events. Moreover, the difference with [29] may be also related to the radar system and to the scan strategy used to design the stroke detection algorithm. The CSI index that is yielded by our multi-parameter algorithm is very similar to the one achieved by the IRT-based methods developed in [31,
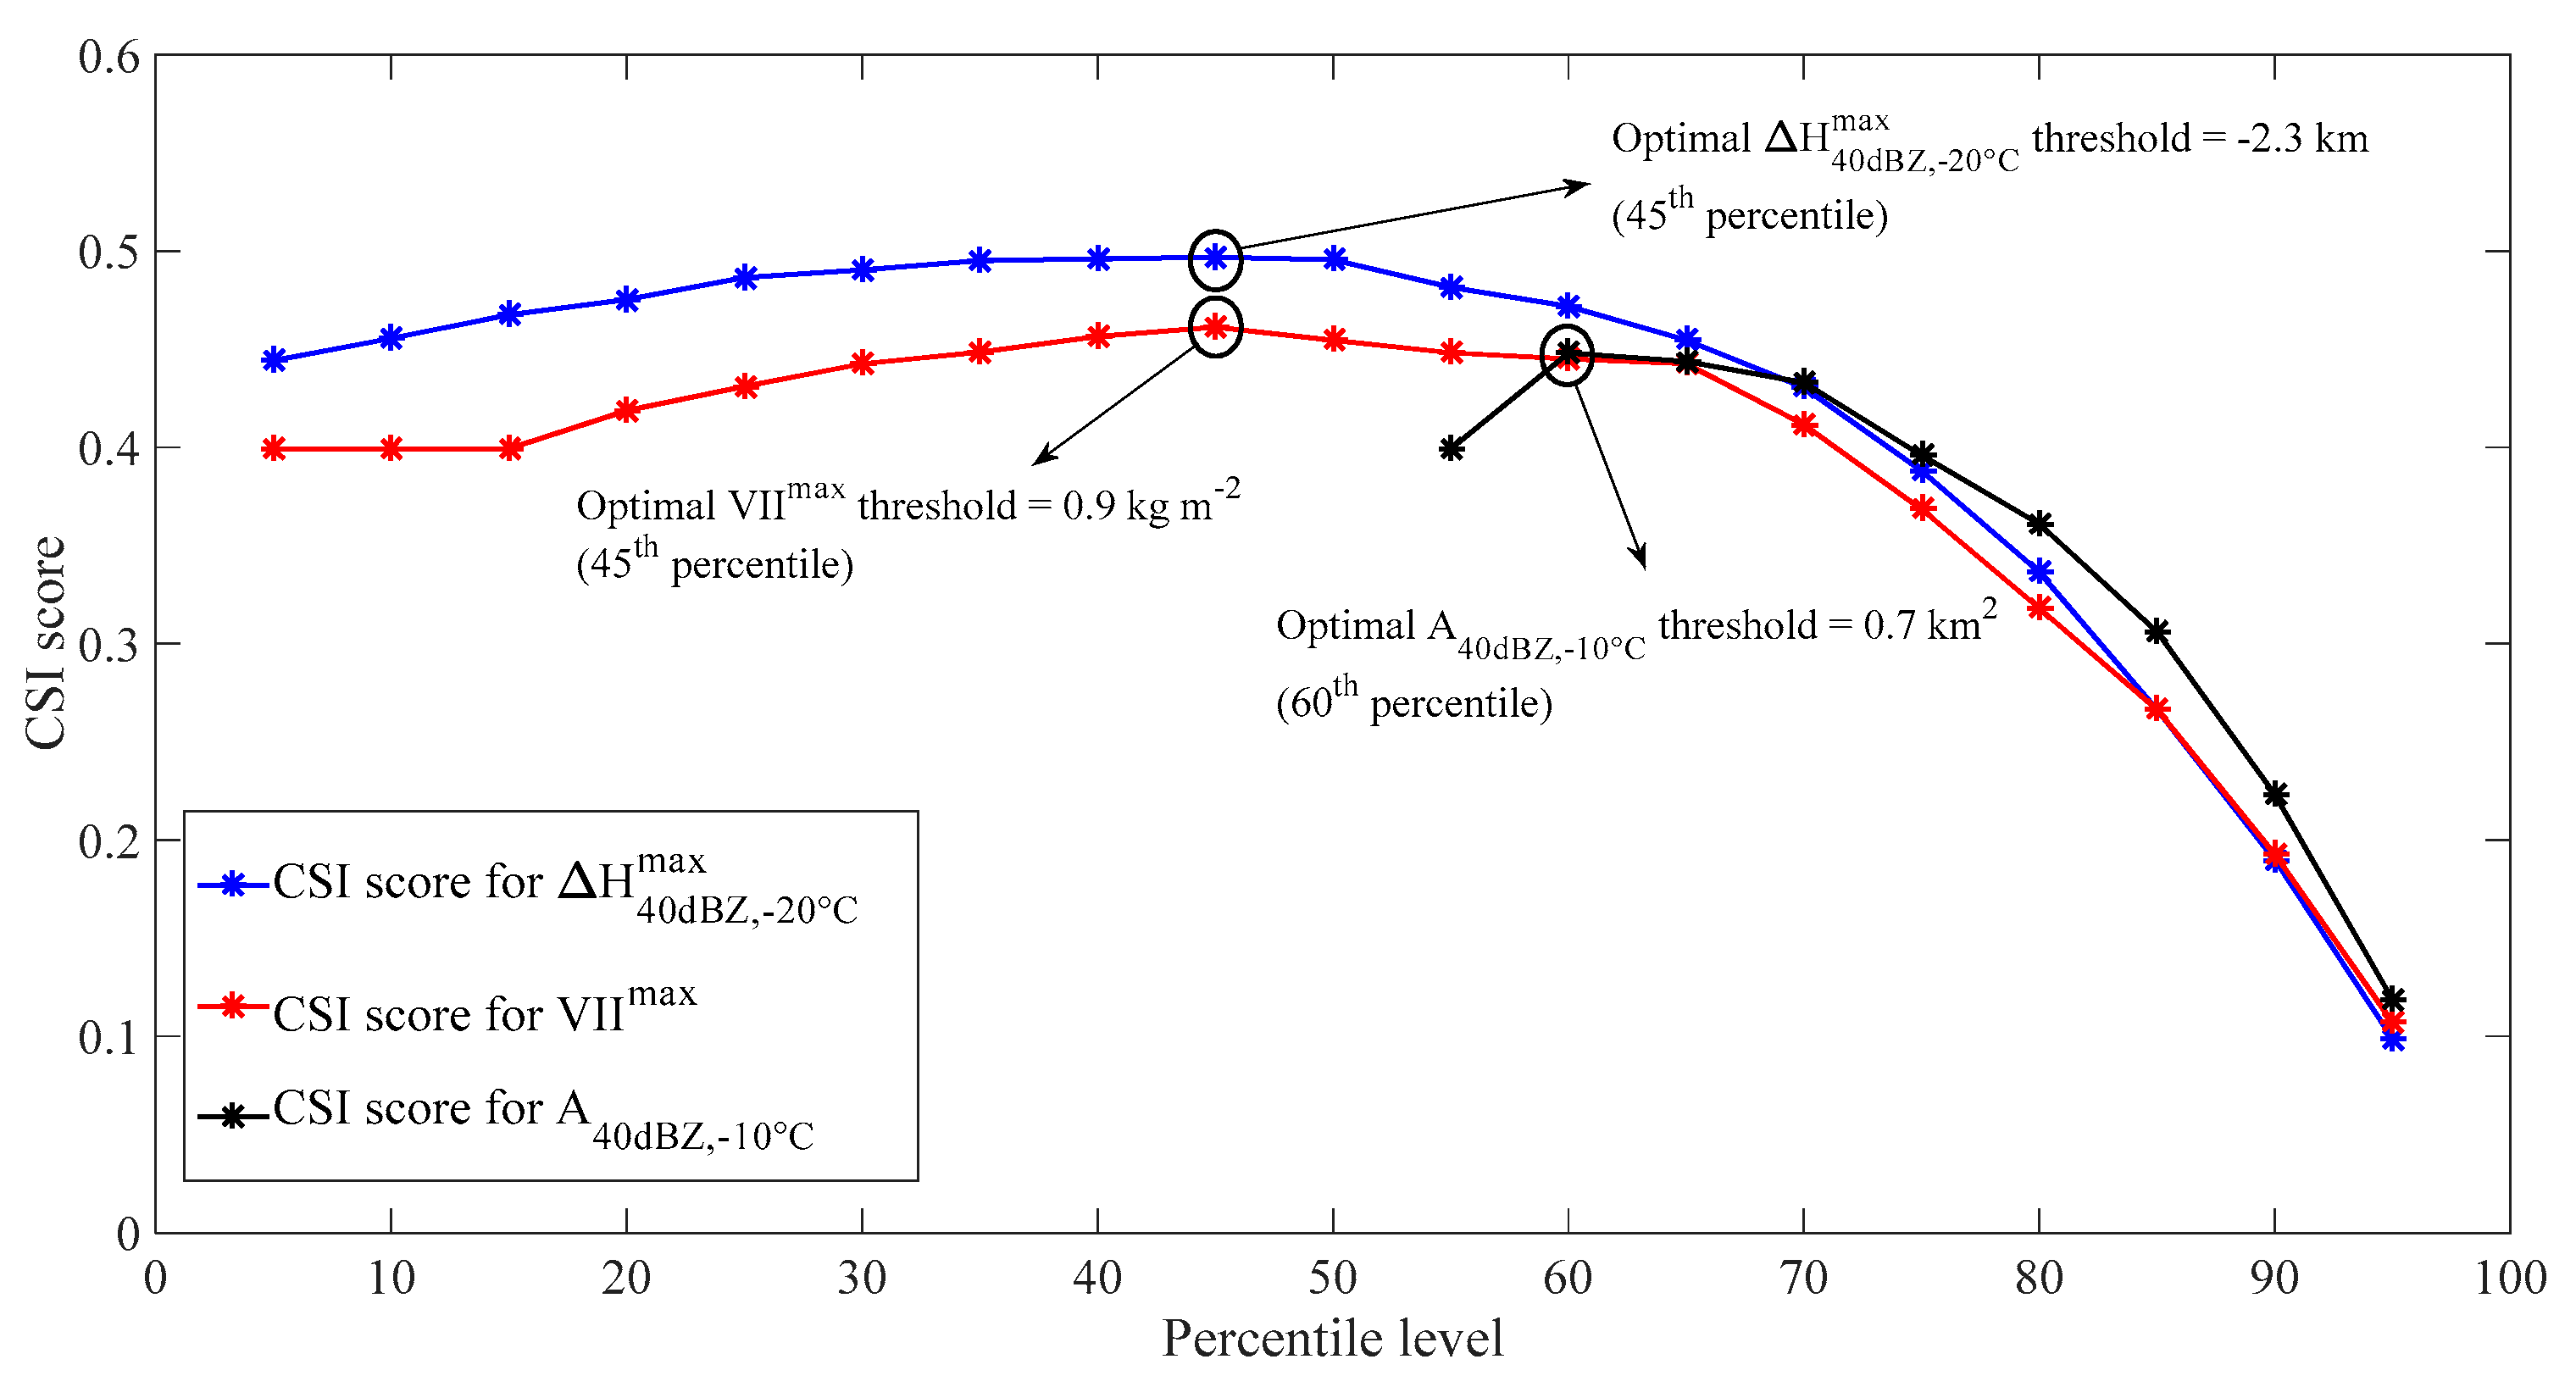
32], which ranges from 0.44 to 0.56. In [31,32], a method that is based on VII has been also proposed, resulting in a CSI score of 0.68 and 0.47, respectively. In our study, the single-parameter detection method based on VII shows a CSI of 0.48 for an optimal threshold of 0.9 kg m−2. This result is not very different from the best values found in the two previous studies (0.42 kg m−2 and 0.58 kg m−2 for [31] and 0.84 kg m−2 for [32]), although it corresponds to a higher percentile level (45th) than the ones that are found in literature (the 10th and the 15th for [31] and 30th for [32]). It is interesting to point out that our results are better that those achieved in [5], where a significantly more efficient and advanced radar system (C-band, dual polarization) has been used. Although it cannot be generalized, this finding may be attributed to the very high number (of order 105) of convective cells considered in [5] and to the difference in the method adopted for the stroke activity detection. In fact, in [5], the maximum height of 20 dBZ reflectivity core has been used, but this variable is not necessarily well correlated with the presence of deep riming precipitation ice within convective clouds, and hence, to lightning.

Sensitivity Analysis

As previously discussed, the quality of the data obtained by WR-10X radar may be adversely affected by some impairments. In order to evaluate the quantitative impact of such issues on stroke detection scores, a comprehensive sensitivity analysis has been performed. This additional investigation focuses on the QDA-based criterion, which has given the best performance among the multi-variable approaches tested in this study. To examine the consequences of the considered challenges, various subsets of convective cells have been extracted from the test dataset. Those subsets reproduce some “ideal” sampling scenarios, allowing for characterizing the impact of the following issues:
  • attenuation along the path. In the framework of this study, the impact of attenuation issue has been properly characterized and quantified, by testing the performance of the proposed algorithm for stroke detection for two different cases of non-attenuated and attenuated rain cells. We have defined as non-attenuated rain cells, those not showing any precipitating structure along the line of sight between the radar position and the rain cell itself. All the other rain cells are labeled as attenuated rain cells. The number of non-attenuated and attenuated cells is 1418 and 1756, respectively. Obviously, for the set of “non-attenuated rain cells”, we cannot exclude residual path attenuation effects within each single rain cell.
  • Radar beam obstruction from Volcano Vesuvio (40.8226°N, 14.4292°E). This challenge has been investigated by a test subset, devoid of convective cells in the azimuthal directions ranging between 89.95° and 107.95°, which are in the blind zone of the radar due to Vesuvio relief. Such a subset includes 3005 rain cells; and,
  • radar beam width. To analyze the impact of such issue, the behavior of the score indexes has been analyzed in relation to the range (i.e., distance from the radar site). More specifically, four different subsets have been considered, including the rain cells located within a certain distance interval, i.e., 30–40 km, 40–50 km, 50–60 km, and >60 km. The number of convective cells belonging to such subsets is 987, 959, 677, and 551, respectively.
The results of sensitivity analysis for all considered sampling scenarios (including the one in which the entire test dataset is employed) are listed in Table 7. It highlights, in first instance, that the attenuation does not exert a relevant influence on score values. As expected, in the non-attenuated scenario, a slight improvement of the indexes is observed, especially for HSS and KSS scores. The results also point out that Vesuvio does not negatively affect the radar ability to correctly sample the mixed-phase region of a thunderstorm, where lightning activity mostly originates, typically sampled at antenna elevation angles larger than 3°. Furthermore, three of the five scores, CSI, HSS, and KSS, exhibit an opposite behavior as a function of the distance from the radar site. The CSI index maximizes in the scenario that takes into account only the convective cells occurring at a distance greater than 60 km. The positive trend of CSI index with increasing distance from radar site can be attributed to the improvement in mixed-phase region radar sampling. The latter results in a growth of hits (i.e., number of times that a stroke event is detected by a radar and is observed by LINET network) and in the decrease of false alarms (i.e., number of times that a stroke event is observed by radar, but not detected by LINET network), which lead to an improvement of CSI. Conversely, the HSS, KSS, and AUC scores get worse with increasing distance, because of the increase of misses (i.e., instances of stroke event occurring despite not being detected by radar) and to the decrease of correct negatives (i.e., instances of stroke event not identified by radar and not observed by LINET network). At long ranges, in fact, the relatively broad beam width (<3° at 3 dB) of WR-10X radar and the beam blockage induced by orography in some azimuthal directions, may have a negative impact on the vertical sampling of convective clouds.

7. Conclusions

This study presents a multi-parameter criterion for CG stroke detection, based, for the first time, on the measurements of a single-polarization X-band weather radar. The architecture of the proposed method is structured into two different steps: (i) rain cell identification and stroke predicting variable extraction and (ii) Stroke rate estimation using single variable or multi variable classification techniques. After a training procedure and objective analysis on a large dataset that was collected in the area of Naples, Italy, we have identified three radar-based predicting variables that are more related to strokes detected by the LINET network: the difference between the maximum 40 dBZ height and the −20 °C level, the vertically integrated reflectivity in the ice layer of the cloud, and the total area where reflectivity values larger than 40 dBZ at the −10 °C isotherm level are found.
The stroke detection results highlight that the multi-parameter approach based on Quadratic Discriminant Analysis classification produced an improvement with respect to classical single-parameter criteria, which varies between 6% and 70%, depending on the specific statistical score and the stroke radar-based proxy parameter considered. The QDA-based algorithm also outperforms the other multi-parameter methods that were developed in this study (relying on Fuzzy Logic and Support Vector Machine techniques) for all considered scores, except for the HSS index, whose value maximizes in Support Vector Machine approach with Gaussian kernel function. Moreover, a further examination has been carried out by comparing, for each of the thunderstorm days analyzed, the number of rain cells producing strokes as observed by LINET network, and the one detected by the radar-based algorithm. This analysis points out that ground-based observations and radar estimates are highly correlated over a time period of 24 h, although the proposed algorithm generally underestimates the number of rain cells with lightning activity.
It is important to highlight that the performances of X-band weather radars are notoriously affected by beam attenuation along the path. In order to quantify the impact of such issue, a sensitivity analysis has been carried out. The results show that the incidence of attenuation on the performance of the proposed algorithm is relatively low. This is likely because the methodology that was developed in this work has been trained and tested on small spatial scales, i.e., within a maximum range of about 70 km. However, a range-dependent behavior of statistical score indexes has been detected. More specifically, lower HSS and KSS values (with an increase of misses and a decrease of corrective negatives) are observed for convective cells that are located more than 60 km away from the radar site. This is compensated by higher CSI (increase of hits). These potential biases in the estimation of SRCG produced by rain cells may arise from the large antenna beam width of the weather radar involved in this study, which adversely affects the sampling of convective structure at long range.
In the light of the findings of this work, the radar-based schemes designed for the detection of CG stroke events may benefit from a multi-parameter approach, including different radar proxies that well represent the processes that occur in the mixed-phase region of a thunderstorm. Future work will be primarily devoted to test the methodology that is introduced in this study in other areas, particularly in contexts where a network of X-band weather radar is used for monitoring and nowcasting needs. Such evolution of research activities can also have relevant meteorological and climatological implications, involving the tuning of radar-based predictors into environments characterized by different microphysical and kinematic properties that are critical for cloud electrification. Moreover, forthcoming studies will be also focused on the development of radar-based CG stroke detection algorithm based on different classification schemes, such as decision trees and random forest. Finally, additional studies will be carried out to examine, from physical and microphysical points of view, the relationships among the various radar-based stroke predictors that are involved in this study and their linkages with other atmospheric parameters (e.g., convective available potential energy, lifted index, wind shear, etc.) that are potentially very useful for stroke detection and/or forecast.

Author Contributions

V.C.: Proposed the idea behind the paper, performed all the algorithm developments, wrote the first draft of the manuscript and performed all the editing stuff; M.M.: contributed to write and refine the manuscript and supervised the results produced during the writing phase; V.M.: contributed to solve some conceptual issues during the writing phase; A.C.M. and G.P.: toughly revised the manuscript in all phases; N.R.: gave useful suggestions on the lightning data processing and machine learning aspects; S.D.: made possible to obtain lightning data taking care of the agreement aspects between CNR and Nowcast GmhB; G.B.: supported the radar installation and some of the personnel involved.

Funding

This research was funded by the Department of Science and Technology, University of Naples “Parthenope” (project EPIMETEO). Additional funding has been provided by “Bando di sostegno alla ricerca individuale—Annualità 2016” of the University of Naples “Parthenope”.

Acknowledgments

The Authors are grateful to the “Soprintendenza Speciale per il Patrimonio Storico Artistico ed Etnoantropologico e per il Polo Museale della città di Napoli” for hosting the WR-10X weather radar at Castel Sant’Elmo. ELDES srl (Florence, Italy) personnel is acknowledged for the technical support. LINET data were provided by Nowcast GmhB (https://www.nowcast.de/) within a scientific agreement with CNR-ISAC-Rome lead by S. Dietrich. Support for Anna Cinzia Marra by the Italian Research Project of National Interest 2015 (PRIN 2015) 4WX5NA is also gratefully acknowledged.

Conflicts of Interest

The authors declare no conflict of interest.

Appendix A

Table A1. For each of the thunderstorm days considered in this study, the following information is presented: the number of analyzed radar scans, the number of identified convective cells and the number of observed CG strokes, with the last two partitioned in terms of training and test dataset.
Date (dd/mm/yyyy)Number of Radar ScansNumber of Identified Convective CellsNumber of Observed CG Strokes
TotalTrainingTestTotalTrainingTest
17/04/20123110000
23/07/201267323148175529313216
24/07/20121031181322193
31/08/201226552530650185465
13/09/201259285124161283134149
01/10/2012372259313215956103
12/10/20123311653631679671
26/10/201212582632318152166
27/10/201277380161219758303455
28/11/201255249106143273106167
01/12/2012411144668592930
02/12/201246159718821587128
08/12/2012251064561753243
17/12/2012261255669903555
13/01/2013421537578874839
16/01/20131548202817512
17/01/20131223111224717
23/01/2013551437370256144112
02/02/2013944242018711
22/07/201432863848692742
01/09/2014693101411691621887734
04/09/201492011946406
06/09/2014441628280786340446
04/12/201461212100112670303367
16/12/201459253115138816391425
04/01/201518401723582929
18/01/2015307334391455590
30/01/201520512526371522
01/02/20153011954651225468
03/02/2015368135461377067
04/02/201514883553981682
05/04/201522442123752946
07/06/20154216584811387848539
08/06/2015331435885795337458
09/06/201521612734499242257
10/06/201513552134410141269
23/07/201531894247548225323
11/08/20155321410311118397731066
04/09/201518381721959514445
05/09/201524492326714425289
20/09/2015196927421222597
23/09/20153212052681285415870
07/10/2015421305377407145262
10/10/20154183354816739128
14/10/2015391496782985616369
15/10/2015301013863840154686
29/10/201535954352869553316
03/03/2016816610742846
Total157557542580317420,580949411,086

Appendix B

The four usual entries of the contingency table have been defined as follows:
  • Hits (H): account for the number of times that a stroke event is detected by a radar-based methodology and is observed by LINET network;
  • False alarms (F): represents the occasions in which a stroke event is observed by radar but not detected by LINET network;
  • Misses (M): account for the instances of stroke event occurring despite not being detected by radar;
  • Corrective negatives (N): represents the number of times that a stroke event is not identified by radar and not observed by LINET network.
The outcomes of the 2-by-2 contingency table allow to determine the following statistical scores, that have been used as reference metric to evaluate the performance of the proposed stroke detection algorithm.
  • Critical   Success   Index   ( C S I ) = H H + F + M ;
    (Range: 0 to 1; Perfect Score: 1.0)
  • Equitable   Threat   Score   ( E T S ) =   H ( ( H + F ) ( H + M ) n ) H + F + M ( ( H + F ) ( H + M ) n ) ;
    (Range: −1/3 to 1; Perfect Score: 1.0)
  • Frequency   Bias   Index   ( F B I ) = H + F H + M ;
    (Range: 0 to ; Perfect Score: 1.0)
  • Heidke   Skill   Score   ( H S S ) = 2 × ( H × N F × M ) [ ( H + M ) × ( M + N ) + ( H + F ) × ( F + N ) ] ;
    (Range: − to 1; Perfect Score: 1.0)
  • Hanssen Kuiper   Skill   Score   ( K S S ) = ( H × N F × M ) [ ( H + M ) × ( F + N ) ]
    (Range: −1 to 1; Perfect Score: 1.0)
  • Area under the ROC curve (AUC): It is a measure of the two-dimensional area underneath the ROC curve. The ROC curve is the curve in the plane of the probability of detection as a function of false alarm rate (POD = H/(H + M) and FAR = F/(F + N), respectively)
    (Range: 0 to 1; Perfect Score: 1.0)

References

  1. Holle, R.L.; López, R.E.; Zimmermann, C. Updated Recommendations for lightning Safety-1998. AMS 1998, 80, 2035–2041. [Google Scholar] [CrossRef]
  2. Nierow, A.; Showalter, R.C. An evaluation of using lightning data to improve aviation oceanic convective forecasting for the Gulf of Mexico. In Proceedings of the 19th Digital Avionics Systems Conference DASC, Philadelphia, PA, USA, 7–13 October 2000; Volume 1, pp. D5/1–D5/7. [Google Scholar]
  3. Poelman, D.R. On the Science of Lightning: An Overview; Royal Meteorological Institute: Uccle, Belgium, 2010; p. 56. [Google Scholar]
  4. Nag, A.; Murphy, M.J.; Schulz, W.; Cummins, K.L. Lightning locating systems: Insights on characteristics and validation techniques. Earth Space Sci. 2015, 2, 65–93. [Google Scholar] [CrossRef] [Green Version]
  5. Voormansik, T.; Rossi, P.J.; Moisseev, D.; Tanilsooa, T.; Post, P. Thunderstorm hail and lightning detection parameters based on dual-polarization Doppler weather radar data. Meteorol. Appl. 2017, 24, 521–530. [Google Scholar] [CrossRef]
  6. Takahashi, T. Riming electrification as a charge generation mechanism in thunderstorms. J. Atmos. Sci. 1978, 35, 1536–1548. [Google Scholar] [CrossRef]
  7. Jayaratne, E.R.; Saunders, C.P.R.; Hallet, J. Laboratory studies of the charging of soft hail during ice crystal interactions. Quart. J. R. Meteorol. Soc. 1983, 109, 609–630. [Google Scholar] [CrossRef]
  8. Kuettner, J.P.; Levin, Z.; Sartor, J.D. Thunderstorm electrification—Inductive or non-inductive? J. Atmos. Sci. 1981, 38, 2470–2484. [Google Scholar] [CrossRef]
  9. Baldini, L.; Roberto, N.; Montopoli, M.; Adirosi, E. Ground-based Weather Radar to Investigate Thunderstorms. In Remote Sensing of Clouds and Precipitation; Andronache, C., Ed.; Springer: Cham, Switzerland, 2018; pp. 113–135. ISBN 978-3-319-72582-6. [Google Scholar]
  10. Liu, H.; Chandrasekar, V. Classification of hydrometeors based on polarimetric radar measurements: Development of fuzzy logic and neuro-fuzzy systems, and in situ verification. J. Atmos. Ocean. Technol. 2000, 17, 140–164. [Google Scholar] [CrossRef]
  11. Galanaki, E.; Kotroni, V.; Lagouvardos, K.; Argiriou, A. A ten-year analysis of cloud-to-ground lightning activity over the Eastern Mediterranean region. Atmos. Res. 2015, 166, 213–222. [Google Scholar] [CrossRef]
  12. Goodman, S.J.; Buechler, D.E.; Wright, P.D. Polarization radar and electrical observations of microburst producing storms during COHMEX. In Proceedings of the AMS 24th Conference on Radar Meteorology, Tallahassee, FL, USA, 27–31 March 1989. [Google Scholar]
  13. Carey, L.D.; Rutledge, S.A. A multiparameter radar case study of the microphysical and kinematic evolution of a lightning producing storm. J. Meteorol. Atmos. Phys. 1996, 59, 33–64. [Google Scholar] [CrossRef]
  14. Carey, L.D.; Rutledge, S.A. The relationship between precipitation and lightning in tropical island convection: A C-band polarimetric study. Mon. Weather Rev. 2000, 128, 2687–2710. [Google Scholar] [CrossRef]
  15. López, R.E.; Aubagnac, J.P. The lightning activity of a hailstorm as a function of changes in its microphysical characteristics inferred from polarimetric radar observations. J. Geophys. Res. 1997, 102, 16799–16813. [Google Scholar] [CrossRef] [Green Version]
  16. Wiens, K.C.; Rutledge, S.A.; Tessendorf, S.A. The 29 June 2000 supercell observed during STEPS. Part II: Lightning and charge structure. J. Atmos. Sci. 2005, 62, 4151–4177. [Google Scholar] [CrossRef]
  17. Preston, A.D.; Fuelberg, H.E. Improving lightning cessation guidance using polarimetric radar data. Weather Forecast. 2015, 30, 308–328. [Google Scholar] [CrossRef]
  18. Roberto, N.; Adirosi, E.; Baldini, L.; Casella, D.; Dietrich, S.; Gatlin, P.; Panegrossi, G.; Petracca, M.; Sanò, P.; Tokay, A. Multi-sensor analysis of convective activity in central Italy during the HyMeX SOP 1.1. Atmos. Meas. Tech. 2016, 9, 535–552. [Google Scholar] [CrossRef] [Green Version]
  19. Chandrasekar, V.; Yanting, W.; Haonan, C. The CASA quantitative precipitation estimation system-a 5-yr validation study. Nat. Hazards Earth Syst. Sci. 2012, 12, 2811–2820. [Google Scholar] [CrossRef]
  20. Workman, E.J.; Reynolds, S.E. Electrical activity as related to thunderstorm cell growth. Phys. Rev. 1949, 74, 1231–1232. [Google Scholar]
  21. Larsen, H.R.; Stansbury, E.J. Association of lightning flashes with precipitation cores extending to height 7 km. J. Atmos. Terr. Phys. 1974, 36, 263–276. [Google Scholar]
  22. Marshall, J.S.; Radhakant, S. Radar precipitation maps as ligtning indicators. J. Appl. Meteorol. 1978, 17, 206–212. [Google Scholar] [CrossRef]
  23. Goodman, S.J.; Buechler, D.E.; Wright, P.D.; Rust, W.D. Stroke and precipitation history of a microburst-producing storm. Geophys. Res. Lett. 1988, 15, 1185–1188. [Google Scholar] [CrossRef]
  24. Dye, J.E.; Winn, W.P.; Jones, J.J.; Breed, D.W. The electrification of New Mexico thunderstorms, 1. Relationship between precipitation development and the onset of electrification. J. Geophys. Res. 1989, 94, 8643–8656. [Google Scholar] [CrossRef]
  25. Buechler, D.E.; Goodman, S.J. Echo size and asymmetry: Impact on NEXRAD storm identification. J. Appl. Meteorol. 1990, 29, 962–969. [Google Scholar] [CrossRef]
  26. Hondl, K.D.; Eilts, M.D. Doppler radar signatures of developing thunderstorms and their potential to indicate the onset of cloud-to-ground lightning. Mon. Weather Rev. 1994, 122, 1818–1836. [Google Scholar] [CrossRef]
  27. Gremillion, M.S.; Orville, R.E. Thunderstorm characteristics of cloud-to-ground lightning at the Kennedy Space Center, Florida: A study of lightning initiation signatures as indicated by the WSR-88D. Weather Forecast. 1999, 14, 640–649. [Google Scholar] [CrossRef]
  28. Vincent, B.R.; Carey, L.D.; Schneider, D.; Keeter, K.; Gonski, R. Using WSR-88D reflectivity data for the prediction of cloud-to-ground lightning: A North Carolina Study. Natl. Weather Digest 2004, 27, 35–44. [Google Scholar]
  29. Wolf, P. Anticipating the initiation, cessation, and frequency of cloud-to-ground lightning, utilizing WSR-88D reflectivity data. NWA Electron. J. Oper. Meteorol. 2007. Available online: nwafiles.nwas.org/ej/pdf/2007-EJ1.pdf (accessed on 1 October 2018).
  30. Helen Yang, Y.; King, P. Investigating the Potential of Using Radar Echo Reflectivity to Nowcast Cloud-to-Ground Lightning Initiation over Southern Ontario. Weather Forecast. 2010, 25, 1235–1248. [Google Scholar] [CrossRef]
  31. Mosier, R.M.; Schumacher, C.; Orville, R.E.; Carey, L.D. Radar Nowcasting of cloud-to-ground lightning over Houston, Texas. Weather Forecast. 2011, 26, 199–212. [Google Scholar] [CrossRef]
  32. Seroka, G.N.; Orville, R.E.; Schumacher, C. Radar Nowcasting of Total Lightning over the Kennedy Space Center. Weather Forecast. 2012, 27, 189–204. [Google Scholar] [CrossRef]
  33. Antonescu, B.; Burcea, S.; Tǎnase, A. Forecasting the onset of cloud-to-ground lightning using radar and upper-air data in Romania. Int. J. Climatol. 2013, 336, 1579–1584. [Google Scholar] [CrossRef]
  34. Woodard, C.J.; Carey, L.D.; Petersen, W.A.; Roeder, W.P. Operational utility of dual-polarization variables in lightning initiation forecasting. Electron. J. Oper. Meteorol. 2012, 13, 79–102. [Google Scholar]
  35. Wang, J.; Zhou, S.; Yang, B.; Meng, X.; Zhou, B. Nowcasting cloud-to-ground lightning over Nanjing area using S-band dual-polarization Doppler radar. Atmos. Res. 2016, 178–179, 55–64. [Google Scholar] [CrossRef]
  36. Amburn, S.A.; Wolf, P.L. VLD Density as a hail indicator. Weather Forecast. 1997, 12, 473–478. [Google Scholar] [CrossRef]
  37. Watson, A.I.; Holle, R.L.; Lopez, R.E. Lightning from two national detection networks related to vertically integrated liquid and echo-top information from WSR-88D radar. Weather Forecast. 1995, 10, 592–605. [Google Scholar] [CrossRef]
  38. MacGorman, D.R.; Filiaggi, R.; Holle, R.L.; Brown, R.A. Negative cloud-to-ground lightning flash rates relative to VIL, maximum reflectivity, cell height, and cell isolation. J. Stroke Res. 2007, 1, 132–147. [Google Scholar]
  39. Stagliano, J.J.; Valant-Spaight, B.; Kerce, J.C. Lightning Forecasting before the First Strike. In Proceedings of the American Meteorological Society 4th Conference on Meteorological Application of Stroke Data, Phoenix, AZ, USA, 11–15 January 2009. [Google Scholar]
  40. Lakshmanan, V.; Smith, T. Data mining storm attributes from spatial grids. J. Atmos. Ocean. Technol. 2009, 26, 2353–2365. [Google Scholar] [CrossRef]
  41. Smith, T.; Lakshmanan, V.; Stumpf, G.; Ortega, K.; Hondl, K.; Cooper, K.; Calhoun, K.; Kingfield, D.; Manross, K.; Toomey, R.; et al. Multi-Radar Multi-Sensor (MRMS) Severe Weather and Aviation Products: Initial Operating Capabilities. Bull. Am. Meteorol. Soc. 2016, 97, 1617–1630. [Google Scholar] [CrossRef]
  42. Betz, H.D.; Schmidt, K.; Laroche, P.; Blanchet, P.; Oettinger, W.P.; Defer, E.; Dziewit, Z.; Konarski, J. LINET—An international lightning detection network in Europe. Atmos. Res. 2009, 91, 564–573. [Google Scholar] [CrossRef]
  43. Montopoli, M.; Picciotti, E.; Telleschi, A.; Marzano, F.S. X-band weather radar monitoring of precipitation fields at urban scale: Spatial calibration and accuracy evaluation. In Proceedings of the 6th European Conference on Radar in Meteorology and Hydrology (ERAD), Sibiu, Romania, 6–10 September 2010. [Google Scholar]
  44. Van de Beek, C.Z.; Leijnse, H.; Stricker, J.N.M.; Uijlenhoet, R.; Russchenberg, H.W.J. Performance of high-resolution X-band radar for rainfall measurement in The Netherlands. Hydrol. Earth Syst. Sci. 2010, 14, 205–221. [Google Scholar] [CrossRef] [Green Version]
  45. Anagnostou, E.N.; Anagnostou, M.N.; Krajewski, W.; Kruger, A.; Miriovsky, B. High-resolution rainfall estimation from X-band polarimetric radar measurements. J. Hydrometeorol. 2004, 5, 110–128. [Google Scholar] [CrossRef]
  46. Marzano, F.S.; Budillon, G.; Picciotti, E.; Montopoli, M.; Zinzi, A.; Buonocore, B. X-band weather radar monitoring real-time products in Rome and Naples urban areas. In Proceedings of the Tyrrhenian Workshop on Advances in Radar and Remote Sensing, Naples, Italy, 12–14 September 2012. [Google Scholar]
  47. Capozzi, V.; Picciotti, E.; Mazzarella, V.; Budillon, G.; Marzano, F.S. Fuzzy-logic detection and probability of hail exploiting short-range X-band weather radar. Atmos. Res. 2018, 201, 17–33. [Google Scholar] [CrossRef]
  48. Capozzi, V.; Picciotti, E.; Mazzarella, V.; Budillon, G.; Marzano, F.S. Hail storm hazard in urban areas: Identification and probability of occurrence by using a single-polarization X-band weather radar. Hydrol. Earth Syst. Sci. Discuss. 2016. [Google Scholar] [CrossRef]
  49. LINET Network. Available online: https://www.ingesco.com/en/products/linet-network (accessed on 25 September 2017).
  50. Capozzi, V.; Picciotti, E.; Budillon, G.; Marzano, F.S. X-band weather radar monitoring of precipitation fields in Naples urban areas: Data quality, comparison and analysis. In Proceedings of the Eighth European Conference on Radar in Meteorology and Hydrology, Garmisch-Partenkirchen, Germany, 1–5 September 2014. [Google Scholar]
  51. Alberoni, P.P.; Andersson, T.; Mezzasalma, P.; Michelson, D.B.; Nanni, S. Use of the vertical Reflectivity profile for Identification of Anomalous propagation. Meteorol. Appl. 2001, 8, 257–266. [Google Scholar] [CrossRef]
  52. Fulton, R.A.; Breidenbach, J.P.; Seo, D.; Miller, D.; O’Bannon, T. The WSR-88D Rainfall Algorithm. Weather Forecast. 1998, 13, 377–395. [Google Scholar] [CrossRef]
  53. Delrieu, G.; Hucke, L.; Creutin, J.D. Attenuation in Rain for X- and C-Band Weather Radar Systems: Sensitivity with respect to the Drop Size Distribution. J. Appl. Meteorol. 1999, 38, 57–68. [Google Scholar] [CrossRef]
  54. Delrieu, G.; Serrar, S.; Guardo, E.; Creutin, J.D. Rain Measurement in Hilly Terrain with X-Band Weather Radar Systems: Accuracy of Path-Integrated Attenuation Estimates Derived from Mountain Returns. J. Atmos. Oceanic Technol. 1999, 16, 405–416. [Google Scholar] [CrossRef]
  55. Smyth, T.J.; Illingworth, A.J. Correction for attenuation of radar reflectivity using polarisation data. Q. J. R. Meteorol. Soc. 1998, 124, 2393–2415. [Google Scholar] [CrossRef]
  56. Betz, H.D.; Schmidt, K.; Oettinger, W.P.; Wirz, M. Lightning Detection with 3D Discrimination of Intracloud and Cloud-to-Ground Discharges. Geophys. Res. Lett. 2004, 31, L11108. [Google Scholar] [CrossRef]
  57. Höller, H.; Betz, H.D.; Schmidt, K.; Calheiros, R.V.; May, P.; Houngninou, E.; Scialom, G. Lightning characteristics observed by a VLF/LF stroke detection network (LINET) in Brazil, Australia, Africa and Germany. Atmos. Chem. Phys. 2009, 9, 7795–7824. [Google Scholar] [CrossRef] [Green Version]
  58. Maki, M.; Park, S.-G.; Bringi, V.N. Effect of natural variations in rain drop size distributions on rain rate estimators of 3 cm wavelength polarimetric radar. J. Meteorol. Soc. Jpn. 2005, 83, 871–893. [Google Scholar] [CrossRef]
  59. Boudala, F.S.; Isaac, G.A.; Hudak, D. Ice water content and precipitation rate as a function of equivalent radar reflectivity and temperature based on in situ observations. J. Geophys. Res. 2006, 111, D11. [Google Scholar] [CrossRef]
  60. Johnson, J.T.; Mackeen, P.L.; Witt, A.; Mitchell, E.D.; Stumpf, G.; Eilts, M.D.; Thomas, K.W. The Storm Cell Identification and Tracking Algorithm: An Enhanced WSR-88D Algorithm. Weather Forecast. 1998, 13, 263–276. [Google Scholar] [CrossRef]
  61. Matthews, J.; Trostel, J. An Improved Storm Cell Identification and Tracking (SCIT) Algorithm based on DBSCAN and JPDA Tracking Methods. In Proceedings of the 21st International Stroke Meteorological Conference, Orlando, FL, USA, 19–22 April 2010. [Google Scholar]
  62. Wilks, D. Statistical Methods in Atmospheric Sciences, 2nd ed.; Academic Press: Burlington, NJ, USA, 2006; pp. 255–264. [Google Scholar]
  63. Zadeh, L.A. Fuzzy sets. Inf. Control 1965, 8, 338–353. [Google Scholar] [CrossRef] [Green Version]
  64. Wu, W.; Mallet, Y.; Walczak, B.; Penninckx, W.; Massart, D.L.; Heuerding, S.; Erni, F. Comparison of regularized discriminant analysis, linear discriminant analysis and quadratic discriminant analysis, applied to NIR data. Anal. Chim. Acta 1996, 329, 257–265. [Google Scholar] [CrossRef]
  65. Duda, R.O.; Hart, P.E.; Stork, D.G. Pattern Classification; Wiley: New York, NY, USA, 2001. [Google Scholar]
  66. Zomer, S.; Sánchez, M.D.N.; Brereton, G.; Pavon, J.L.P. Active Learning Support Vector Machines for Optimal Sample Selection in Classification. J. Chemometr. 2004, 18, 294–305. [Google Scholar] [CrossRef]
  67. Dixon, S.J.; Brereton, R.G. Comparison of performance of five common classifiers represented as boundary methods: Euclidean Distance to Centroids, Linear Discriminant Analysis, Quadratic Discriminant Analysis, Learning Vector Quantization and Support Vector Machines, as dependent on data structure. Chemometr. Intell. Lab. Syst. 2009, 95, 1–17. [Google Scholar]
Figure 1. In (a), a map of study region, including WR-10X radar (filled-in red star) and Mount Vesuvio (blue triangle) locations, is presented. The red circular line at 72 km from Naples Castel Sant’Elmo indicates the limit of the area covered by the radar. In (b), WR-10X installation at Naples Castel Sant’Elmo Site is shown. In (c), a picture of LIghtning NETwork (LINET) stroke detection sensor, retrieved from [49], is presented.
Remotesensing 10 01797 g001
Figure 2. In (a), the Vertical Maximum Intensity (VMI) reflectivity map collected by WR-10X on 27 October 2012 at 14:25 UTC is presented. The zoom on Naples Gulf emphasizes the presence of ground and sea clutters, whose most important evidences are indicated by black circles. Panel (b) shows the same reflectivity map, obtained after applying the quality control algorithms developed to suppress ground and sea echoes.
Remotesensing 10 01797 g002
Figure 3. Example of rain cells observed by the WR-10X radar on 27 October 2012 at 14:35 UTC. Panel (a) VMI of radar reflectivity factor. Panel (b) output of the rain cell identification procedure, where the area occupied by each rain cell is color coded. The distribution of strokes registered by the LINET network in the two minutes coincident with the radar acquisition, namely between 14:35 and 14:36 UTC, is overimposed to rain cell patterns. Panel (c) Range Height Indicator (RHI) referred to the azimuth at 139°, shown in the panel (a) by the black radial line. In this panel, some radar-based stroke predictors, such as ∆H30dBZ,−20°C, A40dBZ,−10°C, and the environmental variables H0°C, H−10°C, and H−20°C are shown. The cloud-to-ground (CG) and intra-cloud (IC) strokes are also highlighted as black crosses and magenta filled-in circles, respectively. The panel (d) shows VII, VIW, and VTI for the same rain cell in the upper right panel.
Remotesensing 10 01797 g003
Figure 4. Histograms of ∆Hmax40dBZ,−20°C (a); VIImax (b) and of A40dBZ,−10°C (c). The frequency distribution obtained for SRCG = 0 cases is highlighted in blue, whereas the one for SRCG > 0 cases is shown in green. The histograms have been determined from the entire dataset of convective cells.
Remotesensing 10 01797 g004
Figure 5. Behavior of Critical Success Index (CSI) score for different percentile levels of the following single-parameter criteria: ∆Hmax40dBZ,−20°C (blue curve), VIImax (red curve) and A40dBZ,−10°C (black curve). The three optimal thresholds (∆Hmax40dBZ,−20°C = −2.3 km, VIImax = 0.9 kg m−2 and A40dBZ,−10°C = 0.7 km2) have been determined from training dataset.
Remotesensing 10 01797 g005
Figure 6. Scatter plot of VIImax against ∆Hmax40dBZ,−20°C for the training dataset, which includes 2580 convective cells. The SRCG > 0 and SRCG = 0 classes are highlighted as red filled-in circles and blue filled-in circles, respectively. A two-dimensional (2D) rendering of the boundary decision functions is provided, by keeping the A40dBZ,−10°C parameter constant to 1.0 km2. The yellow, black, green, and magenta curves show the quadratic classifier obtained from Quadratic Discriminant Analysis (QDA) method, the decision function determined from Support Vector Machine-Gaussian model (SVM-G) and Support Vector Machine-linear kernel function (SVM-L), and the boundary function for the fuzzy logic (FL) technique, respectively.
Remotesensing 10 01797 g006
Figure 7. Comparison between the number of rain cells producing strokes observed by LINET (x-axis) and detected by QDA-based multi-parameter algorithm (y-axis) for each thunderstorm day. Pearson correlation coefficient is overimposed to the scatter plot.
Remotesensing 10 01797 g007
Table 1. Results from previous studies of stroke nowcasting using radar-based predictors. For all the studies T (isotherm level) is the environmental temperature, with the only exception of Wolf (2007), where T is the updraft temperature.
AuthorsRadar BandNumber of CellsDetection StrategyPODFARCSI
Buechler and Goodman (1990)S20Z = 40 dBZ, T = −10 °C1.000.200.80
Hondl and Eilts (1994)S (Doppler)28Z = 10 dBZ, T = −10 °C1.000.180.82
Gremillion and Orville (1999)S39Z = 40 dBZ, T = −10 °C0.840.070.79
Z = 25 dBZ, T = −15 °C0.840.240.67
Vincent et al., (2004)S50Z = 40 dBZ, T = −15 °C0.860.310.63
Z = 35 dBZ, T = −10 °C1.000.410.59
Wolf (2007)S1164Z = 40 dBZ, T = −10 °C0.960.110.86
Yang and King (2010)C (dual pol.)143Z = 40 dBZ, T = −10 °C0.880.160.76
Mosier et al., (2011)S67,384Z = 35 dBZ, T = −10 °C0.840.420.52
Z = 40 dBZ, T = −10 °C0.670.330.51
Z = 35 dBZ, T = −15 °C0.720.340.53
Z = 40 dBZ, T = −15 °C0.510.240.44
Z = 30 dBZ, T = −20 °C0.870.420.56
VII = 0.42 kg m−2 and VII = 0.58 kg m−2n.a. 1n.a.0.68
Seroka et al., (2012)S17,000Z = 25 dBZ, T = −20 °C0.780.350.55
VII = 0.84 kg m−20.750.440.47
Woodward et al., (2012)C (dual pol.)50Graupel PID at −15 °C0.930.030.91
Antonescu et al., (2013)S, C49Z = 35 dBZ, T = −10 °C0.950.100.85
Wang et al., (2016)S (dual pol.)83Z = 40 dBZ, T = −10 °C0.870.160.76
Roberto et al., (2016)C (dual pol.)Based on 11 convective eventsIWCg > 0 g cm−30.850.25n.a.
Voormansik et al., (2017)C (dual pol.)123,360Maximum height of Z = 20 dBZ0.780.550.39
1 n.a. stands for data not available.
Table 2. Technical features of WR-10X weather radar operating in Naples urban area.
Main Paramaters of WR-10X Weather Radar
Frequency9.4 GHz
Pulse Repetition Frequency (PRF)800 Hz
Peak power10 kW
VCP modeSix elevations (1°, 2°, 3°, 4°, 5° and 10°) scanned and processed in 10 min with pulse width of 0.6 µs
Range resolution300 m
Angular resolution3° azimuth
Antenna diatameter70 cm
Vertical Lobe width<3.2°
Sidelobes within ±10°<25 dB
Antenna gain>35 dB
Sensitivity10 dBZ at 25 km
Table 3. Key-parameter settings of Storm Cell Identification and Tracking (SCIT) algorithm. A detailed description of the listed parameters can be found in [60].
Main Parameters of SCIT Algorithm
Reflectivity thresholds30, 35 and 40 dBZ
Azimuthal separation
Segment length overlap2.0 km
Component Area5 km2
Number of segments2
Table 4. Pearson correlation coefficient between the investigated radar-based detection variables and the stroke rate (SR) measured by LINET within the radar coverage in ∆t = 2 min. Results are partitioned in terms of CG, IC, and all types of strokes.
MethodPredictive VariablesSRCGSRICSRAll
DIHHmax30dBZ,−20°C0.360.170.32
Hmax30dBZ,−10°C0.360.170.32
Hmax40dBZ,−20°C0.350.190.32
Hmax40dBZ,−10°C0.350.190.32
Hmax40dBZ,0°C0.350.190.32
VIRVIWmax0.130.060.11
VIImax0.340.230.33
VTImax0.180.080.15
VIWDmax0.070.020.06
VIIDmax0.220.140.22
VTIDmax0.080.020.07
TWC0.210.140.20
TIC0.310.170.29
LAA30dBZ,−20°C0.280.130.25
A30dBZ,−10°C0.340.150.29
A40dBZ,−20°C0.320.200.30
A40dBZ,−10°C0.420.250.39
A40dBZ,0°C0.400.260.39
Table 5. Estimate of the separation distance between the histograms in Figure 3 obtained for SRCG = 0 and for SRCG > 0 for the radar-based stroke predictors selected from correlation analysis. The results are presented in terms of joint probability (%). Bold numbers indicate the predicting variable showing the lower overlap between the histograms in each homogeneous dataset.
Predicting Variables xjJoint Probability (%)
p ( x j S R C G = 0 ,   x j S R C G > 0 )
Hmax30dBZ,−20°C0.633
Hmax30dBZ,−10°C0.638
Hmax40dBZ,−20°C0.619
Hmax40dBZ,−10°C0.620
Hmax40dBZ,0°C0.627
TIC0.636
VIImax0.627
A40dBZ,−10°C0.616
A40dBZ,0°C0.638
Table 6. Statistical scores indexes resulting from verification analysis using seven different detection criteria. The first three methods use a single-parameter approach (∆H40dBZ,−20°C, VIImax, and A40dBZ,−10°C, respectively), whereas the other four involve a multi-parameter approach, through the FL, the QDA, the SVM-L, and the SVM-G membership function. Bold numbers indicate the criterion showing the best results for the five different score indexes. The last two columns show, for each score index, the minimum and maximum improvements (in percentage) introduced by QDA methods with respect to the worst and best single-parameter approach. The score indexes that were adopted in the verification analysis are defined in Appendix A.
Score IndexDetection MethodologyImprovement of QDA wrt. Single Variable Approach (%)
Single-Variable Stroke Detection ApproachMulti-Variable Stroke Detection Approach
H40dBZ,−20°C = −2.3 (km)VIImax = 0.9 (kg m−2)A40dBZ,−10°C = 0.7 (km2)FLQDASVM-LSVM-GMaxMin
CSI0.500.480.460.490.530.420.46+15.0+6.0
ETS0.290.200.240.210.340.250.27+70.0+17.0
FBI1.191.390.981.411.000.630.77+23.1+2.0
HSS0.350.330.390.350.420.410.43+27.0+7.0
KSS0.360.360.380.370.420.380.41+16.0+10.5
AUC0.630.730.730.760.780.780.75+25.8+6.8
Table 7. Statistical scores for QDA-based criterion obtained with respect to eight different sampling scenarios. The first one (“All cells”) refers to the entire test dataset of convective cells. The others allow evaluating the sensitivity of the multi-parameter algorithm to the impact of some potential issues (details are provided in the text). Bold numbers indicate the scenario showing the best results for the five different score indexes.
Score IndexesSensitivity Analysis—Sampling Scenario
All CellsAttenuated CellsNon-Attenuated CellsNo cells in the Southern AzimuthCells between 30 and 40 kmCells between 40 and 50 kmCells between 50 and 60 kmCells over 60 km
CSI0.530.510.550.530.490.510.540.60
ETS0.340.320.350.330.340.330.310.31
FBI1.001.081.061.081.081.060.971.18
HSS0.420.380.450.410.450.420.360.34
KSS0.420.380.460.420.460.420.360.33
AUC0.780.760.790.770.770.770.760.75
Number of cells3174175614183005987959677551

