Article

Comparison and Bias Correction of TMPA Precipitation Products over the Lower Part of Red–Thai Binh River Basin of Vietnam

1
School of Earth, Ocean and the Environment, University of South Carolina, Columbia, SC 29208, USA
2
National Center for Water Resources Planning and Investigation, Ministry of Natural Resources and Environmental, Hanoi 100000, Vietnam
3
Berry College, Mount Berry, GA 30149, USA
4
Hydrological Sciences Laboratory, NASA Goddard Space Flight Center, Greenbelt, MD 20771, USA
*
Author to whom correspondence should be addressed.
Remote Sens. 2018, 10(10), 1582; https://doi.org/10.3390/rs10101582
Submission received: 5 September 2018 / Revised: 20 September 2018 / Accepted: 24 September 2018 / Published: 1 October 2018
(This article belongs to the Special Issue Remote Sensing of Precipitation)

Abstract

:
As the limitation of rainfall collection by ground measurement has been widely recognized, satellite-based rainfall estimate is a promising high-resolution alternative in both time and space. This study is aimed at exploring the capacity of the satellite-based rainfall product Tropical Rainfall Measurement Mission (TRMM) Multi-satellite Precipitation Analysis (TMPA), including 3B42V7 research data and its real-time 3B42RT data, by comparing them against data from 29 ground observation stations over the lower part of the Red–Thai Binh River Basin from March 2000 to December 2016. Various statistical metrics were applied to evaluate the TMPA products. The results showed that both 3B42V7 and 3B42RT had weak relationships with daily observations, but 3B42V7 data had strong agreement on the monthly scale compared to 3B42RT. Seasonal analysis showed that 3B42V7 and 3B42RT underestimated rainfall during the dry season and overestimated rainfall during the wet season, with high bias observed for 3B42RT. In addition, detection metrics demonstrated that TMPA products could detect rainfall events in the wet season much better than in the dry season. When rainfall intensity was analyzed, both 3B42V7 and 3B42RT overestimated the no rainfall event during the dry season but underestimated these events during the wet season. Finally, based on the moderate correlation between climatology–topography characteristics and correction factors of linear-scaling (LS) approach, a set of multiple linear models was developed to reduce the error between TMPA products and the observations. The results showed that climatology–topography-based linear-scaling approach (CTLS) significantly reduced the percentage bias (PBIAS) score and moderately improved the Nash–Sutcliffe efficiency (NSE) score. The finding of this paper gives an overview of the capacity of TMPA products in the lower part of the Red–Thai Binh River Basin regarding water resource applications and provides a simple bias correction that can be used to improve the correctness of TMPA products.

Graphical Abstract

1. Introduction

Precipitation is the most crucial input variable enforced in water prediction models. Reliable precipitation is required for model calibration, forecast, and simulation [1,2,3]. Gauge observation is the primary collection approach to obtain precipitation information [4]. However, gauge network is often sparse and nonexistent in many parts of the globe [5,6]. Moreover, it is often challenging to obtain gauge data, especially in developing countries and transboundary rivers, due to technical and administrative reasons [7,8,9]. In addition, gauge observations only provide point measurements of precipitation and cannot capture the full spatial variability. Space-based precipitation estimations, therefore, have great potential application to enhance the capacity of measuring this vital water cycle component [10,11].
Several satellite-derived datasets have been used in previous studies, such as the Tropical Rainfall Measurement Mission (TRMM) Multi-satellite Precipitation Analysis (TMPA) [12], the Precipitation Estimation from Remotely Sensed Information using Artificial Neural Networks (PERSIANN) [13], the Climate Hazards Group Infrared Precipitation with Stations (CHIRPS) [14], and National Oceanic and Atmospheric Administration/Climate Prediction Centre (NOAA/CPC) morphing technique (CMORPH) [15] products. Among them, TPMA—the first space-borne product of the Earth Science Mission aimed at studying tropical and subtropical rainfall—has performed well in a wide range of applications, such as hydrological modeling [16,17,18], drought monitoring [19,20], and agronomy [21,22]. TMPA products have also been evaluated as having better performance than other satellite-based rainfall products. For example, the TMPA 3B42V7 data is generally a better input in a distributed hydrological model compared to CMORPH and TMPA 3B42RT (real time) for multiple hydrological purposes, including annual water budgeting, monthly and daily streamflow simulation, and extreme flood modeling [23]. Similarity, Tong et al. [24] showed that 3B42V7 was a better driving force of hydrological model for both monthly and daily streamflow simulation over the Tibetan Plateau compared to CMORPH, PERSIANN, and 3B42RT. Moazami et al. used six statistical indices and contingency table to evaluate 3B42V7, concluding it was a better estimation of daily precipitation than PERSIAN and 3B42RT over Iran [25]. Simons et al. [26] identified that monthly TMPA 3B43 rainfall product was the most suitable satellite dataset compared to CHIRPS and CMORPH over the Red River Basin of Vietnam.
Differences between TMPA products and rain gauge observation analysis have been a cause of concern recently. Zad et al. [27] pointed out that 3B42V7 tended to overestimate rainfall measurement by approximately 26.95% at Pahang River Basin of Malaysia and that 3B42V7 was likely to have a high accuracy of detecting rainfall events at high-altitude and mid-altitude areas compared to low-altitude regions. Kneis et al. [28] analyzed that 3B42V7 and 3B42RT datasets were moderately correlated with their gauged-based counterpart at sub-basin level (4000 to 16,000 km2) at the lower Mahanadi River Basin of India but that the 3B42V7 and 3B42RT data often do not reflect gauge observation at high-intensity level (>80 mm/day). The TMPA product is also likely to perform better on a monthly scale when compared to the ground data. Curtarelli et al. [29] found that monthly 3B43 dataset had a great consistency (correlation coefficient >0.97) with ground observation data over the Itumbiara Reservoir drainage area in Central Brazil but that 3B43 tended to overestimate rainfall by 1.24%. Comparing monthly 3B43 dataset with 56 observations in Yangtze River Delta, Cao et al. [30] also showed an inclination of 3B43 to overestimate monthly rainfall, with the bias ranging between −10% and 10% most of the study area; its correlation coefficient with observation was found to peak in March (0.96) and reach bottom in August (0.79). Although the TRMM satellite has not been operated since 2014, TMPA products are still being generated regardless [31].
Following the highly successful TMPA, the Global Precipitation Measurement (GPM) mission was developed to continuously increase precipitation estimation over most of the globe [32]. A range of studies in many regions have demonstrated that GPM outperforms TMPA by having a better spatial resolution, coverage area, and lower systematic bias error [33,34,35]. However, GPM has only been available for a short time (since 2014), while TMPA products date back to January 1998. In addition, GPM is just a slight improvement over TMPA products [36]. Huffman et al. [32] aim to extend the GPM data to the same length as the longest TMPA data. Therefore, assessments on TMPA products are of paramount importance to gain insights into their performance at various regions so that their algorithms can be improved and the next generation GPMs can be developed.
While there is a clear advantage of having a high temporal and spatial resolution using TMPA products, extra work is required because bias correction needs to be performed prior to application of any TMPA products in environmental, water resources, and ecological studies [27]. Climatology and topography are likely factors to induce errors in remote sensing retrievals [37]. Consequently, their effects on the quality of TMPA products are inevitable. Based on the moderate inverse linear relationship between the monthly 3B43 bias and elevation, Hashemi et al. [38] developed a linear model between 3B43 bias and elevation, especially for stations that have elevations above 1500 m above mean sea level in the U.S. The corrected monthly 3B43 product showed a significant improvement in the high elevation area. Thus, the empirical bias correction model using climatology and topography seems to be a potential investigation direction, although relatively little research has been conducted so far.
In Vietnam, ground observations provide poor spatial and temporal measurement of rainfall due to the lack of a dense network for rain gauge measurement. The average rain gauge network in Vietnam is around 400 km2 per rain gauge, which is below the World Meteorological Organization standard (area per rainfall station of 100–250 km2 for mountainous areas; area per rainfall station of 600–900 km2 for lowland areas) [39]. Moreover, the rain gauge distribution in Vietnam is uneven, with insufficient gauged stations at high elevation areas. According to the Vietnam Meteorological and Hydrological Administration, most rain gauge stations (75%) are concentrated at low elevation areas (<200 m), which only cover half of Vietnam’s land [40]. With these perspectives, satellite-based precipitation is an indispensable alternative source of precipitation data for Vietnam. Preliminary studies on satellite-based precipitation products in the country have been conducted recently. However, these studies either focused on monthly rainfall [26,41] or used directly satellite-derived rainfall without bias correction analysis [42]. Therefore, further research on satellite-based precipitation products is still of fundamental importance for the country.
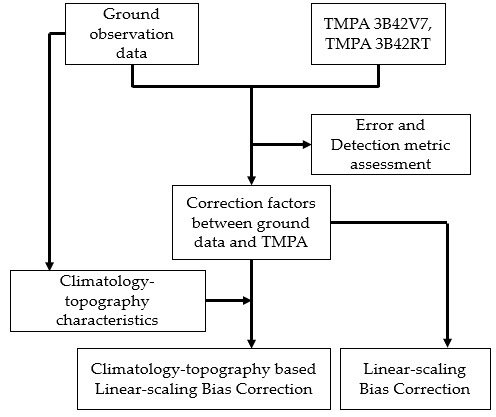
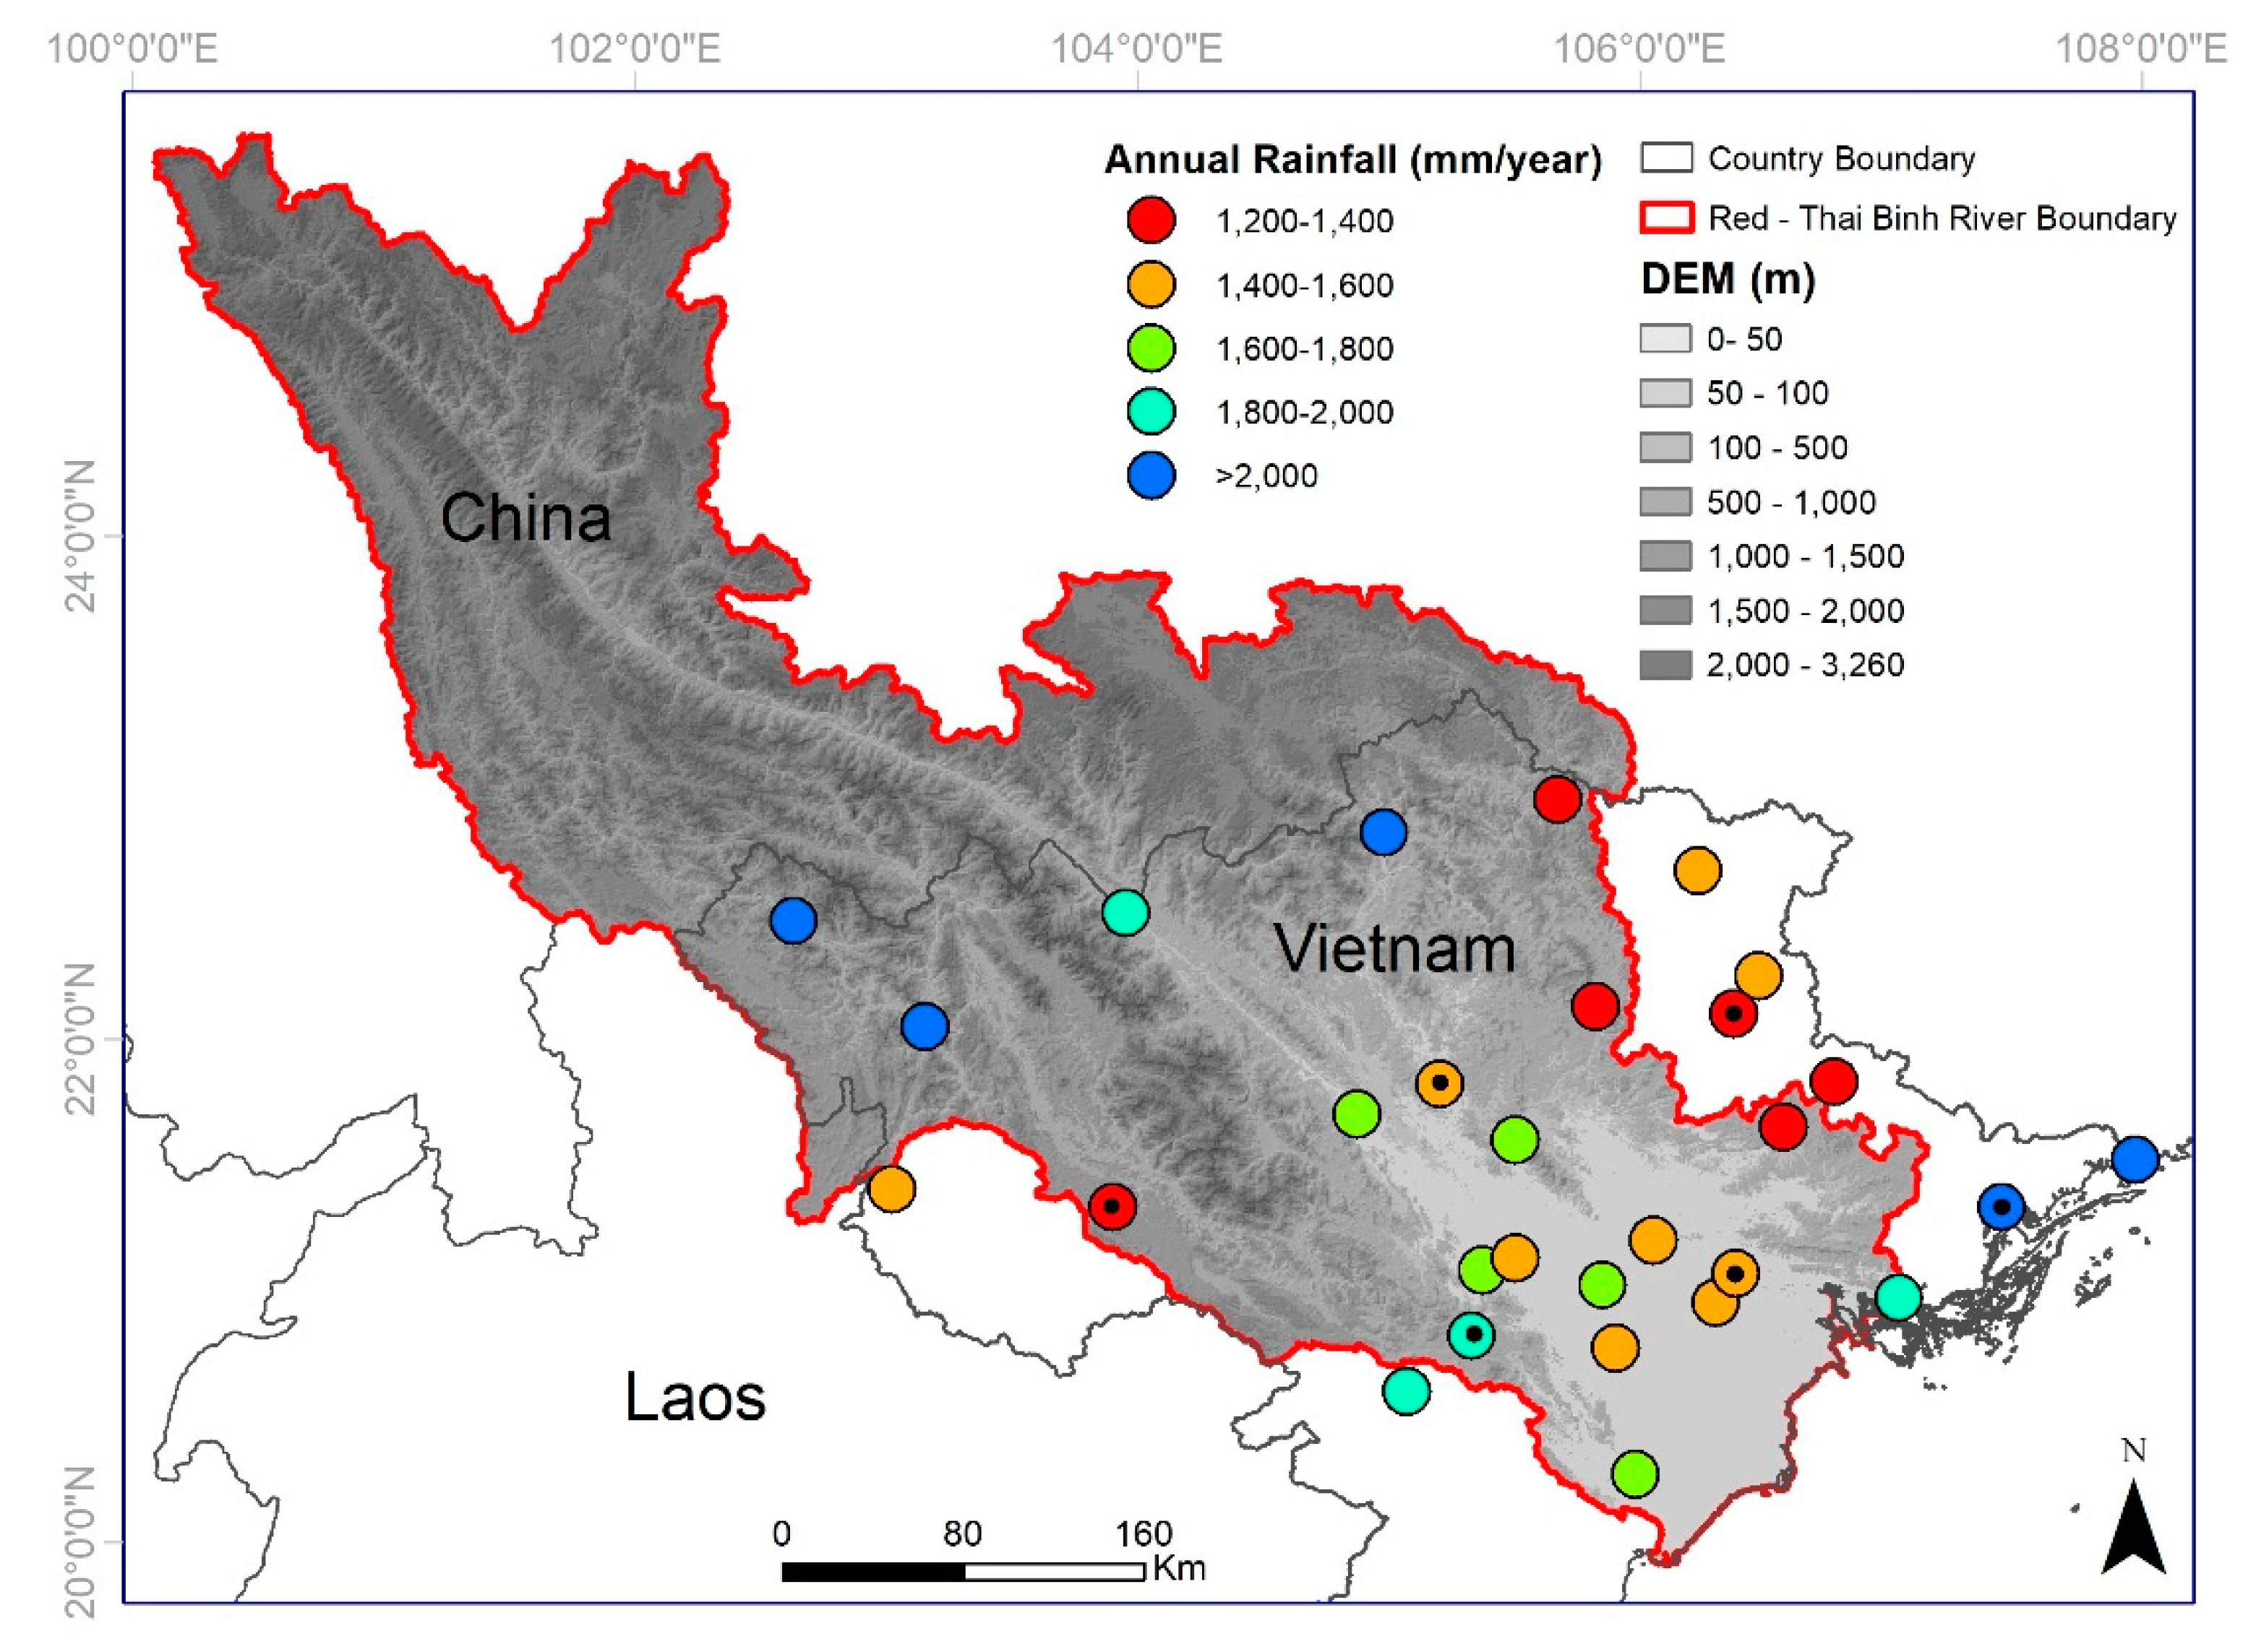
This study selected the Red–Thai Binh River Basin—one of the largest river systems in Vietnam—as a case study. Although it plays an essential role in Vietnam’s economic and social development, many parts of this basin do not have rainfall monitoring from ground, causing difficulties for basin rainfall estimation and water resources management. The first objective of this study was to compare the TMPA products 3B42V7 and 3B42RT with ground observation data over Red–Thai Binh River Basin in various aspects, such as calculating error statistics on a daily scale, monthly scale, dry and wet seasons, detecting rainfall events ability, and evaluating rainfall intensity. The second objective was to develop a linear-scaling bias correction model using climate–topography indices for both 3B42V7 and 3B42RT datasets. The results of the assessment and bias correction of TMPA precipitation products could help in supporting its potential application in hydrological modeling and drought monitoring in the studied region.

2. Materials

2.1. Study Area

The Red–Thai Binh River Basin is a transboundary river that flows through three countries—Vietnam, China, and Laos—with a total area of 169,000 km2 (Figure 1). The area of this in Vietnam is 88,680 km2, which makes up 51.3% of the total area. In this study, due to the lack of observation data, description of water resource characteristics and evaluation results of TMPA 3B42V7 and TMPA 3B42RT data only focused on the Vietnamese part of the basin. There are two primary river systems in the Red–Thai Binh River. The Red River system originates in China and flows into Vietnam through three main tributaries—Da, Lo, and the Thao River—while the Thai Binh River system is entirely located in Vietnam. The Red–Thai Binh River belongs to a tropical climate with two distinct seasons: the wet season and the dry season. The total annual rainfall is approximately 1700 mm, with high rainfall amounts (>2000 mm) observed in the mountainous areas between the Vietnam and China border. The annual total flow of the Red–Thai Binh River is 131.4 billion m3—the Chinese territory part generates 48.3 billion m3, while the rest 83.1 billion m3 is generated in the Vietnamese side [43]. As the second largest river system in Vietnam, the Red–Thai Binh River is home to 29.1 million Vietnamese (2015 figure), making up for 22.6% of Vietnam’s GDP (2010 figure) (General Statistics of Vietnam) [44].

2.2. Data

2.2.1. Observation Data

Rainfall measurements from a total of 29 daily rainfall stations (March 2000 to December 2016) within or neighboring the basin were collected from the Vietnam Meteorological and Hydrological Administration. The distribution of rainfall stations is presented in Figure 1, and their characteristics can be found in Table 1. The stations were selected due to their reliable data and low missing values (5–10%).
In Vietnam, daily ground rainfall data is often collected twice per day at 7.00 a.m. UTC + 7 and 7.00 p.m. UTC + 7, and the daily accumulation is calculated as accumulated rainfall from 7.00 a.m. UTC + 7 to the same time next day [45]. Figure 2 shows monthly rainfall distribution over Red–Thai Binh River Basin from gauge observation data. Wet season (May–October) has a high amount of rainfall, accounting for 85–90% of total annual rainfall. Very high amounts of rainfall are often observed during June, July, and August. During these periods, tropical storms often occur, with the accumulated rainfall reaching 200–600 mm within several days [44]. During the dry season (November–April), the total amount of rainfall only accounts for 10–15% of total annual rainfall.

2.2.2. TMPA Products

The TRMM is a low Earth orbits (LEO) satellite with sensors used to analyze and understand the characteristics of precipitation. The satellite is equipped with various instruments, such as Precipitation Radar (PR), TRMM Microwave Imager (TMI), Visible and Infrared Scanner (VIRS), and Lightning Imaging Sensor (LIS) [12]. The spatial coverage of TRMM is mainly in tropical and subtropical zones (50°S to 50°N) from an altitude of 400 km. The TMPA products used in this study were TMPA 3B42V7 and its real-time version TMPA 3B42RT at 0.25° spatial resolution. Detailed description of 3B42V7 can be found in Reference [12] and that of 3B42RT can be found in Reference [46]. The 3B42V7 dataset ranges from January 1998 to present, while the 3B42RT product ranges from March 2000 to present. However, for comparison purpose, a consistent data length was required and data was therefore collected from March 2000 to December 2016 for both TMPA 3B42V7 and TMPA 3B42RT. Both products were downloaded through NASA Goddard Space Flight Center (https://pmm.nasa.gov/data-access/downloads/trmm/). In order to match the satellite rainfall products with the daily precipitation gauge data, the 3-hourly 3B42 products were accumulated to daily values at 0.00 UTC (equivalent to 7.00 a.m. UTC + 7).

3. Method

The comparison of TMPA 3B42V7 and TMPA 3B42RT precipitation against the ground observation data involved the extraction of data time series of TMPA products at the corresponding locations of the 29 meteorological stations. As one TMPA pixel contained one rainfall station, a total of 29 TMPA pixels were extracted to form the time series corresponding to the ground observation data.

3.1. Error Metric Assessment

To compare rainfall values between TMPA products and ground observation data, widely accepted error metrics—correlation coefficient (CC), Nash–Sutcliffe efficiency (NSE), root mean square error (RMSE), and percent bias (PBIAS)—were used [47,48]. The formulas for the statistical metrics are presented as follows:
  CC =   i = 1 N ( O B S i O B S ¯ ) ( T M P A i T M P A ¯ ) i = 1 N ( O B S i O B S ¯ ) 2 i = 1 N ( T M P A i T M P A ¯ ) 2  
  NSE =   1   i = 1 N ( T M P A i O B S i ) 2 i = 1 N ( O B S i O B S ¯ ) 2  
  RMSE =   1 N i = 1 N ( T M P A i O B S i ) 2  
  PBIAS =   100   i = 1 N ( T M P A i O B S i ) i = 1 N O B S i  
where N is the total of samples, O B S i and T M P A i represent the rainfall values for the ground observation data and the TMPA data, respectively, and O B S ¯ and T M P A ¯   represent the mean of the corresponding variables. CC ranges from −1 to 1, with strong positive correlation when the CC value is closer to 1 and strong negative correlation when the CC value is closer to −1. NSE varies between −∞ to 1, indicating how well the plot of satellite product values and ground values fit the 1:1 line. A NSE value closer to 1 indicates a more perfect match between satellite product and ground data. RMSE is unit-based and would shed further light on the accuracy of the TMPA products. PBIAS measures the average tendency of the satellite values to be larger or smaller than the corresponding ground observations.

3.2. Detection Metric Assessment

The probability of detection (POD), false alarm ratio (FAR), the probability of false detection (POFD), and critical success index (CSI) were used to compare the occurrence and nonoccurrence of rainfall events between TMPA products and ground data [27,33,49]. The POD was the ratio of the total number of rainfall events correctly detected by the TMPA products to the total number of actual rainfall events. The FAR evaluated the ratio of the number of rainfall falsely detected by the TMPA products to the total rainfall events estimated by the TMPA products. The POFD was a fraction of false events detected by the TMPA products versus the correct observations of no rainfall events by the TMPA products. The CSI, which is a function of POD and FAR, was the most accurate detection metric. The rainfall day threshold was set as 0.6 mm/day, which was defined as a threshold between no rainfall event and low rainfall event within 24 h based on long-term rainfall analysis over Vietnam [50]. These detection metrics can be computed as follows:
  POD =   Hits Hits + Misses  
  FAR =   False   Alarms Hits + False   Alarms  
  POFD = False   Alarms False   Alarms + Correct   Rejections  
  CSI = Hits Hits + False   Alarms + Misses  
The Hit, Miss, False Alarm, and Correct Rejection are presented in a contingency table in Table 2. The perfect scores of the POD and CSI are 1, while the perfect scores of the POFD and FAR are 0.

3.3. Rainfall Intensity Evaluation

To evaluate the rainfall intensity, we used probability density function (PDF) to classify the daily rainfall amounts into six categories based on Vietnam’s regulation on rainfall classification [50]: (1) 0 to 0.6 mm; (2) 0.6 to 6 mm; (3) 6 to 16 mm; (4) 16 to 50 mm; (5) 50 to 100 mm; (6) >100 mm. The PDF analysis has been previously applied for comparing satellite rainfall products and ground data in several studies [33,36].

3.4. Climate–Topography-Based Linear-Scaling (CTLS) Bias Correction Approach

The linear-scaling (LS) approach [52,53] was based on monthly correction factor, which was the ratio between long-term monthly mean data for ground observation and TMPA.
  C F m =   O B S ¯ m T M P A ¯ m  
  T M P A i , m c o r r e c t e d =   T M P A i , m × C F m  
where C F m   is the monthly mean change factor at month m , O B S ¯ m and T M P A ¯ m   represent the mean of ground observation and TMPA data at month m, respectively. T M P A i , m c o r r e c t e d   and T M P A i , m   are the corrected TMPA data and original TMPA data at day i of month m , respectively. In this study, we developed a set of multiple linear models that predicted correction factors C F m from climatology–topography characteristics. We acquired station information as longitude (LONG), latitude (LAT), elevation (ELEV), annual rainfall (AR), standard deviation of rainfall (SDR), and the number of rainfall day (NRD). The C F m can be computed as follows:
  C F m =   α 0 m + α 1 m L O N G +   α 2 m L A T +   α 3 m E L E V +   α 4 m A R +   α 5 m S D R +   α 6 m N R D  
where α 0 m ,   α 1 m ,   α 2 m ,   α 3 m ,   α 4 m ,   α 5 m ,   α 6 m are regression coefficients corresponding to correction factor at month m. In other words, we developed a set of 12 multiple linear models to estimate correction factors from climatology–topography data. In order to select the most suitable candidates for each multiple linear model, we analyzed the relationship between the correction factor and climatology–topography for a single month and selected the significant correlation candidates. We used 23 meteorological stations (80%) to develop the abovementioned multiple linear models and six meteorological stations (20%) to verify the models.

4. Results and Discussion

4.1. Comparison between TMPA Products and Ground Observation Data

4.1.1. Daily and Monthly Scale Assessment

Table 3 presents the TMPA 3B42V7 and TMPA 3B42RT data in daily scale and monthly scale performance over the Red–Thai Binh River compared to the ground observation stations for 17 years (March 2000–December 2016). The results showed that daily rainfalls from both 3B42V7 and 3B42RT had very weak correlations with the ground observation data; the average of the CC and the average of NSE were 0.387 and −0.152 for 3B42V7 data and 0.304 and −0.521 for 3B42RT data, respectively. The negative NSE values demonstrated that TMPA values were less accurate than the mean of observed data and were therefore very poor estimations.
The statistics metric for monthly scale showed a significant improvement for both 3B42V7 and 3B42RT compared to ground data (Table 3). However, the PBIAS did not change from a daily to monthly scale. Monthly 3B42V7 and monthly 3B42RT had similar CC, with an average value of 0.896 and 0.842, respectively. However, monthly 3B42V7 data greatly outperformed monthly 3B42RT data regarding NSE, RMSE, and PBIAS. Average NSE of monthly 3B42V7 was 0.765 and no single station had a value smaller than 0.5, while average NSE of monthly 3B42RT was only 0.480. The monthly CC and NSE scores of 3B42V7 compared to ground data in this case study were very similar to the results of monthly 3B43 data compared to observations in the same basin [26]. Average RMSE of monthly 3B42V7 was 66.5 mm/month, equivalent to 30% less than the figure of monthly 3B42RT. Average PBIAS of monthly 3B42V7 was approximately 5 times less than that of monthly 3B42RT, with values of 3.2% and 14.8% respectively. The positive of PBIAS also indicated that both TMPA products overestimated compared to ground observation data. This finding was consistent with the study at the Black Volta Basin of West African countries [17] or Pahang River Basin of Malaysia [27], but it was contrary to the study in Iran [54]. It should be mentioned that although belonging to the same South East Asia region, the 3B42V7 data over the Red–Thai Binh River Basin performed better than that for Malaysia’s basin as the PBIAS of 3B42V7 for Malaysia’s basin was up to 26.95% on average [27].
We calculated various error metrics—CC, NSE, RMSE, and PBIAS. However, for TMPA’s spatial performance purpose, we only showed the spatial PBIAS score distribution. There were two reasons for this: (1) PBIAS is recommended in water resources planning projects because the overall difference between observed and estimated values is a criteria of paramount importance [55]; (2) PBIAS is precisely aimed at defining a poor model performance and has immense variation between seasons [56].
Looking at the PBIAS distribution, the PBIAS of 3B42V7 data mostly ranged within ±10%, while the PBIAS of 3B42RT data mostly fell in the range of 10–40% (Figure 3). The poor performance of 3B42RT data was observed at the center of the Red–Thai Binh River Basin. Moderate performances for both TMPA products were found at the northwestern mountainous area between Vietnam and Chinese border as well as the northeast coastal area.

4.1.2. Dry and Wet Season Assessment

Table 4 presents the performances of both daily and monthly 3B42V7 and 3B42RT during the dry season (November–April) and wet season (May–October) over the Red–Thai Binh River Basin. Generally, 3B42V7 data was better than 3B42RT data in all statistical metrics compared to ground stations, especailly NSE, RMSE, and PBIAS. For example, monthly 3B42V7 had moderate NSE metric compared to ground observation, with averages of 0.586 and 0.566 in the dry season and wet season, respectively. In contrast, the figures of monthly 3B42RT were quite low, with 0.199 and 0.009, respectively. Interestingly, although RMSE of daily 3B42V7 during both dry and wet seasons were quite similar to those of daily 3B42RT, aggregation daily 3B42V7 to monthly was significantly less than monthly 3B42RT during both dry and wet seasons, with a reduction of approximately 30% for each. Regarding PBIAS, 3B42V7 and 3B42RT had almost the same bias during the dry season; however, in the wet season, 3B42V7 had significantly low PBIAS, with a value of 6.1% compared to 20.7% PBIAS of 3B42RT. In regard to the dry and wet seasons, although CC and NSE were slightly higher during the dry season than during the wet season, it was not clearly evident. On the other hand, RMSE during the dry season was observed to be much smaller than during the wet season. This can be explained as dry season receives a small amount of rainfall (10–15% of total annual rainfall), and its rainfall variation is not high as the fluctuation during the wet season.
Both TMPA products showed overall negative PBIAS values during the dry season and overall positive PBIAS values during the wet season, indicating overall underestimations during the dry season and overall overestimations during the wet season. 3B42V7 was observed to underestimate ground observation at 20 out of 29 stations, and this figure was 24 out of 29 stations for 3B42RT (Figure 4). When we used scatter plot to compare monthly dry season of TMPA products and that of ground observation (data not shown), we found that TMPA products reported zero values in many months. The wrong no-rainfall reported by TMPA data was also found at Chindwin River Basin of Myanmar [57]. The underestimation of TMPA rainfall during the dry season was consistent with previous studies in Southwestern of China [58]. On the other hand, during the wet season, 22 out of 29 stations experienced overestimations for 3B42V7 data and 24 out of 29 stations experienced overestimation for 3B42RT data. The northwest mountain region and the northeast coastal area were the only places where both TMPA products underestimated ground observation data during two seasons. The overestimation of rainfall during the wet season agreed with a case study in Malaysia [27] but was contrary to a study involving the southwestern region of China [58].
Although they had a generally positive PBIAS score, TMPA products seemed to underestimate large rainfall amounts. One possible explanation for this could be their spatial resolution. With a rather low 0.25° spatial resolution (approximately 25 km), rainfall observed in a grid was averaged over about 625 km2. However, rainfall can vary dramatically even with a few kilometers, and the resolution of TMPA products are often unable to pick up these differences. If we consider the complexity of terrain, this variation can be harder to estimate. Additionally, many convective storms can have a rapid evolution that a satellite will often not be able to observe accurately [59].

4.1.3. Rainfall Detection Assessment

The capacity of 3B42V7 and 3B42RT data regarding rainfall detection over the Red–Thai Binh River Basin from March 2000 to December 2016 is presented in Figure 5. Generally, the detection capacity of daily TMPA products during the wet season was much better than during the dry season, and 3B42V7 data had slightly better score than 3B42RT data. This may be associated with the temporal resolution of TMPA data as short-duration rainfall events are a typical characteristic of the dry season. Indeed, with 3-hourly products, it is easy for TMPA to miss events lasting less than this figure. On the other hand, TRMM is meant to capture and estimate convective precipitation rather than other types because of its on-board sensors. In Vietnam, precipitation is generally associated with heavier storms and cloud coverage during the wet season [60], meaning the precipitation is more likely to be detected. In contrast, in the dry season, there will be much lighter rainfall with less cloud coverage and convection, meaning that it will be more difficult to detect [59].
The POD for the whole daily TMPA data was stable over the years, with the average values of about 0.61 and 0.58 for 3B42V7 and 3B42RT, respectively. The POD scores for the daily time series in the wet season period were higher, with average values of 0.71 and 0.69 for 3B42V7 and 3B42RT, respectively. The POD scores of 3B42V7 and 3B42RT for the daily time series in the dry season period were typically low, with average values of 0.32 and 0.30, respectively. In the year 2012, the POD scores during the dry season were the lowest at about 0.2. The FAR of the daily time series and the daily values in wet season were moderate, with average values of 0.37 and 0.36 corresponding to 3B42V7 and 0.40 and 0.38 corresponding to 3B42RT. However, the FAR of the time series in the dry season was high, with an average of 43% of 3B42V7 rainfall prediction being wrong (FAR = 0.43). The wrong prediction of 3B42RT was even more than that of 3B42V7, with average FAR being 0.50. Interestingly, FAR scores of 3B42V7 and 3B42RT had great fluctuation over the years, reaching 0.6 and 0.62 in the year 2000, respectively, but the wrong prediction was reduced to only 0.30 for 3B42V7 and 0.42 for 3B42RT in the year 2014. The POFD scores were moderate for both TMPA products, with average values of 0.15 and 0.16 for 3B42V7 and 3B42RT, respectively. The POFD scores during the dry season were relatively low, with all years reporting values less than 0.1 for both TMPA products. During the wet season, POFD scores were higher than those of the dry season, with a range of 0.2–0.3. The CSI scores showed that there was no single year during the study time where the CSI scores of both 3B42V7 and 3B42RT were over 0.5. During the wet season, the average CSI values were around 0.52 and 0.50 for 3B42V7 and 3B42RT, respectively. Regarding the dry season, the CSI were only about 0.24 and 0.21 for each TMPA product, and the lowest CSI scores in the dry season were observed in 2006 and 2012.
As CSI combines different aspects of POD and FAR to give an overall assessment of TMPA performance, we used this metric to investigate the detection metric of TMPA products on the spatial scale (Figure 6). The lowland central part of the basin experienced the worst CSI score, while the northwestern mountainous part of the basin had moderate CSI score (>0.5). The better detection capacity at high elevation region than the lower land area was consistent with the study in Malaysia’s basin [27].

4.1.4. Rainfall Intensity Analysis

The rainfall frequency distributions of ground observations, 3B42V7, and 3B42RT over the Red–Thai Binh River Basin are presented in Figure 7. Generally, rainfall intensity of both TMPA products followed the intensity of ground observations for the whole time series. Based on ground observation data, no rainfall (≤0.6 mm/day) accounted for 68.8% of total rainfall events, and 3B42V7 and 3B42RT data had similar figures. During the dry season, low rainfall intensity (0.6–6 mm/day) detected by TMPA datasets were relatively low (4.8% and 5.3% corresponding to 3B42V7 and 3B42RT) compared to the figure from ground measurement (13.1%). However, the no rainfall (≤0.6 mm/day) detected in the dry season was a different situation. The 3B42V7 estimated 86.4% of daily rainfall events during this season as no rainfall. Similarly, 88% of rainfall events during the dry season were considered as no rainfall events by 3B42RT. In contrast, the observations data only reported a figure of 79%. During the wet season, the no rainfall events by 3B42V7 and 3B42RT were relatively low (approximately 52% for both products), while the figure for observation data was nearly 60%. Regarding high rainfall events (50–100 mm/day) and heavy rainfall events (>100 mm/day), TMPA products had a high accuracy of detecting these, with the PDFs of both TMPA products almost the same as those of observation. The slight underestimation of low rainfall event (0.6–6 mm/day) was contrary to the overestimation conclusion of this rainfall intensity in a case study in Singapore [36].
As no rainfall and low rainfall intensity during the dry season and wet season experience significant differences between ground observations and TMPA data, we exploited the differences by analyzing seasonal spatial low rainfall and light rainfall’s intensity of TMPA products. PDF differences between each TMPA data and ground observation were calculated and are presented in Figure 8. The 3B42V7 and 3B42RT data had similar characteristics, which overestimated no rainfall during the dry season (10–15%) and low rainfall intensity during the wet season (0–5%). On the other hand, the TMPA products underestimated no rainfall during the wet season (10–13%) and low rainfall intensity during the dry season (10–15%). It was noticed that the above characteristics occurred similarly for areas throughout the basin and were not specific to a typical region.

4.2. Development of Bias Correction Model Using Climatology–Topography Characteristics-Based Linear-Scaling (LS) Approach

4.2.1. Correlation Analysis between Climatology–Topography Characteristics and Correction Factors of LS Approach

In the LS approach, the correction factor is an important key to adjust satellite data closely to observation. Correction factors between TMPA products and observations were calculated for each month. In total, we had 12 group correction factors for 3B42V7 and 3B42RT data. Table 5 and Table 6 present the relationship between correction factors in each month with climatology–topography characteristics. Based on the significant levels of the correlation coefficient, we found that topographical characteristics (LONG, LAT, and ELEV) were often associated with correction factors during dry months (except for April), while climate characteristics (AR, SDR, and NRD) were often linked with correction factors during wet months. A larger correction factor indicates larger error between satellite data and observations. ELEV (elevation) had a significant inverse relationship with the correction factor, meaning satellite data at higher elevation areas probably had a smaller error with observations compared to lower areas. This result agreed with an observation in Iran that compared 3B43V7 with rain gauge over this country [25]. Similarly, LAT (latitude) also had significant negative relationship with the correction factor. This meant that the higher the latitude area, the smaller was the satellite error. The frequency occurrence of clouds can affect the accuracy of satellite rainfall estimation [61], and NRD (a number of the rainy days) is a variable that reflects this frequency. As the number of rainy days had significant correlations with the correction factors with negative values, it seemed that the higher the number of rainy day stations, the more error of satellite-based rainfall there were. In addition, from Table 5 and Table 6, AR (annual rainfall rate) and SDR (standard deviation of rainfall) had significant positive correlations with the correction factors. This means the higher the rainfall rate area, the higher was the correction factor, implying a more substantial error. This feature was the same as previous literature [62]. As a result, the correction factor for each month could be estimated from significant climatology–topography candidates.

4.2.2. Multiple Linear Model Development to Estimate Correction Factors

As climatology–topography characteristics have various units, before building the multiple linear regression models for correction factors, we made it dimensionless for all input climatology–topography data by scaling them to a range [0.1, 0.9]. The multiple linear models for the correction factors of 3B42V7 and 3B42RT are presented in Table 7 and Table 8. All p-values were smaller than 0.5, indicating that sets of linear models using climatology–topography characteristics could well predict correction factors.

4.2.3. Calibration and Validation of the CTLS Bias Correction Approach

Table 9 compares the TMPA products before and after using the LS and CTLS approaches against the observations on a daily scale. Both calibration and validation data showed that LS and CTLS performed very well in reduction PBIAS scores but had moderate performances regarding NSE scores, slight improvements in RMSE scores, and almost no change in CC scores. Moreover, the linear-scaling model seemed to reduce errors better for 3B42RT data compared to that for 3B42V7 data. The reason for this may be that 3B42V7 data had already passed through the correction stage before the online public, meaning other bias correction approaches did not improve this product’s quality significantly. The good performances during calibration and validation stations of the CTLS approach indicated that empirical correction factors calculated by climatology and topography characteristics could be applied for the satellite-based data bias correction process throughout the Red–Thai Binh River Basin.
Regarding bias correction models on a monthly scale, similar results were observed as the daily scale, with a significant reduction in PBIAS scores after bias correction (Table 10). Moreover, the NSE scores of corrected monthly 3B42RT improved profoundly compared to those before bias correction. Before applying bias correction, the average monthly NSE for calibration and validation stations for 3B42RT data were 0.488 and 0.447, respectively. After using the LS approach, these figures improved to 0.734 and 0.713, respectively. Also, the empirical CTLS approach had considerable monthly NSE improvement, with values of 0.677 and 0.642 corresponding to calibration and validation stations.
Table 11 presents the performance of TMPA products regarding the PBIAS score before and after bias correction using LS and CTLS during the dry and wet seasons. The wet season seemed to benefit from bias correction more than the dry season. Using the LS approach, PBIAS scores for both 3B42V7 and 3B42RT were equal to 0, while the figures for the dry season were up to 10%. With the CTLS approach, PBIAS scores during the wet season also observed a significant decrease, ranging from 0.07% to 4.55%. During the dry season, highly positive PBIAS scores (up to 24%) were observed, indicating a high overestimation of dry season after bias correction.
Table 12 shows the CSI scores for TMPA products against observations before and after bias correction using LS and CTLS during daily, daily (dry season), and daily (wet season). Generally, there was no significant change in CSI scores after bias correction compared to before bias correction for both products and for both bias correction approaches. By analyzing the intensity metric before and after doing bias correction (data not shown), we also obtained the same results as that of detection metric, i.e., after doing bias correction, there was no significant change in the intense rainfall for TMPA products.

5. Conclusions

TMPA products are recommended for wide use over the tropical and subtropical regions due to their high temporal–spatial resolution. Therefore, this study carried out a comparison and bias correction between TMPA 3B42V7 and TMPA 3B42RT data and 29 ground observations over the lower part of the Red–Thai Binh River Basin from March 2000 to December 2016.
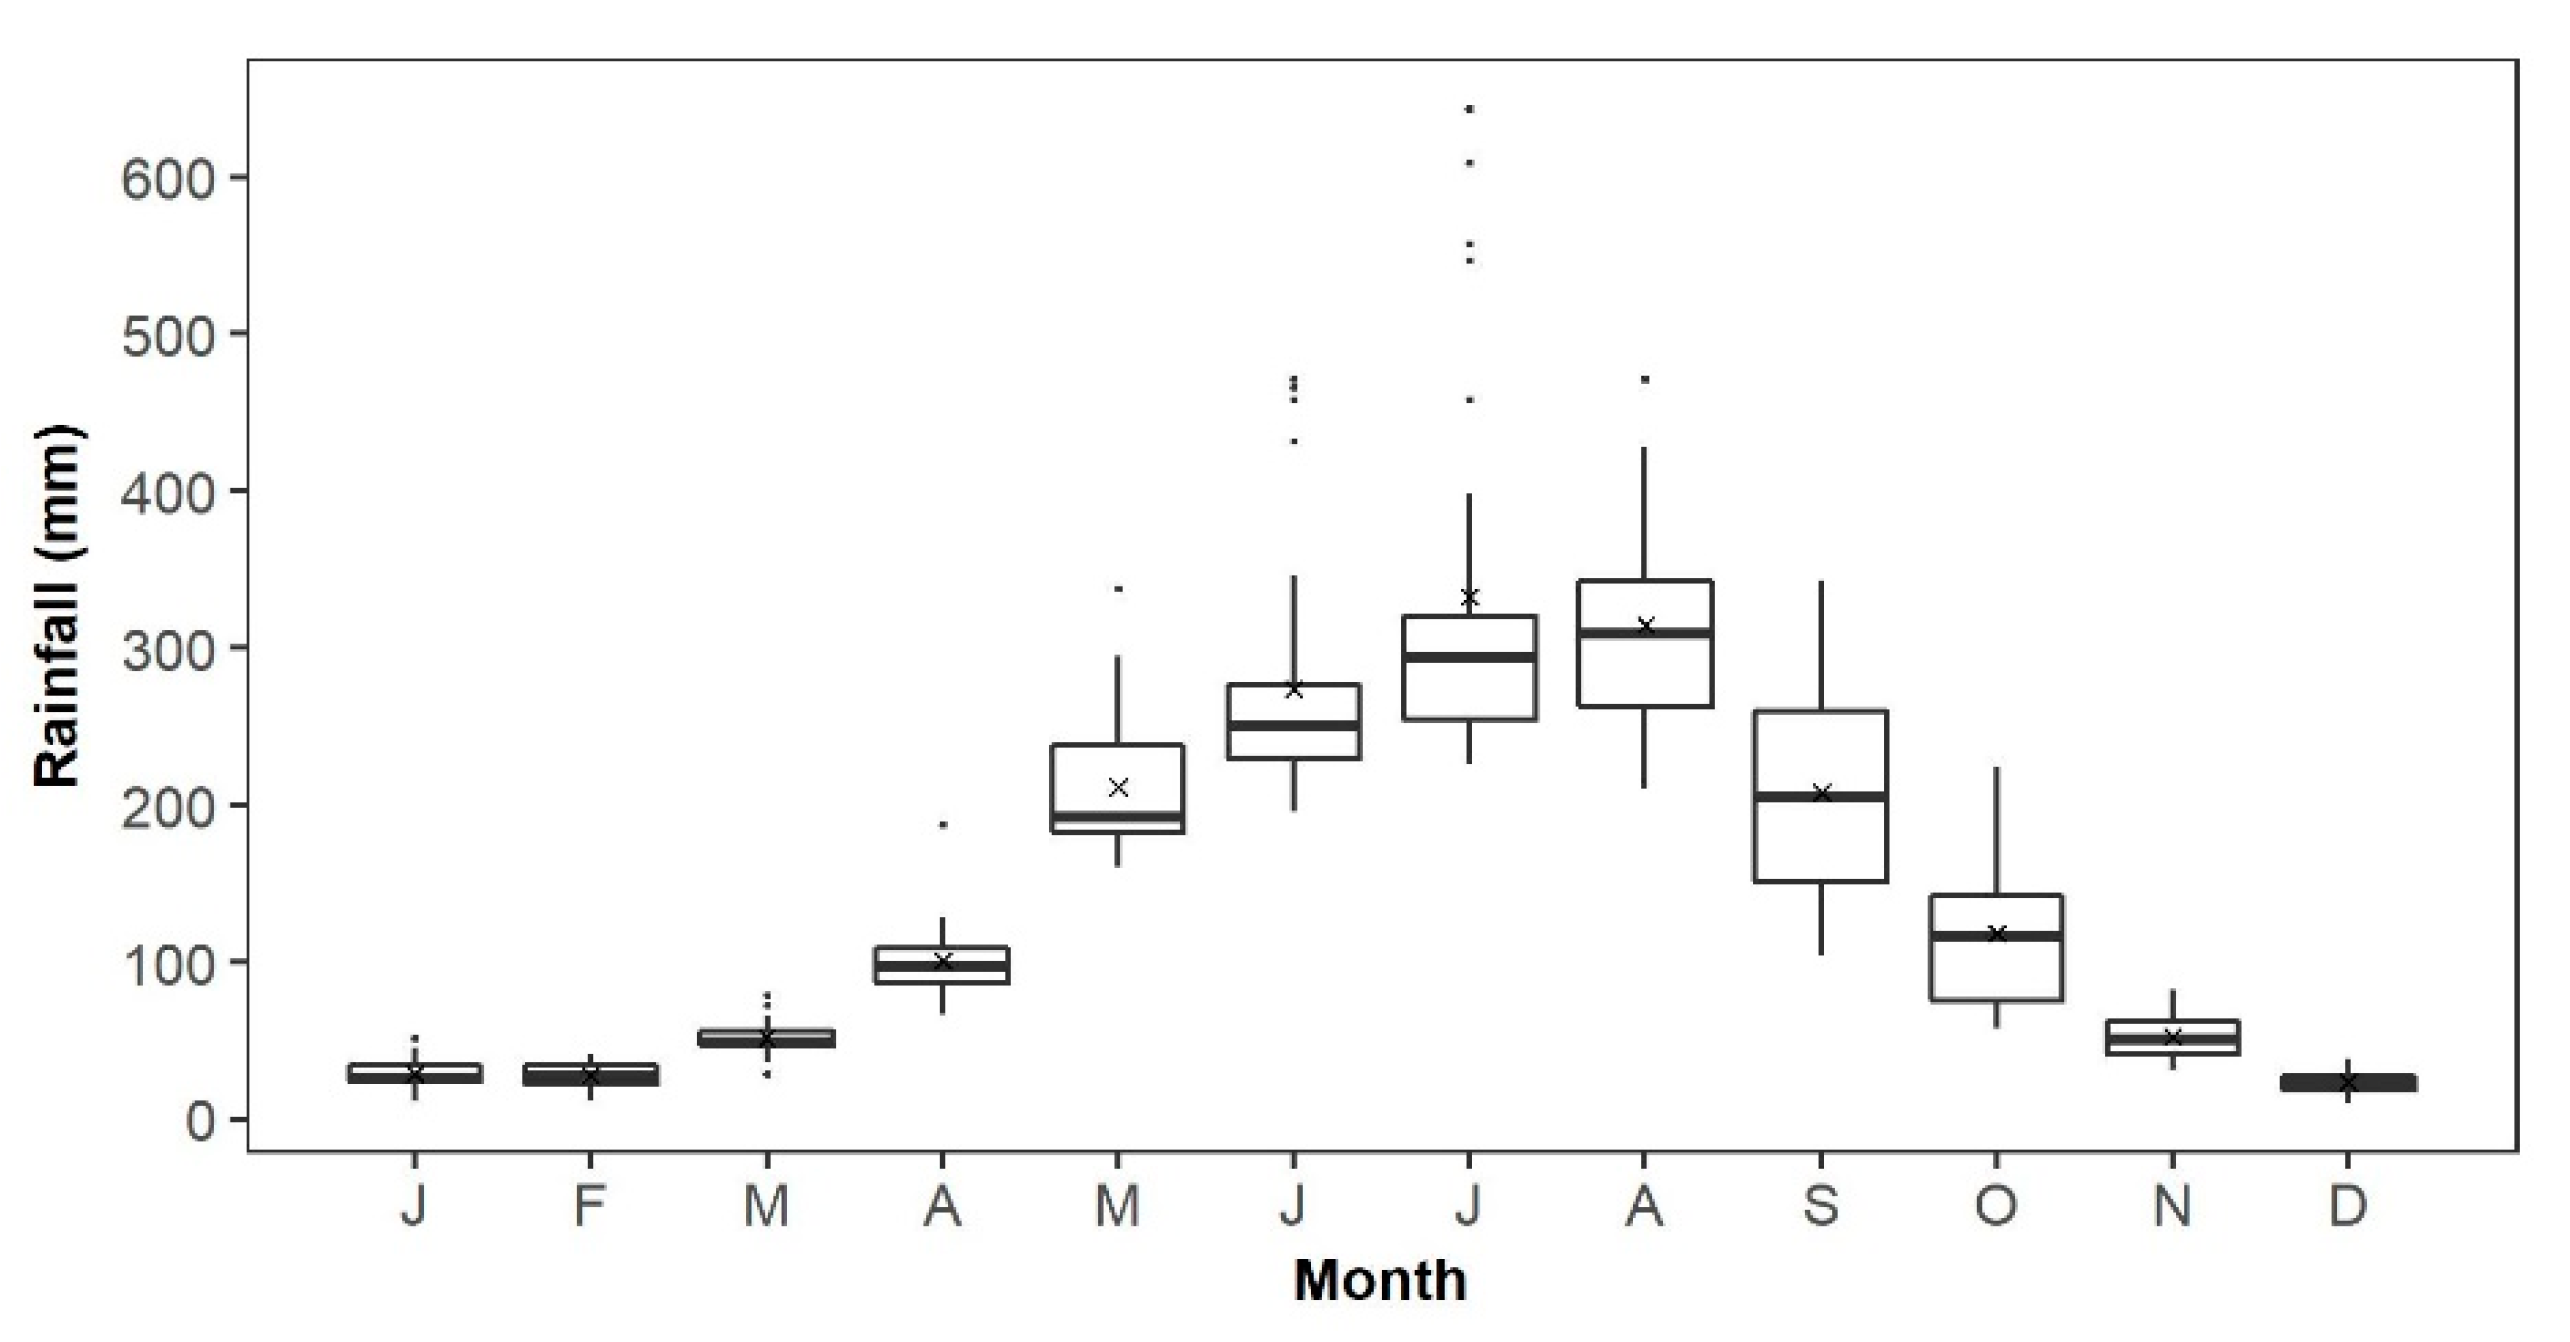
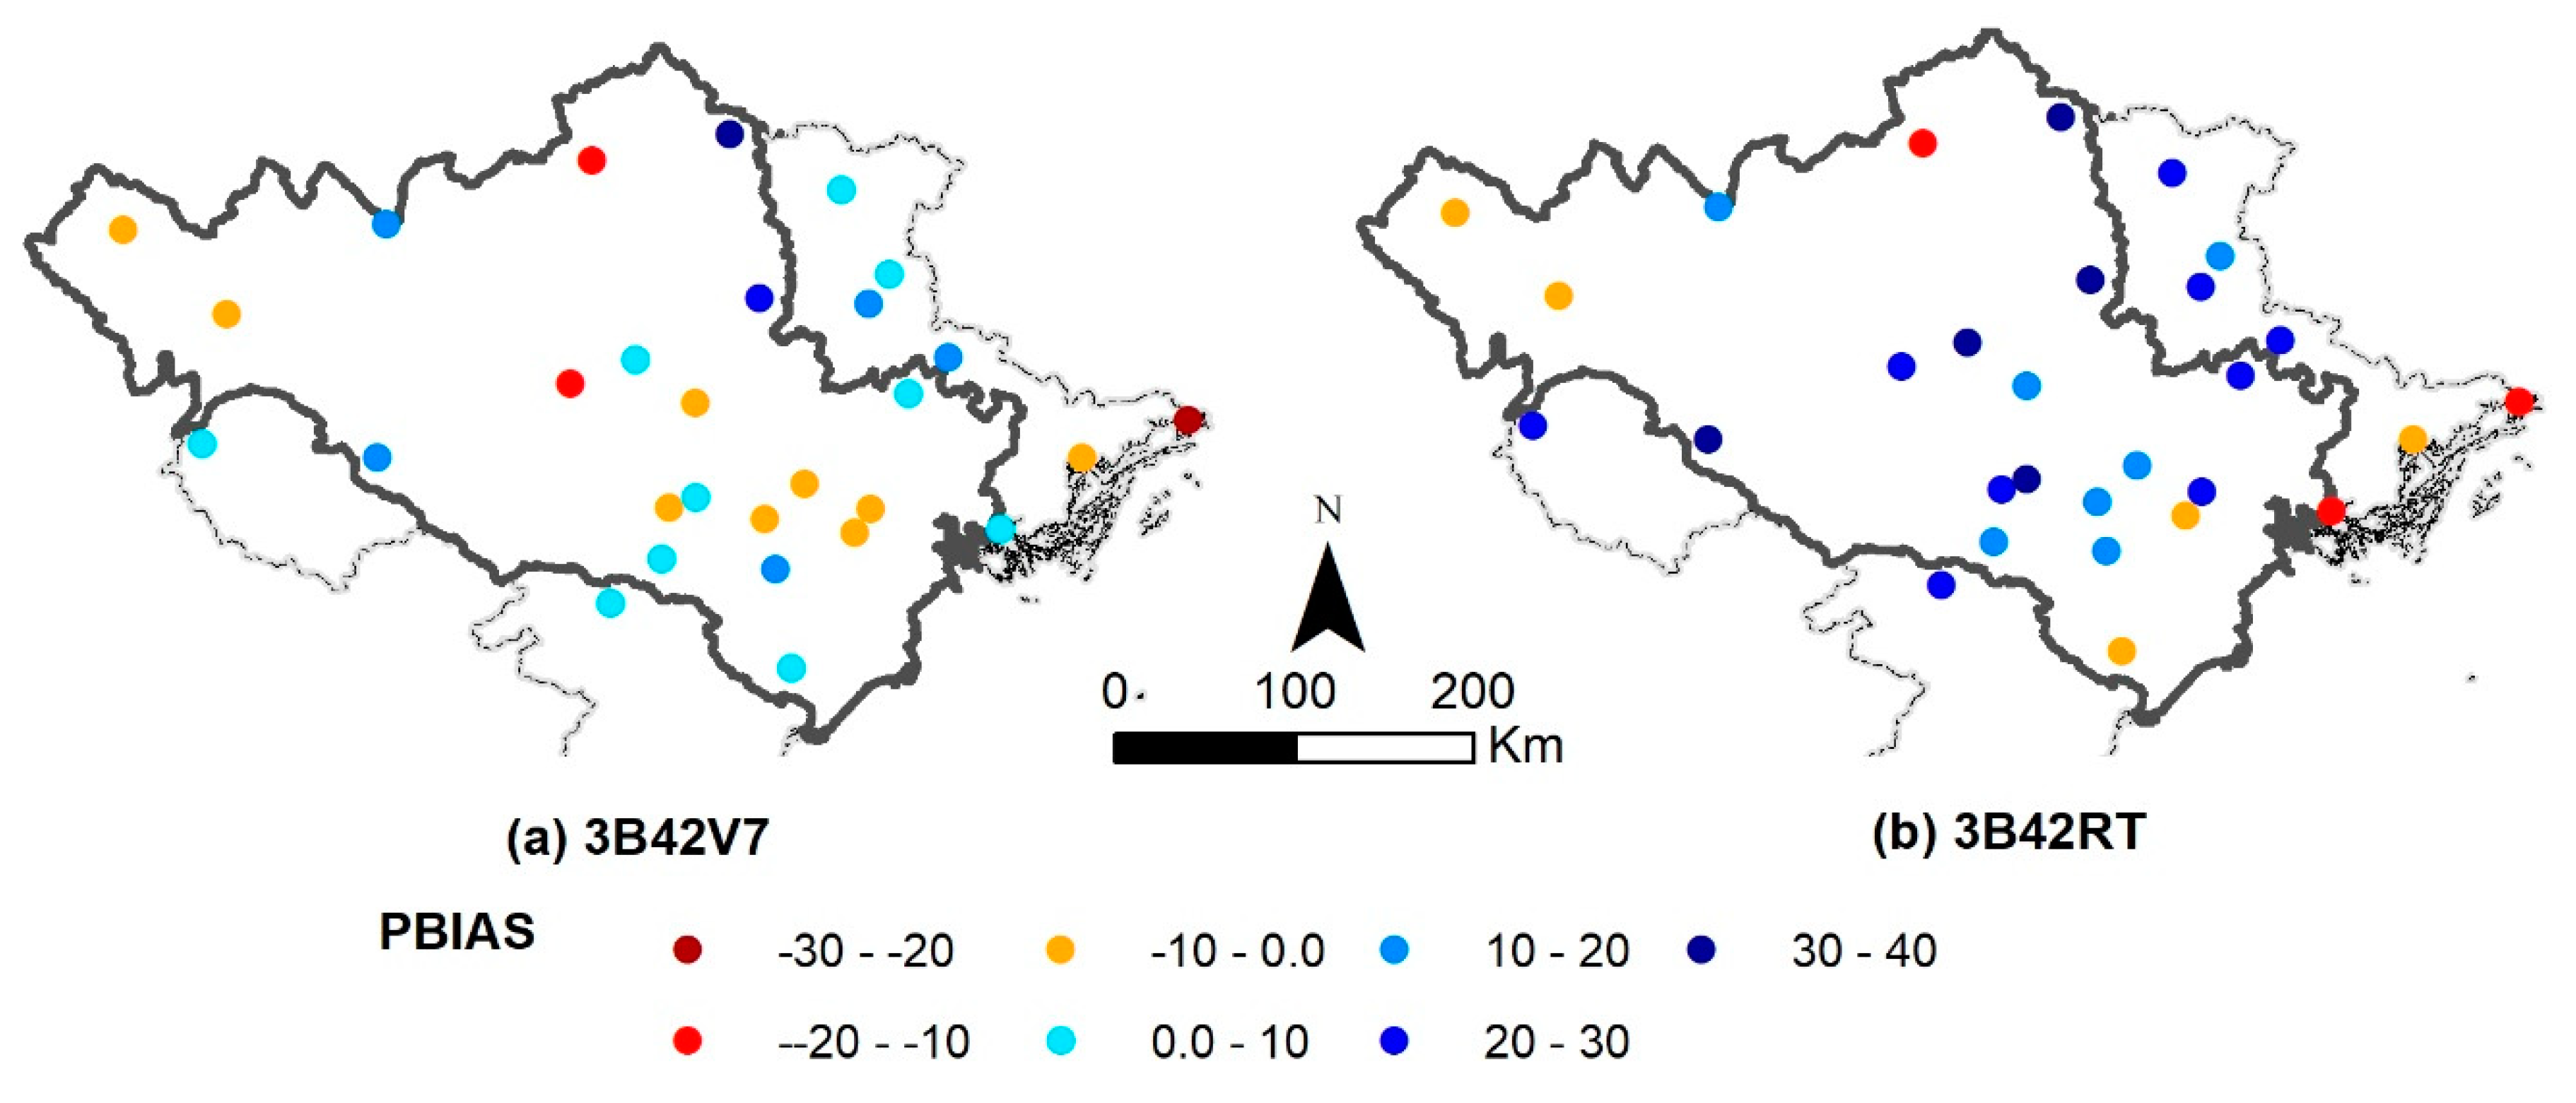
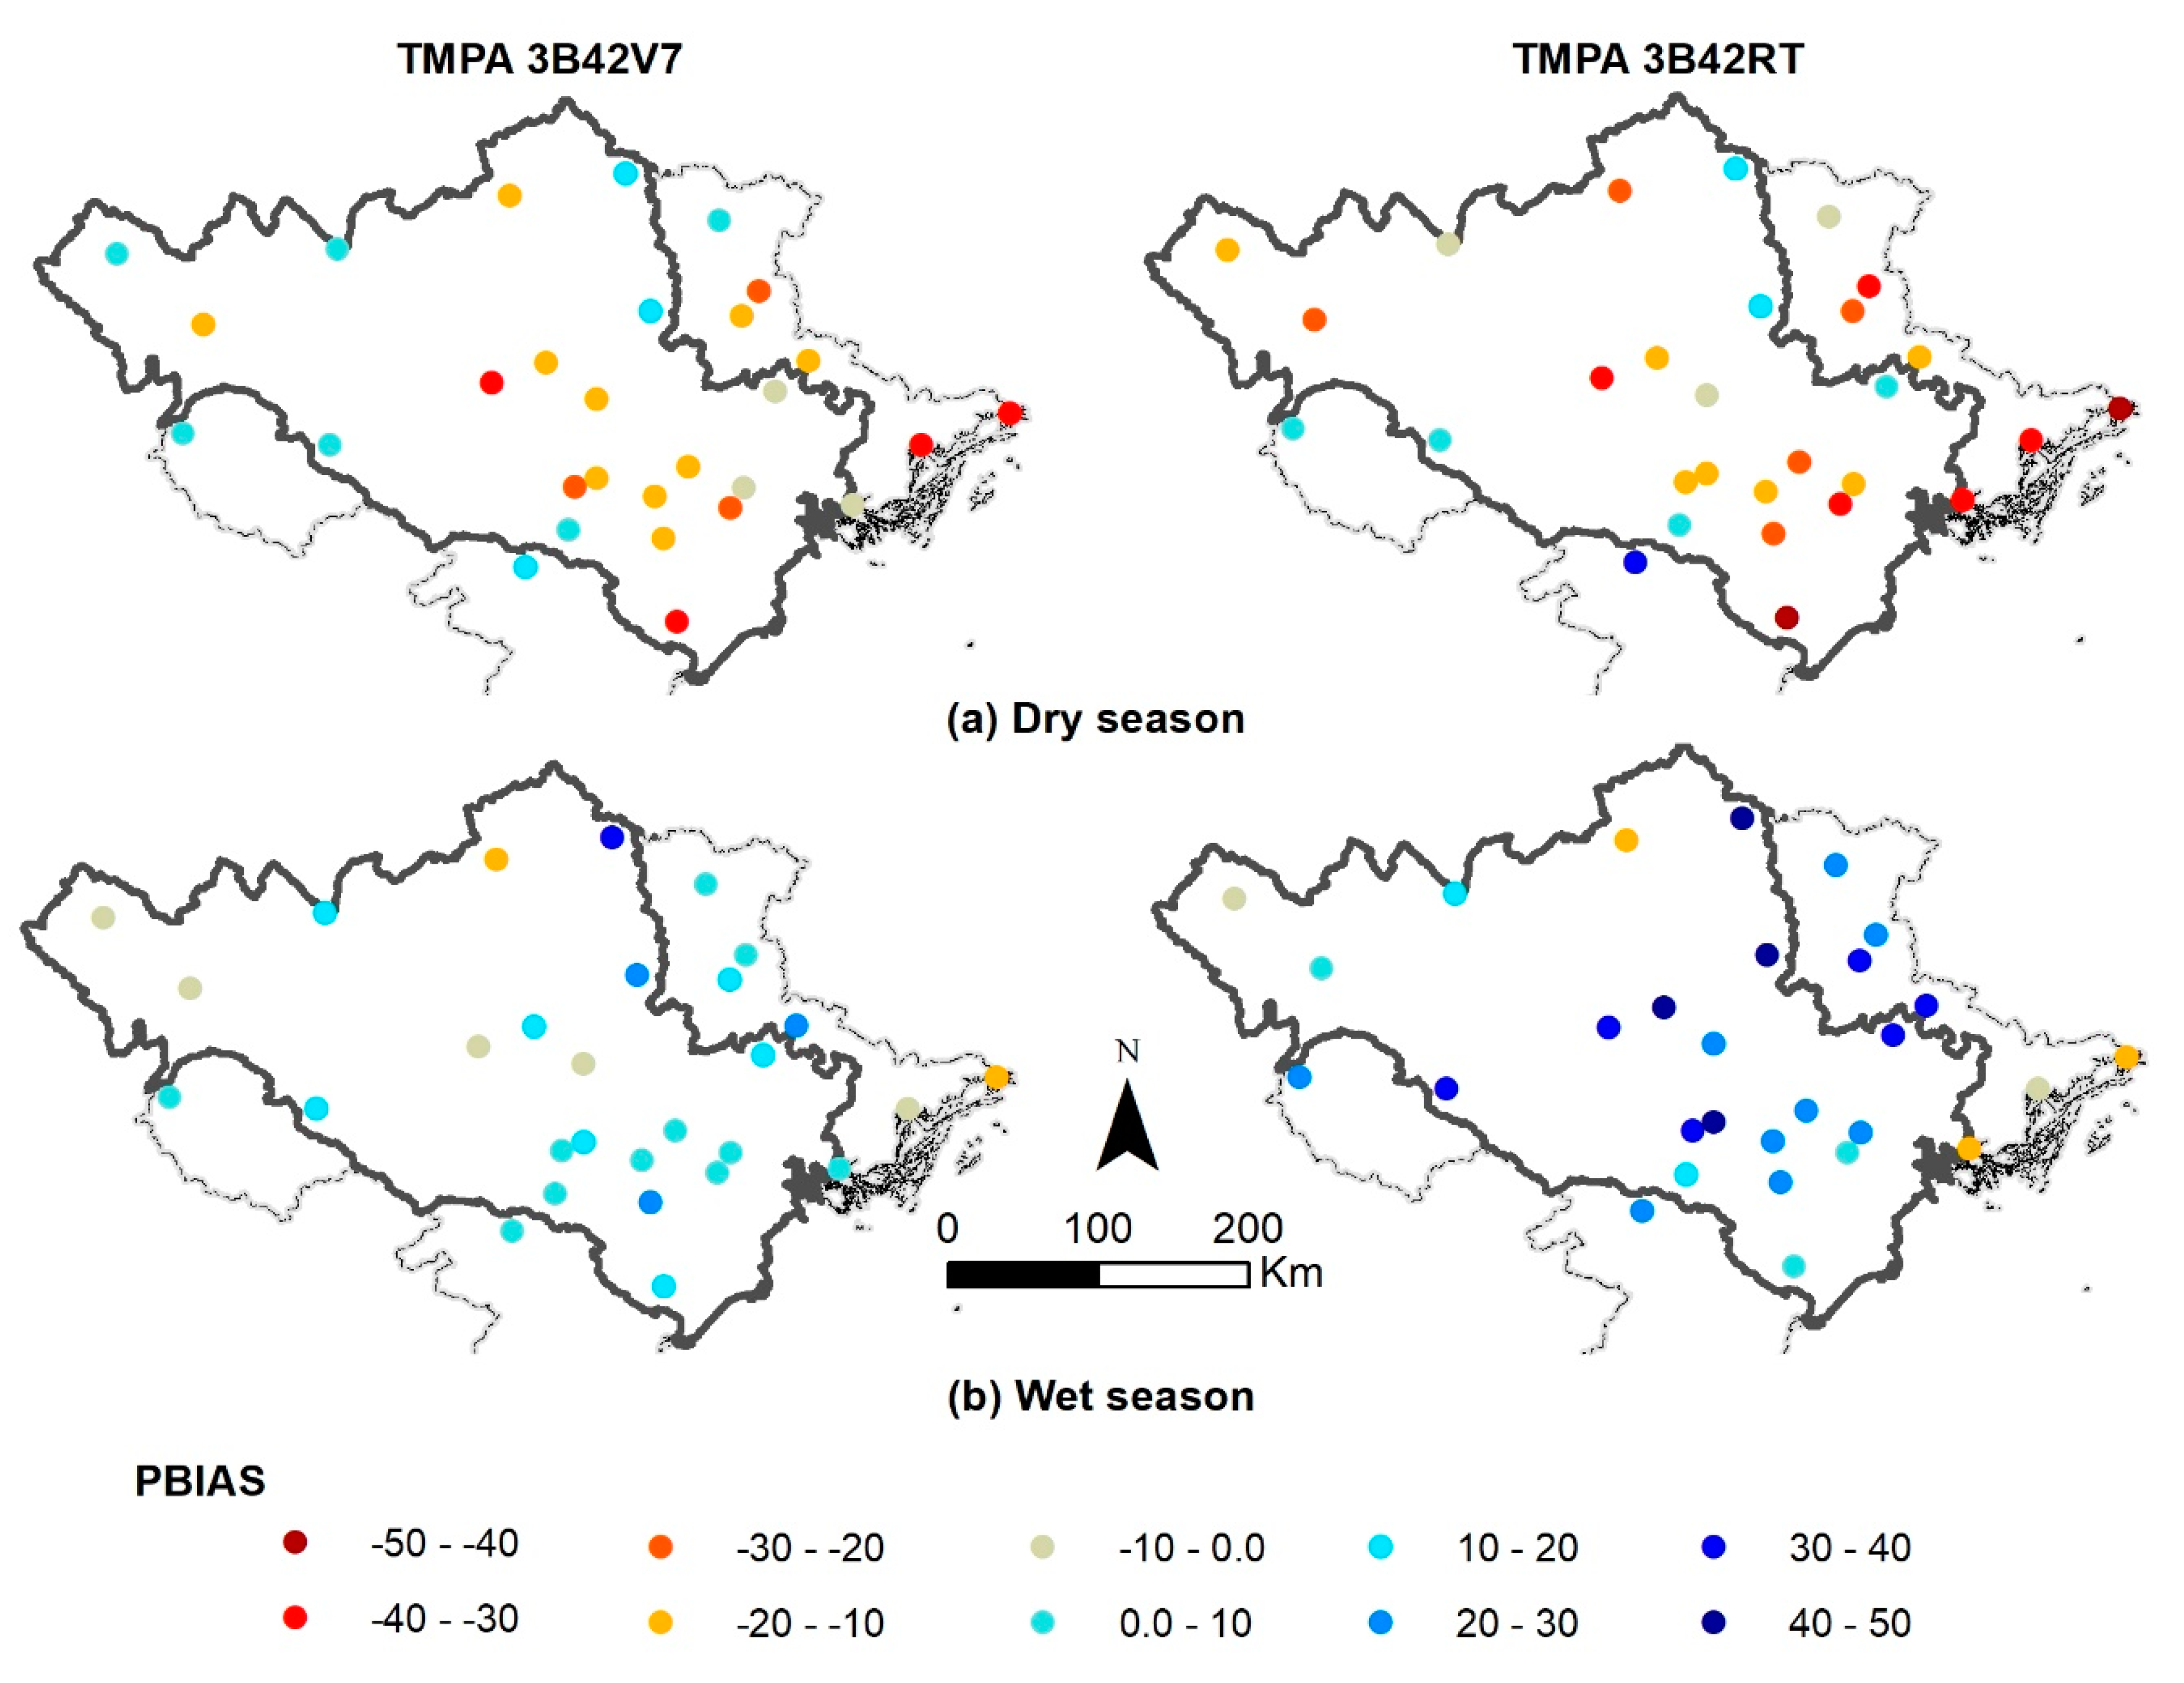
Based on various error metrics—CC, NSE, RMSE, and PBIAS—we compared 3B42V7 and 3B42RT against observations at different scales, including daily and monthly scales and dry and wet seasons. Our analysis showed that both products had relatively weak relationships with observations on a daily scale but this significantly improved on a monthly scale. Except for the CC score, 3B42V7 data was considerably better than 3B42RT data in the rest of the error metrics on a monthly scale. In addition, 3B42V7 data showed better performance than 3B42RT data during both dry and wet seasons, especially regarding NSE and PBIAS measurements. Both products showed overall underestimations during the dry season and overestimations during the wet season. Spatial analysis of the PBIAS score indicated significant bias of TMPA products at the lowland area of the Red–Thai Binh River Basin, while the northwestern mountainous area and the northeast coastal area had low PBIAS for both products.
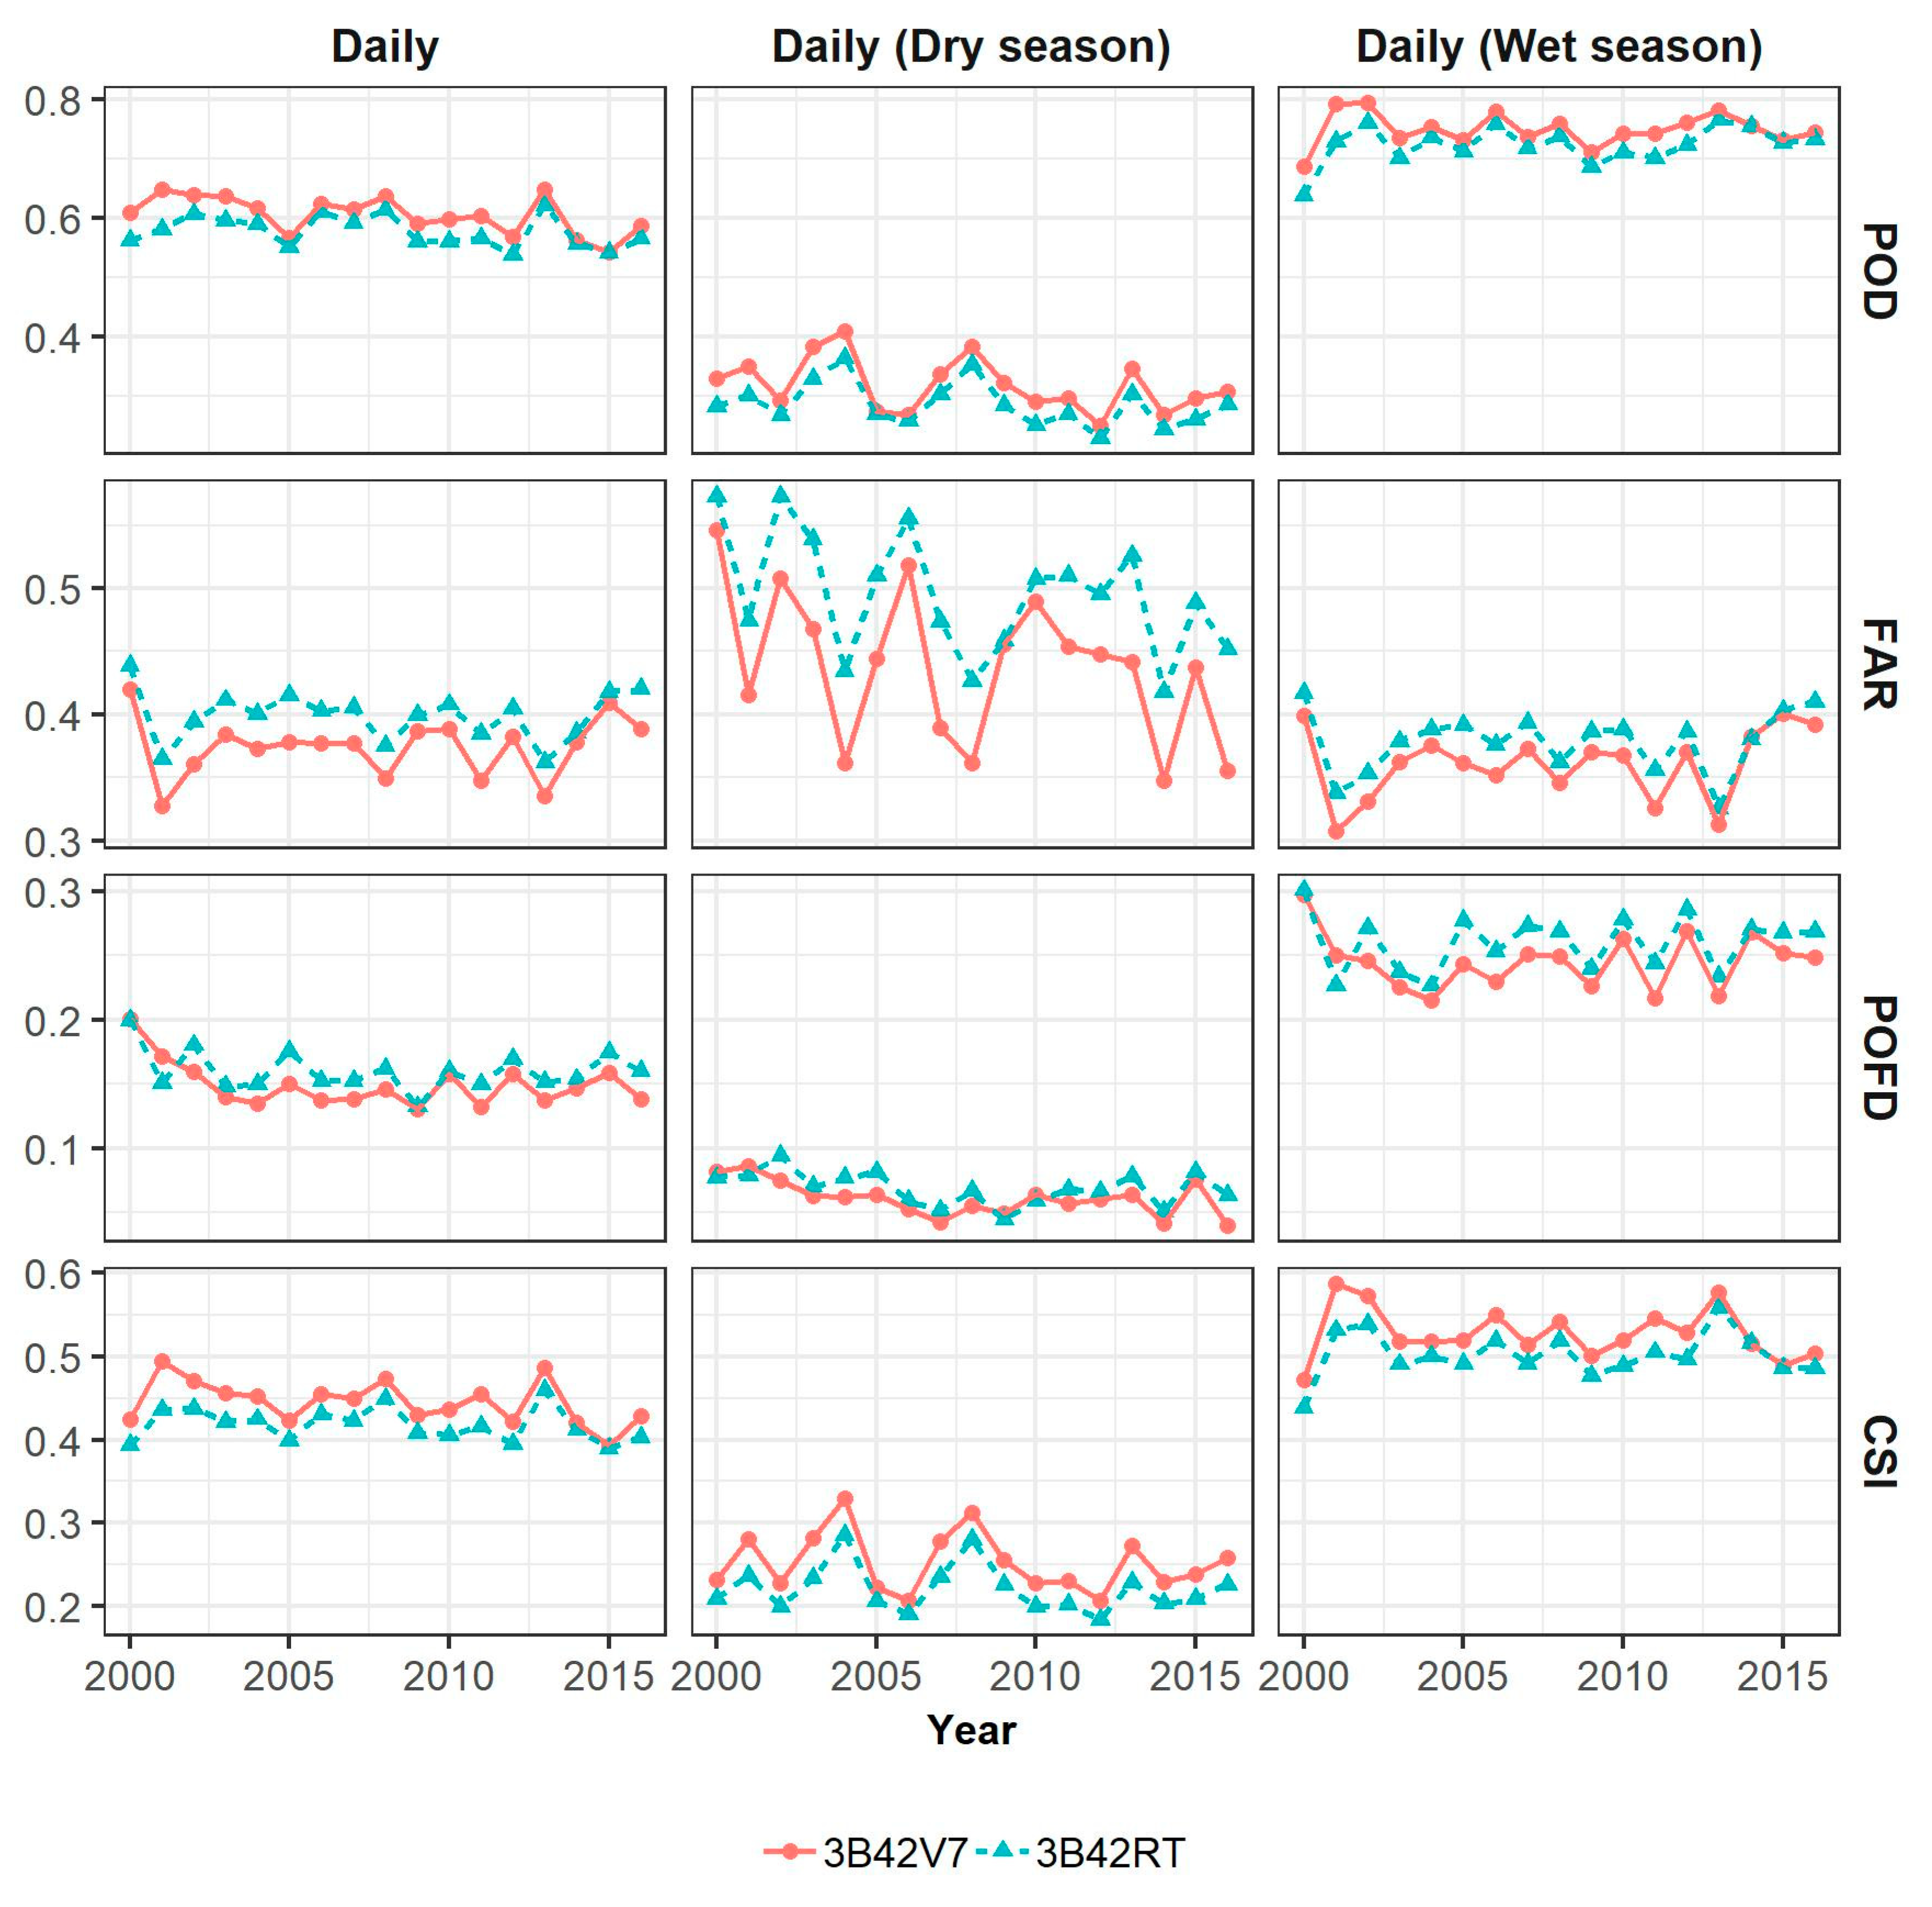
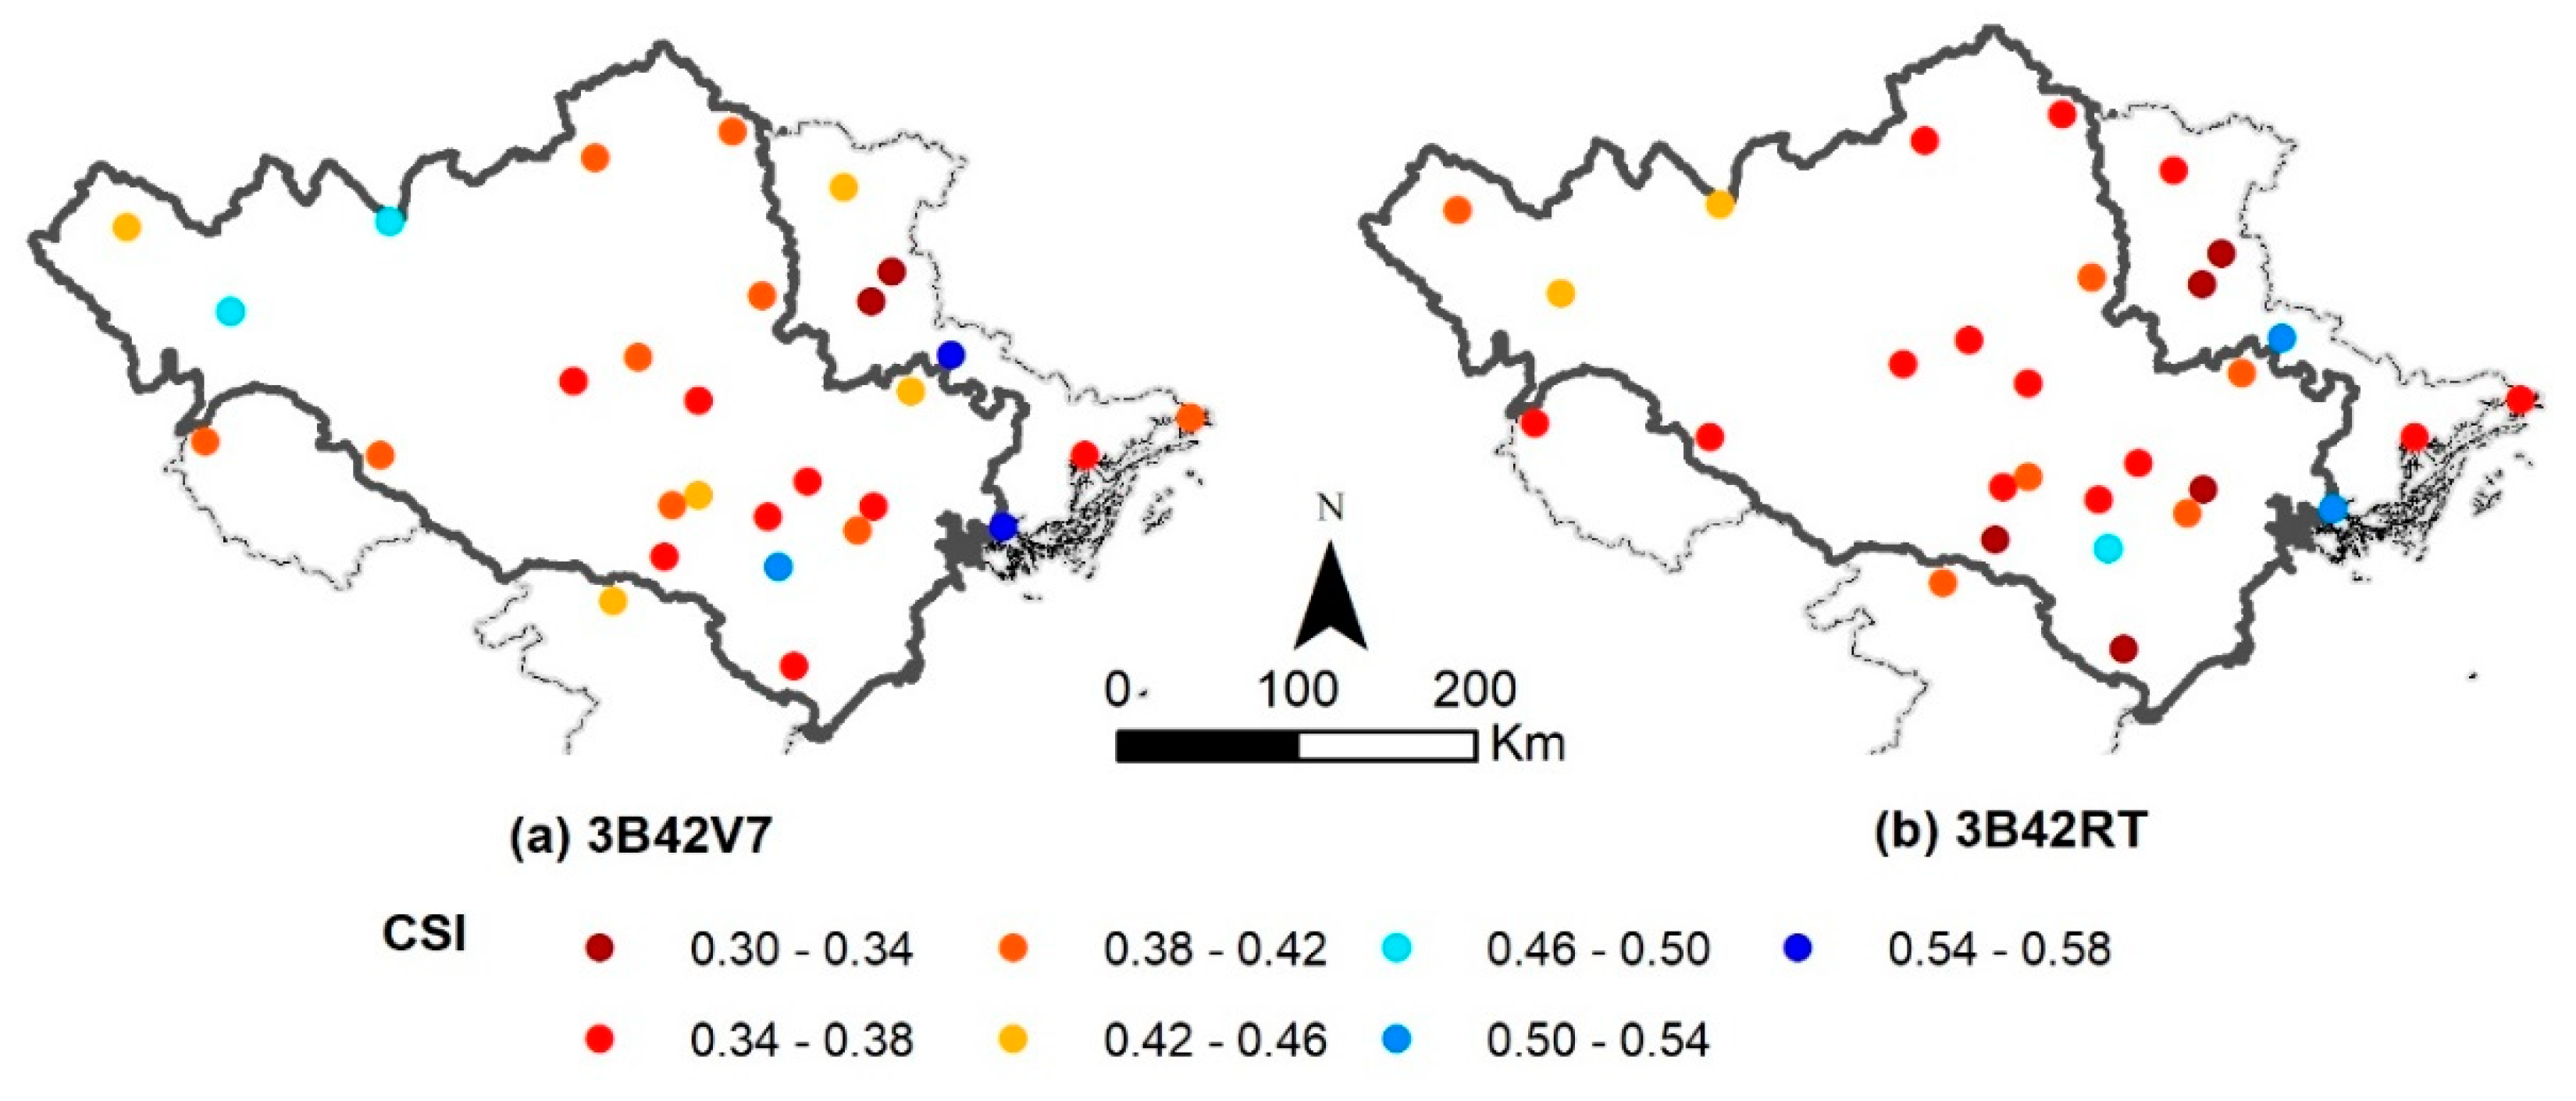
The comparison between 3B42V7 and 3B42RT was also viewed from a different angle using detection metrics—POD, FAR, POFD, and CSI—against observations on daily time series, daily time series in the dry season, and daily time series in the wet season. In this case, the 3B42V7 showed a slightly better performance compared to 3B42RT for the metrics mentioned. Both products had better detection metrics in the wet season compared to the dry season. Spatial CSI score distribution showed that the lowland area of the central basin had the lowest score compared to other parts.
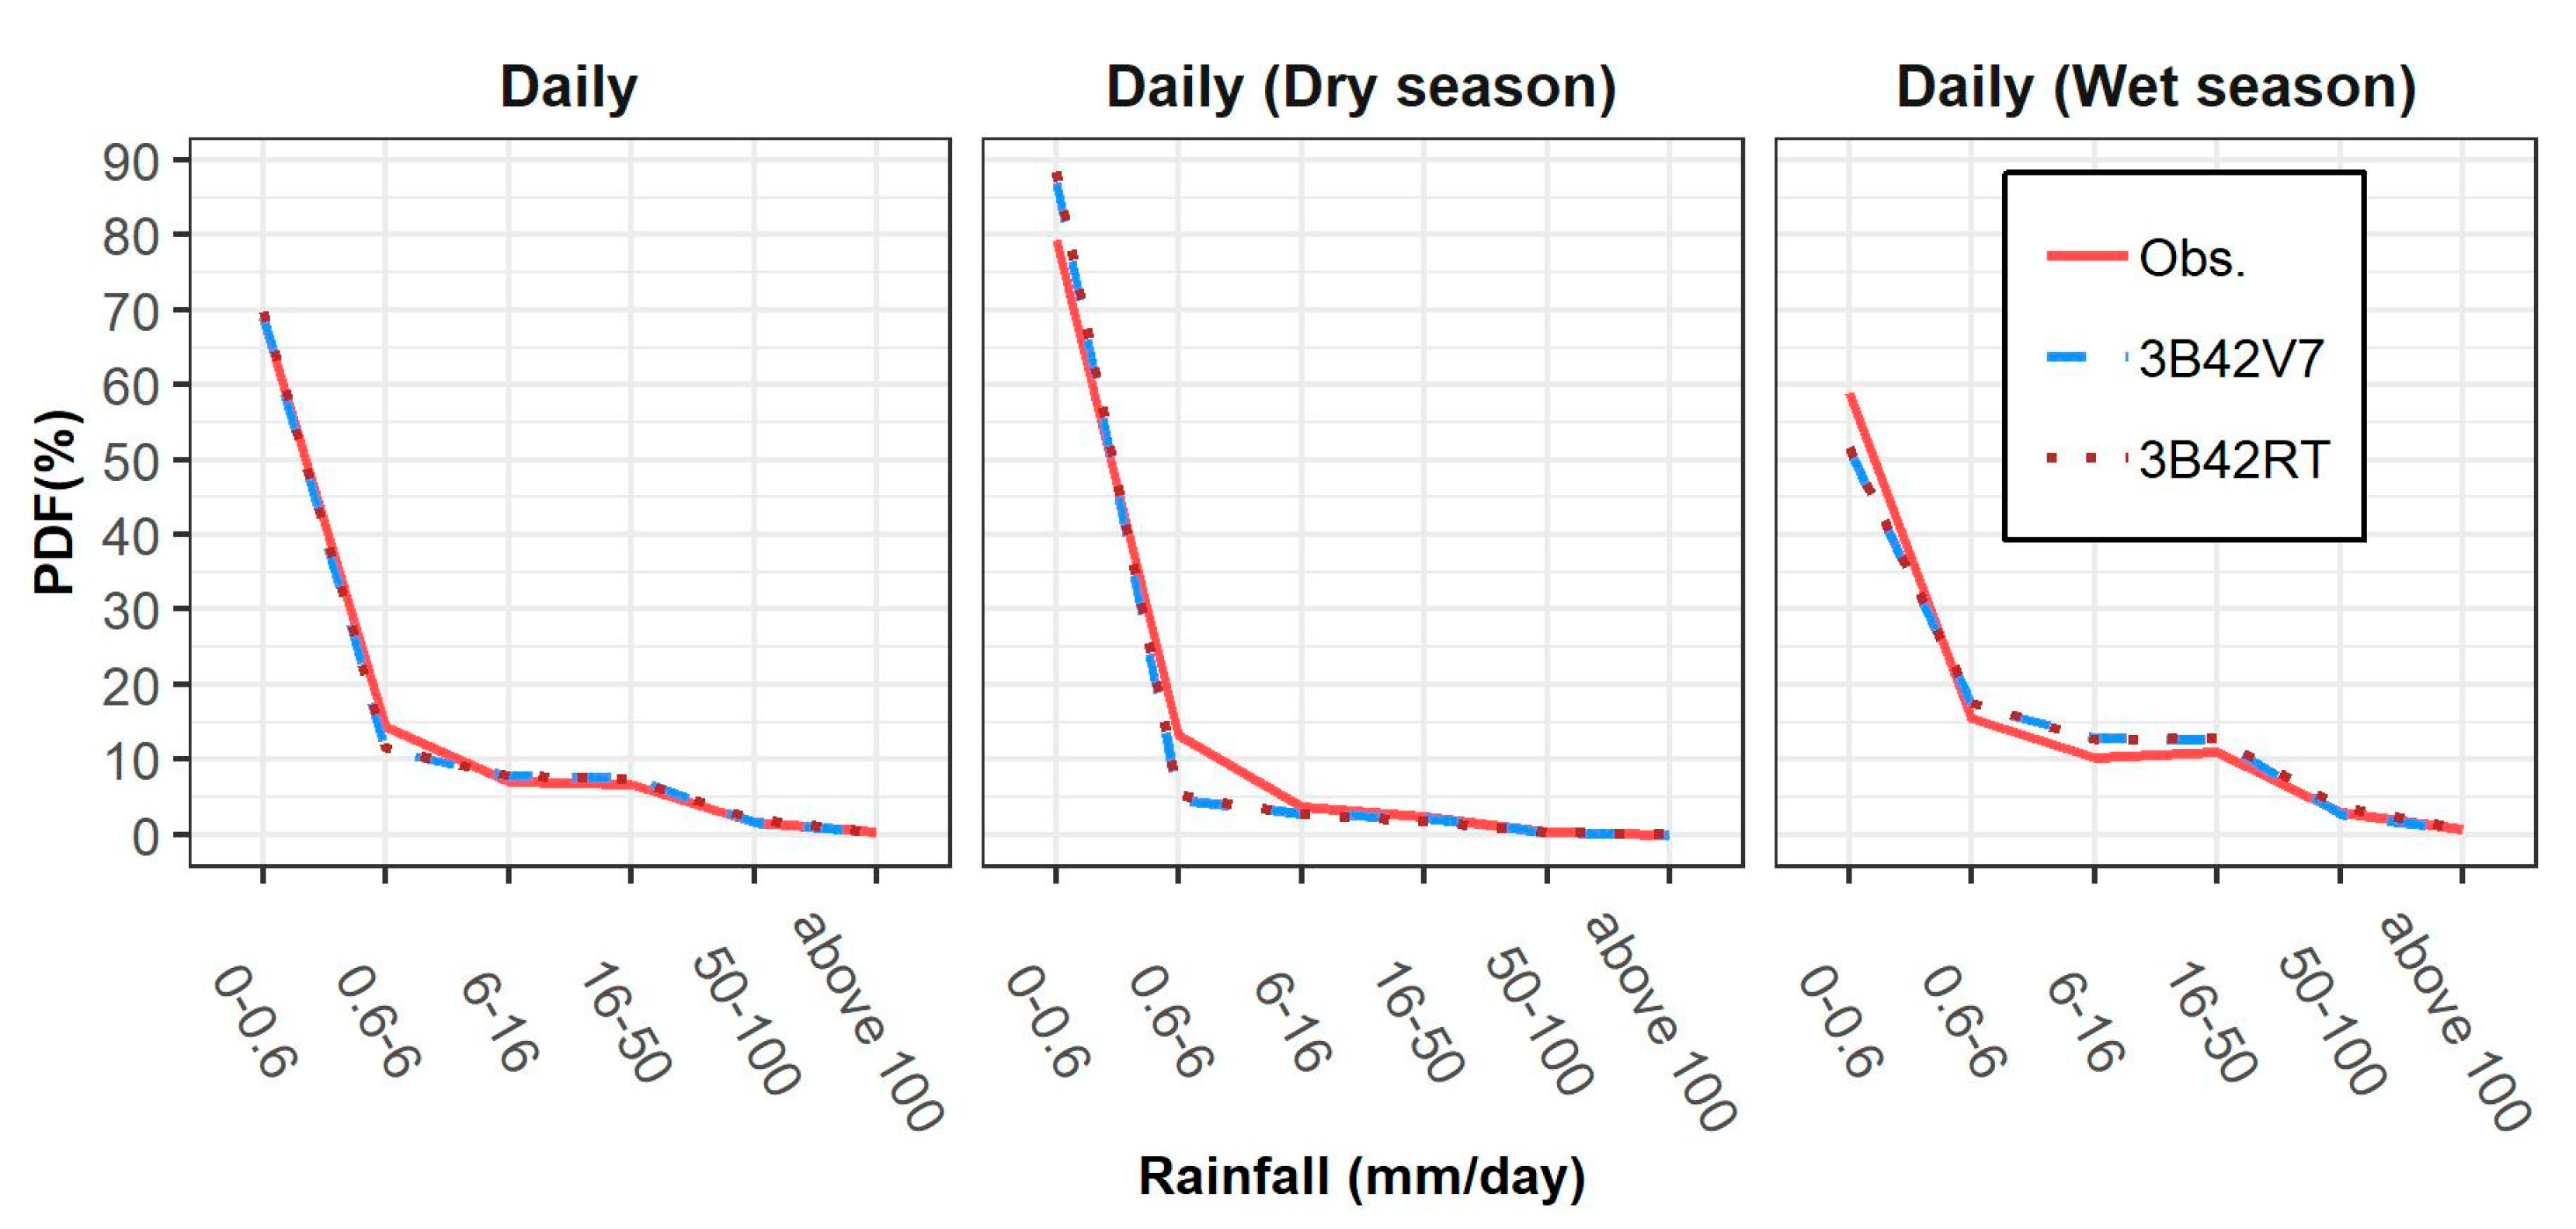
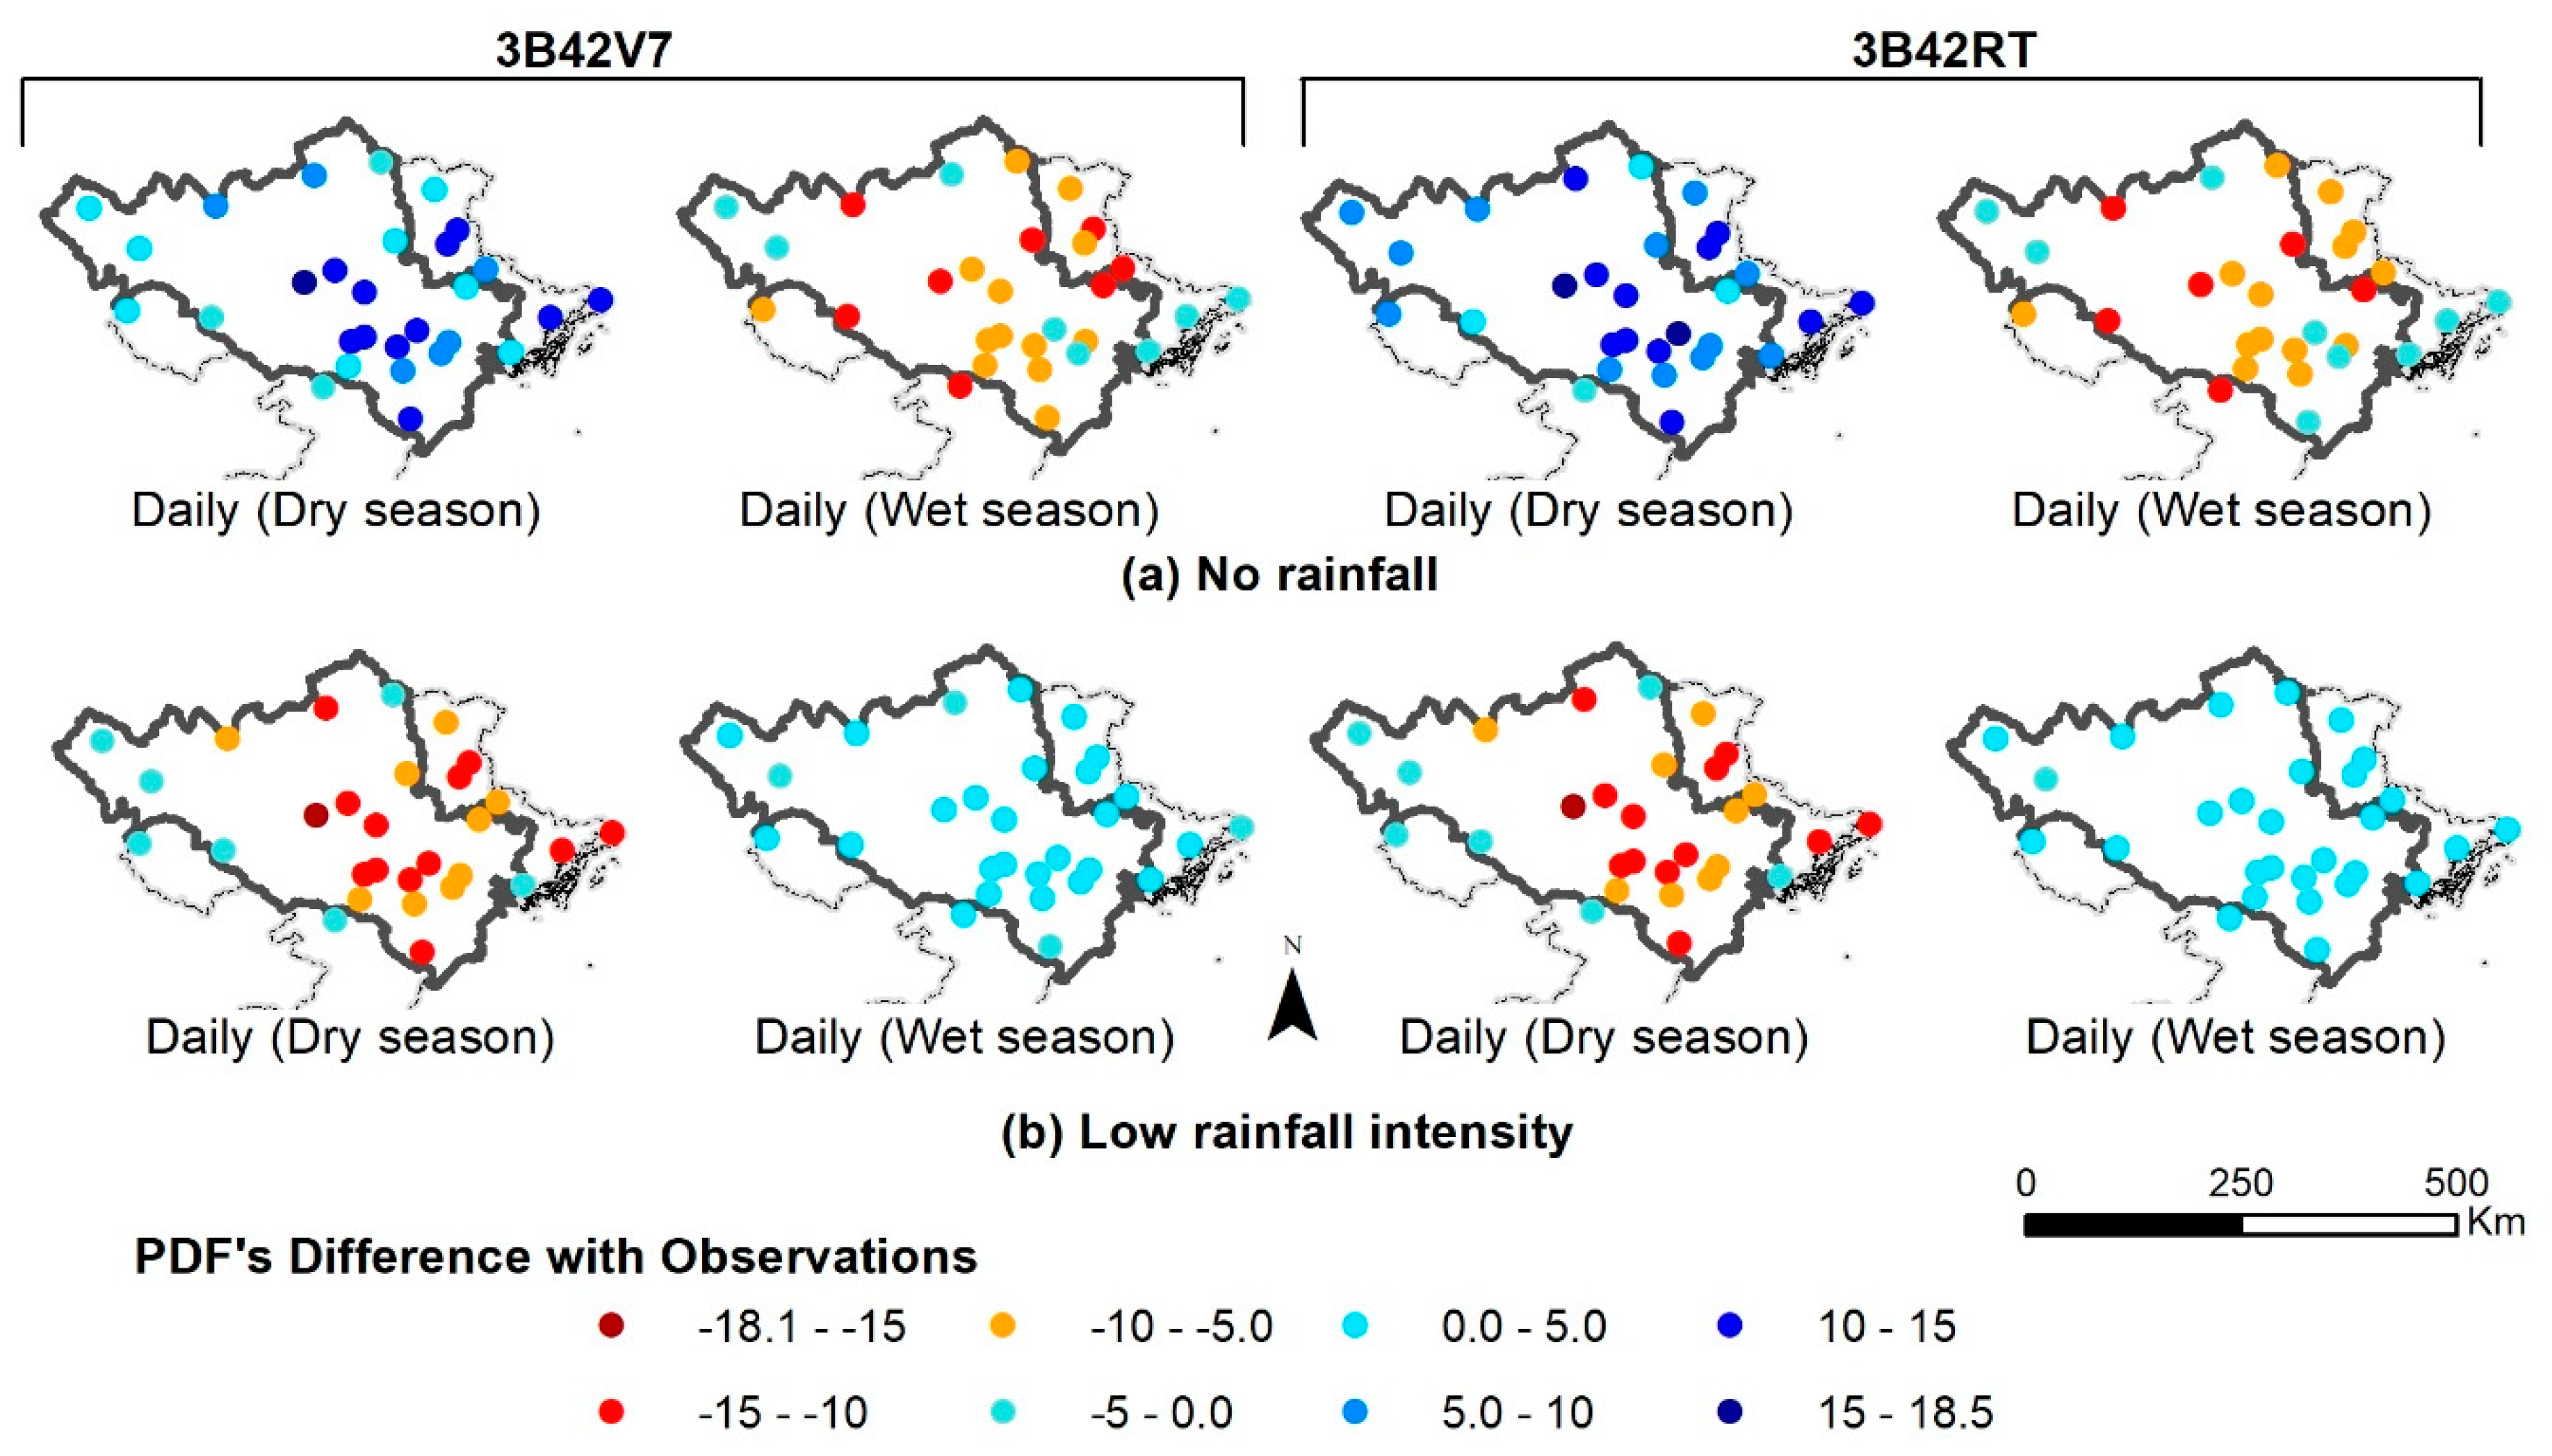
From the perspective of the assessment on rainfall intensity on daily time series for the dry and wet seasons, it was found out that 3B42RT performed the same as 3B42V7 data. Both products overestimated no rainfall (≤0.6 mm/day) during the dry season and underestimated rainfall intensity during the wet season. The overestimation and underestimation compromised the daily time series for the dry and wet seasons, meaning the frequency distributions of no rainfall events were almost the same for TMPA products and ground observations. On the other hand, TMPA products underestimated low rainfall intensity (0.6–6 mm/day) during the dry season and overestimated rainfall intensity during the wet season. The underestimation of low rainfall was more significant than the overestimation, resulting in a slightly lower rainfall estimation by TMPA products at the daily time series compared to observations.
In addition, we used the LS approach to do bias correction for 3B42V7 and 3B42RT products. In this approach, the correction factor is an important key to adjust satellite rainfall data closely to observations. We found that the correction factors of the LS approach were associated with climatology–topography characteristics. Therefore, a set of multiple linear regression models was developed to predict correction factors from climatology–topography characteristics for 3B42V7 and 3B42RT. After bias correction using LS and CTLS approaches, corrected TMPA products showed significant improvement compared to the results before bias correction, especially for the 3B42RT dataset with PBIAS and NSE scores. However, we found that both bias correction approaches did not improve the TMPA products significantly on other measurement scores.
In conclusion, 3B42V7 and 3B42RT data should be a good alternative source for a wide range of hydrological purposes on a monthly scale. The 3B42V7 data is also a good source for typical analysis of dry and wet seasons, although these datasets should be used with caution for daily scale purposes. The post-TMPA products after using climatology–topography characteristics are promising sources, especially for total water resource estimation.
The biggest advantage of the LS approach was to reduce PBIAS score; however, other error scores remained almost the same. Future studies may merge satellite-based and ground-based rainfall product to further improve rainfall product quality [63]. The finding of this paper gives an overview of the capacity of TMPA products in the lower part of the Red–Thai Binh River Basin regarding water resource application and provides a simple bias correction that can be used to improve the correctness of TMPA products. Additionally, the study is beneficial for regions, such as Vietnam, that are seeking alternative rainfall sources. The reason for this is that approximately 60% of Vietnam’s water resources come from abroad, and hydro-climatology acquisition from upstream countries faces many challenges due to limited administration interaction [64].

Author Contributions

Conceptualization, H.M.L., and V.L.; Methodology, H.M.L.; Validation, J.R.P.S., D.D.B.; Resources, H.M.L., and J.R.P.S.; Writing—Original Draft Preparation, H.M.L.; Writing—Review & Editing, H.M.L. and J.R.P.S.; Supervision, V.K. and D.D.B.; Project Administration, V.L. and J.D.B.; Funding Acquisition, V.L. and J.D.B.

Acknowledgments

The authors wish to thank the NASA SERVIR project (Program Manager Nancy Searby) for the funding. The authors thank the hydrological modeling group of the National Central for Water Resources Planning and Investigation (NAWAPI) for providing essential support for data collection. The authors also thank anonymous reviewers for their valuable comments to improve the manuscript’s quality.

Conflicts of Interest

The authors declare no conflict of interest.

References

  1. Kumar, B.; Lakshmi, V. Accessing the capability of TRMM 3B42 V7 to simulate streamflow during extreme rain events: Case study for a Himalayan River Basin. J. Earth Syst. Sci. 2018, 127, 27. [Google Scholar] [CrossRef]
  2. Brutsaert, W. Hydrology: An Introduction; Cambridge University Press: Cambridge, UK, 2005. [Google Scholar]
  3. Yilmaz, K.K.; Hogue, T.S.; Hsu, K.-L.; Sorooshian, S.; Gupta, H.V.; Wagener, T. Intercomparison of rain gauge, radar, and satellite-based precipitation estimates with emphasis on hydrologic forecasting. J. Hydrometeorol. 2005, 6, 497–517. [Google Scholar] [CrossRef]
  4. Kidd, C. Satellite rainfall climatology: A review. Int. J. Climatol. 2001, 21, 1041–1066. [Google Scholar] [CrossRef]
  5. Rana, S.; McGregor, J.; Renwick, J. Precipitation seasonality over the Indian subcontinent: An evaluation of gauge, reanalyses, and satellite retrievals. J. Hydrometeorol. 2015, 16, 631–651. [Google Scholar] [CrossRef]
  6. Xie, P.; Arkin, P.A. Analyses of global monthly precipitation using gauge observations, satellite estimates, and numerical model predictions. J. Clim. 1996, 9, 840–858. [Google Scholar] [CrossRef]
  7. Plengsaeng, B.; Wehn, U.; van der Zaag, P. Data-sharing bottlenecks in transboundary integrated water resources management: A case study of the Mekong River Commission’s procedures for data sharing in the Thai context. Water Int. 2014, 39, 933–951. [Google Scholar] [CrossRef]
  8. Gerlak, A.K.; Lautze, J.; Giordano, M. Water resources data and information exchange in transboundary water treaties. Int. Environ. Agreem. Polit. Law Econ. 2011, 2, 179–199. [Google Scholar] [CrossRef]
  9. Viglione, A.; Borga, M.; Balabanis, P.; Blöschl, G. Barriers to the exchange of hydrometeorological data in Europe: Results from a survey and implications for data policy. J. Hydrol. 2010, 394, 63–77. [Google Scholar] [CrossRef]
  10. García, L.; Rodríguez, D.; Wijnen, M.; Pakulski, I. Earth Observation for Water Resources Management: Current Use and Future Opportunities for the Water Sector; World Bank Publications: Washington, DC, USA, 2016. [Google Scholar]
  11. Sun, Q.; Miao, C.; Duan, Q.; Ashouri, H.; Sorooshian, S.; Hsu, K.L. A review of global precipitation data sets: Data sources, estimation, and intercomparisons. Rev. Geophys. 2018. [Google Scholar] [CrossRef]
  12. Huffman, G.J.; Bolvin, D.T.; Nelkin, E.J.; Wolff, D.B.; Adler, R.F.; Gu, G.; Hong, Y.; Bowman, K.P.; Stocker, E.F. The TRMM multisatellite precipitation analysis (TMPA): Quasi-global, multiyear, combined-sensor precipitation estimates at fine scales. J. Hydrometeorol. 2007, 8, 38–55. [Google Scholar] [CrossRef]
  13. Sorooshian, S.; Hsu, K.-L.; Gao, X.; Gupta, H.V.; Imam, B.; Braithwaite, D. Evaluation of PERSIANN system satellite-based estimates of tropical rainfall. Bull. Am. Meteorol. Soc. 2000, 81, 2035–2046. [Google Scholar] [CrossRef]
  14. Funk, C.C.; Peterson, P.J.; Landsfeld, M.F.; Pedreros, D.H.; Verdin, J.P.; Rowland, J.D.; Romero, B.E.; Husak, G.J.; Michaelsen, J.C.; Verdin, A.P. A Quasi-Global Precipitation Time Series for Drought Monitoring; US Geological Survey Data Series 832; U.S. Geological Survey: Sioux Falls, SD, USA, 2014.
  15. Joyce, R.J.; Janowiak, J.E.; Arkin, P.A.; Xie, P. CMORPH: A method that produces global precipitation estimates from passive microwave and infrared data at high spatial and temporal resolution. J. Hydrometeorol. 2004, 5, 487–503. [Google Scholar] [CrossRef]
  16. Ha, L.T.; Bastiaanssen, W.G.; Griensven, A.V.; Van Dijk, A.I.; Senay, G.B. Calibration of Spatially Distributed Hydrological Processes and Model Parameters in SWAT Using Remote Sensing Data and an Auto-Calibration Procedure: A Case Study in a Vietnamese River Basin. Water 2018, 10, 212. [Google Scholar] [CrossRef]
  17. Adjei, K.A.; Ren, L.; Appiah-Adjei, E.K.; Odai, S.N. Application of satellite-derived rainfall for hydrological modelling in the data-scarce Black Volta trans-boundary basin. Hydrol. Res. 2015, 46, 777–791. [Google Scholar] [CrossRef]
  18. Xue, X.; Hong, Y.; Limaye, A.S.; Gourley, J.J.; Huffman, G.J.; Khan, S.I.; Dorji, C.; Chen, S. Statistical and hydrological evaluation of TRMM-based Multi-satellite Precipitation Analysis over the Wangchu Basin of Bhutan: Are the latest satellite precipitation products 3B42V7 ready for use in ungauged basins? J. Hydrol. 2013, 499, 91–99. [Google Scholar] [CrossRef]
  19. Sahoo, A.K.; Sheffield, J.; Pan, M.; Wood, E.F. Evaluation of the tropical rainfall measuring mission multi-satellite precipitation analysis (TMPA) for assessment of large-scale meteorological drought. Remote Sens. Environ. 2015, 159, 181–193. [Google Scholar] [CrossRef]
  20. Zhang, A.; Jia, G. Monitoring meteorological drought in semiarid regions using multi-sensor microwave remote sensing data. Remote Sens. Environ. 2013, 134, 12–23. [Google Scholar] [CrossRef]
  21. Arvor, D.; Dubreuil, V.; Ronchail, J.; Simões, M.; Funatsu, B.M. Spatial patterns of rainfall regimes related to levels of double cropping agriculture systems in Mato Grosso (Brazil). Int. J. Climatol. 2014, 34, 2622–2633. [Google Scholar] [CrossRef]
  22. Cashion, J.; Lakshmi, V.; Bosch, D.; Jackson, T.J. Microwave remote sensing of soil moisture: Evaluation of the TRMM microwave imager (TMI) satellite for the Little River Watershed Tifton, Georgia. J. Hydrol. 2005, 307, 242–253. [Google Scholar] [CrossRef]
  23. Li, Z.; Yang, D.; Gao, B.; Jiao, Y.; Hong, Y.; Xu, T. Multiscale hydrologic applications of the latest satellite precipitation products in the Yangtze River Basin using a distributed hydrologic model. J. Hydrometeorol. 2015, 16, 407–426. [Google Scholar] [CrossRef]
  24. Tong, K.; Su, F.; Yang, D.; Hao, Z. Evaluation of satellite precipitation retrievals and their potential utilities in hydrologic modeling over the Tibetan Plateau. J. Hydrol. 2014, 519, 423–437. [Google Scholar] [CrossRef]
  25. Moazami, S.; Golian, S.; Kavianpour, M.R.; Hong, Y. Comparison of PERSIANN and V7 TRMM Multi-satellite Precipitation Analysis (TMPA) products with rain gauge data over Iran. Int. J. Remote Sens. 2013, 34, 8156–8171. [Google Scholar] [CrossRef]
  26. Simons, G.; Bastiaanssen, W.; Ngô, L.A.; Hain, C.R.; Anderson, M.; Senay, G. Integrating global satellite-derived data products as a pre-analysis for hydrological modelling studies: A case study for the Red River Basin. Remote Sens. 2016, 8, 279. [Google Scholar] [CrossRef]
  27. Zad, M.; Najja, S.; Zulkafli, Z.; Muharram, F.M. Satellite Rainfall (TRMM 3B42-V7) Performance Assessment and Adjustment over Pahang River Basin, Malaysia. Remote Sens. 2018, 10, 388. [Google Scholar] [Green Version]
  28. Kneis, D.; Chatterjee, C.; Singh, R. Evaluation of TRMM rainfall estimates over a large Indian river basin (Mahanadi). Hydrol. Earth Syst. Sci. 2014, 18, 2493–2502. [Google Scholar] [CrossRef] [Green Version]
  29. Curtarelli, M.P.; Rennó, C.D.; Alcântara, E.H. Evaluation of the Tropical Rainfall Measuring Mission 3B43 product over an inland area in Brazil and the effects of satellite boost on rainfall estimates. J. Appl. Remote Sens. 2014, 8, 1–14. [Google Scholar] [CrossRef]
  30. Cao, Y.; Zhang, W.; Wang, W. Evaluation of TRMM 3B43 data over the Yangtze River Delta of China. Sci. Rep. 2018, 8, 5290. [Google Scholar] [CrossRef] [PubMed] [Green Version]
  31. Huffman, G.J. The Transition in Multi-Satellite Products from TRMM to GPM (TMPA to IMERG); NASA/GSFC Code. Available online: https://pmm.nasa.gov/sites/default/files/document_files/TMPA-to-IMERG_transition_161025.pdf (accessed on 8 June 2018).
  32. Huffman, G.J.; Bolvin, D.T.; Nelkin, E.J. Integrated Multi-satellitE Retrievals for GPM (IMERG) Technical Documentation; NASA/GSFC Code; NASA’s Goddard Space Flight Center: Greenbelt, MD, USA, 2015; Volume 612, p. 47.
  33. Xu, R.; Tian, F.; Yang, L.; Hu, H.; Lu, H.; Hou, A. Ground validation of GPM IMERG and TRMM 3B42V7 rainfall products over southern Tibetan Plateau based on a high-density rain gauge network. J. Geophys. Res. Atmos. 2017, 122, 910–924. [Google Scholar] [CrossRef]
  34. Kim, K.; Park, J.; Baik, J.; Choi, M. Evaluation of topographical and seasonal feature using GPM IMERG and TRMM 3B42 over Far-East Asia. Atmos. Res. 2017, 187, 95–105. [Google Scholar] [CrossRef]
  35. He, Z.; Yang, L.; Tian, F.; Ni, G.; Hou, A.; Lu, H. Intercomparisons of Rainfall Estimates from TRMM and GPM Multisatellite Products over the Upper Mekong River Basin. J. Hydrometeorol. 2017, 18, 413–430. [Google Scholar] [CrossRef]
  36. Tan, M.L.; Duan, Z. Assessment of GPM and TRMM precipitation products over Singapore. Remote Sens. 2017, 9, 720. [Google Scholar] [CrossRef]
  37. Khan, S.I.; Hong, Y.; Gourley, J.J.; Khattak, M.U.K.; Yong, B.; Vergara, H.J. Evaluation of three high-resolution satellite precipitation estimates: Potential for monsoon monitoring over Pakistan. Adv. Space Res. 2014, 54, 670–684. [Google Scholar] [CrossRef]
  38. Hashemi, H.; Nordin, M.; Lakshmi, V.; Huffman, G.J.; Knight, R. Bias Correction of Long-Term Satellite Monthly Precipitation Product (TRMM 3B43) over the Conterminous United States. J. Hydrometeorol. 2017, 18, 2491–2509. [Google Scholar] [CrossRef]
  39. WMO. Guide to Hydrological Practices: Data Acquisition and Processing, Analysis, Forecasting and Other Applications; World Meteorological Organization: Geneva, Switzerland, 1994. [Google Scholar]
  40. Duc, D.D. Assessment current situation and possibility of exploting satellite rainfall for flood forecasting- an application for Chu River Basin. J. Clim. Chang. Sci. 2017, 2, 98–104. (In Vietnamese) [Google Scholar]
  41. Poortinga, A.; Bastiaanssen, W.; Simons, G.; Saah, D.; Senay, G.; Fenn, M.; Bean, B.; Kadyszewski, J. A Self-Calibrating Runoff and Streamflow Remote Sensing Model for Ungauged Basins Using Open-Access Earth Observation Data. Remote Sens. 2017, 9, 86. [Google Scholar] [CrossRef]
  42. Nguyen, T.H.; Masih, I.; Mohamed, Y.A.; van der Zaag, P. Validating Rainfall-Runoff Modelling Using Satellite-Based and Reanalysis Precipitation Products in the Sre Pok Catchment, the Mekong River Basin. Geosciences 2018, 8, 164. [Google Scholar] [CrossRef]
  43. NAWAPI. Red-Thai Binh River Basin Water Resources Planning, Term of Reference; Ministry of Natural Resources and Environment: Hanoi, Vietnam, 2017. (In Vietnamese)
  44. NAWAPI. Red-Thai Binh River Basin Water Resources Planning, Main Report; Ministry of Natural Resources and Environment: Hanoi, Vietnam, 2017. (In Vietnamese)
  45. MONRE. Circular on National Technical Standard of Meteorological Monitoring; 25/2012/TT-BTNMT; Ministry of Natural Resources and Environment: Hanoi, Vietnam, 2012.
  46. Huffman, G.J.; Bolvin, D.T. TRMM and Other Data Precipitation Data Set Documentation; NASA: Greenbelt, MD, USA, 2013; Volume 28.
  47. Legates, D.R.; McCabe, G.J. Evaluating the use of “goodness-of-fit” measures in hydrologic and hydroclimatic model validation. Water Resour. Res. 1999, 35, 233–241. [Google Scholar] [CrossRef]
  48. Moriasi, D.N.; Arnold, J.G.; Van Liew, M.W.; Bingner, R.L.; Harmel, R.D.; Veith, T.L. Model evaluation guidelines for systematic quantification of accuracy in watershed simulations. Trans. ASABE 2007, 50, 885–900. [Google Scholar] [CrossRef]
  49. Schaefer, J.T. The critical success index as an indicator of warning skill. Weather Forecast. 1990, 5, 570–575. [Google Scholar] [CrossRef]
  50. NCHMF. Rainfall Classification of Vietnam; NCHMF: Hanoi, Vietnam, 2000.
  51. Wilks, D.S. Statistical Methods in the Atmospheric Sciences (International Geophysics Series; V. 91); Academic Press: Cambridge, MA, USA, 2006. [Google Scholar]
  52. Lenderink, G.; Buishand, A.; Deursen, W.V. Estimates of future discharges of the river Rhine using two scenario methodologies: Direct versus delta approach. Hydrol. Earth Syst. Sci. 2007, 11, 1145–1159. [Google Scholar] [CrossRef]
  53. Teutschbein, C.; Seibert, J. Bias correction of regional climate model simulations for hydrological climate-change impact studies: Review and evaluation of different methods. J. Hydrol. 2012, 456, 12–29. [Google Scholar] [CrossRef]
  54. Alijanian, M.; Rakhshandehroo, G.R.; Mishra, A.K.; Dehghani, M. Evaluation of satellite rainfall climatology using CMORPH, PERSIANN-CDR, PERSIANN, TRMM, MSWEP over Iran. Int. J. Climatol. 2017, 37, 4896–4914. [Google Scholar] [CrossRef]
  55. NAWAPI. Bang Giang—Ky Cung Water Resources Planning Project, Water Resources Assessment Report; Ministry of Natural Resources and Environment: Hanoi, Vietnam, 2018. (In Vietnamese)
  56. Gupta, H.V.; Sorooshian, S.; Yapo, P.O. Status of automatic calibration for hydrologic models: Comparison with multilevel expert calibration. J. Hydrol. Eng. 1999, 4, 135–143. [Google Scholar] [CrossRef]
  57. Yuan, F.; Zhang, L.; Win, K.W.W.; Ren, L.; Zhao, C.; Zhu, Y.; Jiang, S.; Liu, Y. Assessment of GPM and TRMM Multi-Satellite Precipitation Products in Streamflow Simulations in a Data-Sparse Mountainous Watershed in Myanmar. Remote Sens. 2017, 9, 302. [Google Scholar] [CrossRef]
  58. Hu, Q.; Yang, D.; Li, Z.; Mishra, A.K.; Wang, Y.; Yang, H. Multi-scale evaluation of six high-resolution satellite monthly rainfall estimates over a humid region in China with dense rain gauges. Int. J. Remote Sens. 2014, 35, 1272–1294. [Google Scholar] [CrossRef]
  59. Ebert, E.E.; Janowiak, J.E.; Kidd, C. Comparison of near-real-time precipitation estimates from satellite observations and numerical models. Bull. Am. Meteorol. Soc. 2007, 88, 47–64. [Google Scholar] [CrossRef]
  60. Nguyen, D.Q.; Renwick, J.; McGregor, J. Variations of surface temperature and rainfall in Vietnam from 1971 to 2010. Int. J. Climatol. 2014, 34, 249–264. [Google Scholar] [CrossRef]
  61. Ochoa-Sánchez, A.; Pineda Ordonez, L.E.; Crespo, P.; Willems, P. Evaluation of TRMM 3B42 precipitation estimates and WRF retrospective precipitation simulation over the Pacific-Andean region of Ecuador and Peru. Hydrol. Earth Syst. Sci. 2014, 18, 3179–3193. [Google Scholar] [CrossRef]
  62. Almazroui, M. Calibration of TRMM rainfall climatology over Saudi Arabia during 1998–2009. Atmos. Res. 2011, 99, 400–414. [Google Scholar] [CrossRef]
  63. Nerini, D.; Zulkafli, Z.; Wang, L.-P.; Onof, C.; Buytaert, W.; Lavado-Casimiro, W.; Guyot, J.-L. A comparative analysis of TRMM–rain gauge data merging techniques at the daily time scale for distributed rainfall–runoff modeling applications. J. Hydrometeorol. 2015, 16, 2153–2168. [Google Scholar] [CrossRef]
  64. Xuan, T.T.; Tuyen, H.M.; Thai, T.T.; Dung, N.K. Water Resources on Vietnam’s River System; Science and Technology Publisher: Hanoi, Vietnam, 2012. (In Vietnamese) [Google Scholar]
Figure 1. Overview of Red–Thai Binh River Basin. The stations with black dots at the middle were used for calibration climatology–topography-based linear-scaling approach.
Remotesensing 10 01582 g001
Figure 2. Monthly rainfall distribution over Red–Thai Binh River Basin (March 2000–December 2016). Cross symbol indicates average monthly rainfall.
Remotesensing 10 01582 g002
Figure 3. Percentage bias (PBIAS) score’s spatial performance of TMPA products (a) 3B42V7 and (b) 3B42RT against observation data on both daily and monthly scales from March 2000 to December 2016 over Red–Thai Binh River Basin. The grey line is the Red–Thai Binh River Basin boundary within the Vietnam territory.
Remotesensing 10 01582 g003
Figure 4. PBIAS score’s spatial performance of TMPA rainfall data against observation data during (a) the dry and (b) the wet season from March 2000 to December 2016 over the Red–Thai Binh River Basin. The grey line is the Red–Thai Binh River Basin boundary within Vietnam territory.
Remotesensing 10 01582 g004
Figure 5. Average rainfall detection measurement of TMPA 3B42V7 and TMPA 3B42RT over the Red–Thai Binh River Basin from March 2000 to December 2016.
Remotesensing 10 01582 g005
Figure 6. Critical success index (CSI) score’s spatial performance of TMPA rainfall data against observation data from March 2000 to December 2016 over the Red–Thai Binh River basin. The grey line is the Red–Thai Binh River Basin boundary within Vietnam territory.
Remotesensing 10 01582 g006
Figure 7. Average probability density function (PDF) of ground observation, TMPA 3B42V7, and TMPA 3B42RT for rainfall in daily, daily (dry season), and daily (wet season) over the Red–Thai Binh River Basin from March 2000 to December 2016.
Remotesensing 10 01582 g007
Figure 8. Percentage difference of PDF between TMPA 3B42V7, TMPA 3B42RT, and observation at (a) no rainfall intensity (0–0.6 mm/day) and (b) low rainfall intensity (0.6–6 mm/day) over the Red–Thai Binh River Basin from March 2000 to December 2016.
Remotesensing 10 01582 g008
Table 1. Rainfall station descriptions for the ground observation stations over Red–Thai Binh River Basin (March 2000–December 2016).
No.Station NameLong. (°)Lat. (°)Elev. (m)Annual Rainfall
(AR) (mm/year)
Standard Deviation of Rainfall
(SDR) (mm/day)
No. of Rain Days (NRD)
(day)
1Baccan105.8222.13241138911.29250
2Bacninh106.0521.208153713.27248
3Baolac105.6722.9534812019.91263
4Caobang106.2322.67244141711.5251
5Dienbien103.0221.40487153511.75248
6Hagiang104.9822.82117233317.15222
7Bavi105.3721.08535179114.61234
8Lang105.8521.0217168614.5246
9Phuxuyen105.9020.779151613.16272
10Sontay105.5021.1314160013.27244
11Chilinh106.3821.071148912.51250
12Haiduong106.3020.953153013.6249
13Hoabinh105.3320.8248186114.69239
14Maichau105.0720.60579185918.79251
15Muongte102.6322.47354243317.1229
16Tamduong103.1522.05303233314.49216
17Chilang106.5721.65124132411.9267
18Langson106.7721.83263131511.55253
19Thatkhe106.4722.25157148412.33243
20Vanmich106.3722.10238134111.33240
21Laocai103.9522.50152181014.11229
22Ninhbinh105.9820.273172515.16242
23Baichay107.0320.9759189817.93246
24Mongcai107.9721.527273524.5230
25Tienyen107.4421.3316213919.04231
26Sonla103.9021.33709136410.96252
27Thainguyen105.5021.60784176015.02238
28Tuyenquang105.2021.8229157514.02242
29Yenbai104.8721.7041179614.97222
Table 2. Contingency table to measure the correspondence between ground observation data and Tropical Rainfall Measurement Mission Multi-satellite Precipitation Analysis (TMPA) product concerning the threshold intensity of 0.6 mm/day of a point-to-point event [51].
Ground Observation
YesNo
TMPA ProductYesHitFalse Alarm
NoMissCorrect Rejection
Table 3. Descriptive statistics for observation rain gauge and TMPA data in daily and monthly scale.
nTMPA 3B42V7TMPA 3B42RT
Daily ScaleMonthly ScaleDaily ScaleMonthly Scale
MaxMinMeanMaxMinMeanMaxMinMeanMaxMinMean
CC290.5100.3200.3870.9590.8330.8960.3950.2160.3040.9000.7310.842
NSE290.207−0.5070.1520.8840.5930.7650.002−0.968−0.5210.7920.1310.480
RMSE2921.711.415.1111.636.266.524.513.717.3143.676.496.0
PBIAS2933.2−21.53.233.2−21.53.238.5−18.114.838.5−18.114.8
Note: n is total number of stations. RMSE unit on a daily scale is mm/day. RMSE unit on a monthly scale is mm/month.
Table 4. Descriptive statistics for daily and monthly observation rain gauge and those of TMPA data during the dry and wet seasons.
nTMPA 3B42V7TMPA 3B42RT
Dry SeasonWet SeasonDry SeasonWet Season
MaxMinMeanMaxMinMeanMaxMinMeanMaxMinMean
Daily
CC290.4870.2890.4070.4940.2640.3440.4230.1960.3170.3640.1410.255
NSE29−0.048−0.8840.3250.185−0.6010.201−0.076−1.2370.612−0.031−1.1070.598
RMSE298.85.87.029.114.720.010.26.47.732.817.922.9
PBIAS2918.9−38.6−10.437.2−19.46.131.7−47.314.143.2−13.320.7
Monthly
CC290.9570.6570.8270.9240.5880.7960.8730.5510.7180.8170.3580.691
NSE290.8810.1910.5860.7880.2760.5660.672−0.3810.1990.618−0.8450.009
RMSE2944.916.829.0152.848.088.757.126.741.0198.3100.6128.6
PBIAS2918.9−38.610.437.2−19.46.131.7−47.314.143.2−13.320.7
Note: n is the total number of stations. RMSE unit on a daily scale is mm/day. RMSE unit on a monthly scale is mm/month.
Table 5. Correlation coefficient between correction factors of TMPA 3B42V7 against climatology–topography characteristics.
LONGLATELEVARSDRNRD
C F 1 0.46 **−0.32−0.350.180.27−0.21
C F 2 0.47 **0.61 **0.48 **0.090.29−0.02
C F 3 0.43 *0.58 **0.42 *−0.030.110.07
C F 4 0.010.00−0.110.52 **0.47 *0.57 **
C F 5 0.010.07−0.020.66 **0.56 **0.65 **
C F 6 −0.040.02−0.090.63 **0.45 *0.46 *
C F 7 0.030.12−0.080.69 **0.60 **0.44 *
C F 8 0.06−0.16−0.340.53 **0.54 **0.50 **
C F 9 −0.290.170.250.52 **0.50 **0.58 **
C F 10 0.260.42 *0.40 *0.58 **0.68 **0.47 *
C F 11 0.29−0.050.47 **0.310.33−0.32
C F 12 0.39 *0.39 *0.41 *0.120.23−0.17
Note: * 0.05 significant level; ** 0.01 significant level
Table 6. Correlation coefficient between correction factors of TMPA 3B42RT against climatology–topography characteristics.
LONGLATELEVARSDRNRD
C F 1 −0.020.50 **−0.100.290.28−0.30
C F 2 0.48 **0.69 **0.56 **−0.030.160.23
C F 3 0.250.55 **0.42 *−0.060.010.05
C F 4 −0.150.22−0.160.61 **0.43 *0.57 **
C F 5 −0.220.37−0.030.69 **0.47 *0.59 **
C F 6 −0.280.44 *0.020.68 **0.39 *0.53 **
C F 7 0.10−0.13−0.300.61 **0.56 **−0.18
C F 8 0.48 **−0.300.52 **0.58 **0.74 **−0.23
C F 9 300.04−0.030.54 **0.69 **−0.34
C F 10 0.190.42 *−0.340.57 **0.66 **−0.35
C F 11 0.55 **−0.220.51 **0.46 *0.62 **−0.24
C F 12 0.64 **−0.370.45 *0.230.43 *−0.16
Note: * 0.05 significant level; ** 0.01 significant level.
Table 7. Multiple linear models to predict correction factors of TMPA 3B42V7 data.
FormulasCCp-Value
C F 1 =   1.004 LONG + 0.947 0.4460.045
C F 2 =   0.736 LONG 2.331 LAT 1.347 ELEV + 3.256 0.779<0.001
C F 3 =   0.242 LONG 1.298 LAT 0.735 ELEV + 2.200 0.768<0.001
C F 4 =   0.103 AR +   0.134 SDR 0.262 NRD + 0.921 0.6040.003
C F 5 = 0.046 AR +   0.218 SDR 0.404 NRD + 1.068 0.7480.001
C F 6 =   1.019 AR   0.528 SDR + 0.116 NRD + 0.662 0.7120.003
C F 7 =   0.937 AR   0.170 SDR + 0.140 NRD + 0.615 0.7330.002
C F 8 =   0.351 AR + 0.544 SDR 0.393 NRD + 1.093 0.6940.006
C F 9 =   0.491 AR +   0.636 SDR 0.563 NRD + 1.182 0.6870.006
C F 10 =   0.286 LAT 0.291 ELEV 0.665 AR +   0.965 SDR 0.678 NRD + 1.488 0.840<0.001
C F 11 =   0.755 ELEV + 1.373 0.6000.003
C F 12 =   0.437 LONG 1.422 LAT 1.202 ELEV + 2.671 0.5640.038
Note: p-value shows significant level between predicted correction factors using multiple linear models and calculated correction factors.
Table 8. Multiple linear models to predict correction factors of TMPA 3B42RT data.
FormulasCCp-Value
C F 1 = 1.537 LAT + 2.582 0.5010.041
C F 2 =   1.102 LONG 3.343 LAT 2.204 ELEV + 4.038 0.875<0.001
C F 3 =   2.871 LAT 2.045 ELEV + 4.432 0.7480.001
C F 4 =   1.041 AR 0.515 SDR 0.003 NRD + 0.672 0.7200.003
C F 5 = 1.197 AR 0.687 SDR 0.082 NRD + 0.545 0.761<0.001
C F 6 =   0.215 LAT + 1.524 AR 0.909 SDR +   0.386 NRD + 0.147 0.875<0.001
C F 7 =   0.605 AR +   0.112 SDR + 0.696 0.6080.002
C F 8 =   0.196 LONG 0.241 ELEV 0.011 AR + 0.580 SDR + 0.676 0.877<0.001
C F 9 =   0.311 AR +   1.037 SDR + 0.681 0.7120.003
C F 10 =   0.664 AR +   0.429 SDR + 0.587 SD + 0.948 0.6740.007
C F 11 =   1.233 LONG 0.638 ELEV + 0.720 AR + 0.616 SDR + 0.250 0.838<0.001
C F 12 =   2.233 LONG 0.978 ELEV + 0.936 SDR + 0.842 0.7290.002
Note: p-value shows significant level between predicted correction factors using multiple linear models and calculated correction factors.
Table 9. The average performance of calibration and validation for climatology–topography-based linear-scaling approach (CTLS) with TMPA 34B42V7 and TMPA 3B42RT on a daily scale.
Before Bias CorrectionLSCTLS
CCNSERMSEPBIASCCNSERMSEPBIASCCNSERMSEPBIAS
3B42V7
Calibration0.389−0.14715.23.00.389−0.13015.21.10.389−0.11915.20.8
Validation0.378−0.17514.84.00.375−0.15314.71.50.372−0.16514.81.7
3B42RT
Calibration0.303−0.50917.313.50.309−0.29916.3−0.20.306−0.34216.62.2
Validation0.307−0.56517.119.40.308−0.29915.80.80.300−0.40916.47.4
Table 10. The average performance of calibration and validation for CTLS with TMPA 34B42V7 and TMPA 3B42RT on a monthly scale.
Before Bias CorrectionLSCTLS
CCNSERMSEPBIASCCNSERMSEPBIASCCNSERMSEPBIAS
3B42V7
Calibration0.8990.76766.73.00.9040.81659.51.10.8990.79962.10.8
Validation0.8810.75565.84.00.8830.77863.21.50.8730.75565.91.7
3B42RT
Calibration0.8430.48896.113.50.8660.73471.8−0.20.8500.67778.82.2
Validation0.8380.44795.919.40.8540.71371.30.80.8310.64279.37.4
Table 11. The average PBIAS score’s performance of calibration and validation for CTLS with TMPA 34B42V7 and TMPA 3B42RT during the dry and wet seasons.
Before Bias CorrectionLSCTLS
Dry SeasonWet SeasonDry SeasonWet SeasonDry SeasonWet Season
3B42V7
Calibration−10.325.756.970.003.370.51
Validation−10.9219.299.630.0012.670.07
3B42RT
Calibration−14.487.32−0.580.005.591.71
Validation−12.7526.235.590.0024.324.55
Table 12. Average CSI score’s performance of calibration and validation for CTLS with TMPA 34B42V7 and TMPA 3B42RT for daily, daily (dry season), and daily (wet season).
Before Bias CorrectionLSCTLS
DailyDaily (Dry Season)Daily (Wet Season)DailyDaily (Dry Season)Daily (Wet Season)DailyDaily (Dry Season)Daily (Wet Season)
3B42V7
Calibration0.4500.2580.5310.4490.2590.5290.4480.2590.529
Validation0.4290.2250.5190.4280.2250.5160.4280.2260.518
3B42RT
Calibration0.4220.2260.5050.4220.2260.5050.4220.2260.505
Validation0.4020.2020.4920.4020.2050.4920.4020.2060.492

