Article

Estimated Wind River Range (Wyoming, USA) Glacier Melt Water Contributions to Agriculture

1
University of Wyoming, Department of Civil and Architectural Engineering, 1000 East University Avenue, Laramie, WY 82070, USA
2
University of Tennessee, Department of Civil and Environmental Engineering, 223 Perkins Hall, Knoxville, TN 37996, USA
*
Author to whom correspondence should be addressed.
Remote Sens. 2009, 1(4), 818-828; https://doi.org/10.3390/rs1040818
Submission received: 4 September 2009 / Revised: 1 October 2009 / Accepted: 19 October 2009 / Published: 28 October 2009
(This article belongs to the Special Issue Global Croplands)

Abstract

:
In 2008, Wyoming was ranked 8th in barley production and 20th in hay production in the United States and these crops support Wyoming’s $800 million cattle industry. However, with a mean elevation of 2,040 meters, much of Wyoming has a limited crop growing season (as little as 60 days) and relies on late-summer and early-fall streamflow for agricultural water supply. Wyoming is host to over 80 glaciers with the majority of these glaciers being located in the Wind River Range. These “frozen reservoirs” provide a stable source of streamflow (glacier meltwater) during this critical late-summer and early-fall growing season. Given the potential impacts of climate change (increased temperatures resulting in glacier recession), the quantification of glacier meltwater during the late-summer and early-fall growing seasons is needed. Glacier area changes in the Wind River Range were estimated for 42 glaciers using Landsat data from 1985 to 2005. The total surface area of the 42 glaciers was calculated to be 41.2 ± 11.7 km2 in 1985 and 30.8 ± 8.2 km2 in 2005, an average decrease of 25% over the 21 year period. Small glaciers experienced noticeably more area reduction than large glaciers. Of the 42 glaciers analyzed, 17 had an area of greater than 0.5 km2 in 1985, while 25 were less than 0.5 km2 in 1985. The glaciers with a surface area less than 0.5 km2 experienced an average surface area loss (fraction of 1985 surface area) of 43%, while the larger glaciers (greater than 0.5 km2) experienced an average surface area loss of 22%. Applying area-volume scaling relationships for glaciers, volume loss was estimated to be 409 × 106 m3 over the 21 year period, which results in an estimated 4% to 10% contribution to warm season (July–October) streamflow.

1. Introduction

The State of Wyoming is a major producer of cattle in the United States. The primary agricultural crop grown in the state to support the livestock industry is hay and barley. The challenge for farmers and ranchers is the limited growing season. This is due to high land elevations which results in low temperatures. Thus, late-summer and early-fall are critical seasons for agricultural production. The primary water supply source for these seasons is streamflow. In the western USA, the primary source of water (streamflow) for municipal, agricultural and hydropower use is snowpack. This is primarily attributed to precipitation occurring in the form of snowfall and, in the western USA, snowfall accounts for approximately 50%–70% of total precipitation [1].
The Wyoming Water Development Commission (WWDC) Wind-Bighorn River Basin (WBRB) Plan—Final Report states that “very little research was performed on the (Wind River) glaciers from 1960 to 1998” and “from 1998 to present, there has been a renewed interest in the glaciers.” The WBRB Plan identifies the glaciers as an important source of late-summer and early-fall runoff and in general terms, evaluates climatic change and drought scenarios. However, specific information on climatic influences on glacial variability and the contribution of glacial melt to streamflow have not been addressed.
Thus, quantifying the amount (or percentage) of glacier meltwater contribution to total streamflow during the critical late-summer and early-fall growing seasons is of major interest. Given the possible impacts of climate change (increased temperatures), the continued recession of these “frozen reservoirs” could have a significant impact on agricultural water supply and alternative sources (i.e., new impoundments, groundwater, etc.) may need to be identified and included in long-term planning efforts.
The purpose of this study is to quantify changes in glacier area and volume in Wyoming’s Wind River Range from 1985 through 2005 through the use of Landsat imagery. In addition to estimating area and volume changes, glacier meltwater contributions to streamflow are estimated for three watersheds containing glaciers.

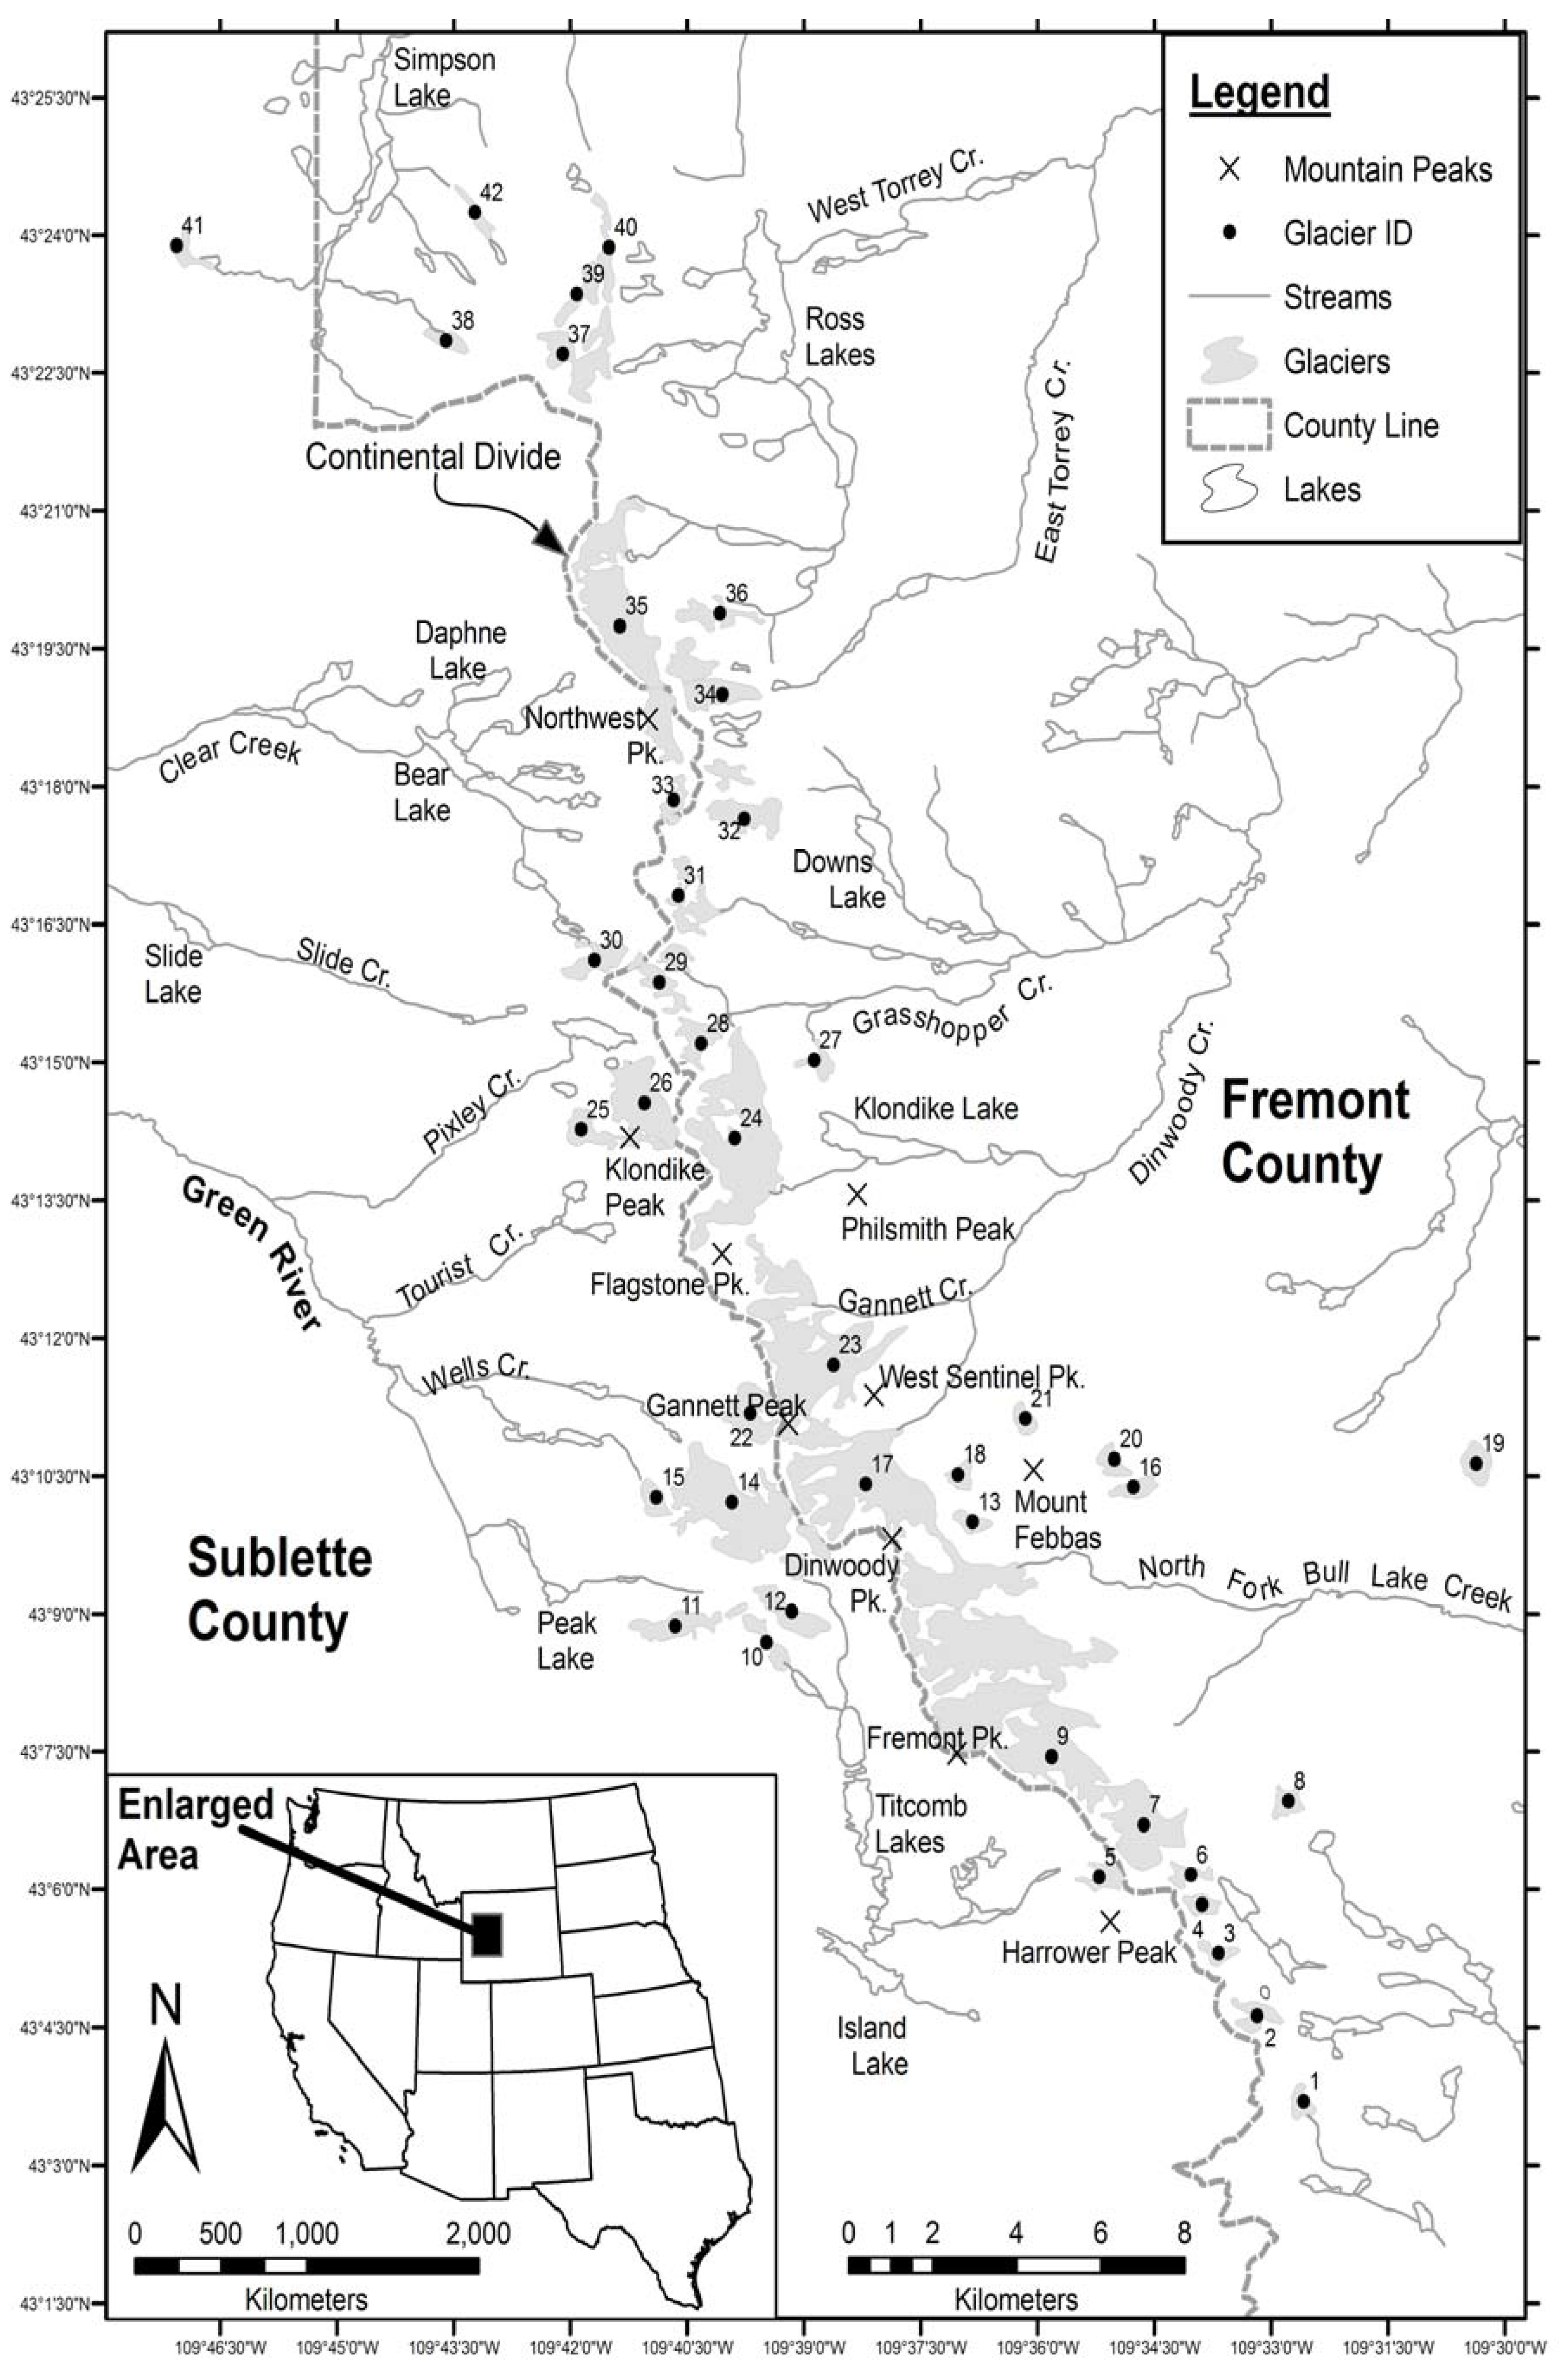
2. Background and Study Area

Glaciers store about 75% of the World’s freshwater [2] and the recent retreat of glacier ice has resulted in significant impacts on the development of water resources in many areas. Glacially populated watersheds are shown to provide a more stable water source than non-glaciated basins [3,4,5]. Globally, watershed hydrology is greatly affected by increased rates of glacier retreat due to the greater variability of glacier meltwater volume and timing [5,6,7,8,9]. In the USA, the impacts of glaciers on the development of water resources are exacerbated in the Pacific Northwest and the Rocky Mountain states due to the large number of small alpine glaciers [2]. Research shows that small glaciers are more sensitive to temperature and precipitation variability [10,11].
The majority of the glaciers in the conterminous USA occur in western states including Washington, Wyoming, Montana, Oregon, California, Colorado and Idaho [12,13,14]. Estimates show that western states are host to approximately 590 km2 of glacier area [13,15]. The glaciers of the western USA have significant impacts on the development of water resources in the region. In some glaciated watersheds, glaciers (meltwater) can contribute as much as 50% of the summer runoff and these glaciated watersheds display less runoff variability than nonglaciated basins [5]. However, the amount of glacier meltwater contribution varies greatly depending on the degree of glacier coverage. Rivers and streams originating from glaciers exhibit unique streamflow patterns making them valuable for mid to late summer water supply needs, since glaciers typically reach their peak outflow during this time [2,16].
Recorded glacier observations in the American west began as early as 1857 [13] while efforts to document glacier area changes began in the 1950s [17]. Early glacier monitoring efforts involved expensive and time consuming field efforts, usually focusing on only one glacier in each region under the assumption that other glaciers in the region would undergo similar changes [9]. Meier [18] estimated that the western United States was host to approximately 510 km2 of glacier area, although this estimate is largely speculative due to incomplete data [13]. More recent estimates show that the American west was host to approximately 590 km2 in the 1970’s and 1980’s [13]. The most recent study of Wyoming’s glaciers was conducted in the late 1980s and early 1990s [19,20].
Wyoming is host to approximately 80 glaciers [2] with the vast majority of glaciers occurring in the Wind River Range. The Wind River Range contains 63 glaciers [15], making it the largest concentration of glaciers in the American Rocky Mountains, which extends from northern New Mexico into central Colorado, eastern Utah, western Wyoming, eastern Idaho and western Montana. The current research identified 42 glacier complexes in the Wind River Range (Figure 1 and Table 1). Referring to Table 1, in some cases, glaciers (see ID 9) are grouped together since it was difficult to distinguish “breaks” in glacier ice when evaluating remote sensing data. Meier [18] estimated that the total glacier area was approximately 47 km2 in 1961, while more recent estimates show that the total area of glaciers in Wyoming has decreased to approximately 37 km2 [13,15,21].
The Wind River Range is characterized by extremely steep terrain, making access to the glaciers difficult, resulting in very few research efforts that focus on a complete inventory and analysis of the Wind River Range glaciers. In addition to the complete inventory and analysis efforts by Meier [2,18], Graf [15], Krimmel [13] and Fountain [21], several studies have been performed on select glaciers of the Wind River Range since the 1960s.
Figure 1. Location Map of glaciers in the Wind River Range, Wyoming, USA.
Remotesensing 01 00818 g001
Table 1. Wind River Range glaciers [ID, name, average slope (%) and maximum length (m)] identified for current research (NN denotes and unnamed glacier). Site ID 9 and 23 consists of multiple, named glaciers that were combined in the area analysis.
Site IDGlacier NamesAverage SlopeMax Length Site IDGlacier NamesAverage SlopeMax Length
1NN14%417 21NN31%695
2NN30%1011 22Minor Glacier24%1268
3NN28%698 23Gannett Glacier29%2735
4NN26%669 23 Gooseneck Glacier52%1107
5Harrower Glacier38%841 24Grasshopper Glacier10%3953
6NN32%825 25J Glacier13%1747
7Knife Point Glacier23%1848 26Sourdough Glacier12%1928
8NN44%875 27NN41%826
9Bull Lake Glacier16%2139 28NN15%1146
9Upper Fremont Glacier11%2104 29NN13%1411
9Sacagawea Glacier5%3618 30Connie Glacier11%1218
9Helen Glacier15%2397 31NN2%1556
10NN29%1252 32Downs Glacier21%1248
11Stroud Glacier1%1640 33NN8%1034
12Twins Glacier18%1547 34NN21%1321
13NN28%713 35Continental Glacier9%2717
14Mammoth Glacier18%2645 36NN32%1520
15Baby Glacier45%835 37NN5%1956
16NN30%885 38NN14%851
17Dinwoody Glacier15%2619 39NN7%1438
18Heap Steep Glacier56%621 40NN8%2209
19NN15%918 41NN2%896
20NN5%686 42NN15%1257

3. Data and Methods

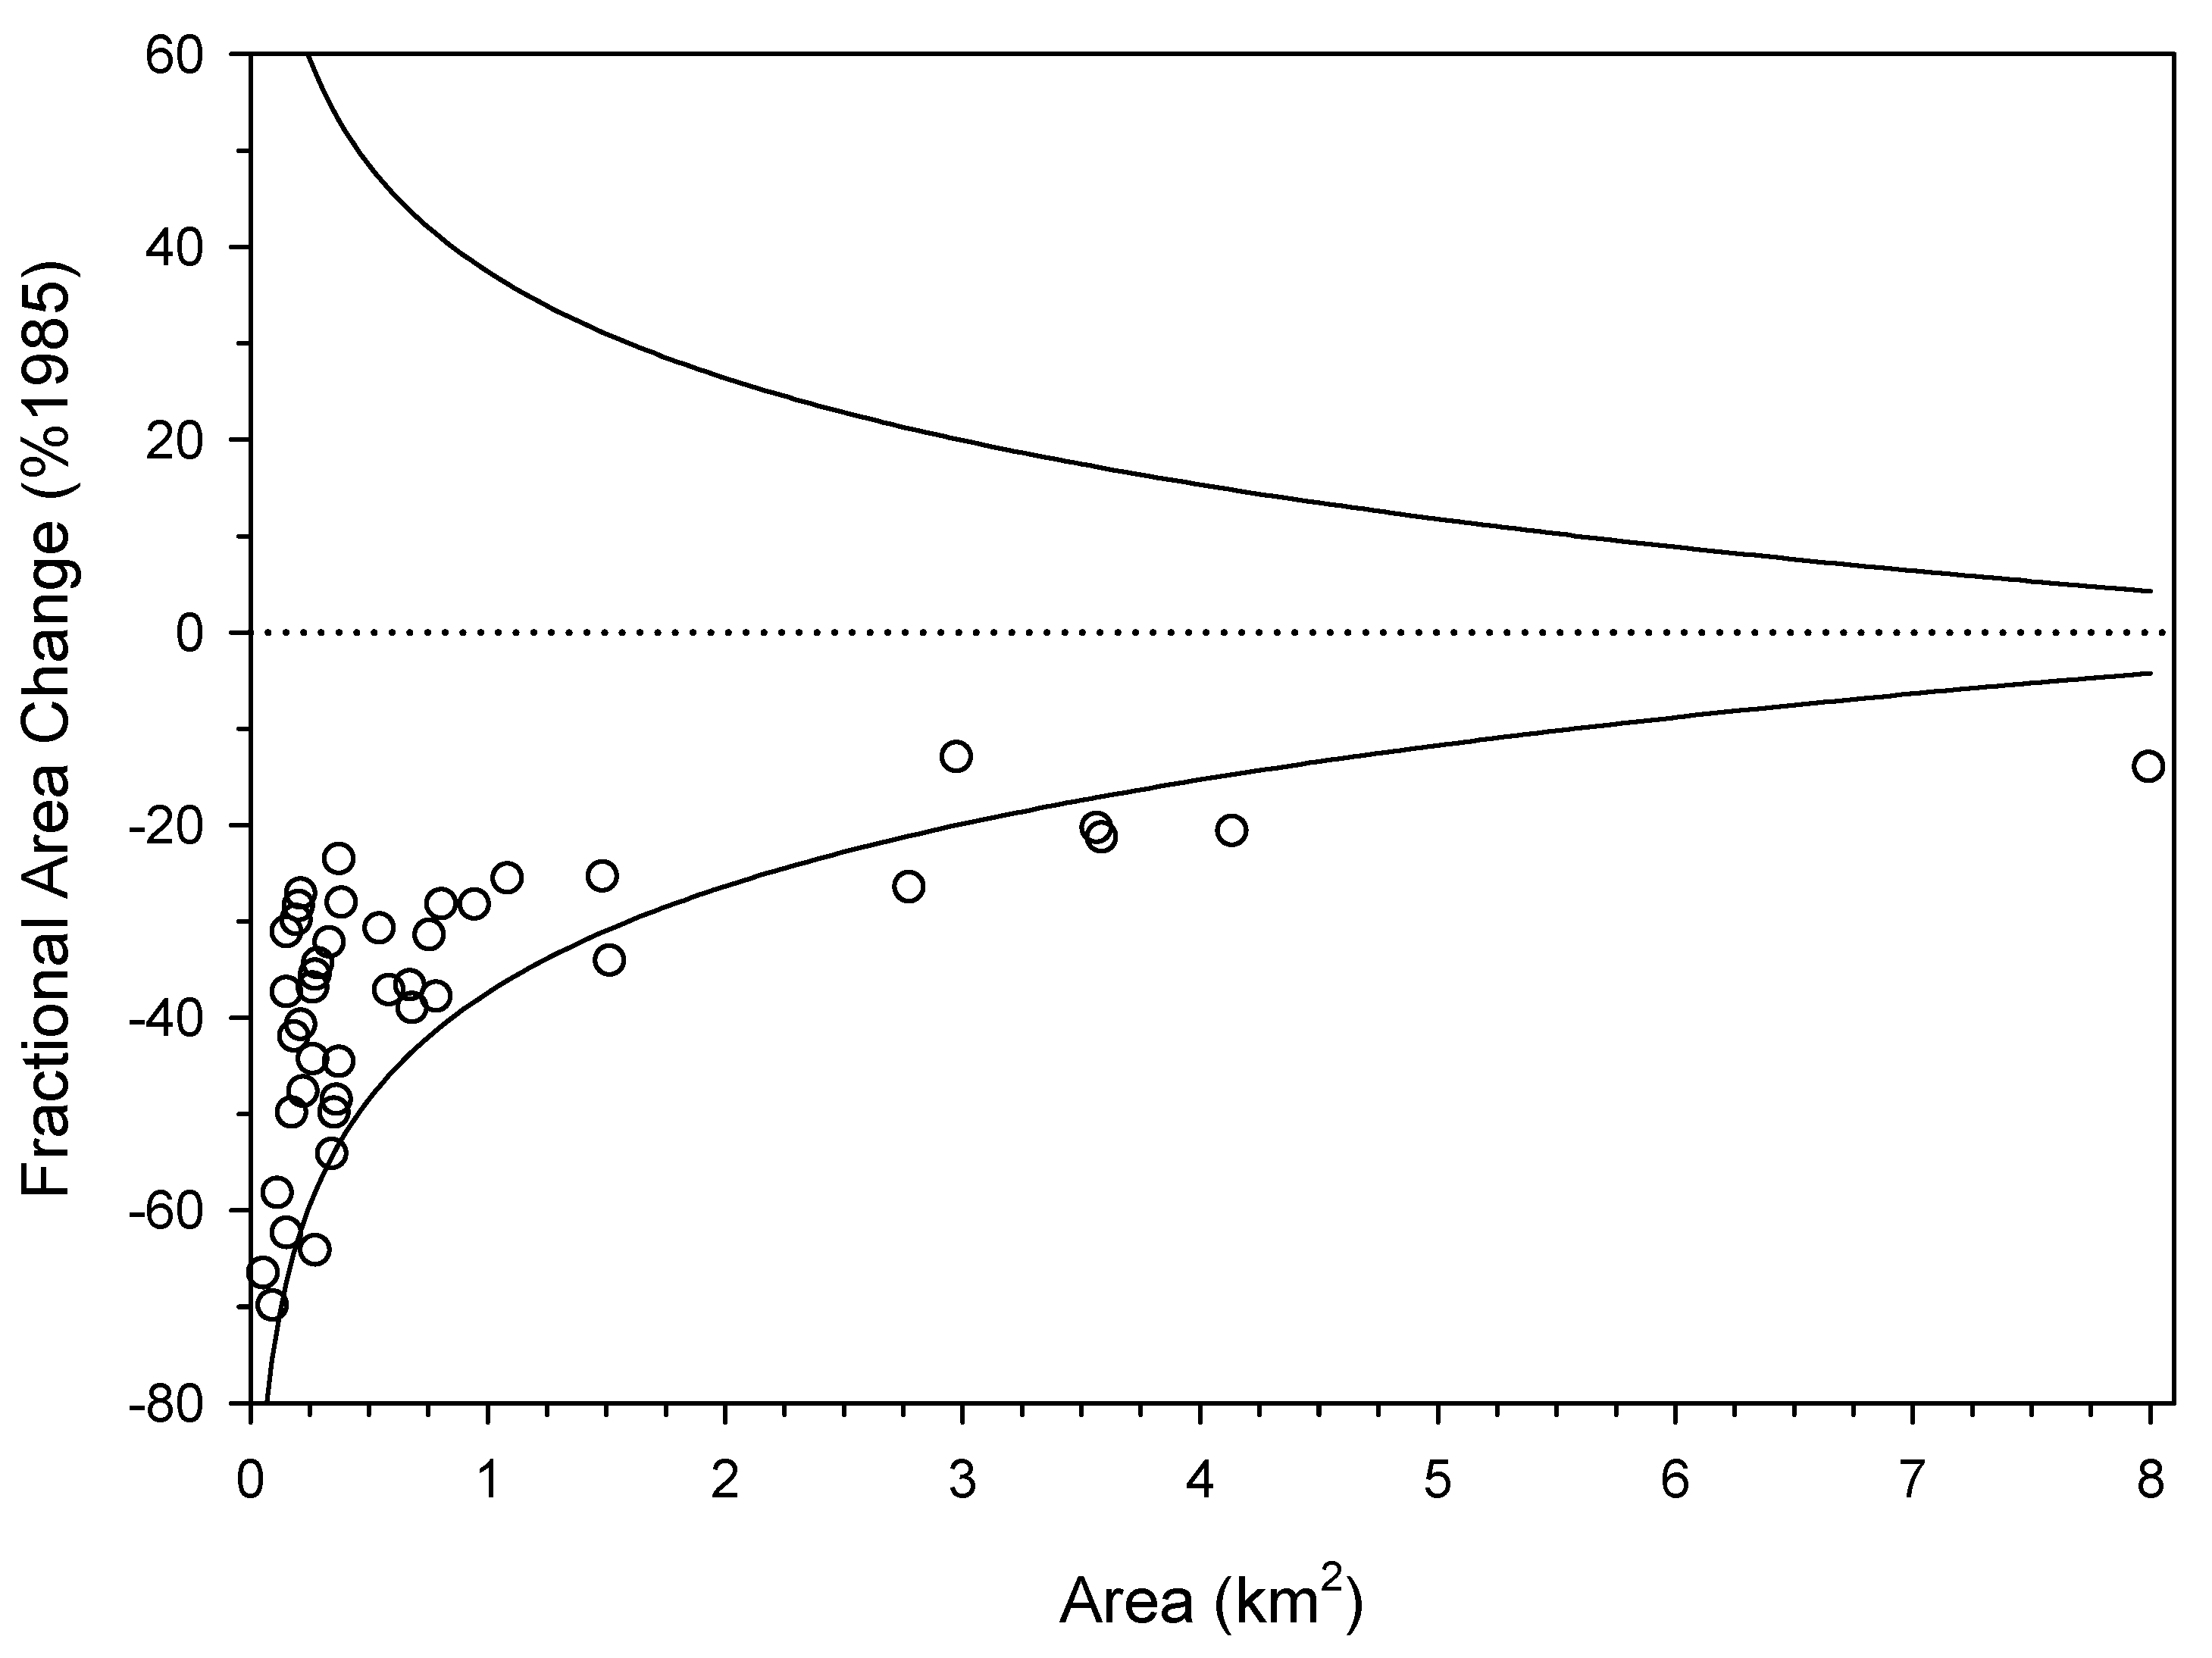
3.1. Glacier Area Changes

Area changes, from 1985 to 2005, were calculated for 42 glaciers in the Wind River Range, using Landsat data obtained from the Wyoming Geographic Information Science Center (WyGISC) in Laramie, Wyoming (USA). The data consisted of unrectified Landsat Thematic Mapper (TM) 5 (1985) and Landsat Enhanced Thematic Mapper (TM) 7 (2005) scenes. Each scene was obtained in the late summer months to reduce the effects of yearly snow cover. The TM has seven spectral bands ranging from 0.45 to 12.5 μm. Bands 1 through 5 and 7 are in the visible, near infrared and middle infrared wavelength regions and have a ground resolution of 30 m. Band 6 is in the thermal infrared wavelength region has a resolution of 120 m. Band 5 is especially useful for distinguishing between clouds and snow. Although the resolution of 30 m (Landsat TM) is not ideal for quantitative area measurements, it was found by [22] that the resolution is adequate to determine the accumulation area ratio on small glaciers, thus it is deemed suitable for estimating the total area of small glaciers [22,23]. The authors recognize that inherent uncertainties exist when using this data set such as the low resolution will reduce accuracy and, at times, it is difficult to distinguish debris-covered ice from moraines.
Each Landsat image was analyzed using an unsupervised classification. An unsupervised classification is nonbiased statistical approach used to group the pixels of an image into classes for land cover analyses. This procedure can be performed digitally using several different software packages. For this study, ERDAS Imagine was used to perform unsupervised classifications on each of the Landsat images. Due to the large area of coverage for each Landsat image, many classes were necessary to accurately classify each land-cover type. The Landsat image contains areas of agricultural land, forested areas, granite rocks, snow, glacial ice etc, thus 25 classes were chosen to perform the unsupervised classification. In each of the land-cover types mentioned above, several subclasses may be contained, for example, glacial ice can occur in the form of clean snow from the previous year, firn (a substance that is undergoing the transition from snow to glacier ice) clean glacier ice and dirty glacier ice. Therefore it was necessary to have many classes to be able to identify the subtle differences between different materials. Each classified Landsat image was then imported to a Geographical Information System (GIS) for further analysis. The resulting polygons representing glacier area were imported into a GIS framework to calculate the surface area of each glacier in 1985 and 2005. Since clouds are similar in color to snow and ice each cloud was identified using the band 5 information and removed by clipping them in ArcGIS.
The base map of glacier extent from 1985 was combined with a 30 meters resolution digital elevation model to calculate the maximum length and average slope of each glacier. The accuracy of the unsupervised classification was determined by calculating the kappa coefficient for each classified glacier. The kappa coefficient has been utilized in numerous remote sensing applications [24,25]. The kappa coefficient represents the percentage of points that were correctly classified during the unsupervised classification. The kappa coefficient accuracy assessment was performed only on the 1985 glacier classifications to determine the overall accuracy of the classification and the values for accuracy were assumed to generally represent the accuracy of the 2005 classifications. The percent error was obtained by multiplying the surface area (km2) of the glacier times the percent (e.g., 1–kappa coefficient) obtained from the kappa coefficient.

3.2. Glacier Volume Changes (Area-Volume scaling relationships)

Area-volume scaling relationships were used to estimate glacier volume changes for the 42 glaciers from 1985 to 2005. Area-volume scaling relationships [26] were explored by subtracting the 1985 volume estimates from those in 2005 for the 42 glaciers. The standard error of the mean (the standard deviation divided by the square root of the number of data points) was utilized to determine the error (+ or −) in volume change estimates. The author’s acknowledge that area-volume scaling relationships are most accurate when applied to glaciers that are in equilibrium with climate and, thus, our results are only speculative.
Utilizing methods presented by Bahr et al. [26], glacier ice volumes can be estimated from surface area. This approach allows the estimation of ice volumes for glaciers given the surface area of each glacier. Bahr et al. [26] used this technique on 144 mountain glaciers, each having reliable radio echo soundings and found that glacier volumes can be expressed as:
V = α A β
where α and β are empirically derived constants and are equal to 0.175 and 1.36 respectively, and A (m2) is equal to the surface area of the glacier and V (m3) is equal to the volume of the glacier.

4. Results

4.1. Glacier Area Changes (1985 to 2005)

In 1985, the 42 glaciers covered an area of 41.2 ± 11.7 km2. In 2005, the 42 glaciers covered an area of 30.8 ± 8.2 km2. Therefore, the overall decrease in glacier area from 1985 to 2005 was approximately 25%. Of the 42 snow and ice features analyzed, 25 resulted in an area of <0.5 km2 in 1985, while the remaining 17 were >0.5 km2 in 1985. The glaciers that resulted in a surface area <0.5 km2 in 1985 experienced an average decrease of approximately 43%, while the large glaciers (>0.5 km2) experienced an average decrease of approximately 22% from 1985 to 2005. Similar to Granshaw and Fountain [21], the 42 individual glaciers Fractional Area Change (FAC—as a percentage of the 1985 area) and the error envelope are displayed in Figure 2. While smaller glaciers lost more surface area than large glaciers, no significant correlations were found between glacier area change and topographic characteristics.
Figure 2. Individual glacier Fractional Area Change (FAC) as a percent of 1985 area. The open circles represent the 42 individual glaciers while the solid lines represent the error envelope about the axis.
Remotesensing 01 00818 g002

4.2. Glacier Volume Changes (Area-Volume Scaling)

The volume of each glacier was calculated based on the 1985 surface area using Bahr’s [26] empirical equation. This process was then repeated using the 2005 surface area of each glacier. The 2005 volume was then subtracted from the 1985 volume for each glacier and the individual glacier volumes were then summed. This resulted in an estimated [26] volume loss for the 42 glaciers in the Wind River Range of 409.0 ± 2.5 × 10⁶ m3, which translates into a water equivalent of approximately 370 × 106 m3. While the greatest percent area loss was noted for the 25 small glaciers, it was found the volume loss of the 17 large glaciers accounts for approximately 88% of the total volume loss in the Wind River Range, and therefore makes the largest contributions to downstream flows.
The majority of the water lost from Wind River Range glaciers contributes to three watersheds with downstream streamflow gages. The USGS acknowledges that these gages (Dinwoody Creek Above Lakes, Bull Lake Creek Above Bull Lake and Green River at Warren Bridge) represent flows that are unaffected by diversions and/or significant channel alterations. Based on glacier volume loss estimates, approximately 4% to 10% of the warm season (July to October) streamflow at these locations can be attributed to glacier meltwater contributions. For the purpose of this analysis, it was assumed that all glacier melt takes place during this period. It was also assumed that all glacier meltwater is conveyed to its respective downstream gage and that no evaporation/infiltration takes place, therefore this analysis is only suggestive. Some glaciers do contribute to other watersheds in which streamflow records are either impaired or lacking sufficient streamflow data necessary to approximate the extent of glacier contributions to flows. If the glaciers continue to recede, it is likely that the volume of late-summer streamflows associate with glacier melt will decrease. The storage provided in the glacier ice (i.e., frozen reservoir) is likely diminishing and new sources (i.e., groundwater or impoundments) may be required to offset this critical loss of growing season water.

5. Discussion and Conclusions

Wind River Range snowpack variability was investigated to determine if a possible cause of the rapid reduction in glacier area could be attributed to a downward trend in precipitation (snow). Hunter et al. [27] identified 323 Natural Resources Conservation Service (NRCS) SNOTEL (SNOwpack TELemetrysites) stations for the period of 1961 to 2004 and for 121 SNOTEL stations for the period 1941 to 2004 in the western United States. April 1st Snow-Water Equivalent (SWE) typically represents the peak measurement of snowpack in the western United States. SWE is simply a method of representing (converting) snow accumulation to an equivalent amount of water. Seven SNOTEL stations adjacent to the Wind River Range (four on the west slope and three on the east slope) were evaluated. The author’s acknowledge that these stations are at lower elevations than the glaciers, however, they represent the best available data source in the region. April 1st snowpack was highly variable which Hunter et al. [27] attributes to a strong El Niño-Southern Oscillation/ENSO signal in the region. A slight, downward trend for the 1960s to present was identified. This was primarily attributed to the recent drought beginning around 2000. Interestingly, April 1st average snowpack for the period of record was similar for the four stations on the west slope (average of 122.7 cm with a standard deviation of 45.2 cm) and the three stations on the east slope (average of 131.8 cm with a standard deviation of 38.6 cm).
An additional explanation of the rapid reduction in glacier area is increased air temperatures. The Intergovernmental Panel on Climatic Change (IPCC) reported that a consensus exists among scientists and policy makers that “…the globally averaged net effect of human activities since 1750 has been one of warming…” [28]. While determining impacts of climate change at regional (e.g., Wind River Range) scale prove challenging, the IPCC noted the general pattern (trend) of drier conditions in the midlatitudes and wetting in the high latitudes [28]. Ice core samples from glaciers in the Wind River Range revealed rapid increases in air temperatures since 1960 [29], thus, confirming the scientific consensus. Also, several physical parameters such as the elevation of the glacier, the exposure to direct radiation (sunlight), slope and local topography would influence area change but were not included in the current research.
While the Wind River Range glaciers decreased approximately 25% in area from 1985 to 2005, glacier area change is highly variable in the United States. Granshaw and Fountain [21] determined that North Cascades National Park (Washington, USA) glaciers decreased only 7% from 1958 to 1998 while they cite a study by Hall and Farge [30] which determined Sperry and Grinnell Glaciers (in the Lewis Range, Montana, USA) decreased by 30% during the same time period. The climate patterns impacting the Wind River Range may be similar to the Lewis Range, given their relatively similar location (further inland) when compared to the Cascade Range, although all three regions acknowledge a strong ENSO signal in snowpack [23]. Future research will attempt to “bridge” the spatial gap between the Wind River Range and Lewis Range by examining glaciers in the Teton Range in northwestern Wyoming (USA) and attempt to determine if glacier area change is similar.

Acknowledgments

This research is supported by the Wyoming Water Development Commission, the Wyoming Water Development Office, the USGS Wyoming Water Research Program and the Wyoming NASA Space Grant Consortium. The authors wish to thank the four anonymous reviewers for their helpful comments.

References and Notes

  1. Clark, M.P.; Serreze, M.C.; McCabe, G.J. Historical effects of El Niño and La Niña events on seasonal evolution of the Montane snowpack in the Columbia and Colorado River basins. Water Resour. Res. 2001, 37, 741–757. [Google Scholar] [CrossRef]
  2. Meier, M.F. Glaciers and water supply. J. Am. Water. Works Assoc. 1969, 81, 8–12. [Google Scholar]
  3. Braithwaite, R.J.; Olsen, O.B. Effects of glaciers on annual run-off, Johan Dahl Land, South Greenland. J. Glaciol. 1988, 24, 200–207. [Google Scholar]
  4. Ferguson, R.I. Sinuosity of supraglacial streams. Geol. Soc. Am. Bull. 1973, 84, 251–255. [Google Scholar] [CrossRef]
  5. Fountain, A.G.; Tangborn, W.V. The effect of glaciers on streamflow variations. Water Resour. Res. 1985, 21, 579–586. [Google Scholar] [CrossRef]
  6. Post, A.; Richardson, D.; Tangborn, W.V.; Rosselot, F.L. Inventory of glaciers in the North Cascades, Washington. USA Geol. Surv. Prof. Pap. 1971, 705-A. [Google Scholar]
  7. Østrem, G. Runoff forecasts for highly glacierized basins. In The Role of Snow and Ice in Hydrology; International Association of Scientific Hydrology: Gentburgge, Belgium, 1973; pp. 1111–1132. [Google Scholar]
  8. Tangborn, W.V. Contribution of Glacier Runoff to the Hydroelectric Power Generation on the Columbia River. In Proceedings of the International Symposium on Computation and Forecasts of the Run-off from Glaciers and Glacierized Areas, Tbilisi, Georgia, 1978; USSR Academy of Sciences, Section of Glaciology: Tbilisi, Georgia, 1980; pp. 140–143. [Google Scholar]
  9. Granshaw, F.D.; Fountain, A.G. Glacier change (1958–1998) in the North Cascades National Park Complex, Washington USA. J. Glaciol. 2006, 52, 251–256. [Google Scholar] [CrossRef]
  10. Meier, M.F. Contribution of small glaciers to global sea level. Science 1984, 226, 1418–1421. [Google Scholar] [CrossRef] [PubMed]
  11. Oerlemans, J.; Anderson, B.; Hubbard, A.; Huybrechts, P.; Jóhannesson, T.; Knap, W.H.; Schmeits, M.; Stroeven, A.P.; van de Wal, R.S.W.; Wallinga, J.; Zuo, Z. Modeling the response of glaciers to climate warming. Climate Dyn. 1998, 14, 267–274. [Google Scholar] [CrossRef]
  12. Meier, M.F.; Post, A.S. Recent variations in mass net budgets of glaciers in western North America. In Variations of Regimen of Existing Glaciers, Proceedings of the Symposium of Obergurgl, Obergurgl, Austria, 1962; Ward, W., Ed.; International Association of Scientific Hydrology: Gentbrugge, Belgium, 1962; pp. 63–77. [Google Scholar]
  13. Krimmel, R.M. Glaciers of the Western United States, satellite image atlas of glaciers of the world. USA Geol. Surv. Prof. Pap. 2002, 1386-J-2, J329–J381. [Google Scholar]
  14. Fountain, A.G.; Hoffman, M.; Jackson, K.; Basagic, H.; Nylen, T.; Percy, D. Digital outlines and topography of the glaciers of the American West; U.S. Geological Survey Open-File Report 2006-1340; U.S. Geological Survey: Reston, VA, USA, 2007. Availabe online: http://pubs.usgs.gov/of/2006/1340/ (accessed on 12 August 2009).
  15. Graf, W.L. The distribution of glaciers in the Rocky Mountains of the United States. J. Glaciol. 1977, 18, 325–328. [Google Scholar]
  16. Pochop, L.O.; Marston, R.A.; Kerr, G.L.; Veryzer, D.J.; Jacobel, R. Glacial icemelt in the Wind River Range, Wyoming. In Watershed Planning and Analysis in Action; Riggins, R.E., Jones, E.B., Singh, R., Rechard, P.A., Eds.; American Society of Civil Engineers: Durango, CO, USA, 1990; pp. 118–124. [Google Scholar]
  17. Meier, M.F. Glaciers of the Gannett Peak-Fremont Peak area, Wyoming. M.S. Thesis, The State University of Iowa, Iowa City, IA, USA, 1951. [Google Scholar]
  18. Meier, M.F. Distribution and variations of glaciers in the United States exclusive of Alaska. In General Assembly of Helsinki: 1960, Snow and Ice Commission, Helsinki, Finland, 25 July–6 August 1960; International Association of Scientific Hydrology: Gentburgge, Belgium, 1961; pp. 420–429. [Google Scholar]
  19. Marston, R.A.; Pochop, L.O.; Kerr, G.L.; Varuska, M.L.; Veryzer, D.J. Recent glacier changes in the Wind River Range, Wyoming. Phys. Geo. 1991, 12, 115–123. [Google Scholar]
  20. Wolken, G.J. Energy balance and spatial distribution of net radiation on Dinwoody Glacier, Wind River Range, Wyoming, USA. M.S. Thesis, Department of Geography and Recreation, University of Wyoming, Laramie, WY, USA, 2000. [Google Scholar]
  21. Fountain, A.G. States with Glaciers. Portland State University. Availabe online: http://glaciers.research.pdx.edu/states.php (accessed on 22 August 2007).
  22. Meier, M.F. Evaluation of ERTS imagery for mapping and detection of changes in snowcover on land and on glaciers. In Symposium on Significant Results Obtained from the Earth Resources Technology Satellite-1, Proceedings of the Symposium on Significant Results Obtained from the Earth Resources Technology Satellite-1, New Carrollton, MD, USA, 1973; Freden, S.C., Mercanti, E.P., Becker, M.A., Eds.; National Aeronautics and Space Administration: Washington DC, USA, 1973; pp. 863–875. [Google Scholar]
  23. Hall, D.K.; Martinec, J. (Eds.) Remote Sensing of Ice and Snow; Champan and Hall: New York, NY, USA, 1985.
  24. Mas, J.F.; Puig, H.; Palacio, J.L.; Sosa-López, A. Modelling deforestation using GIS and artificial neural networks. Environ. Modell. Softw. 2004, 19, 461–471. [Google Scholar] [CrossRef]
  25. Foody, G.M.; Atkinson, P.M. (Eds.) Uncertainty in Remote Sensing and GIS; Wiley: West Sussex, UK, 2002.
  26. Bahr, D.; Meier, M.; Peckman, S. The physical basis of glacier volume area scaling. J. Geophys. Res. 1997, 102, 20,355–20,362. [Google Scholar] [CrossRef]
  27. Hunter, T.; Tootle, G.A.; Piechota, T.C. Oceanic-atmospheric variability and western USA snowfall. Geophys. Res. Lett. 2006, 33, L13706. [Google Scholar] [CrossRef]
  28. Pachuri, R.K.; Reisinger, A. (Eds.) IPCC Fourth Assessment Report: Climate Change 2007; Intergovernmental Panel on Climate Change (IPCC): Geneva, Switzerland, 2007.
  29. Naftz, D.L.; Susong, D.D.; Schuster, P.F.; Cecil, L.D.; Dettinger, M.D.; Michel, R.L.; Kendall, C. Ice core evidence of rapid air temperature increases since 1960 in alpine areas of the Wind River Range, Wyoming, United States. J. Geophys. Res. 2002, 107, 3.1–3.16. [Google Scholar] [CrossRef]
  30. Hall, M.H.P.; Fagre, D.B. Modeled climate-induced glacier change in Glacier National Park, 1850–2100. BioScience 2003, 53, 131–140. [Google Scholar] [CrossRef]

