An Empirical Algorithm for Estimating Agricultural and Riparian Evapotranspiration Using MODIS Enhanced Vegetation Index and Ground Measurements of ET. II. Application to the Lower Colorado River, U.S.


Abstract
:1. Introduction
Need for Wide Area Estimates of Riparian and Agricultural Water Use on Arid Zone Rivers
2. Methods
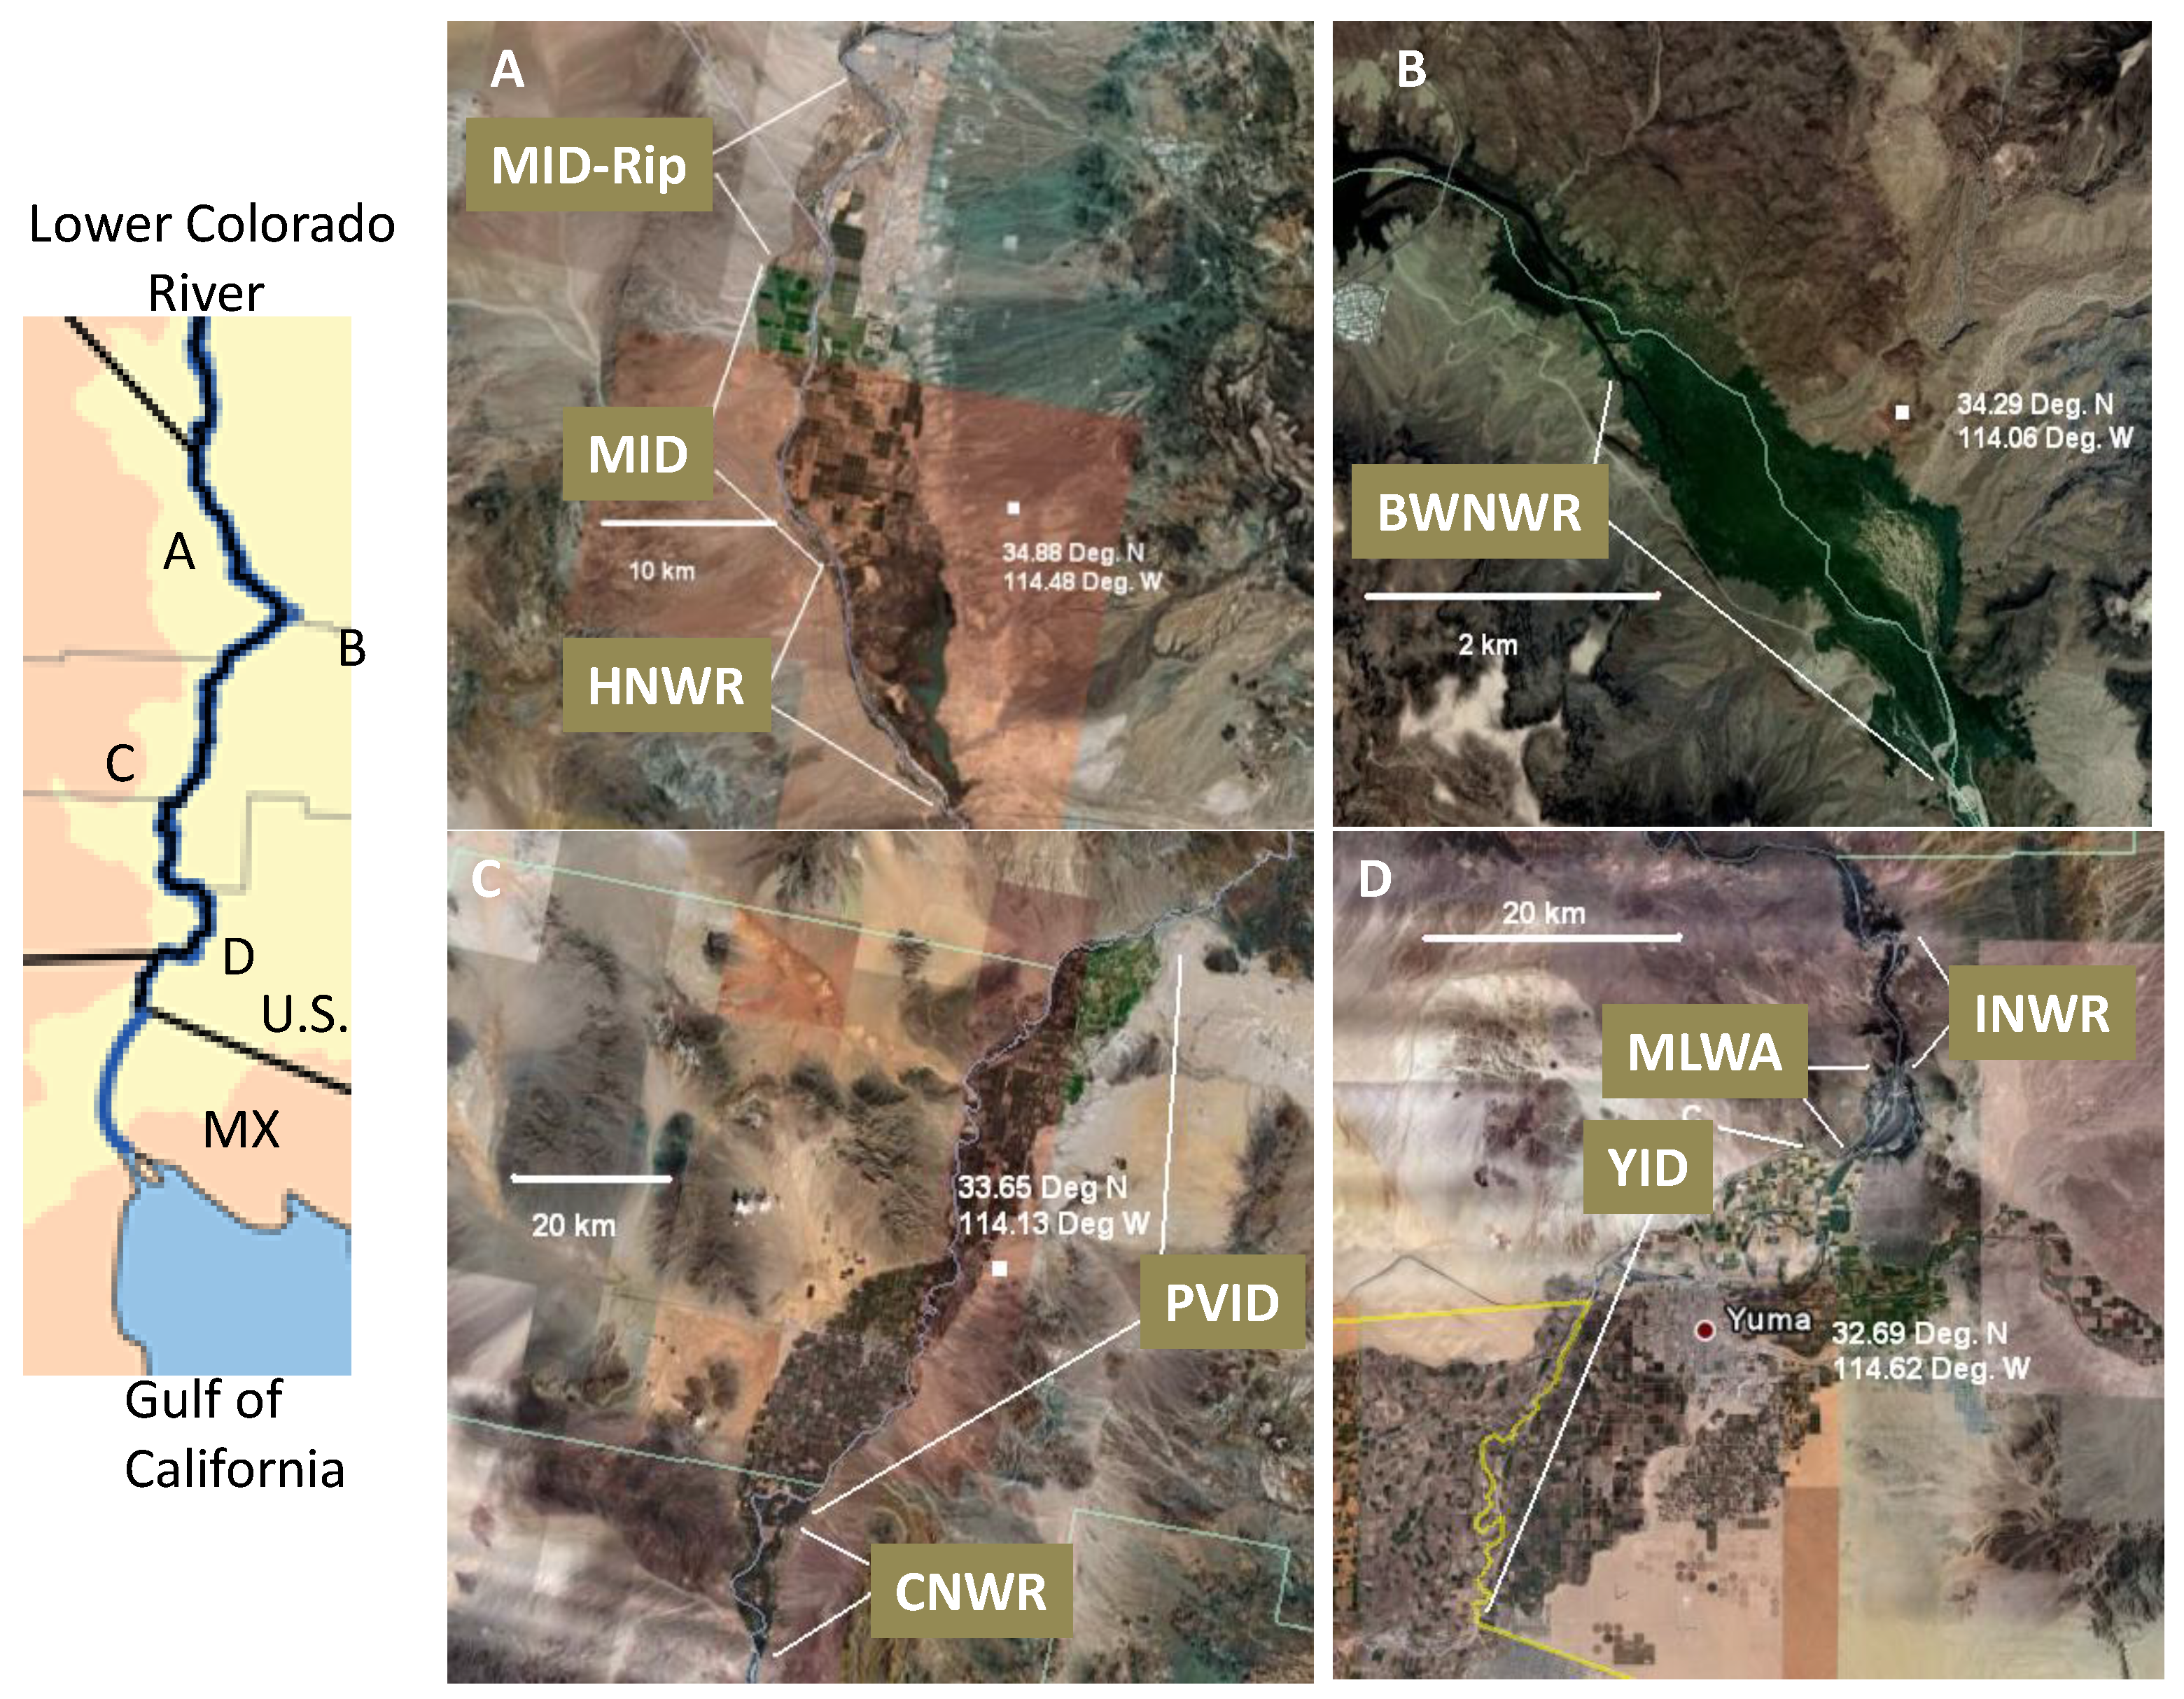
2.1. Site Description
2.2. MODIS Data

2.3. ET Estimation

| Plant Species | Site | Summary of Methodology | References |
|---|---|---|---|
| Saltcedar | Cibola National Wildlife Refuge | Summer sap flow measurements at six sites correlated with MODIS EVI values at each site. | [14,15] |
| Saltcedar | Havasu National Wildlife Refuge | Bowen Ratio flux tower measurements correlated with MODIS EVI values at 16-day intervals over two growing seasons | [13,20] |
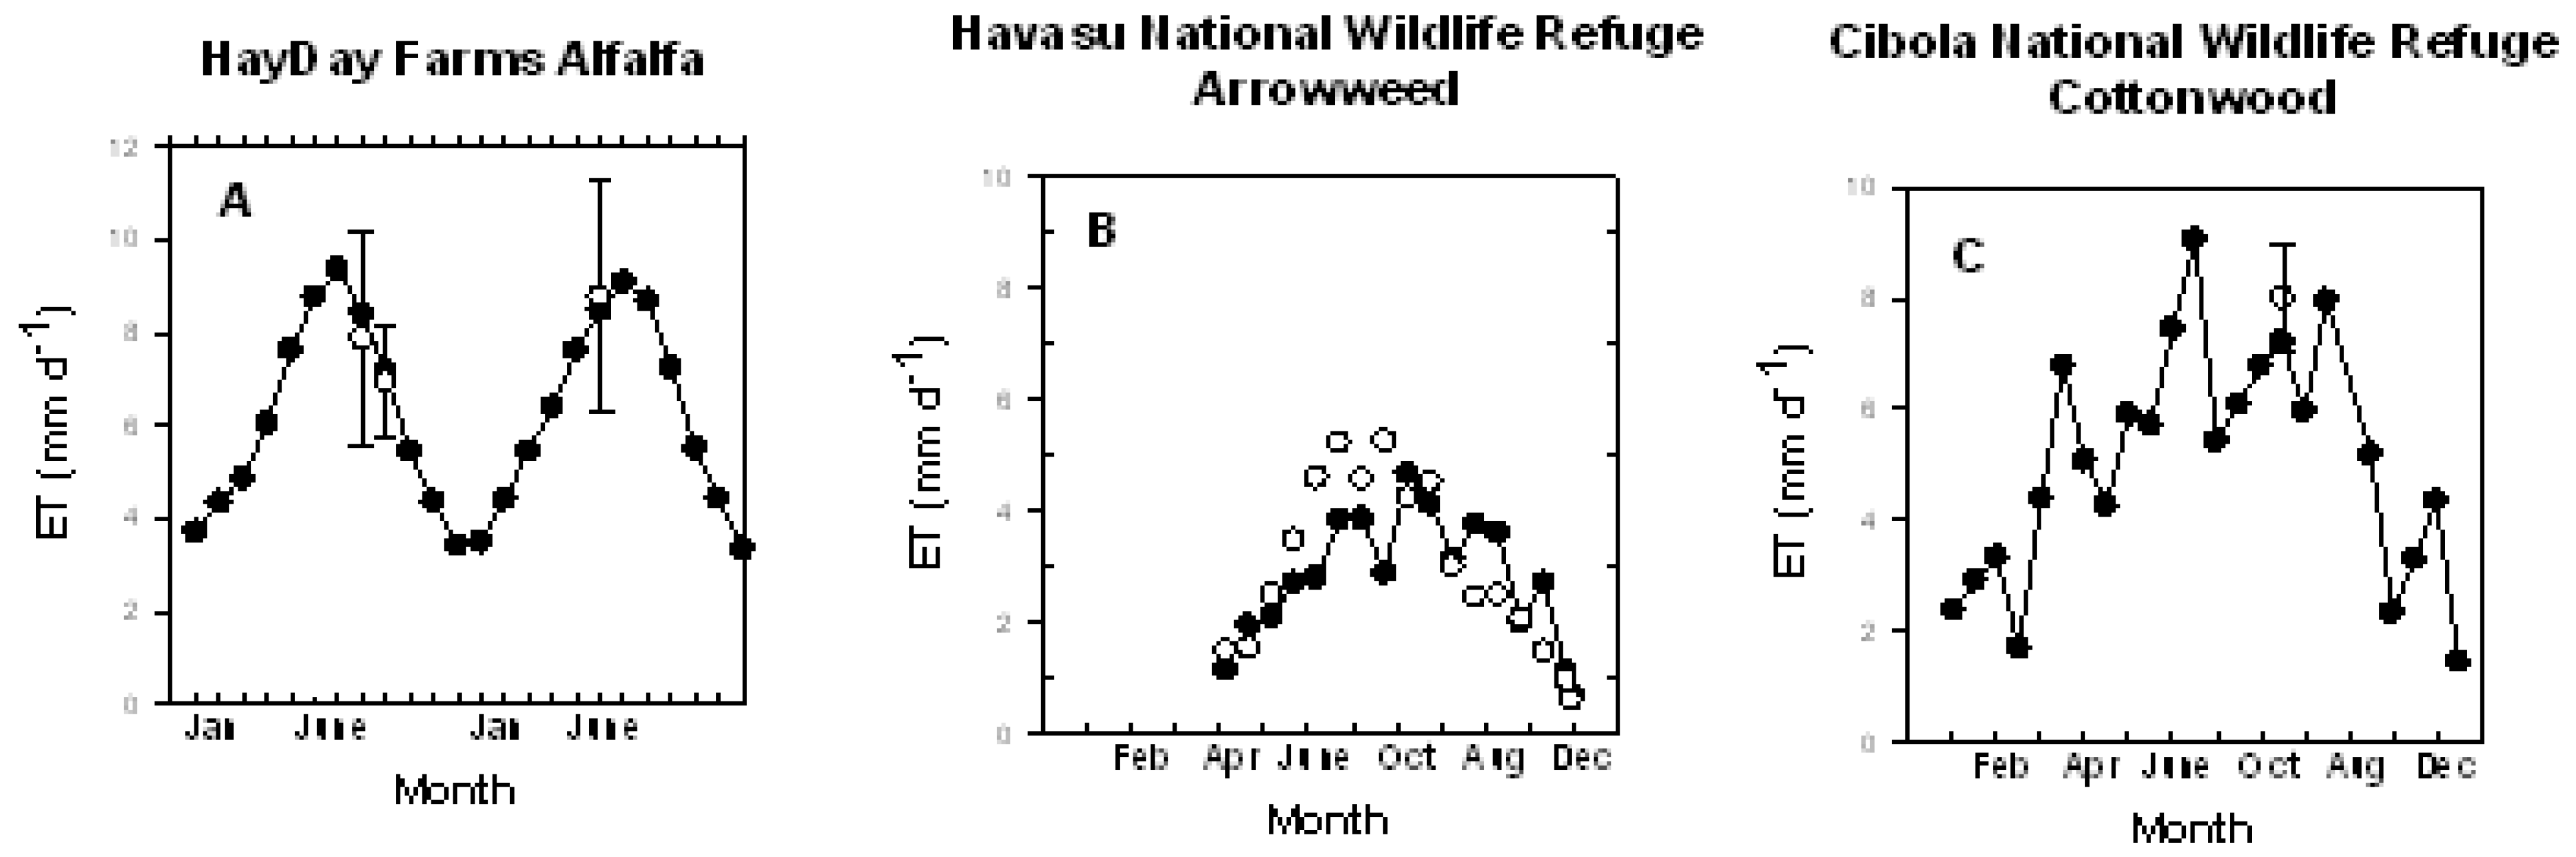
| Arrowweed | Havasu National Wildlife Refuge | Bowen Ratio flux tower measurements correlated with MODIS EVI values at 16-day intervals over one growing season | [13,20] |
| Cottonwood | Palo Verde Irrigation District | Sap flow measurements correlated with MODIS EVI values at two sites in a cottonwood restoration plot | [33] |
| Alfalfa | Palo Verde Irrigation District | Soil moisture depletion measured by neutron hydroprobe at five points over three irrigation cycles in a commercial alfalfa farm correlated with MODIS EVI values | [15] |
2.4. Other Data Sources and Calculations
3. Results and Discussion
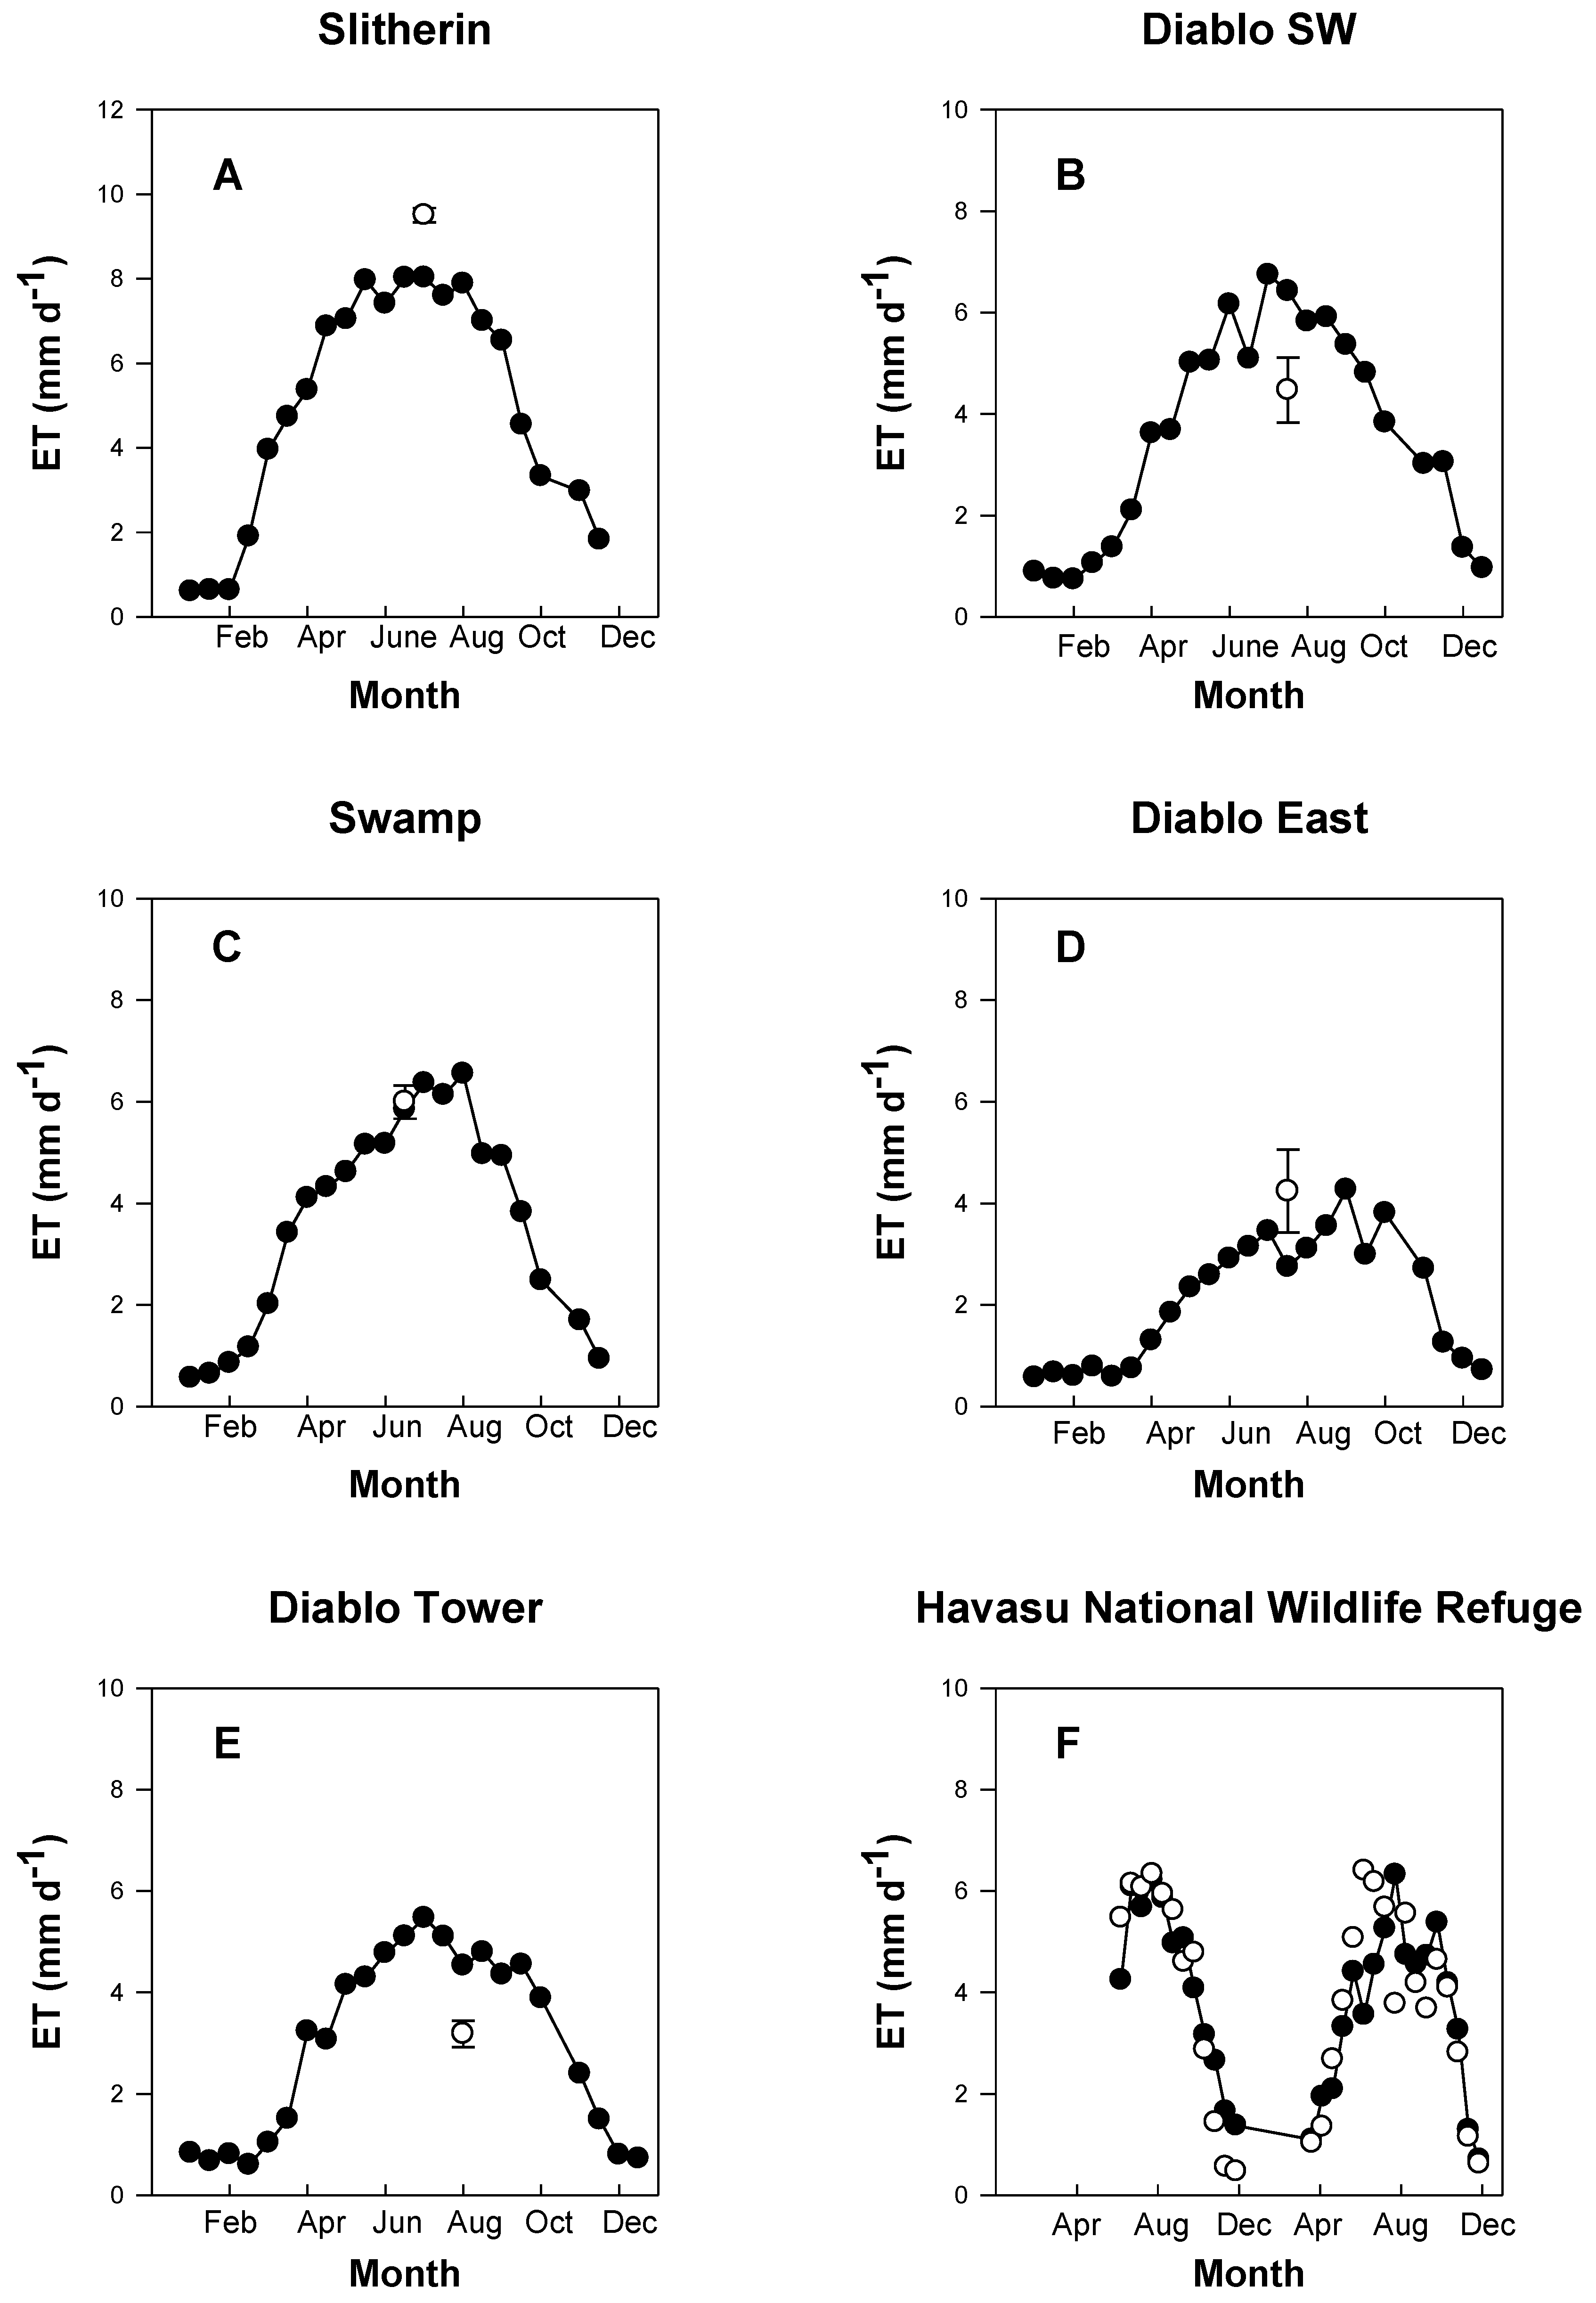
3.1. Relationship Between Ground ET Estimates and MODIS ET Estimates
3.2. Agricultural ET Estimates
| Year | MID ETo | PVID ETo | YID ETo | HayDay Alfalfa | MID Crops | PVID Crops | YID Crops |
|---|---|---|---|---|---|---|---|
| 2000 | 2,177 | 2,217 | 2,118 | 2,495 | 1,238 | 1,842 | 1,242 |
| 2001 | 2,062 | 2,062 | 1,920 | 2,234 | 1,172 | 1,888 | 1,327 |
| 2002 | 2,060 | 2,060 | 2,045 | 1,713 | 1,187 | 2,024 | 1,327 |
| 2003 | 1,885 | 1,877 | 1,941 | 1,580 | 1,317 | 1,803 | 1,333 |
| 2004 | 1,930 | 1,930 | 1,887 | 1,588 | 1,208 | 1,844 | 1,246 |
| 2005 | 2,019 | 1,951 | 1,854 | 6,70* | 1,347 | 1,622 | 1,286 |
| 2006 | 2,019 | 2,019 | 2,035 | 2,593 | 1,479 | 1,566 | 1,329 |
| 2007 | 2,108 | 2,108 | 1,999 | 2,612 | 1,373 | 1,886 | 1,300 |
| 2008 | 2,096 | 2,096 | 2,096 | 2,353 | 1,484 | 1,962 | 1,316 |
| Mean (SE) | 2,040 (30) | 2,036 (35) | 1,988 (31) | 2,146 (159) | 1,312(40) | 1,846(29) | 1,301(12) |
3.3. Riparian ET Estimates
| Year | MID-Rip | HNWR | BWNWR | CNWR | INWR | MLWA | CRG |
|---|---|---|---|---|---|---|---|
| 2000 | 3,24 | 1,036 | 1,447 | 1,005 | 1,305 | 1,083 | 1,048 |
| 2001 | 4,37 | 1,019 | 1,172 | 961 | 1,211 | 969 | 953 |
| 2002 | 391 | 1,005 | 1,197 | 834 | 1,120 | 902 | 912 |
| 2003 | 448 | 1,004 | 1,056 | 876 | 1,141 | 901 | 941 |
| 2004 | 415 | 962 | 945 | 833 | 1,042 | 806 | 840 |
| 2005 | 619 | 963 | 943 | 904 | 1,060 | 713 | 778 |
| 2006 | 458 | 951 | 1,053 | 699 | 1,144 | 848 | 632 |
| 2007 | 446 | 1,002 | 1,120 | 608 | 1,129 | 801 | 542 |
| 2008 | 483 | 1,016 | 1,173 | 710 | 1,242 | 857 | 686 |
| Mean(SE) | 447(26) | 741(16) | 1,123(51) | 825(43) | 1,155(28) | 875(36) | 815(56) |
3.4. Comparison of MODIS ET Estimates With Crop Coefficient-Derived Values
3.5. Sources of Error in ET Estimates
4. Conclusions
Disclaimer
References and Notes
- Poff, N.; Allan, J.; Bain, M.; Karr, J.; Prestegaard, K.; Richter, B.; Sparks, R.; Stromberg, J. The natural flow regime. Biosci. 1997, 47, 769–784. [Google Scholar] [CrossRef]
- Pataki, D.; Bush, S.; Gardner, P.; Solomon, D.; Ehleringer, J. Ecohydrology in a Colorado River riparian forest: Implications for the decline of Populus fremontii. Ecolog. Appl. 2005, 15, 1009–1018. [Google Scholar] [CrossRef]
- United States Bureau of Reclamation. Description and Assessment of Operations, Maintenance, and Sensitive Species of the Lower Colorado River: Biological Assessment; United States Bureau of Reclamation: Boulder City, NV, USA, 1997.
- Lower Colorado River Multi-Species Conservation Program. Lower Colorado River Multi-Species Conservation Program, Volume III: Biological Assessment; J & S, Inc.: Sacramento, CA, USA, 2004.
- Gaskin, J.; Schaal., B. Hybrid Tamarix widespread in US invasion and undetected in native Asian range. Proc. Nat. Acad. Sci. USA 2002, 99, 11256–11259. [Google Scholar] [CrossRef] [PubMed]
- Glenn, E.; Nagler, P. Comparative ecophysiology of Tamarix ramosissima and native trees in western US riparian zones. J. Arid Envir. 2005, 61, 419–446. [Google Scholar] [CrossRef]
- Stromberg, J.; Chew, M.; Nagler, P.L.; Glenn, E.P. Change perceptions of change: The role of scientists in Tamarisk and river management. Restor. Ecol. 2009, 17, 177–1861125. [Google Scholar] [CrossRef]
- Di Tomaso, J. Impact, biology, and ecology of saltcedar (Tamarix spp.) in the southwestern United States. Weed Technol. 1998, 12, 326–336. [Google Scholar]
- Zavaleta, E. The economic value of controlling an invasive shrub. Ambio 2000, 29, 462–467. [Google Scholar] [CrossRef]
- United States 109th Congress. HR 2720: Salt Cedar and Russian Olive Control Demonstration Act; United State Congress: Washington, DC, USA, 2009; p. 1328. [Google Scholar]
- Devitt, D.; Sala, A.; Smith, S.; Cleverly, J.; Shaulis, L.; Hammett, R. Bowen ratio estimates of evapotranspiration for Tamarix ramosissima stands on the Virgin River in southern Nevada. Water Resour. Res. 1998, 34, 2407–2414. [Google Scholar]
- Cleverly, J.; Dahm, C.; Thibault, J.; McDonnell, D.; Coonrod, J. Riparian ecohydrology: regulation of water flux from the ground to the atmosphere in the Middle Rio Grande, New Mexico. Hydrol. Process. 2006, 20, 3207–3225. [Google Scholar] [CrossRef]
- Westenberg, C.; Harper, D.; DeMeo, G. Evapotranspiration by Phreatophytes Along the Lower Colorado River at Havasu National Wildlife Refuge, Arizona; United States Geological Survey Scientific Investigations Report, 2006–5043; Henderson, NV, USA, 6 March 2006.
- Nagler, P.L.; Morino, K.; Didan, K.; Osterberg, J.; Hultine, K.; Glenn, E. Wide-area estimates of saltcedar (Tamarix spp.) evapotranspiration on the lower Colorado River measured by heat balance and remote sensing methods. Ecohydrology 2009, 2, 18–33. [Google Scholar]
- Nagler, P.L.; Murray, R.S.; Morino, K.; Osterberg, J.; Glenn, E.P. Scaling riparian and agricultural evapotranspiration in river irrigation districts based on potential evapotranspiration, ground measurements of actual evapotranspiration, and the Enhanced Vegetation Index from MODIS. I. Description of method. Remote Sens. 2009, in press. [Google Scholar] [CrossRef]
- Sala, A.; Smith, S.; Devitt, D. Water use by Tamarix ramosissima and associated phreatophytes in a Mojave Desert floodplain. Ecol. Appl. 1996, 6, 888–898. [Google Scholar] [CrossRef]
- Owens, M.; Moore, G. Saltcedar water use: Realistic and unrealistic expectations. Rangeland Ecol. Manag. 2007, 60, 553–557. [Google Scholar] [CrossRef]
- Nagler, P.L.; Cleverly, J.; Glenn, E.; Pampkin, D.; Huete, A.; Wan, Z.M. Predicting riparian evapotranspiration from MODIS vegetation indices and meteorological data. Remote Sens. Envir. 2005, 94, 17–30. [Google Scholar] [CrossRef]
- Nagler, P.; Glenn, E.; Didan, K.; Osterberg, J.; Jordan, F.; Cunningham, J. Wide-area estimates of stand structure and water use of Tamarix spp. on the Lower Colorado River: Implications for restoration and water management projects. Restor. Ecol. 2009, 16, 136–145. [Google Scholar]
- Nagler, P.; Scott, R.; Westenburg, C.; Cleverly, J.; Glenn, E.; Huete, A. Evapotranspiration on western U.S. rivers estimated using the Enhanced Vegetation Index from MODIS and data from eddy covariance and Bowen ratio flux towers. Remote Sens. Environ. 2005, 97, 337–351. [Google Scholar]
- Tamarisk Coalition. Independent Peer Review of Tamarisk and Russian Olive Evapotranspiration Colorado River Basin. Available online: http://www.tamariskcoalition.org/tamariskcoalition/PDF/ET%20Report%20FINAL%204-16-09%20(2).pdf (accessed on November 11, 2009).
- Wheeler, K.G.; Pitt, J.; Magee, T.M.; Luecke, D. Alternatives for restoration of the Colorado River Delta. Nat. Resour. J. 2007, 47, 917–967. [Google Scholar]
- Sogge, M.; Sferra, S.; Paxton, E. Tamarix as habitat for birds: Implications for riparian restoration in the Southwestern United States. Restor. Ecol. 2008, 16, 146–154. [Google Scholar] [CrossRef]
- van Riper, C., III; Paxton, K.; O’Brien, C.; Shafroth, P. Rethinking avian response to Tamarix on the Lower Colorado River: A threshold hypothesis. Restor. Ecol. 2008, 16, 155–167. [Google Scholar] [CrossRef]
- Christensen, N.S.; Lettenmaier, D.P. A multimodel ensemble approach to assessment of climate change impacts on the hydrology and water resources of the Colorado River Basin. Hydrol. Earth Syst. Sci. 2007, 11, 1417–1434. [Google Scholar] [CrossRef]
- United States Bureau of Reclamation. Lower Colorado River Accounting System. Evapotranspiration and Evaporation Calculations, Calendar Year 2007; United States Bureau of Reclamation: Boulder City, NV, USA, 2008.
- Huete, A.; Didan, K.; Miura, T.; Rodriquez, E.; Gao, X.; Ferreira, L. Overview of the radiometric and biophysical performance of the MODIS vegetation indices. Remote Sens. Environ. 2002, 83, 195–213. [Google Scholar] [CrossRef]
- Nagler, P.L.; Glenn, E.P.; Kim, H.; Emmerich, W.; Scott, R.L.; Huxmam, T.E.; Huete, A.R. Relationship between evapotranspiration and precipitation pulses in a semiarid rangeland estimated by moisture flux towers and MODIS vegetation indices. J. Arid Environ. 2007, 70, 443–462. [Google Scholar] [CrossRef]
- Oak Ridge National Laboratory Distributed Active Archive Center (ORNL DAAC). MODIS Subsetted Land Products, Collection 5; ORNL DAAC: Oak Ridge, TN, USA, 2009. Available online: http://www.daac.ornl/MODIS (accessed on November 11, 2009).
- AZMET. The Arizona Meteorological Network; University of Arizona: Tucson, AZ, USA, 2009. Available online: http://cals.arizona.edu/azmet/ (accessed on November 11, 2009).
- Brouwer, C.; Heibloem, M. Irrigation. In Water Management Training Manual No. 3; FAO: Rome, Italy, 1986. [Google Scholar]
- Allen, R.; Pereira, L.; Rais, D.; Smith, M. Crop Evapotranspiration – Guidelines for Computing Crop Water Requirements – FAO Irrigation and Drainage Paper 56; Food and Agriculture Organization of the United Nations: Rome, Italy, 1998. [Google Scholar]
- Nagler, P.; Jetton, A.; Fleming, J.; Didan, K.; Glenn, E.; Erker, J.; Morino, K.; Milliken, J.; Gloss, S. Evapotranspiration in a cottonwood (Populus fremontii) restoration plantation estimated by sap flow and remote sensing methods. Agr. Forest Meteorol. 2007, 144, 95–110. [Google Scholar]
- Jensen, M.E. Coefficients for Vegetative Evapotranspiration and Open Water Evaporation for the Lower Colorado River Accounting System; United States Bureau of Reclamation; Boulder Canyon Operations Office: Boulder City, NV, USA, 1998. [Google Scholar]
- Hunsaker, D.J.; Pinter, P.J.; Cai, H. Alfalfa basal crop coefficients for FAO-56 procedures in the desert regions of the southwestern US. Trans. ASAE 2002, 45, 1799–1815. [Google Scholar] [CrossRef]
- Choudhury, B.J.; Ahmed, N.U.; Idso, S.B.; Reginato, R.J.; Daughtry, C.S.T. Relations between evaporation coefficients and vegetation indexes studied by model simulations. Remote Sens. Environ. 1994, 50, 1–17. [Google Scholar] [CrossRef]
- Glenn, E.; Huete, A.; Nagler, P.L.; Nelson, S.G. Relationship between remotely-sensed vegetation indices, canopy attributes and plant physiological processes: What vegetation indices can and cannot tell us about the landscape. Sensors 2008, 8, 2136–2160. [Google Scholar] [CrossRef]
- Glenn, E.; Huete, A.; Nagler, P.; Hirschboek, K.; Brown, P. Integrating remote sensing and ground methods to estimate evapotranspiration. Crit. Rev. Plant Sci. 2007, 26, 139–168. [Google Scholar] [CrossRef]
- Kalma, J.D.; McVicar, T.R.; McCabe, M.F. Estimating land surface evaporation: A review of methods using remotely sensed surface temperature data. Surv. Geophys. 2008, 29, 421–469. [Google Scholar] [CrossRef]
- Gonzalez-Dugo, M.P.; Neale, C.M.U.; Mateos, L.; Kustas, W.P.; Anderson, M.C.; Li, F. A comparison of operational remote-sensing based models for estimating crop evapotranspiration. Agr. Forest Meteor. 2009, 49, 2082–2097. [Google Scholar] [CrossRef]
© 2009 by the authors; licensee Molecular Diversity Preservation International, Basel, Switzerland. This article is an open-access article distributed under the terms and conditions of the Creative Commons Attribution license (http://creativecommons.org/licenses/by/3.0/).
Share and Cite
Murray, R.S.; Nagler, P.L.; Morino, K.; Glenn, E.P. An Empirical Algorithm for Estimating Agricultural and Riparian Evapotranspiration Using MODIS Enhanced Vegetation Index and Ground Measurements of ET. II. Application to the Lower Colorado River, U.S. Remote Sens. 2009, 1, 1125-1138. https://doi.org/10.3390/rs1041125
Murray RS, Nagler PL, Morino K, Glenn EP. An Empirical Algorithm for Estimating Agricultural and Riparian Evapotranspiration Using MODIS Enhanced Vegetation Index and Ground Measurements of ET. II. Application to the Lower Colorado River, U.S. Remote Sensing. 2009; 1(4):1125-1138. https://doi.org/10.3390/rs1041125
Chicago/Turabian StyleMurray, R. Scott, Pamela L. Nagler, Kiyomi Morino, and Edward P. Glenn. 2009. "An Empirical Algorithm for Estimating Agricultural and Riparian Evapotranspiration Using MODIS Enhanced Vegetation Index and Ground Measurements of ET. II. Application to the Lower Colorado River, U.S." Remote Sensing 1, no. 4: 1125-1138. https://doi.org/10.3390/rs1041125
APA StyleMurray, R. S., Nagler, P. L., Morino, K., & Glenn, E. P. (2009). An Empirical Algorithm for Estimating Agricultural and Riparian Evapotranspiration Using MODIS Enhanced Vegetation Index and Ground Measurements of ET. II. Application to the Lower Colorado River, U.S. Remote Sensing, 1(4), 1125-1138. https://doi.org/10.3390/rs1041125