1. Introduction and Study Area
The Zagros fold-thrust belt was formed during several episodes of shortening related to the closure of the Tethys Ocean and subsequent collision of the Arabian and Eurasian plates in the late Cretaceous to recent times [
1]. This fold-thrust belt is truncated and disturbed by several transverse strike-slip fault zones such as the Izeh, Kazerun, Karebas, Sarvestan and Sabzpushan fault zones [
2,
3,
4,
5] with approximately N160°–180° in trend. This seismically active fold-thrust belt is divided into the Thrust Zone (High Zagros), Simply Folded Belt (SFB) and Coastal Plain [
6,
7,
8,
9,
10]. In the upper Cretaceous, the NW–SE trending Mountain Front Fault has divided the SFB into a major foreland basin to the southwest known as the Dezful Embayment and a piggyback basin to the northeast [
11]. From the east to west of this belt respectively, the SFB divided into the Fars Arc, Izeh Zone and Dezful Embayment by the Kazerun and Izeh fault zones (
Figure 1).
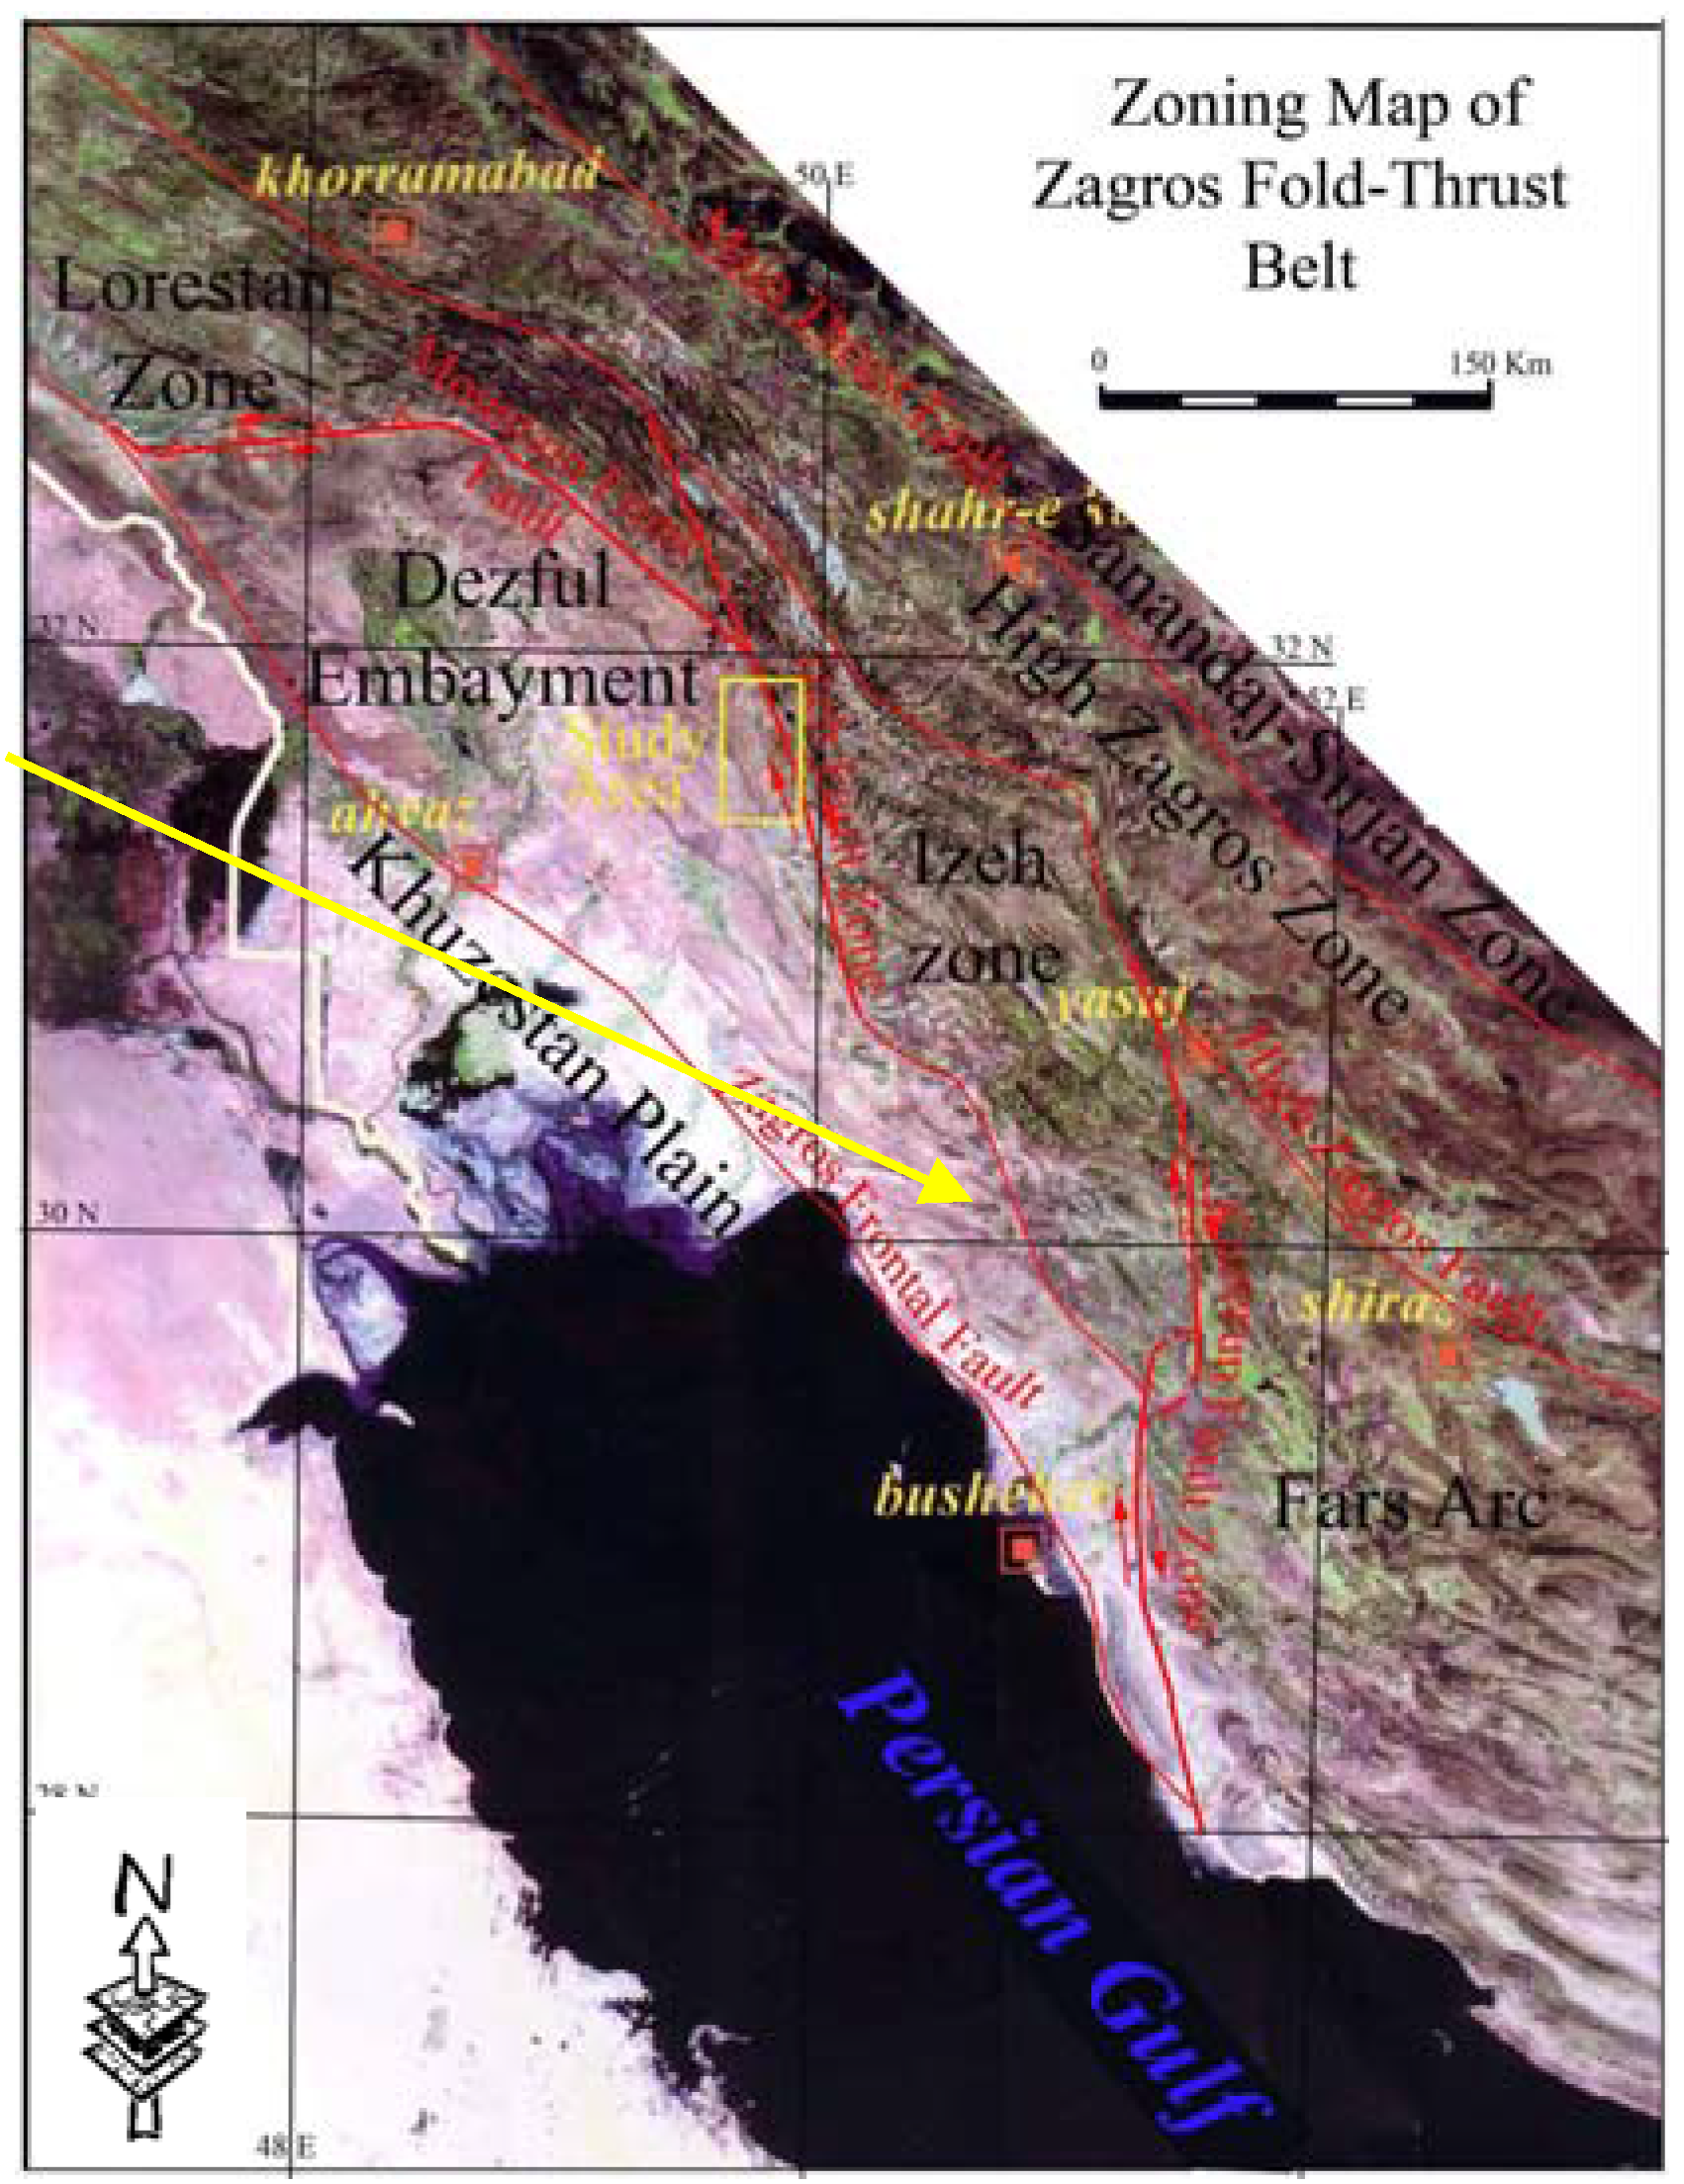
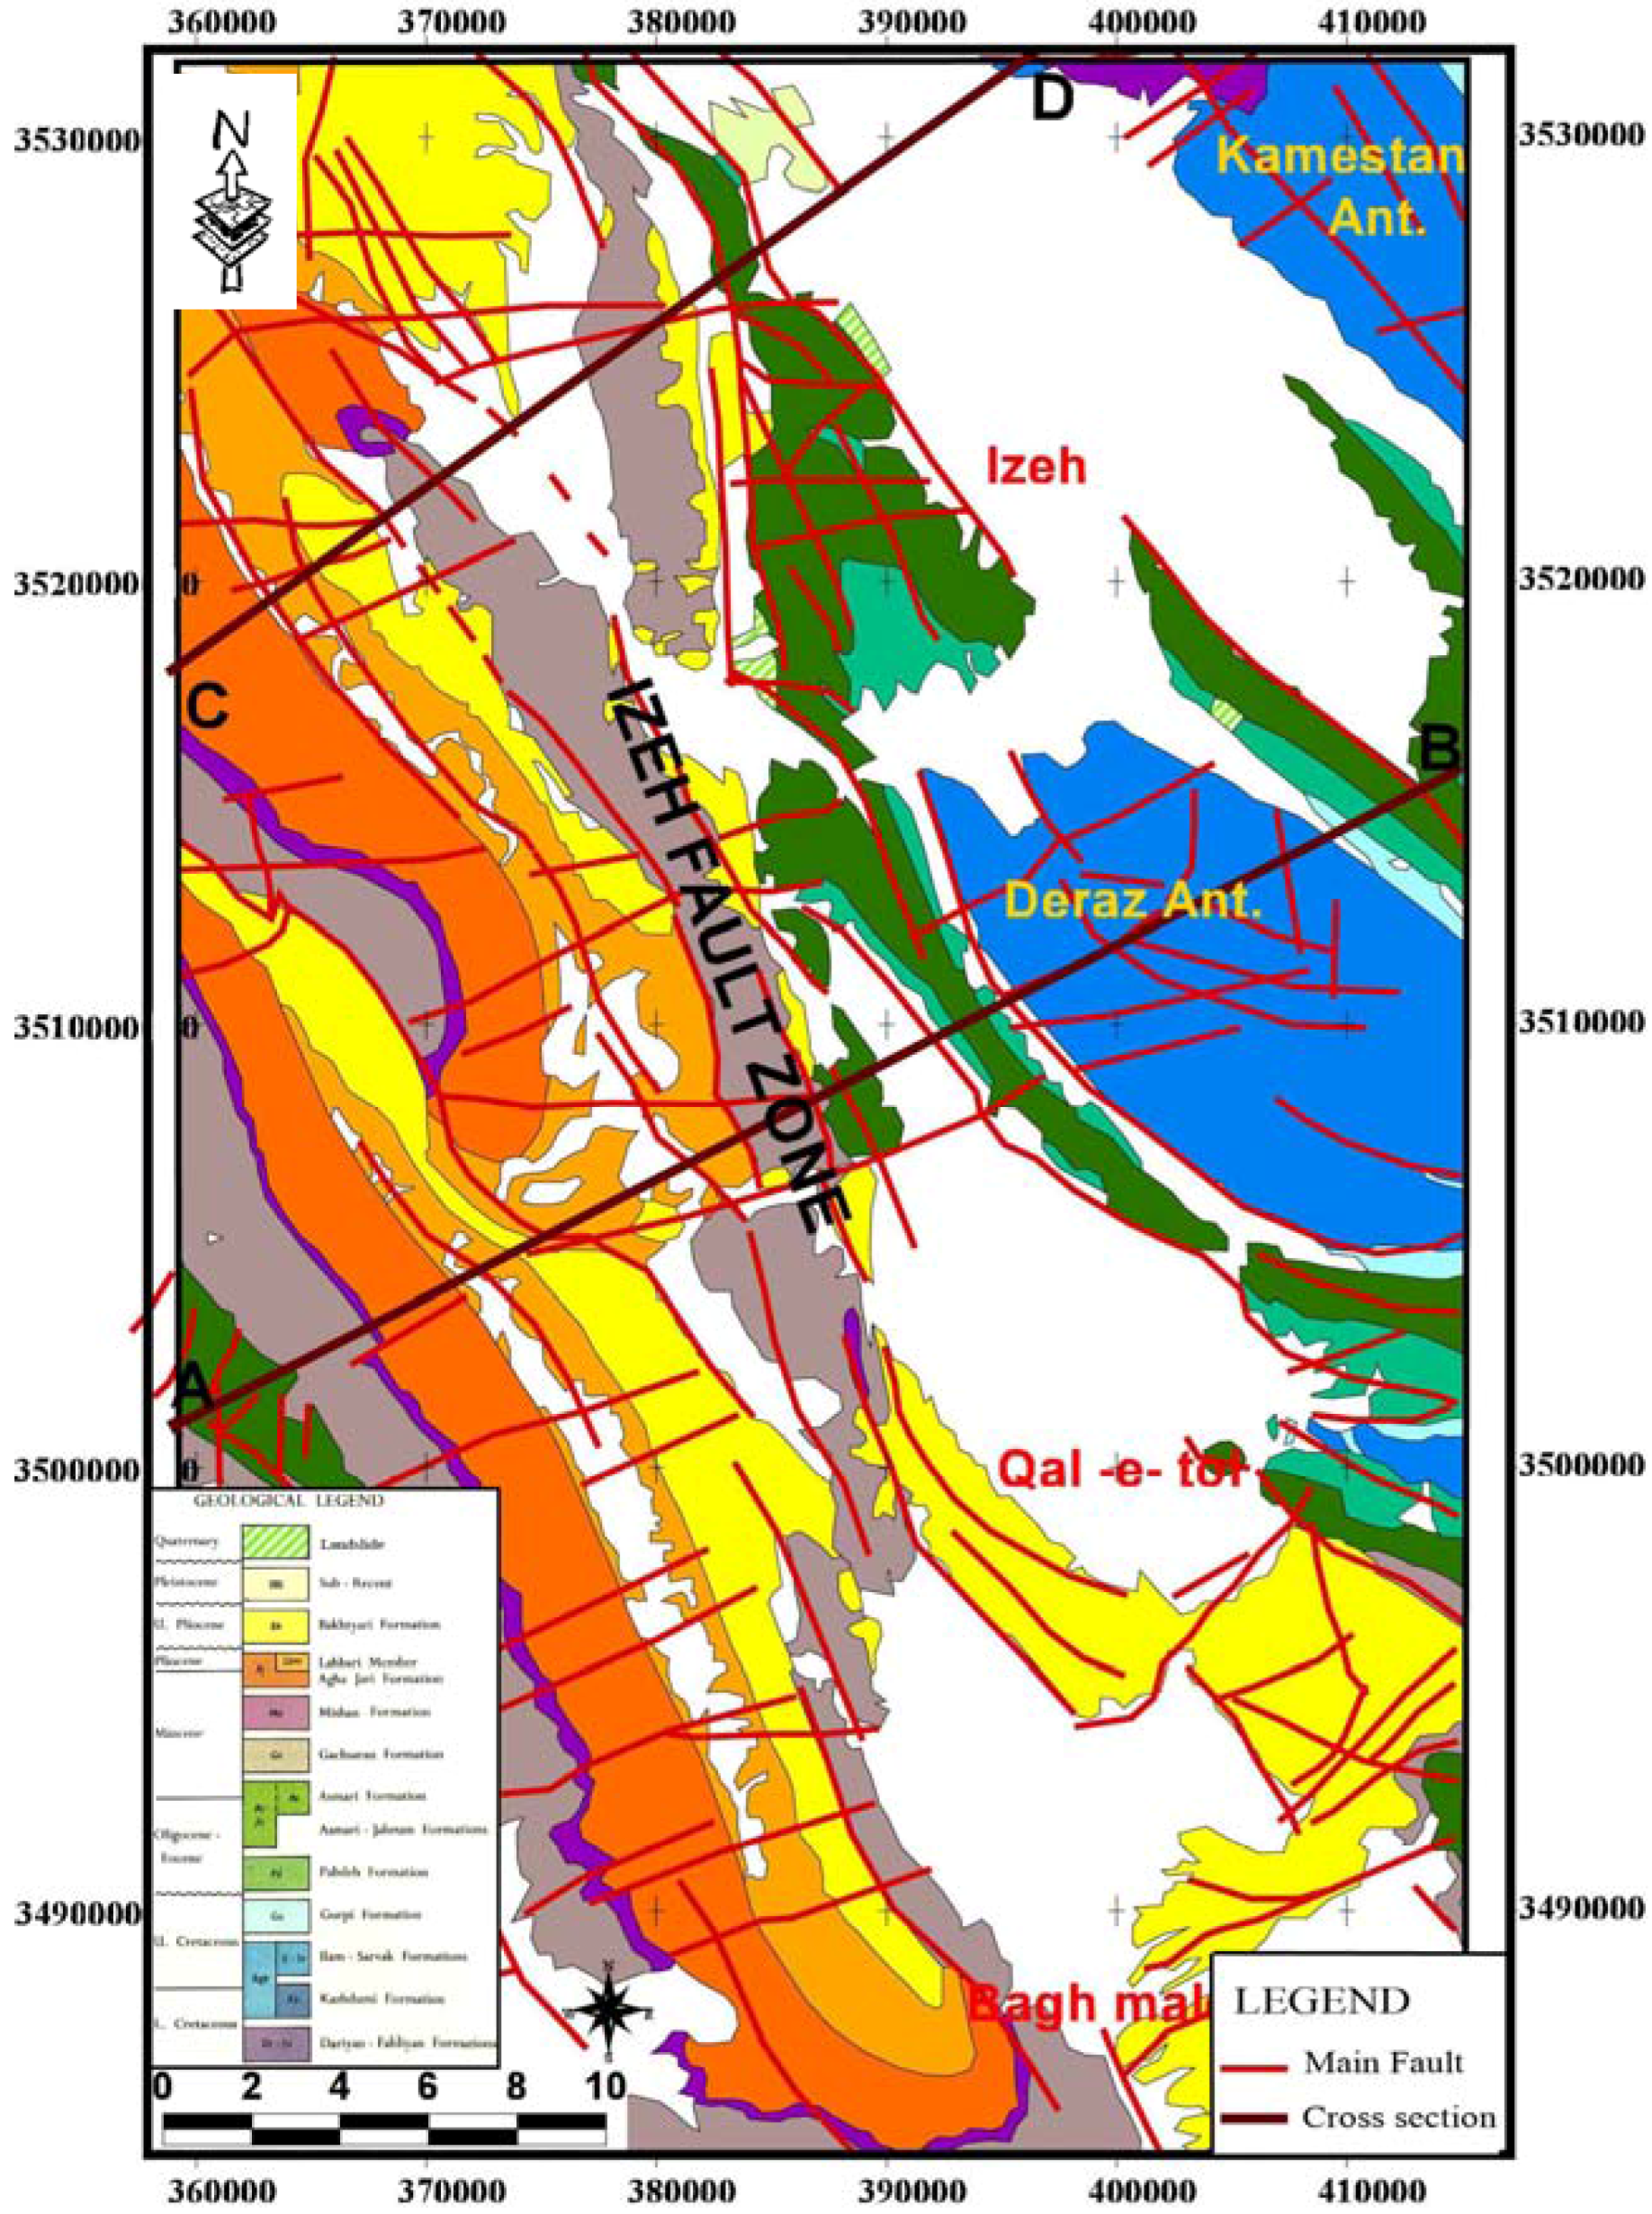
Figure 1.
Structural zones of the Zagros fold-thrust belt and location of the study area together with a structural map of part of the Izeh fault zone.
Figure 1.
Structural zones of the Zagros fold-thrust belt and location of the study area together with a structural map of part of the Izeh fault zone.
The Dezful Embayment appears to be a discrete structural unit with boundaries that define the Mountain Front Thrust Fault from northwest and the Kazerun-Borazjan with the Izeh transverse faults to the east-southeast. This also faces the Zagros fore deep (Frontal) fault to the southwest [
11] (
Figure 1). The Izeh and Kazerun fault zones which are formed due to the eastern boundary of the Dezful Embayment are controlled by the sedimentation and subsidence of the embayment. Along these transverse fault zones some evidences of dextral shear deformation structures such as dextral bending of fold axes, up landing of synclines, strike slip duplexes, transtensional pull-apart basins and occurring of En-echelon folds have been exhibited.
The Dezful Embayment primarily corresponds to a morpho-tectonic region with respect to the Izeh zone [
11]. Therefore, this embayment shows a sharp topographic difference with the Izeh zone across the Mountain front fault (MFF) and the Izeh fault. The difference in elevation of the same formations (with reference to the top of the Asmari Formation) between the Dezful Embayment and the Izeh zone is calculated on the basis of balanced cross sections. The magnitude of this difference is estimated at approximately 4–5 km or more than 5 km [
12,
13]. These authors calculated the height difference and stated that it is the result of the Dezful Embayment subsidence and uplifting of Izeh zone along the the Izeh fault zone (due to existence of a reverse component along this fault zone).
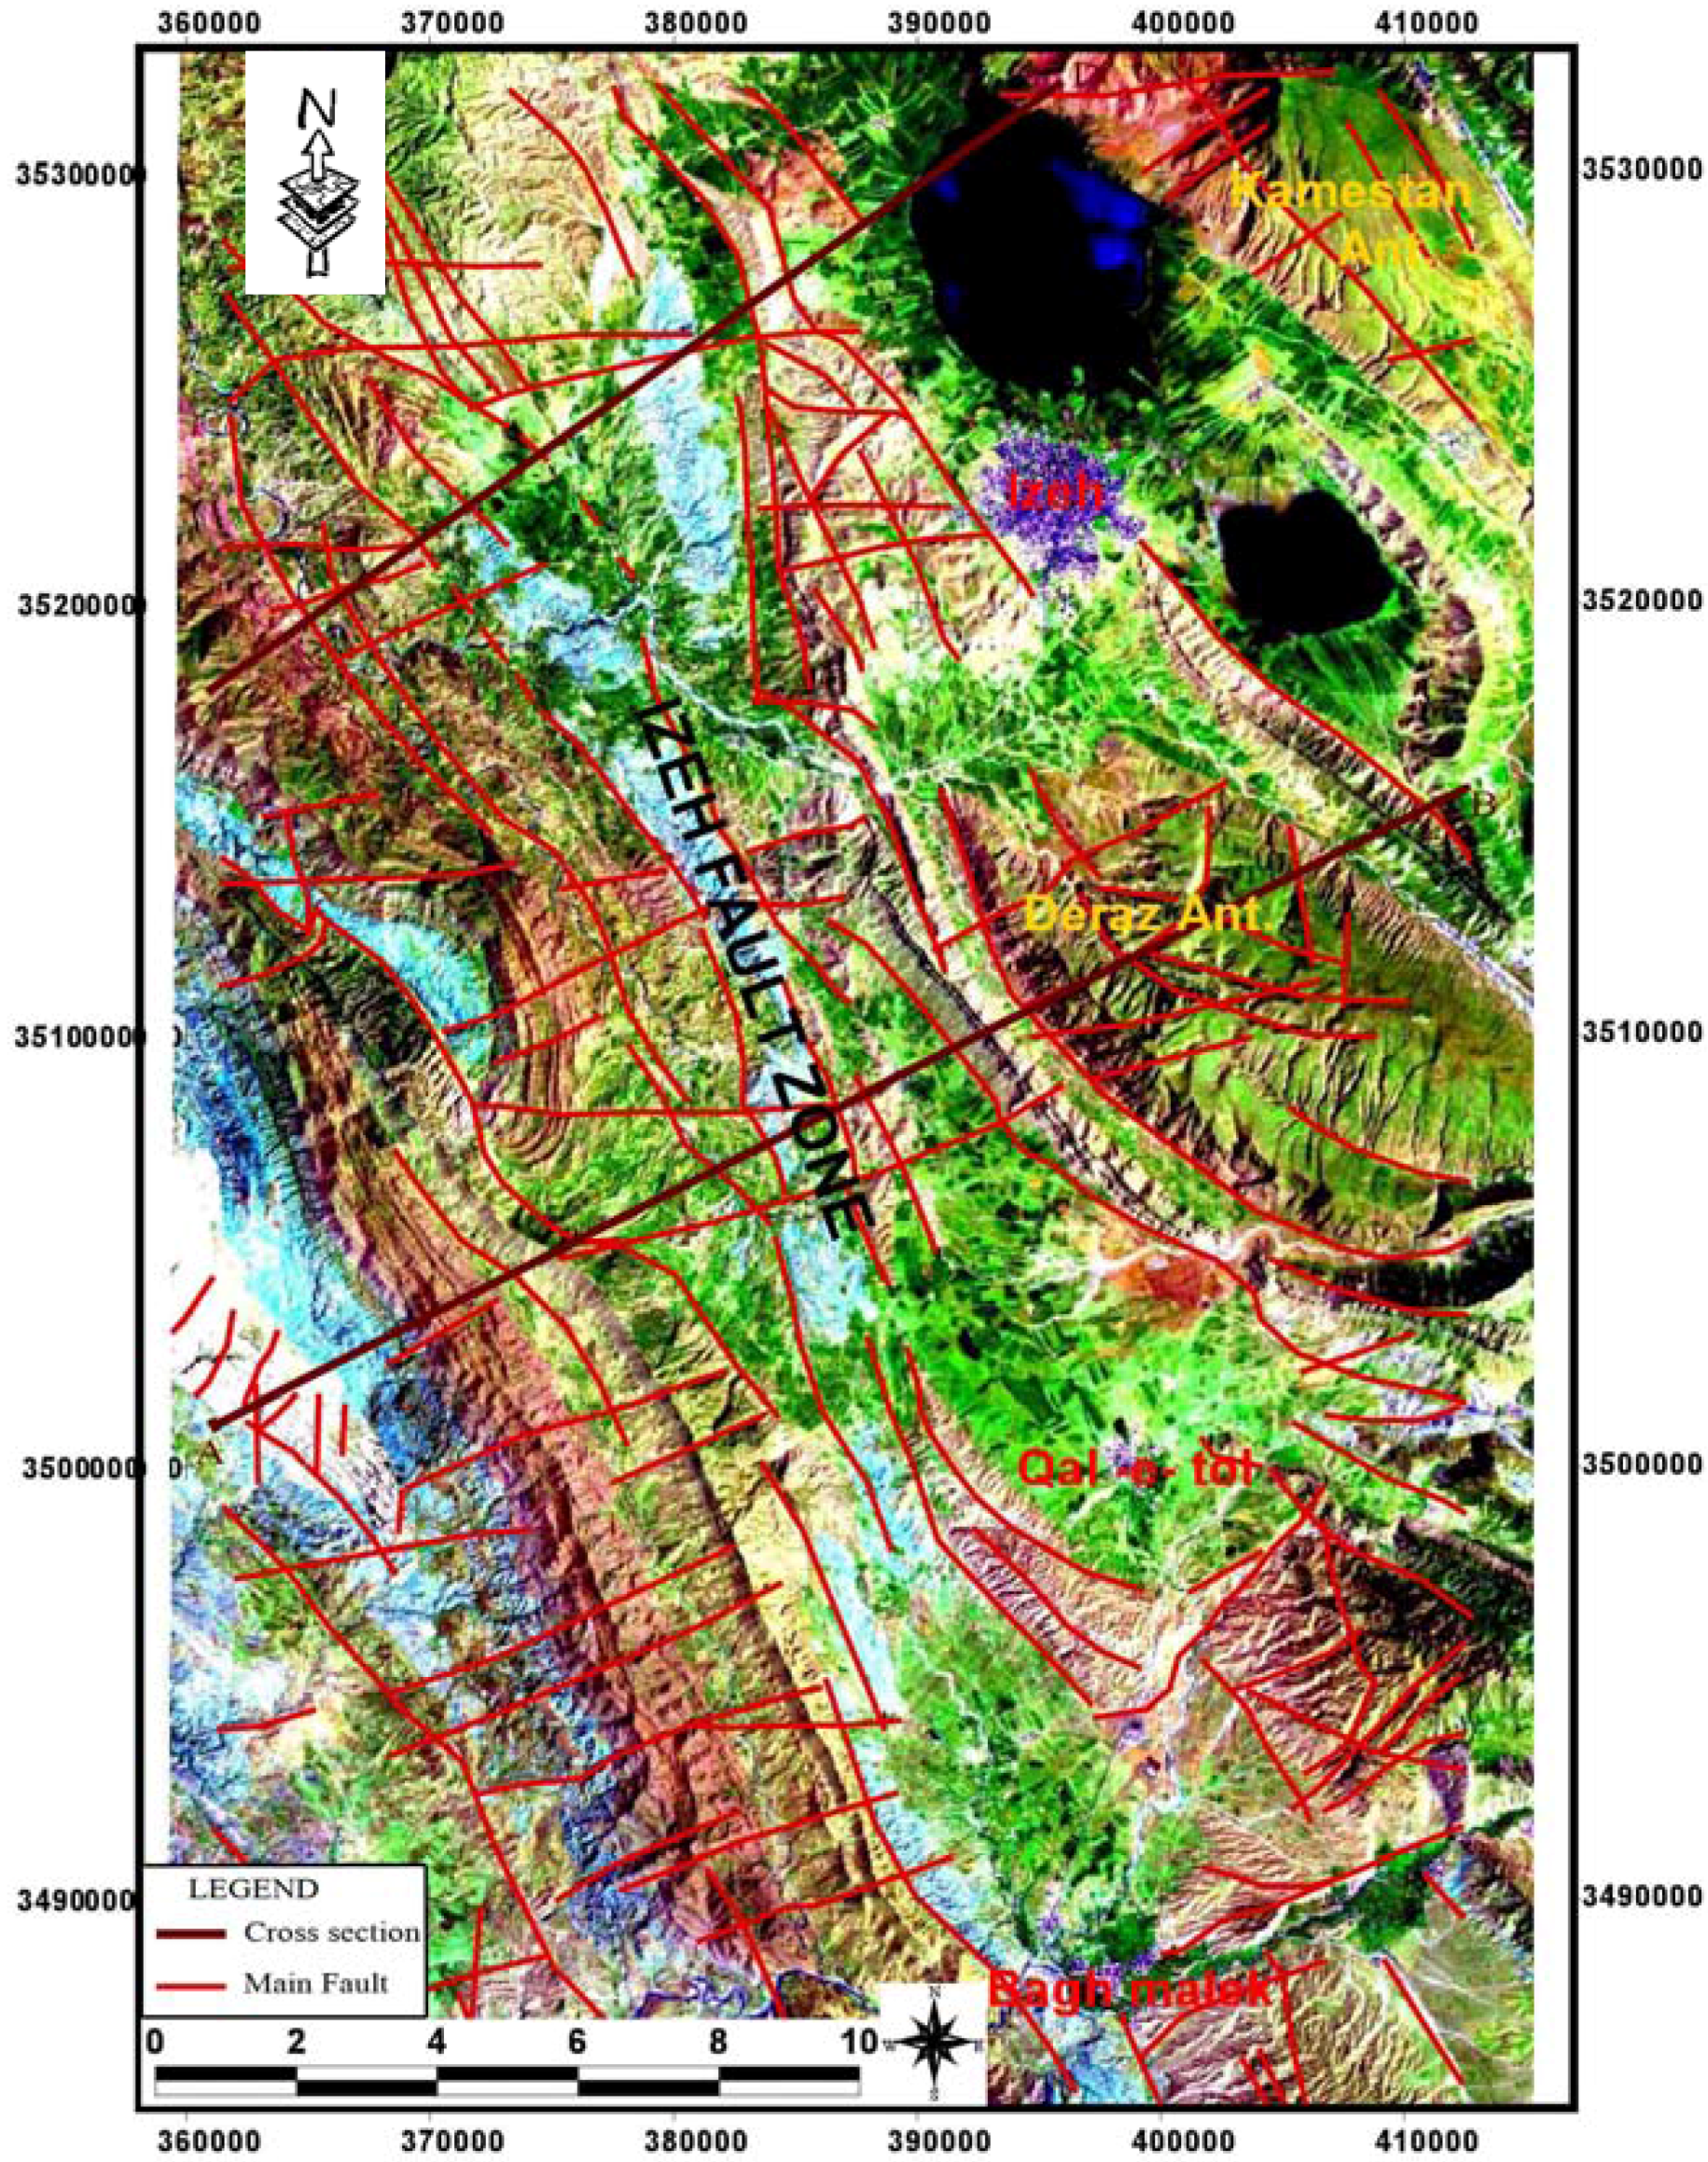
Figure 2.
The study area with structural features and AB cross section on ETM+ image with FCC 7-4-1.
Figure 2.
The study area with structural features and AB cross section on ETM+ image with FCC 7-4-1.
In this paper, the Izeh fault zone is selected as a case study of the Zagros transverse faults and the absolute uplifting rate estimation was calculated along this fault zone. This paper discusses the real subsidence which was taken place in the eastern boundary of the Dezful Embayment. Geoinformation technology has been used as a tool to calculate the uplifting of the Izeh Fault Zone.
The study area (Izeh–Baghmalek) covers the coordinates between 360,000–415,000E and 3,485,000–3,534,000N in the UTM coordinates system. The eastern part of the Dezful Embayment along with the western part of the Izeh zone and the Izeh transverse fault zone are located in this area (
Figure 2).
On the basis of the historical evidence, the Zagros Mountain indicates that a l mm/yr uplift in the Shaur anticline (in the Dezful Embayment, Zagros Foredeep) has occurred since the Late Pliocene [
14]. Holocene uplift rates of 1.8–6.6 mm/yr indicate a shortening by folding of 29 mm/yr. The traces of these neotectonic movements are shown along the Izeh fault zone (
Figure 1). This has been obtained from the fossil shorelines in the Zagros coastal plain southwest of Bandar Abbas.
Pronounced subsidence of the Zagros Foredeep and the Dezful Embayment with thickening of the post-Asmari deposits (Neogene Gachsaran Evaporites and the Aghajari-Bakhtiari synorogenic molasse) provides evidence of relative motion along the MFF and the Dezful Embayment fault since Early Miocene times [
15]. The geological evidence, based on the present position of the top of the Eocene-Oligocene Asmari Formation, from stratigraphic, seismic and borehole data [
16] demonstrates the vertical displacement along MFF thrust, which is more than 6 km. It was a sedimentary basin with pronounced subsidence and thickening of the post-Eocene-Oligocene Asmari deposits in the Zagros Foredeep at the foot of the uplifting Simple Fold Belt. The vertical drop of the basin of the Lower Miocene-Pliocene Aghajari Formation is more than 3 km in the Dezful Embayment.
2. Methodology
In order to calculate the absolute uplift along the Izeh Fault and real subsidence of the Dezful Embayment the following data and methodology have been used.
2.1. Data and Materials Used
The data consists of: (a) analog geological map of Kuh-e-Safid, Kuh-e-Kamestan and Kuh-e-Asmari in scale: 1/100,000; (b) digital and analog topographical maps of the study area in scale: 1/25,000; (c) Landsat Thematic Mapper Plus (ETM+) images with row and path 164/38 and 165/38 dated 1991.
2.2. Surface Geospatial Analysis
Geospatial investigations consist of the interpretation of satellite images, ground truth and generate a modify version of the digital geological map. Satellite images (Landsat ETM+) were geometrically corrected on the basis of 100 ground control points (GCPs) and digital topography maps in scale 1:25,000 from the Iranian Survey Organization. The RMS error obtained was less than 0.5 m in resolution from the images that is 28.5 m resolution. A Pseudocolor 7,4,1 (RGB) band composition was developed. This corrected pseudocolor image was filtered by high-pass filter. The filtering was useful to discriminate the lithology using ground truth data. Directional-filters were used to enhance the linear structures revelation. Linear structures such as faults, folds (
Figure 2) were extracted from the images. Lithology of outcropping rocks were emphasized by field investigations and then digitally mapped on the images. The extracted structures and lithological units were inputs to GIS environment as data layers and then with overlaying of these layers, the digital geological map of study area was prepared (
Figure 3).
Figure 3.
Geology map of the study area with vertical displacement along the Izeh Fault Zone and thrust.
Figure 3.
Geology map of the study area with vertical displacement along the Izeh Fault Zone and thrust.
2.3. DEM Generation
The DEM (Digital Elevation Model) portrays the topographical information in the form of an array of numbers denoting location of features in terms of their x and y coordinates and the elevations [
15]. The main factors which are plays important role in quality of DEM-derived products mainly comprise of: terrain roughness, sampling density (elevation data collection method), grid resolution or pixel size, interpolation algorithm and vertical resolution. Some most common interpolation algorithms were tested. They are including: Inverse Distance Weighted (IDW), Kriging and Spline methods using the same data sources. The IDW method applies the idea that influence decreases with increasing the distance from particular points and hence, the IDW algorithm is optimal if we need to produce results in a short time [
16]. This method was selected in our study for interpolation of data. The important uses of this DEM include: creation of relief maps, rendering of 3D visualizations and use for preparation of 3D sketches for interpretation. The digital topography maps at the scale 1:25,000 of the study area were used for the generation of DEM. The spatial data are entered into Arcview version 3.2 and then the DEM was prepared on the basis of inverse distance weighting (IDW) method of interpolation (
Figure 4).
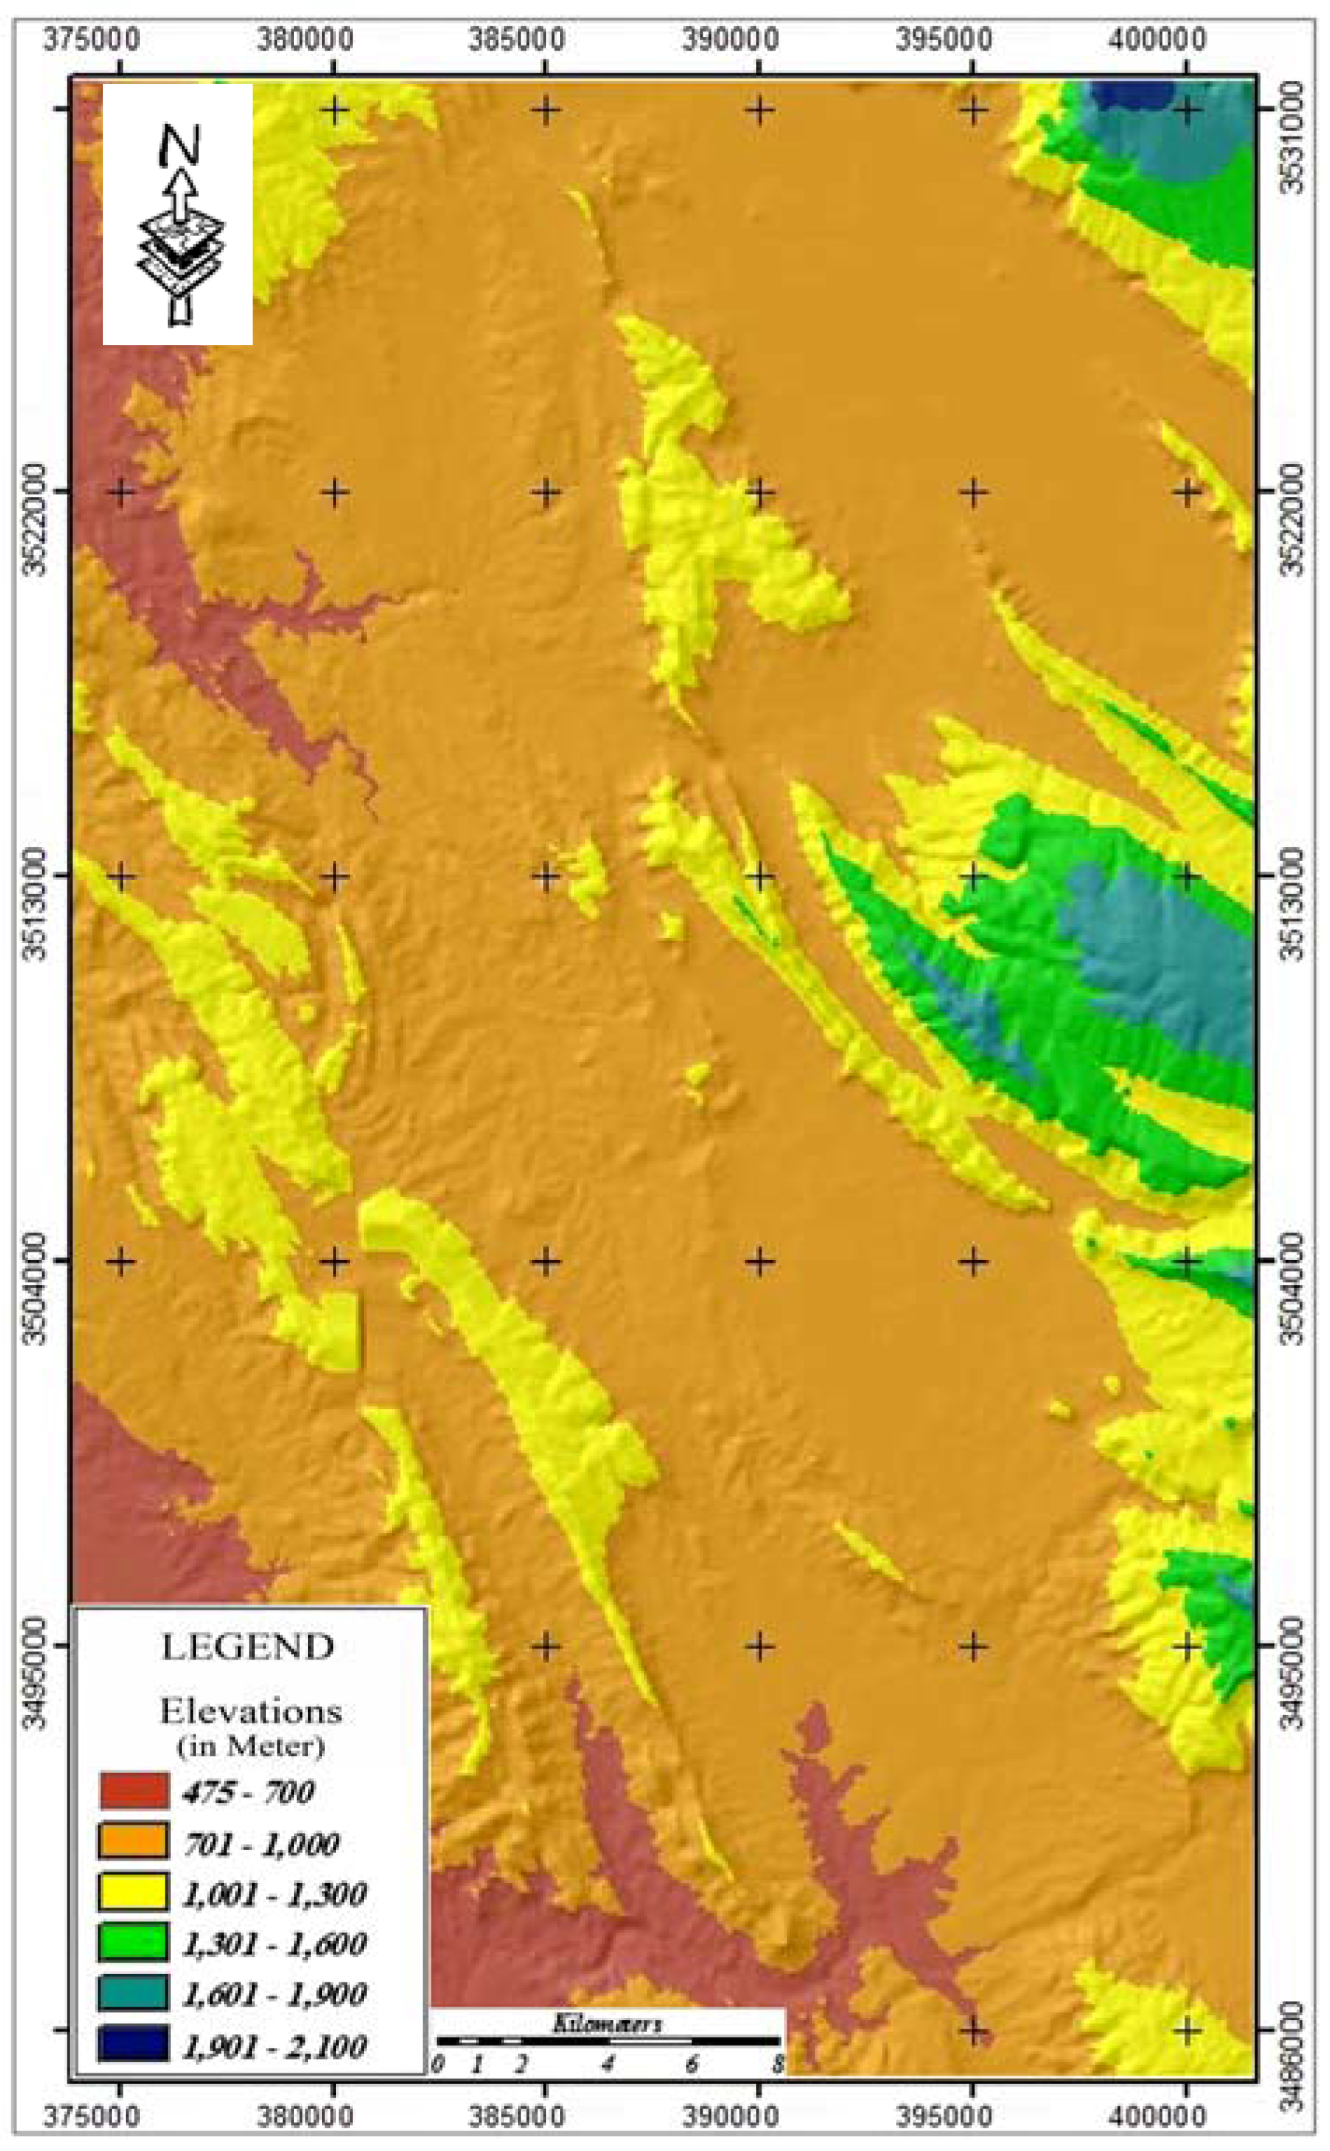
Figure 4.
DEM of the study area.
Figure 4.
DEM of the study area.
2.4. Surface Reconstruction and Structural Cross section Surveying
In order to prepare the cross section of the study area two transects have been chosen in such a way that they cut the Dezful Embayment and the Izeh Fault. The Izeh Zone has been studied along with the fault bedding during the collection of the ground truths. The Aghajari-Bakhtiari stratigraphic boundaries of both sides of the Izeh Fault (as a youngest boundary) in cross sections were reconstructed on the basis of structural styles which have been inferred using visual and image interpretation techniques in conjunction with the field data.
In order to understand the underground structural style of the study area, two cross sections which are cuts the border zone of the Dezful Embayment and the Izeh zone were selected for surveying. The profiles of these cross sections were prepared using the elevation heights that was extracted from the DEM. All structures such as major faults, minor faults and attitude of beds (include: strike, dip and dip direction), especially stratigraphical boundaries have been measured along these cross sections. Then, the cross sections were drawn by using field measurements and Busk draw method (
Figure 5).
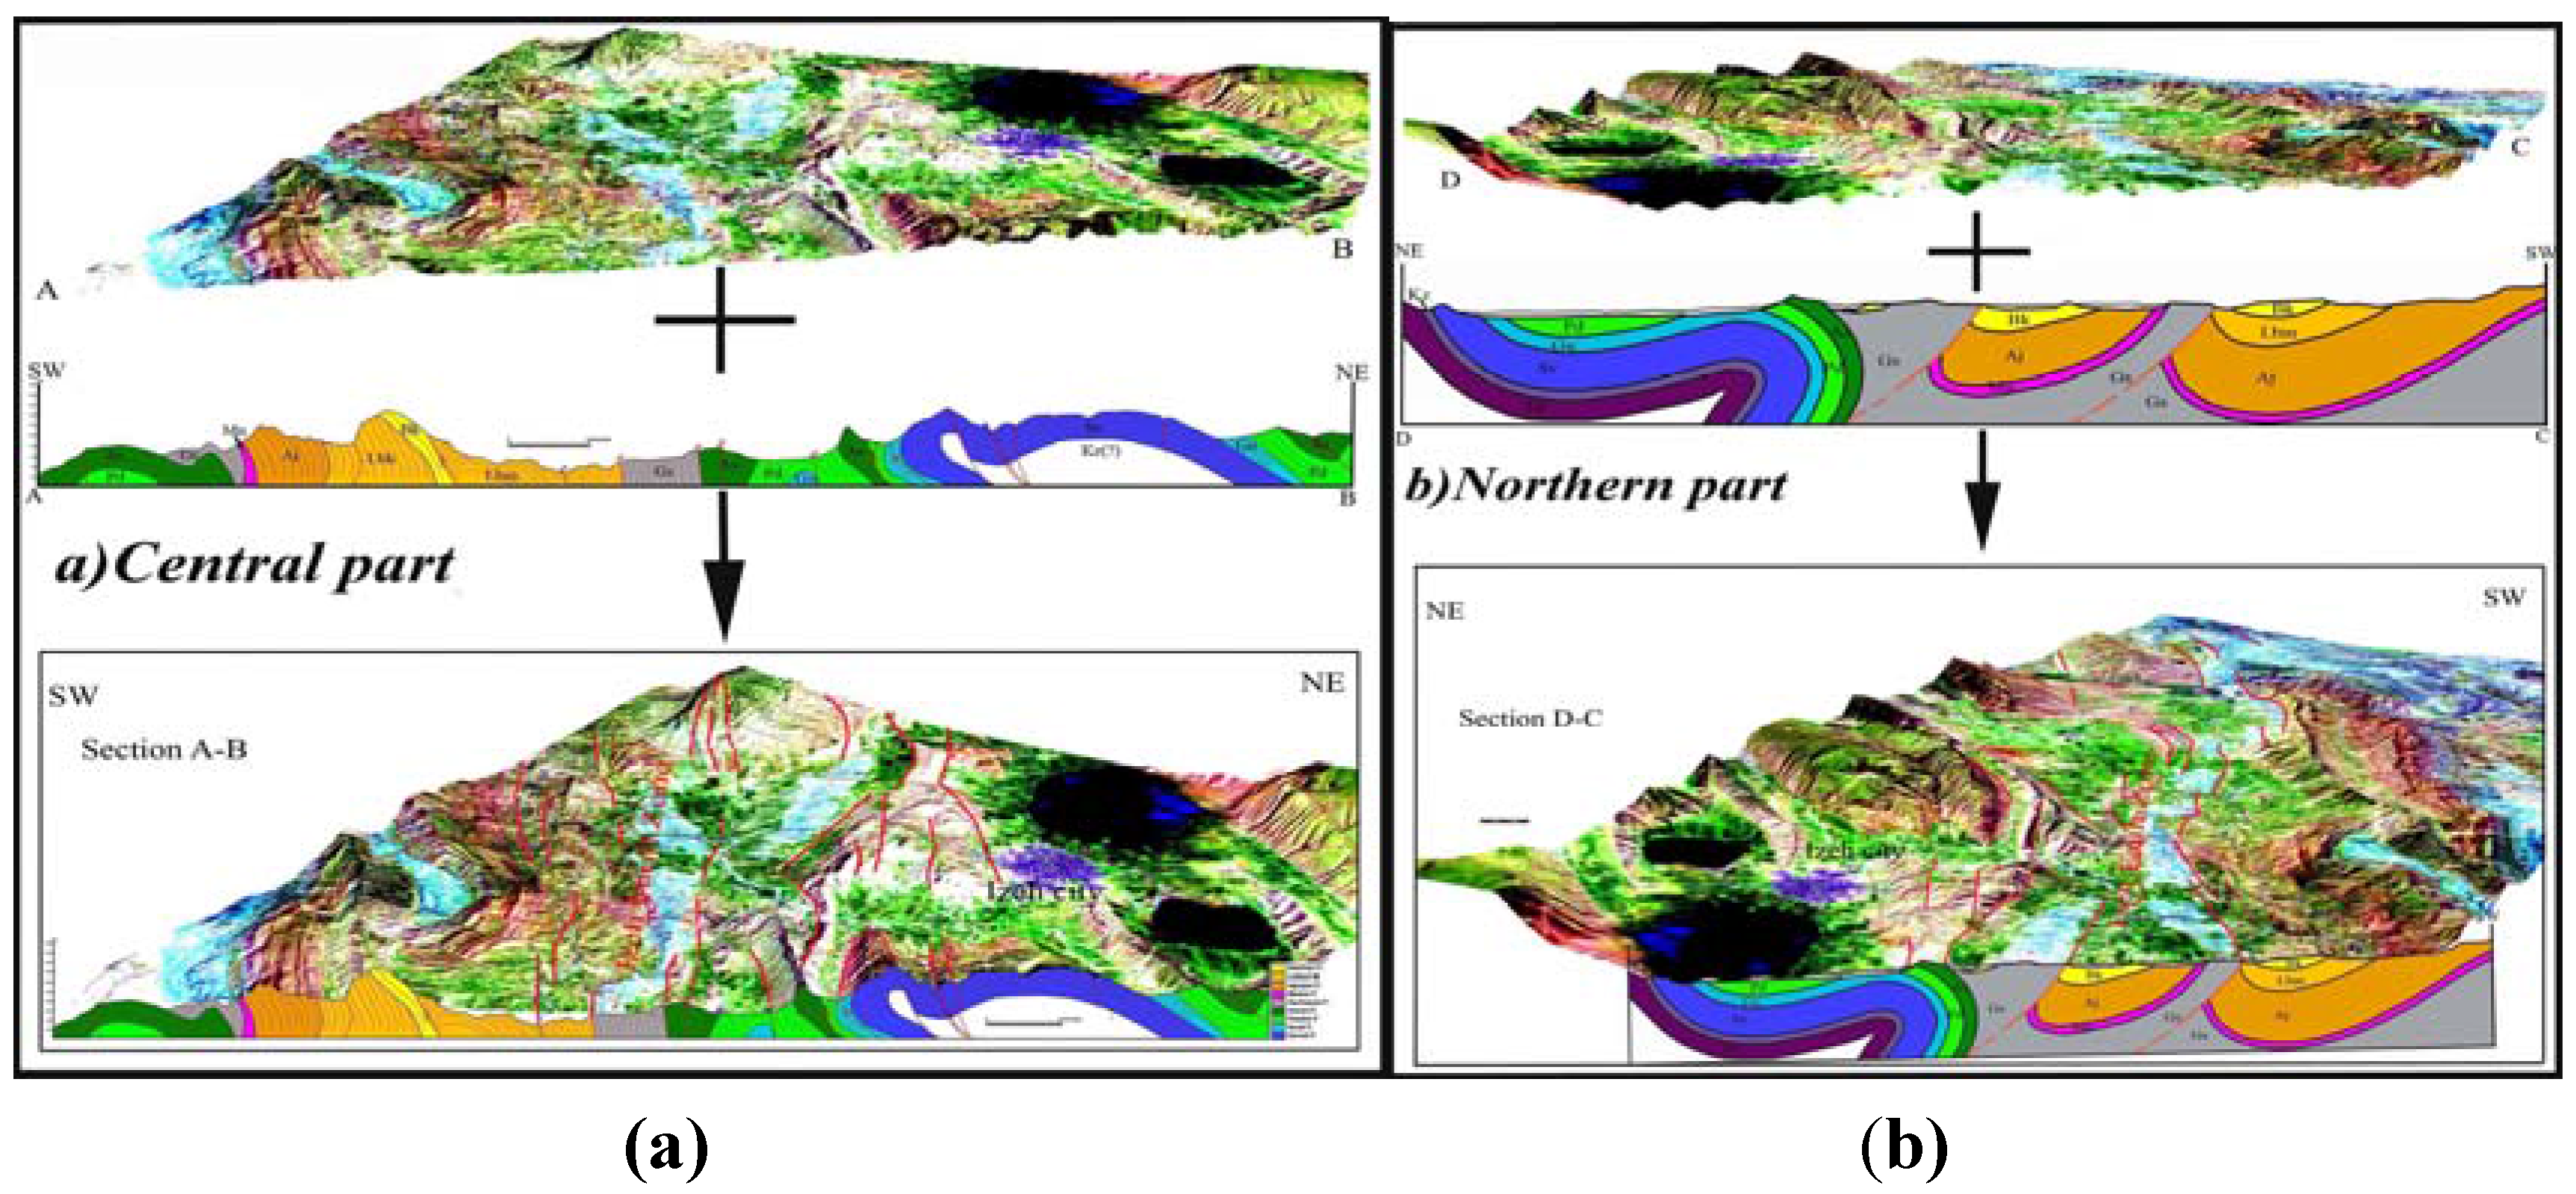
Figure 5.
The different stages for 3D sketches generation: (a) The geometric corrected Landsat ETM+ satellite image overlaid on DEM; (b) surveyed cross sections in opposite directions.
Figure 5.
The different stages for 3D sketches generation: (a) The geometric corrected Landsat ETM+ satellite image overlaid on DEM; (b) surveyed cross sections in opposite directions.
2.5. Design of the 3D Sketches
The geometrically corrected and filtered pseudocolor image was overlaid on the DEM of the study area. The combinations of the DEM and overlay images were plotted along the cross sections. Then the cross sections were laterally attached on the DEM and finally the 3D sketches were prepared perpendicular to the Izeh fault zone which is part of the study area (consisting of the Dezful Embayment, Izeh Fault and Izeh Zone,
Figure 5). These 3D sketches present the 3D visualization and perspectives of surface-subsurface relationship of faulting along the Izeh Fault Zone and consequently structural style of study area. It uses for determining the Izeh Fault Zone position and its movement trace (mechanism of faulting).
Using 3D sketches and extracted structural style on the basis of digital image processing techniques on the DEM and 3D model enabled us to determine the surface and subsurface structural features. For this interpretation field and geophysics data were combined and further a surface cross section has been reconstructed. For the cross section, the Aghajari-Bakhtiari stratigraphic boundary (i.e., youngest boundary) in the eastern block of the fault zone was selected for reconstruction and finally the surface styles of the main anticlines (i.e., Deraz and Kamestan anticlines) have been emphasized.
The Aghajari–Bakhtiari stratigraphic boundaries in Pliocene age as the youngest boundary and Sarvak–Gurpi with the Khazdumi-Sarvak stratigraphic boundaries in Upper Cretaceous in the Deraz and Kamestan anticlines as oldest outcropped boundaries were selected for erosion level calculation with the greatest age differences. The thickness of the stratigraphic columns between these erosion levels was calculated. All of these stages were performed for calculation of total height difference between the youngest erosion level in the Dezful Embayment and the oldest erosion level in the Izeh zone (located in western and eastern side of the Izeh fault zone, respectively). The Asmari-Pabdeh stratigraphic boundary in the Eocene-Oligocene age has also been selected between the interior and eastern block fault zone (in A-B cross section) in order to calculate the uplifting due to the Izeh fault activity in central part of the study area.
2.6. Selection of the Suitable Erosion Level
The Aghajari–Bakhtiari (Pliocene), Sarvak–Gurpi and Kazhdumi-Sarvak (Upper Cretaceous) stratigraphy boundaries have been selected for calculation of the Total Height Difference (THD) in both side of the Izeh fault (between the Dezful Embayment and the Izeh Zone) because they have greatest age and erosion levels differences. Then, the same Asmari-Pabdeh stratigraphic boundaries have been selected for calculation of the uplift along the Izeh Fault Zone (between the interior and eastern block of the Izeh Fault Zone).
2.7. Calculation of the Subsidence and Uplifting
By comparison of the height differences in selected erosion levels between both sides of the Izeh Fault Zone; the total subsidence could be calculated. Then, by comparison of the height difference between the interior and eastern block of the Izeh Fault Zone, the absolute uplift in the Izeh zone (as eastern block) due to Izeh fault activity was estimated. Finally, subtracting the absolute uplifting and total height difference was calculated using the subsidence of the Dezful Embayment.
The elevations of the Sarvak–Gurpi and Khazdumi-Sarvak boundaries as the oldest outcropped erosion levels have been extracted from cross section profiles and added to calculate the total thickness of stratigraphic columns between oldest and youngest erosion levels (
Table 1). The calculation has been attempted for surface-reconstructed outcropped core of the Deraz and Kamestan anticlines which are located in the eastern block of the Izeh fault. The elevation of the Aghajari–Bakhtiari stratigraphical boundaries, as youngest boundary located in western block has been extracted from cross section profiles (and/or digital topographic maps).
The developed total height differences of youngest-oldest boundaries across the Izeh fault zone were calculated by subtracting the elevation of the Aghajari–Bakhtiari stratigraphic boundaries from the oldest stratigraphic elevation boundaries in surface-reconstructed cross sections. By comparison of the Asmari-Pabdeh elevation differences between the interior and eastern block of the fault zone (Izeh zone) in cross section A-B, the uplift (absolute uplifting) due to the Izeh fault activities were estimated in the central part. Finally, the real subsidence of the Dezful Embayment was calculated by subtracting the uplift of the eastern block (Izeh zone) and total height differences.
The uplift due to Izeh fault activity in the northern part (in C-D cross section) was calculated using the same concept of subtracting method of real subsidence of the Dezful Embayment from the total height differences.
Therefore, the uplift along the Izeh fault zone in the northern and central part of the study area and the subsidence of the Dezful Embayment were calculated (
Figure 6). The details of calculations in two cross sections are given in equations 1 to 7 and the descriptions of the abbreviation of different terms used in the equations are given in
Table 2.
Table 1.
Characteristics of outcropped formations in the study area.
Table 1.
Characteristics of outcropped formations in the study area.
| Formation | Lithology | Age | Lower Contact | Upper Contact | Thickness(m) |
|---|
| Bakhtiari | Sequence of: conglomerate, siltstone and partly marl | Pelio - Plistocene | Angular Unconformity with Lahbari, Aghajari and etc. | – | – |
| Aghajar | Lahbari Member | Sequence of: siltstone, marl and conglomerate | Upper Miocene to Pliocene | Angular Unconformity with Aghajari | Angular Unconformity with Bakhtiari | ~2100 |
| Main part | Sequence of: sandstone, grey and red marls and Siltstone | Transitional with Mishan | Angular Unconformity with Lahbari member | |
| Mishan | Gray marls inter-bedded with marly limestone | Lower to Middle Miocene | Sharp and conformable with Gachsaran | Transitional with Aghajari | 130 |
| Gachsaran | Sequence of: anhydrite and marl with marly limestone and salt inter-beds | Lower Miocene | Conformable with Asmari | Conformable with Mishan | ~1500 |
| Asmari | Competent limestone with inter-bedded argillaceous limestone | Oligo-Miocene | Conformable with Pabdeh | Conformable with Gachsaran | 460 |
| Pabdeh | Purple shale at base, gray shale with inter-bedded argillaceous limestone | Paleocene to Oligocene | Conformable with Gurpi | Conformable with Asmari | ~445 |
| Gurpi | Gray shale and marl with inter-bedded argillaceous limestone | Cretaceous | Santonian to Maestrictian | Disconform. with Sarvak | Conformable with Pabdeh | 305 |
| Ilam-Sarvak | Well bedded grey argillaceous limestone with massive feature forming limestone | Albian to Turonian | Transitional with Kazhdumi | Disconform. With Pabdeh | 755 |
| Kazhdumi | Bituminous shale with shaly limestone and marls inter beds | Aptian to Albian | Diastem together with red ferrous layer | Transitional with Ilam-Sarvak | ? |
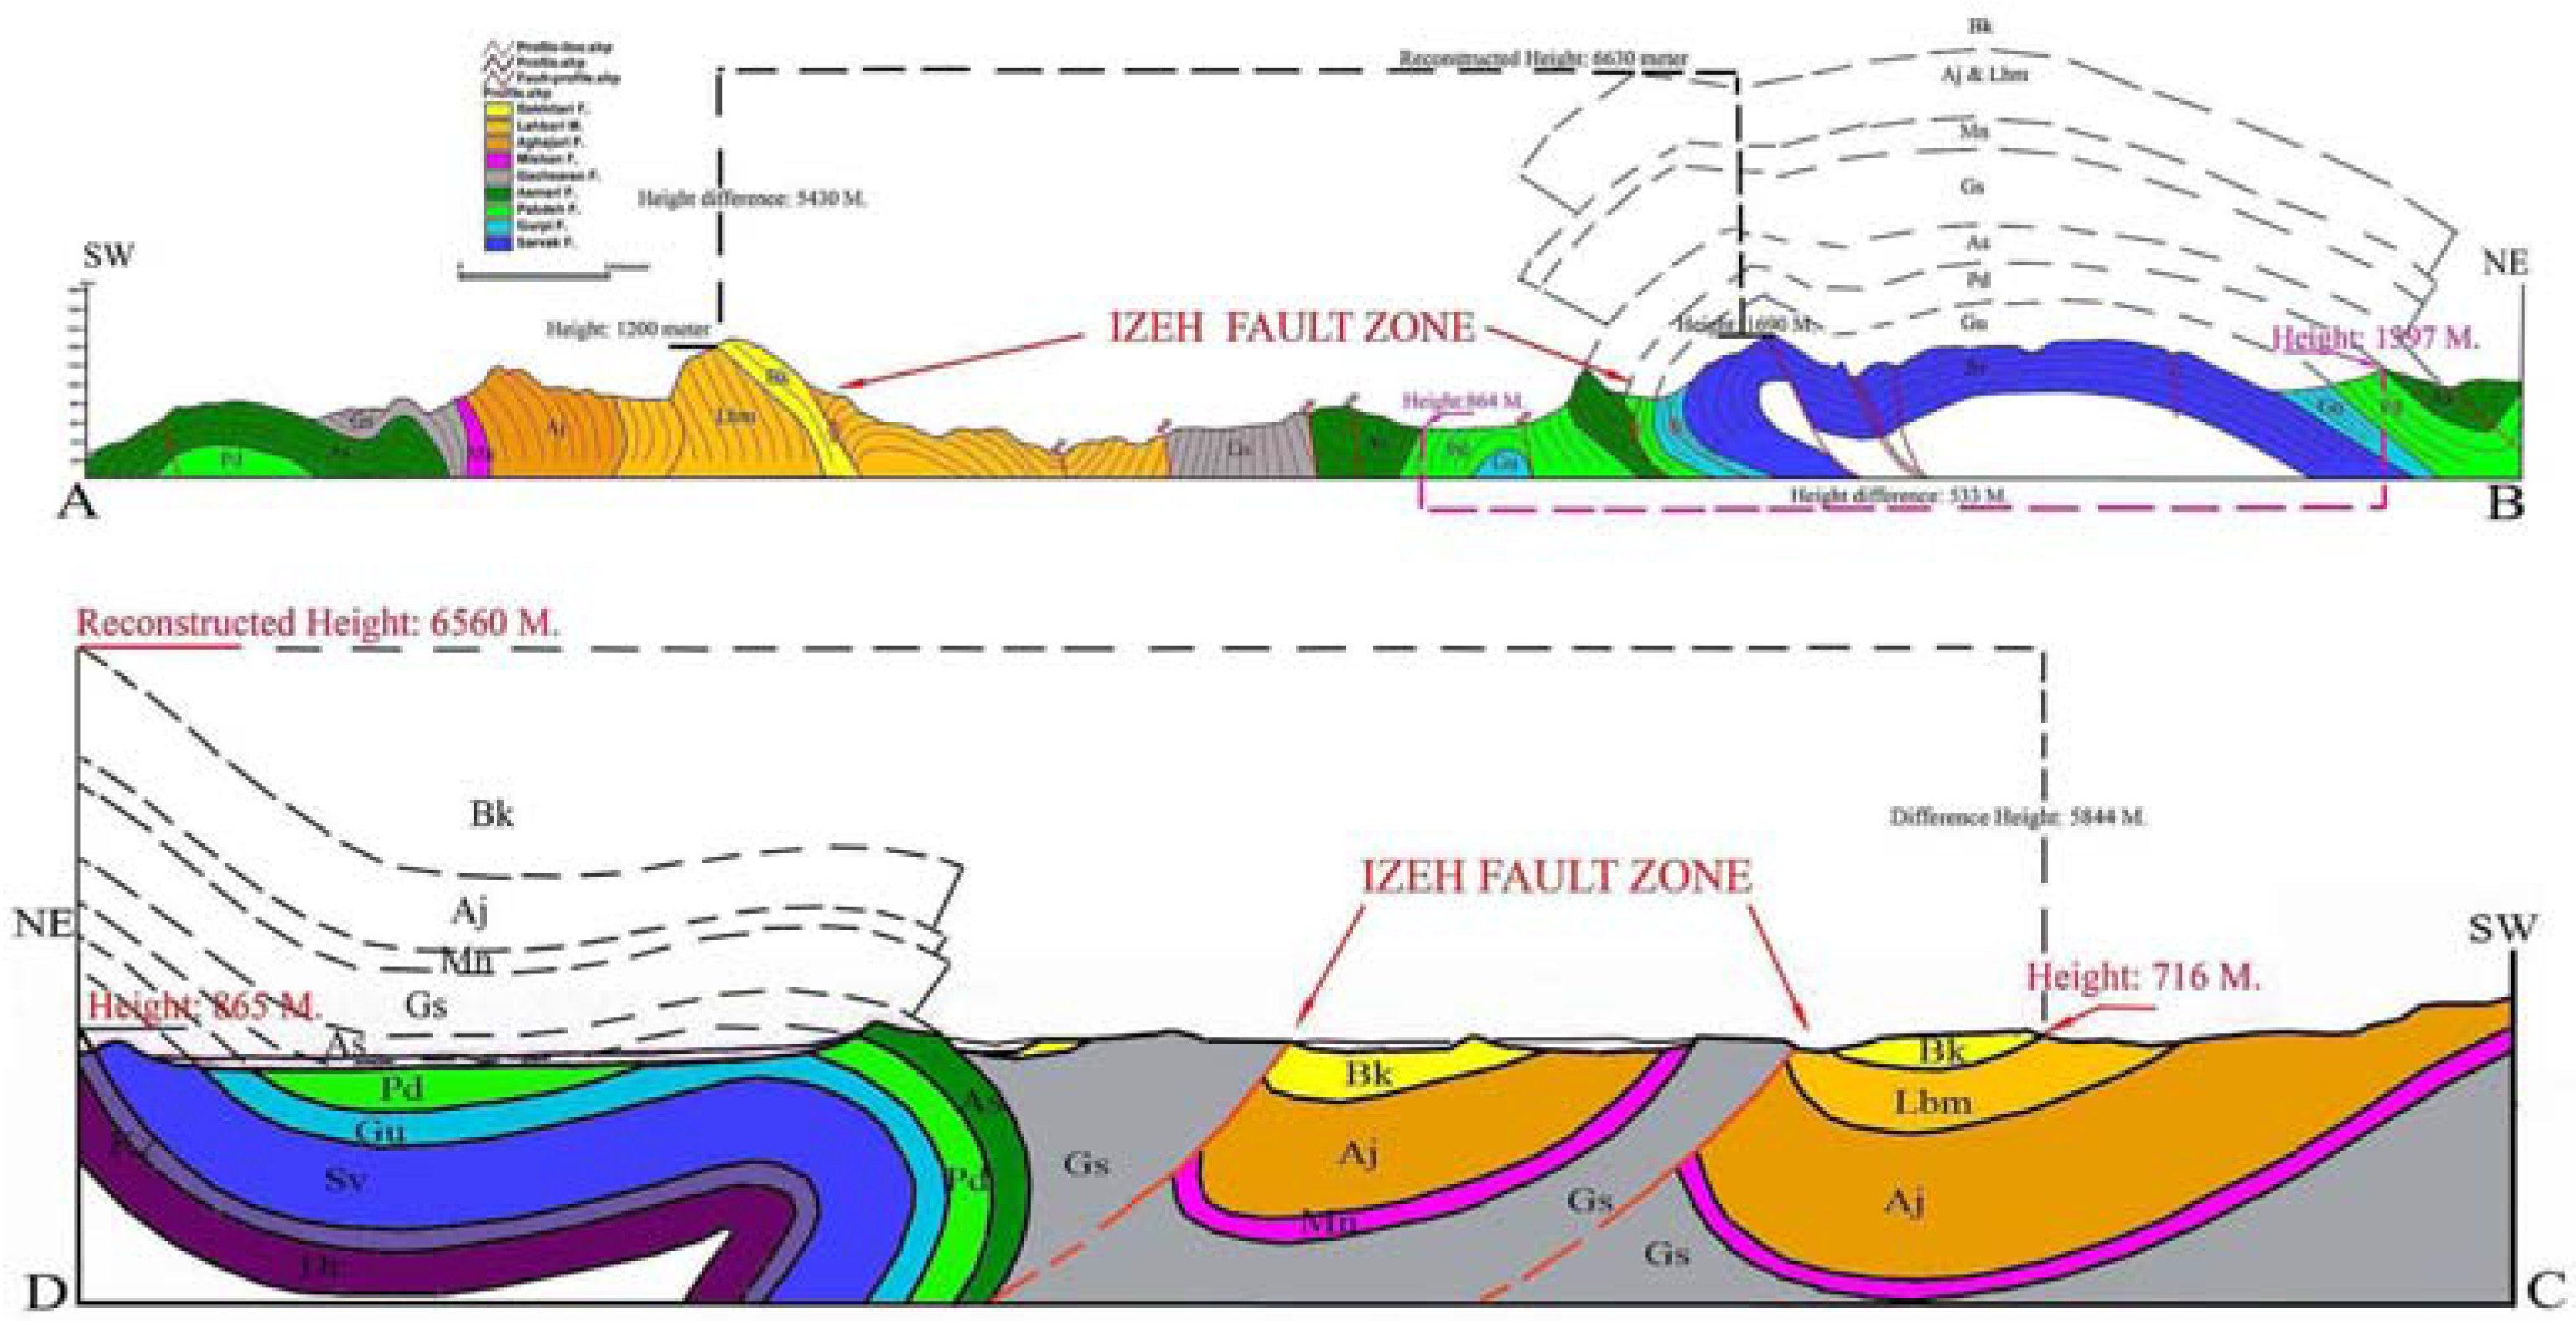
Figure 6.
Cross sections together with subsidence-uplifting.
Figure 6.
Cross sections together with subsidence-uplifting.
| A: Calculations in Cross Section A-B (Central Part): | |
| ESv-Gu + TSC-D = EBSv-Gu | (Eq. 1) |
| 1690 +4940 = 6630 m (Reconstructed elevation) | |
| EB Sv-Gu − E1Aj-Bk = BHDAB | (Eq. 2) |
| 6630 − 1200 = 5430 m (Total height difference) | |
| UPIFZ = EXAs-Pd − EIAs-Pd | (Eq. 3) |
| 1397 − 864 = 533m (Uplifting in central part) | |
| SUBDM = BHDAB − UPIFZ | (Eq. 4) |
| 5430 − 533 = 4897 m (Subsidence in Dezful embayment) | |
| B: Calculation in Cross Section C-D (Northern Part): | |
| EKz-Sv + TSC-K = EBKz-Sv | (Eq. 5) |
| 865 + 5696 = 6560 m (Reconstructed elevation) | |
| EB Kz-Sv − E2Aj-Bk = BHDCD | (Eq. 6) |
| 6560 − 716 = 5844 m (Total height difference) | |
| BHDCD − SUBDM = UPIFZ | (Eq. 7) |
| 5844 − 4897 = 947 m (Uplifting in northern part). | |
Table 2.
The descriptions of abbreviation of different items in the equations.
Table 2.
The descriptions of abbreviation of different items in the equations.
| Abbreviations | Descriptions |
|---|
| In cross section A-B | ESv-Gu | Elevation of the Sarvak–Gurpi boundary in the Deraz Anticline |
| TSC-D | Thickness of the stratigraphic column in the Deraz Ant. |
| EBSv-Gu | Elevation of the Sarvak–Gurpi boundary in surface-reconstructed section A-B |
| E1Aj-Bk | Elevation of the Aghajari–Bakhtiari stratigraphic boundary in section A-B |
| BHDAB | Bulk height differences of youngest-oldest boundaries in section A-B |
| In cross section C-D | EKz-Sv | Elevation of the Kazhdumi-Sarvak boundary in the Kamestan anticline |
| TSC-K | Thickness of the stratigraphic column in the Kamestan Ant. |
| EBKz-Sv | Elevation of the Kazhdumi-Sarvak boundary in surface-reconstructed of section C-D |
| E2Aj-Bk | Elevation of the Aghajari–Bakhtiari stratigraphic boundary in section C-D |
| BHDCD | Bulk height differences of youngest-oldest boundaries in section C-D |
| Izeh fault zone | EXAs-Pd | Elevation of Asmari-Pabdeh in the external zone of the Izeh fault |
| EIAs-Pd | Elevation of Asmari-Pabdeh in the internal zone of the Izeh fault |
| UPIFZ | Uplifting along the Izeh fault zone |
| SUBDM | Subsidence in the eastern limit of the Dezful Embayment |
3. Stratigraphic and Geo Structural Settings
O’Brien divided the stratigraphic column of the Dezful Embayment and the adjacent area into five structural and geo-mechanical groups: (a) the basement group (Pan-African crystalline basement); (b) lower mobile group (with 4 km thickness); (c) the competent group (Cambrian to Lower Miocene platform sediments with 6–7 km thickness); (d) the upper mobile group (Miocene evaporates with 1,600 meter thickness) and (e) the incompetent group (Miocene to Recent molasses with 3–4 km thickness) [
23].
The surface outcropped rock types were distinguished by remote sensing techniques and supplemented with field investigations [
17,
18]. Finally, the stratigraphy of the surface outcrops was used for digital mapping area (
Figure 3). The visible surface and subsurface stratigraphy of outcropped rocks in the Dezful Embayment (west block of IFZ) consists of the Sarvak, Gurpi, Pabdeh, Asmari and Gachsaran Formations. The surface stratigraphy in the Izeh zone (east block of IFZ) consists of the Asmari, Gachsaran, Mishan (with Guri Member), Aghjari (with Lahbari Member) and Bakhtiari Formations. The characteristics of each formation are shown in
Table 1. The study area is located in the border of the Dezful Embayment and the Izeh Zone. The boundary of these two main structural zones is formed by the Izeh transverse fault zone. The main characteristics of these structural units are described below.
3.1. Dezful Embayment
The Dezful Embayment appears to be a discrete structural unit with boundaries defined by the Mountain Front Fault (MFF) in the northwest of the Kazerun-Borazjan region and the Izeh transverse fault zone to the east-southeast and the Zagros Fore deep (Frontal) fault in the southwest (
Figure 1). Activity along these major fault zones has controlled the sedimentation and subsidence of this embayment [
19]. It was a sedimentary basin with pronounced subsidence and thickening of the post-Eocene-Oligocene Asmari deposits in the Zagros Foredeep at the foot of the uplifting Simple Fold Belt. The vertical drop of the basin of the Lower Miocene-Pliocene Aghajari Formation is more than 3 km in the Dezful Embayment. The geological evolution of the Dezful Embayment shows evidence of interactions between basement faulting and cover folding during and after deposition of the Asmari carbonates in the Zagros foreland [
20].
Field observation (
Figure 7) indicates that probably the Dezful embayment primarily corresponds to a morpho-tectonic region stepped down with respect to the Izeh zone and increased rate of sedimentation and erosion during uplifting. Therefore, this embayment shows a sharp topographic difference with the Izeh zone across the mountain front fault and Izeh fault. The amount of this difference has estimated to be approximately 4–5 km to more than 5 km [
20,
21]. Balanced and restored cross sections show that cumulative northeast–southwest shortening has taken placed between 25 km and 49 km in the Dezful Embayment. This corresponds to an average of around 13% shortening of the sedimentary cover in the Izeh zone and the Dezful Embayment [
21,
22,
23,
24].
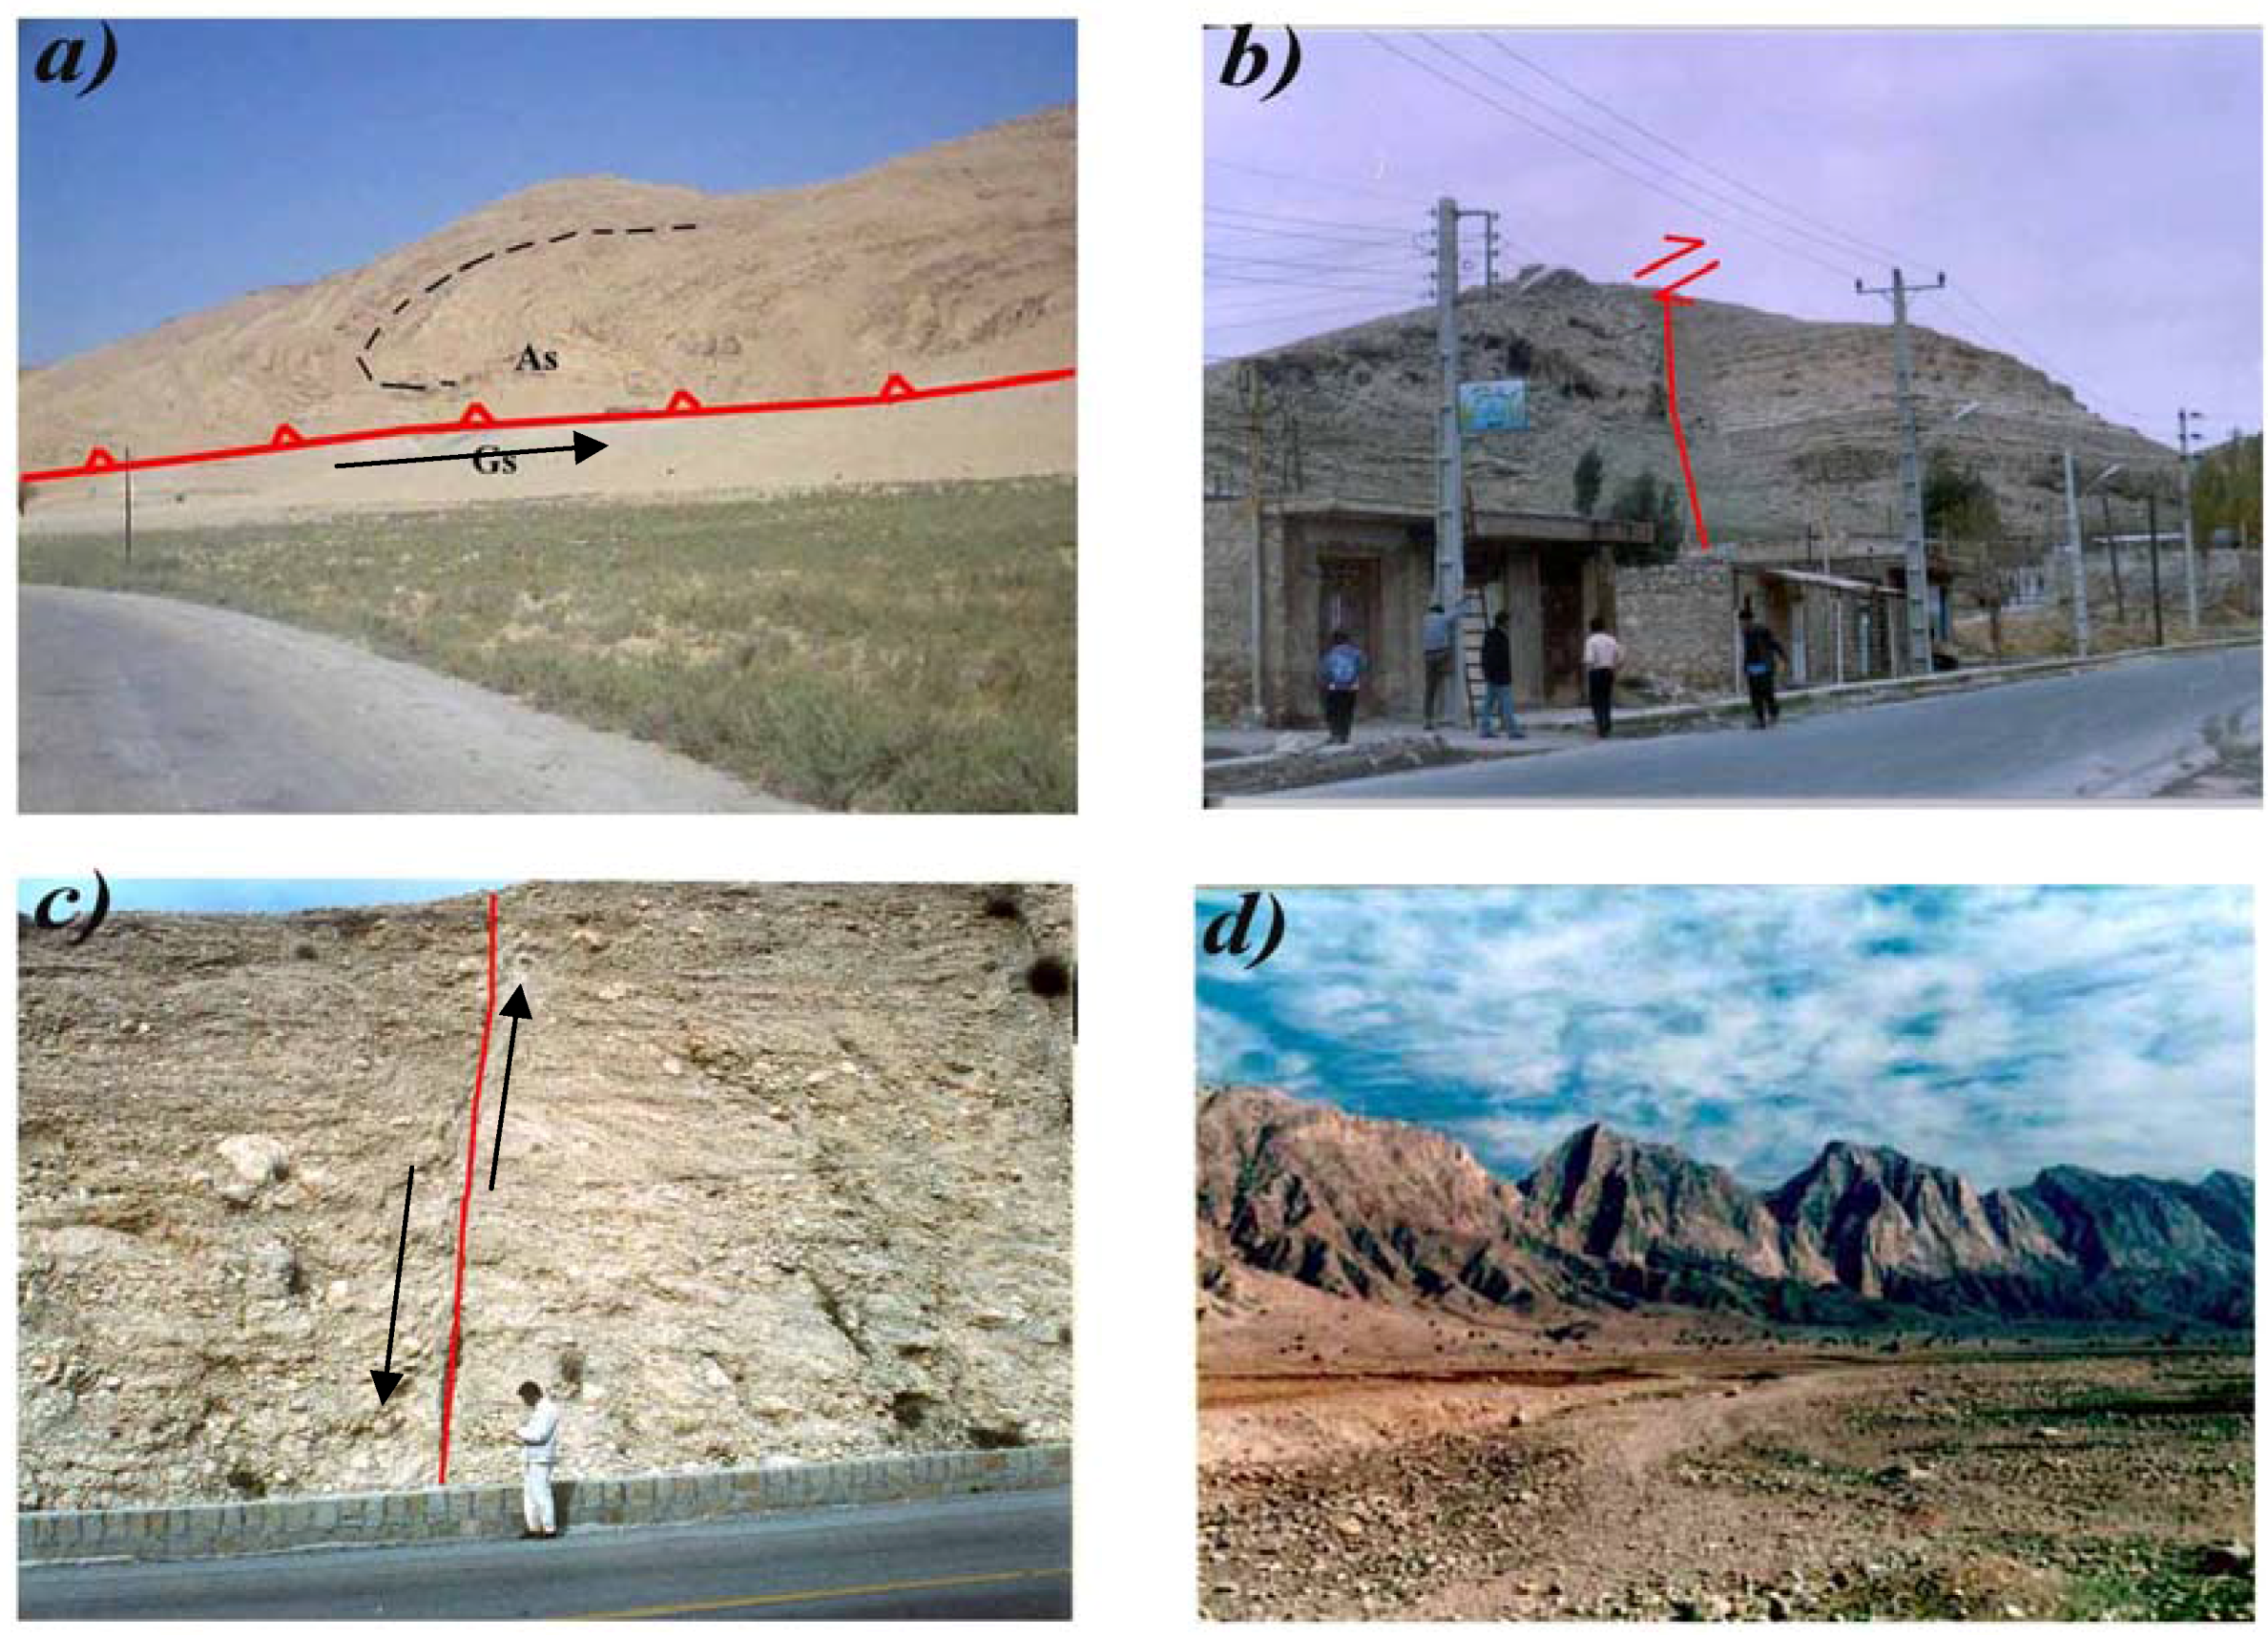
Figure 7.
Field photos indicate active faulting and uplifting during the sedimentation and erosion processes. (a) thrust faulting in mountain front; (b) uplifting along fault zone; (c) active faulting in quaternary sediments; (d) bending in mountain front.
Figure 7.
Field photos indicate active faulting and uplifting during the sedimentation and erosion processes. (a) thrust faulting in mountain front; (b) uplifting along fault zone; (c) active faulting in quaternary sediments; (d) bending in mountain front.
Geo-structural and satellite image interpretation in the Dezful foreland can be complicated by apparently irregular folding in synorogenic sediments which are mechanically detached along an evaporite horizon from the underlying competent carbonates. Sherkati and Letouzey presented a balanced cross-section across the Dezful embayment and have shown the development of detachments at different horizons and supporting this idea [
13]. This research indicates that a single basal decollement is not sufficient to explain the shape of the Zagros folds. Consequently, the presences of intermediate to incompetent layers within the sedimentary succession and their role on folding style have been discussed by different authors [
24].
3.2. Izeh Zone
The Zagros simply folded belt has been cut by several transverse strike–slip faults such as the Balarud, Izeh and Kazerun fault zones. This has divided the region into the Lurestan, Izeh and Fars subzones [
23,
24]. The Izeh zone is part of the Zagros folded belt which is limited to the north-northeast by the High Zagros Fault, to the south by the Mountain Front Fault, to the west by the Izeh fault and to the east by the Kazerun fault zone (
Figure 1). This structural unit is a transition zone between different types of sedimentation periods during the entire Jurassic. Most of sediments lies somewhere between the Kazerun and Izeh Fault zones during Cretaceous. The Izeh zone consists of a variety of structures of variable size and geometrical character. Therefore it can be subdivided into the Darishk and Khami domains on the basis of the age of outcrops and the folding style. Due to erosion of the molasses; the competent group outcrops exposing a structural style characterized by ‘
ideal’ parallel folds in which the layers follow a series of quasi-circular arcs [
13]. There is a marked contrast along the prepared section between the widely spaced asymmetric folds which have open inter limb angles in the Dezful Embayment and the smaller with closely spaced folding in the Izeh zone. Synclines are essentially the mirror image of anticlines in the Izeh zone. The presence of short wavelength anticlines in the Asmari Formation (Oligo-Miocene) within the Izeh zone supports that the Pabdeh and Gurpi Formations are efficient intermediate decollement levels, whereas, the same role is probably played by the Albian shales of the Kazhdumi Formation in the southeast of the Izeh zone and parts of the northeast Dezful Embayment.
3.3. Izeh Fault Zone (IFZ)
Safari and Chitsazan (2005) distinguished and mapped the Izeh fault zones and segmented it into four main fault segments, including the Kuh-e-Pabdeh, Andika, Baghmalek and Seidun segments [
2]. The corrected pseudo-color ETM+ images were filtered by high-pass and directional-filters and consequently, the length and width of this fault zone are extracted from the images. Subsequently, all of linear structures such as major and minor faults related to the Izeh fault zone (together with its mechanisms) were measured by field investigations. The length, width and mechanism of this fault zone is firstly distinguished by remote sensing techniques and complementary determined by field investigations and finally two cross sections (perpendicular to the fault strike) were surveyed north of Izeh city and north of the Qale-tol Plain (
Figure 2 and
Figure 3). The Izeh fault zone is a dextral strike slip fault zone with 250 km length, 10–12 km width, and approximately N150°–160° trend which extends from north of the Pabdeh anticline (located in 31°52′25″N, 49°18′16″E) to northeast of Behbahan city (located in 30°43′17″N, 50°13′02″E). On the basis of offsetting of mountain front fault (
Figure 1) the occurred horizontal movement along the strike slip fault has been estimated to be approximately 135 km. Probably some vertical movements have been taken placed along the fault due to a reverse component that is increased towards the fault end and therefore the vertical movements in the fault terminated at a higher level than their central parts [
24]. The important kinematical effects of fault activity comprises dextral offsetting of the Mountain front fault, truncation and dextral bending of fold axes, occurring of local En-echelon fold axes and up landing of synclines.
IFZ formed the border zone between the Dezful Embayment and the Izeh zone and with the Kazerun Fault played an important role in controlling the sedimentation, subsidence and consequently subsequent deformation of the sediments [
11]. The transition zone between the Tertiary Shahbazan and Jahrum Formations to the northeast of the Dezful Embayment locates approximately along the Izeh fault zone [
25,
26,
27,
28]. The deformed rock units of the Fars Group (Mio-Pliocene) and Bakhtiari Formation (Upper Pliocene) indicate that the Izeh fault has been reactivated in the younger phases of the Alpine orogeny.
4. Results and Discussion
During the end of Cretaceous, the NW–SE trending Mountain Front Fault with approximately N-S trending Izeh and Kazerun transverse fault zone divided the simply folded belt into a major foreland basin to the south-southwest known as the Dezful Embayment and a piggyback basin to the north-northeast. This study shows the Izeh transverse fault zone has a dextral strike slip motion with some reverse component. Some evidence of dextral shear deformation together with vertical movements (due to some reverse component) are exhibited along this fault zone. The study reveals that the IFZ formed the border zone of the Dezful Embayment and the Izeh zone and were controlled by the sedimentation and subsidence of this embayment. Also, the Dezful Embayment shows a sharp topographic difference with the Izeh zone (located in the eastern block of the fault zone). The calculated amount of this subsidence is the sum of the real subsidence of the Dezful Embayment and the uplifting of the Izeh zone (due to some reverse component of the Izeh fault zone).
The study shows that the subsidence in the Dezful Embayment in the western block is related to fault zone. It can refer to each height difference in the same erosion levels between the interior and eastern block of the Izeh fault zone (Izeh zone) and uplifting along this fault zone.
This research paper emphasizes that probably there is an amount of vertical movement in the strike-slip fault that increases towards the end of faulting. Therefore, the results can be inferred that the vertical movement in the fault zone is higher than their length. Correspondingly, the strike slip movement increases towards the southern parts of the study area. Hence, the absolute uplift conversely decreases, but the subsidence amount is relatively constant along the Izeh fault zone in all of the study area.
The results further show that the Kazerun fault (KF), the Izeh Fault correspond to a series of roughly N–S striking linear uplifts along preexisting basement trends (
Figure 1). Structural transect shows an abrupt drop in amount of shortening from approximately 16% in the Izeh zone to 6% in the Dezful Embayment. This study reveals that probably the Middle to Post Miocene shift of sedimentary depocenter to the southwest allowed rapid subsidence and thick accumulation of the Fars Group in the Dezful Embayment. Progressive deformation following the obduction of oceanic crust caused the depocenter to migrate southwestward during the Eocene. Later in the Oligo-Miocene during closure of the Neotethys and Zagros orogeny, vertical movements, which are interpreted as a bulge effect, affected the sedimentary basin southwest of the Izeh zone.
Using remote sensing and GIS techniques to interpret structural features in GIS environment is one of the advantages of geoinformation technology for present and future research works. The combination of field data with remote sensing satellite images could produce more accurate and validate maps in GIS environment. 3D of surface and subsurface of the study area enable analysts to better interpret behavior of the tectonic and geomorphology processes throughout the geological time scale. The study emphasizes the use of 3D for enhancing structural features based on digital raster process (DRP) in a remote sensing and GIS environment.
However, integration of spatial and non spatial data with overall mathematical calculation in GIS environment showed 4,897 m subsidence of Dezful embayment from the end of the Eocene (37 million years ago). The mean rate of subsidence is 4,897 meter/37,000,000 years which is equal to 0.13 mm per year from end of Eocene to present. The results also showed that 533 meter uplifting has been seen due to fault activity from the end of the Eocene. The mean rate of uplifting is 533 meter/37,000,000 years which is 0.015 mm/year.


