1. Introduction
In 2014, one third of Albertans were employed in the upstream oil and natural gas industry contributing
$10 billion in government revenues and 40% of Alberta’s gross domestic product [
1]. Despite the decrease in these values in 2015, and difficulties with mining, the Canadian oil sands remain a high value commodity with 170 billion barrels of recoverable reserves [
1,
2]. Strategies to utilize the existing, and future, waste products from oil production are critical for the nation, from both economic and environmental perspectives. Moreover, utilizing it in a carbon advantage process is important for the control of greenhouse gas emissions (GHG). The polygeneration plant that will be proposed below makes use of Canada’s stockpiles of waste petroleum coke, a high carbon waste product leftover from oil production with little positive market value in southwestern Ontario. The cost of the system is the key parameter that is minimized in optimizing this design. This study will present an overview of the modelling methods used in AspenPlus, MATLAB and VisualBasic; the economic analyses conducted; and optimization technique used for the hydrogen systems and overall for the polygeneration system.
Current uses of petroleum coke include material for cement kilns, anodes for aluminum production and combustion for energy [
3]. These combustion processes are GHG intensive. Further, these uses are niche applications with a much greater petroleum coke production rate than existing demand. In Alberta alone, 57 million metric tonnes (MMT) of petroleum coke are available in storage with a production rate of 6 MMT per year [
4]. A continuous processing method for petroleum coke would be preferred rather than combustion applications [
5]. The challenges associated with petroleum coke processing are the high CO
2 emissions and low efficiencies in its combustion. Currently, the Canadian government is providing incentives to companies to use environmentally clean technologies by an introduction of a
$50 per tonne CO
2 carbon price by 2022. In Ontario, energy surplus has originated from a systematic increased reliance on nuclear power over the past decade, the rapid increase in wind power, and a decrease in power consumption across the province [
6]. During off-peak hours, Ontario sells a large amount of its electricity to Manitoba, Quebec and the North-Eastern States. In 2014, Ontario exported about 14,600 GWh at below wholesale prices. This results in a large net loss for the provincial electricity system. The use of combustion to produce electrical energy, and generate more CO
2 emissions, is currently unreasonable for the province of Ontario. There is a large incentive to find more environmentally friendly uses for petroleum coke which do not result in an end product of electricity.
An alternative to combustion is gasification, which releases abundant volatile components and minimal CO
2 from the conversion of carbonaceous feedstocks [
7,
8,
9]. The gasification of petroleum coke produces carbon monoxide (CO) rich syngas, which requires hydrogen addition, along with further downstream processing to create high value chemical products. The installation of a gasification unit is expensive and may be uneconomical if only a single downstream product is produced in a market with fluctuating demand. To safeguard against such a circumstance, polygeneration is considered. Polygeneration is defined as a system of businesses, working in close proximity, which gains economic and environmental benefits by collaborating on the management of resource and environmental issues [
10]. With regards to chemical processing, this refers to several plants sharing materials or energy between different processes to economically produce diverse product mixes at fluctuating market demand. Polygeneration systems are sometimes referred to as “EcoParks”.
Polygeneration processes have arisen out of mutual interests between nearby stakeholders around the world. In Burnside Park, Halifax, over 1500 businesses are improving their environmental and economic performance with support from Dalhousie University’s Eco-Efficiency Centre [
11]. Further, in Kalundborg, Denmark, surplus heat from a 1500 MW coal-fired power plant is used to heat over 3500 homes and a nearby fish farm. The power plant supplies other nearby businesses with many other waste materials including fly ash for cement production, excess steam, and gypsum, a by-product from the sulphur dioxide scrubber, which is used in the production of drywall. In addition to the economic benefits, the reduction of heat pollution into a nearby fjord and the reduction in open-pit mining required to meet the gypsum demand are the environmental benefits [
12]. Polygeneration provides businesses of all varieties with substantial cost savings and reduces environmental impact [
13].
Since January 2017, six separate parties have been evaluating the technical and economic feasibility of implementing power-to-gas technology in a polygeneration plant for Rotterdam, Netherlands. Power-to-gas is a methodology of buffering the intermittent and fluctuating electricity that is often associated with renewably-sourced electricity or overproduction of grid power [
14,
15]. The power-to-gas concept purposes to convert the surplus, and potentially curtailed, electrical energy to chemical energy by producing hydrogen which can then be directed in multiple application pathways [
16]. Power-to-gas technologies have already been implemented on various scales around the world [
17,
18]. The European Union has initiatives for hydrogen storage and fuel cell technologies as part of a vision towards a “hydrogen economy” [
19,
20]. Case studies of such hydrogen economy systems using power-to-gas have been conducted on the energy systems in Germany and Italy [
21,
22]. The advantages of power-to-gas is that it integrates well with electrical systems where there are large components of CO
2 free baseload electrical power, intermittent renewable power providing energy storage and distribution without the need for extensive energy distribution upgrades as existing natural gas infrastructure along with potential future hydrogen pipeline infrastructure is used [
21]. The major challenge in the Rotterdam project is that a much larger hydrogen production capacity is needed than in an existing power-to-gas pilot plant developed in Rozenburg. The motivation behind the project is the large cost savings across each party and the reduction of GHG emissions from usual fossil energy sources typically used in such applications [
23].
In the proposed polygeneration process, the conversion of CO-rich syngas to high value chemical products has an optimal hydrogen to CO ratio which is different from the syngas composition produced by petroleum coke gasification. To adjust the ratio, the most popular method of hydrogen production is the conversion of natural gas to a hydrogen-rich syngas through steam reforming, but the process produces a large amount of CO
2 [
24]. Alternatively, electrolysers can be used to convert water and electricity into hydrogen [
25,
26]. If the excess power in Ontario were used to run a polygeneration system by means of power-to-gas, the economic benefits could be distributed back to the locality and the province [
27]. This benefit will be weighed against the fact that electrolysis is normally a more capital expensive method of hydrogen generation than steam reforming [
17,
28]. In this study, steam reforming and electrolysis are coupled as the best option to currently investigate. The proposed project will serve as an example of green technology for the processing of waste product petroleum coke. The region in southwest Ontario was selected for the case study because:
Ontario has excess power that is currently curtailed or sold a deep discount.
This region has ready access to both the electrical grid and natural gas grid.
This region has existing extensive geological storage potential in both salt caverns and depleted petroleum features currently used for natural gas storage.
This region is currently heavily industrialized with similar standalone production facilities at time.
The region currently has facilities and transportation networks that receive large volumes of coke at this time [
29,
30,
31].
A polygeneration process in southwestern Ontario would be beneficial since it would have access to current chemical industries with existing manufacturing capabilities. The region also opens the doors to use the hydrogen directly in various petrochemical processes located in the vicinity. It has been shown that it could also be possible to use hydrogen directly in steel manufacturing processes, which are located in nearby Hamilton, Ontario [
32]. As for a supply of petroleum coke, Sarnia would have ready access to oil sands petroleum coke via rail, since rail lines already exist for shipping crude to the refining core in Sarnia and Detroit. It would also have access to any petroleum coke produced at the local Sarnia refineries.
The power-to-gas “pathway” that is proposed is one where both the hydrogen and the oxygen generated via electrolysis is in a polygeneration process, and this is a novel application that has yet to be presented in the literature. The use of petroleum coke’s use in a polygeneration process has been proposed earlier by Salkuyeh et al. [
33]. The polygeneration processes would produce: electricity, gasoline and diesel via the Fischer–Tropsch process, as well as industrial chemical intermediaries of ethylene, ethane and dimethyl ether (DME). These products were selected to best integrate the waste petroleum coke, the hydrogen and oxygen from the electrolysis units and with a close consideration of carbon pricing. The proposed model evaluates and implements electrolysis to produce environmentally friendly hydrogen with power-to-gas technology and customizes a global optimization algorithm necessary for prediction of downstream production rates. The goal of this work is to have effective petroleum coke utilization, carbon dioxide emissions reduction, and diversifiable production rates for fluctuating market demand.
2. Modelling Methods
A model is developed which determines the feasibility and benefits of implementing water electrolysis to produce hydrogen instead of steam reforming in a polygeneration process. The electricity provided to the electrolysers is obtained from Ontario’s excess electricity which have nearly zero emissions factor since it in made up of nuclear and wind power. Due to the intermittency of this resource, a mixed integer linear programming (MILP) model in MATLAB is used to simulate hydrogen production and determine the sizing of electrolysers, compressors and storage tanks needed to produce the hydrogen demand [
34]. AspenPlus is used to simulate the remaining blocks of the polygeneration process. A nomenclature of the model is given in
Table A1.
2.1. Polygeneration Process Simulation
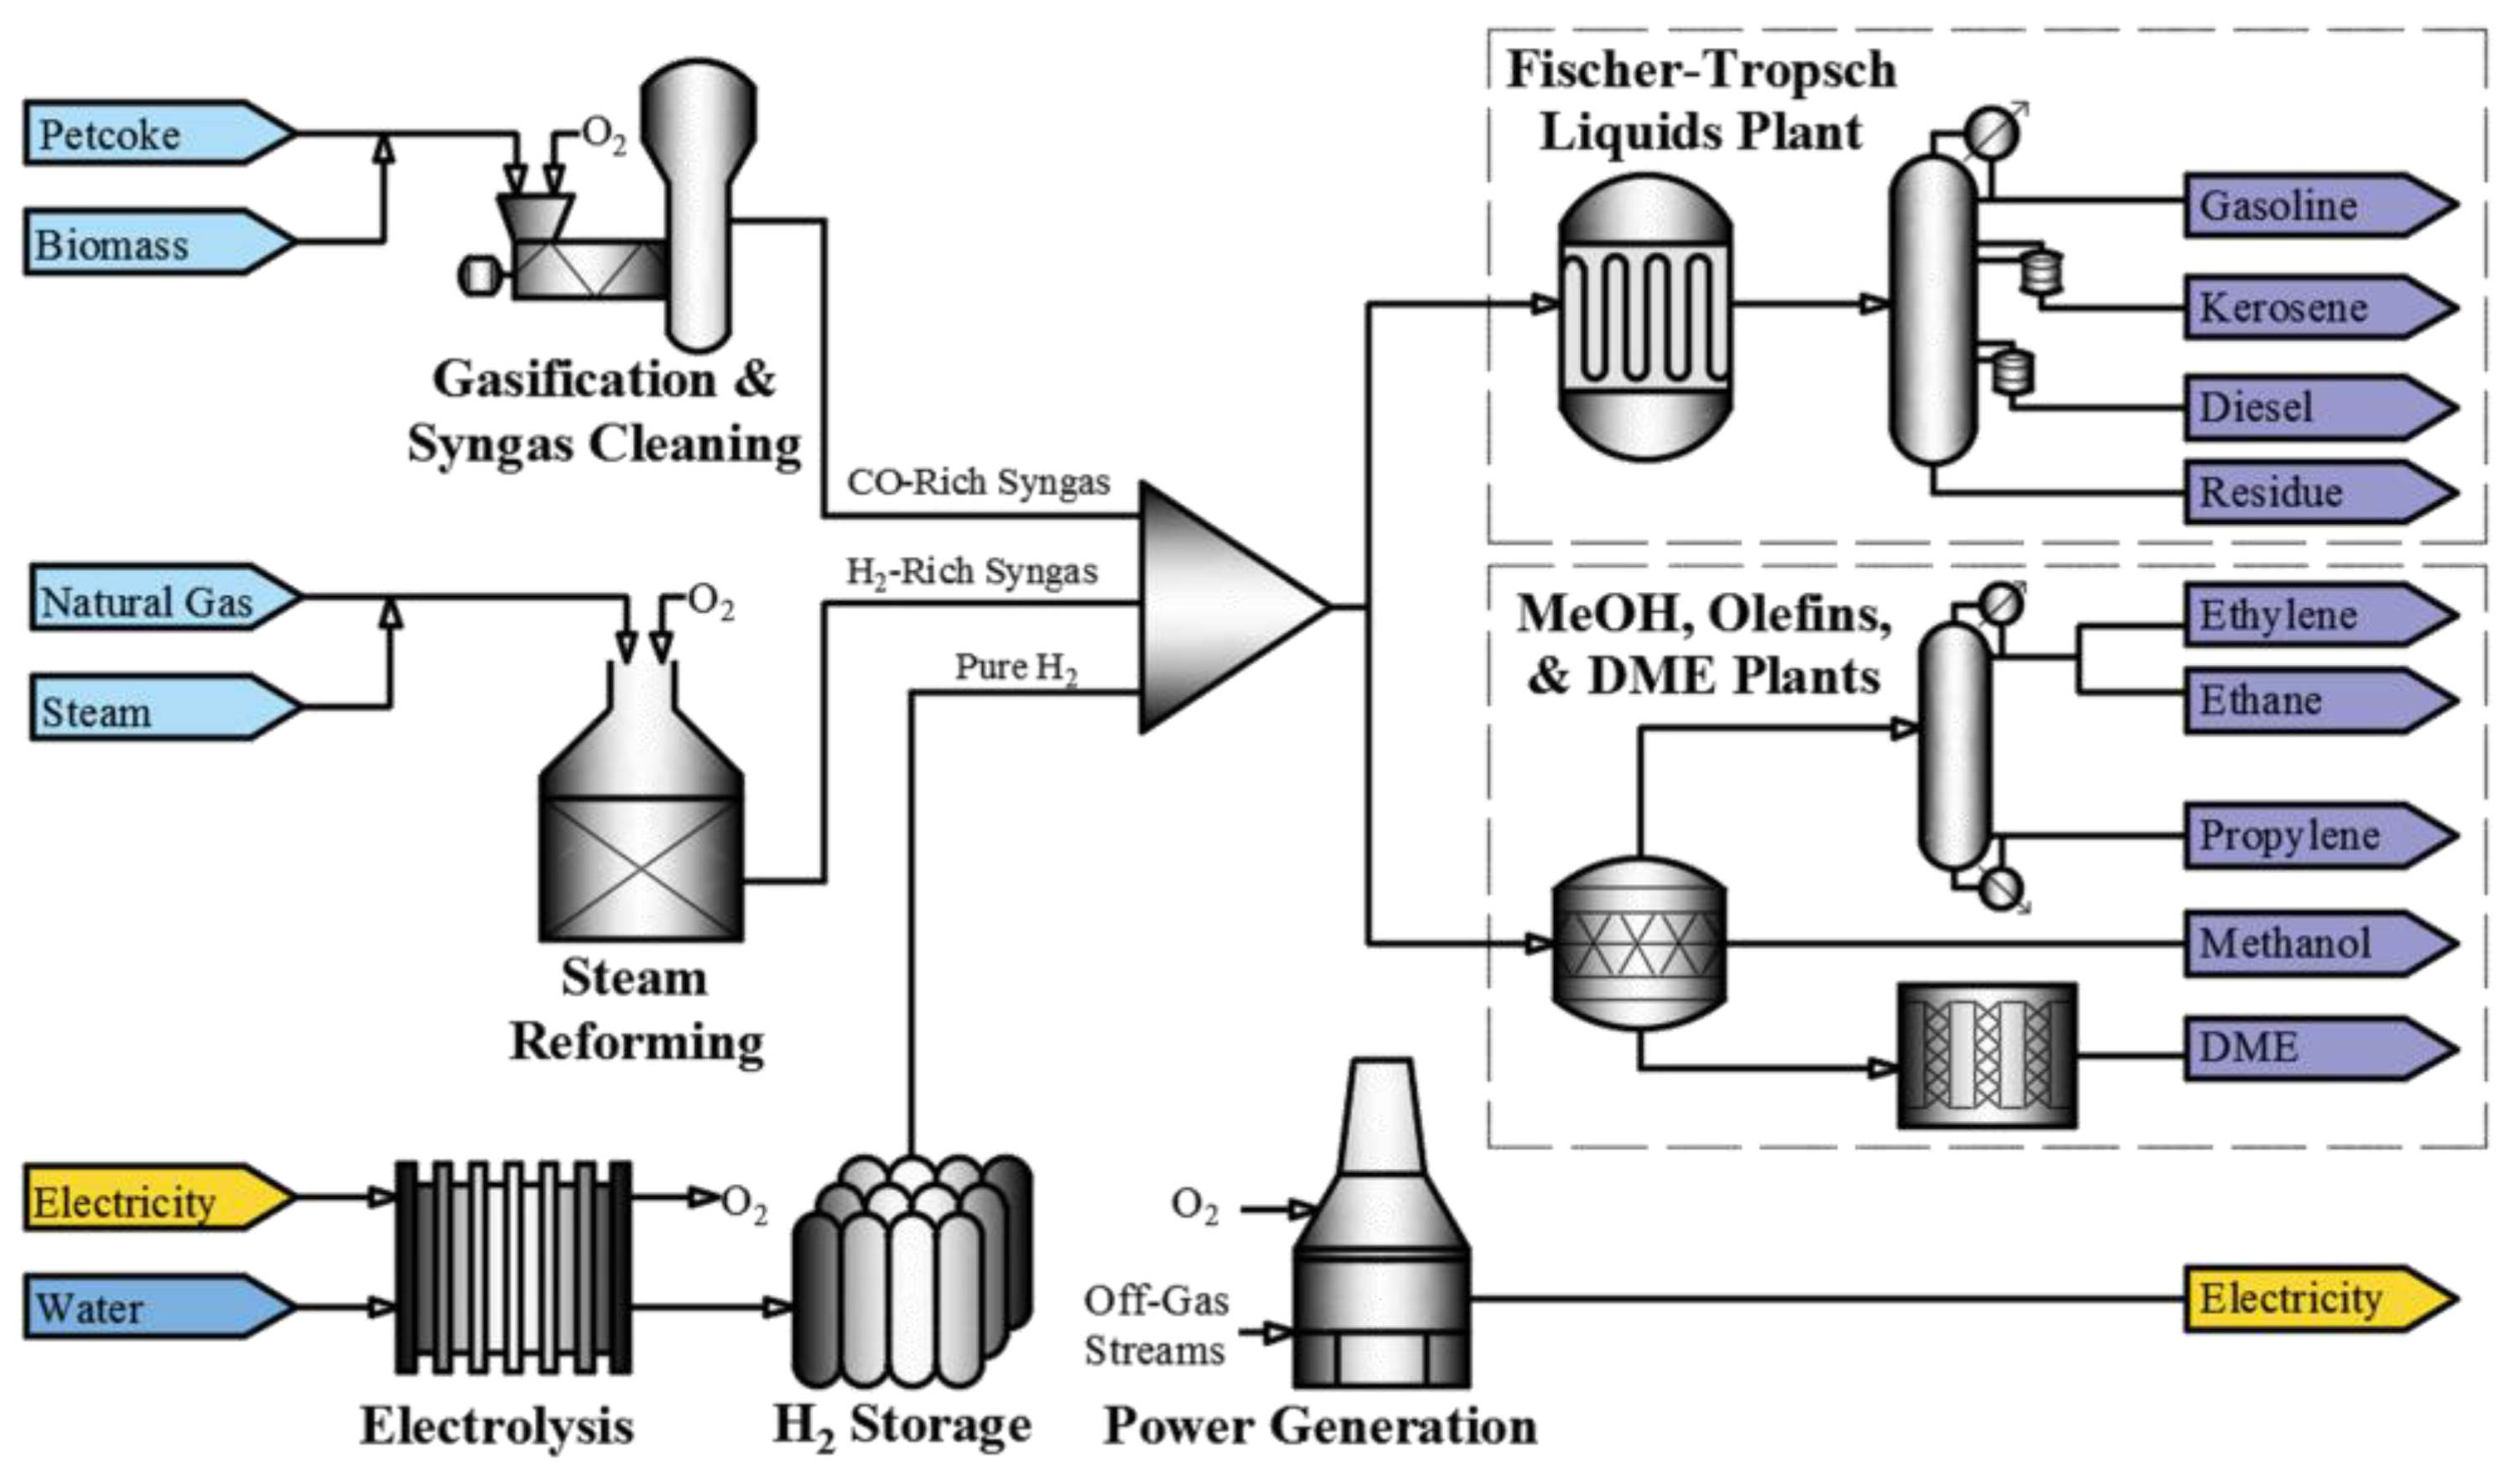
The block flow diagram in
Figure 1 illustrates a simplified version of the overall polygeneration process implemented in this work.
As shown in
Figure 1, the polygeneration process produces a number of products that have been selected to make best use of the petroleum coke, biomass, hydrogen and oxygen. The AspenPlus model blocks used to simulate the polygeneration process are summarized in
Table 1. The block flow diagrams of all the hierarchy blocks are left for the reader to review from Salkuyeh [
33] while only a brief description is provided in this work.
The process starts with the gasification of petroleum coke and biomass. Biomass is used in the gasification process to improve efficiency. The biomass implemented in the model is pinewood with a gross heating value of 19.6 MJ/kg. The raw syngas produced is a rich gas stream of hydrogen and CO. The raw syngas is sent to a chloride scrubber, carbonyl sulphide conversion column and acid-gas removal unit in that order for purification. The cleaned syngas is then sent to the hydrogen blending section of the plant. The 13-POWER hierarchy block converges many off-gas streams from these cleaning blocks, and many other hierarchy blocks, for combustion to produce heat. The heat is used to produce steam, and generate electricity through steam turbines. All excess electricity is not sold but provided to the electrolysis model in MATLAB such that the electricity (generation or consumption) is utilized.
Clean syngas from the acid-gas removal unit is split between the Fischer–Tropsch and methanol plants. The methanol can be sold directly to the market, which in 2015 had a demand of 70 million metric tons [
35]. Due to the likelihood of a saturated methanol market, a methanol-to-olefin (MTO) unit for production of olefins and paraffin’s is included [
36]. The Fischer–Tropsch process converts CO and hydrogen to liquefied hydrocarbons. After cracking, products such as diesel, naphtha and paraffin are produced. The ethanol plant was removed due to low utilization in preliminary simulations [
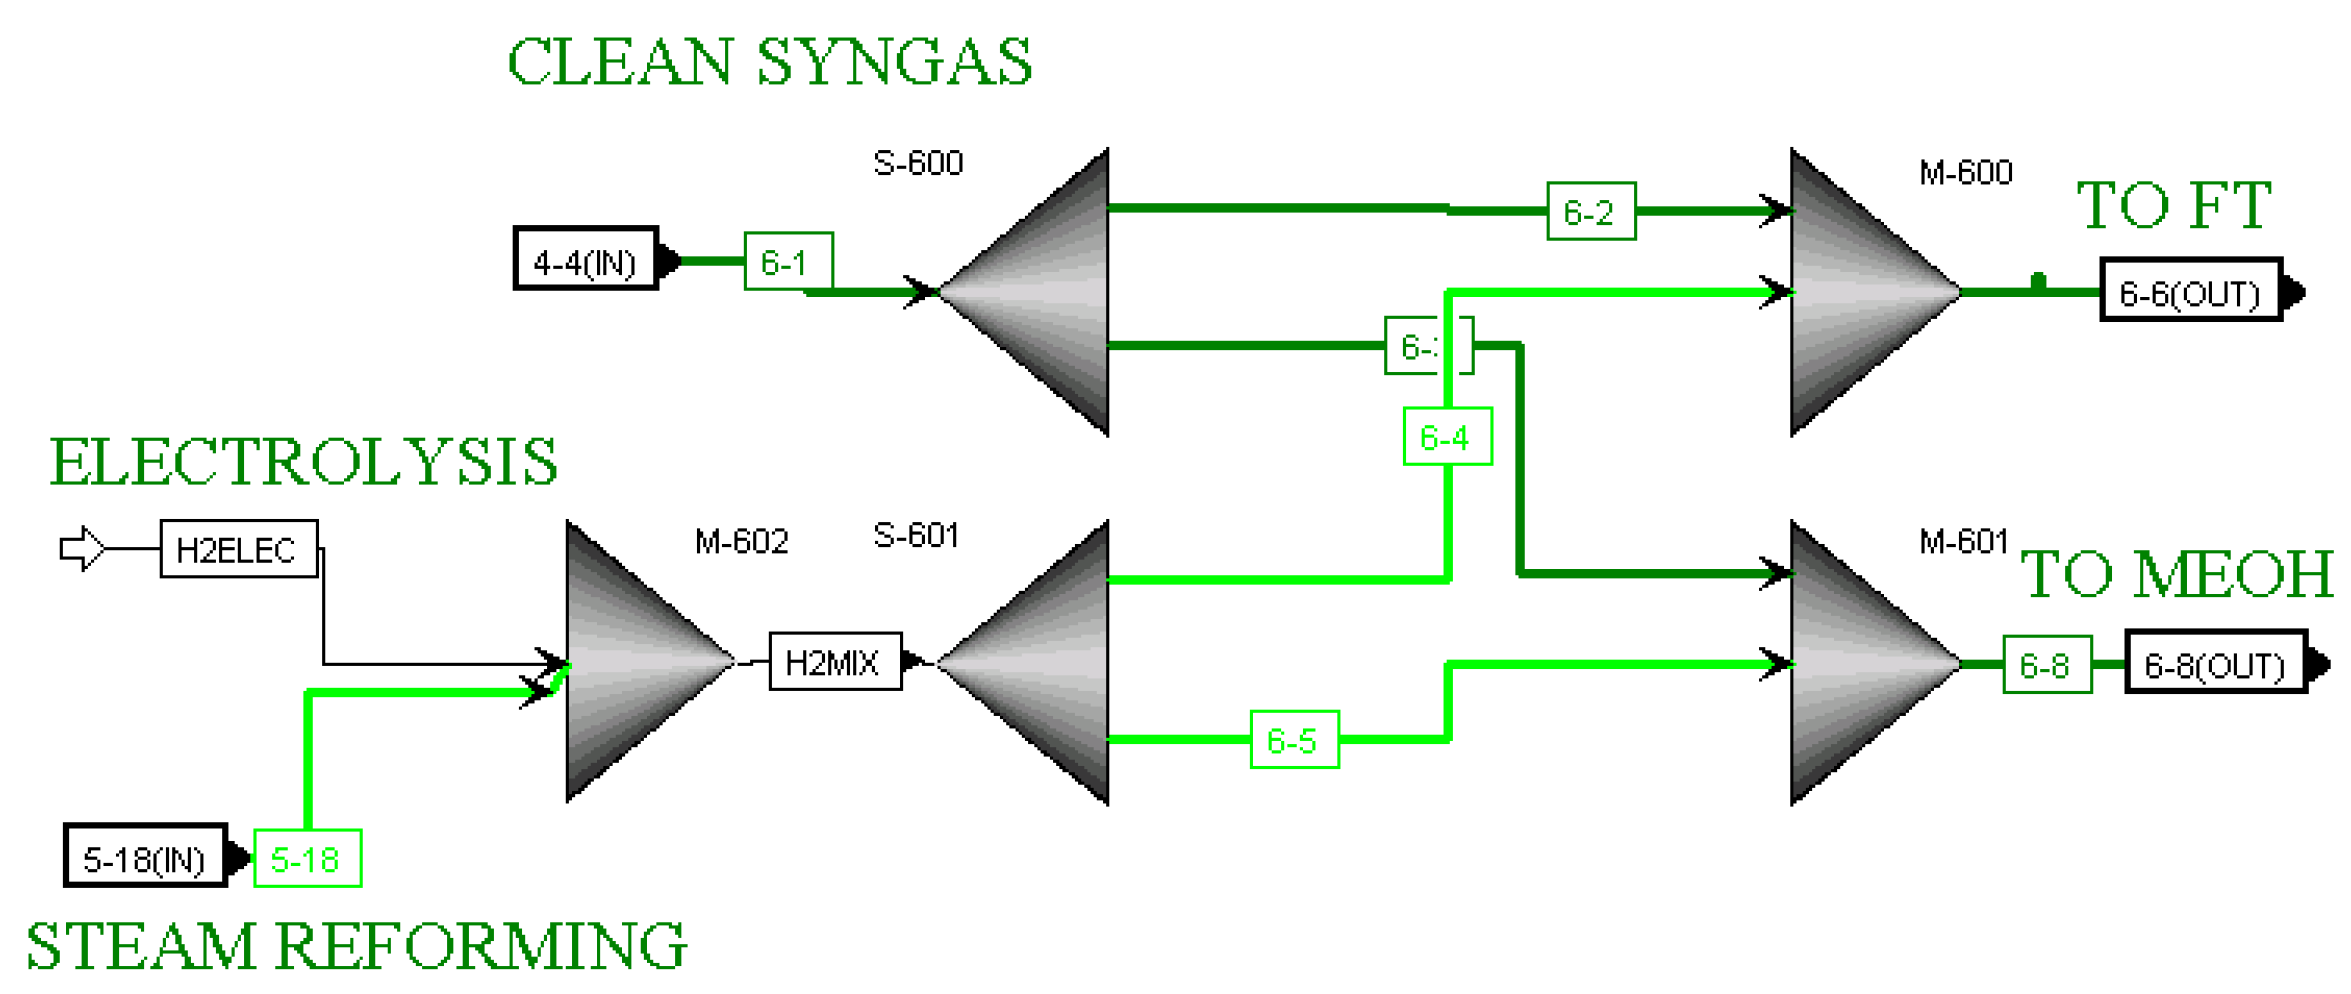
33]. Each of the downstream processes requires a fixed ratio of hydrogen to CO. Ratios 2.09 and 2.78 were utilized for Fischer–Tropsch and Methanol processes, respectively. The hydrogen is provided to the hydrogen blending section of the process, where it is mixed with the cleaned syngas, and split to achieve the required ratios for the downstream processes. The hydrogen was originally produced using only the steam reforming of natural gas, but a hydrogen stream from electrolysers was added into the model as an alternative. For the blending section, the
6-BLEND hierarchy block is shown in
Figure 2. In this block, clean syngas exiting the
4-ACID hierarchy block from the gasification section is mixed with hydrogen produced by steam reforming and/or electrolysis. The process ends with the conversion of the blend of hydrogen and CO into several products, including Fischer–Tropsch liquids (kerosene, gasoline, diesel, and residue), methanol, dimethyl ether, propylene, ethylene and ethane.
The decision variables dictate the downstream production rates, and are defined as the split ratios of raw material between production plants. In
Table 2, the six decision variables are outlined. The decision variables are categorized into input (1–2) and downstream variables (3–6). The first objective is to determine reasonable values for
DV1 and
DV2 since their optimization will require consideration of system behaviour and operational limitations due to technological shortcomings. The hydrogen production design space is probed with simulations run at a total hydrogen input of: 7600, 10,100, 12,600 and 15,100 kg/h. The fraction of hydrogen produced from electrolysis was varied 0–100% by 10% increments for each of the four cases. The remaining four decision variables are held constant at values in
Table 2 from previous simulations to provide a basis for the determination of
DV1 and
DV2 [
33].
The total hydrogen input (DV1) fixes the total products produced in the system. The total hydrogen in the system is mainly produced by the steam reforming plant and the electrolysers, and partially by the gasification reactor. The fraction of hydrogen produced via electrolysis versus steam methane reforming (DV2) also controls the amount of CO production since electrolysis produces no CO. Thus, as the fraction of hydrogen produced by electrolysis is increased, the fraction of both the hydrogen and CO produced by the steam reforming decreases. To offset the decrease in CO, the gasification reactor feed is increased to produce more CO.
After determination of
DV1 and
DV2, the AspenPlus model’s operational equations were expressed as a function of the remaining decision variables to dynamically optimize for maximum NPV while considering carbon emissions in the form of a carbon price of
$50/tonne CO
2. Particle swarm optimization (PSO) is used as a stochastic optimization technique to determine the optimal product portfolio in the polygeneration design [
37]. These operational equations consist of expressions that guarantee control of the hydrogen and CO ratios to the Fischer–Tropsch and Methanol sections of the polygeneration process by dynamically adjusting the hydrogen, CO, natural gas, petroleum coke and biomass feed rates. The total hydrogen produced in the electrolyser and steam reformer is a function of the total hydrogen production (
DV1) and the fraction of hydrogen produced by electrolysis (
DV2).
The total CO necessary is calculated from the total hydrogen production (
DV1) and fraction of clean syngas sent to the Fischer–Tropsch plant (
DV3).
To obtain the natural gas feed rate to the steam methane reformer, the hydrogen and CO production in the gasifier and steam reforming are linear functions of the feedstock of each respective plant. The linear functions for both processes were obtained by running simulations in AspenPlus and performing linear regression. A similar procedure was completed for the petroleum coke and biomass feed rate into the gasifier.
The Fischer–Tropsch and Methanol plants have particular difficulty in expression of their operation with respect to the decision variables since the hierarchy blocks have several RADFRAC columns. To reach convergence, the initial distillate specification of the RADFRAC column must be of the correct magnitude as to the feed to the column. As done for Equations (4) and (5) (NGFR and PFR relations), linear functions are used to describe the operation of the plant from input specifications but with respect to the downstream variables (DV3–DV6).
The method to determine the capital and operational costs for the system components are taken from Salkuyeh et al. [
33]. To calculate the revenue from operation, the feed and product prices are used as given in
Table 3. To calculate the capital and operational costs, while considering inflation, the CE index values are used. The capital costs is expressed with Equation (7) so that the cost calculations dynamically change to input and production rates. S
1 represents the size of a given plant with a known cost C
1 and S
2 represents the size of the new plant whose cost will be C
2. The degression indices, represented by
n are given in
Table 4, along with base plant sizes for when Equation (7) is value for a given unit operation. The plant financial factors are summarized in
Table 5.
2.2. MILP for Sizing Hydrogen System
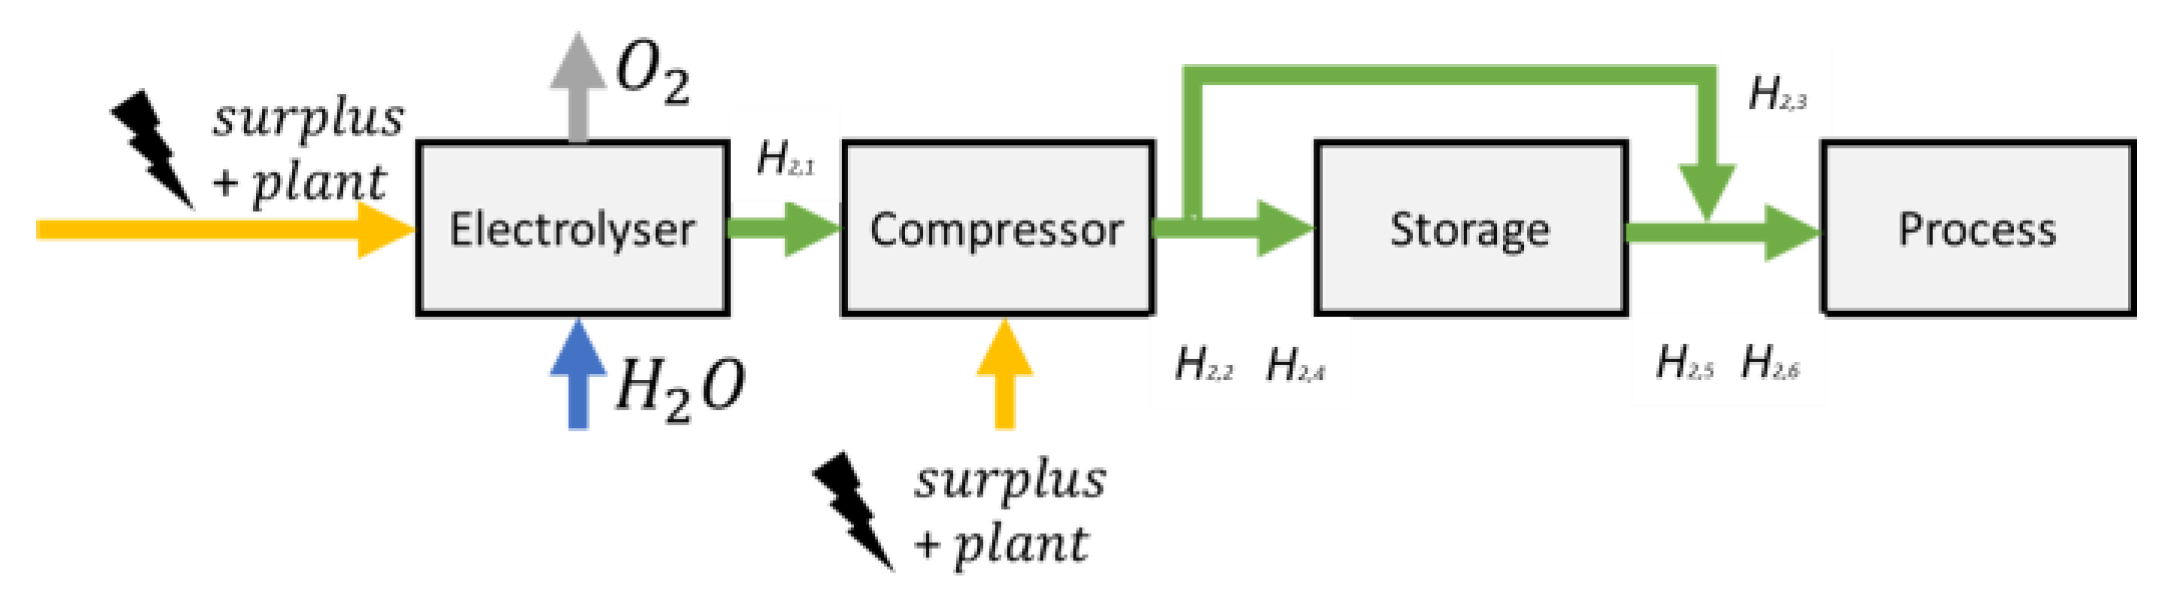
A block flow diagram of the hydrogen production and storage system is illustrated in
Figure 3 with mathematical nomenclature marked along each stream. The electrical input is converted to hydrogen by means of water electrolysis. A compressed hydrogen stream is either sent directly to the process for immediate use or stored for future use when the electricity prices are high and hydrogen conversion is unfavourable. Additionally, excess hydrogen may be produced and stored when electricity prices are relatively cheap for savings on operational costs. The oxygen output of the electrolyser is used to decrease the need for an air-separation unit in its supply of rich oxygen to many parts of the plant. To simplify the model, the following parts were not included in the overall costing, but this is not expected to be significant to the results: water input, transformers, rectifiers and expanders.
The electrical input to the system is composed of the surplus electrical generation in Canada plus the excess electrical generation from the on-site power generation facility on an hourly basis. First, the surplus electrical generation data is retrieved from Ontario’s Independent Electricity System Operator (IESO) website in the form of the 2016 Ontario hourly exports [
38]. Second, all off-gas streams from the polygeneration are directed towards a power generation facility that creates varying levels of power. The system is constrained to use all excess power generation from the plant prior to using surplus electricity from the Ontario electricity grid. Therefore, the system provides minimal disruption to the existing main grid infrastructure and supply-chain network but does alleviate the strains of over production in critical times. Any excess electricity not utilized by the system will be sold through regular channels to neighbouring entities by Ontario’s IESO.
The objective of the model is to minimize the cost of capital, operation and carbon prices while achieving a fixed level of hydrogen input to the process. The mathematical formulation of the optimization is presented below.
In the mathematical formulation, e represents the electricity streams, H2 represent the hydrogen streams, N represents the integer pieces of each equipment with respective costs, pi represents price of electricity, and Cop,c represents the cost of operating the compressor, and the index is for each hour of the year.
Polymer electrolyte membrane (PEM) electrolysers can operate dynamically with the electrical grid which makes them good for power-to-gas, but have only been as large as 135 MW (or 30,000 Nm
3/h) [
38]. Future large scale systems could use 50,000 kg hydrogen/day (or 23,300 Nm
3/h) from initiatives by the United States Department of Energy [
39]. For the modelling, only commercially available units were considered. The selected technologies cost and specifications are summarized in
Table 6.
The total cost of electricity acquired from the grid is the sum of the wholesale price of the surplus electricity and the carbon price associated with electricity used for operation. The wholesale price electricity is based on Ontario’s IESO standards. All electricity consumers using >250 MWh/year pay the Hourly Ontario Electricity Price (HOEP) and the global adjustment as a percentage of how much electricity is used during peak demand [
38]. This is the same price that Ontario currently sells excess electricity to neighbouring provinces and states. The cost of electricity also includes an environmental penalty by multiplying the cost of the carbon price with a carbon emission factor derived from 2016 Ontario IESO data of hourly electricity sources and respective carbon emissions. The carbon emission value is set to its hourly 2016 value based on a co-relation generated from power generation data from Ontario IESO [
40].
The optimization is subject to the following equalities, inequalities and general constraints. The electrical input into the hydrogen system is less than or equal to the surplus electricity available and the plant electricity at each index. The compressor electrical input can be incorporated with the factor
where
.
To ensure the electrical input into the hydrogen system uses all plant generated electricity, the following inequality is stated. To determine the plant electricity production, the AspenPlus model was run at varying hydrogen production levels and percent contributions from the electrolyser relative to the steam reformers. A linear regression was complete to provide an expression to relate power generation (
y) (MW) by the polygeneration plant to the hydrogen demand (
x1) (kg/h) and percent electrolyser (
x2) in operation. The following linear regression was determined to fit the model best by comparing the adjusted R-squared value between many alternative models.
The hydrogen generation output from the electrolyser is calculated by the conversion factor,
.
A series of material balances for each indexed hour are used to present the flow of hydrogen to and from the compressor, as well as the hydrogen provided to the process.
The level of hydrogen storage in the tanks is monitored with a material balance. The material balance over the storage tank level includes the hydrogen level from the hour previous. The initial storage level is set to the demand of any particular simulation. Further, the minimum tank level is restricted to be more than 10% of the system’s capacity. Finally, all hydrogen is penalized by a run of factor of 5%.
The sizing of the electrolyser, compressors and storage tanks is completed by ensuring that the streams passing through them to reach set demands are always within their capacity.
Finally, the number of equipment are integer values and independent of time while the remaining decision variables are greater than zero for all periods of time.
3. Results and Discussion
The purpose of this polygeneration process is to utilize waste petroleum coke and low cost, low emission electricity in Ontario through the power-to-gas concept of transforming the electricity to hydrogen using electrolysis. In a polygeneration process configuration, a sweet of product can be produced in an efficient and low carbon manner. The key goals of this work are to maximize net present value (NPV), and minimize overall carbon dioxide emissions from the production of all of the products. For every tonne of CO2 produced, there is a carbon price of $50 assigned which will be the minimum price of carbon in Ontario in 2022. To accomplish this, the following stages of analysis are conducted:
Simulate hourly operation of electrolysers, compressors, and storage tanks using a MILP for equipment sizing.
Perform sensitivity analysis of total system scale with relation to the hydrogen supply.
Optimize the downstream decision variables relating to production rates with particle swarm optimization.
Perform the environmental and economic analyses of optimized solution.
The purpose of the MILP model is to provide the costing of the major hydrogen related components for hydrogen produced via electrolysis, and to simulate the operation of the system over a year. The costing profile will be estimated using a linear regression model. A spreadsheet is used to control the polygeneration plant in AspenPlus, which will then use this linear model to dynamically calculate total costs.
3.1. Hydrogen System Equipment Sizing
The MILP model was simulated for hydrogen demands to the polygeneration facility of 1000–15,000 kg/h and ranges of 0–100% contribution of hydrogen by electrolysers versus steam reformers. The model uses all electricity generated by the polygeneration plant prior to using any excess electricity as to place the least amount of burden on the existing electrical infrastructure. The successful yearly operation confirms that at all hydrogen demand scales investigated, the electrolysis process can successfully operate under the regular and historical energy supply conditions. At a hydrogen demand of 15,000 kg/h, only 31% of the excess electrical supply from Ontario is used over the duration of a year of operation.
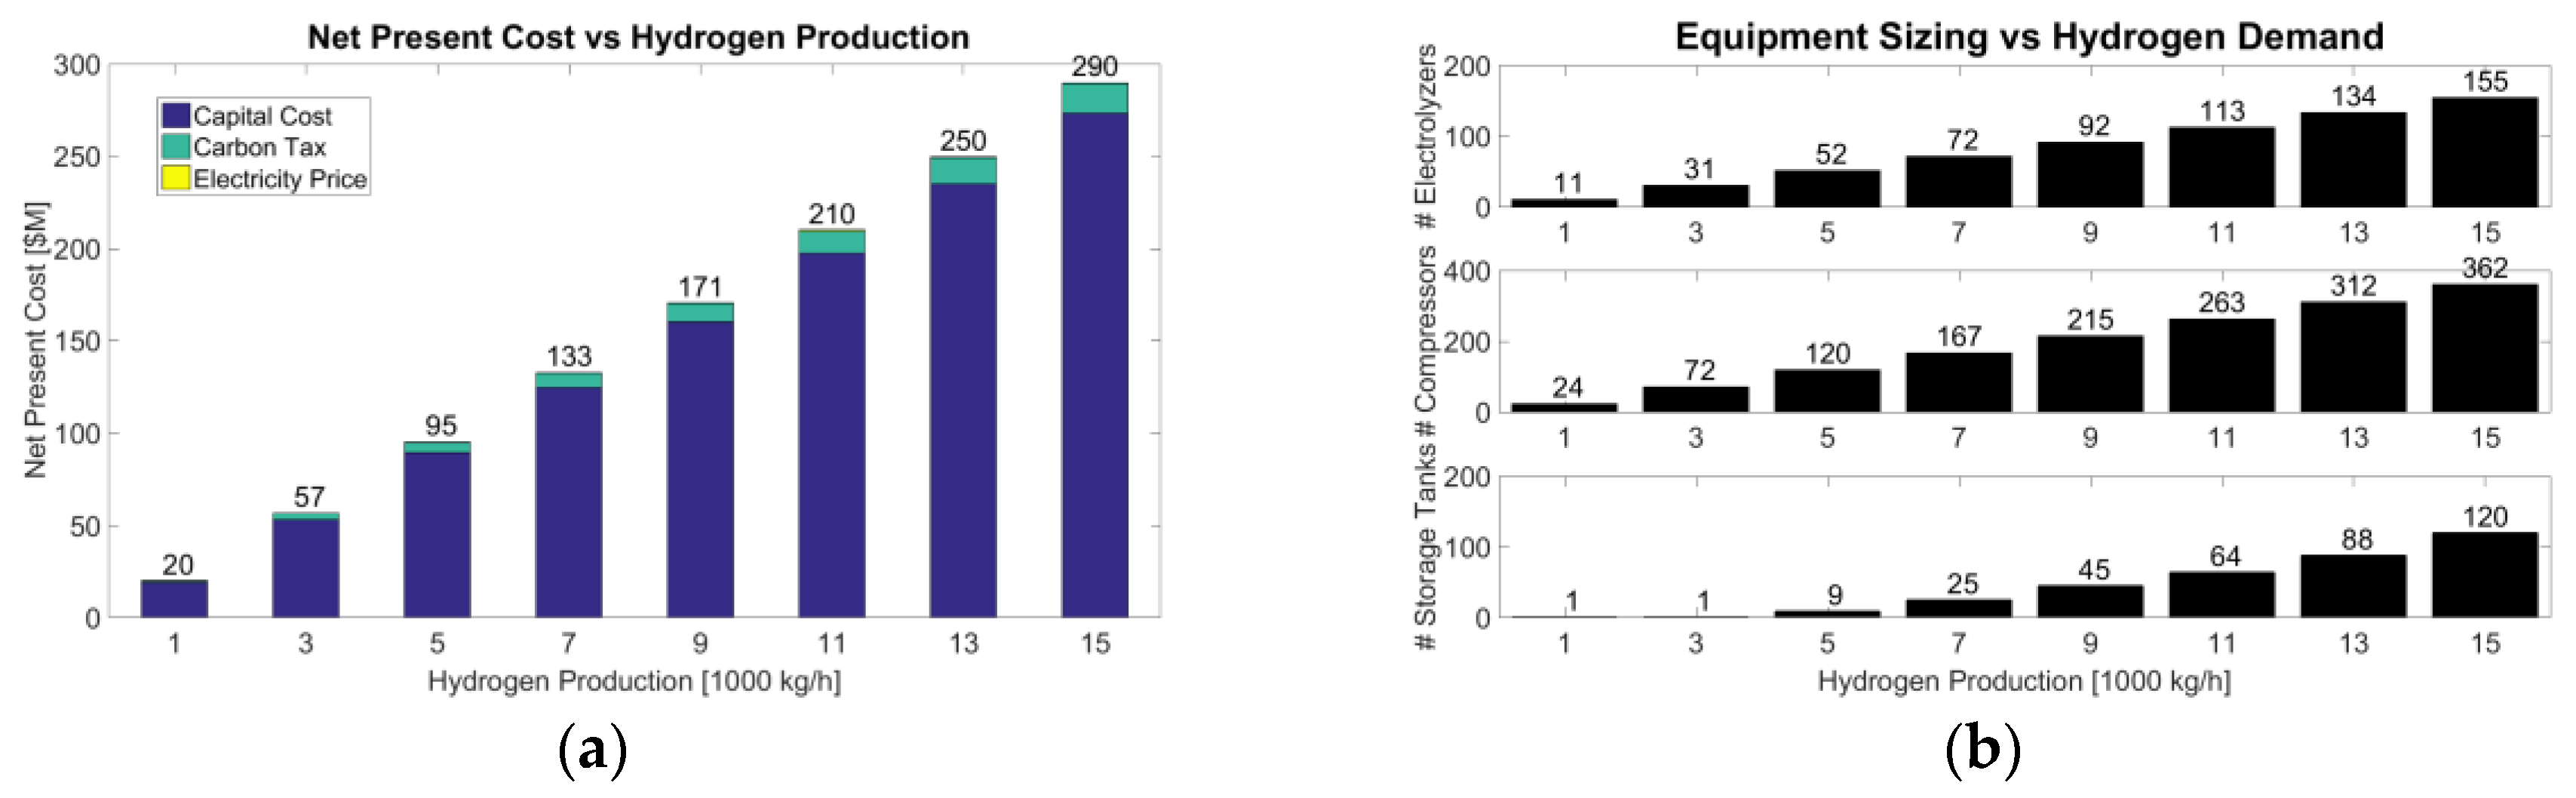
In
Figure 4a, the net present value of the hydrogen system scales almost linearly with respect to hydrogen output of the electrolyser system since only the capital cost is a significant factor. The cost of electricity is insignificant relative to the carbon price for the electricity usage. The MILP model also outputs the recommended number of electrolysers, compressors and storage tanks for all hydrogen scales,
Figure 4b. The costing results of the model are summarized with a linear regression which is dynamically implemented into Aspen Plus for future optimization.
The process variables monitored in the model are electrical input usage from Ontario’s excess demand and hydrogen demand contributions directly from the electrolyser versus the storage tank. Generally, the electrolysers operate near full capacity with slight changes due to fluctuations in the electricity price. Concerning hydrogen supply, the contributions of hydrogen from the electrolyser and hydrogen from the storage tanks show a cyclic contribution of the storage tank due to cyclic electricity prices. The utility of the model is the determination of the sizes of hydrogen equipment. However, the resulting operation only provides a first order assessment of operation feasibility since real operation would require a well-designed control system.
3.2. Operation Sensitivity Analysis
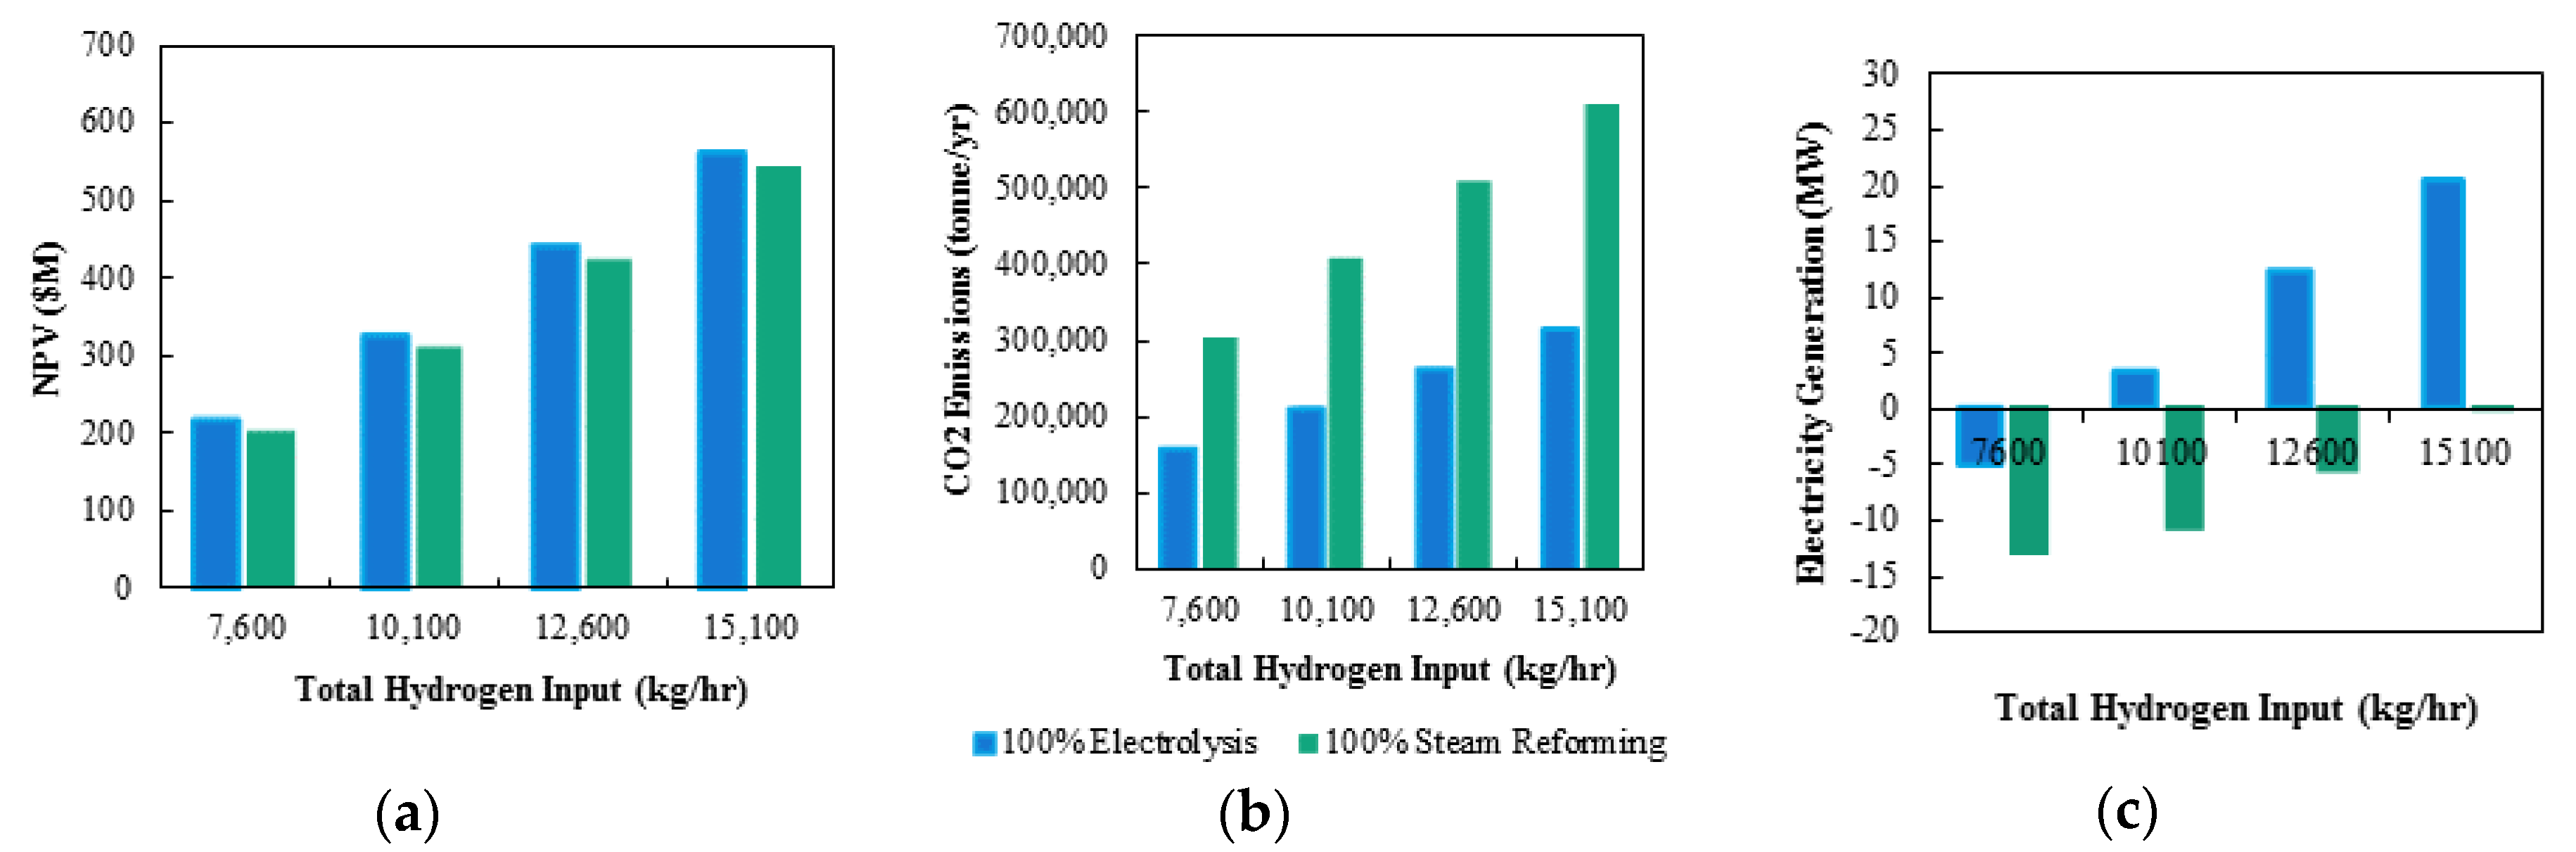
The goal of this section is to find the optimal balance between the two hydrogen production methods with regards to NPV and carbon emissions while selecting a reasonable total hydrogen production level. First, the cases of 100% electrolysis vs. 100% steam reforming production of hydrogen were investigated. The NPVs for the cases are compared in
Figure 5a for four total hydrogen inputs. As the total hydrogen in the system is increased, the NPV also increases. By doubling the total hydrogen in the system, the NPV increases by approximately 2.5. As hydrogen input increase, product generation increases which increases total revenue. Thus, more hydrogen input to the system results in an increase of feed to each of the downstream plants. Concerning hydrogen production, the 100% electrolysis case has slightly higher NPVs than the 100% steam reforming case due to the carbon emissions plot in
Figure 5b. The yearly carbon emissions comparison for the two cases show that, when the total hydrogen in the system is doubled, the total carbon emissions are also roughly doubled creating a difference in NPV due to the carbon price. This is because steam reforming produces carbon dioxide, whereas electrolysis does not. Finally, the electricity generation via the off-gas power plant is compared for the two cases in
Figure 5c. All off-gas streams are sent to the oxy-fuel combustor to produce heat in the form of steam, and subsequently electricity. As the total hydrogen input is increased, there is a larger magnitude of off-gas streams sent to the oxy-fuel combustor and a greater electricity production. Comparing the two cases, 100% electrolysis produces more electricity when compared to 100% steam reforming. As stated earlier, as the fraction of the hydrogen produced via electrolysis is increased, the fraction of steam reforming hydrogen places a larger demand on the gasifier to meet the required CO production is decreased. To balance the lost CO resulting from the decrease in steam reforming production, more feed is sent to the gasifier. However, the equations derived only balance the total CO in the system, and not the total mass flows. Thus, as the fraction of hydrogen produced via electrolysis is increased, a larger off-gas streams is produced as a direct result of the increasing output of the gasification amount, and subsequent gas-clean up plants, and therefore result in a larger magnitude of results in much more off-gas sent to the off-gas power plant, generating more electricity generation.
The use of 100% electrolysis provides a slightly larger NPV due to less carbon price paid resulting from decreased yearly carbon emissions when compared to 100% steam reforming. Note that the NPV is further benefitted from of the electrolysis offset comes from the lack of need for a O
2 separation unit, nor a CO
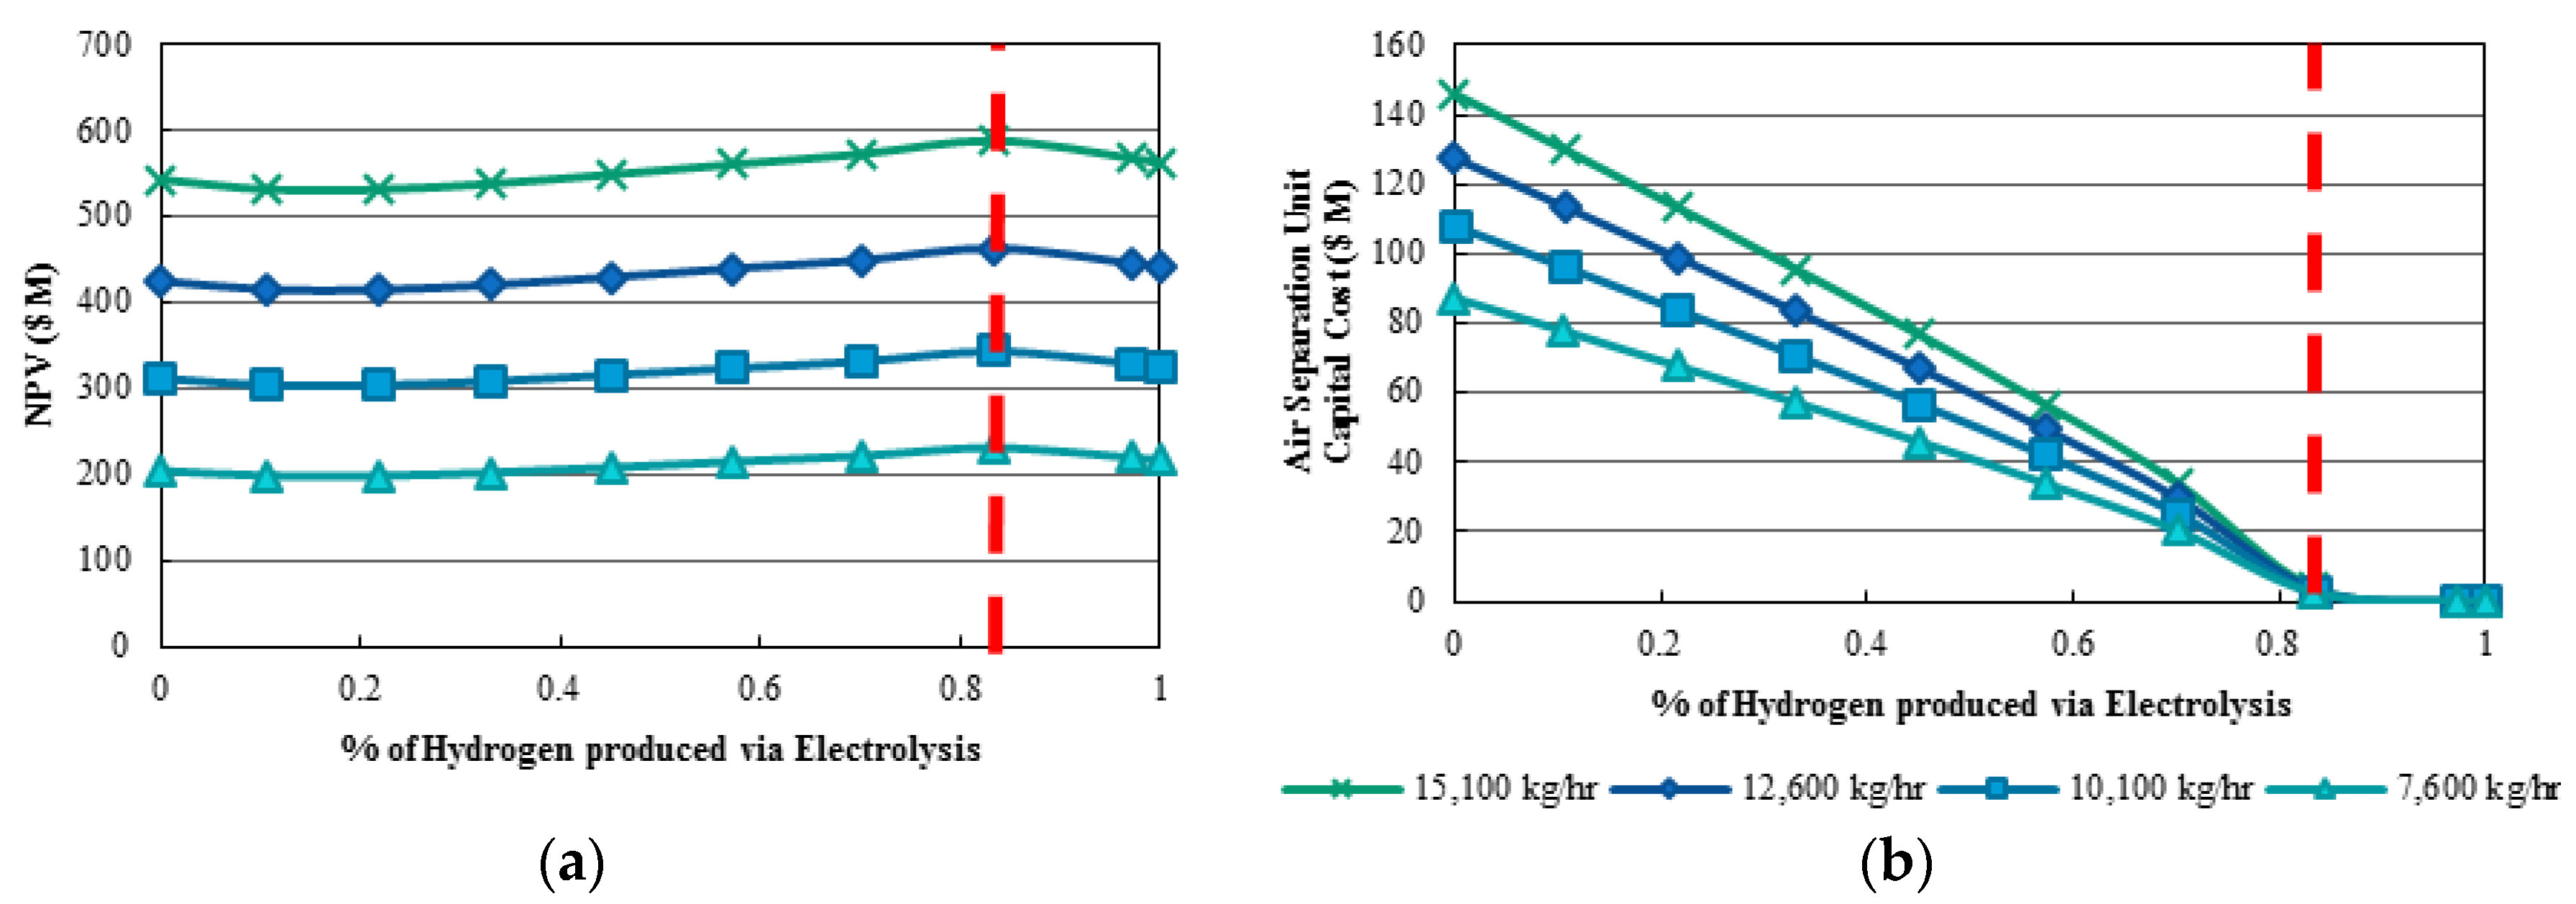
2 liquefaction unit. The optimal percentage of hydrogen produced by electrolysers is investigated. The NPVs for hydrogen inputs at varying percentages of hydrogen produced by electrolysers are shown in
Figure 6a. The NPV for each total hydrogen input increases up until approximately 82% of hydrogen is supplied by electrolysis. This point represents the elimination of the expensive air separation unit used to provide pure oxygen. After this point, the NPV begins to decrease due to no further benefit derived from decreasing capital cost of the air separation unit, which made up 25% of the total capital costs for the 100% steam reforming case. The air separation unit produces pure oxygen required for various plants in the polygeneration process including the gasification reactor, steaming reforming plant, and oxy-fuel combustor. In
Figure 6b, the capital cost of the air separation unit decreases with increasing electrolysis production. However, at approximately 82% of hydrogen supplied by electrolysis, the capital cost for the air separation unit is eliminated. This is the theoretical point where oxygen demand in the process may be satisfied from the pure oxygen produced by the electrolysers.
In addition to NPV, the carbon emissions and electricity generation were monitored in the polygeneration plants. As the hydrogen demand increases, both the carbon emissions and power generation increases. In contrast, as the percent electrolyser used to produce hydrogen increases, the carbon emissions decreases and the electricity generation of the power plant increases. From this analysis, 82% of hydrogen production via electrolysis is demonstrated to be the optimal percentage due to maximum NPV, and significantly reduced carbon dioxide emissions. In regards to the total hydrogen input of the system, anything more than 8000 kg/h of hydrogen is significantly oversized [
41,
42]. Therefore, the selection of 7600 kg/h of hydrogen as the total hydrogen input is chosen due to its more realistic scale, and because the NPV is still positive.
3.3. Optimization of Downstream Production
The optimization of the downstream decision variables is completed with particle swarm optimization to maximize the NPV of the polygeneration process. This analysis will fix the total hydrogen input at 7600 kg/h and 82% of hydrogen will be produced via electrolysis. In regards to PSO parameters, the swarm size was set to 3, and the maximum iterations was specified to be 70. The optimization was completed with two cases. In Case 1, PSO I, the bounds of the decision variables were placed based on simulation stability. In Case 2, PSO II, decision variables were further constrained to show greater product mix. The bounds of the decision variables for both cases, along with the optimal values, are presented in
Table 7. The recycle ratio of unreacted gasses in the methanol plant was not optimized, but kept constant at 93% to ensure adequate off-gas being sent to the power plant.
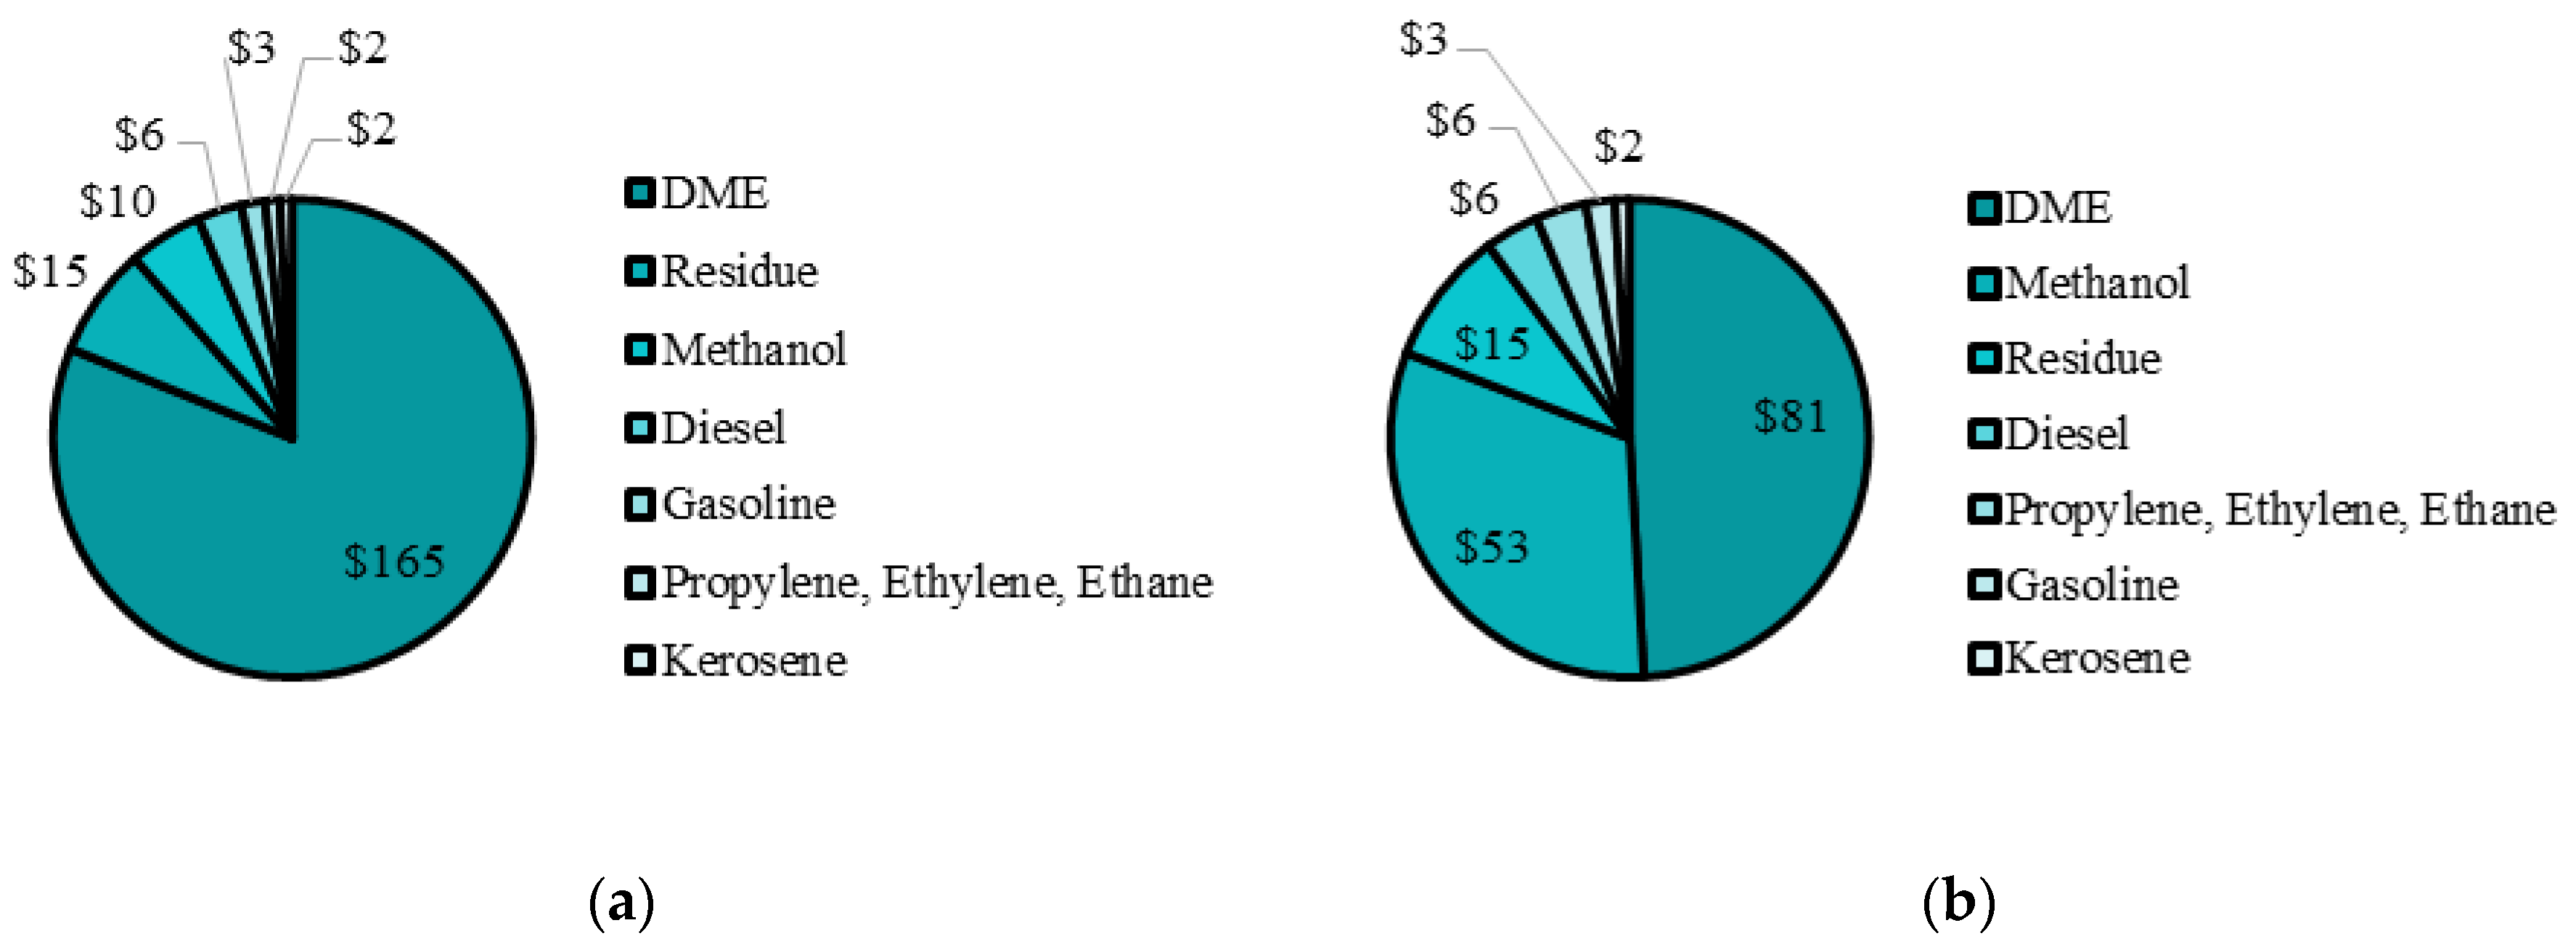
From the PSO I results, DME production was highly favoured, and is at its upper bound. For the remaining methanol, 82% was kept as a product, while the remaining 18% was converted to olefins. Fischer–Tropsch liquids production was minimized and is at its lower bound since methanol products produce more revenue than Fischer–Tropsch liquids. The maximum NPV was
$332 M with over 75% of the product mix being DME. The distribution of revenue from each plant is compared in
Figure 7a. The revenue breakdown shows DME production accounted for over 75% of the total revenue. DME is considered a specialty product since its use is in niche applications such as high pressure diesel engines, implying small market demand. However, DME has potential future uses in diesel engines [
43]. To create a more diverse product mix, the optimization for case PSO II constrained the fraction of methanol sent to DME. A cap of 50% is selected to produce a less heavily skewed product mix. The optimal decision variable values and maximum NPV for such a scenario is shown in
Table 7 and the revenue breakdown for each product is shown in
Figure 7b.
In PSO II, when DME production is capped at 50%, the NPV is
$203 M. The effect of DME production on the system is significant but the total NPV remains positive with additional adjustments possible to be made to match market demand and many social benefits included in building such a facility. For PSO II, the product mix is much more balanced since DME and methanol make up about 49% and 31% of the total yearly revenue, while the remaining revenue is split between Fischer–Tropsch liquids and olefins. The final values for all of the decision variables are presented in
Table 8.
3.4. Environmental and Economic Assessment
The motivation of this work was to determine the most effective way to utilize petcoke in Canada. Three methods of petcoke utilization were compared with constant petcoke input. An environmental analysis is carried out comparing the carbon emissions of the three following cases:
Optimal design with 82% electrolysis and constrained DME production as in PSO II;
Polygeneration process with 100% of hydrogen production via steam reforming; and
An equivalent amount of feedstock petroleum coke being combusted.
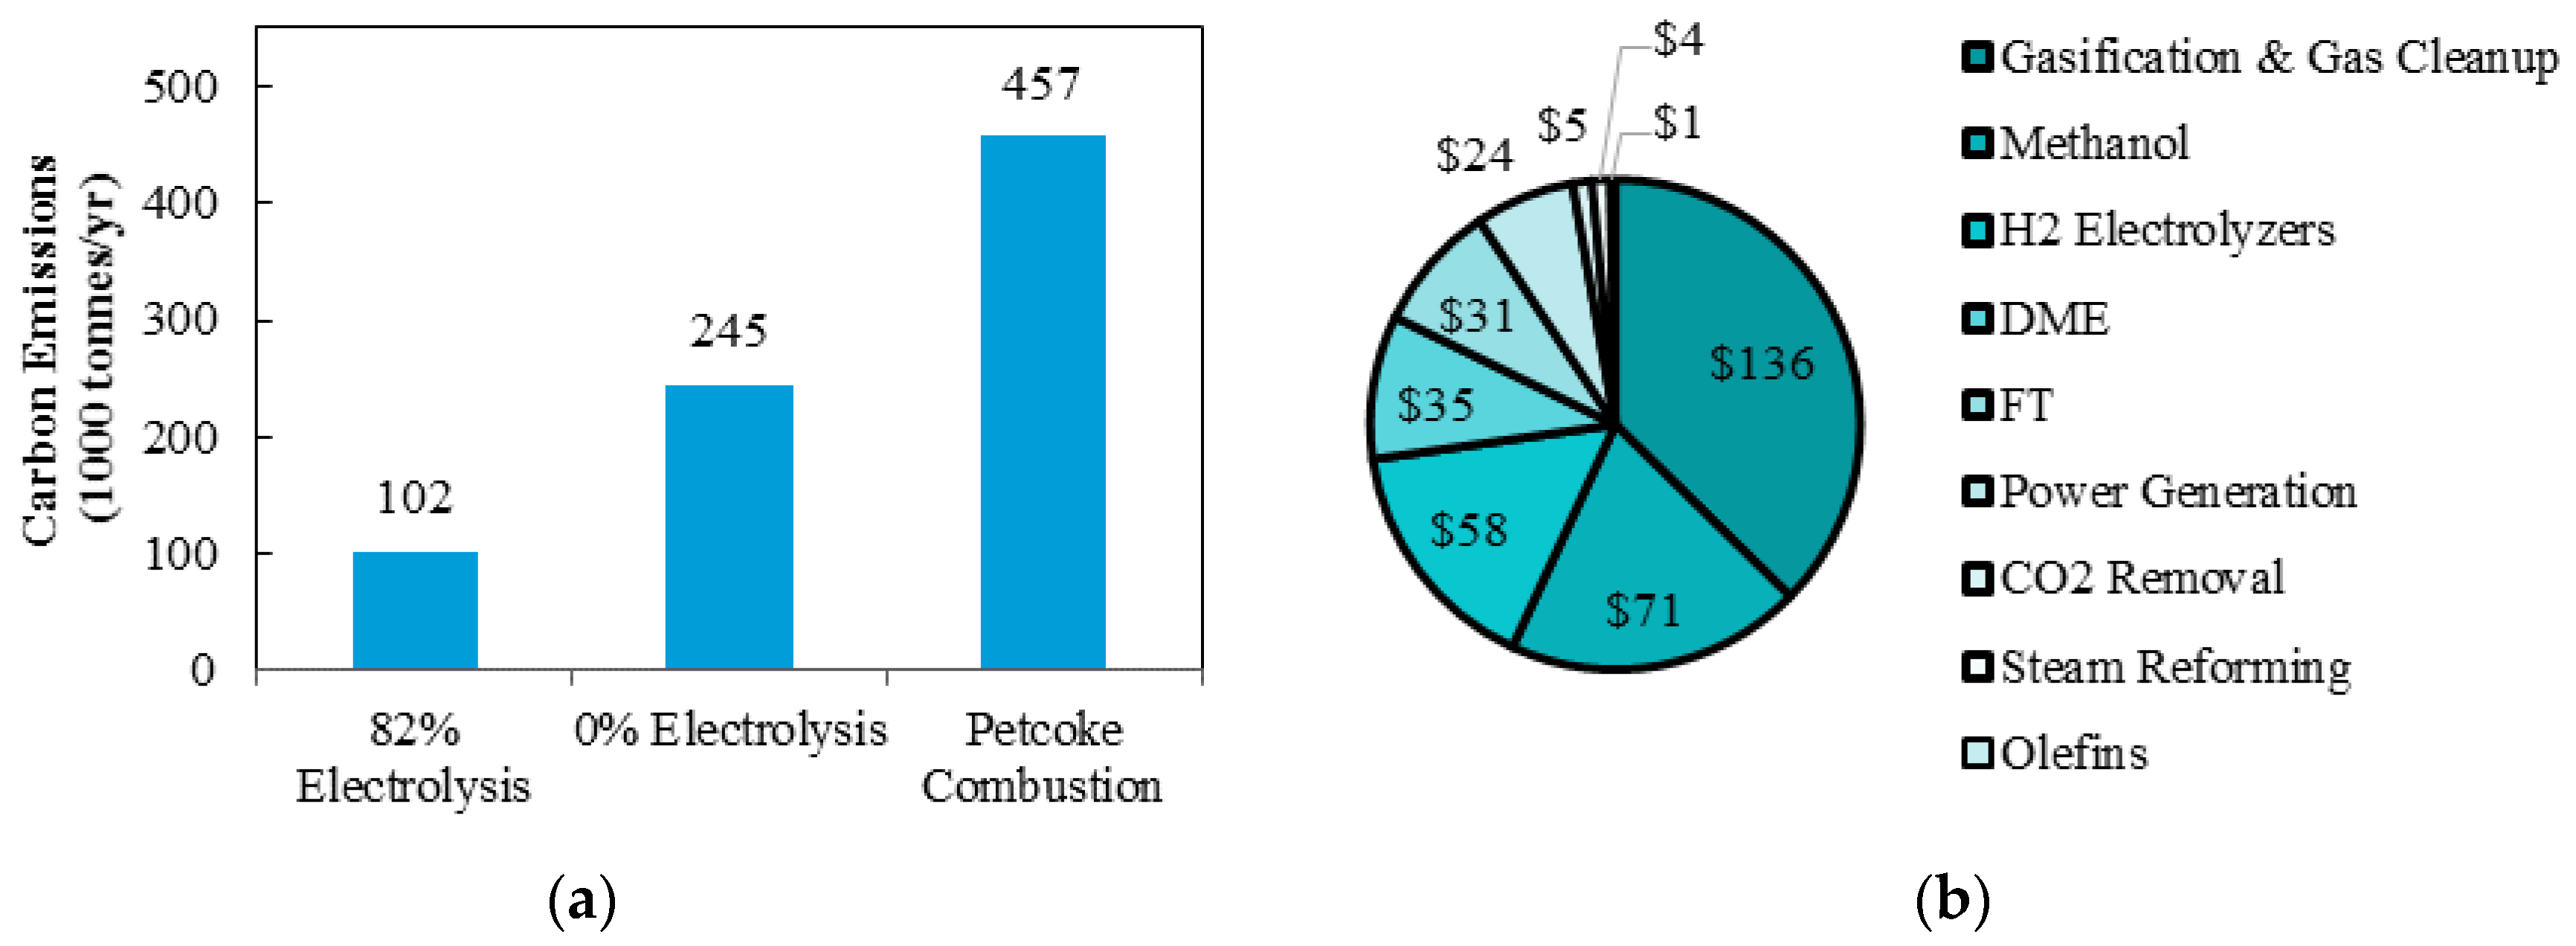
The yearly carbon emissions comparison is shown in
Figure 8a. Implementing 82% of hydrogen production via electrolysis reduces yearly carbon emission by approximately 58% when compared with 100% of hydrogen production via steam reforming. When compared with complete petroleum coke combustion, yearly carbon emissions are reduced by 78%. The capital cost for each component of the polygeneration system is shown in
Figure 8b. The gasification and gas clean-up represents 37% of the total capital cost while only 16% of the capital cost comes from the hydrogen electrolysis system. This is significant, as the cost of using such a clean technology is within the magnitudes of other components in the same system.
An economic assessment of the polygeneration process is presented in
Table 9.
4. Conclusions
The proposed project serves as an example of green technology for the effective processing of waste petroleum coke, as well as the effective integration of low emission factor electricity from grid as a “power-to-gas” application. For maximum emissions reduction and resource utilization, power-to-gas technology is successfully implemented from Ontario’s surplus electricity to produce environmentally clean hydrogen via electrolysis, demonstrating the effective use of clean electricity with a jurisdiction without the need to sell surplus at a loss, nor curtailment of the power generation. Furthermore, the optimal hydrogen production from electrolysis is determined with sensitivity analysis and the downstream production rates are obtained with particle swarm optimization for the economically feasible operation of a polygeneration facility with a diverse product mix. Thus, the polygeneration process both demonstrates the use of a waste product (coke), as well as power-to-gas to generate useful industrial products in CO2 emission reduced methodology.
A mixed integer linear program is used to run 48 hourly simulations with 2016 Ontario electricity export data to generate a linear regression model. The linear regression calculates the total system cost with respect to total hydrogen demand and the percentage of electrolyser contributing to the polygeneration plant. For all hydrogen demands investigated, the operation of the polygeneration plant is feasible to operate with the existing excess electricity in Ontario.
Comparing 100% electrolysis vs. 100% steam reforming as a source of hydrogen production, electrolysis provides a slightly larger NPV due to less carbon price paid as a result of decreased yearly carbon emissions when compared to 100% steam reforming, and the elimination of the need for oxygen generation equipment. The optimal percent of hydrogen produced from electrolysis was determined to be 82% by maximizing the NPV of the production assets, while significantly reducing carbon dioxide emissions. Concerning the total hydrogen input of the system, a rate of 7600 kg/h was determined from sensitivity analysis and commercially available technology. Under this flow rate, the overall production process would use 64 Hydrogenics PEM electrolysers (5 MW each), 149 compressors (42 kg/h capacity) and 18 storage vessels (340-kg capacity). This polygeneration ecopark would only use 12% of the total Ontario excess electricity. For the design, the cost of electricity is less significant relative to the carbon price for the electricity usage and total capital cost.
Particle swarm optimization was used to set the decision variables that would determine the downstream production rates. Particle swarm optimization was run to determine the syngas rate to the Fischer–Tropsch liquids, methanol feed rate to the DME plant and the methanol storage. The maximum NPV was $332 M with over 75% of the production being DME. To create a more diverse product mix, the fraction of methanol sent to DME may be constrained. When the methanol fraction sent to DME is capped at 50%, the maximum NPV was $203 M. Even with a more constrained production rate, the system is still profitable and has room for further constraints as required by market demands. Thus, the plant can dynamically adapt to changing product market demands while remaining profitable.
The optimal design with 82% electrolysis and constrained DMW production is compared to a design with 100% steam reforming and a design using conventional petroleum coke combustion methods for electricity production. The optimal design reduces carbon emissions by 58% and 78%, respectively, or 212,000 and 355,000 tonnes of CO2 per year. Moreover, 37% of capital cost is contributed by the gasification and gas clean-up, while only 16% comes from hydrogen electrolysis system. Finally, although the use of power-to-gas technology with hydrogen electrolysis is a high capital item to add to the system, it provides the Province of Ontario clean and cost effective use of its excess electricity production.
Based upon the current results, it can be observed that incorporating electrolysis into the polygeneration design definitely has significant merit. However, there are still potential areas of further analysis. These include:
Incorporation of stochastic programming as a means to account for the uncertainty of the feedstock and product prices due to market demand;
Design of control systems for electricity input and hydrogen delivery; and,
Elimination of the off-gas power plant, as it is a large contributor to the total carbon dioxide produced in the polygeneration system, or consideration of a methanation or carbon capture progress.

 ,
, 

