Evaluation of Developmental Progress in Some Cities of Punjab, Pakistan, Using Urban Sustainability Indicators


Abstract
:1. Introduction
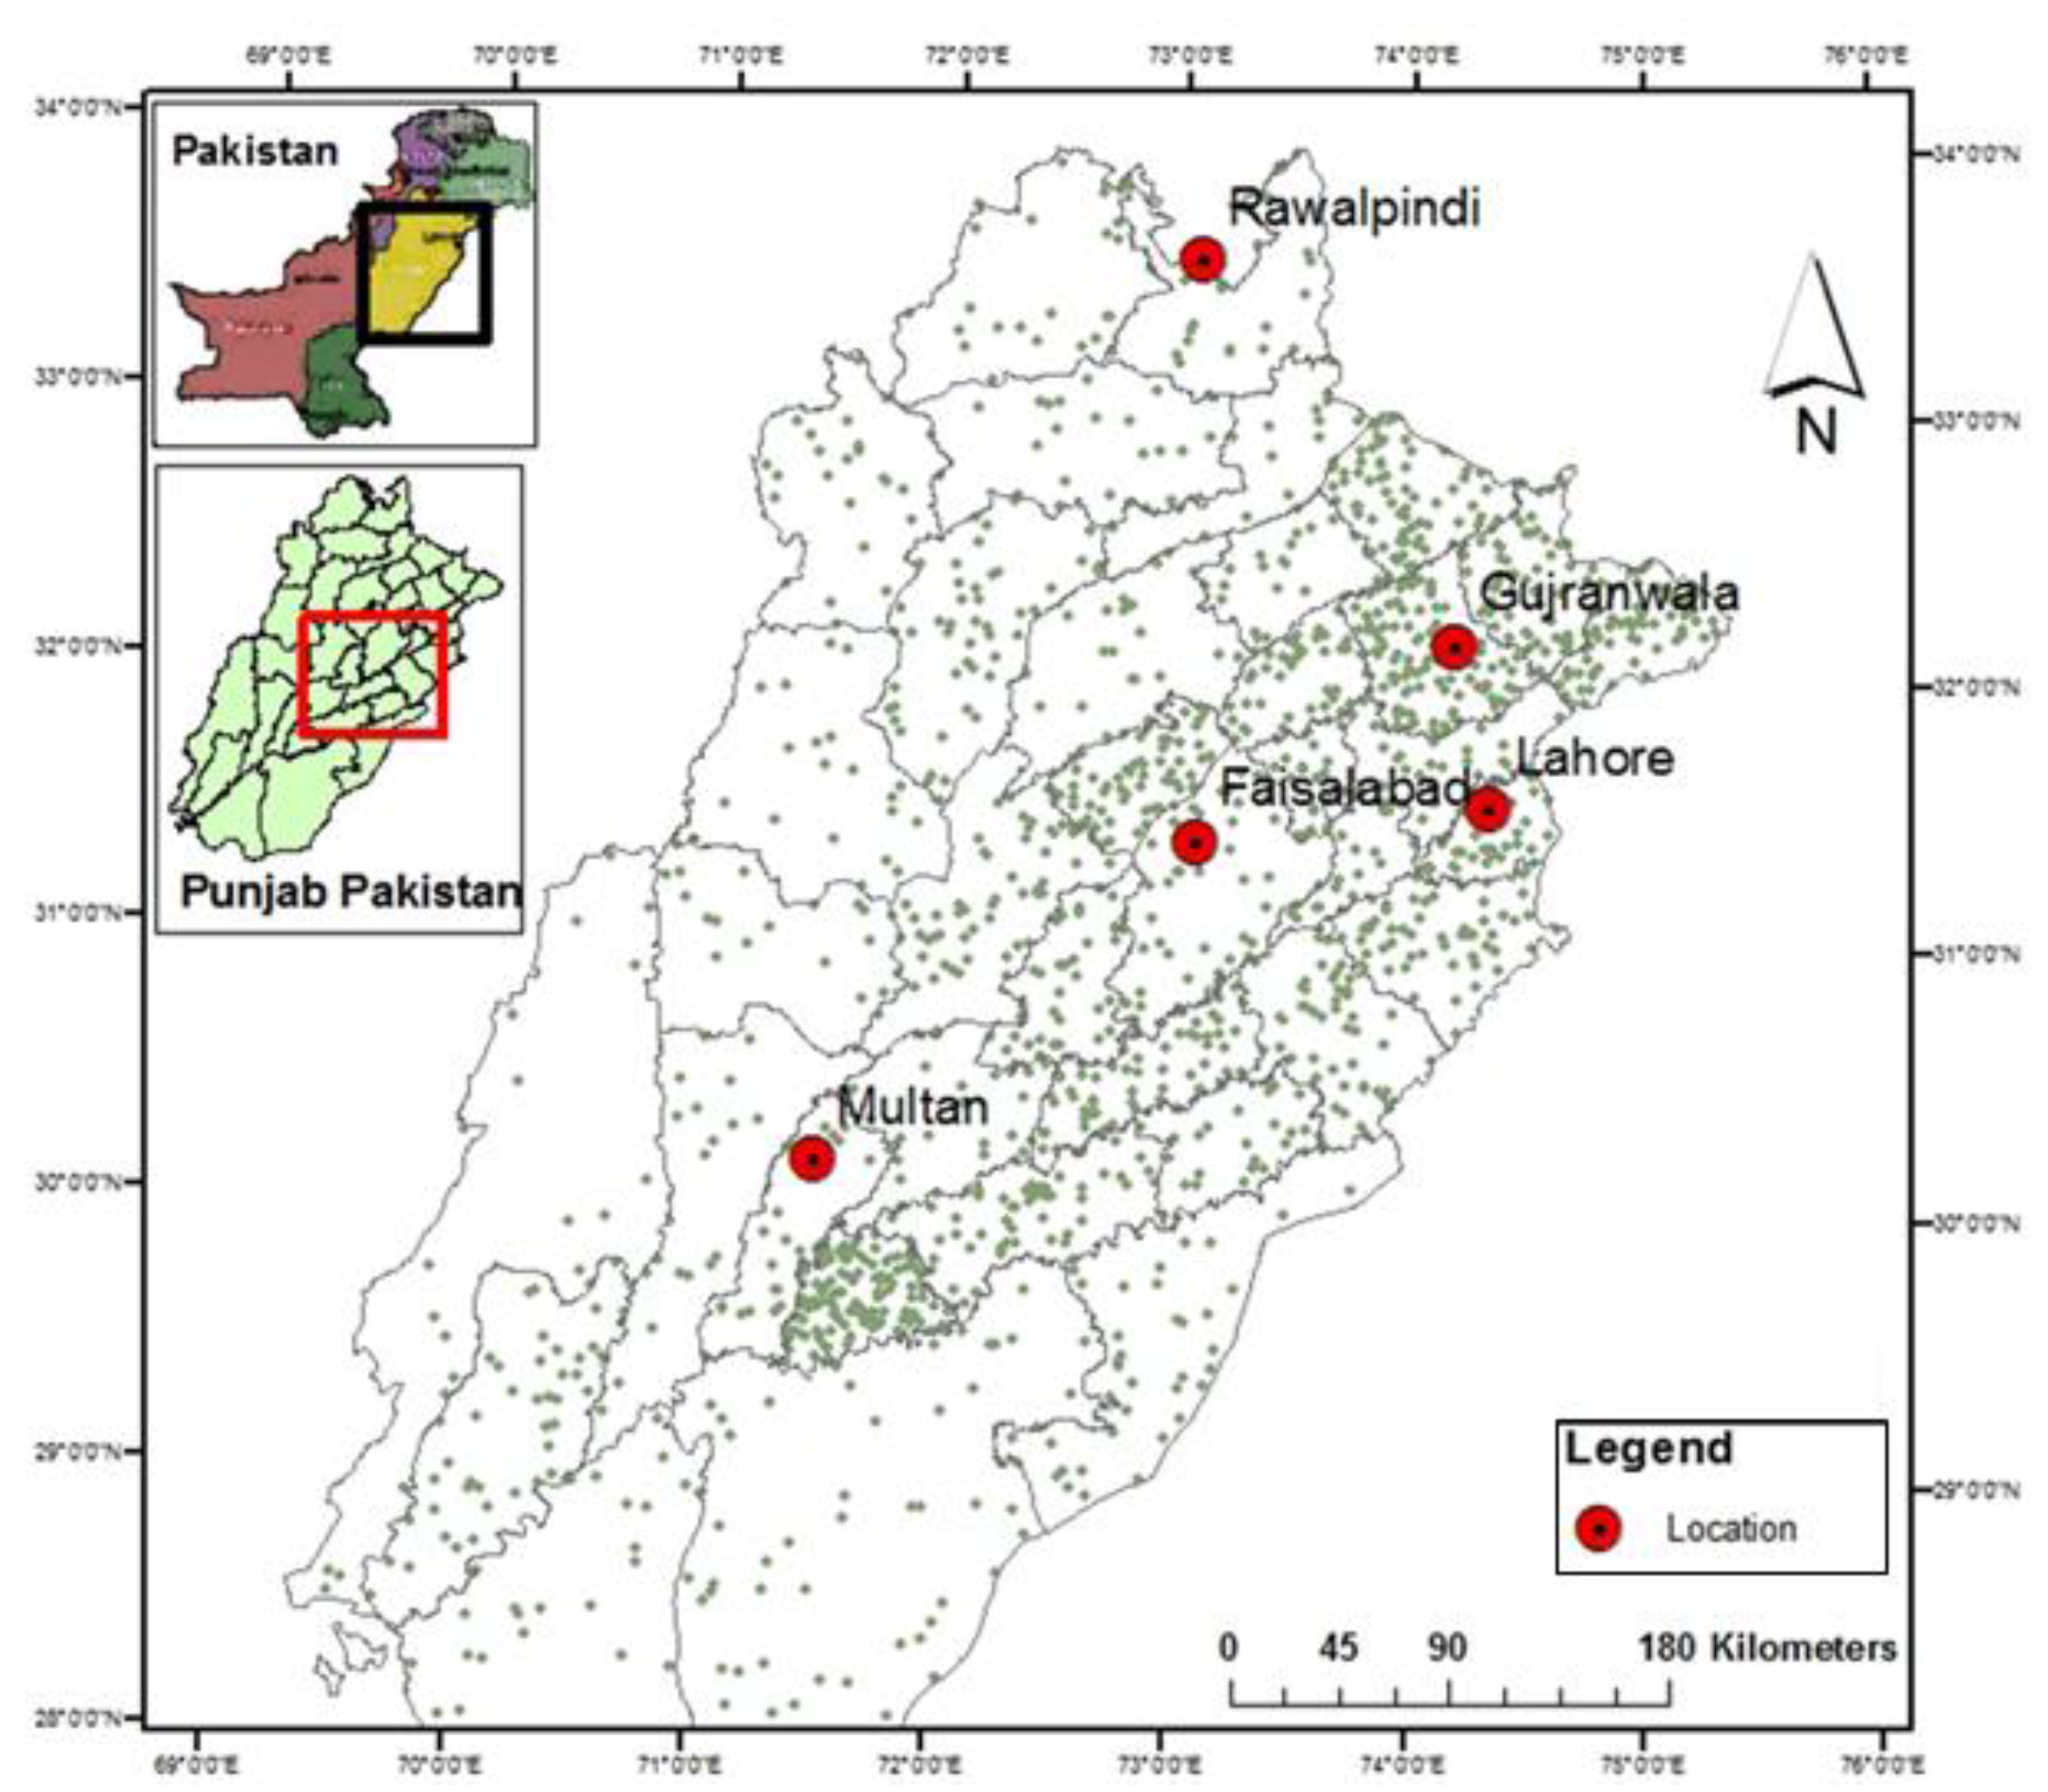
2. Study Area
3. Methodology
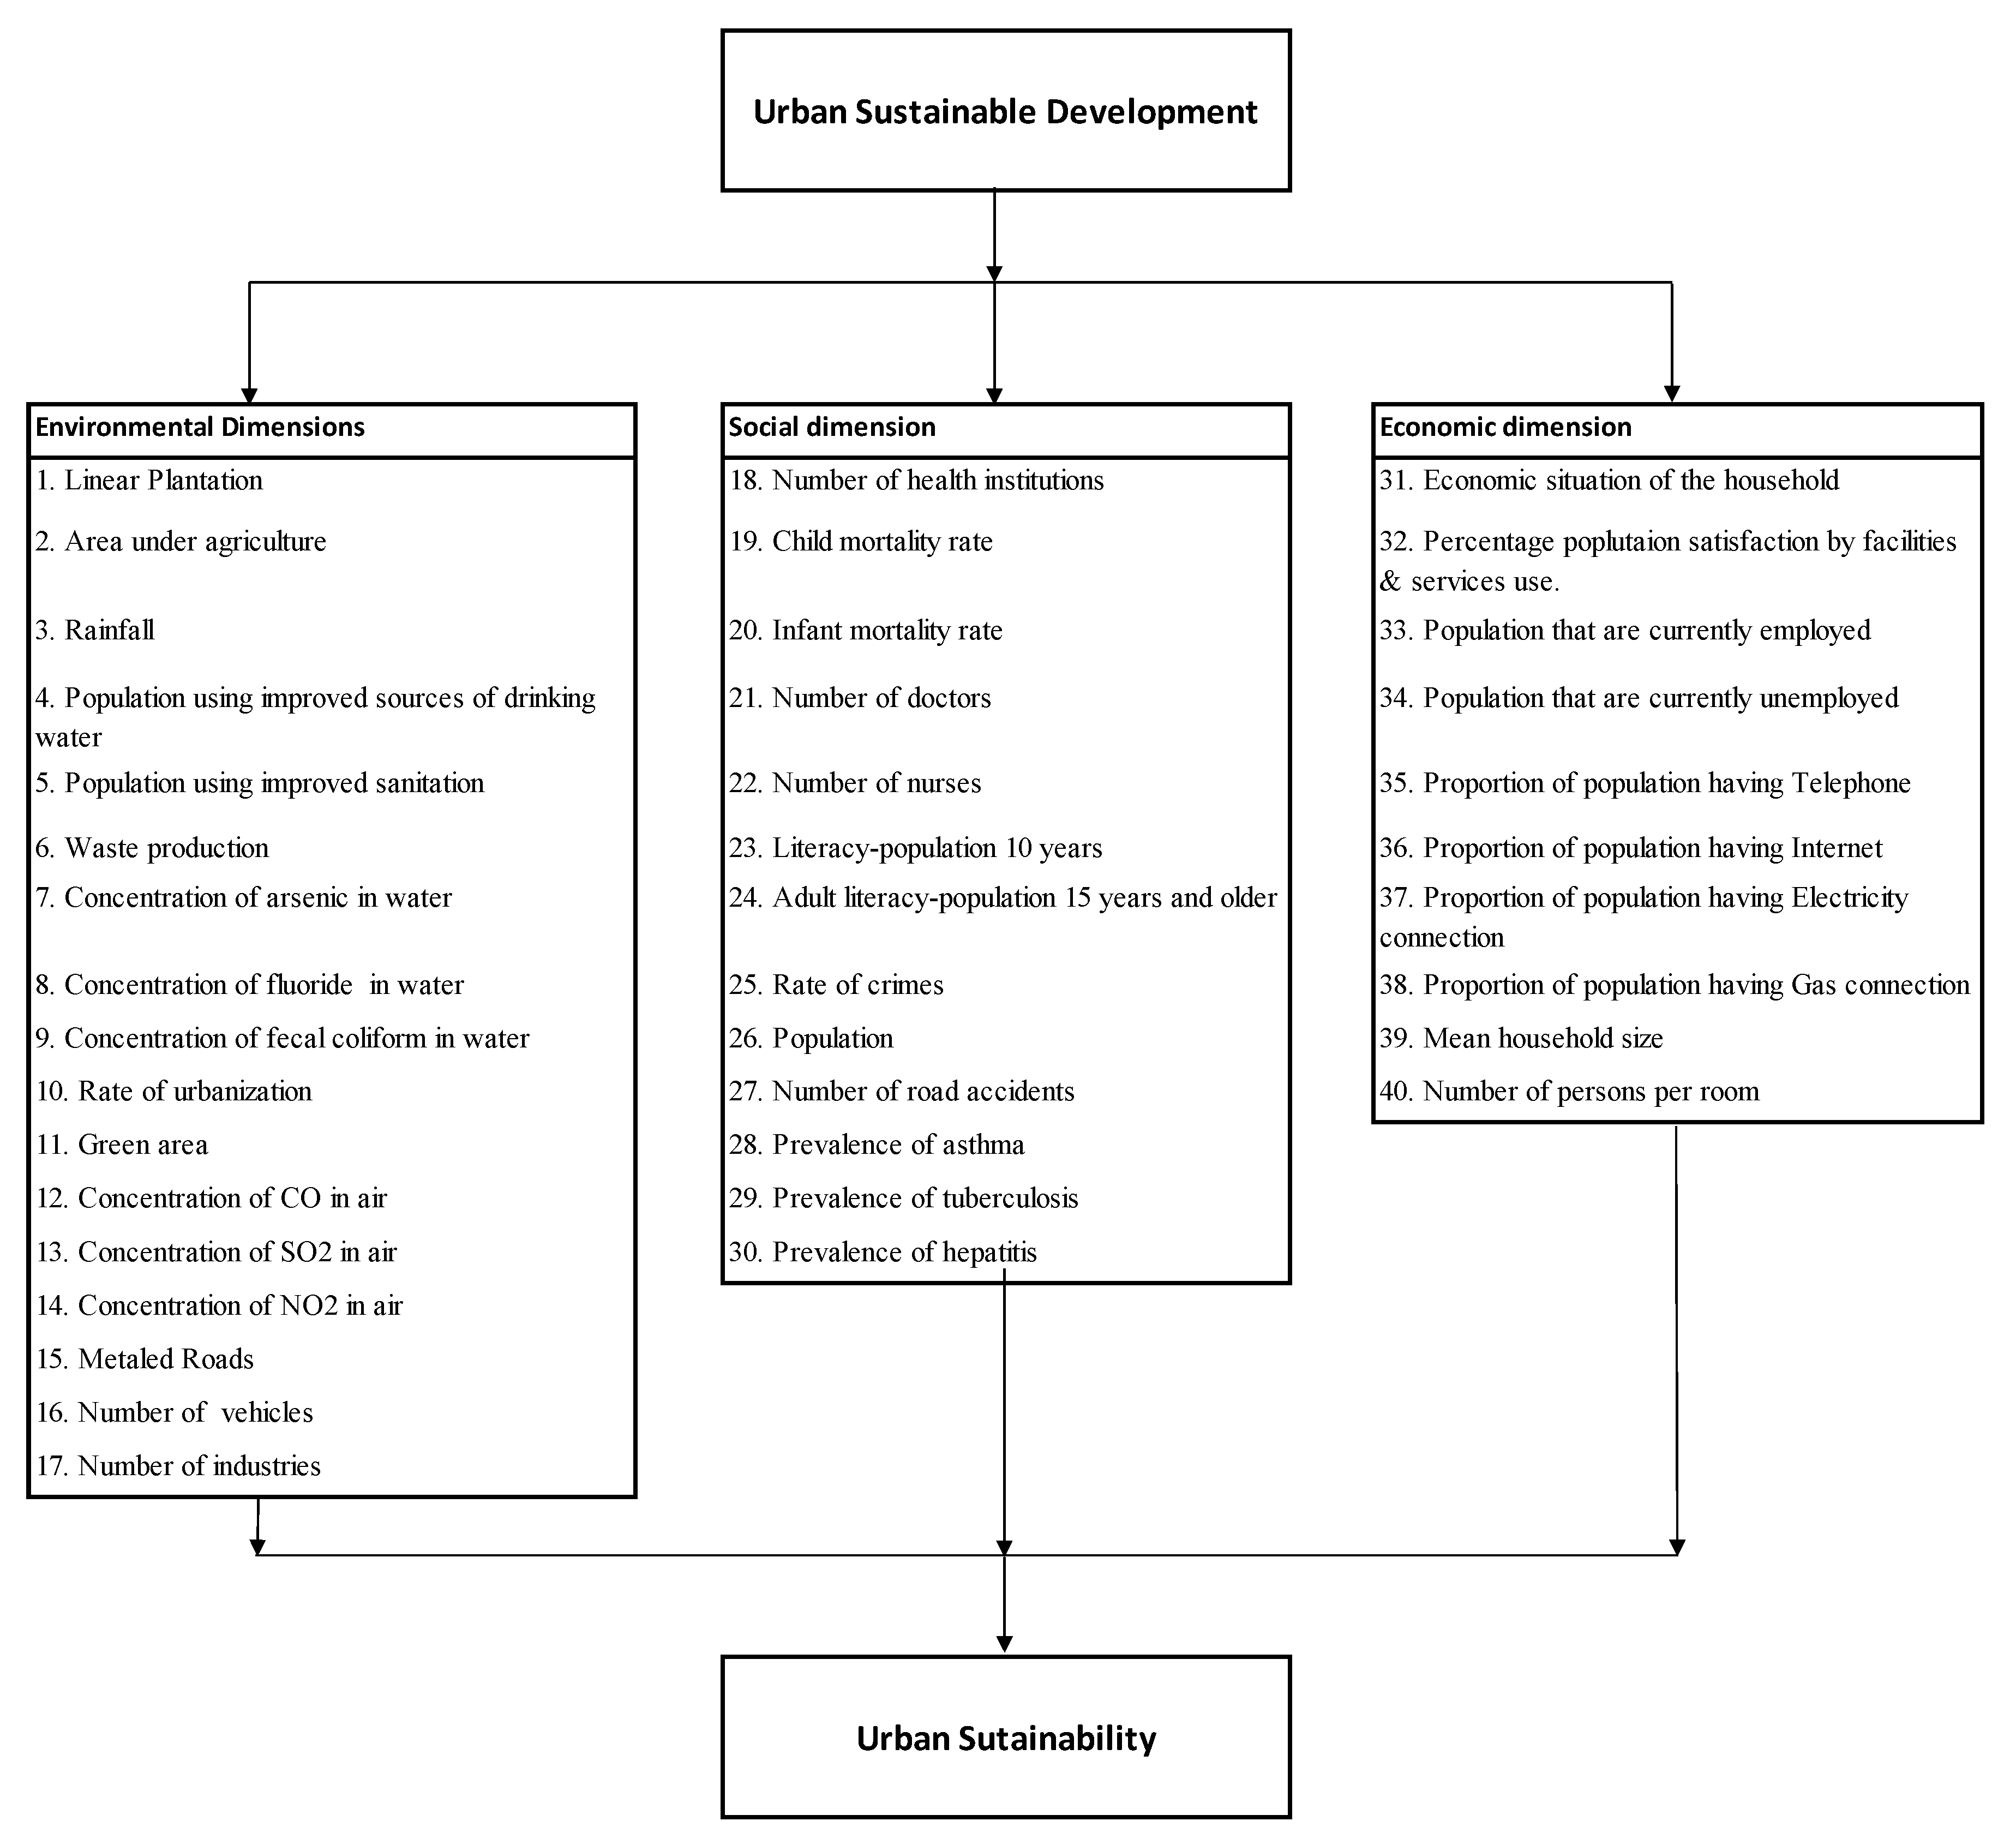
3.1. Construction of Urban Sustainability Index
3.1.1. Context of Urban Sustainability Indicators
- Effectivity—an indicator should be flexible enough to accept changes because of minor variations from statistical interference [35].
- Independence—the indicator system should be independent, meaning the indicator is used separately to calculate different consequence [36].
- Extensibility—an indicator system should provide entire understanding of the social, economic and environmental health of the city [21].
3.1.2. Data
3.1.3. Grouping and Signing of Indicators
3.1.4. Mathematical Calculation
4. Results
4.1. Sustainability Indicator Trends for Cities of Punjab
4.2. Sub-Index and Urban Sustainability Index for Cities of Punjab
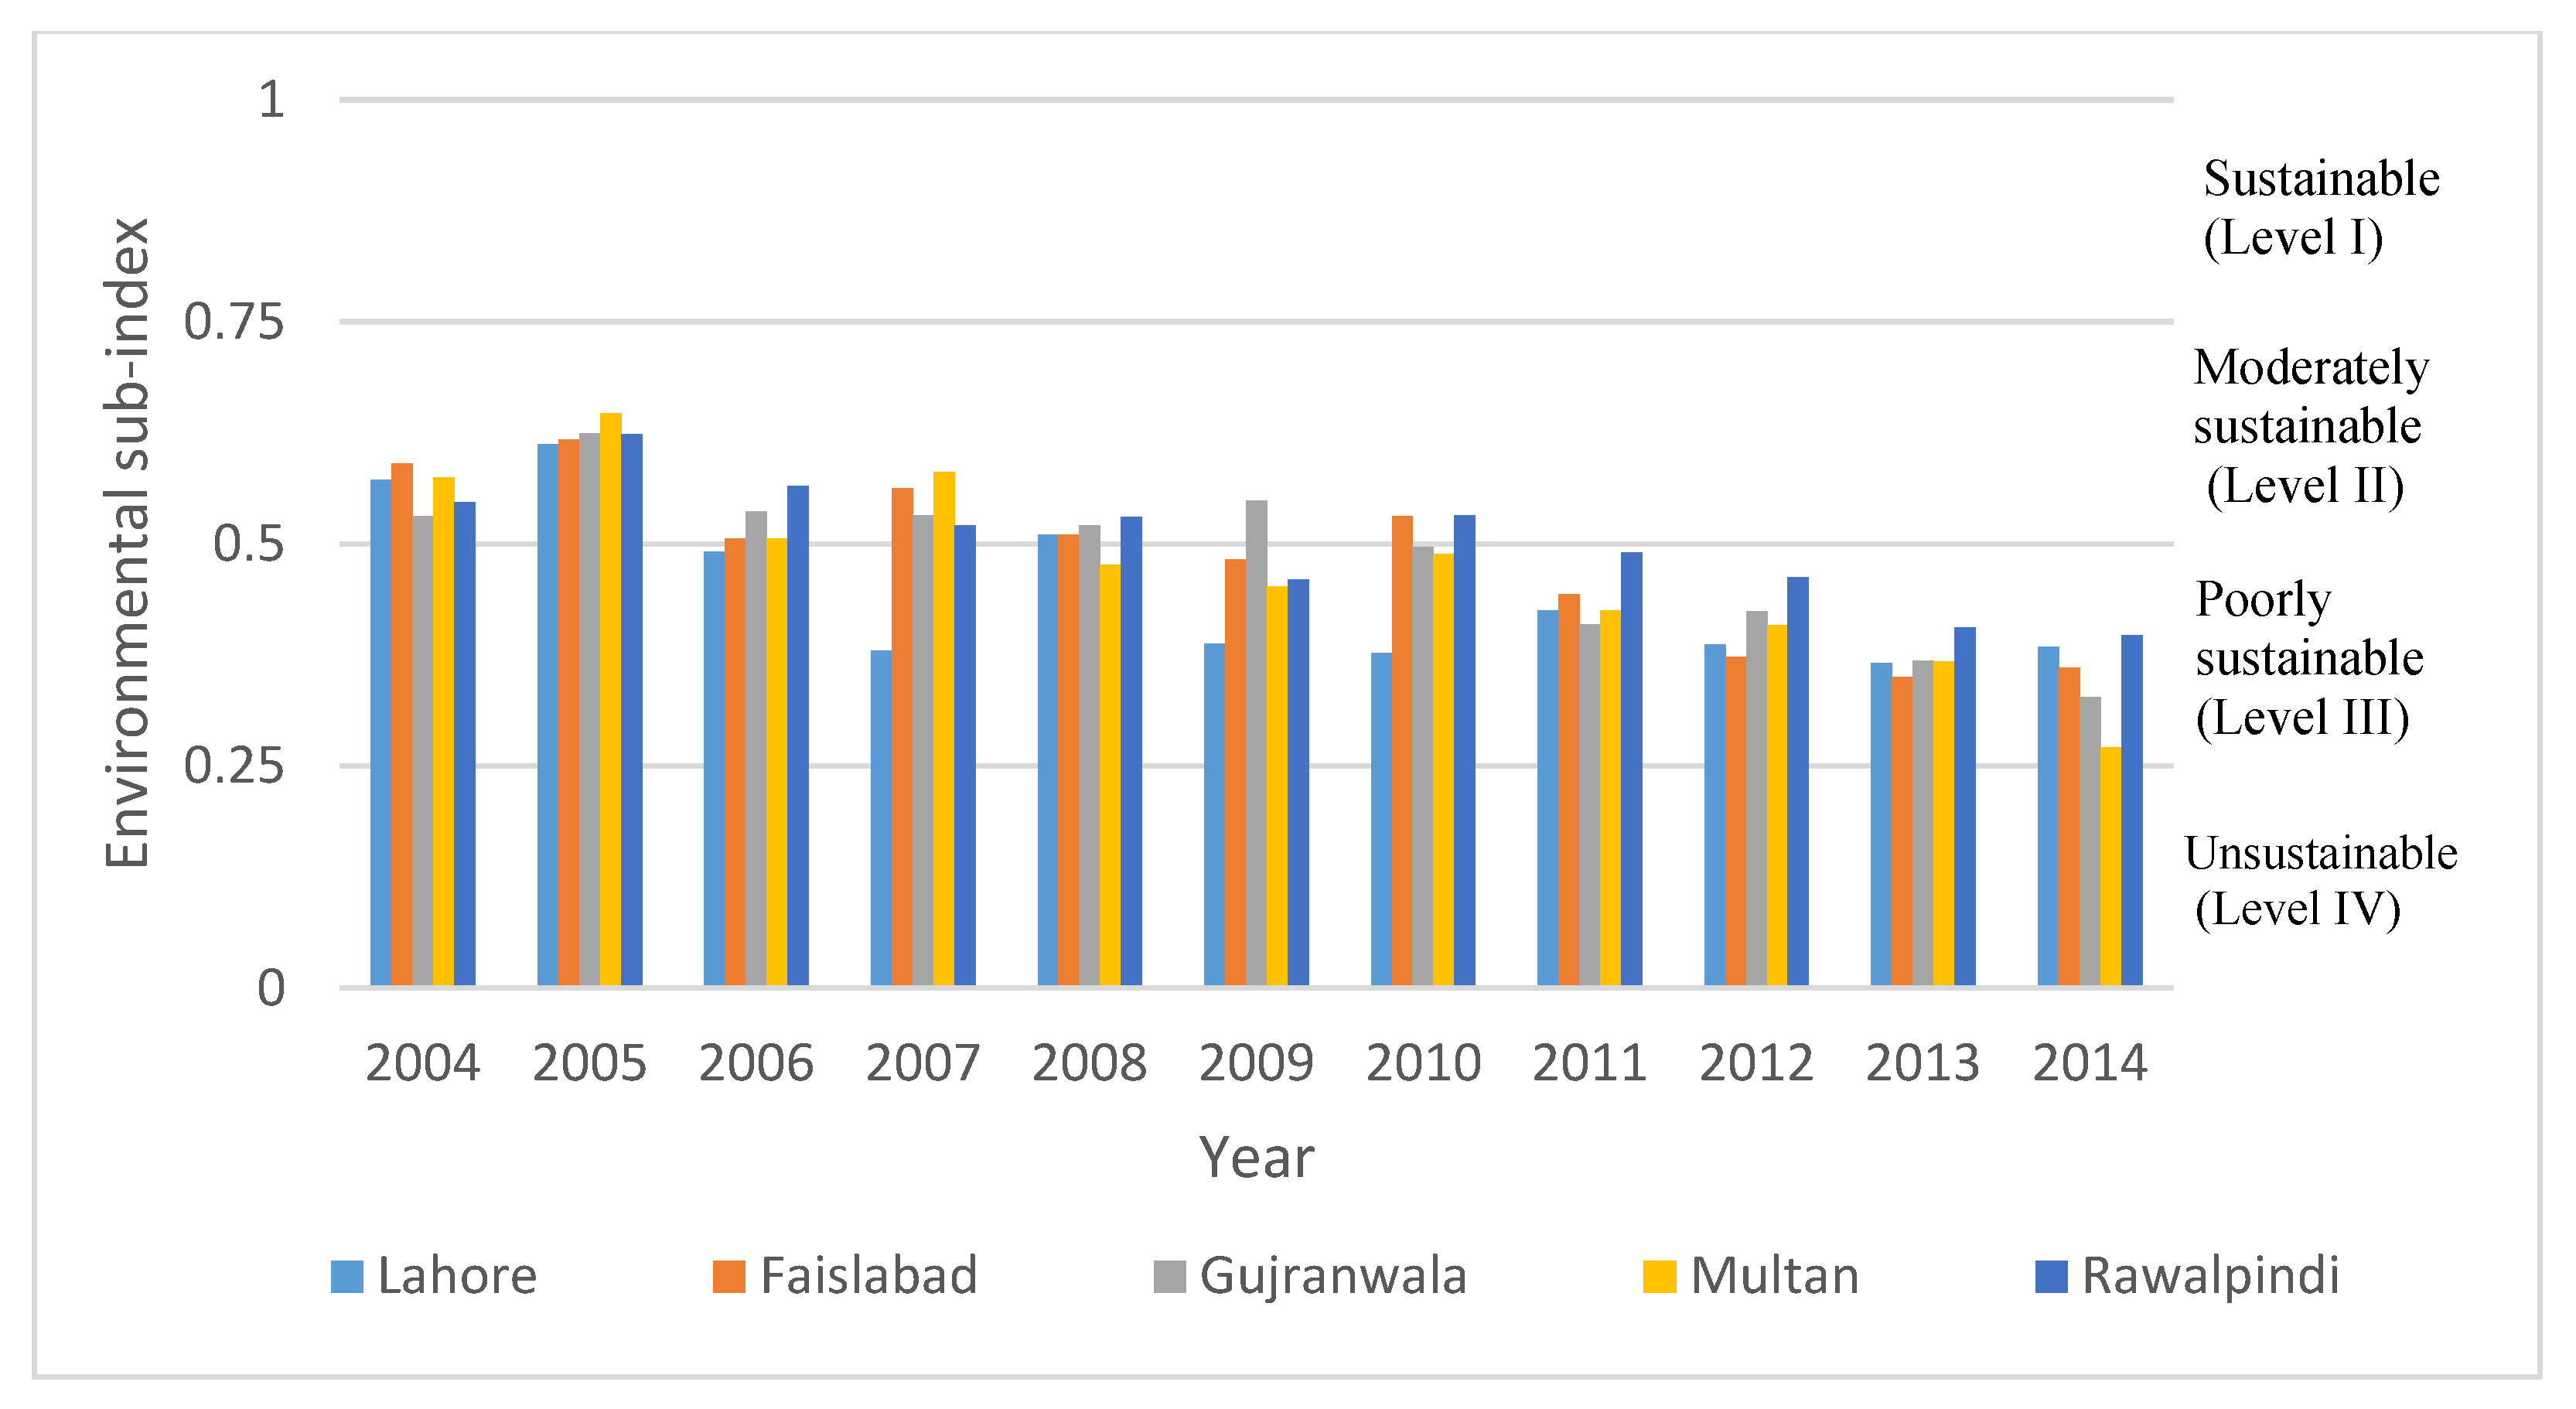
4.2.1. Environmental Sub-Index of the Cities
4.2.2. Social Sub-Index of the Cities
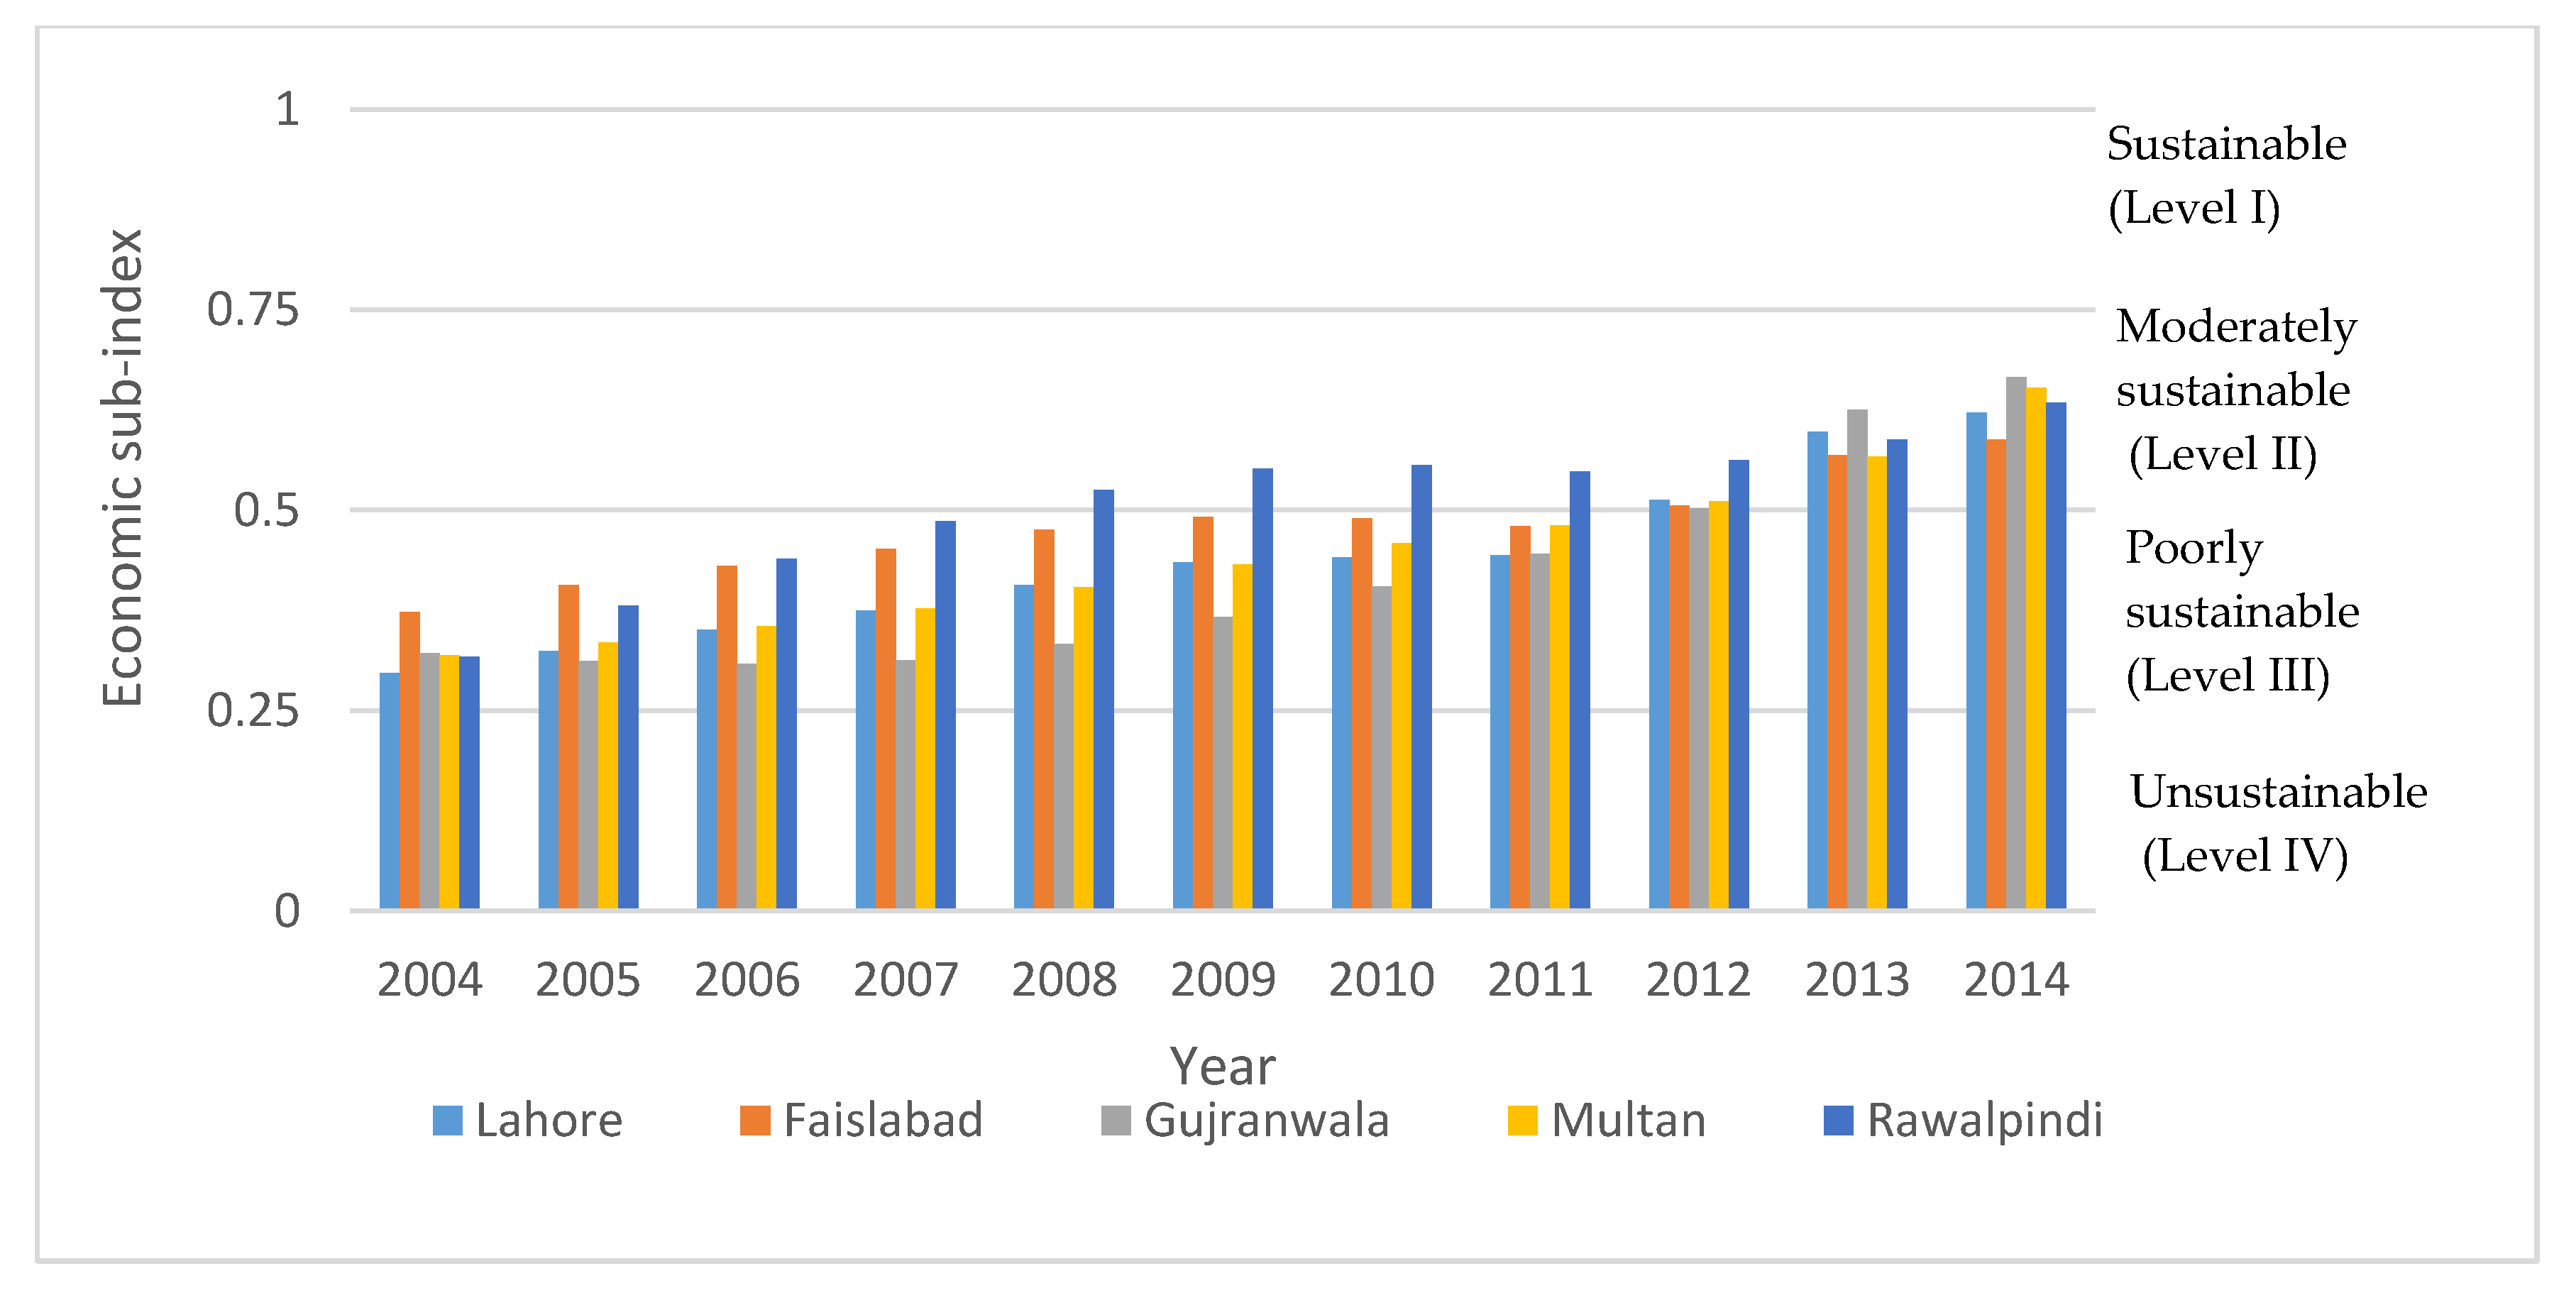
4.2.3. Economic Sub-Index of the Cities
4.2.4. Urban Sustainability Index
5. Discussion
6. Conclusions
Acknowledgments
Author Contributions
Conflicts of Interest
Appendix A

| Indicators | Indicator Code | Principal Components | |||
|---|---|---|---|---|---|
| PC 1 | PC 2 | PC 3 | PC 4 | ||
| 1. Linear Plantation | Env. 1 | 0.648 | 0.143 | −0.528 | 0.530 |
| 2. Area under agriculture | Env. 2 | −0.816 | −0.339 | −0.091 | −0.459 |
| 3. Rainfall | Env. 3 | 0.557 | 0.820 | 0.099 | −0.084 |
| 4. Population using improved sources of drinking water | Env. 4 | −0.484 | 0.026 | 0.840 | 0.242 |
| 5. Population using improved sanitation | Env. 5 | −0.484 | 0.026 | 0.840 | 0.242 |
| 6. Waste production | Env. 6 | −0.582 | 0.312 | 0.697 | 0.277 |
| 7. Concentration of arsenic in water | Env. 7 | −0.494 | 0.858 | −0.138 | 0.032 |
| 8. Concentration of fluoride in water | Env. 8 | −0.643 | −0.141 | 0.529 | 0.536 |
| 9. Concentration of fecal coliform in water | Env. 9 | 0.728 | 0.266 | −0.358 | −0.520 |
| 10. Rate of urbanization | Env. 10 | −0.195 | 0.400 | −0.182 | −0.877 |
| 11. Green area | Env. 11 | 0.197 | −0.408 | 0.183 | 0.872 |
| 12. Concentration of CO in air | Env. 12 | −0.102 | −0.760 | −0.590 | 0.252 |
| 13. Concentration of SO2 in air | Env. 13 | 0.101 | −0.898 | −0.417 | 0.101 |
| 14. Concentration of NO2 in air | Env. 14 | 0.091 | −0.893 | −0.427 | 0.107 |
| 15. Metaled Roads | Env. 15 | 0.780 | 0.215 | 0.035 | 0.586 |
| 16. Number of vehicles | Env. 16 | −0.702 | 0.017 | −0.502 | 0.505 |
| 17. Number of industries | Env. 17 | −0.527 | −0.648 | 0.014 | −0.549 |
| 18. Number of health institutions | Soc. 1 | 0.190 | −0.694 | −0.620 | 0.313 |
| 19. Child mortality rate | Soc. 2 | −0.910 | −0.345 | 0.009 | 0.229 |
| 20. Infant mortality rate | Soc. 3 | −0.764 | −0.622 | 0.032 | 0.170 |
| 21. Number of doctors | Soc. 4 | 0.453 | 0.027 | 0.777 | −0.437 |
| 22. Number of nurses | Soc. 5 | −0.270 | −0.824 | −0.256 | 0.426 |
| 23. Literacy-population 10 years | Soc. 6 | 0.613 | −0.543 | 0.489 | −0.301 |
| 24. Adult literacy-population 15 years and older | Soc. 7 | 0.335 | −0.773 | 0.535 | −0.058 |
| 25. Rate of crimes | Soc. 8 | −0.560 | −0.347 | −0.440 | −0.610 |
| 26. Population | Soc. 9 | −0.256 | 0.501 | −0.808 | 0.177 |
| 27. Number of road accidents | Soc. 10 | −0.898 | 0.100 | −0.349 | 0.251 |
| 28. Prevalence of asthma | Soc. 11 | −0.102 | 0.742 | −0.509 | 0.425 |
| 29. Prevalence of tuberculosis | Soc. 12 | −0.689 | 0.700 | −0.028 | −0.187 |
| 30. Prevalence of hepatitis | Soc. 13 | −0.210 | 0.212 | 0.095 | 0.950 |
| 31. Economic situation of the household | Econ 1 | 0.268 | −0.491 | 0.816 | 0.145 |
| 32. Percentage population satisfaction by facilities & services use | Econ 2 | 0.331 | 0.109 | −0.834 | 0.428 |
| 33. Population that are currently Employed | Econ 3 | 0.747 | 0.221 | 0.264 | 0.569 |
| 34. Population that are currently Unemployed | Econ 4 | 0.598 | 0.267 | 0.704 | 0.276 |
| 35. Proportion of population having Telephone | Econ 5 | 0.604 | 0.364 | −0.620 | −0.344 |
| 36. Proportion of population having Internet | Econ 6 | 0.605 | −0.733 | −0.286 | 0.122 |
| 37. Proportion of population having Electricity connection | Econ 7 | −0.822 | 0.161 | 0.534 | 0.114 |
| 38. Proportion of population having Gas connection | Econ 8 | −0.814 | 0.286 | −0.457 | 0.217 |
| 39. Mean household size | Econ 9 | −0.952 | 0.285 | −0.043 | −0.104 |
| 40. Number of persons per room | Econ 10 | −0.263 | −0.875 | 0.039 | −0.403 |
| Expl.Var | 12.945 | 10.733 | 9.355 | 6.968 | |
| Prp.Totl | 0.324 | 0.268 | 0.234 | 0.174 | |
| Sources of Variation | Infrastructure and socio economic factors | Urbanization, pollution factor | Population and services | Environmental Health | |
References
- Costa, C. An emerging tourism planning paradigm? A comparative analysis between town and tourism planning. Int. J. Tour. Res. 2001, 3, 425–441. [Google Scholar] [CrossRef]
- Alfonso Piña, W.H.; Pardo Martinez, C.I. Development and urban sustainability: An analysis of efficiency using data envelopment analysis. Sustainability 2016, 8, 148. [Google Scholar] [CrossRef]
- Brezis, E.S.; Krugman, P.R. Technology and the life cycle of cities. J. Econ. Growth 1997, 2, 369–383. [Google Scholar] [CrossRef]
- Piña, W.H.A.; Martínez, C.I.P. Urban material flow analysis: An approach for Bogotá, Colombia. Ecol. Indic. 2014, 42, 32–42. [Google Scholar] [CrossRef]
- Liu, S.; Zhang, P.; Jiang, X.; Lo, K. Measuring sustainable urbanization in China: A case study of the coastal Liaoning area. Sustain. Sci. 2013, 8, 585–594. [Google Scholar] [CrossRef]
- United Nations. World Urbanization Prospects: The 2009 Revision; Department of Economic and Social Affairs, Population Division, United Nations: New York, NY, USA, 2010. [Google Scholar]
- Huang, S.-L.; Wong, J.-H.; Chen, T.-C. A framework of indicator system for measuring Taipei’s urban sustainability. Landsc. Urban Plan. 1998, 42, 15–27. [Google Scholar] [CrossRef]
- Xu, Z.; Coors, V. Combining system dynamics model, GIS and 3D visualization in sustainability assessment of urban residential development. Build. Environ. 2012, 47, 272–287. [Google Scholar] [CrossRef]
- Brundtland, G. Our Common Future; Oxford University Press: New York, NY, USA, 1987. [Google Scholar]
- Huang, L.; Wu, J.; Yan, L. Defining and measuring urban sustainability: A review of indicators. Landsc. Ecol. 2015, 30, 1175–1193. [Google Scholar] [CrossRef]
- Ekins, P. Environmental sustainability: From environmental valuation to the sustainability gap. Prog. Phys. Geogr. 2011, 35, 629–651. [Google Scholar] [CrossRef]
- Komeily, A.; Srinivasan, R.S. A need for balanced approach to neighborhood sustainability assessments: A critical review and analysis. Sustain. Cities Soc. 2015, 18, 32–43. [Google Scholar] [CrossRef]
- Fistola, R.; La Rocca, R.A. Smart City Planning: A systemic approach. In Proceedings of the 6th Knowledge City World Summit, Istanbul, Turkey, 9–12 September 2013. [Google Scholar]
- Fistola, R. Urban entropy vs sustainability: A new town planning perspective. In The Sustainable City VII: Urban Regeneration and Sustainability; WIT Press: Ashurst, UK, 2012; Volume 155, p. 1195. [Google Scholar]
- Rasoolimanesh, S.M.; Badarulzaman, N.; Jaafar, M. City development strategies (CDS) and sustainable urbanization in developing world. Procedia Soc. Behav. Sci. 2012, 36, 623–631. [Google Scholar] [CrossRef]
- Abu-Ghazalah, S. The sustainable city development plan for Aqaba, Jordan. J. Dev. Soc. 2008, 24, 381–398. [Google Scholar] [CrossRef]
- Bottero, M.; Mondini, G. (Eds.) The construction of the territorial performance index for testing the environmental compatibility of projects and plans. In Proceedings of the International Conference on Smart and Sustainable Built Environment, Brisbane, Australia, 19–21 November 2003. [Google Scholar]
- Winston, N.; Eastaway, M.P. Sustainable housing in the urban context: International sustainable development indicator sets and housing. Soc. Indic. Res. 2008, 87, 211–221. [Google Scholar] [CrossRef]
- Choon, S.-W.; Siwar, C.; Pereira, J.J.; Jemain, A.A.; Hashim, H.S.; Hadi, A.S. A sustainable city index for Malaysia. Int. J. Sustain. Dev. World Ecol. 2011, 18, 28–35. [Google Scholar] [CrossRef]
- Lee, Y.-J.; Huang, C.-M. Sustainability index for Taipei. Environ. Impact Assess. Rev. 2007, 27, 505–521. [Google Scholar] [CrossRef]
- Balachandra, P.; Sudhakara Reddy, B. Benchmarking Bangalore City for Sustainability—An Indicator-Based Approach; The Center for Infrastructure, Sustainable Transportation and Urban Planning Indian Institute of Science: Bangalore, India, 2012. [Google Scholar]
- Lu, C.; Xue, B.; Lu, C.; Wang, T.; Jiang, L.; Zhang, Z.; Ren, W. Sustainability Investigation of Resource-Based Cities in Northeastern China. Sustainability 2016, 8, 1058. [Google Scholar] [CrossRef]
- Repetti, A.; Desthieux, G. A Relational Indicatorset Model for urban land-use planning and management: Methodological approach and application in two case studies. Landsc. Urban Plan. 2006, 77, 196–215. [Google Scholar] [CrossRef]
- Opschoor, H.; Reijnders, L. Towards sustainable development indicators. In In Search of Indicators of Sustainable Development; Springer: Berlin, Germany, 1991; pp. 7–27. [Google Scholar]
- Singh, R.K.; Murty, H.; Gupta, S.; Dikshit, A. Development of composite sustainability performance index for steel industry. Ecol. Indic. 2007, 7, 565–588. [Google Scholar] [CrossRef]
- Malkina-Pykh, I.G. Integrated assessment models and response function models: Pros and cons for sustainable development indices design. Ecol. Indic. 2002, 2, 93–108. [Google Scholar] [CrossRef]
- Alam, S.; Fatima, A.; Butt, M.S. Sustainable development in Pakistan in the context of energy consumption demand and environmental degradation. J. Asian Econ. 2007, 18, 825–837. [Google Scholar] [CrossRef]
- Shirazi, S.A.; Kazmi, S.J.H. Analysis of Population Growth and Urban Development in Lahore-Pakistan using Geospatial Techniques: Suggesting some future Options. South Asian Stud. 2014, 29, 269–280. [Google Scholar]
- Bhalli, M.N.; Ghaffar, A.; Shirazi, S.A.; Parveen, N.; Anwar, M.M. Change Detection Analysis of Land Use by Using Geospatial Techniques: A Case Study of Faisalabad Pakistan. Sci. Int. 2012, 24, 539–546. [Google Scholar]
- Nasir, A.; Arslan, C.; Khan, M.A.; Nazir, N.; Awan, U.K.; Ali, M.A.; Waqas, U. Industrial waste water management in district Gujranwala of Pakistan-current status and future suggestions. Pak. J. Agric. Sci. 2012, 49, 79–85. [Google Scholar]
- Shad, M.A.; Ansari, T.M.; Afzal, U.; Kauser, S.; Rafique, M.; Khan, M. Major constituents, free amino acids and metal levels in renal calculi from multan region. OnLine J. Biol. Sci. 2001, 1, 1063–1065. [Google Scholar]
- Abbas, F.; Ahmad, A.; Safeeq, M.; Ali, S.; Saleem, F.; Hammad, H.M.; Farhad, W. Changes in precipitation extremes over arid to semiarid and subhumid Punjab, Pakistan. Theor. Appl. Climatol. 2014, 116, 671–680. [Google Scholar] [CrossRef]
- Javaid, A.; Ghauri, K.; Muneer, B.; Nasar-u-Minallah, M. Criteria Maps For Rainwater Harvesting in Potohar Region. Sci. Int. 2016, 28, 2617–2620. [Google Scholar]
- Punjab, G. Punjab Development Statistics; Bureau of Statistics and Govt. of the Punjab: Lahore, Pakistan, 2000.
- United Nations Development Programme (UNDP). Indicators of Sustainable Development: Framework and Methodologies; United Nations: New York, NY, USA, 1996. [Google Scholar]
- Li, F.; Liu, X.; Hu, D.; Wang, R.; Yang, W.; Li, D.; Zhao, D. Measurement indicators and an evaluation approach for assessing urban sustainable development: A case study for China's Jining City. Landsc. Urban Plan. 2009, 90, 134–142. [Google Scholar] [CrossRef]
- Ukaga, O.; Maser, C. Evaluating Sustainable Development: Giving People a Voice in Their Destiny; Stylus Publishing, LLC.: Sterling, VA, USA, 2004. [Google Scholar]
- Spangenberg, J.H. Institutional sustainability indicators: An analysis of the institutions in Agenda 21 and a draft set of indicators for monitoring their effectivity. Sustain. Dev. 2002, 10, 103–115. [Google Scholar] [CrossRef]
- Barrera-Roldán, A.; Saldıvar-Valdés, A. Proposal and application of a Sustainable Development Index. Ecol. Indic. 2002, 2, 251–256. [Google Scholar] [CrossRef]
- Gibson, B.; Hassan, S.; Tansey, J. Sustainability Assessment: Criteria and Processes; Routledge: Abingdon, UK, 2013. [Google Scholar]
- Neumayer, E. Indicators of Sustainability; Edward Elgar: Cheltenham, UK, 2004. [Google Scholar]
- Kurosawa, S.; Nakayama, H.; Kato, N.; Jamalipour, A.; Nemoto, Y. Detecting blackhole attack on AODV-based mobile ad hoc networks by dynamic learning method. Int. J. Netw. Secur. 2007, 5, 338–346. [Google Scholar]
- Marzukhi, M.A.; Omar, D.; Leh, O.L.H.; Hamir, M.S.; Barghchi, M. Malaysian urban indicators network: A sustainable development initiative in Malaysia. Eur. J. Soc. Sci. 2011, 25, 77–84. [Google Scholar]
- Rosales, N. Towards the modeling of sustainability into urban planning: using indicators to build sustainable cities. Procedia Eng. 2011, 21, 641–647. [Google Scholar] [CrossRef]
- Gelman, V.; Hulkkonen, V.; Kantola, R.; Nousiainen, M.; Nousiainen, V.; Poku-Marboah, M. Impacts of forest management practices on forest carbon. In HENVI Workshop; University of Helsinki: Helsinki, Finland, 2013. [Google Scholar]
- Dale, V.H.; Joyce, L.A.; McNulty, S.; Neilson, R.P.; Ayres, M.P.; Flannigan, M.D.; Hanson, P.J.; Irland, L.C.; Lugo, A.E.; Peterson, C.J. Climate change and forest disturbances: Climate change can affect forests by altering the frequency, intensity, duration, and timing of fire, drought, introduced species, insect and pathogen outbreaks, hurricanes, windstorms, ice storms, or landslides. BioScience 2001, 51, 723–734. [Google Scholar] [CrossRef]
- Pretty, J.; Ball, A. Agricultural Influences on Carbon Emissions and Sequestration: A Review of Evidence and the Emerging Trading Options; Centre for Environment and Society Occasional Paper, University of Essex: Colchester, UK, 2001; Volume 3, p. 31. [Google Scholar]
- McCarty, G.; Ritchie, J. Impact of soil movement on carbon sequestration in agricultural ecosystems. Environ. Pollut. 2002, 116, 423–430. [Google Scholar] [CrossRef]
- Watson, J.T.; Gayer, M.; Connolly, M.A. Epidemics after natural disasters. Emerg. Infect. Dis. 2007, 13. [Google Scholar] [CrossRef] [PubMed]
- Ali, A.O.G. Solid Waste Pollution and the Importance of Environmental Planning in Managing and Preserving the Public Environment in Benghazi City and Its Surrounding Areas. World Acad. Sci. Eng. Technol. Int. J. Environ. Chem. Ecol. Geol. Geophys. Eng. 2013, 7, 924–929. [Google Scholar]
- Rahman, M.M.; Ng, J.C.; Naidu, R. Chronic exposure of arsenic via drinking water and its adverse health impacts on humans. Environ. Geochem. Health 2009, 31, 189–200. [Google Scholar] [CrossRef] [PubMed]
- Majumdar, K.K. Health impact of supplying safe drinking water containing fluoride below permissible level on flourosis patients in a fluoride-endemic rural area of West Bengal. Indian J. Public Health 2011, 55, 303–308. [Google Scholar] [CrossRef] [PubMed]
- Savichtcheva, O.; Okabe, S. Alternative indicators of fecal pollution: Relations with pathogens and conventional indicators, current methodologies for direct pathogen monitoring and future application perspectives. Water Res. 2006, 40, 2463–2476. [Google Scholar] [CrossRef] [PubMed]
- Guatam, N. Analyzing the Sustainable Development Indicators of Nepal Using System Dynamics Approach. In Proceedings of the Commons Amidst Complexity and Change, the Fifteenth Biennial Conference of the International Association for the Study of the Commons, Edmonton, Alberta, 25–29 May 2015. [Google Scholar]
- Chen, T.-M.; Kuschner, W.G.; Gokhale, J.; Shofer, S. Outdoor air pollution: Nitrogen dioxide, sulfur dioxide, and carbon monoxide health effects. Am. J. Med. Sci. 2007, 333, 249–256. [Google Scholar] [CrossRef] [PubMed]
- Robinson-Pant, A. The Social Benefits of Literacy; Documento de Referencia Para el Informe de Seguimiento de la EPT en el Mundo; United Nations Educational Scientific and Cultural Organization: Paris, France, 2006. [Google Scholar]
- Spellerberg, I. Ecological effects of roads and traffic: A literature review. Glob. Ecol. Biogeogr. 1998, 7, 317–333. [Google Scholar] [CrossRef]
- Böhringer, C.; Jochem, P.E. Measuring the immeasurable—A survey of sustainability indices. Ecol. Econ. 2007, 63, 1–8. [Google Scholar] [CrossRef]
- Krajnc, D.; Glavič, P. A model for integrated assessment of sustainable development. Resour. Conserv. Recycl. 2005, 43, 189–208. [Google Scholar] [CrossRef]
- Reddy, B.S.; Balachandra, P. Benchmarking Indian Mega Cities for Sustainability—An Indicator-Based Approach; SANEI Working Paper Series, 13(02); South Asia Network of Economic Research Institutes: Dhaka, Bangladesh, 2013. [Google Scholar]
- Satterthwaite, D. Adapting to Climate Change in Urban Areas: The Possibilities and Constraints in Low-and Middle-Income Nations; IIED: London, UK, 2007; Volume 1. [Google Scholar]
- Reddy, B.S.; Balachandra, P. Benchmarking Urban Sustainability—A Composite Index for Mumbai and Bangalore; Indira Gandhi Institute of Development Research: Mumbai, India, 2013. [Google Scholar]
- Sathar, Z.A.; Casterline, J.B. The onset of fertility transition in Pakistan. Popul. Dev. Rev. 1998, 24, 773–796. [Google Scholar] [CrossRef]


| Indicators | Units | Index Properties | Lahore | Faisalabad | Gujranwala | Multan | Rawalpindi |
|---|---|---|---|---|---|---|---|
| Environment Dimension | |||||||
| Env1-Linear plantation | Hectares | ↘↗ | ↗↘↗ | ↗ | ↘↗ | →↗ | |
| Env2-Area under agriculture | Thousand hectares | Positive | ↘↗ | ↗ | ↘ | ↘ | ↘ |
| Env3-Rainfall | Millimeters | Positive | ↘→↗ | ↘→↘→↗ | ↘ | ↗↘→ | →↗→↘ |
| Env4-Population using improved sources of drinking water | % | Positive | ↘→↗ | ↗→↘ | ↗→↘ | ↗→↘ | ↘→↗ |
| Env5-Population using improved sanitation | % | Positive | ↘→↗ | ↗→↘ | ↗→↘ | ↗→↘ | ↘→↗ |
| Env6-Waste production | Tons | Negative | ↘→↗ | ↗↘ | ↘→↗ | ↘→↗ | ↘↗ |
| Env7-Concentration of arsenic in drinking water | As (ppb) | Negative | ↘→ | ↘ | ↘ | ↘↗ | ↘→↗ |
| Env8-Concentration of fluoride in drinking water | F (ppm) | Negative | ↗→ | ↗↘ | ↘→ | ↘↗ | ↘→ |
| Env9-Concentration of fecal coliform in drinking water | Fecal Coliform (00/100 mL) | Negative | ↘→ | ↘→ | ↘↗→ | ↘ | ↘↗→ |
| Env10-Rate of urbanization | Square kilometers | Negative | ↘→↗ | ↘→↗ | ↘→↗ | ↘→↗ | ↘→↗ |
| Env11-Green area | Square kilometers | Positive | ↘→↗ | ↗↘ | ↗→↘ | ↗→↘ | ↘→↗ |
| Env12-Concentration of Carbon monoxide in air | CO (mg/m³) | Negative | ↘→↗ | ↘→↗ | ↘→↗ | ↘→↗ | ↘→↗ |
| Env13-Concentration of Sulphur dioxide in air | SO2 (ug/m³) | Negative | ↗ | ↗ | ↘→↗ | ↘→↗ | ↘→↗ |
| Env14-Concentration of Nitrogen dioxide in air | NO2 (ug/m³) | Negative | ↗ | ↗ | ↘→↗ | ↘→↗ | ↘→↗ |
| Env15-Metaled Roads | Kilometers | Negative | →↗ | ↗ | →↗ | →↘ | →↗ |
| Env16-Number of vehicles | Number | Negative | ↘→↗ | ↘→ | ↗→↘ | →↘ | ↘→↗ |
| Env17-Number of industries | Number | Negative | ↘→↗ | ↘→↗ | ↗→↘ | ↘→↗ | ↘→↘ |
| Social Dimension | |||||||
| Soc1-Number of health institutions | Number | Positive | ↘↗ | → | →↗ | ↘ | →↗ |
| Soc2-Rate of child mortality and infant mortality | % | Negative | ↗→↘ | ↗→↘ | ↗→ | ↘→ | →↘→ |
| Soc3-Rate of child mortality and infant mortality | ↗→↘ | ↘→↗ | →↗ | ↘→↗ | ↘↗ | ||
| Soc4-Number of doctors | Per thousand person | Positive | ↘→↗ | ↘→↗ | ↘→↗ | ↘→↗ | ↘→↗ |
| Soc5-Number of nurses | Per thousand person | Positive | ↘→↗ | ↘→↗ | ↘→↗ | ↘→↗ | ↘→↗ |
| Soc6-Literacy-population 10 years | % | Positive | →↘→↗ | →↗ | ↘↗ | ↗ | →↗→↗ |
| Soc7-Adult literacy rate | % | Positive | →↘→↗ | ↗ | →↗ | ↗ | →↗ |
| Soc8-Rate of crimes | Number | Negative | ↘→↗→ | → | ↘↗ | ↘→↗ | →↗ |
| Soc9-Population | Per thousand person | Negative | ↘→↗ | ↘→↗ | ↘→↗ | ↘→↗ | ↘→↗ |
| Soc10-Population Number of road accidents | Number | Negative | ↗→↘ | ↘↗ | ↗→ | →↘ | → |
| Soc11-Prevalence of asthma | % | Negative | ↘→↗ | ↘→ | ↘→↗ | ↘→↗ | ↘→↗ |
| Soc12-Prevalence of tuberculosis | % | Negative | ↗↘ | ↘ | ↘→↗ | ↘→↗ | ↘↗ |
| Soc13-Prevalence of hepatitis | % | Negative | ↗→↘ | ↗ | ↘→↗→ | ↘→↗ | ↘→↗ |
| Economic Dimension | |||||||
| Econ 1-Economic situation of the household | % | Positive | →↘→↗ | ↘→ | →↘→ | ↘→↗ | ↘↗→ |
| Econ 2-Percent distribution of household’s satisfaction by facilities & services use | % | Positive | ↘→↗ | ↘→ | ↘↗ | ↘↗ | ↘↗ |
| Econ 3-Population that are currently Employed | % | Positive | ↘→↗ | ↘→↗ | ↘→↗ | ↘→↗ | ↘→↗ |
| Econ 4-Population that are currently Unemployed | % | Negative | ↗→↘ | ↗→↘ | ↗→↘ | ↗↘ | ↗→↘ |
| Econ 5-Proportion of household having Telephone | % | Positive | ↗↘ | ↗↘ | ↗↘ | ↗↘ | ↗→↘ |
| Econ 6-Proportion of household having Internet | % | Positive | →↘ | ↗→↘ | ↘→↗ | ↘→↗ | ↘→↗ |
| Econ 7-Proportion of household having Electricity | % | Positive | ↗ | →↗ | ↗→ | →↗ | ↘→↗↘ |
| Econ 8-Proportion of household having Gas | % | Positive | →↗ | ↘→ | ↘→ | ↘ | ↘→ |
| Econ 9-Mean household size | % | Negative | ↗↘ | ↗→↘ | ↗↘ | ↘→↗ | ↗→↘ |
| Econ 10-Mean household size and the number of persons per room | % | Negative | ↘→↗ | ↘→↗ | ↗↘ | ↘→↗ | ↘→↗ |
| Cities | Number of Indicators | Sustainabilty Index Score | Sustainability Status | Sources |
|---|---|---|---|---|
| Lahore, Pakistan | 40 | 0.52 | Moderate | Present study |
| Faisalabad, Pakistan | 40 | 0.52 | Moderate | Present study |
| Gujranwala, Pakistan | 40 | 0.47 | Weak | Present study |
| Multan, Pakistan | 40 | 0.41 | Weak | Present study |
| Rawalpindi, Pakistan | 40 | 0.48 | Weak | Present study |
| Bangalore, India | 60 | 0.59 | Moderate | [62] |
| Mumbai, India | 60 | 0.67 | Moderate | [62] |
| London, England | 60 | 0.79 | Excellent | [62] |
| Singapore | 60 | 0.77 | Excellent | [62] |
| Shanghai, China | 60 | 0.669 | Moderate | [62] |
| Jining, China | 52 | 0.62 | Moderate | [36] |
| Taipei, Taiwan | 51 | 0.71 | Moderate | [20] |
| Kuala Lumpur, Malaysia | 38 | 0.64 | Moderate | [19] |
| Ipoh, Malaysia | 38 | 0.62 | Moderate | [19] |
| Shah Alam, Malaysia | 38 | 0.62 | Moderate | [19] |
© 2017 by the authors. Licensee MDPI, Basel, Switzerland. This article is an open access article distributed under the terms and conditions of the Creative Commons Attribution (CC BY) license (http://creativecommons.org/licenses/by/4.0/).
Share and Cite
Ghalib, A.; Qadir, A.; Ahmad, S.R. Evaluation of Developmental Progress in Some Cities of Punjab, Pakistan, Using Urban Sustainability Indicators. Sustainability 2017, 9, 1473. https://doi.org/10.3390/su9081473
Ghalib A, Qadir A, Ahmad SR. Evaluation of Developmental Progress in Some Cities of Punjab, Pakistan, Using Urban Sustainability Indicators. Sustainability. 2017; 9(8):1473. https://doi.org/10.3390/su9081473
Chicago/Turabian StyleGhalib, Ambreen, Abdul Qadir, and Sajid Rashid Ahmad. 2017. "Evaluation of Developmental Progress in Some Cities of Punjab, Pakistan, Using Urban Sustainability Indicators" Sustainability 9, no. 8: 1473. https://doi.org/10.3390/su9081473