1. Introduction
Lake sediment is the major site where accumulation of contaminants occurs due to the sedimentation of various organic substances introduced from the catchment, affecting the benthic and water environment in a lake [
1]. Organics in sediment are decomposed by the metabolism of microorganisms, benthic organisms, and unspecified aerobic biochemical reactions. The sum of the consumed oxygen represents the sediment oxygen demand (SOD). A high SOD level under stratification conditions in a lake can allow an anaerobic state to persist, with expected negative impacts on the benthic environment [
2].
Release of chemical components or contaminants from the lake sediment can be affected by various environmental factors, such as the temperature, pH, and dissolved oxygen (DO). Such a release consequently influences the trophic level of a lake water body [
3]. Among these environmental factors, DO is considered one of the most influential variables affecting a lake environment. It is thus suggested that contaminants are more easily released under anaerobic conditions [
4,
5,
6]. Therefore, the evaluation of SOD was recommended to properly assess the release rate of the related chemicals in fresh and seawater [
7,
8,
9,
10,
11].
On the west coast of South Korea, coastal reservoirs have recently been created by the construction of dikes to secure the agricultural water supply. However, there are many concerns regarding the maintenance of water quality in those artificial reservoirs [
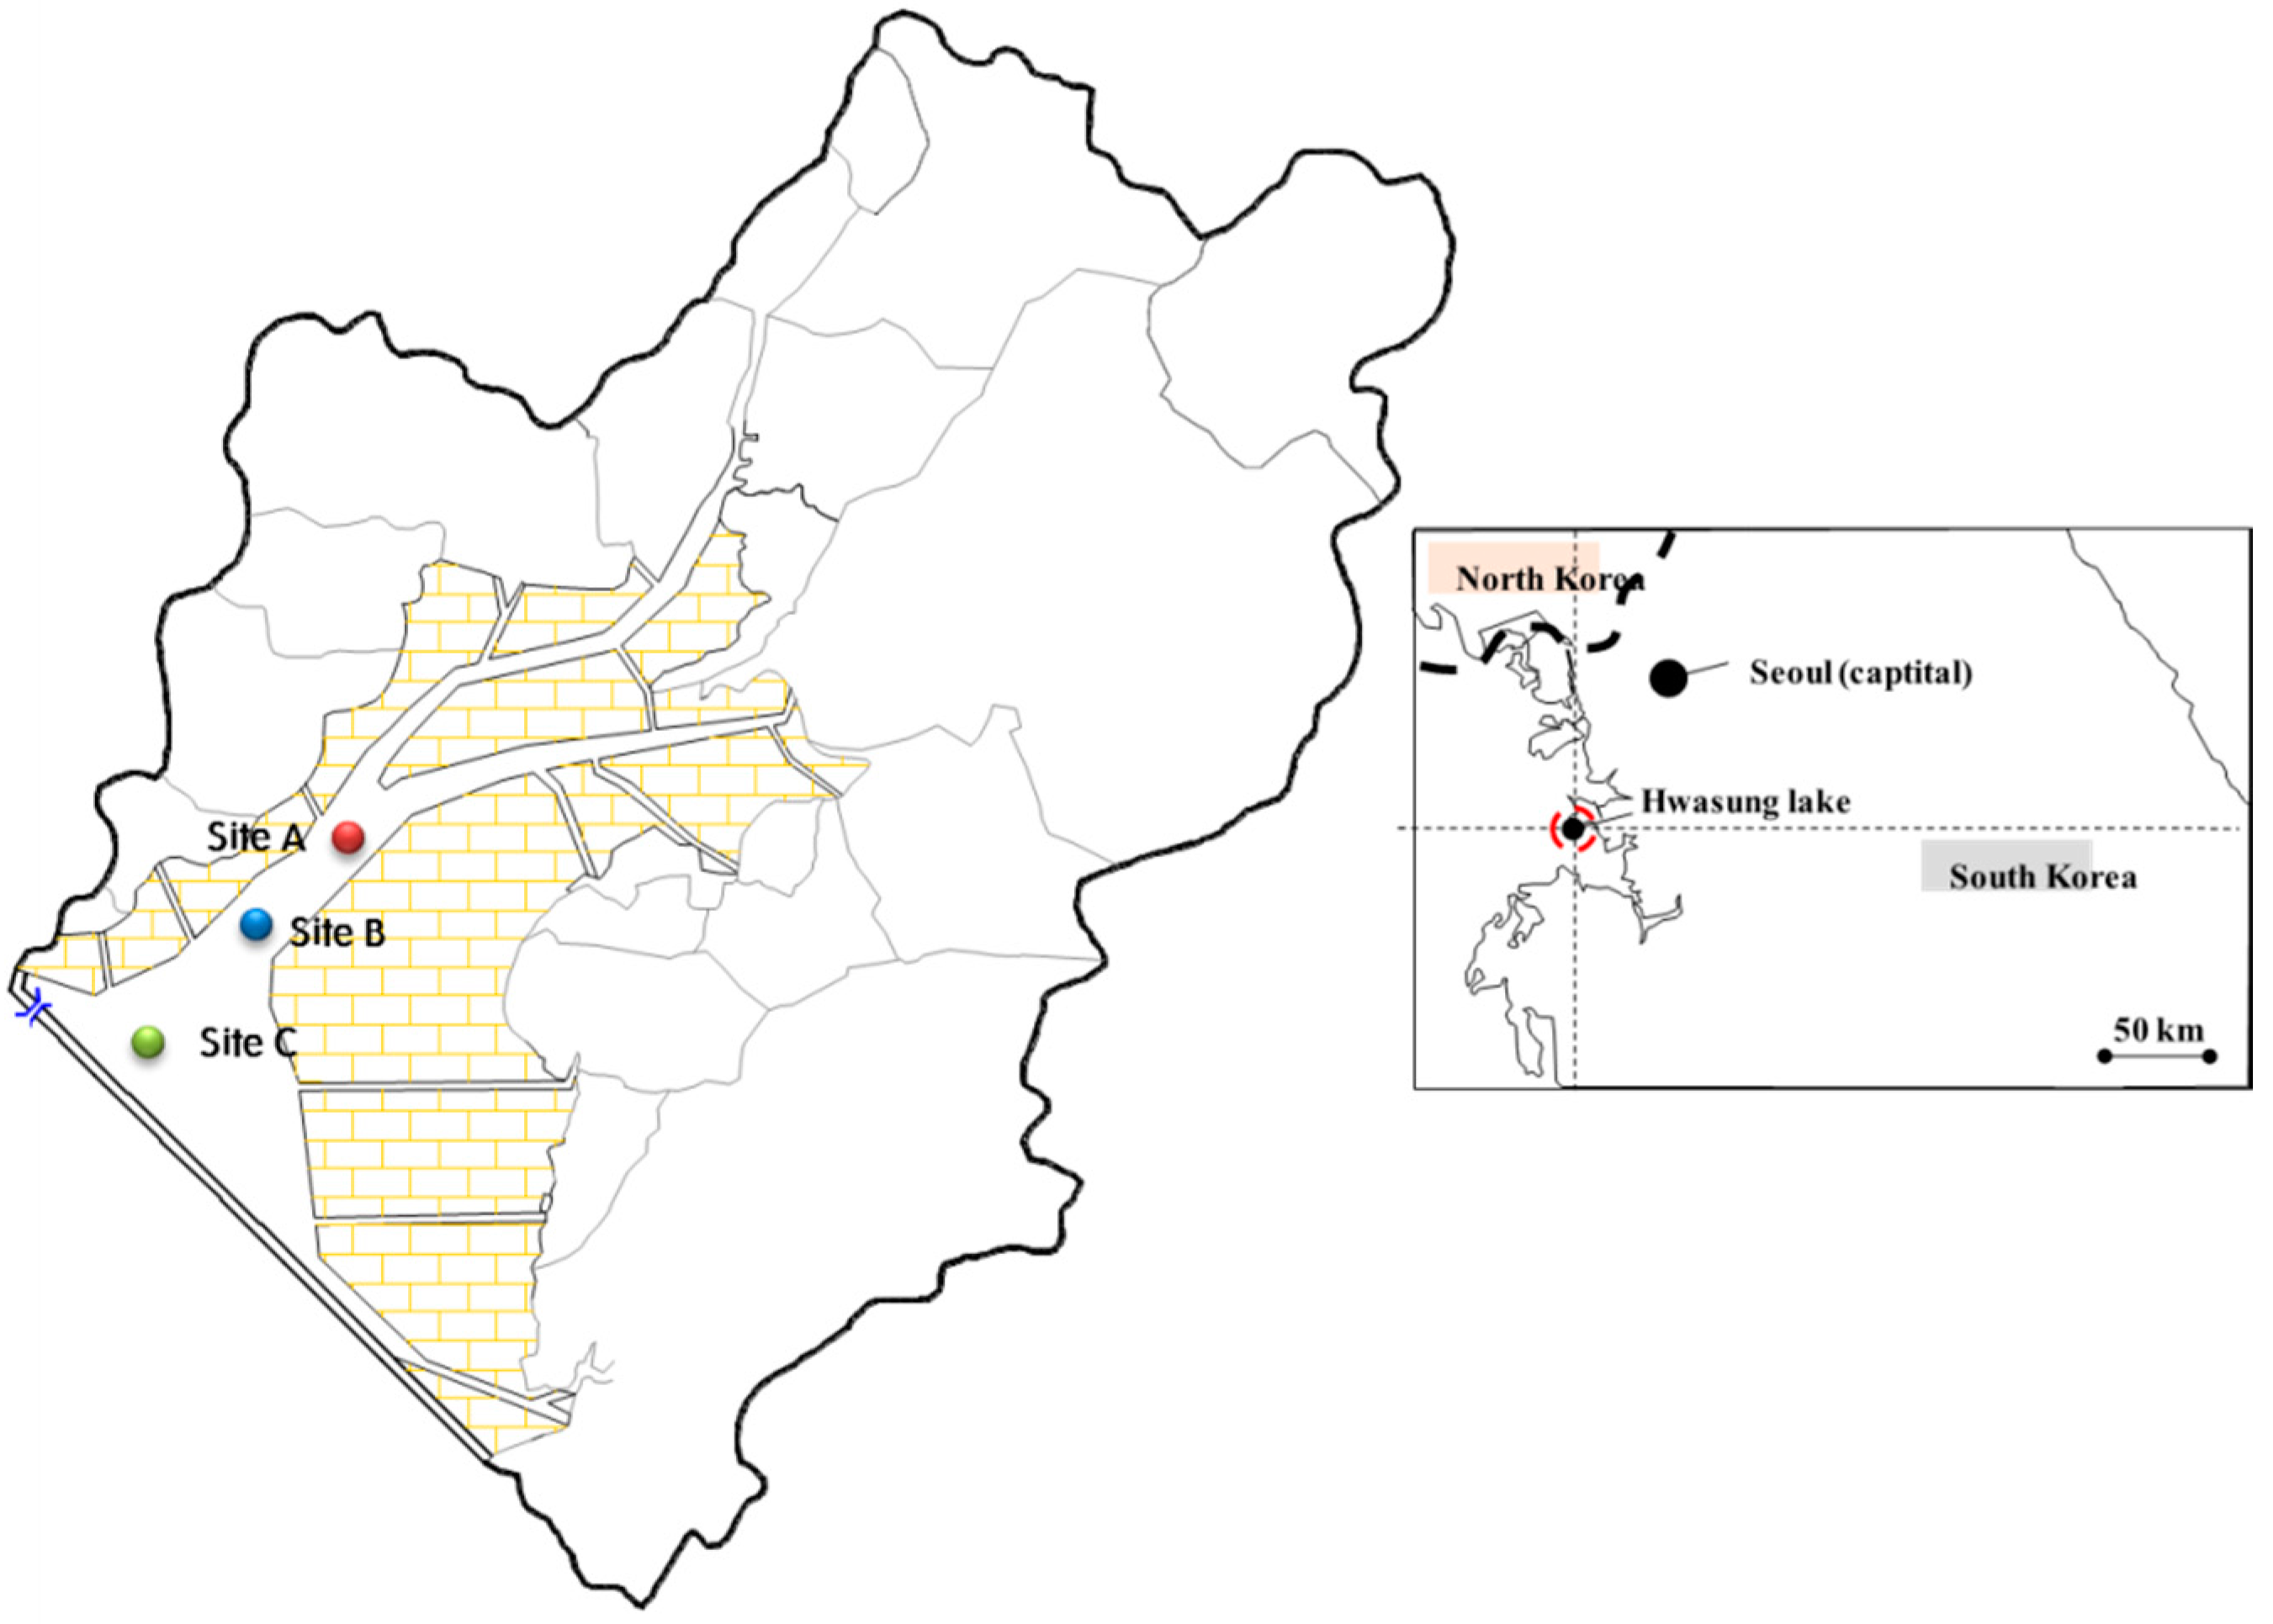
12]. The study site, Hwasung Lake, is an artificial lake in the region made by damming Namyang-bay with a tide embankment, and its area is 1730 ha with a volume of 54,600,000 tons. Desalination has recently been conducted to secure the agricultural water supply for farmlands in the reclaimed land and hinterland [
13]. The lake water is brackish, and an apparent water quality change in the lake has been observed to be accompanied by changes in its salinity. Hwasung Lake is well known for a particular spatial gradient of salinity distribution, with higher salinity near the seaside and lower salinity on the shoreside (e.g., due to freshwater input through inflowing rivers) [
14].
In many previous studies focusing on brackish water lakes, researchers have generally performed simple monitoring of water quality and sediment contaminants. As brackish water lakes often exhibit different salinity levels along the salinity gradients, it is important to properly assess the interaction between the salinity and the release of chemicals representing water-quality variables or contaminants. This information can be used as a sensitive barometer to predict water quality change in a brackish lake during the desalination process. In this study, we conducted a series of sediment-water column studies to investigate the effect of salinity changes on the water-quality variables in relation to the degree of oxygen deficit and SOD. Hence, our objectives were specifically set as follows: (1) to determine the contaminant decomposition causing anaerobic conditions under controlled conditions and (2) to evaluate the effect of the salinity changes on the release rate of water-quality related chemicals like N, P, and COD.
2. Materials and Methods
2.1. Sample Collection and Preparation
Sediments and water were sampled from Hwasung Lake, located in Hwasung-si, Gyeonggi-do, Korea. Sampling locations (sites A, B, and C) were selected to maintain similar physicochemical characteristics in the sediment properties but with different salinity levels (
Figure 1).
Our field campaign was conducted on 30 August 2011, and water and sediment samples were collected using a Van Dorn sampler and grab sampler, respectively. The collected water and sediment samples were transported to the laboratory and stored under dark conditions at 4 °C in a refrigerator until the analysis. Sediment pH and electrical conductivity (EC) were measured in a 1:5 soil-to-water ratio suspension after shaking for 2 h using a pH meter (HI8424, HANNA, Padova, Italy) and an EC meter (EC-40N, ISTEK, Seoul, Korea). Sieve analysis was used for the grain size distribution. The water content and loss on the ignition measurements were based on the weight loss after drying and combustion of the sediments at 105 °C and 550 °C, respectively. Salinity was measured using a salinity meter (HI96822, HANNA, Padova, Italy). Total phosphorous in the sediment was measured by the perchloric acid (HClO
4) digestion method [
15], and total nitrogen was measured by the modified Kjeldahl method (KS I ISO 11261) [
16]. The results of the basic water quality measurements and the sediment characteristics are presented in
Table 1 and
Table 2.
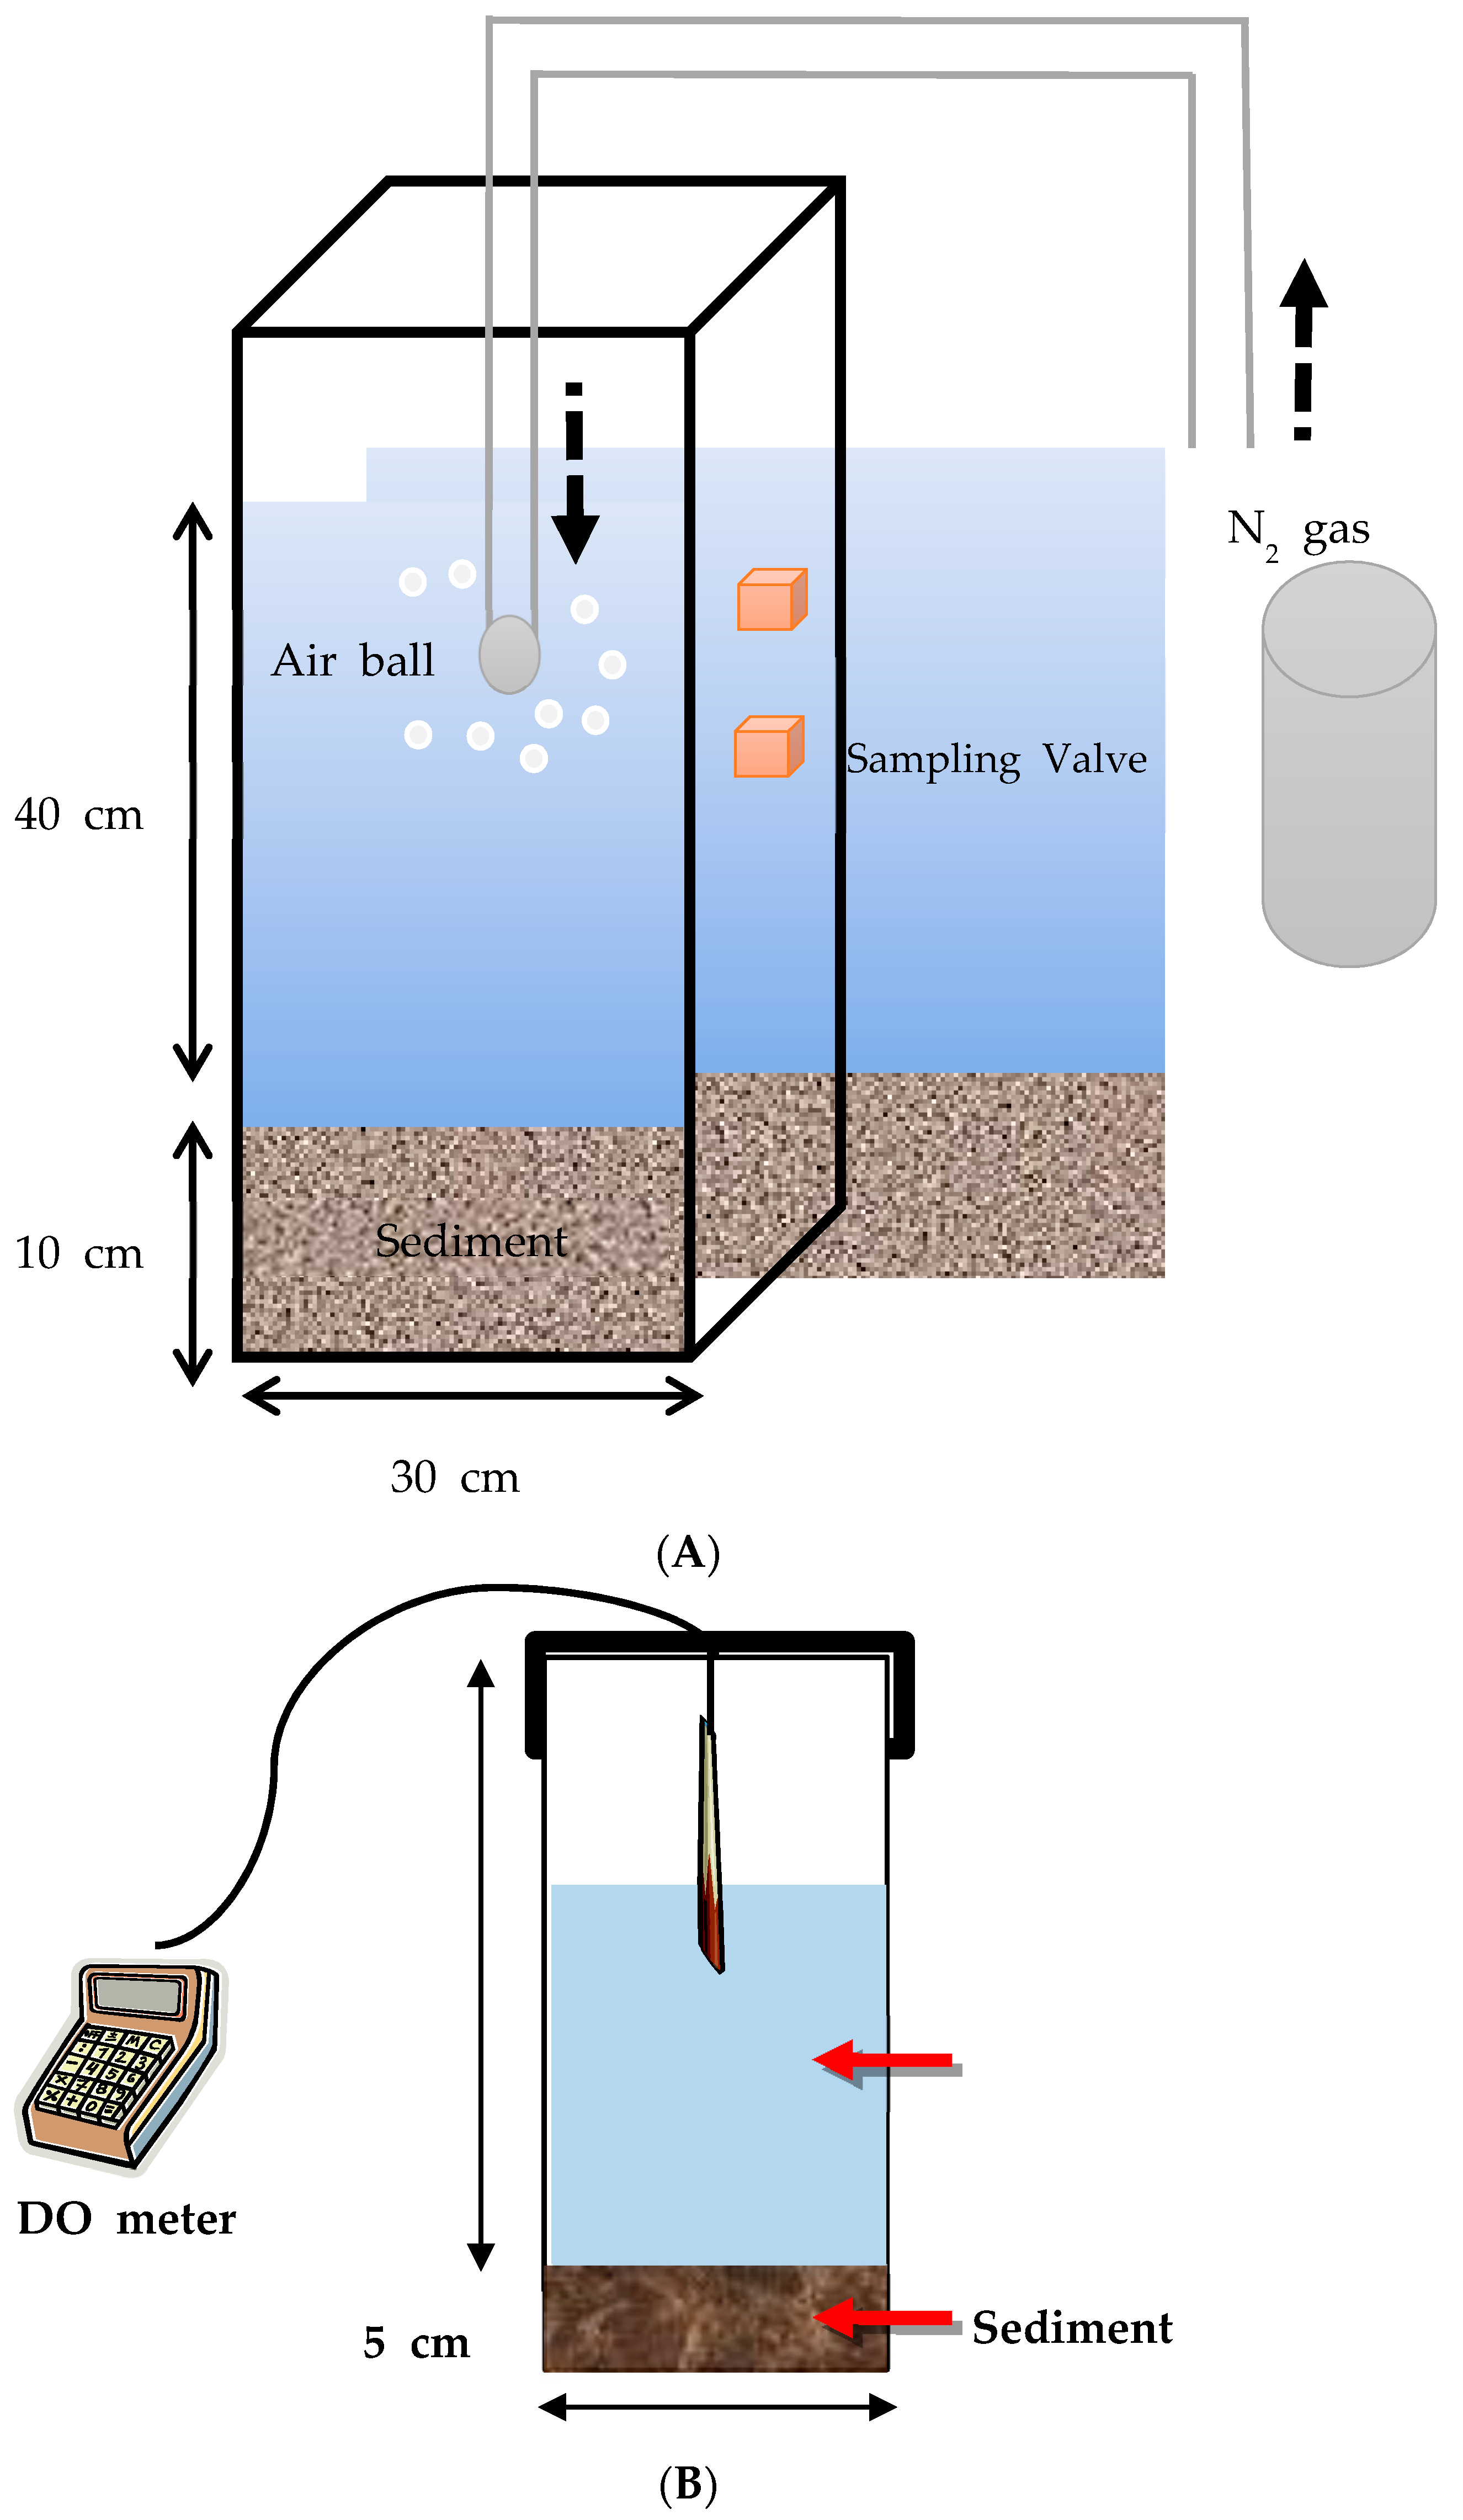
2.2. Sediment Oxygen Demand Measurement
A 5–6 cm thick layer of the sampled sediment was deposited at the bottom of a beaker (19 cm in diameter and 27 cm in height), to which 5 L of lake water was added. The DO concentration was analyzed using a DO meter (YSI 5100, USA) at regular time intervals once the sediments were stabilized in the beaker until the DO concentration plateaued. During the monitoring period, the beaker was kept under dark conditions at 20 °C sealed with aluminum foil (
Figure 2). The SOD was calculated according to the following Equation (1):
where Oc = O
2 consumption (mg L
−1), V = volume of water (L), A = water–sediment interface area (m
2), and T = time (d). To estimate the oxygen demand of the sediment collected from different sites, the average SOD during 16 h was compared.
2.3. Evaluation of the Contaminant Release from Sediment in Relation to Changes in the Salinity Level
The release of water quality-related chemicals from the sediment was monitored under anaerobic conditions in a specially manufactured acrylic reactor (
Figure 2). N
2 gas was continuously supplied into the reactor at 50 mL min
−1 to maintain the anaerobic conditions, with the whole body of the reactor covered by an aluminum foil strip to block any autonomous aeration caused by light penetration. After the reactor was set up, 250 mL of water was sampled from the reactor every 24 h for a week. The chemical oxygen demand (COD) and the concentrations of the total nitrogen (T-N) and total phosphorous (T-P) were measured according to the standard method (Korean Standard method).
3. Results and Discussion
3.1. SOD Analysis
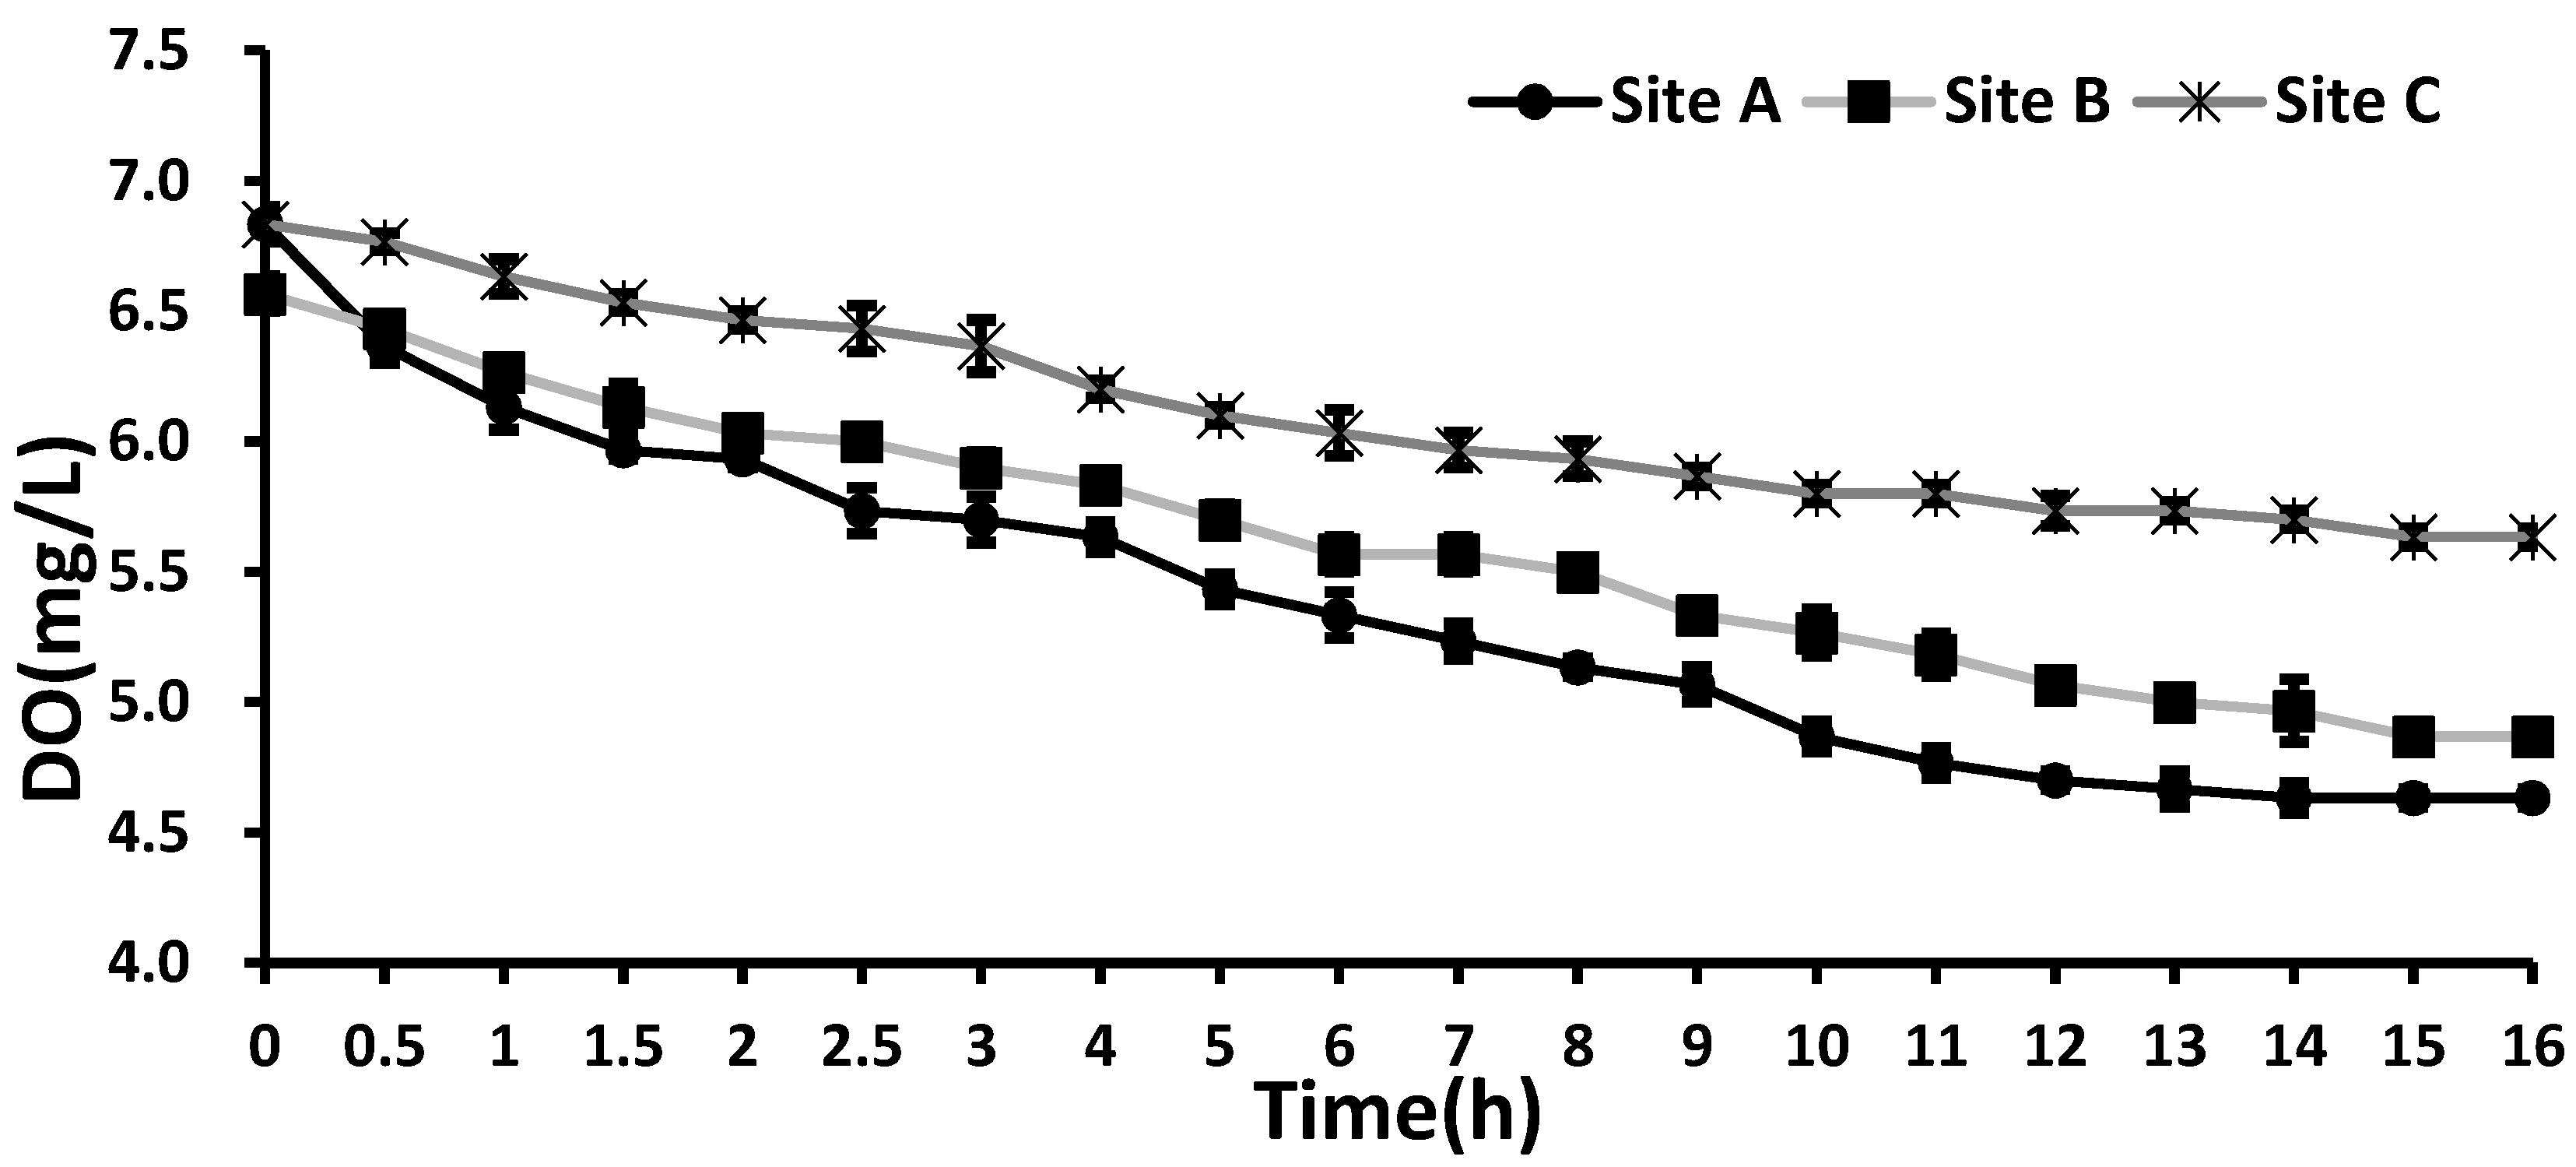
The SOD analysis revealed that the DO concentration gradually decreased in all cases (
Figure 3). The initial DO concentrations were in a similar range across three sites: Site A (6.60 mg/L), Site B (6.84 mg/L), and Site C (6.81 mg/L). The lowest DO concentration was found in the Site C sample, accounting for a 17% reduction relative to its initial DO. In general, sediments containing more organic substances exhibited higher SOD values [
17]. The SODs of Sites A and B were 0.483 and 0.463 g·O
2 m
−2 d
−1, respectively, which were higher than that of Site C (0.26 g·O
2 m
−2 d
−1). Thus, sites with higher concentrations of organic substances (A and B) exhibited enhanced values of SOD relative to Site C, with reduced organic substances (
Table 3).
Furthermore, the DO concentration in Site A decreased rapidly during the initial 1.5 h, but this rapidly decreasing pattern was not observed at Site C with the maximum salinity. In general, high salinity is likely to result in low SOD because it can suppress the microbial activity (e.g., decomposition of organic substances) [
17]. Our results also suggest that under high salinity (Site C), higher DO levels are maintained with lower SOD, probably due to the reduced microbial activity under which less oxygen is consumed during the decomposition of organic substances. In addition, an anaerobic condition is likely to be maintained when sediment has high levels of organic substances under stratification conditions. All these situations are likely to have an effect on salinity, as hypoxia can be accelerated, especially under reduced salinity conditions.
3.2. Contaminant Release Rate in Relation to Salinity Differences
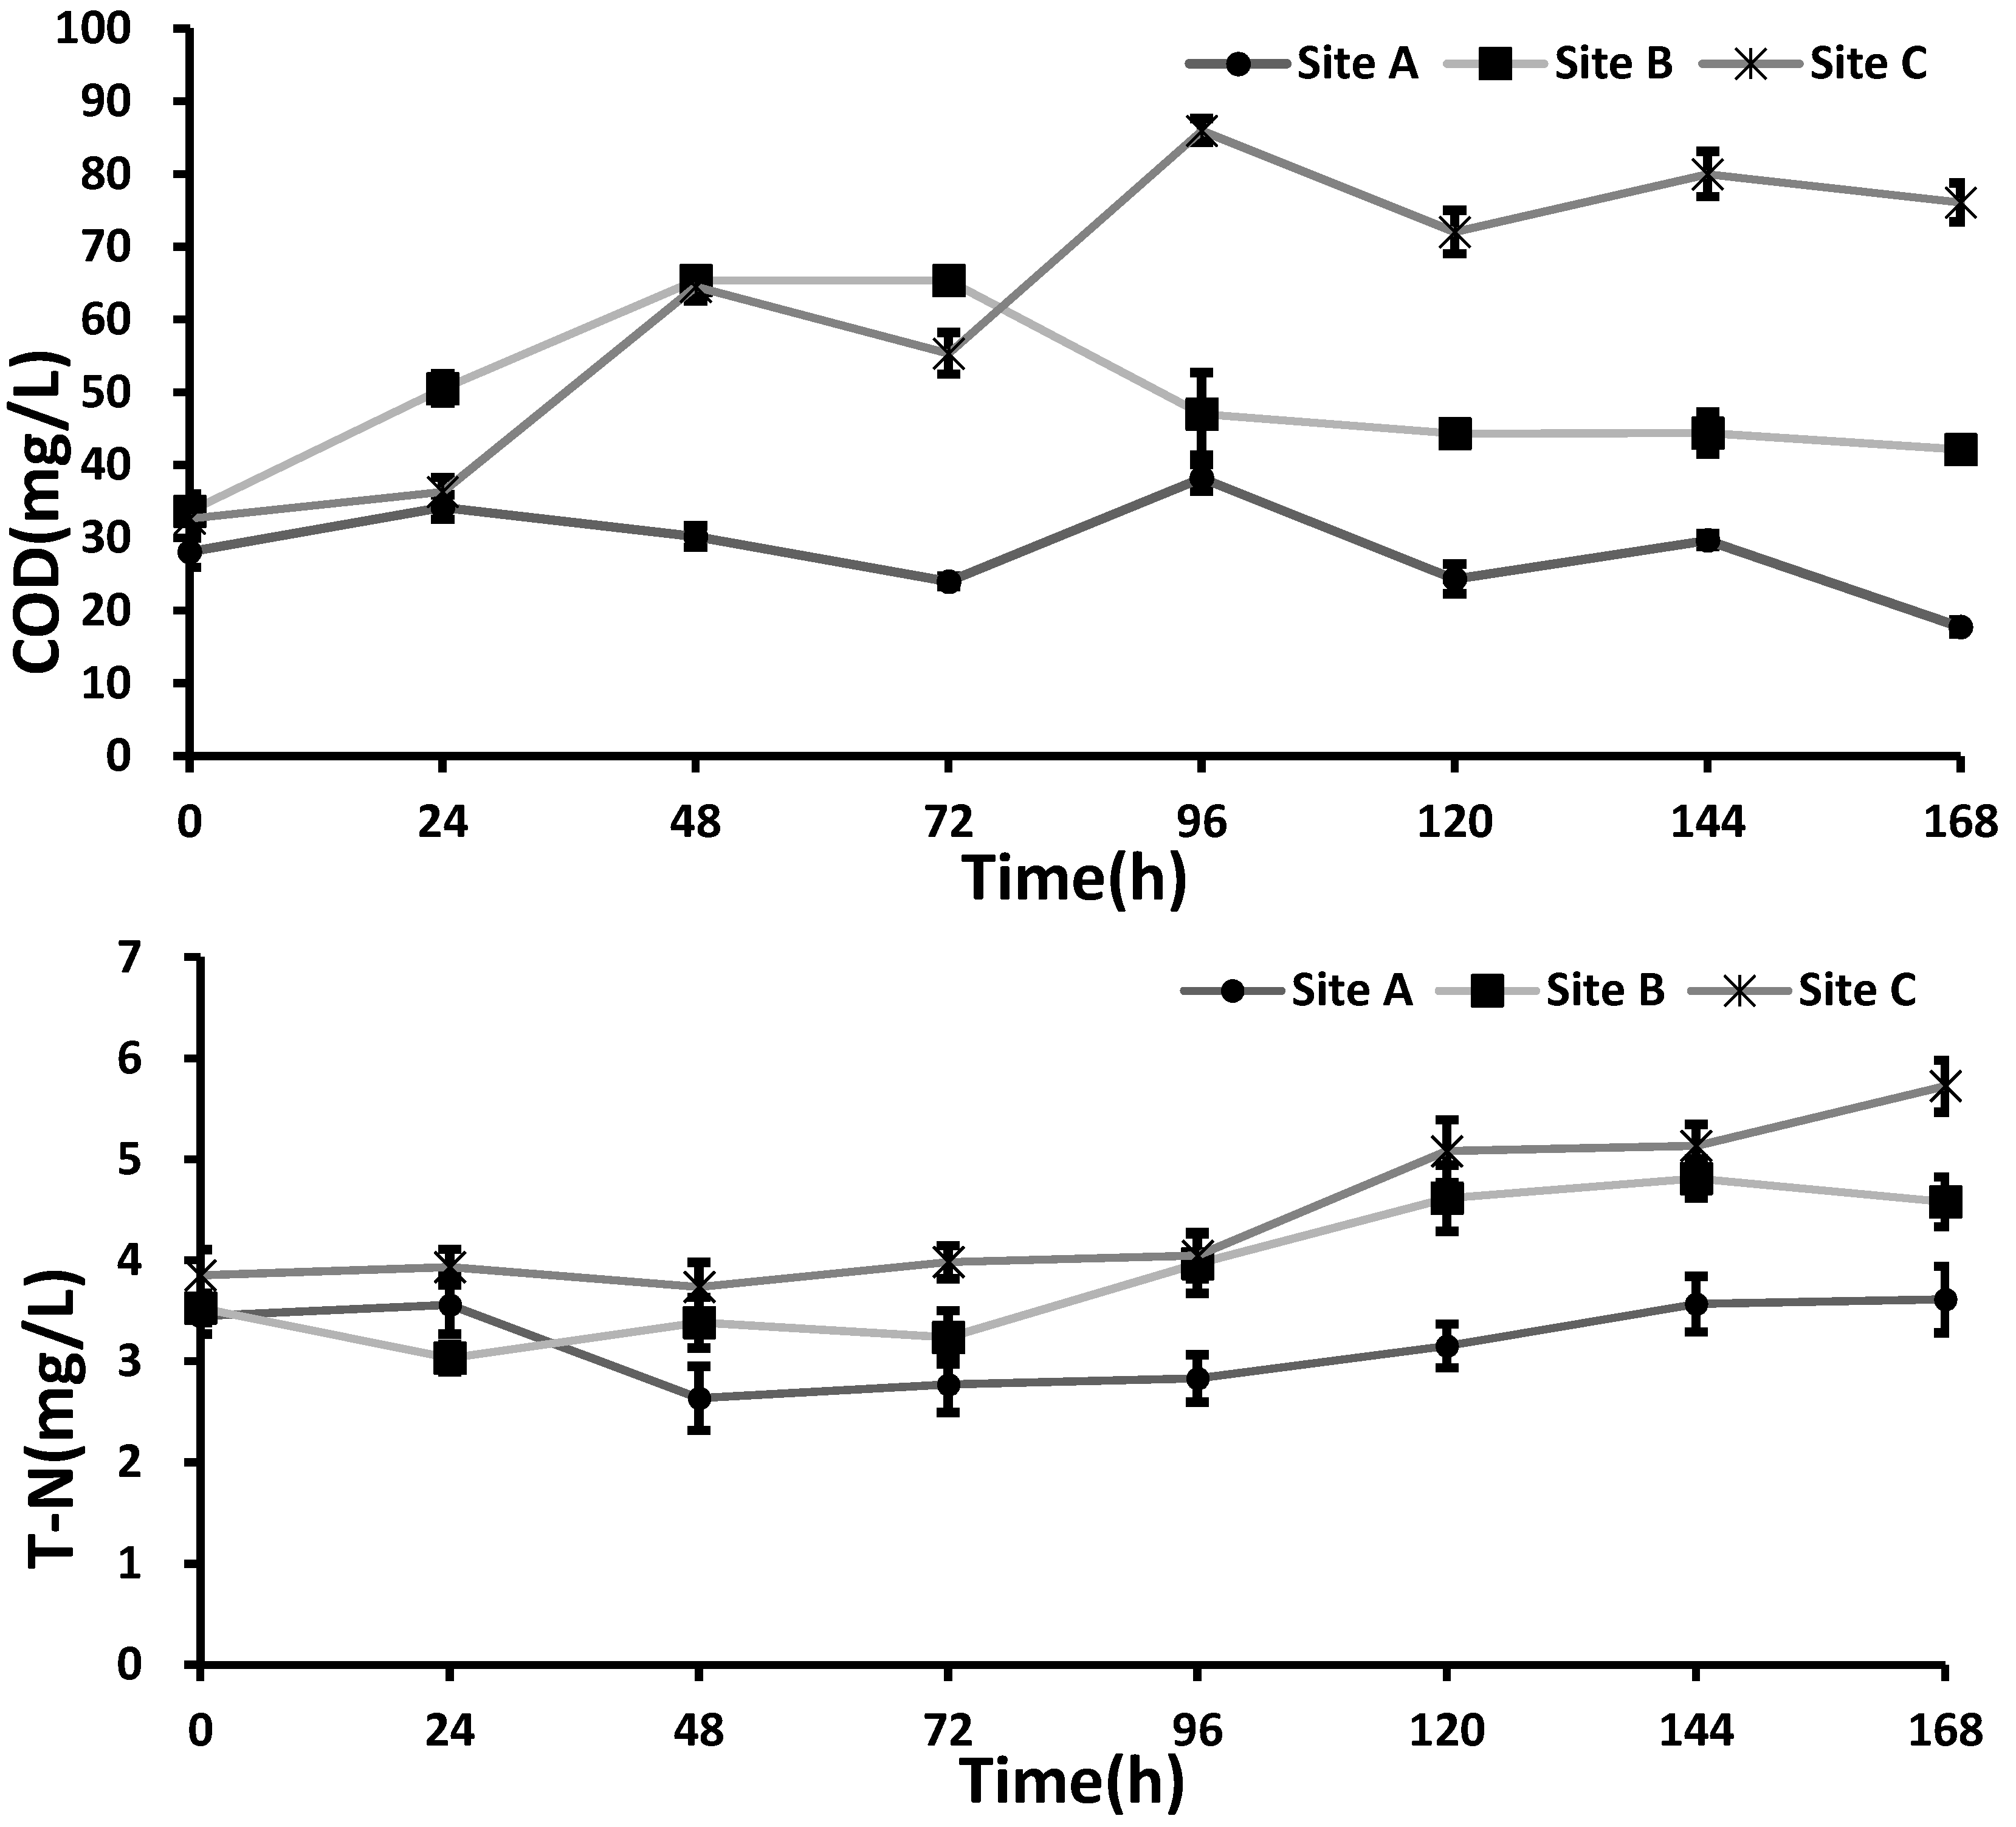
Changes in the COD under anaerobic conditions for all three sites are plotted in
Figure 3. The COD increased with the salinity level, to show the highest COD (76 mg/L) in the Site C sample (the highest salinity). In contrast, the lowest COD value was observed at site A with the lowest salinity (
Figure 3 and
Table 3). It was suggested that the activity of the microorganisms should exert strong controls on the release of organic substances from the sediment to water [
18]. However, our results suggest that both the microorganism activity and salinity should interact with each other to affect the release of organic substances from sediment. Under high salinity conditions, ion exchange between the water and microorganisms and the consequent elevation in osmotic pressure should result in cell wall breakdown. As a result, the organic contents of cells—especially the algal cells—are likely released into the surrounding water [
19]. This appears to be the main reason for enhanced levels of COD under the high salinity conditions (Site C).
The concentration of total nitrogen (T-N) released from the sediment under the anaerobic conditions did not change significantly at Site A. On the other hand, the T-N levels at sites B and C began to increase noticeably after 96 h (
Figure 4). At the end of the experiment, the T-N reached the highest level at site C, up to 5.72 mg L
−1. This result was consistent with what was expected from the dynamics of the COD.
In general, the amount of N in water is reduced as N is denitrified in the anaerobic condition. During the denitrification process, nitrogen is transformed into NH
3 or N
2 gas by increasing the activities of the denitrifying bacteria [
20]. However, the metabolism of the denitrifying bacteria is likely to be suppressed in a high salinity range. This has been shown to lead to a reduction in the denitrification rate [
21]. Therefore, the T-N value remaining in the water at Sites B and C was higher than that at Site A, although their initial T-N concentrations were similar.
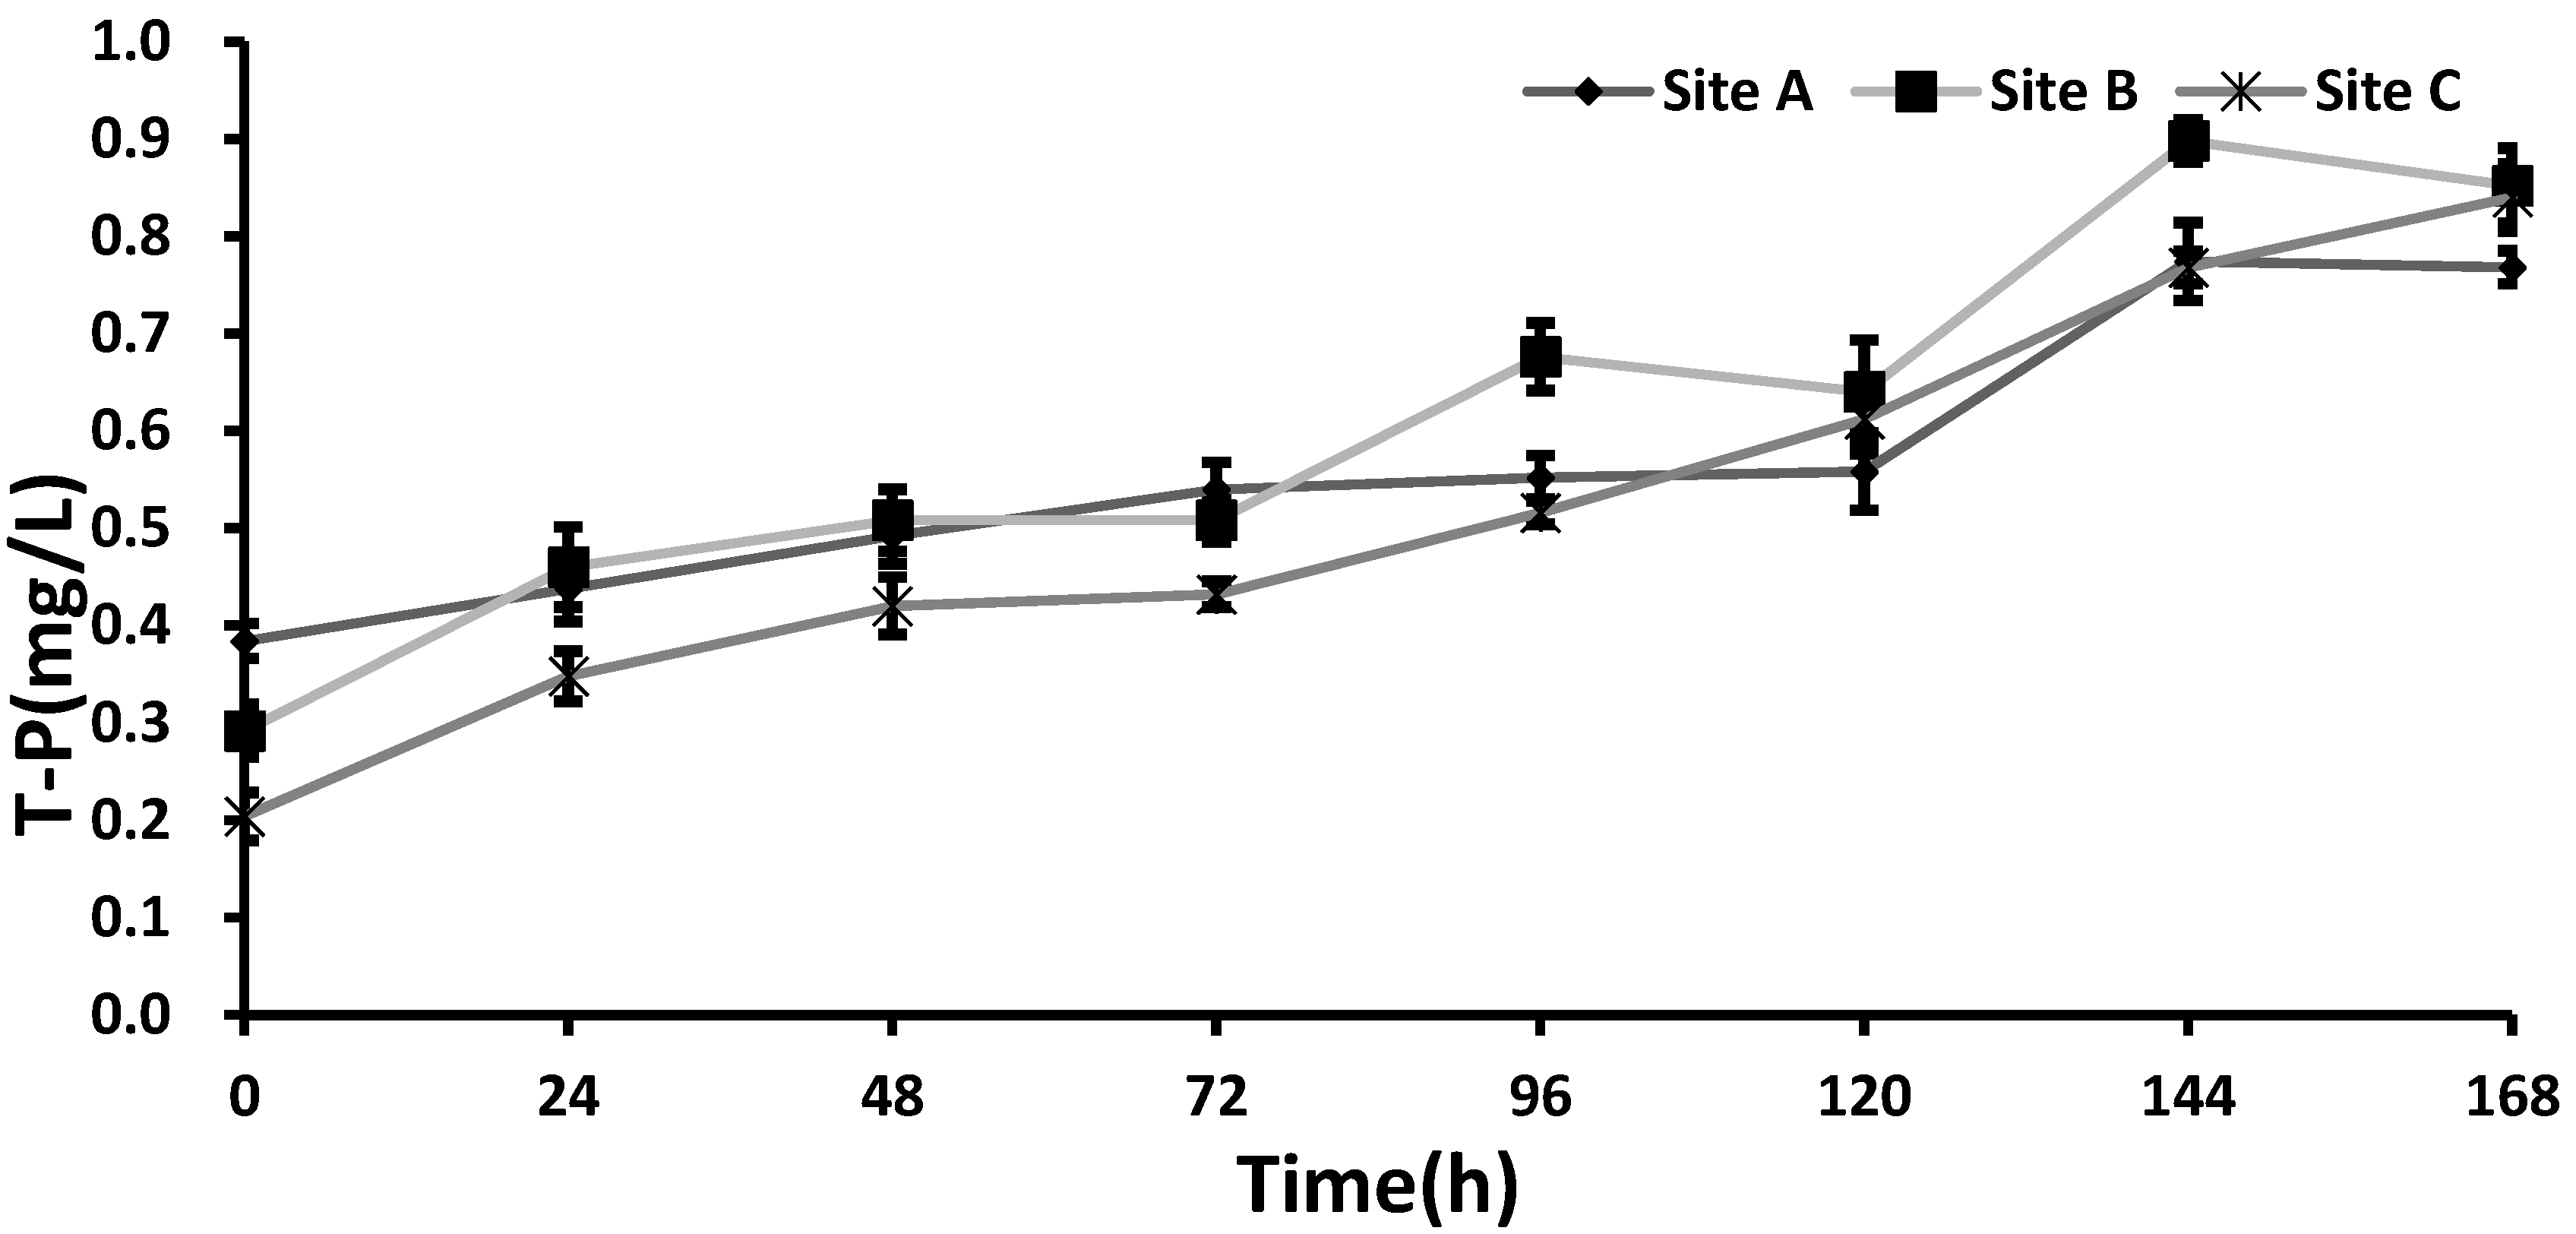
Compared with the T-N concentration, the total P (T-P) concentration showed an increasing pattern at all sediment sites, without any apparent difference during the experiment (
Figure 4). The result suggests that the effect of salinity on the release of P was minimal. In the work, it was noted that microorganisms related with P release show proper activity at a salinity concentration below 4000 mg/L [
22]. In our study, the highest salinity was 38.3 mg L
−1 at site C. Consequently, T-P appeared to increase, regardless of the salinity level of the water.
4. Conclusions
This work was carried out to help expand our understanding of the effect of salinity on water quality by assessing the release patterns of water-quality variables like N, P, and COD from the sediment of an artificial lake under anaerobic conditions. As our experiments focused on the water-sediment column, the release rate of the chemicals was examined mainly in relation to the SOD with the varying salinity levels in the water column. As the water columns were stratified, a high salinity level with a high SOD was prevalent under anaerobic conditions. The effect of the high salinity was also significant to stimulate the release of nitrogen by promoting the cell breakdown of algae and the suppression of metabolic activity. In contrast, the phosphorus release was not sensitive to changes in the salinity conditions. Overall, our study suggests that contaminant release from sediment and its overall impact on the water quality of a brackish lake can vary according to the temporal and spatial dynamics of the salinity.
Acknowledgments
The corresponding author acknowledges the support of the Cooperative Research Program for Agriculture Science & Technology Development (Project title: Study on model development to control odor from pigpens, Project No. PJ01052101), Rural Development Administration, Republic of Korea. K.-H.K. acknowledges support made in part by grants from the National Research Foundation of Korea (NRF) funded by the Ministry of Science, ICT & Future Planning (No. 2016R1E1A1A01940995). This work was also carried out with the support of “Cooperative Research Program for Agriculture Science and Technology Development (Project No. PJ012521032017)” Rural Development Administration, Republic of Korea.
Author Contributions
Tae-Hoon Kim, Ji Hoon Kang and Sang Hyun Kim wrote the main manuscript text and prepared all Tables and Figures. Jong Min Oh and Ki-Hyun Kim added scientific and scholarly comments in the manuscript with the thorough revision of the text. I-Song Choi and Kwang-Hyeon Chang also conducted the sampling and analysis. All authors read and approved the final manuscript.
Conflicts of Interest
The authors declare no conflict of interest.
References
- Oh, J.; Cho, Y. Effects of nutrients release from sediments on water quality in a small-size reservoir. J. Korean Soc. Environ. Eng. 2007, 29, 1217. [Google Scholar]
- Otubu, J.E. Temperature and Nutrient Effect on Tubificid Worms and Their Relation to Sediment Oxygen Demand; Rutgers University: New Brunswick, NJ, USA, 1989. [Google Scholar]
- Jeppesen, E.; Jensen, J.P.; Sondergaard, M.; Lauridsen, T.; Landkildehus, F. Trophic structure, species richness and biodiversity in Danish lakes: Changes along a phosphorus gradient. Freshw. Biol. 2000, 45, 201–218. [Google Scholar] [CrossRef]
- Chapra, S.C.; Canale, R.P. Long-Term Phenomenological Model of Phosphorus and Oxygen for Stratified Lakes. Water Res. 1991, 25, 707–715. [Google Scholar] [CrossRef]
- Furumai, H.; Ohgaki, S. Adsorption Desorption of Phosphorus by Lake-Sediments under Anaerobic Conditions. Water Res. 1989, 23, 677–683. [Google Scholar] [CrossRef]
- Mortimer, C.H. Chemical Exchanges between Sediments and Water in Great Lakes—Speculations on Probable Regulatory Mechanisms. Limnol. Oceanogr. 1971, 16, 387–404. [Google Scholar] [CrossRef]
- Andrieux-Loyer, F.; Aminot, A. Phosphorus forms related to sediment grain size and geochemical characteristics in French coastal areas. Estuar. Coast. Shelf Sci. 2001, 52, 617–629. [Google Scholar] [CrossRef]
- Hupfer, M.; Dollan, A. Immobilisation of phosphorus by iron-coated roots of submerged macrophytes. Hydrobiologia 2003, 506, 635–640. [Google Scholar] [CrossRef]
- Kim, L.H.; Choi, E.; Stenstrom, M.K. Sediment characteristics, phosphorus types and phosphorus release rates between river and lake sediments. Chemosphere 2003, 50, 53–61. [Google Scholar] [CrossRef]
- Liikanen, A.; Murtoniemi, T.; Tanskanen, H.; Vaisanen, T.; Martikainen, P.J. Effects of temperature and oxygen availability on greenhouse gas and nutrient dynamics in sediment of a eutrophic mid-boreal lake. Biogeochemistry 2002, 59, 269–286. [Google Scholar] [CrossRef]
- Zhang, K.; Cheng, P.-D.; Zhong, B.-C.; Wang, D.-Z. Total phosphorus release from bottom sediments in flowing water. J. Hydrodyn. Ser. B 2012, 24, 589–594. [Google Scholar] [CrossRef]
- Lee, C.H.; Lee, B.Y.; Chang, W.K.; Hong, S.; Song, S.J.; Park, J.; Kwon, B.O.; Khim, J.S. Environmental and ecological effects of Lake Shihwa reclamation project in South Korea: A review. Ocean Coast. Manag. 2014, 102, 545–558. [Google Scholar] [CrossRef]
- Kang, H.; Jang, J.H. Water quality modeling for the water quality conservation of estuary reservoir in Korea. Desalination Water Treat. 2015, 53, 1840–1854. [Google Scholar] [CrossRef]
- Ueda, S.; Kawabata, H.; Hasegawa, H.; Kondo, K. Characteristics of fluctuations in salinity and water quality in brackish Lake Obuchi. Limnology 2000, 1, 57–62. [Google Scholar] [CrossRef]
- Jackson, M.L. Soil Chemical Analysis; Prentice-Hall: Upper Saddle River, NJ, USA, 1958. [Google Scholar]
- International Organization for Standardization (ISO). ISO 11261 Soil Quality—Determination of Total Nitrogen—Modified Kjeldahl Method; ISO: Geneva, Switzerland, 1995. [Google Scholar]
- Phae, C.; Jung, M.J.; Kim, H.K. A Study on Degradation Characteristics of Organic materials by Mesophilic and Thermophilic Microorganisms in Composting. Environ. Issues Korea Jpn. 1996, 1, 104–122. [Google Scholar]
- Chau, K. Field measurements of SOD and sediment nutrient fluxes in a land-locked embayment in Hong Kong. Adv. Environ. Res. 2002, 6, 135–142. [Google Scholar] [CrossRef]
- Tokuz, R.; Eckenfelder, W., Jr. The Effect of F/M Ratio on an Activated Sludge System Treating High Salinity Wastewater. In Proceedings of the 46th Purdue Industrial Wastes Conference, Purdue University, West Lafayette, IN, USA, 1979. [Google Scholar]
- Liu, H.Y.; Tong, S.; Chen, N.; Liu, Y.; Feng, C.P.; Hua, Q.L. Effect of electro-stimulation on activity of heterotrophic denitrifying bacteria and denitrification performance. Bioresour. Technol. 2015, 196, 123–128. [Google Scholar] [CrossRef] [PubMed]
- Yang, P.; Nitisoravut, S.; Wu, J.S. Nitrate removal using a mixed-culture entrapped microbial cell immobilization process under high salt conditions. Water Res. 1995, 29, 1525–1532. [Google Scholar] [CrossRef]
- Panswad, T.; Anan, C. Specific oxygen, ammonia, and nitrate uptake rates of a biological nutrient removal process treating elevated salinity wastewater. Bioresour. Technol. 1999, 70, 237–243. [Google Scholar] [CrossRef]
© 2017 by the authors. Licensee MDPI, Basel, Switzerland. This article is an open access article distributed under the terms and conditions of the Creative Commons Attribution (CC BY) license (http://creativecommons.org/licenses/by/4.0/).

 ,
, 

