Enhancing Urban Development Quality Based on the Results of Appraising Efficient Performance of Investors—A Case Study in Vietnam


1
Department of Industrial Engineering and Management, National Kaohsiung University of Applied Sciences, No. 415 Chien Kung Road, Sanmin District, Kaohsiung City 80778, Taiwan
2
Department of Industrial Engineering and Management, Fortune Institute of Technology, Kaohsiung 83160, Taiwan
*
Author to whom correspondence should be addressed.
Sustainability 2017, 9(8), 1397; https://doi.org/10.3390/su9081397
Submission received: 4 July 2017
/
Revised: 2 August 2017
/
Accepted: 7 August 2017
/
Published: 8 August 2017
(This article belongs to the Special Issue Sustainable Urbanization Strategies in Developing Countries)
Abstract
:Economic development and the overpopulation in Vietnam have led to rapid urbanization, which has posed countless difficulties and challenges to its government. In particular, creating adequate accommodation, life activities, and entertainment are extremely urgent issues. The planning and investment in industry zones, urban areas, residential districts, and amusement parks at the right time and right place contribute to social stability and economic development, and are important issues for every government—especially in Vietnam which remains a developing country with regard to rapid industrialization and modernization speed. The population density in many localities is too dense, while in others it is too thin, resulting in a state where inhabitants have no shelter, whereas many of the buildings have been abandoned. To deal with these matters, the authors used this study to assess the investment effectiveness of leading corporations in the field of investment in urban development and infrastructure investment in Vietnam. The study focused on addressing the following issues: assessing the effectiveness of corporations in urban development and infrastructure investment in Vietnam and predicting the business state of the groups. Through business data of corporations from 2013–2016, the authors used a Grey system theory to forecast business situations for the period from 2017–2020. The authors also used data envelopment analysis (DEA) to evaluate the effectiveness of investments of the group from 2013–2020. The results will help corporations in creating suitable investment and business strategies with the changes of the domestic and world economy, and can be considered as a foundation for management units, for local government to create planning projects with feasible content, for long-term vision, and practical efficiency to quickly meet the needs of urban development plans.
1. Introduction
1.1. Urban Planning and Development
Investment in urban development and infrastructure has been recognized by Vietnam’s government as one of the most important missions to boost economic development and sustainable growth.
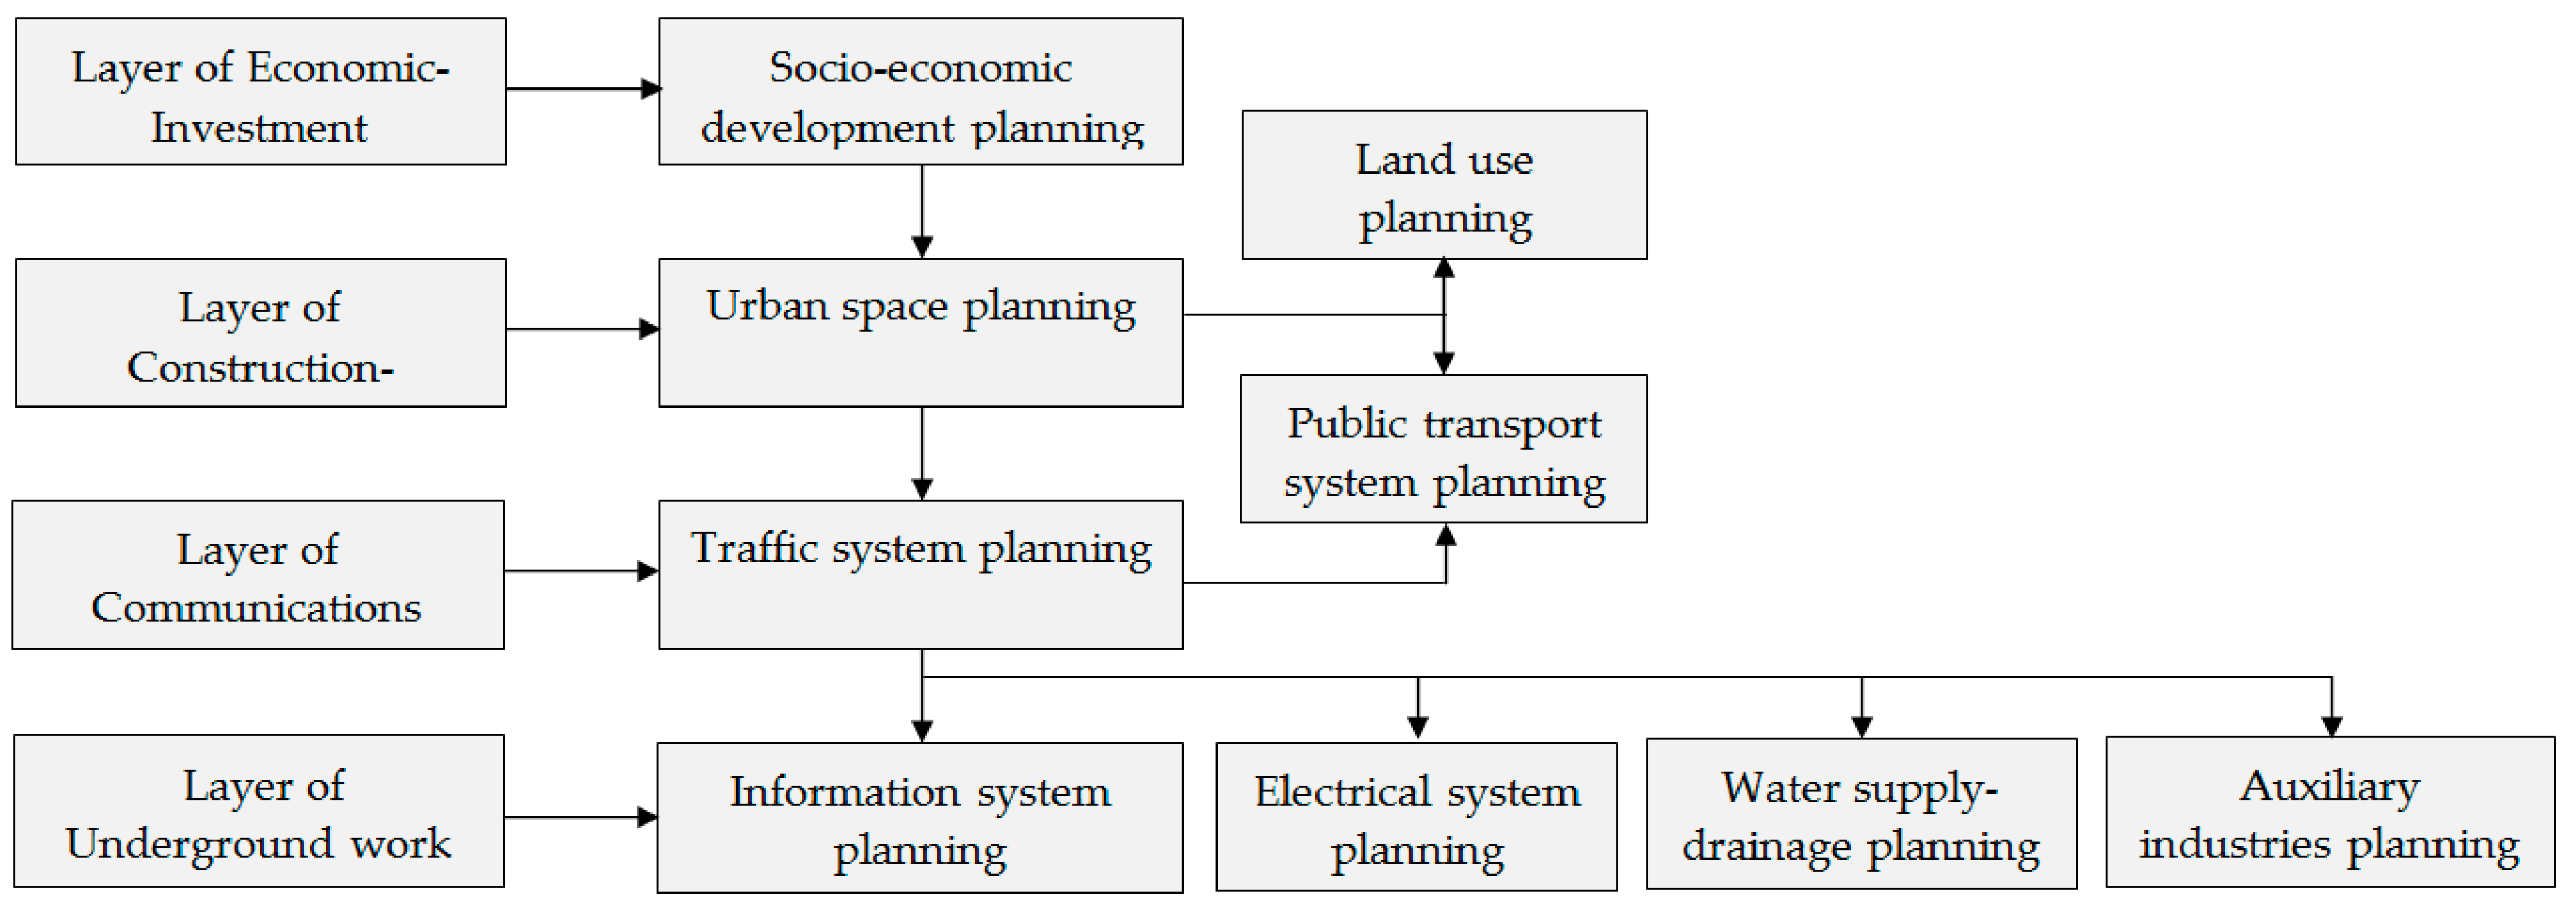
With regard to today’s practical requirements, urban development has demonstrated a number of comprehensive renovation requirements, particularly the integration of specialized planning with urban planning (see Figure 1). Toward sustainable development, urban planning products need to show a strategy, enhance the macro-regulations of the state, have community responsibilities, and to be able to put into place a comprehensive coordination system (integrated planning of technical infrastructure: transport, electricity, water, etc.) [1]. Integration of projects is demonstrated through the interconnection of planning layers, planning sectors, and sector planning systems. Urban development must ensure that waste is minimized in all sectors. Urban development projects should be easily coordinated between sectors and socio-economic infrastructure should be modernized and synchronized to meet the requirements of urban development integration.
1.2. Orientation and Urban Development in Vietnam
Vietnam is located in the heart of Southeast Asia, an area of land of 331,698 km2, and is divided into 63 provinces and cities [3]. Pursuant to Resolution No. 134/2016/QH13 of the national assembly of the socialist republic of Vietnam on the adjustment of land use planning in the national phase from 2017 to 2020, as shown in Table 1 [4].
Vietnam’s current population is about 94,444,200 people, ranks the 14th in the world, eighth in Asia, and third in Southeast Asia [5]. The population density is currently 305 people/km2, 5.2 times more than the population density in the world, and ranks third in Southeast Asia [5]. The average Vietnam population by area is shown in Table 2.
In recent years, along with innovation and integration policies as well as rapid socioeconomic development, Vietnam’s urban system has grown rapidly both in quantity and quality. By October 2015, there were about 788 metropolitan areas in Vietnam, including two special municipalities (Hanoi, Ho Chi Minh City), 15 first-class (I) cities, 25 second-class (II) cities, 42 third-class (III) cities, 74 fourth-class (IV) cities, and approximately 630 fifth (V) class cities. The rate of urbanization is approximately 35.2% [7]. The role of the system of urban planning projects has contributed greatly to the general development. However, based on the requirements of practical progression, it is obvious that some of the problems have to be fixed in the near future.
Besides, investment activities in general and investment in urban development and infrastructure investment in particular also get positive results: investments, disbursements, and budgets have grown increasingly, which created more jobs and contributed to improving the balance of payments and completing objectives and tasks of the social economic development plan in the period of 2010–2016. However, the state investment certificate does not match the planning, and it also takes place at the local area, particularly in creating luxury apartments, new urban areas, industrial parks, etc. Many projects were neither verified nor carefully reviewed for technical criteria, technology, working environment, etc. which leads to low-quality projects. Although the government and local authorities have a higher incentive, investors are not interested. That situation has led to the paradox that the local areas with a high economic development rate attract many projects with the economic growth rate exceeding the average growth rate for the whole country, while regions that are less developed, attract fewer projects, the economic growth rate is low, and without adjusting capital investment planning and orientation of the state, the disparity in development levels between economic regions will increase social imbalance and entail unpredictable consequences.
Further, the inspection and supervision of the implementation of the obligations of the investors on capital contribution schedules, capital raises, and construction activities, the environment, technology transfer, implementation of obligations to laborers and financial obligations toward the state are not good, which includes lack of coordination between ministries, branches, and localities. In addition, weakness of the infrastructure, the related infrastructure works, and the critical shortage of trained workers, engineers, and managers continue to be a barrier to urban development and infrastructure investment in Vietnam. In this research, through business data of decision-making units (DMUs), the authors use data envelopment analysis (DEA) to evaluate the effectiveness of investment of DMUs in the past and use the Grey system theory to forecast business situations for the next period.
2. Literature Review
In the past, some researchers combined DEA models and Grey system theory to their studies: Saranga [8] used DEA to identify the inefficiencies of DMUs in the Indian auto component industry. Leachman et al. [9] used DEA to assess the performances of DMUs in the automobile industry. Zhao et al. [10] employed DEA to evaluate the performances of DMUs in the Chinese coal mining industry. In the manufacturing and service industries, DEA has been applied to assess business performances and strategies. For example, Chandraprakaikul and Suebpongsakorn [11] used DEA to explore the operational performances of 55 Thailand logistics companies. Lo and Lu [12] argued the reasons for using DEA models, the super-slack-based measure (SBM), and Malmquist models. Charles et al. [13] used DEA to assess the efficiency of a Printed Circuit Boards assemble line. Chang et al. [14] proposed a nonradial DEA model with the slack-based measure (SBM) to analyze the environmental efficiency of China’s transportation section. Chia-Nan Wang and Nhu-Ty-Nguyen [15] combined DEA models and Grey system theory to evaluate the effectiveness and to predict the manpower of undergraduate educational systems.
Thus, the use of DEA to evaluate the efficiency of corporations in urban development and infrastructure investment sector in Vietnam from 2013 to 2016 and to use the Grey model (1,1) ((GM) (1,1)) to forecast business situations for the period from 2017 to 2020 help corporations make the right decisions for the future, thereby saving state budgets and avoiding wasting the country’s land resources [16]. These matters have importance and urgency for corporations and countries; the authors address these issues in the next section.
3. Materials and Methodology
3.1. Research Development
In this research, the authors combine DEA models and Grey system theory to evaluate the effectiveness of 16 leading corporations in urban development and infrastructure investment sector in Vietnam from 2013 to 2020, which includes four parts, as follows and as shown in Figure 2.
Part 1. The authors chose the research topic, then learned about the history of research in this field.
Part 2. Next, the authors continued to choose the appropriate group and input/output factors for the field of research, which included a suitable size and time in order to do the research data.
Part 3. After collecting data, the analysis stage, applying the models in this research, was conducted. GM (1,1) was used for developing a forecast through the time series data with four input factors and two output factors for all corporations. In fact, there were many prediction methods, and the authors used GM (1,1) to predict the data from the DMUs from 2017 to 2020 because this was a highly reliable prediction method and would be suitable with the data of DMUs [16]. Mean absolute percentage error (MAPE) was applied to measure the accuracy prediction and to check if the forecasting error was reliable.
- If the variables had MAPE, which were too large, they would be removed and returned to the step collecting data to rebuild a new DMU-DMU, which had variables that met our requirements. Besides, Malmquist radial models were used to evaluate a corporation’s performance in this period. Next, the results of GM (1,1), were utilized to see future trends.
- The business results from year 2013 to year 2016 of DMUs were put in the DEA model to measure the efficiency and distinguish the ranking of corporations. The DEA model was used to establish a best practice group from among a set of observed units and to identify the units that were inefficient when compared with the best practice group [17]. In this case, if the input factors and output factors had a correlation coefficient at zero and negative, they would be removed and returned to the step collecting data to rebuild a new DMU-DMU, which had variables that could meet our requirements.
- Next, the prediction results were put into the DEA model to measure efficiency and to distinguish the ranking of corporations in the period from 2017–2020.
Part 4. After that, based on the Malmquist productivity index (MPI) of corporations the efficiency change, technical change, and productivity index were analyzed, evaluated, and utilized to see future trends.
3.2. Data Collection
In this study, the authors combined DEA models and Grey system theory to evaluate the effectiveness of 16 leading corporations in urban development and infrastructure investment sectors in Vietnam from 2013 to 2016, as shown in Table 3.
Data used in this study (Appendix A) were collected from realistic financial reports on websites of corporations in the period from 2013–2016. After studying, the authors decided to use data with four input factors and two output factors as follows:
Input Factors:
- (1)
- Owner’s equity (OE): Total amount of capital contributed by owners that the business is not required to pay. The capital is invested by business owners and investors or formed from business results.
- (2)
- Total assets (TA): Total value of all assets of an enterprise, both tangible and intangible.
- (3)
- Cost of goods sold (CS): Total cost of the input of the business to create the product.
- (4)
- Total operating expenses (TE): Includes items of financial costs, selling expenses, and business management costs.
Output Factors:
- (1)
- Net sales (NS): Reflects an enterprise’s sales revenue and providing a service.
- (2)
- Profit after tax (PT): Reflects the result of a business (profit and loss) after income tax.
Therefore, these factors play an important role in assessing the effectiveness of investment and decision-making in the business of managers.
3.3. Methodology
3.3.1. Grey Forecasting Generation Theory
The initial data on the use of the GM (1,1) model for prediction should be tested according to formula [16]:
. All values must be within:
The GM (1,1) model is calculated by the following differential equation:
In this study, the original data are the actual business data of enterprises in the period from 2013–2016.
The initial data completed verification, which we calculated according to the following steps [16]:
The authors use the cumulative method to compute the values [16]:
The generated mean sequence of is defined as [16]:
The equations of the GM (1,1) model were built and the values calculated [16]:
The formula was built to calculate the predictive value of the model [16]:
The predicted value of the GM (1,1) model is calculated based on the following formula [16]:
Evaluation of Volatility Forecasts
The authors use the MAPE method to determine the reliability of the predicted values, calculated according to the following formula [34]:
The grades of mean absolute percentage error are divided into four levels as Table 4.
3.3.2. Data Envelopment Analysis Model
To evaluate the performance of the infrastructure investment and urban development groups in Vietnam, the authors used the following two models:
Super Efficiency SBM Model
This model, introduced by Tone (2001) [35], develops on SBM. We used n DMUs with input and output matrices and , respectively. is a non-negative vector in [35]. The vectors and indicate the input excess and output shortfall, respectively. The SBM model in fractional form is as follows [35]:
The authors optimized solution for SBM is . A DMU is super-SBM if . This condition is equivalent to in the optimal solution, the inputs are guaranteed and output is stable. SBM is non-radial and deals with input and output slack. The SBM returns an efficiency measure between 0 and 1 [35].
The best performer has an efficient status and is expressed by unity. Tone (2002) discriminates these efficient DMU and ranks the efficient DMUs by a super-SBM model [35]. The DMU is SBM-efficient, , and the super-SBM model will be followed [35]:
However, DEA’s previous models still have some limitations in assessing the business performance. Thus far, the DEA-Solver Pro 8.0 Manuel model has overcome these limitations [36]:
When . will be defined: If the output r has no positive elements, then it is defined as . The term is replaced by in the objective function in the following way (value never changes in constraint conditions) [36].
If the term is replaced by [36]:
If , the term is replaced by:
The B value in the DEA-Solver is 100. In all cases, the proposition is positive and tighter than . Furthermore, it is inversely proportional to the distance and it is related to the magnitude of the unsupportive output [36].
Malmquist Productivity Index (MPI)
To evaluate the performance of a business between two periods of time, the authors used three indicators:
Malmquist (MI); catch-up (C); and frontier shift (F).
- (MI) evaluates the performance change in the second period compared with the first period.
- (C) assesses the level of effort to improve the performance of the second period compared with the first period.
- (F) evaluates the change in performance boundaries around the second period compared with the first period.
The authors denote DMU0 in period 1 as , period 2 as , and use the following notations for efficiency of DMU measured by the frontier technology 𝑡2 [37]:
The formula for calculating the (C), (F), and (MI) index is as follows [37]:
If:
- The performance of period 2 is better than period 1.
- The performance of period 2 is equivalent to period 1.
- The performance of period 2 is less than period 1.
The authors developed output-oriented (MI) with output-oriented radial DEA models. The output-oriented models take all output slacks into account but no input slacks. This is explained below in output-orientation (O-V) [37]:
Subject to:
Intertemporal score in output-orientation (O-V):
Subject to:
The radial approaches suffer from one general problem in the neglect of slacks. Tone developed the non-radial measures of efficiency and super-efficiency: slacks-based measure (SBM) and super-SBM. Using these measures, the authors developed the non-radial and slacks-based MI. In the output-oriented case, the authors solved as follows [37].
SBM-O:
Subject to:
where the vector denotes the output-slacks [37].
Super-SBM-O:
Subject to:
4. Results and Discussion
4.1. Results and Analysis of the Grey Forecasting
The authors used the GM (1,1) model to predict the realistic input and output factors of top urban development and infrastructure investment in Vietnam corporations from 2017 to 2020. The authors used the factor of owner’s equity (OE)—Input 1 of DMU1 (at Table 5)—to explain calculation procedure in this part.
The sequence of raw data:
| X(0) = (364,972, 390,115, 382,949, 400,377) |
| X(1)(1) = X(0)(1) = 364,972 |
| X(1)(2) = X(0)(1) + X(0)(2) = 755,087 |
| X(1)(3) = X(1)(2) + X(0)(3) = 1,138,036 |
| X(1)(4) = X(1)(3) + X(0)(4) = 1,538,413 |
Then, the authors created the different equations of GM (1,1) to find X(1) series, the mean obtained by the mean equation as follows:
To find 𝑎 and 𝑏 in order to solve the equations, the primitive values are substituted into the Grey differential equation to obtain:
and converted into the form of a matrix as follows:
The authors used formula (7) to find a, b: .
Then, we used the two coefficients 𝑎 and 𝑏 into equation: .
The authors used formula (8) to find the prediction model:
Instead of values of k, we have the results:
| k = 1 | X(1)(1) = 364,972.00; | k = 5 | X(1)(5) = 1,940,019.92 | |||
| k = 2 | X(1)(2) = 750,939.24; | k = 6 | X(1)(6) = 2,347,005.30 | |||
| k = 3 | X(1)(3) = 1,142,057.00; | k = 7 | X(1)(7) = 2,759,421.68 | |||
| k = 4 | X(1)(4) = 1,538,394.01; | k = 8 | X(1)(8) = 3,177,341.53 |
The authors computed the simulated values of X(0) in the original series by Formula (9):
| X(0)(1) = X(1)(1) = 364,972.00—for year 2012 |
| X(0)(2) = X(1)(2) − X(1)(1) = 385,967.24 |
| X(0)(3) = X(1)(3) − X(1)(2) = 391,117.76 |
| X(0)(4) = X(1)(4) − X(1)(3) = 396,337.01 |
| X(0)(5) = X(1)(5) − X(1)(4) = 401,625.91—result forecast for year 2017 |
| X(0)(6) = X(1)(6) − X(1)(5) = 406,985.38—result forecast for year 2018 |
| X(0)(7) = X(1)(7) − X(1)(6) = 412,416.38—result forecast for year 2019 |
| X(0)(8) = X(1)(8) − X(1)(7) = 417,919.85—result forecast for year 2020 |
Thereby, the authors could obtain the forecasting results of all DMUs from 2017–2020 (Appendix B).
For checking the forecasting accuracy, the results of MAPE are listed in Table 6.
4.2. Pearson Correlation
To apply the DEA model, we have to ensure the relationship between input and output factors is isotonic, which means that, if the input quantity increases the output quantity could not decrease under the same condition [34]. Higher correlation coefficient means closer relation between two variables, while lower correlation coefficient means that they are less correlated [34].
The interpretation of the correlation coefficient is explained in more detail as follows. The correlation coefficient is always between (−1) and (+1). The closer the correlation is to (±1), the closer it is to a perfect linear relationship [34]. Its general meaning is shown in Table 7.
By convention is shown in Table 7, the results shown in Table 8 indicate that the correlation complies well with the prerequisite condition of the DEA model (correlation coefficients between input factors and output factors show strong correlation). This shows that these positive correlations of input and output variables are appropriate, which explains why the authors use these indicators for DEA methodologies. The correlation is important and affects the performance.
4.3. Performance Rankings
The results in Table 9 indicate that the number of efficient DMUs from the 2013–2016 sequence is 9, 11, 11, 12, and the number of inefficient DMUs sequence is 7, 5, 5, 4. Average scores are 1.1851, 1.4334, 1.4159, 1.6396, respectively, which explains that super-SBM can distinguish DMUs with differences in their scoring.
The results in Table 10 show scores and rankings of DMUs in the period from 2013–2016, which indicates that the ranking of corporations in urban development and infrastructure investment in Vietnam tends to change strongly year by year (for example, ranking of DMU10 changed from No.13 in 2013 increase to No.3 in 2014, reduced to No.11 of 2015 and increased to No.8 in 2016).
The authors used the forecasted results as input factors for the GM (1,1) model to evaluate the ranking of DMUs in the period of 2017–2020, as shown in Table 11. The results indicate that the ranking of corporations in urban development and infrastructure investment in Vietnam will change in the future. DMUs are divided into four groups:
- Group 1: DMUs get effective business; they are always at the top position and include DMU4 (ranking is, respectively, 3, 1, 1, 1); DMU5 (ranking is, respectively, 1, 2, 2, 2); DMU7 (ranking is, respectively, 2, 3, 3, 3); DMU15 (ranking is, respectively, 5, 4, 4, 4).
- Group 2: DMUs make strong progress in the future: DMU8 (ranking is, respectively, 13, 13, 9, 3); DMU9 (ranking is, respectively, 16, 13, 12, 10); DMU11 (ranking is, respectively, 9, 9, 6, 6); DMU14 (ranking is, respectively, 15, 16, 8, 7).
- Group 3: DMUs have inefficient business in the future: DMU10 (ranking is, respectively, 4, 5, 10, 13); DMU12 (ranking is, respectively, 12, 12, 14, 15); DMU16 (ranking is, respectively, 11, 15, 16, 16).
- Group 4: For other DMUs, there are small changes in this period.
This reflects the intense competition of corporations in urban development and infrastructure investment in Vietnam.
4.4. Components of the Malmquist Productivity Index (MPI)
4.4.1. Catch-Up Efficiency Change
The results of the changes in the catch-up of corporations in urban development and infrastructure investment are shown in Table 12. The results show the efficiency change in technology of the activity management as well as the attribute to investment planning, technical experience, management, and organization of corporations in urban development and infrastructure investment in Vietnam.
According to results in Table 12, the average Malmquist index catch-up for all DMUs in 2013–2014 is 0.9577 and 2014–2015 is 1.0050 (increased 4.94%). The index of next period, 2015–2016, is 1.0121 (increased 0.71%). Among 16 corporations, DMU6 (C.E.O. Investment J.S.C-CEO) and DMU10 (FLC Group J.S.C-FLC) have reduced the average Malmquist index catch-up in this period. However, DMU8 (Development Investment Construction J.S.C.-DIG) has the highest increased average Malmquist index catch-up (the year 2013 was 0.8159 increased to 1.2358 in 2016, equaled an increase of 51.46%), and DMU4 (Song Da Urban & Industrial Zone Investment & Development J.S.C-SJC) has the high increased average Malmquist index catch-up, with efficiency scores of 0.9043, 1.0113, and 1.1720, respectively, leading to the growth in the Malmquist index of corporations of the catch-up criteria in this period. This clearly indicates that, in this period, corporations in the urban development and infrastructure investment sector in Vietnam focused on technical efficiency in terms of technical experience, management, and organization making big changes in their catch-up scores during this period.
4.4.2. Frontier Shift
Table 13 shows results of the change in frontier shift of corporations in urban development and infrastructure investment sectors in Vietnam in the period of 2013–2016. Table 13 shows that corporations tended to strongly change their levels of technical changes or their innovation effect in this period. DMU5, especially, has the highest change in Malmquist index frontier shift (in the year 2013 it was 0.4103, in 2016 the Malmquist index was 1.7506 (increased 327%). Average Malmquist index frontier shift of all DMUs in 2013–2014 is 0.5910 and period 2015–2016 is 1.0182 (increased 72.28%).
4.4.3. Malmquist Productivity Index
The Malmquist productivity index is the most important element in the performance evaluation of corporations in the urban development and infrastructure investment sector in Vietnam. The results, as shown in Table 14, indicate that, in the period of 2013–2016, most of the corporations (14/16 DMUs) performed inefficiently with the Malmquist productivity index being smaller than 1 (<1). In particular, DMU1, DMU3, DMU7, DMU10, and DMU14 have a low Malmquist productivity index (with Malmquist productivity index scores of 0.3995, 0.1172, 0.3183, 0.3368, and 0.3544, respectively). However, during the period of 2014–2016, these companies dramatically improved their performance, thus increasing the average Malmquist productivity index (the period 2013–2014 was 0.5713, period 2014–2015 Malmquist productivity index was 1.0610, and period 2015–2016 was 1.0299). Note that DMU3 (Tu Liem Urban Development J.S.C.-NTL) has the highest increased average The Malmquist productivity index (the period 2013–2014 was 0.1583, period 2014–2015 was 0.9707, and period 2015–2016 was 0.9153), and DMU14 (Becamex Infrastructure Development J.S.C-IJC) has the high increased average Malmquist productivity index, with efficiency scores of 0.3988, 1.0070, and 0.9993, respectively, which shows these firms have managed their operations as well.
In general, the innovation in technology growth of corporations in the urban development and infrastructure investment sector in Vietnam in this period was positive. In the period of 2013–2016 investment corporations focused on technical efficiency in terms of technical experience, management, and organization. That is reflected in the result of changes in their catch-up scores and frontier shift scores leading to the growth in the Malmquist productivity index of corporations. This result reflects the process of socio-economic development in the localities with the building of more urban areas with increasingly modern infrastructure, contributing to boosting socio-economic development and country development.
4.5. Results Forecasting of the Malmquist Productivity Index in the Future
The authors used the output results of the GM (1,1) model to forecast Malmquist productivity index of corporations in urban development and infrastructure investment sector in Vietnam in the period of 2017–2020. Table 15 shows that 2017–2018 had a big change with stable changes in the period of 2018–2020.
4.6. Discussion
In this study, 16 leading corporations in urban development and infrastructure investment in Vietnam were involved, the results from the super-SBM model show the performance of the Top 3 are DMU5, DMU7, DMU9 from 2013–2016. With the lowest score, three DMUs with inefficient business in the past include DMU14, DMU11, DMU8. However, in the period of 2017–2020, there are small changes, performance scores on the Top 3 in the period include: DMU4, DMU5, DMU7. With the lowest score, three DMUs with inefficient business in the future include DMU1, DMU12, DMU16. They need action with strong improvement to get effective business in the future.
The results of this study can be considered as a foundation for management units, for local government to create planning projects with feasible content, for long-term vision, and practical efficiency to quickly meet the need for urban development plans: DMUs with effective business will have favorable conditions to attain greater achievements, which is helpful for sustainable urban development. Inefficient companies that caused the abandonment of the construction of many buildings and delay of construction affected urban development, wasted land and natural resources, and destroyed the urban structure. They will be restrictively granted permits. However, for the sustainable urban development in Vietnam, it is necessary to inherit the experience of developed countries such as Japan, Singapore, Australia, etc. It is also necessary to balance all cultural values and religious values, ensuring adequate technical, social, and service elements. There must be a combination of technical infrastructure planning and urban landscape design.
This research also gives international readers an additional perspective on the situation of urban development in developing countries in general and in Vietnam in particular. In addition, the research provides an additional means of assessing the investment effectiveness of corporations in urban development and infrastructure investment.
5. Conclusions
In the future, demand for residential real estate in Vietnam will remain high, especially in large urban centers, due to previous relatively small supply and relatively low quality; in addition, living standards will improve, and the process of urbanization will increase as well. The planning and investment in industry zones, urban areas, residential district, and amusement parks at the right time and right place contribute to social stability and economic development, which is an extremely important issue for Vietnam’s government to resolve.
Our limitations in this study are due to the specific nature of urban development and the infrastructure investment sector, under the strict management of the provisions of legislation. In this study, the authors only analyze, evaluate, and forecast business results of the groups in the past. Therefore, future research should incorporate analysis of the regulations and policies of the state management for the urban development and infrastructure investment sectors in order to introduce solutions and provide enterprises with a more general perspective for more accurate assessments and decisions. Another limitation is that the study only focuses on quantitative models. The authors will undertake more research of external environmental factors in the future. Comparisons with other quantitative and qualitative approaches will be in addition a worthwhile research direction.
Author Contributions
In this research, Chia-Nan Wang contributed to generating the research ideas and designing the theoretical verifications. Han-Khanh Nguyen analyzed the data, summarized and wrote and formatted the manuscript. Both authors have read and approved the manuscript.
Conflicts of Interest
The authors declare no conflict of interest.
Appendix A

Table A1.
Data of 16 DMUs in 2013 (Currency unit: Million VND).
| DMUs | Inputs | Outputs | ||||
|---|---|---|---|---|---|---|
| (I)OE | (I)TA | (I)CS | (I)TE | (O)NS | (O)PT | |
| DMU1 | 364,972 | 1,112,361 | 140,222 | 41,366 | 238,066 | 44,749 |
| DMU2 | 3,215,849 | 14,585,799 | 5,198,012 | 419,958 | 7,021,749 | 1,110,753 |
| DMU3 | 868,026 | 1,323,357 | 350,870 | 13,554 | 453,946 | 91,875 |
| DMU4 | 1,628,823 | 5,607,236 | 374,765 | 177,180 | 631,443 | 70,127 |
| DMU5 | 171,963 | 423,897 | 1,559,802 | 16,887 | 1,593,895 | 26,080 |
| DMU6 | 437,460 | 872,182 | 101,766 | 41,052 | 169,987 | 20,682 |
| DMU7 | 87,124 | 171,527 | 79,723 | 7671 | 82,503 | 1208 |
| DMU8 | 2,417,833 | 4,634,308 | 593,471 | 181,543 | 754,950 | 53,333 |
| DMU9 | 663,615 | 1,268,215 | 136,660 | 144,083 | 342,591 | 82,764 |
| DMU10 | 1,264,280 | 2,100,861 | 1,598,173 | 65,474 | 1,744,013 | 99,117 |
| DMU11 | 577,910 | 1,271,924 | 202,263 | 39,678 | 273,126 | 26,090 |
| DMU12 | 848,650 | 2,327,799 | 805,250 | 94,766 | 988,683 | 122,776 |
| DMU13 | 577,507 | 1,845,614 | 1,620,882 | 159,270 | 1,804,414 | 41,099 |
| DMU14 | 3,007,699 | 4,807,856 | 352,831 | 108,963 | 615,153 | 161,533 |
| DMU15 | 4,914,775 | 12,532,339 | 577,262 | 444,938 | 1,072,821 | 72,499 |
| DMU16 | 142,783 | 509,250 | 86,874 | 20,233 | 132,330 | 19,171 |
Table A2.
Data of 16 DMUs in 2014 (Currency unit: Million VND).
| DMUs | Inputs | Outputs | ||||
|---|---|---|---|---|---|---|
| (I)OE | (I)TA | (I)CS | (I)TE | (O)NS | (O)PT | |
| DMU1 | 390,115 | 1,114,028 | 195,573 | 43,110 | 295,588 | 57,299 |
| DMU2 | 2,726,244 | 15,567,845 | 4,841,982 | 1,063,880 | 6,512,808 | 498,757 |
| DMU3 | 861,747 | 1,367,020 | 174,517 | 21,567 | 228,313 | 36,675 |
| DMU4 | 1,765,921 | 5,419,827 | 892,867 | 182,754 | 1,226,062 | 156,395 |
| DMU5 | 181,772 | 397,461 | 1,664,585 | 11,406 | 1,700,861 | 27,004 |
| DMU6 | 545,379 | 1,392,932 | 253,451 | 49,235 | 448,924 | 85,090 |
| DMU7 | 81,584 | 161,321 | 93,363 | 8638 | 96,190 | 1366 |
| DMU8 | 2,458,135 | 5,034,820 | 540,795 | 118,835 | 691,031 | 43,921 |
| DMU9 | 1,072,227 | 2,160,453 | 204,365 | 136,709 | 506,181 | 167,834 |
| DMU10 | 3,915,705 | 5,403,552 | 1,805,738 | 107,434 | 2,063,590 | 355,854 |
| DMU11 | 609,786 | 1,207,709 | 325,809 | 36,536 | 392,025 | 22,689 |
| DMU12 | 1,051,315 | 2,293,764 | 1,300,332 | 79,301 | 1,554,415 | 148,275 |
| DMU13 | 627,893 | 1,950,652 | 1,861,845 | 175,989 | 2,119,961 | 90,419 |
| DMU14 | 3,066,255 | 6,730,499 | 641,228 | 114,830 | 1,035,575 | 230,445 |
| DMU15 | 6,256,482 | 13,048,822 | 481,366 | 390,485 | 1,069,035 | 325,617 |
| DMU16 | 231,191 | 479,857 | 145,182 | 21,595 | 235,077 | 51,018 |
Table A3.
Data of 16 DMUs in 2015 (Currency unit: Million VND).
| DMUs | Inputs | Outputs | ||||
|---|---|---|---|---|---|---|
| (I)OE | (I)TA | (I)CS | (I)TE | (O)NS | (O)PT | |
| DMU1 | 382,949 | 1,105,783 | 186,792 | 51,776 | 277,039 | 54,700 |
| DMU2 | 7,128,550 | 25,306,639 | 3,286,015 | 1,180,780 | 4,920,363 | 795,075 |
| DMU3 | 892,604 | 1,277,582 | 330,708 | 21,961 | 473,237 | 93,954 |
| DMU4 | 1,990,459 | 5,734,361 | 540,712 | 17,518 | 855,452 | 225,105 |
| DMU5 | 193,955 | 400,575 | 1,887,753 | 31,257 | 1,945,178 | 28,913 |
| DMU6 | 1,099,046 | 2,621,012 | 301,505 | 73,494 | 639,404 | 139,432 |
| DMU7 | 78,031 | 163,262 | 97,076 | 8687 | 100,020 | 2038 |
| DMU8 | 2,656,336 | 5,089,310 | 491,248 | 175,063 | 655,225 | 10,461 |
| DMU9 | 1,771,359 | 3,573,347 | 735,260 | 277,948 | 1,394,505 | 336,629 |
| DMU10 | 6,231,111 | 9,814,813 | 4,662,388 | 205,714 | 5,326,248 | 902,186 |
| DMU11 | 634,389 | 1,197,205 | 323,158 | 42,790 | 423,552 | 47,740 |
| DMU12 | 1,306,733 | 3,054,981 | 1,250,096 | 85,649 | 1,479,927 | 123,459 |
| DMU13 | 1,220,681 | 3,480,209 | 2,181,049 | 314,383 | 2,543,398 | 100,163 |
| DMU14 | 2,958,255 | 7,330,710 | 413,047 | 145,057 | 686,153 | 122,021 |
| DMU15 | 8,036,005 | 13,653,707 | 861,405 | 169,258 | 1,434,852 | 611,910 |
| DMU16 | 405,457 | 499,712 | 158,758 | 24,357 | 242,135 | 58,776 |
Table A4.
Data of 16 DMUs in 2016 (Currency unit: Million VND).
| DMUs | Inputs | Outputs | ||||
|---|---|---|---|---|---|---|
| (I)OE | (I)TA | (I)CS | (I) TE | (O)NS | (O)PT | |
| DMU1 | 400,377 | 1,375,058 | 320,147 | 41,542 | 412,151 | 55,192 |
| DMU2 | 6,486,159 | 34,317,744 | 6,763,559 | 3,128,873 | 11,217,376 | 1,648,549 |
| DMU3 | 960,240 | 1,361,034 | 349,763 | 21,183 | 433,359 | 74,755 |
| DMU4 | 2,111,372 | 5,973,319 | 272,802 | 35,620 | 522,934 | 176,768 |
| DMU5 | 219,655 | 418,065 | 2,173,099 | 12,382 | 2,233,442 | 43,405 |
| DMU6 | 1,565,350 | 3,845,534 | 892,916 | 209,639 | 1,389,774 | 159,497 |
| DMU7 | 97,067 | 195,844 | 105,544 | 7254 | 109,313 | 1022 |
| DMU8 | 2,821,029 | 5,900,679 | 845,290 | 199,359 | 1,160,790 | 77,791 |
| DMU9 | 3,537,355 | 5,562,791 | 1,454,880 | 441,255 | 2,506,517 | 537,203 |
| DMU10 | 8,407,080 | 17,790,121 | 4,581,295 | 878,184 | 6,284,334 | 979,250 |
| DMU11 | 668,047 | 1,424,087 | 372,527 | 40,763 | 478,861 | 58,141 |
| DMU12 | 1,698,364 | 6,518,163 | 1,368,415 | 365,333 | 1,982,946 | 202,947 |
| DMU13 | 2,162,392 | 5,041,852 | 3,714,012 | 312,354 | 4,046,846 | 104,962 |
| DMU14 | 2,978,667 | 9,123,731 | 1,599,369 | 189,242 | 1,959,659 | 137,835 |
| DMU15 | 8,622,076 | 14,657,548 | 865,066 | 252,696 | 1,972,459 | 557,957 |
| DMU16 | 509,974 | 664,521 | 189,209 | 49,318 | 282,883 | 43,630 |
Appendix B
Table A5.
Forecasted data of 16 DMUs in 2017 (Currency unit: Million VND).
| DMUs | Inputs | Outputs | ||||
|---|---|---|---|---|---|---|
| (I)OE | (I)TA | (I)CS | (I) TE | (O)NS | (O)PT | |
| DMU1 | 401,625.91 | 1,493,716.17 | 401,448.05 | 44,030.38 | 472,768.12 | 53,635.64 |
| DMU2 | 9,599,183.79 | 49,323,893.70 | 7,619,434.05 | 4,820,006.57 | 14,470,832.58 | 2,724,994.08 |
| DMU3 | 1,008,340.96 | 1,329,105.69 | 487,146.46 | 21,192.45 | 598,982.62 | 107,328.33 |
| DMU4 | 2,322,397.48 | 6,282,729.81 | 172,325.44 | 3390.86 | 365,955.39 | 205,245.64 |
| DMU5 | 239,714.55 | 426,512.99 | 2,474,423.15 | 19,066.82 | 2,552,657.96 | 54,071.53 |
| DMU6 | 2,467,059.08 | 5,994,681.61 | 1,348,359.99 | 332,697.37 | 2,244,721.91 | 215,828.75 |
| DMU7 | 102,941.49 | 211,902.54 | 111,547.06 | 6936.69 | 115,765.27 | 1211.68 |
| DMU8 | 3,027,087.41 | 6,286,282.96 | 1,031,922.58 | 257,675.67 | 1,476,073.78 | 95,119.83 |
| DMU9 | 5,858,764.19 | 8,491,323.52 | 2,988,004.70 | 725,207.47 | 4,670,966.44 | 880,872.80 |
| DMU10 | 11,962,047.87 | 29,519,601.10 | 6,883,331.46 | 640,619.30 | 9,971,156.30 | 1,505,650.36 |
| DMU11 | 697,933.26 | 1,514,906.06 | 391,083.83 | 44,283.44 | 526,196.48 | 87,804.43 |
| DMU12 | 2,136,617.49 | 10,282,494.66 | 1,377,309.19 | 266,449.65 | 2,174,322.28 | 228,133.96 |
| DMU13 | 3,636,516.68 | 7,685,015.54 | 5,141,238.78 | 418,143.16 | 5,487,800.82 | 113,782.79 |
| DMU14 | 2,913,864.46 | 10,491,506.98 | 2,128,601.23 | 240,364.68 | 2,647,888.12 | 82,396.81 |
| DMU15 | 10,227,133.89 | 15,478,539.04 | 1,162,283.64 | 140,178.78 | 2,635,794.46 | 744,701.53 |
| DMU16 | 732,552.40 | 767,500.24 | 214,006.17 | 72,361.45 | 305,969.74 | 44,645.92 |
Source: Calculated by researcher.
Table A6.
Forecasted data of 16 DMUs in 2018 (Currency unit: Million VND).
| DMUs | Inputs | Outputs | ||||
|---|---|---|---|---|---|---|
| (I)OE | (I)TA | (I)CS | (I) TE | (O)NS | (O)PT | |
| DMU1 | 406,985.38 | 1,672,630.65 | 538,209.07 | 43,326.97 | 572,672.25 | 52,622.03 |
| DMU2 | 12,891,994.66 | 71,262,852.64 | 9,590,593.64 | 9,388,769.86 | 20,954,720.41 | 5,096,575.57 |
| DMU3 | 1,065,120.08 | 1,326,064.51 | 645,944.95 | 21,006.33 | 760,437.87 | 135,287.74 |
| DMU4 | 2,534,707.54 | 6,594,014.25 | 99,926.75 | 928.12 | 244,720.14 | 215,641.95 |
| DMU5 | 263,989.56 | 437,556.71 | 2,828,537.22 | 19,437.10 | 2,925,041.28 | 70,318.70 |
| DMU6 | 3,914,309.29 | 9,492,120.91 | 2,919,045.02 | 755,659.86 | 4,176,431.95 | 284,494.36 |
| DMU7 | 113,147.20 | 234,754.07 | 118,706.86 | 6391.06 | 123,538.23 | 1099.58 |
| DMU8 | 3,241,464.44 | 6,829,971.75 | 1,352,088.02 | 326,260.53 | 2,016,067.99 | 169,202.95 |
| DMU9 | 10,809,453.21 | 13,391,523.79 | 6,479,164.36 | 1,229,583.76 | 9,144,709.47 | 1,492,764.04 |
| DMU10 | 17,108,394.17 | 52,639,620.42 | 9,554,195.16 | 2,001,077.48 | 15,166,884.96 | 2,185,132.89 |
| DMU11 | 730,643.35 | 1,653,269.53 | 419,589.49 | 46,601.06 | 582,392.70 | 129,144.09 |
| DMU12 | 2,722,053.14 | 18,452,454.53 | 1,414,476.73 | 720,431.82 | 2,490,144.95 | 276,670.84 |
| DMU13 | 6,514,121.45 | 11,888,410.03 | 7,544,169.80 | 527,726.04 | 7,787,422.79 | 122,419.79 |
| DMU14 | 2,871,351.94 | 12,294,320.85 | 4,278,868.76 | 308,978.82 | 4,230,600.52 | 59,802.34 |
| DMU15 | 11,889,421.27 | 16,412,834.59 | 1,475,434.90 | 103,046.86 | 3,580,228.41 | 916,694.81 |
| DMU16 | 1,039,636.84 | 914,945.17 | 245,190.37 | 117,352.06 | 336,932.06 | 41,748.47 |
Source: Calculated by researcher.
Table A7.
Forecasted data of 16 DMUs in 2019 (Currency unit: Million VND).
| DMUs | Inputs | Outputs | ||||
|---|---|---|---|---|---|---|
| (I)OE | (I)TA | (I)CS | (I) TE | (O)NS | (O)PT | |
| DMU1 | 412,416.38 | 1,872,975.17 | 721,560.38 | 42,634.79 | 693,687.86 | 51,627.58 |
| DMU2 | 17,314,339.42 | 102,960,123.09 | 12,071,695.30 | 18,288,149.26 | 30,343,817.82 | 9,532,161.10 |
| DMU3 | 1,125,096.40 | 1,323,030.29 | 856,508.09 | 20,821.85 | 965,413.25 | 170,530.66 |
| DMU4 | 2,766,426.66 | 6,920,721.60 | 57,944.76 | 254.04 | 163,648.22 | 226,564.86 |
| DMU5 | 290,722.82 | 448,886.39 | 3,233,328.47 | 19,814.58 | 3,351,748.11 | 91,447.76 |
| DMU6 | 6,210,559.48 | 15,030,049.18 | 6,319,398.32 | 1,716,340.06 | 7,770,487.64 | 375,005.82 |
| DMU7 | 124,364.72 | 260,069.91 | 126,326.22 | 5888.34 | 131,833.11 | 997.85 |
| DMU8 | 3,471,023.56 | 7,420,683.16 | 1,771,588.33 | 413,100.43 | 2,753,609.06 | 300,984.95 |
| DMU9 | 19,943,502.58 | 21,119,547.35 | 14,049,365.73 | 2,084,749.91 | 17,903,299.54 | 2,529,700.63 |
| DMU10 | 24,468,816.23 | 93,867,448.58 | 13,261,404.82 | 6,250,687.54 | 2,306,9982.30 | 3,171,258.00 |
| DMU11 | 764,886.45 | 1,804,270.38 | 450,172.89 | 49,039.97 | 644,590.50 | 189,947.10 |
| DMU12 | 3,467,898.82 | 33,113,858.99 | 1,452,647.26 | 1,947,917.77 | 2,851,841.20 | 335,534.23 |
| DMU13 | 1,166,8797.91 | 1,839,0892.28 | 1,107,0191.52 | 666,027.33 | 1,105,0684.17 | 131,712.41 |
| DMU14 | 2,829,459.67 | 1,440,6922.24 | 8,601,290.64 | 397,179.46 | 6,759,341.75 | 43,403.61 |
| DMU15 | 1,382,1891.80 | 1,740,3524.88 | 1,872,957.74 | 75,750.81 | 4,863,063.36 | 1,128,410.98 |
| DMU16 | 1,475,450.46 | 1,090,715.83 | 280,918.61 | 190,315.49 | 371,027.58 | 39,039.06 |
Source: Calculated by researcher.
Table A8.
Forecasted data of 16 DMUs in 2020 (Currency unit: Million VND).
| DMUs | Inputs | Outputs | ||||
|---|---|---|---|---|---|---|
| (I)OE | (I)TA | (I)CS | (I) TE | (O)NS | (O)PT | |
| DMU1 | 417,919.85 | 2,097,316.57 | 967,373.86 | 41,953.67 | 840,276.18 | 50,651.91 |
| DMU2 | 2,325,3682.43 | 148,756,140.88 | 1,519,4661.87 | 3,562,3027.09 | 4,393,9850.41 | 1,782,8067.87 |
| DMU3 | 1,188,449.95 | 1,320,003.01 | 1,135,709.94 | 20,638.99 | 1,225,639.57 | 214,954.50 |
| DMU4 | 3,019,329.19 | 7,263,616.02 | 33,600.56 | 69.53 | 109,434.15 | 238,041.05 |
| DMU5 | 320,163.26 | 460,509.43 | 3,696,049.29 | 20,199.39 | 3,840,703.20 | 118,925.58 |
| DMU6 | 9,853,858.31 | 2,379,8936.04 | 1,368,0773.95 | 3,898,345.45 | 1,445,7431.33 | 494,313.37 |
| DMU7 | 136,694.34 | 288,115.81 | 134,434.64 | 5425.17 | 140,684.93 | 905.54 |
| DMU8 | 3,716,839.96 | 8,062,484.09 | 2,321,243.28 | 523,054.28 | 3,760,965.85 | 535,404.02 |
| DMU9 | 3,679,5875.53 | 3,330,7283.59 | 3,046,4526.99 | 3,534,677.62 | 3,505,0663.50 | 4,286,936.90 |
| DMU10 | 3,499,5860.03 | 167,385,285.69 | 1,840,7082.44 | 1,952,5028.49 | 3,509,1192.73 | 4,602,409.92 |
| DMU11 | 800,734.43 | 1,969,062.85 | 482,985.48 | 51,606.53 | 713,430.85 | 279,377.08 |
| DMU12 | 4,418,107.07 | 5,942,4487.71 | 1,491,847.84 | 5,266,818.51 | 3,266,074.22 | 406,921.17 |
| DMU13 | 2,090,2411.14 | 2,844,9970.86 | 1,624,4218.18 | 840,573.28 | 1,568,1390.87 | 141,710.41 |
| DMU14 | 2,788,178.60 | 1,688,2543.64 | 1,729,0130.84 | 510,557.72 | 1,079,9578.16 | 31,501.67 |
| DMU15 | 1,606,8460.25 | 1,845,4013.94 | 2,377,584.19 | 55,685.20 | 6,605,552.09 | 1,389,024.26 |
| DMU16 | 2,093,956.23 | 1,300,253.90 | 321,853.04 | 308,643.83 | 408,573.37 | 36,505.49 |
Source: Calculated by researcher.
References
- Sikder, S.K.; Eanes, F.; Asmelash, H.B.; Kar, S.; Koetter, T. The Contribution of Energy-Optimized Urban Planning to Efficient Resource Use—A Case Study on Residential Settlement Development in Dhaka City, Bangladesh. Sustainability 2016, 8, 119. [Google Scholar] [CrossRef]
- Urban Planning Process. Available online: http://cayxanhcanhquan.com (accessed on 18 July 2017).
- Vietnam Map. Available online: http://datsohongbinhduong.com (accessed on 18 July 2017).
- Resolution No.134/2016/QH13. Available online: http://www.sggp.org.vn (accessed on 15 May 2017).
- The Situation of Vietnam’s Population in 2016. Available online: http://kehoachviet.com (accessed on 15 May 2017).
- Average Vietnam’s Population by Areas. Available online: https://www.gso.gov.vn (accessed on 15 May 2017).
- Renovating the Urban Construction Planning. Available online: http://kienviet.net (accessed on 15 May 2017).
- Saranga, H. The Indian Auto Component Industry–Estimation of Operational Efficiency and Its Determinants Using DEA. Eur. J. Oper. Res. 2009, 196, 707–718. [Google Scholar] [CrossRef]
- Leachman, C.; Pegels, C.C.; Kyoon Shin, S. Manufacturing Performance: Evaluation and Determinants. Int. J. Oper. Prod. Manag. 2005, 25, 851–874. [Google Scholar] [CrossRef]
- Zhao, X.; Li, L.; Zhang, X.S. Analysis of Operating Efficiency of Chinese Coal Mining Industry. In Proceedings of the IEEE 18th International Conference on Industrial Engineering and Engineering Management, Changchun, China, 3–5 September 2011. [Google Scholar]
- Chandraprakaikul, W.; Suebpongsakorn, A. Evaluation of Logistics Companies Using Data Envelopment Analysis. In Proceedings of the 4th IEEE International Symposium on Logistics and Industrial Informatics, Smolenice, Slovakia, 5–7 September 2012. [Google Scholar]
- Lo, S.-F.; Lu, W.-M. An integrated performance evaluation of financial holding companies in Taiwan. Eur. J. Oper. Res. 2009, 198, 341–350. [Google Scholar] [CrossRef]
- Charles, V.; Kumar, M.; Kavitha, I. Measuring the Efficiency of Assembled Printed Circuit Boards with Undesirable Outputs Using Data Envelopment Analysis. Int. J. Prod. Econ. 2012, 136, 194–206. [Google Scholar] [CrossRef]
- Chang, Y.T.; Zhang, N.; Danao, D.; Zhang, N. Environmental Efficiency Analysis of Transportation System in China. A Non-Radial Approach. Energy Policy 2013, 58, 277–283. [Google Scholar] [CrossRef]
- Wang, C.N.; Nguyen, N.T. Forecasting the manpower requirement in Vietnamese tertiary institutions. Asian J. Empir. Res. 2013, 3, 563–575. [Google Scholar]
- Deng, J.L. Introduction to Grey system theory. J. Grey Syst. 1989, 1, 1–24. [Google Scholar]
- Ren, J.; Tan, S.; Dong, L.; Mazzi, A.; Scipioni, A.; Sovacool, B.K. Determining the life cycle energy efficiency of six biofuel systems in China: A Data Envelopment Analysis. Bioresour. Technol. 2014, 162, 1–7. [Google Scholar] [CrossRef] [PubMed]
- Financial Report. Industrial Urban Development J.S.C. Available online: http://www.d2d.com.vn/ (accessed on 5 May 2017).
- Financial Report. Hanoi Southern City Development J.S.C. Available online: http://www.namhanoijsc.vn (accessed on 5 May 2017).
- Financial Report. Tu Liem Urban Development J.S.C. Available online: http://lideco.vn/ (accessed on 5 May 2017).
- Financial Report. Song Da Urban & Industrial Zone Investment & Development J.S.C. Available online: http://www.sudicosd.com.vn (accessed on 5 May 2017).
- Financial Report. Idico Urban and House Development J.S.C. Available online: http://www.idico-udico.com.vn (accessed on 8 May 2017).
- Financial Report. C.E.O Investment J.S.C. Available online: http://ceogroup.com.vn (accessed on 8 May 2017).
- Financial Report. Real Estate 11 J.S.C. Available online: http://diaoc11.com.vn/ (accessed on 8 May 2017).
- Financial Report. Development Investment Construction J.S.C. Available online: http://www.dic.vn (accessed on 8 May 2017).
- Financial Report. Dat Xanh Real Estate Service & Construction Corporation. Available online: https://www.datxanh.vn/ (accessed on 15 May 2017).
- Financial Report. FLC Group J.S.C. Available online: http://www.flc.vn/ category_id=12 (accessed on 15 May 2017).
- Financial Report. Ba Ria-Vung Tau House Development J.S.C. Available online: http://hodeco.vn (accessed on 15 May 2017).
- Financial Report. Ha Do Group J.S.C. Available online: http://www.hado.com.vn (accessed on 15 May 2017).
- Financial Report. International Development and Investment Corporation. Available online: http://www.idiseafood.com/ (accessed on 15 May 2017).
- Financial Report. Becamex Infrastructure Development J.S.C. Available online: http://www.becamexijc.net/ (accessed on 15 May 2017).
- Financial Report. Kinh Bac City Development Share Holding Corporation. Available online: http://www.kinhbaccity.vn (accessed on 15 May 2017).
- Financial Report. Danang Housing Investment Development J.S.C. Available online: http://ndn.com.vn/ (accessed on 15 May 2017).
- Lo, F.-Y.; Chien, C.-F.; Lin, J.T. A DEA study to evaluate the relative efficiency and investigate the districtre organization of the Taiwan Power Company. IEEE Trans. Power Syst. 2001, 16, 170–178. [Google Scholar]
- Tone, K. A slacks-based measure of efficiency in data envelopment analysis. Eur. J. Oper. Res. 2001, 130, 498–509. [Google Scholar] [CrossRef]
- Düzakın, E.; Düzakın, H. Measuring the performance of manufacturing firms with super slacks based model of data envelopment analysis: An application of 500 major industrial enterprises in Turkey. Eur. J. Oper. Res. 2007, 182, 1412–1432. [Google Scholar] [CrossRef]
- Wang, C.N.; Nguyen, N.-T.; Tran, T.-T. Integrated DEA Models and Grey System Theory to Evaluate Past-to-Future Performance: A Case of Indian Electricity Industry. Sci. World J. 2015. [Google Scholar] [CrossRef] [PubMed]
Figure 1.
Urban planning process [2].
Figure 1.
Urban planning process [2].

Figure 2.
Research process.
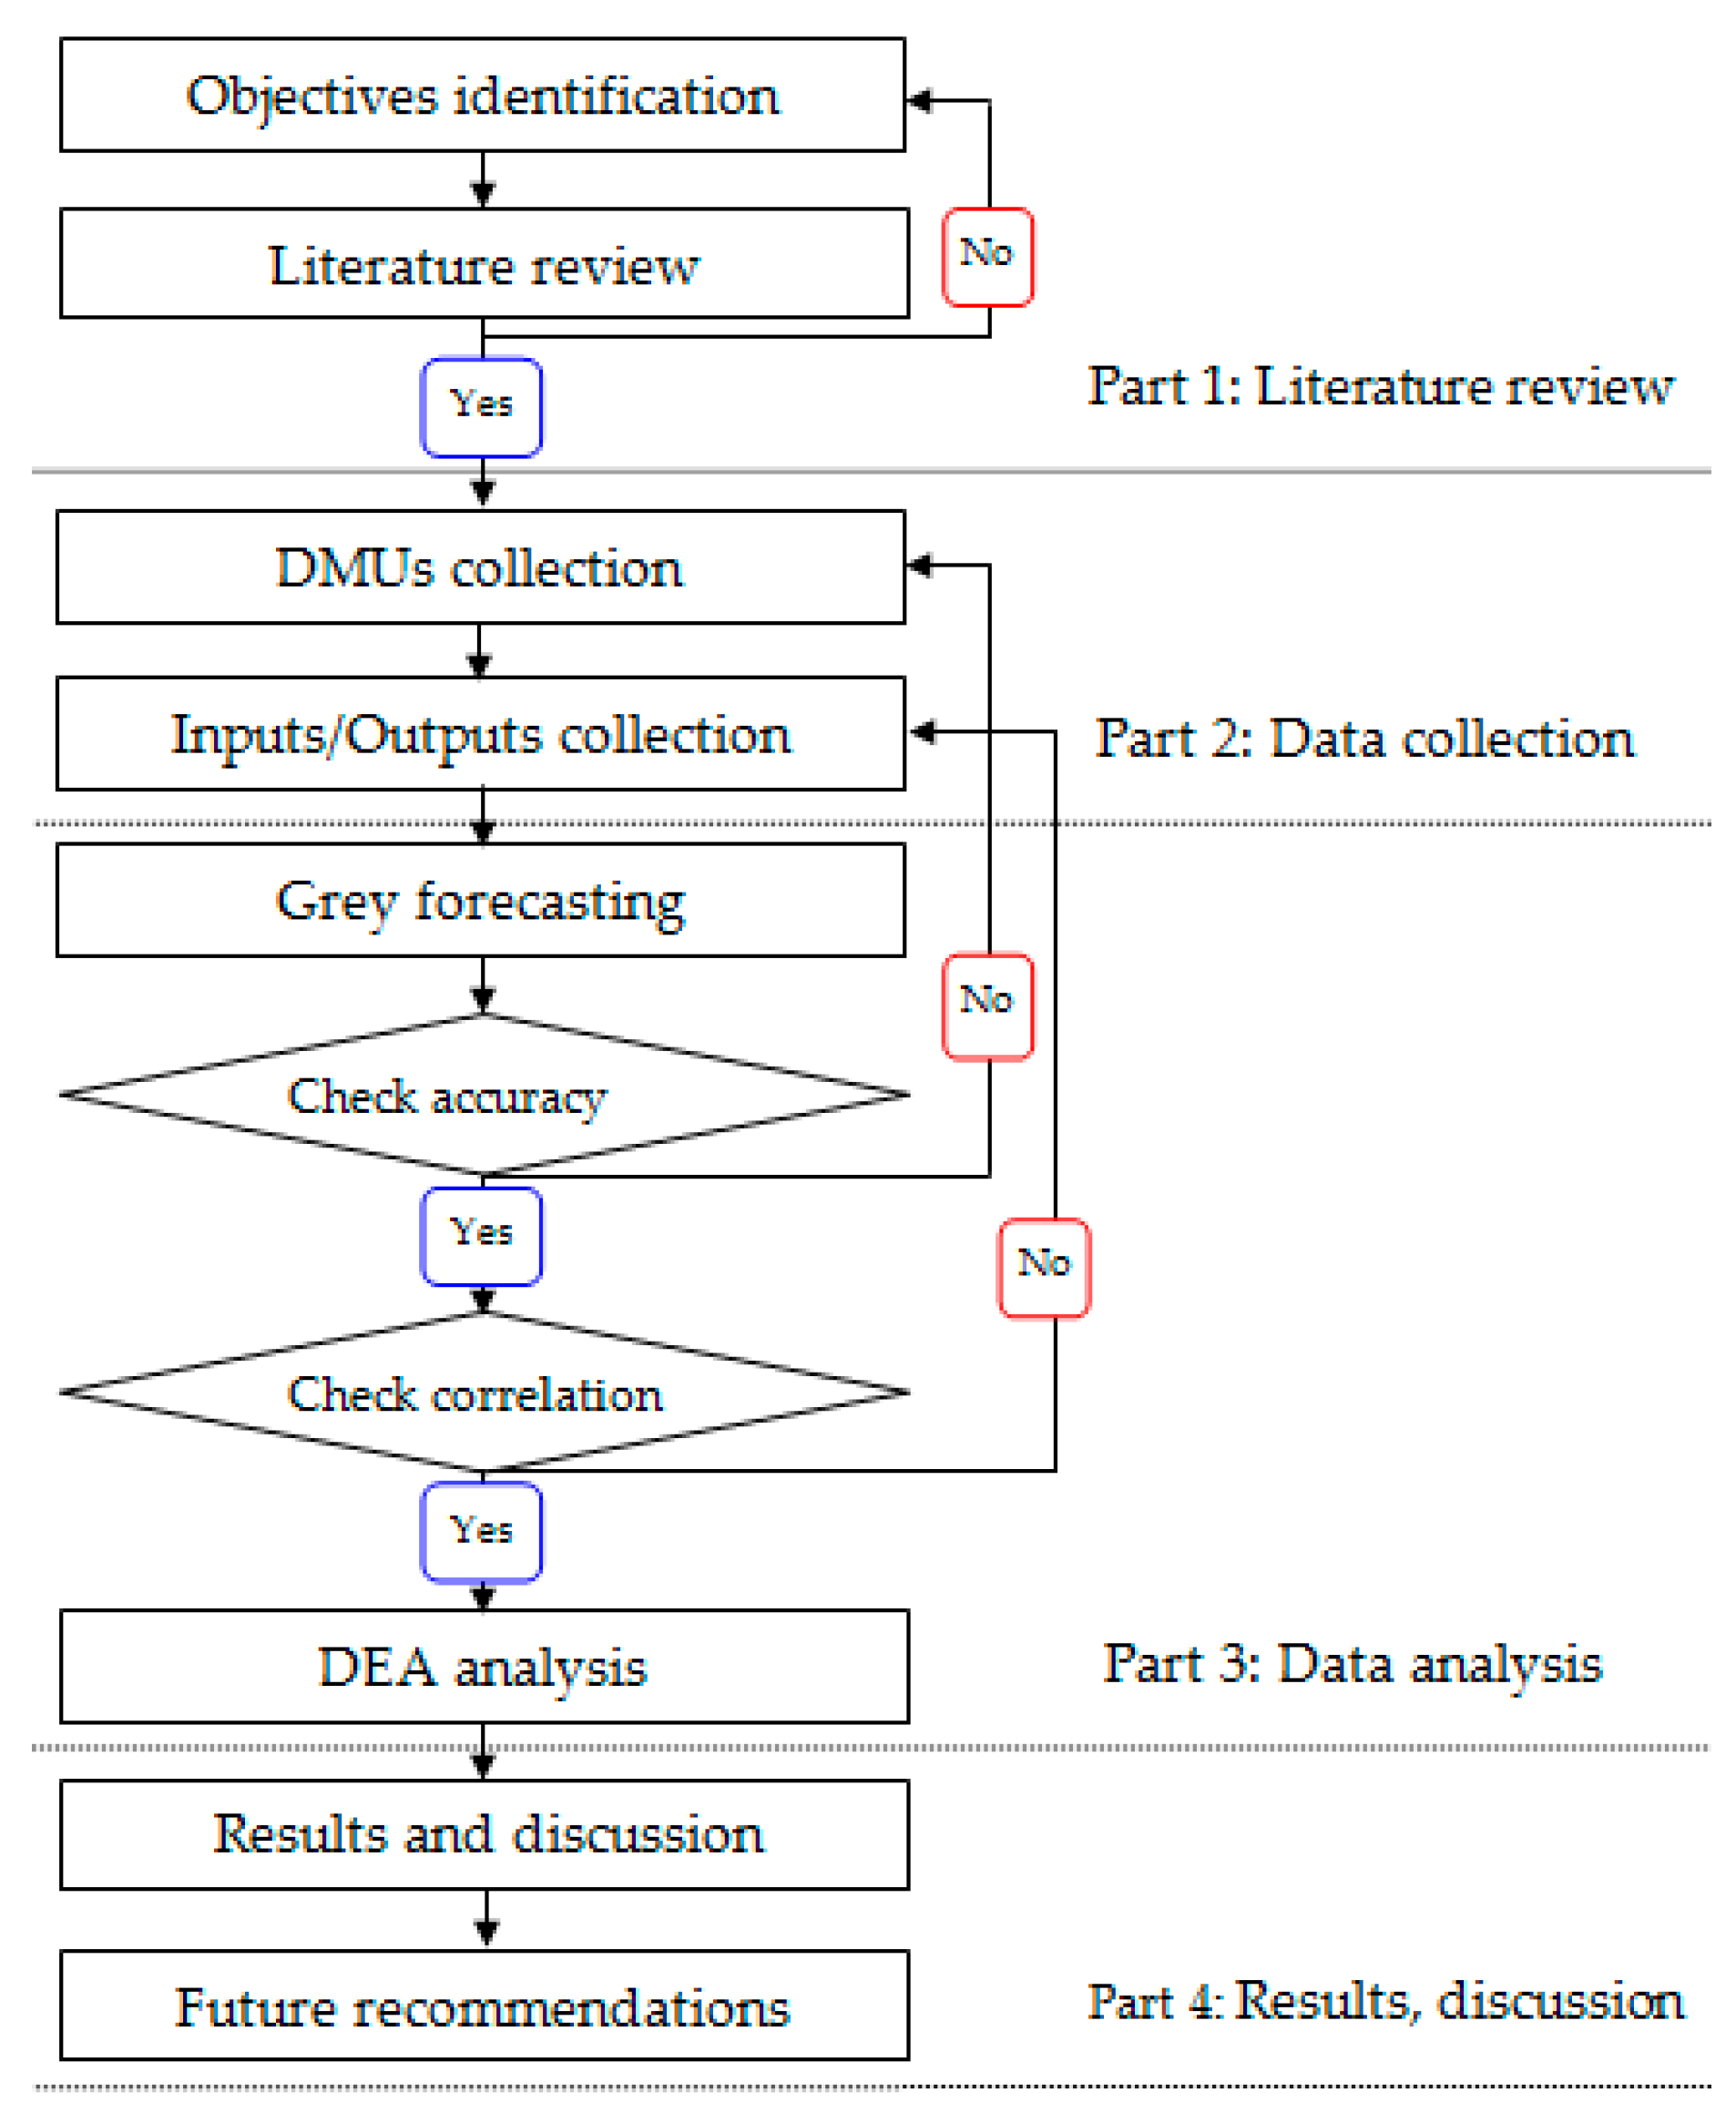
Table 1.
The use planning of Vietnam land from 2017 to 2020.
| Targets | Acreage (1000 ha) | |||
|---|---|---|---|---|
| 2017 | 2018 | 2019 | 2020 | |
| 1. Agricultural land | 26,898.14 | 26,960.77 | 27,009.46 | 27,038.09 |
| 2. Non-agricultural land group | 4363.59 | 4503.75 | 4645.04 | 4780.24 |
| • Defence land | 290.08 | 308.85 | 325.16 | 340.96 |
| • Security land | 62.58 | 65.54 | 68.51 | 71.14 |
| • Industrial zone land | 141.61 | 157.69 | 174.84 | 191.42 |
| • Infrastructure development land | 1434.45 | 1477.48 | 1519.94 | 1561.39 |
| • Historic land | 30.23 | 31.84 | 33.57 | 35.19 |
| • Landfill land | 16.45 | 18.31 | 20.17 | 21.91 |
| • Urban areas inhabited land | 184.52 | 189.67 | 194.74 | 199.13 |
| 3. Unused land | 1866.97 | 1664.15 | 1474.19 | 1310.36 |
| 4. High-tech zone land | 3.63 | 3.63 | 3.63 | 3.63 |
| 5. Economic zone land | 1582.96 | 1582.96 | 1582.96 | 1582.96 |
| 6. Urban land | 1766.50 | 1828.94 | 1890.96 | 1941.74 |
Sources: Resolution [4].
Table 2.
Average population of Vietnam by areas in 2015 (Currency unit: 1000 Persons).
| Areas | Population |
|---|---|
| Red River Delta | 20,925.5 |
| Northern Midlands and mountain areas | 11,803.7 |
| North Central and Central coastal areas | 19,658.0 |
| Central Highlands | 5607.9 |
| South East | 16,127.8 |
| Mekong River Delta | 17,590.4 |
Sources: Population and employment [6].
Table 3.
List of corporations in urban development and infrastructure investment in Vietnam.
| Order | Code | Corporations Name |
|---|---|---|
| 1 | DMU1 | Industrial Urban Development Joint Stock Company (J.S.C) No. 2-D2D |
| 2 | DMU2 | Hanoi Southern City Development J.S.C-NHN |
| 3 | DMU3 | Tu Liem Urban Development J.S.C-NTL |
| 4 | DMU4 | Song Da Urban & Industrial Zone Investment & Development J.S.C-SJC |
| 5 | DMU5 | Idico Urban And House Development J.S.C-UIC |
| 6 | DMU6 | C.E.O. Investment J.S.C-CEO |
| 7 | DMU7 | Real Estate 11 J.S.C-D11 |
| 8 | DMU8 | Development Investment Construction J.S.C-DIG |
| 9 | DMU9 | Dat Xanh Real Estate Service & Construction Corporation-DXG |
| 10 | DMU10 | FLC Group J.S.C-FLC |
| 11 | DMU11 | Ba Ria-Vung Tau House Development JSC-HDC |
| 12 | DMU12 | Ha Do Group J.S.C-HDG |
| 13 | DMU13 | International Development and Investment Corporation-IDI |
| 14 | DMU14 | Becamex Infrastructure Development J.S.C-IJC |
| 15 | DMU15 | Kinh Bac City Development Share Holding Corporation-KBC |
| 16 | DMU16 | Danang Housing Investment Development J.S.C-NDN |
Table 4.
The grades of mean absolute percentage error (MAPE) [34].
Table 4.
The grades of mean absolute percentage error (MAPE) [34].
| MAPE Valuation (%) | ≤10 | 10 ÷ 20 | 20 ÷ 50 | ≥50 |
| Accuracy | Excellent | Good | Qualified | Unqualified |
Table 5.
Data of DMU1 from 2013 to 2016 (Currency unit: Million Viet Nam Dong (VND)).
| Year | Inputs | Outputs | ||||
|---|---|---|---|---|---|---|
| (I)OE | (I)TA | (I)CS | (I)TE | (O)NS | (O)PT | |
| 2013 | 364,972 | 1,112,361 | 140,222 | 41,366 | 238,066 | 44,749 |
| 2014 | 390,115 | 1,114,028 | 195,573 | 43,110 | 295,588 | 57,299 |
| 2015 | 382,949 | 1,105,783 | 186,792 | 51,776 | 277,039 | 54,700 |
| 2016 | 400,377 | 1,375,058 | 320,147 | 41,542 | 412,151 | 55,192 |
Sources: Synthetic by researcher [18].
Table 6.
Average MAPE of DMUs.
| DMUs | Average MAPE (%) | DMUs | Average MAPE (%) |
|---|---|---|---|
| DMU1 | 5.11 | DMU9 | 7.40 |
| DMU2 | 14.43 | DMU10 | 18.84 |
| DMU3 | 8.44 | DMU11 | 3.31 |
| DMU4 | 12.65 | DMU12 | 13.95 |
| DMU5 | 7.59 | DMU13 | 5.12 |
| DMU6 | 11.33 | DMU14 | 12.15 |
| DMU7 | 5.21 | DMU15 | 8.15 |
| DMU8 | 16.49 | DMU16 | 5.30 |
| Average all MAPE | 9.72% | ||
Source: Calculated by researcher.
Table 7.
The Pearson correlation coefficient.
| Correlation Coefficient | <0.2 | 0.2 ÷ 0.4 | 0.4 ÷ 0.6 | 0.6 ÷ 0.8 | >0.8 |
| Degree of Correlation | Very low | Low | Medium | High | Very high |
Table 8.
Correlation of inputs and outputs.
| 2013 | 2014 | |||||||||||
| OE | TA | CS | TE | NS | PT | OE | TA | CS | TE | NS | PT | |
| OE | 1.0000 | 0.8956 | 0.3377 | 0.8618 | 0.4085 | 0.4343 | 1.0000 | 0.8169 | 0.2255 | 0.4591 | 0.2958 | 0.7434 |
| TA | 0.8956 | 1.0000 | 0.6323 | 0.9515 | 0.7039 | 0.7256 | 0.8169 | 1.0000 | 0.6200 | 0.8739 | 0.7068 | 0.8842 |
| CS | 0.3377 | 0.6323 | 1.0000 | 0.5650 | 0.9923 | 0.9007 | 0.2255 | 0.6200 | 1.0000 | 0.8277 | 0.9895 | 0.6999 |
| TE | 0.8618 | 0.9515 | 0.5650 | 1.0000 | 0.6322 | 0.6125 | 0.4591 | 0.8739 | 0.8277 | 1.0000 | 0.8966 | 0.8088 |
| NS | 0.4085 | 0.7039 | 0.9923 | 0.6322 | 1.0000 | 0.9409 | 0.2958 | 0.7068 | 0.9895 | 0.8966 | 1.0000 | 0.7635 |
| PT | 0.4343 | 0.7256 | 0.9007 | 0.6125 | 0.9409 | 1.0000 | 0.7434 | 0.8842 | 0.6999 | 0.8088 | 0.7635 | 1.0000 |
| 2015 | 2016 | |||||||||||
| OE | 1.0000 | 0.8945 | 0.5852 | 0.6072 | 0.6733 | 0.8947 | 1.0000 | 0.8081 | 0.5866 | 0.5522 | 0.6486 | 0.7838 |
| TA | 0.8945 | 1.0000 | 0.5739 | 0.8659 | 0.7043 | 0.8182 | 0.8081 | 1.0000 | 0.8244 | 0.9188 | 0.9093 | 0.9544 |
| CS | 0.5852 | 0.5739 | 1.0000 | 0.5656 | 0.9805 | 0.7666 | 0.5866 | 0.8244 | 1.0000 | 0.8571 | 0.9776 | 0.8304 |
| TE | 0.6072 | 0.8659 | 0.5656 | 1.0000 | 0.7001 | 0.6236 | 0.5522 | 0.9188 | 0.8571 | 1.0000 | 0.9389 | 0.9260 |
| NS | 0.6733 | 0.7043 | 0.9805 | 0.7001 | 1.0000 | 0.8384 | 0.6486 | 0.9093 | 0.9776 | 0.9389 | 1.0000 | 0.9201 |
| PT | 0.8947 | 0.8182 | 0.7666 | 0.6236 | 0.8384 | 1.0000 | 0.7838 | 0.9544 | 0.8304 | 0.9260 | 0.9201 | 1.0000 |
Source: Calculated by researcher.
Table 9.
Summary of super–SBM results.
| 2013 | 2014 | 2015 | 2016 | |
|---|---|---|---|---|
| No. of DMUs in Data | 16 | 16 | 16 | 16 |
| No. of DMUs with inappropriate Data | 0 | 0 | 0 | 0 |
| No. of evaluated DMUs | 16 | 16 | 16 | 16 |
| Average of scores | 1.1851 | 1.4334 | 1.4159 | 1.6396 |
| No. of efficient DMUs | 9 | 11 | 11 | 12 |
| No. of inefficient DMUs | 7 | 5 | 5 | 4 |
| No. of over iteration DMUs | 0 | 0 | 0 | 0 |
Source: Calculated by researcher.
Table 10.
Scores and rankings of all DMUs period 2013–2016.
| DMUs | 2013 | 2014 | 2015 | 2016 | ||||
|---|---|---|---|---|---|---|---|---|
| Score | Rank | Score | Rank | Score | Rank | Score | Rank | |
| DMU1 | 1.0194 | 8 | 0.7131 | 13 | 0.7838 | 12 | 1.0624 | 9 |
| DMU2 | 1.0000 | 9 | 1.0000 | 11 | 1.0739 | 8 | 1.0000 | 12 |
| DMU3 | 1.6226 | 3 | 0.5665 | 14 | 1.0806 | 7 | 1.1992 | 7 |
| DMU4 | 0.6281 | 15 | 0.7183 | 12 | 1.6596 | 3 | 1.4672 | 4 |
| DMU5 | 3.9616 | 1 | 5.0496 | 1 | 5.0439 | 1 | 6.7785 | 1 |
| DMU6 | 0.7708 | 10 | 1.0435 | 9 | 1.0644 | 9 | 1.0070 | 11 |
| DMU7 | 2.0837 | 2 | 2.4658 | 2 | 3.1740 | 2 | 4.3096 | 2 |
| DMU8 | 0.4246 | 16 | 0.4283 | 16 | 0.4249 | 16 | 0.5909 | 16 |
| DMU9 | 1.3485 | 4 | 1.8046 | 4 | 1.3862 | 5 | 1.4677 | 3 |
| DMU10 | 0.6559 | 13 | 2.3425 | 3 | 1.0000 | 11 | 1.1962 | 8 |
| DMU11 | 0.6299 | 14 | 0.5364 | 15 | 0.7269 | 14 | 0.9121 | 13 |
| DMU12 | 0.6982 | 12 | 1.0852 | 7 | 0.7687 | 13 | 0.8644 | 14 |
| DMU13 | 0.7281 | 11 | 1.0205 | 10 | 1.0311 | 10 | 1.3319 | 6 |
| DMU14 | 1.1724 | 5 | 1.0651 | 8 | 0.5085 | 15 | 0.6002 | 15 |
| DMU15 | 1.0488 | 7 | 1.5420 | 6 | 1.5632 | 4 | 1.4197 | 5 |
| DMU16 | 1.1694 | 6 | 1.5532 | 5 | 1.3651 | 6 | 1.0271 | 10 |
Source: Calculated by researcher.
Table 11.
Forecasted scores and rankings of 16 DMUs period 2017–2020.
| DMUs | 2017 | 2018 | 2019 | 2020 | ||||
|---|---|---|---|---|---|---|---|---|
| Score | Rank | Score | Rank | Score | Rank | Score | Rank | |
| DMU1 | 1.0064 | 13 | 0.6811 | 14 | 0.5632 | 15 | 0.4814 | 14 |
| DMU2 | 1.0000 | 14 | 1.0000 | 10 | 1.0000 | 11 | 1.0000 | 11 |
| DMU3 | 1.2837 | 6 | 1.3321 | 7 | 1.2843 | 7 | 1.2471 | 8 |
| DMU4 | 4.2784 | 3 | 9.4478 | 1 | 22.1119 | 1 | 54.7273 | 1 |
| DMU5 | 6.6878 | 1 | 7.6942 | 2 | 7.8405 | 2 | 6.5804 | 2 |
| DMU6 | 1.0204 | 10 | 0.9058 | 11 | 0.7502 | 13 | 0.8902 | 12 |
| DMU7 | 5.2242 | 2 | 5.5088 | 3 | 5.8675 | 3 | 6.3164 | 3 |
| DMU8 | 0.6351 | 16 | 0.7750 | 13 | 0.8752 | 12 | 1.0129 | 10 |
| DMU9 | 1.2783 | 7 | 1.3705 | 6 | 1.7778 | 5 | 3.0782 | 5 |
| DMU10 | 1.7949 | 4 | 1.4234 | 5 | 1.1025 | 10 | 0.8158 | 13 |
| DMU11 | 1.0318 | 9 | 1.1620 | 9 | 1.3741 | 6 | 1.7206 | 6 |
| DMU12 | 1.0119 | 12 | 0.7924 | 12 | 0.5928 | 14 | 0.4704 | 15 |
| DMU13 | 1.2003 | 8 | 1.2671 | 8 | 1.1409 | 9 | 1.0888 | 9 |
| DMU14 | 0.6496 | 15 | 0.6059 | 16 | 1.2029 | 8 | 1.6515 | 7 |
| DMU15 | 1.6205 | 5 | 2.7488 | 4 | 3.9337 | 4 | 5.9245 | 4 |
| DMU16 | 1.0176 | 11 | 0.6534 | 15 | 0.5180 | 16 | 0.4300 | 16 |
Source: Calculated by researcher.
Table 12.
The Malmquist Productivity Index (MPI) catch-up efficiency change.
| Catch-Up | 2013–2014 | 2014–2015 | 2015–2016 | Average |
|---|---|---|---|---|
| DMU1 | 0.8786 | 1.0944 | 0.9441 | 0.9724 |
| DMU2 | 1.0000 | 1.0000 | 1.0000 | 1.0000 |
| DMU3 | 0.7399 | 1.1463 | 0.9206 | 0.9356 |
| DMU4 | 0.9043 | 1.0113 | 1.1720 | 1.0292 |
| DMU5 | 1.0000 | 1.0000 | 1.0000 | 1.0000 |
| DMU6 | 1.0403 | 1.0000 | 0.9432 | 0.9945 |
| DMU7 | 1.0000 | 1.0000 | 1.0000 | 1.0000 |
| DMU8 | 0.8159 | 1.0124 | 1.2358 | 1.0214 |
| DMU9 | 1.0000 | 1.0000 | 1.0000 | 1.0000 |
| DMU10 | 1.0574 | 1.0000 | 0.9929 | 1.0168 |
| DMU11 | 0.8670 | 1.0655 | 1.0374 | 0.9899 |
| DMU12 | 1.1063 | 0.8562 | 1.0333 | 0.9986 |
| DMU13 | 1.0240 | 1.0000 | 1.0000 | 1.0080 |
| DMU14 | 0.8888 | 0.8944 | 0.9145 | 0.8992 |
| DMU15 | 1.0000 | 1.0000 | 1.0000 | 1.0000 |
| DMU16 | 1.0000 | 1.0000 | 1.0000 | 1.0000 |
| Average | 0.9577 | 1.0050 | 1.0121 | 0.9916 |
| Max | 1.1063 | 1.1463 | 1.2358 | 1.0292 |
| Min | 0.7399 | 0.8562 | 0.9145 | 0.8992 |
| SD | 0.0978 | 0.0665 | 0.0838 | 0.0324 |
Source: Calculated by researcher.
Table 13.
The MPI frontier shift.
| Frontier | 2013–2014 | 2014–2015 | 2015–2016 | Average |
|---|---|---|---|---|
| DMU1 | 0.4547 | 0.8993 | 0.8898 | 0.7479 |
| DMU2 | 1.0368 | 1.0000 | 1.0774 | 1.0380 |
| DMU3 | 0.1583 | 0.9707 | 0.9153 | 0.6814 |
| DMU4 | 0.7103 | 1.1709 | 0.9955 | 0.9589 |
| DMU5 | 0.4103 | 1.6863 | 1.7506 | 1.2824 |
| DMU6 | 0.5330 | 0.9905 | 0.8968 | 0.8068 |
| DMU7 | 0.3183 | 1.0153 | 0.8626 | 0.7321 |
| DMU8 | 0.7677 | 1.0057 | 0.8912 | 0.8882 |
| DMU9 | 0.8591 | 1.1723 | 0.9949 | 1.0088 |
| DMU10 | 0.3185 | 1.1166 | 0.8116 | 0.7489 |
| DMU11 | 0.4734 | 1.0205 | 0.9466 | 0.8135 |
| DMU12 | 0.3630 | 1.0675 | 1.0760 | 0.8355 |
| DMU13 | 0.7848 | 0.9642 | 1.3873 | 1.0454 |
| DMU14 | 0.3988 | 1.0070 | 0.9993 | 0.8017 |
| DMU15 | 1.3651 | 0.9133 | 1.0188 | 1.0991 |
| DMU16 | 0.5040 | 0.9165 | 0.7770 | 0.7325 |
| Average | 0.5910 | 1.0573 | 1.0182 | 0.8888 |
| Max | 1.3651 | 1.6863 | 1.7506 | 1.2824 |
| Min | 0.1583 | 0.8993 | 0.7770 | 0.6814 |
| SD | 0.3113 | 0.1867 | 0.2407 | 0.1672 |
Source: Calculated by researcher.
Table 14.
The MPI change over the period 2013–2016.
| Malmquist | 2013–2014 | 2014–2015 | 2015–2016 | Average |
|---|---|---|---|---|
| DMU1 | 0.3995 | 0.9842 | 0.8400 | 0.7412 |
| DMU2 | 1.0368 | 1.0000 | 1.0774 | 1.0380 |
| DMU3 | 0.1172 | 1.1127 | 0.8426 | 0.6908 |
| DMU4 | 0.6423 | 1.1841 | 1.1667 | 0.9977 |
| DMU5 | 0.4103 | 1.6863 | 1.7506 | 1.2824 |
| DMU6 | 0.5545 | 0.9905 | 0.8458 | 0.7969 |
| DMU7 | 0.3183 | 1.0153 | 0.8626 | 0.7321 |
| DMU8 | 0.6264 | 1.0181 | 1.1014 | 0.9153 |
| DMU9 | 0.8591 | 1.1723 | 0.9949 | 1.0088 |
| DMU10 | 0.3368 | 1.1166 | 0.8059 | 0.7531 |
| DMU11 | 0.4104 | 1.0873 | 0.9820 | 0.8266 |
| DMU12 | 0.4016 | 0.9141 | 1.1119 | 0.8092 |
| DMU13 | 0.8036 | 0.9642 | 1.3873 | 1.0517 |
| DMU14 | 0.3544 | 0.9007 | 0.9139 | 0.7230 |
| DMU15 | 1.3651 | 0.9133 | 1.0188 | 1.0991 |
| DMU16 | 0.5040 | 0.9165 | 0.7770 | 0.7325 |
| Average | 0.5713 | 1.0610 | 1.0299 | 0.8874 |
| Max | 1.3651 | 1.6863 | 1.7506 | 1.2824 |
| Min | 0.1172 | 0.9007 | 0.7770 | 0.6908 |
| SD | 0.3140 | 0.1902 | 0.2509 | 0.1731 |
Source: Calculated by researcher.
Table 15.
The MPI change over the period 2017–2020.
| Malmquist | 2017–2018 | 2018–2019 | 2019–2020 | Average |
|---|---|---|---|---|
| DMU1 | 0.3340 | 0.9765 | 0.9728 | 0.7611 |
| DMU2 | 0.7597 | 1.0305 | 1.0268 | 0.9390 |
| DMU3 | 0.2551 | 1.1260 | 1.1560 | 0.8457 |
| DMU4 | 0.1038 | 1.4516 | 1.4562 | 1.0039 |
| DMU5 | 0.4963 | 1.7417 | 1.6653 | 1.3011 |
| DMU6 | 0.6704 | 0.9928 | 1.2483 | 0.9705 |
| DMU7 | 0.2448 | 0.9393 | 0.9388 | 0.7076 |
| DMU8 | 0.8115 | 1.1183 | 1.1216 | 1.0171 |
| DMU9 | 0.7836 | 1.6098 | 0.9909 | 1.1281 |
| DMU10 | 0.3202 | 1.0751 | 1.1066 | 0.8340 |
| DMU11 | 0.4078 | 1.2105 | 1.2316 | 0.9499 |
| DMU12 | 0.5595 | 1.0918 | 1.0873 | 0.9129 |
| DMU13 | 0.5598 | 1.1097 | 0.9427 | 0.8707 |
| DMU14 | 0.6600 | 1.4771 | 1.7048 | 1.2806 |
| DMU15 | 0.2891 | 1.0983 | 1.1234 | 0.8369 |
| DMU16 | 0.5404 | 0.9376 | 0.9338 | 0.8039 |
| Average | 0.4872 | 1.1867 | 1.1692 | 0.9477 |
| Max | 0.8115 | 1.7417 | 1.7048 | 1.3011 |
| Min | 0.1038 | 0.9376 | 0.9338 | 0.7076 |
| SD | 0.2161 | 0.2470 | 0.2437 | 0.1698 |
Source: Calculated by researcher.
© 2017 by the authors. Licensee MDPI, Basel, Switzerland. This article is an open access article distributed under the terms and conditions of the Creative Commons Attribution (CC BY) license (http://creativecommons.org/licenses/by/4.0/).
Share and Cite
MDPI and ACS Style
Wang, C.-N.; Nguyen, H.-K. Enhancing Urban Development Quality Based on the Results of Appraising Efficient Performance of Investors—A Case Study in Vietnam. Sustainability 2017, 9, 1397. https://doi.org/10.3390/su9081397
AMA Style
Wang C-N, Nguyen H-K. Enhancing Urban Development Quality Based on the Results of Appraising Efficient Performance of Investors—A Case Study in Vietnam. Sustainability. 2017; 9(8):1397. https://doi.org/10.3390/su9081397
Chicago/Turabian StyleWang, Chia-Nan, and Han-Khanh Nguyen. 2017. "Enhancing Urban Development Quality Based on the Results of Appraising Efficient Performance of Investors—A Case Study in Vietnam" Sustainability 9, no. 8: 1397. https://doi.org/10.3390/su9081397
Note that from the first issue of 2016, this journal uses article numbers instead of page numbers. See further details here.