Article

Stormwater Management toward Water Supply at the Community Scale—A Case Study in Northern Taiwan

Department of Bioenvironmental Systems Engineering, National Taiwan University, 10617 Taipei, Taiwan
*
Author to whom correspondence should be addressed.
Sustainability 2017, 9(7), 1206; https://doi.org/10.3390/su9071206
Submission received: 8 May 2017 / Revised: 1 July 2017 / Accepted: 3 July 2017 / Published: 18 July 2017
(This article belongs to the Section Environmental Sustainability and Applications)

Abstract

:
Adaptation measures are necessary for reducing the impacts of extreme climatic events, especially at the community scale. Constructed wetlands and rainwater harvesting systems are commonly used as on-site water supply systems for distributed adaptation. The purpose of this study is to build a community water supply model and to evaluate the performance of low impact development (LID) modules as water supply facilities. The community water supply model simulates four water balances, namely, household storage, the constructed wetland, the rainwater harvesting system, and paddy fields. Three performance indicators are utilized, namely, the water saving efficiency, tolerance duration, and water use efficiency. The results show that the rainwater harvesting system saves up to 25.8% of the total domestic water demand, and the constructed wetland saves up to 40% of the irrigation water demand in Xingshi Village, located in northern Taiwan. In conclusion, the constructed wetland and rainwater harvesting system are good candidates for on-site water supply systems at the community scale. However, constructing a community water supply system requires more study, including a climate change risk assessment and the optimization of adaptation measures.

1. Introduction

Climate change may introduce more frequent and intensive rainfall and longer consecutive dry days, which may cause droughts and further impact the water supply system [1]. Furthermore, climate risk is associated with high uncertainty, highlighting the need for flexible measures to adapt to an uncertain future. Managing the water demand and water resources appropriately, as well as developing new water supply facilities, could help to reduce water deficits and their adverse effects. Traditional water resources, such as water from reservoirs and weirs, play an important role in a centralized water supply system, given its effectiveness to allocate available water to meet the water demands for different locations and time periods. However, the centralized water supply system itself may face serious challenges under climate change, because once established, it is not flexible to changes in capacity. On the other hand, building a new hydraulic facility may also cause negative environmental and social impacts. Furthermore, it may be difficult to find a suitable site for building a huge traditional hydraulic facility, such as a reservoir, in an island state. Not only does constructing a new reservoir to increase the water supply face barriers, but the reservoir’s active storage may also decrease significantly each year owing to sedimentation. For example, the Morakot Typhoon in 2009 brought around 91 million cubic meters of sediment into the Tsengwen reservoir in Taiwan, which occupies about 12% of the reservoir capacity [2].
Conventionally, communities rely on a centralized system for their water supply. New measures are urgently needed to increase the water supply to a local area while simultaneously reducing the loading on the centralized system. Developing new on-site water resources at the community scale may increase the local water supply and decrease the water demand loading on the centralized water supply system, thus reducing the risk of water deficits. Low impact development (LID) has been used as an on-site stormwater management measure to reduce the adverse effects of extreme rainfall [3]. LID is a distributed measure of stormwater management accomplished by building green infrastructures that attempt to mimic the natural hydrologic cycle. Distributed measures, such as LID, have recently been drawing an increasing amount of attention. Climate adaptation requires flexible measures for the uncertainty of climate risk. The LID measures can be the distributed adaptation and have more flexibility in a changing climate. Besides, LID measures could work over a range of development levels, such as cities or rural communities. Since these LID measures tend to detain stormwater to reduce surface runoff, it naturally follows that the detained water can be used later as the on-site water supply. Such new water resources at the community scale may assist in stabilizing the centralized water supply system by maximizing the utilization of stormwater. For example, wetlands and rainwater harvesting systems are commonly used LID measures for a local area. Unlike treatment plants, wetlands are a low-cost solution using natural processes to purify water, and they can provide reclaimed water for irrigation [4]. On the other hand, rainwater can be harvested from rooftops and may help meet part of the nonpotable water demand [5,6,7]. Thus, wetlands and rainwater harvesting systems not only reduce the adverse effects of stormwater, but also provide alternative water resources.
In order to assist stormwater management, the U.S. Environmental Protection Agency (USEPA, Washington, DC, USA) has developed simulation tools, including the System for Urban Stormwater Treatment and Analysis Integration (SUSTAIN [8]) and Storm Water Management Model (SWMM [9]). SUSTAIN is a decision support system that assists stormwater management professionals in developing and implementing plans for flow and pollution control measures, to protect source water and meet water quality goals. SWMM is a dynamic rainfall-runoff simulation model, which is used for simulating the runoff quantity and quality [9]. SWMM also provides LID modules for evaluating the effect of stormwater detention, and has been extended to model the hydrologic performance of specific types of LID modules. Users can choose eight LID modules, namely, a bio-retention cell, rain garden, green roof, infiltration trench, permeable pavement, rain barrel, rooftop disconnection, and vegetative swale.
The LID modules of SWMM are utilized for flood reduction analysis [10,11,12,13,14,15]. The LID modules can be used for not only reducing flood events, but also for providing an alternative water supply. A rainwater harvesting system not only reduces stormwater, but also provides an additional water resource. Steffen et al. [16] showed that a 190-liter rain barrel installed for a household of four persons can provide a water saving efficiency of approximately 50% of the nonpotable indoor water demand in regions with higher annual precipitation. Walsh et al. [17] evaluated rainwater harvesting systems of different capacities and identified that the 227-litter rain barrel is the most cost-effective in their case study location. The LID increases not only the time to peak, but also the volume of detention water serving as a distributed water supply system. Li et al. [18] developed an integrated water resources model for a community, but assumed that the surface runoff of the community was totally drained out of the system and thus did not consider it. The surface runoff was considered as a water resource in this study. The purpose of this study is to build upon the previous work [18] by developing a community water supply model that explicitly incorporates the water supply potential from LID modules. SWMM is applied to simulate surface runoff and is integrated with the community water supply model. The effects of LID on the resilience of the water supply system of a rural community are evaluated by a case study in northern Taiwan.

2. Materials and Methods

This study evaluates the effectiveness of LID measures serving as the on-site water supply to reduce loadings on traditional agricultural and domestic water supply systems. The hypothetical model community analogizes to Xingshi Village located in northern Taiwan. The rural community is considered to have seven land covers, namely, regular roofs, green roofs, permeable pavements, impermeable pavements, wetlands, paddy fields, and parks, and it has external agricultural and domestic water supply systems. Moreover, there are two major storage facilities for on-site water supply, namely, a constructed wetland and a rainwater harvesting system. Normally, most of the rainfall becomes surface runoff and is drained out as quickly as possible without being collected and used as a supply of water. The community water supply system is shown in Figure 1. In this study, the surface runoff from the regular roof and green roof is designed to flow into either the rainwater harvesting system or rainwater sewer system. On the other hand, the surface runoff from permeable and impervious pavements is designed to flow into the rainwater sewer system. The rainwater sewer system may collect the surface runoff from the regular roof, green roof, permeable pavement, and impermeable pavement, and then transport it to the wetland. When the wetland is full, the overflow drains into the external rainwater drainage system. After being treated by the wetland, the reclaimed water can be used for irrigation. The rainwater harvesting system collects water from roofs and can provide low quality water to households for noncontact use, such as flushing toilets and watering gardens.
To develop a simulation model for this study, SWMM is linked to the community water supply model. The green arrows in Figure 1 represent the amount of surface runoff from SWMM, which is used as the input for the community water supply system. The community water supply model consists of four water balance equations for the household storage, constructed wetland, rainwater harvesting system, and paddy field. These water balance equations are described first, and then, modeling the LID in SWMM is briefly introduced. Lastly, this section also presents the method used to determine the capacity of the rainwater harvesting system and its performance indicators.

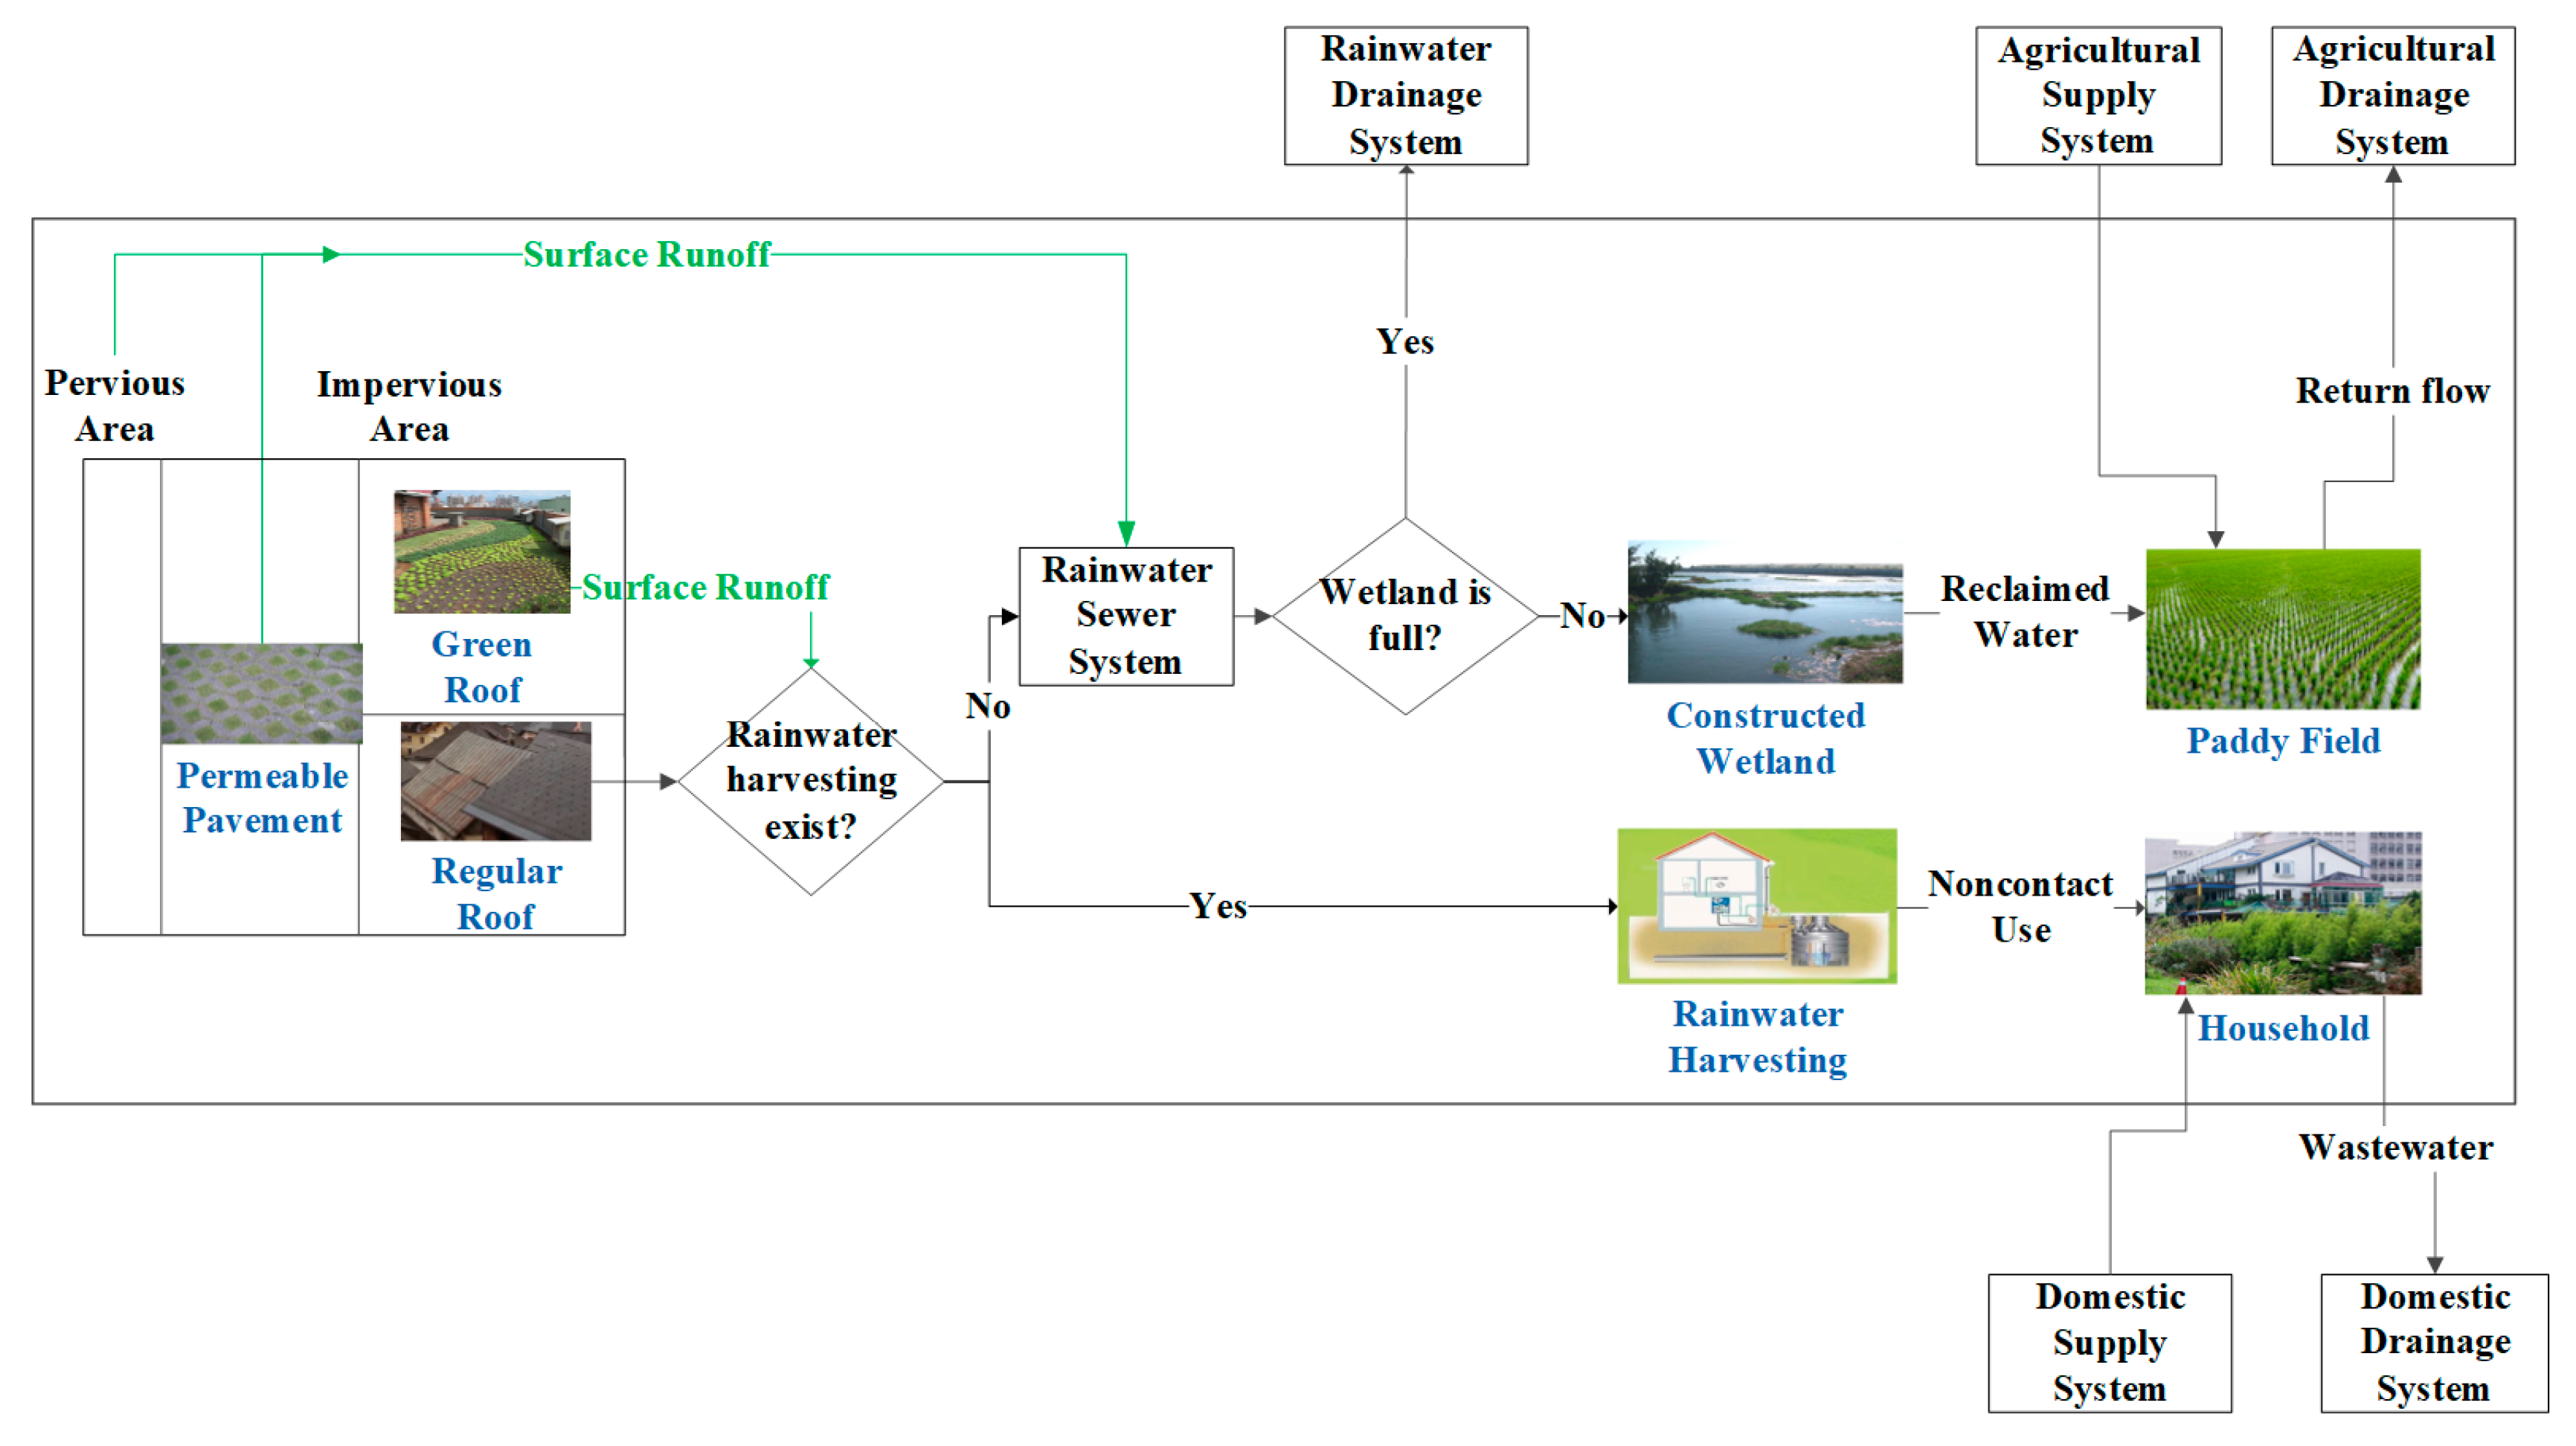
2.1. Community Water Supply Model

Li et al. [18] developed a water supply model for a rural community. The reclaimed water from constructed wetlands is used for irrigation and the noncontact domestic water demand. However, surface runoff from the community was not considered to be available as water supply, and thus, it was not included in the simulation. In this study, the community water supply model is combined with the SWMM to simulate the amount of surface runoff. Moreover, owing to the cost of the water supply pipeline, the reclaimed water from constructed wetlands is only used for irrigation. The following are the water balance equations of the wetland and rainwater harvesting system for the rural community, respectively:
V W , t + 1 = V W , t + R W , t + S R t E T W , t O W , t
V R , t + 1 = V R , t + R R R , t + [ G R t ] O R , t U L , t
where VW,t is the water storage capacity of the wetland (m3), RW,t is the volume of direct rainfall (m3), SRt is the runoff from the drainage system (m3), ETW,t is the evapotranspiration of the wetland’s vegetation (m3), and OW,t is the overflow of the wetland, which is used for irrigation (m3). SRt is added in this study as an inflow of the wetland and is simulated by SWMM. The seepage is ignored since the bottom of the constructed wetland is normally installed with an impermeable layer. VR,t is the volume of the rainwater harvesting system (m3); RRR,t and GRt are the volumes of rainwater harvested from the regular roof and green roof, respectively (m3); OR,t is the overflow of the rainwater harvesting system (m3); and UL,t is the volume of water diverted toward low quality water uses from the rainwater harvesting system (m3), where t is the time (day). In this study, the time step is one day. The square brackets [] mean that the variable within them exists only when the green roofs are installed. The calculations/formulas for ETW,t, OW,t, RRR,t, OR,t, and UL,t are described in a previous study [18].
Domestic and irrigation water demands constitute the major water uses of a rural community. The average liter per capita per day (LPCD) is about 250 liters in Taiwan. The high quality water demand constitutes 68% of the domestic water demand. The remaining 32% is low quality water demand [19]. The household storage system which is refilled by the external domestic water supply system is assumed to supply high quality uses first. The noncontact domestic water demand can use low quality water from a rainwater harvesting system. The following equation is the water balance equation of the household storage system:
V H , t + 1 = V H , t + S t U H , t Y t
where VH,t is the household storage (m3), St is the water imported from the external domestic water supply system (m3), and UH,t and Yt are high quality and supplemental low quality water supplies from the household storage (m3), respectively. The high quality water supply is determined by the volume of the household storage system and high quality water demand. The low quality water supply is determined by the volume of the rainwater harvesting system and low quality water demand. If the low quality water demand cannot be met by the rainwater harvesting system, the household storage system will supply tap water to meet the deficit. The calculations/formulas for St, UH,t, and Yt are described in a previous study [18].
The paddy field is considered to have surface and sub-soil layers. The first layer is on top of the soil surface, and the second layer is below the soil surface. The bottom of the second layer is a compressed layer (hard pan) with a low permeability.
V P 1 , t + 1 = V P 1 , t + R P , t + O W , t + I R t E T 1 , t I n f t O P , t
V P 2 , t + 1 = V P 2 , t + I n f t E T 2 , t S P t
where VP1,t is the water storage volume of the surface layer (m3), RP,t is the direct rainfall received by the paddy field (m3), IRt is the volume of irrigation water from the external agricultural water supply system (m3), ET1,t and ET2,t are the evapotranspiration from the surface and sub-soil layers (m3), respectively, Inft refers to infiltration (m3), OP,t is the overflow from the paddy field (m3), VP2,t is the water content below the soil surface (m3), and SPt is the seepage (m3). The calculations/formulas used to estimate Inft, OP,t, and SPt are described in a previous study [18].
The volume of irrigation water is determined by the maximal available water from the external agricultural water supply system and the field water demand. In a previous study (Li et al., 2015), the field water demand considered the water demands of surface and sub-soil layers. In this study, the field water demand of the surface layer and the soil water demand of the sub-soil layer are calculated separately for an accurate simulation. The field water demand is determined by the evapotranspiration, effective rainfall, storage capacity of the surface layer, soil water demand, and overflow from the constructed wetland. The soil water demand is determined by the maximum infiltration, evapotranspiration, seepage, and storage capacity of the sub-soil layer.
I R t = min ( I S m a x C o e f L , F W D t )
F W D t =   { 0 otherwise max ( 0 , E T 1 , t R p e , t + C P 1 , t + S W D t O w , t ) growing   season }
S W D t =   { 0 otherwise min ( I n f m a x , E T 2 , t + S P t + C P 2 , t ) growing   season }
C P 1 , t = max ( 0 , D t × A P V P 1 , t )
C P 2 , t = max ( 0 , V P 2 , m a x V P 2 , t )
R p e , t = max ( 0 , R P , t O p , t )
E T 1 , t = min ( E T P , t , V P 1 , t + R P , t + O W , t )
E T 2 , t = min ( E T P , t E T 1 , t , V P 2 , t )
where ISmax is the maximal water supply from the external agricultural water supply system (m3), CoefL is the coefficient of transport loss, FWDt is the field water demand (m3), Rpe,t is the effective rainfall (m3), CP1,t is the storage capacity of the surface layer (m3), SWDt is the soil water demand (m3), Infmax is the maximal infiltration (m3), CP2,t is the storage capacity of the sub-soil layer (m3), Dt is the required ponding depth of the paddy field on day t (m), AP is the area of paddy field (m2), VP2,max is the maximal storage of VP2,t (m3) as the deficit between the porosity and wilting point, and ETP,t is the evapotranspiration from the paddy field (m3).

2.2. Modeling LID Modules Using the SWMM

There are eight LID modules in version SWMM 5.1011. They consist of vertical layers, namely, the surface, pavement, soil, storage, and drain. Table 1 summarizes the layers of the different LID modules [9].
Some LID modules, such as the rain garden and vegetative swale, have fewer layers. The permeable pavement has more layers, and thus, it is utilized to describe the hydrological processes of LID modules, as shown in Figure 2 (adapted from Rossman [9]). The surface layer receives rainwater and surface runoff from other areas and loses water through infiltration into the pavement layer, evaporation, and surface outflow. The daily evaporation rate is computed by the Hargreaves method, while the outflow from the surface layer is calculated by Manning’s equation. The pavement layer receives infiltration from the surface layer and loses water through evaporation and permeating the sub-soil layer. The sub-soil layer receives water from the pavement layer and loses water through evaporation and percolation into the storage layer. The percolation rate is calculated by Darcy’s law. The storage layer receives percolation from the sub-soil layer and loses water through evaporation and infiltration, which penetrates through the bottom of the storage layer and drains water into the drainage system. The following formulas describe these hydrological processes:
I n f i l S u r f a c e = I n f l o w S u r f a c e + V S u r f a c e T s t e p
P e r m P a v e = min [   k s a t , P a v e × ( 1 C F P a v e )   ,   P e r m P a v e , m a x ]
P e r c S o i l = min [   k s a t , S o i l × exp [ ( Φ θ ) ] × K s l o p e S o i l ,   P e r c S o i l , m a x ]
I n f i l S t o r a g e = min [ k s a t , S t o r a g e × ( 1 C F S t o r a g e ) ,   I n f i l n a t i v e , m a x ]
D r a i n S t o r a g e = C d × H η
O u t f l o w S u r f a c e = min [   1.49 n × ( D S u r f a c e d S u r f a c e ) 5 3 ,   D S u r f a c e d S u r f a c e T s t e p ]
where InfilSurface is the infiltration into the pavement layer (m/day), InflowSurface is the inflow of the surface layer (m/day), Vsurface is the unit volume of the surface layer (m), Tstep is the time step (day), PermPave is the permeating water from the pavement layer (m/day), ksat,Pave is the saturated hydraulic conductivity of the pavement layer (m/day), CFPave is the clogging factor of the pavement layer, PermPave,max is the maximum permeability of the pavement layer (m/day), PercSoil is the percolation within the sub-soil layer (m/day), ksat,Soil is the saturated hydraulic conductivity of the sub-soil layer (m/day), Φ is the porosity of the sub-soil layer, θ is the moisture content of the sub-soil layer, Kslopesoil is the conductivity slope of the sub-soil layer, PercSoil,max is the maximum percolation within the sub-soil layer (m/day), InfilStorage is the infiltration from the storage layer (m/day), ksat,Storage is the saturated hydraulic conductivity of the storage layer (m/day), CFPave is the clogging factor of the storage layer, Infilnative,max is the maximum infiltration from the storage layer (m/day), DrainStorage is the outflow from the storage layer (m/day), Cd is the drain coefficient, H is the head of water above the drain (m), η is the drain exponent, OutflowSurface is the outflow from the surface layer (m/day), n is the surface roughness coefficient, DSurface is the water depth of the surface layer (m), and dsurface is the thickness of the surface layer (m).

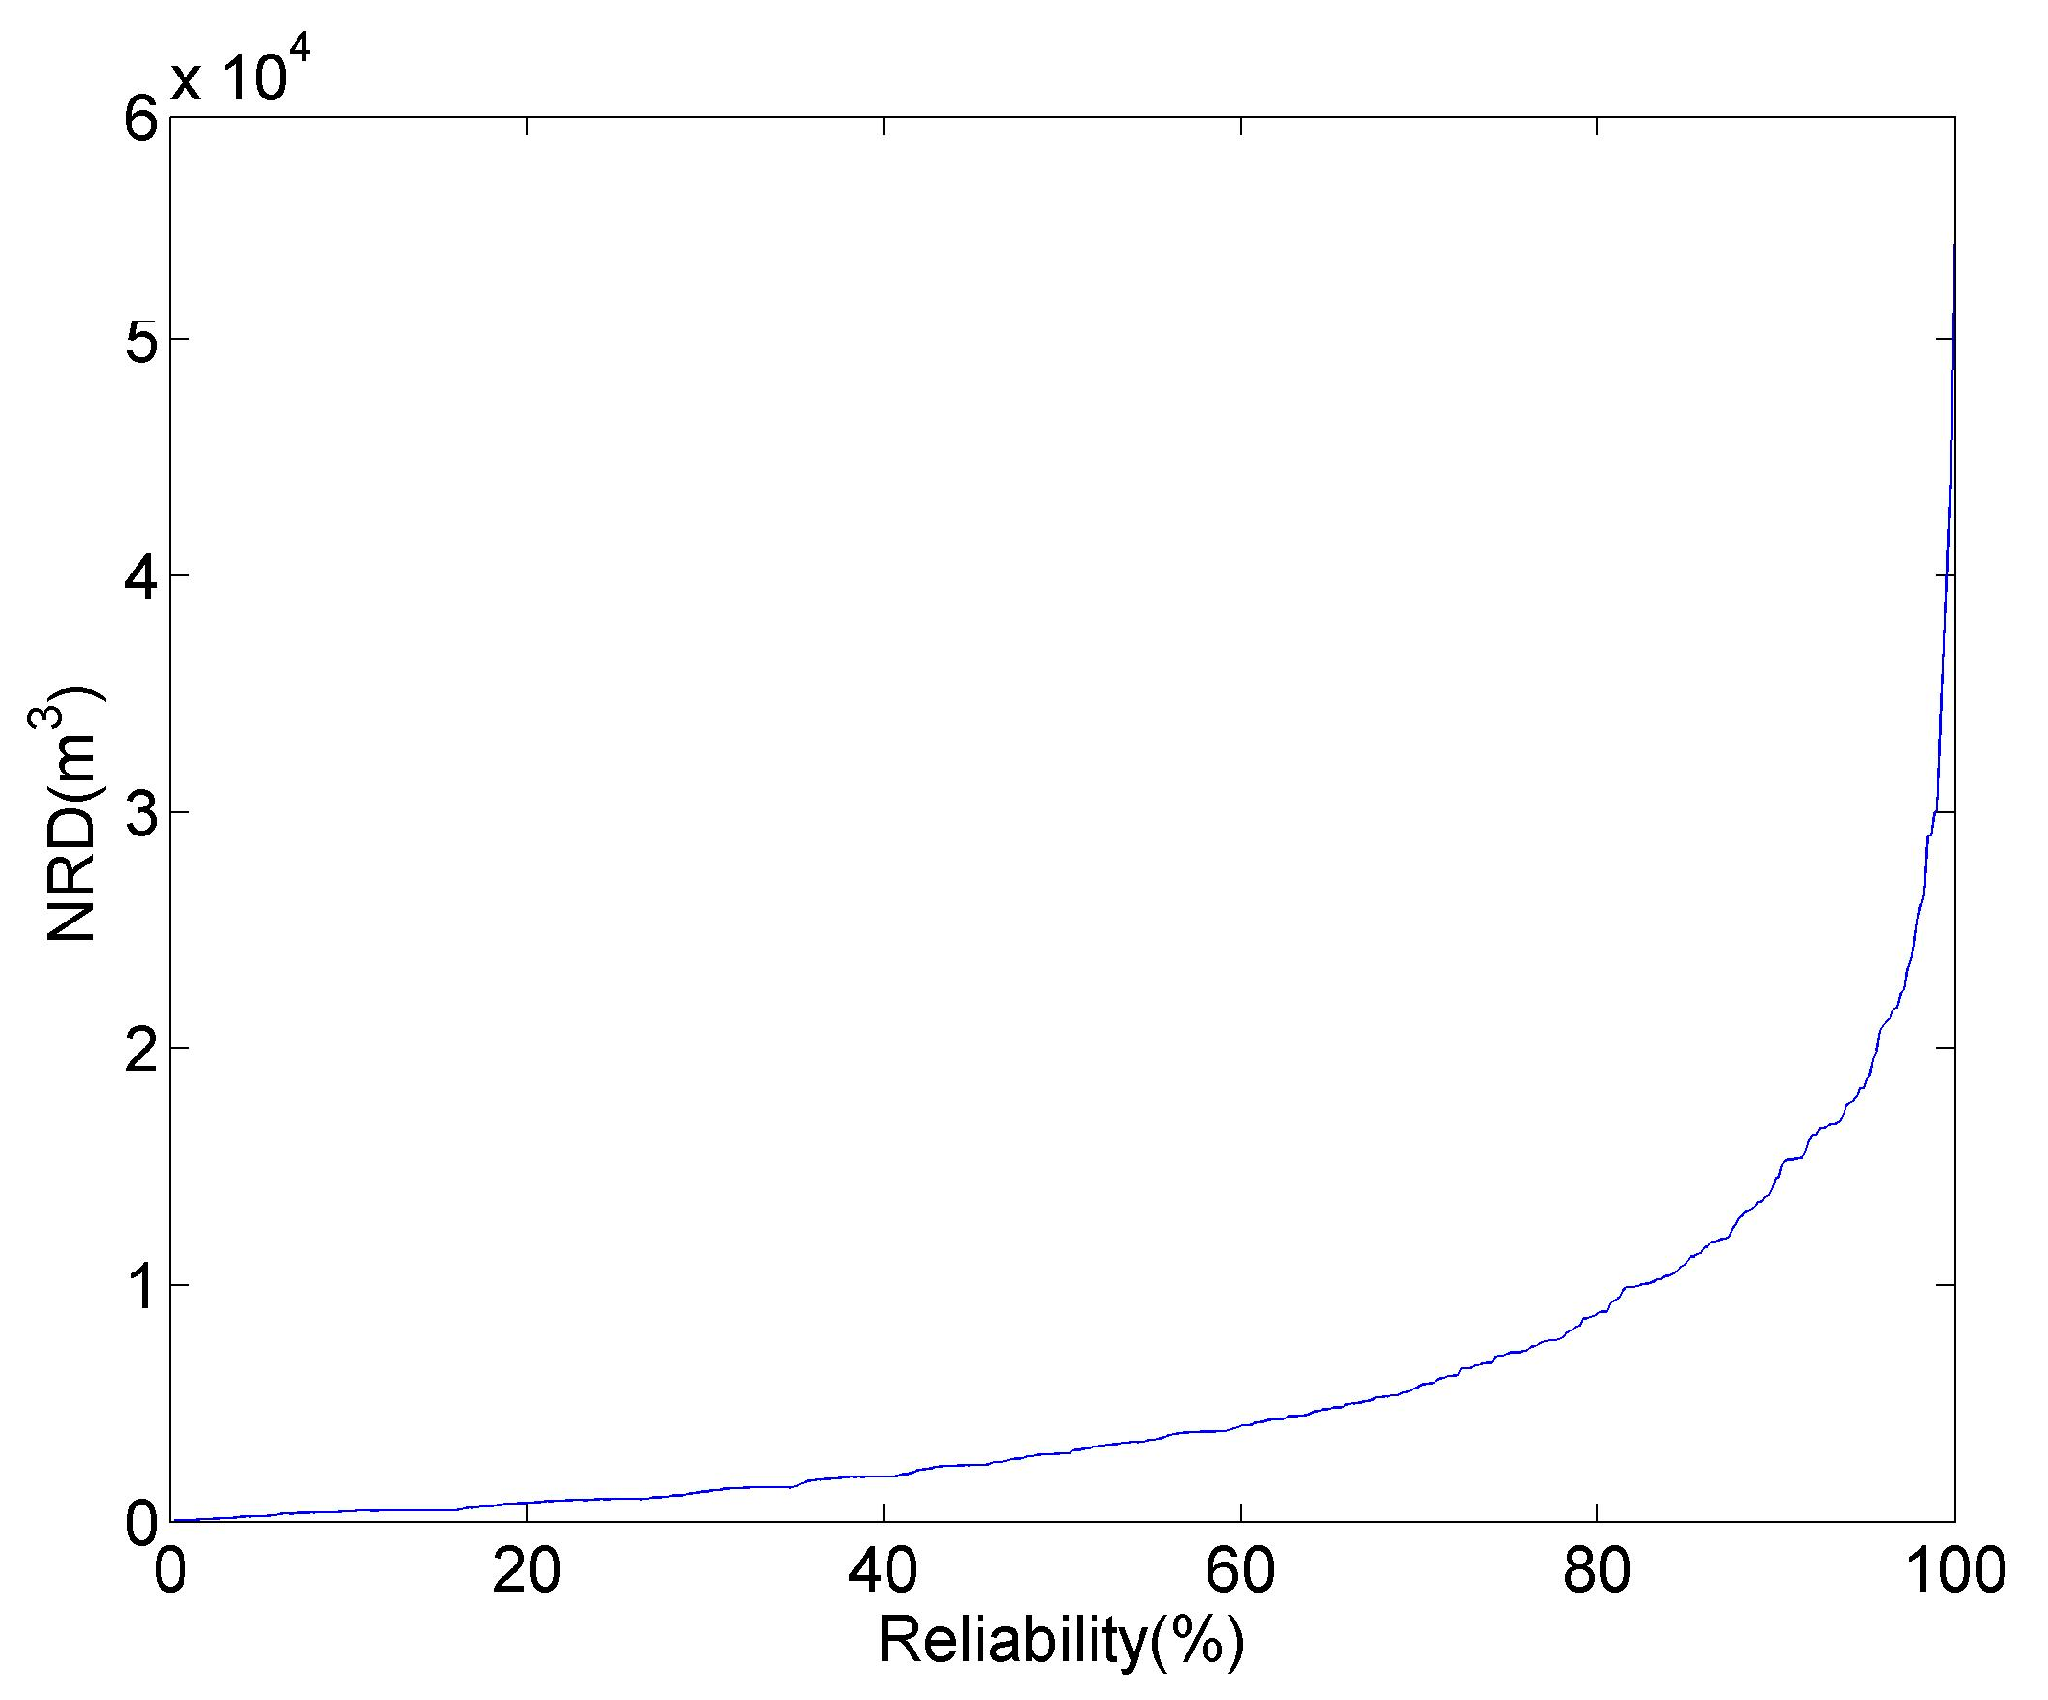
2.3. Calculation of Rainwater Harvesting System Capacity

The capacity of the rainwater harvesting system has a key influence on the water saving efficiency. The sequent peak algorithm is commonly used for determining the adequate capacity of a reservoir, as well as that of a rainwater harvesting system [20]. However, the sequent peak algorithm may not be applicable for extreme rainfall conditions, such as those experienced in Taiwan. Extreme rainfall mandates an oversized capacity. A new method to determine the capacity of the rainwater harvesting system was proposed in this study. The ideal capacity of the rainwater harvesting system used to meet the low quality water demand is assessed from rainfall records. The capacity of the rainwater harvesting system can be calculated as the difference between the total low quality water demand and rainfall. In Figure 3, the hatched areas present the deficits of the low quality water demand. If the rainwater harvesting system can supply this deficit to the extent possible, it will help increase the water saving efficiency. Equation (20) is used to calculate the total deficit for a water deficit event.
N R D i =   t = 1 D ( D L R R , t )
where NRDi denotes the total rainwater deficit (m3); DL is the low quality water demand, which is 32% of the domestic water demand (m3); and RR,t is the volume of rainfall (m3). The capacity of the rainwater harvesting system may be assessed using the following steps: (1) Ranking NRDs; (2) deciding upon an acceptable reliability p% or risk (1−p)%, such as when 50% or 75% of deficits can be satisfied; (3) determining the capacity of the rainwater harvesting system, which is the NRD with p% exceeding the probability.
The capacity of the rainwater harvesting system can be determined as the difference between the low quality water demand and rainfall received. The rankings of the NRDs are shown in Figure 4. Considering a rainwater harvesting system of maximal capacity is not realistic. The capacity of the rainwater harvesting system also depends on the cost and size of the system. This study assumes a reliability of 75% for supplying the low quality water demand. Accordingly, the corresponding total capacity of the rainwater harvesting system in the design community is 7140 m3. There are 528 water shortage events over the twenty years (1986–2005). The goodness of fit, Chi-Square test, and Kolmogorov-Smirnov Test (KS test) demonstrate that NRD passes the lognormal distribution test (p-Value > 0.05).

2.4. Performance Indicators

It is possible for a sustainable rural community to support its own water demands even in periods of drought and when discharging high flows without causing inundation during storms. The LIDs can be installed to achieve these goals. For verifying the performance of the LID modules for the water supply, this study uses three indicators, namely, the water saving efficiency (WSE), tolerance duration (TD), and water use efficiency (WUE). Detailed descriptions of the three indicators are as follows.

2.4.1. Water Saving Efficiency

WSE indicates the reduction percentage of water demand from the external water supply system. The value refers to the volume of water that can be saved (Villarreal and Dixon, 2005). In this study, WSEd denotes the water saving efficiency of low quality water from the rainwater harvesting system. WSEagri refers to the water saving efficiency of reclaimed water from the wetland. A higher WSEd means that the rainwater harvesting system can supply more low quality water for noncontact use and further decrease the loading on the external domestic water supply system. A higher WSEagri indicates fewer loadings on the external agricultural water supply system. WSEd and WSEagri are described mathematically as follows:
W S E d , t = U L , t D L , t × 100
W S E a g r i , t = O W , t F W D t × 100
where WSEd and WSEagri are the water saving efficiency for domestic and agricultural use (%), respectively. DL,t is the low quality water demand (m3) on day t. In this study, WSE is calculated for each day, followed by the calculation of the annual average WSE.

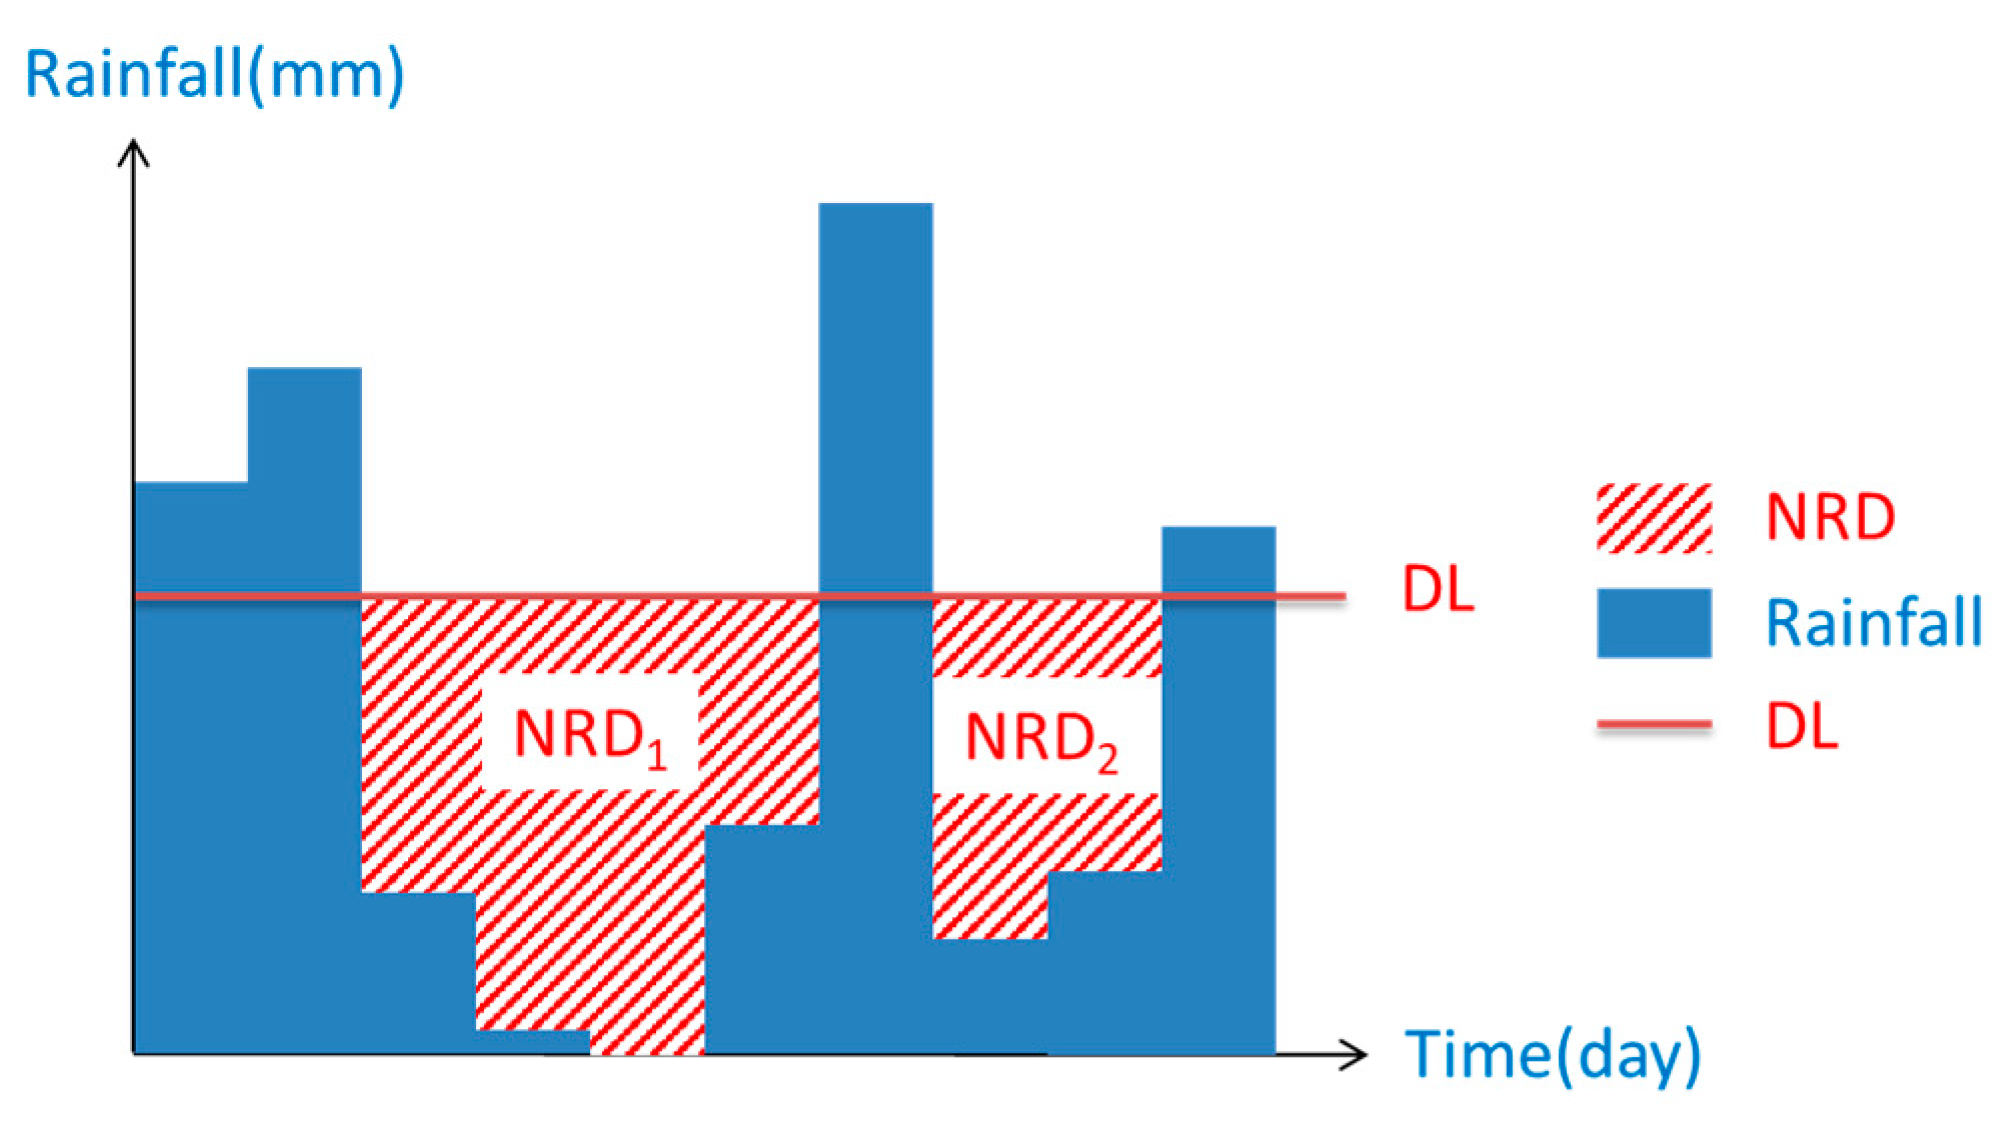
2.4.2. Tolerance Duration

When the external domestic water supply system is temporarily shut down, the duration for which the household storage and rainwater harvesting system can sustain the water supply is called TD. Household storage supplies high quality water demands first, and then meets the deficits of the low quality water demands when the rainwater harvesting system is empty. When the TD of the household storage is lower than that of the rainwater harvesting system, the TD of the domestic system is equal to the TD of the household storage. The equation for TD is as follows:
T D R , t = V R , t D L , t
T D H , t = V H , t D H , t
T D t = { T D H , t if   T D H , t T D R , t T D R , t + V H , t T D R , t × D H , t D H , t + D L , t if   T D H , t > T D R , t }
where TDR,t is the tolerance duration of the rainwater harvesting system (days), TDH,t is the tolerance duration of the household storage (days), DH,t is the high quality water demand (m3), and TDt is the tolerance duration of the domestic system (days) if the external domestic water supply stops on day t.

2.4.3. Water Use Efficiency

WUE is defined as the ratio of crop yield to the total water consumption in the growing season [21]. A higher WUE indicates high yields of the agricultural production system.
W U E j = C Y j / F W D j
where WUEj is the water use efficiency (kg/m3), CYj is the crop yield (kg), and FWDj is the field water demand (m3) in which j denotes the year.

2.5. Design Cases

In this study, the design rural community is a simplified version of Xingshi Village in Hsinchu county located in northern Taiwan. A simplified study site was utilized for evaluating the water supply benefits of the LID modules. The design community has an area of 60 ha and varied land uses, namely, residential, paddy fields, wetlands, and parks. There are 1500 low-rise residential buildings serving a population of 6000. Land use in the community is divided among the residential area (40%), paddy fields (56.67%), wetlands (1.67%), and parks (1.67%). Jia et al. [22] classified the benefits of LID modules as an important factor in their selection. According to their results, constructed wetlands are highly effective in terms of detention and filtration, while the rainwater harvesting system is the most effective detention system. The green roofs and permeable pavements exhibit medium and high effectiveness with regard to filtration, respectively. The above LID modules are chosen in the study based on their efficiencies in filtration or detention. The surface runoffs are simulated by SWMM version 5.1011, and the results are fed into the community water supply model. This model is developed using MATLAB software, which can write statements and undertake quick calculations. The simplified study site presented in this study uses the four above-mentioned LID modules and tests their effectiveness to supply water.
The extent of impervious surfaces (such as buildings, roads, and parking areas) in the residential area is 85%. The remaining 15% is pervious area such as gardens. In Taiwan, the building coverage ratio of the residential area is 60%. In other words, 60% of the residential area is impervious roof area. The remaining part of the impervious area comprises pavements (25%). For comparison purposes, this study presents eight combinations of the LID modules. Case 1 is an original community without LID modules and serves as a control run, while a wetland is installed in case 2. The wetland may collect surface runoff and supply reclaimed water to paddy fields. Green roofs, considered in case 4, and permeable pavements, in case 6, provide runoff for the wetland. A combination of green roofs and permeable pavements provides runoff for the wetland in case 7. A rainwater harvesting system is installed for storing the rainwater from regular roofs in case 3 and from green roofs in case 5. The rainwater is used as low quality water in households. Four LID modules are installed in case 8. The runoff from green roofs and permeable pavements will flow into the rainwater harvesting system and wetland, respectively. The ratio of the area of green roofs is set to 30% of the residential area, and the ratio of the area of permeable pavements is set to 25% of the residential area. Table 2 shows the eight design cases, which install different combinations of the LID modules.

3. Results and Discussion

The rainfall data recorded by the Hsinchu weather station from 1986–2005 are used. The results belong to the case study in Xingshi Village located in northern Taiwan, and assume that the water quality meets the requirements based on the purpose of use.

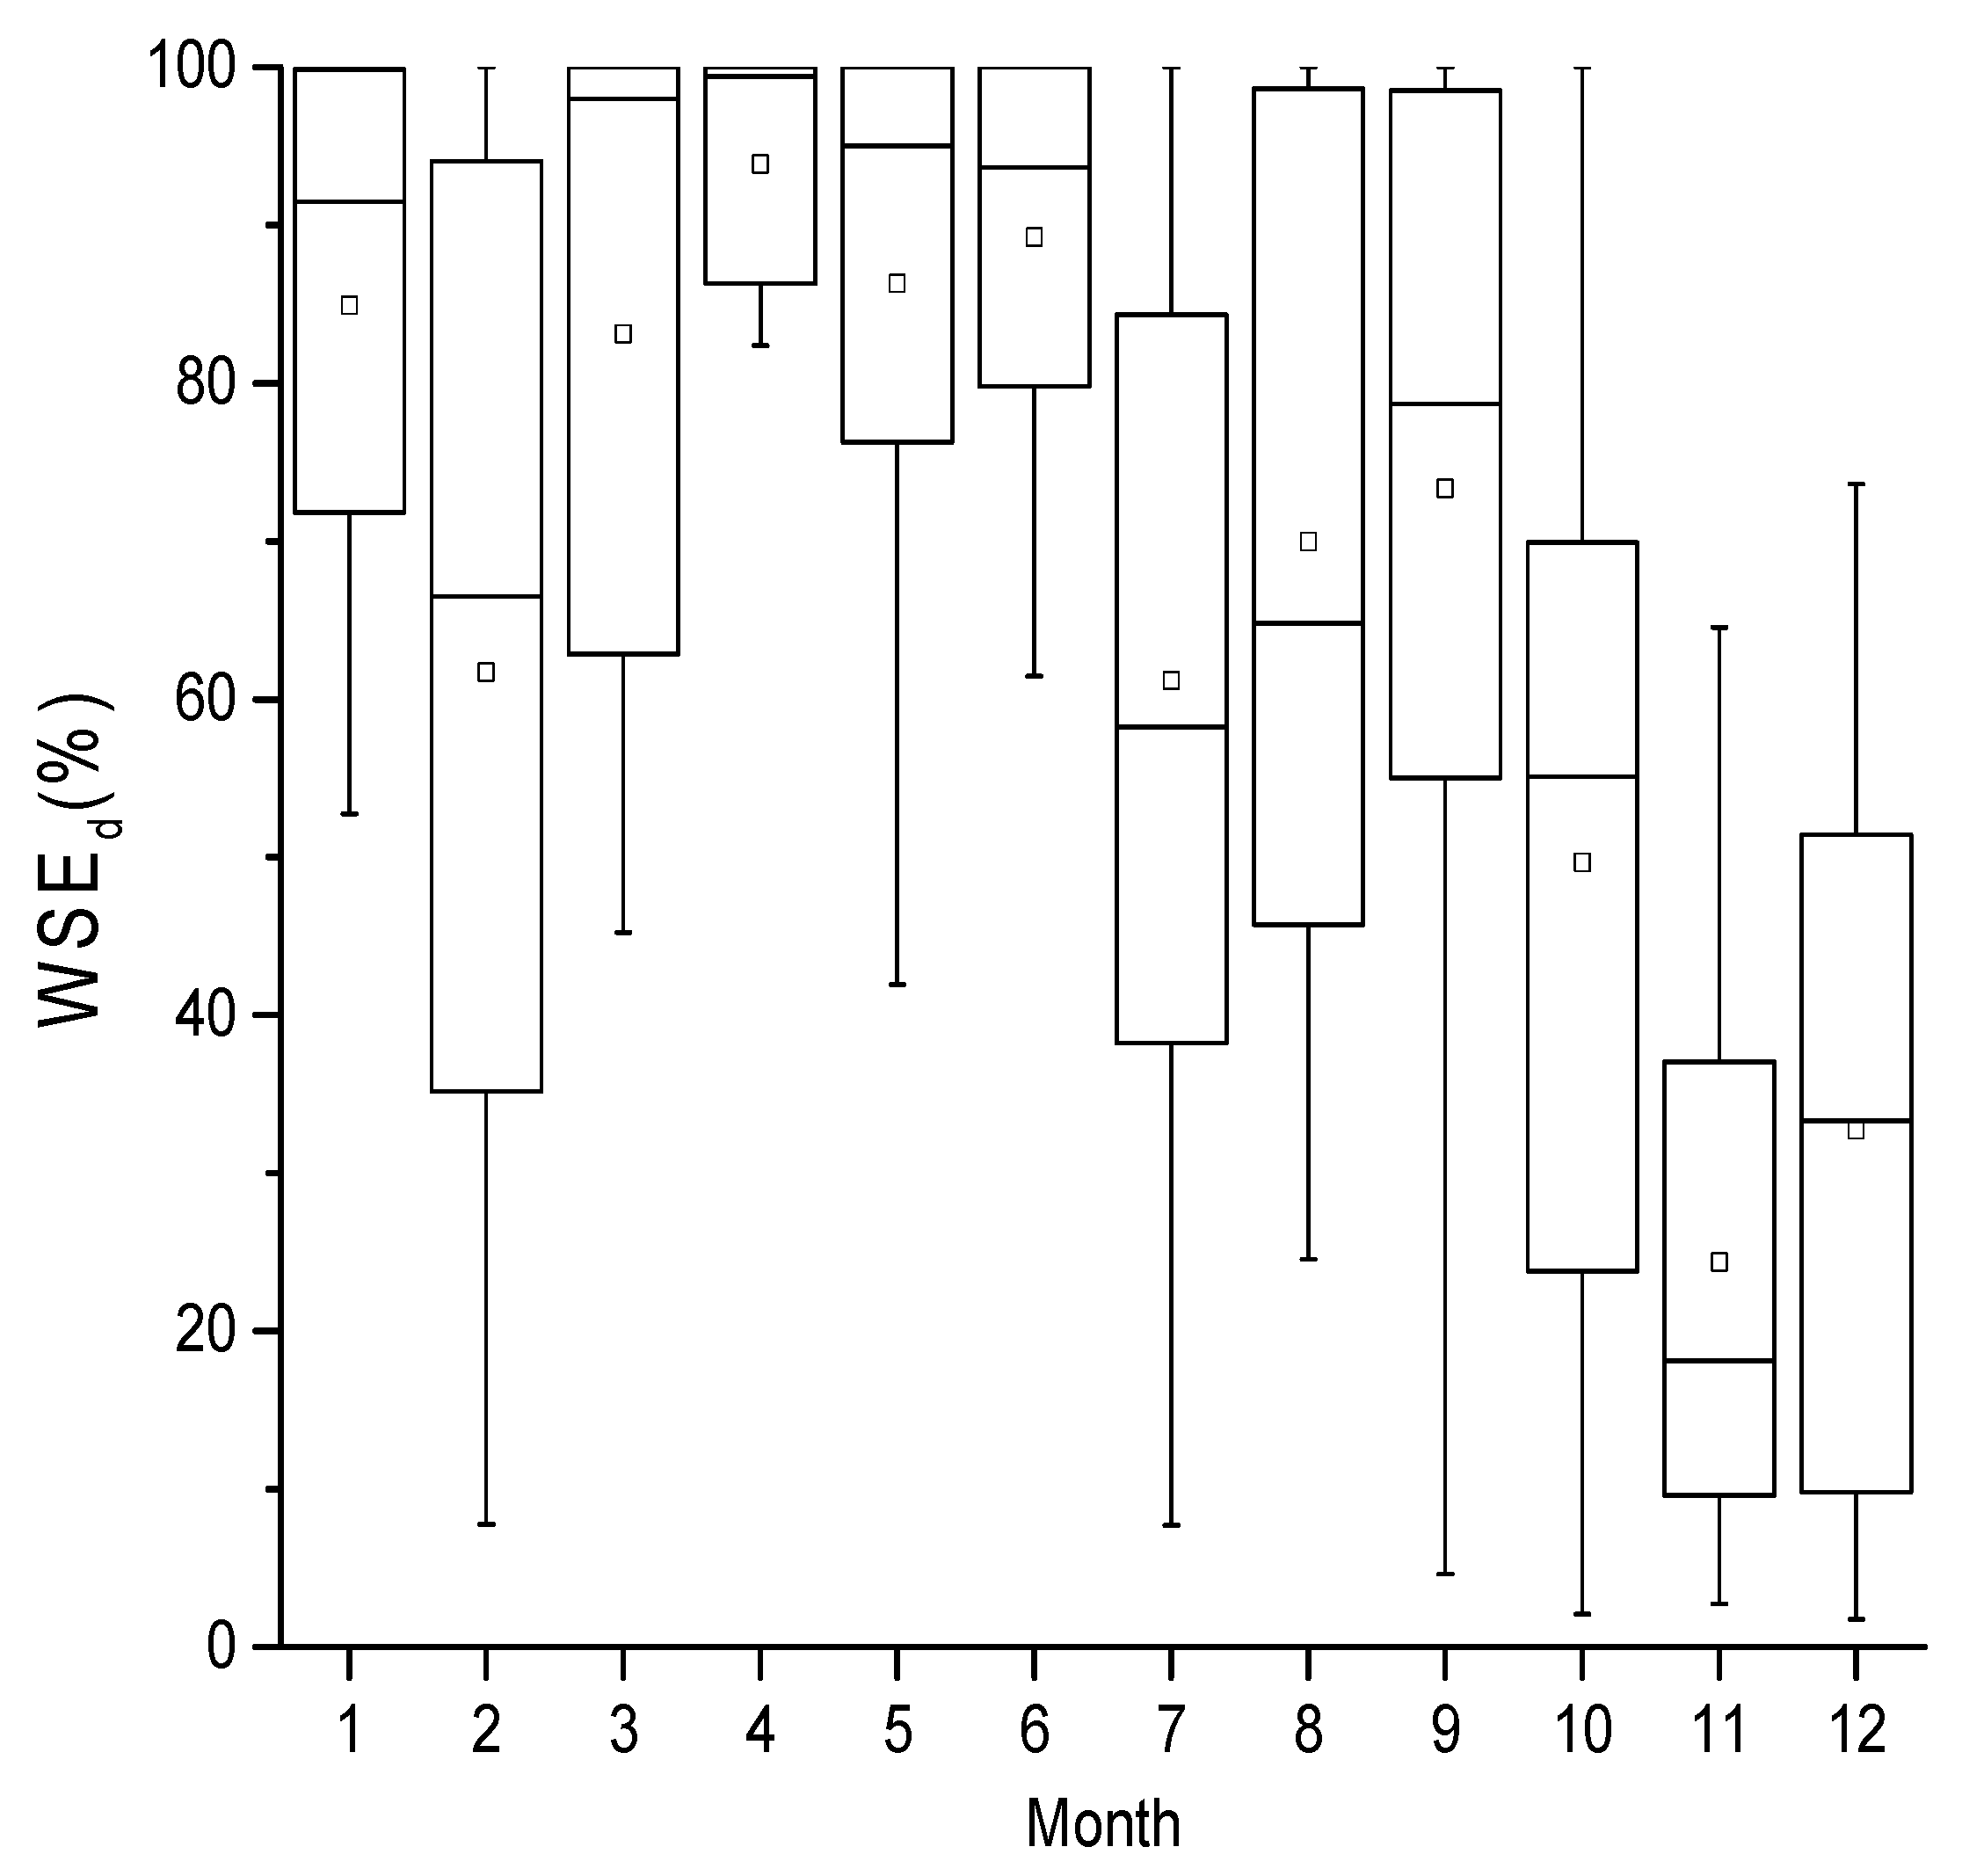
3.1. Water Saving Efficiency

In Taiwan, low quality water demand constitutes 32% of domestic water demand. Table 3 uses the annual averages of WSEd over the twenty years to present the design cases, including the rainwater harvesting system. Cases 3 and 5 have twenty data points in Table 3. The difference between cases 3 and 5 is small. Table 3 shows that the rainwater harvesting system can reduce up to 80.6% of the total low quality water demand, which comprises 25.8% (= 80.6% × 32%) of the total domestic water demand. The result indicates that the rainwater harvesting system has a superior saving efficiency and can significantly reduce the demand loadings on the external domestic water supply system. The premise of this result is that the water quality meets the requirements of the low quality water demand. The simple treatment of rainwater may improve the water quality significantly. There are some cheap domestic rainwater treatments which can ensure the water quality, such as disinfection, slow sand filtration, and pasteurization [23].
However, the performance of the rainwater harvesting system varies in each month. To investigate the relationship between rainfall and the performance of the rainwater harvesting system, the monthly averages of WSEd over the twenty years and the monthly averages of durations of dry days over the twenty years are shown in Figure 5 and Figure 6, respectively. There are twenty data points per month in Figure 5 and Figure 6. In Taiwan, the plum-growing season from May to June is characterized by a longer duration of wet days with a low rainfall intensity, while the typhoon season from July to September is often shorter, with wet days and a high rainfall intensity. The number of consecutive dry days is lower in the plum-growing season than in the typhoon season. Therefore, the inflow of the rainwater harvesting system is more stable in the plum-growing season. Excessive rainfall cannot be stored in rain barrels. Thus, the extreme rainfall pattern during the typhoon season lowers the effectiveness of the rainwater harvesting system. In other words, as rainfall patterns influence the performance of the rainwater harvesting system, it is necessary to evaluate rainfall patterns before installing such a system.
The WSEd in the case study is sensitive to the selection of the reliability of the rainwater harvesting system. Table 4 shows the relationships between the capacities of the rainwater harvesting system and the averages of WSEd based on the chosen reliability. The larger capacity has a higher WSEd, but it also needs a higher budget. The tradeoff between reliability and the costs of the capacity requires further research.
In Taiwan, irrigation accounts for 68% of the total water demand [24]. When the stored water resources cannot satisfy all types of water demands, irrigation water is often diverted to satisfy the domestic water demand in Taiwan. If the irrigation water is not sufficient, the crop yield will be affected. Wetlands provide reclaimed water for irrigation and decrease the irrigation water demand. WSEagri denotes the saving percentage of the irrigation water demand. The previous model [18] assumed that the surface runoff of the community was totally drained out of the system. In case 8, the means of WSEagri in the first and second growth periods are 14.4% and 7.0%, respectively. If the surface runoff drains to constructed wetlands, the means of WSEagri in the first and second growth periods increase to 21.3% and 11.5%, respectively. It shows that the surface runoff flowing into the constructed wetland improves the WSEagri in this study.
The annual averages of WSEagri over the twenty years of the design cases including the wetland are shown in Table 5. The design cases in Table 5 have twenty data points. The WSEagri of cases 4 and 7 with the green roofs are higher than those of cases 2 and 6 without the green roofs. Thus, the green roofs may decrease the peak runoff and increase the runoff detention. This detention may cause cases 4 and 7 to provide more stable runoff discharge to the wetland, thus improving their performance in terms of WSEagri. This finding shows that green roofs are not only a good tool for stormwater management, but also perform well in terms of supplying water to the wetland. A combination of permeable pavements and green roofs (case 7) provides a higher WSEagri than cases 4 and 6. The highest WSEagri is obtained for case 7, and the lowest for case 8. Notably, all the LID modules are installed in case 8. The runoff from the green roofs flows into the rainwater harvesting system. Therefore, the inflow to the wetland is lower than in other cases. The results show that installing all the LID modules at the community scale may not result in the best outcome for agriculture.
In Taiwan, rice grows during two periods during the year. The first growth period spans from March to June, and the second from July to November. Table 5 shows that the first growth period has a higher WSEagri. In Hsinchu, the means of historical rainfall in the first and second growth periods are about 798 mm and 469 mm, respectively. The means of daily temperature in the first and second growth periods are about 24 °C and 25 °C, respectively. The higher rainfall and lower temperature in the first growth period result in a lower crop water demand. Therefore, WSEagri in the first growth period is higher.

3.2. Tolerance Duration

The rainwater harvesting system stores rainwater and supplies the low quality domestic water demand. When droughts occur, the external domestic water supply system may temporarily stop supplying water for several days. The water from household storage and the rainwater harvesting system can support the demand for a few days. In Taiwan, the household storage capacity is designed for supplying two days of domestic water demand. Owing to water quality considerations, the stored water from household storage should preferably be no more than two days old. Integer values of TD mean how many days which domestic water demand can be fully satisfied. The TD of the domestic water storage system without a rainwater harvesting system is one day. Adding a rainwater harvesting system allows a longer tolerance duration of the domestic system. The design cases in Table 6 have twenty data points. As shown in Table 6, the annual averages of TDs over the twenty years of cases 3, 5, and 8 with the rainwater harvesting system are two days.

3.3. Water Use Efficiency

Crop yields are of high concern in the rural community. WUE is calculated using the ratio of crop yields to the total water consumption in the growth period. In this study, the rice yields of the design rural community are calculated by multiplying the yield discount rate by the maximal historical rice yields in the Hsinchu area. The historical rice yields are obtained from the government website. The yield discount rate is calculated from the ratio of actual irrigation water supply to irrigation water demand. The annual averages of WUE over the twenty years of the eight cases are shown in Table 7. The design cases in Table 7 have twenty data points. The WUE values of cases 1, 3, and 5 are the same, because the rainwater harvesting system has no influence on WUE. Cases 2, 4, 6, 7, and 8 have higher WUE values than cases 1, 3, and 5. The wetland provides reclaimed water for irrigation, and thus, decreases the irrigation water demand from the external agricultural water supply system. The WUE values of cases 2, 4, 6, 7, and 8 in the first growth period are higher than those in the second growth period. Because the rainfall in the first growth period is higher, more surface runoff flows into the wetland. The wetland may provide more reclaimed water for irrigation. The irrigation water demand of the first growth period is lower than that of the second growth period, and thus, WUE is higher in the first growth period.
The possible and desired ranges of performance indicators are worth discussing. The possible ranges of WSEd and WSEagri are 0% to 100%, and that of TD depends on the capacities of the household storage and rainwater harvesting system. The possible range of WUE is 0.1 kg/m3 to 2 kg/m3 [25], depending on the crop types and rainfall patterns. The desired values of WSEd and WSEagri are considered as 100% and 30% for a sustainable community, respectively. The rainwater harvesting system has the goal of supplying 100% of the low water quality demand, while wetland is expected to supply 30% of irrigation water. When irrigation water decreases to 30%, the paddy field will stop framing. The desired value of TD is larger than two days. When water restrictions are implemented during a serious drought period, water is available only five of every seven days. If TD is larger than two days, the household storage and the rainwater harvesting system may meet the water demands until the external domestic water supply system returns to normal operation. The desired value of WUE is larger than 1 kg/m3, which is the median of the possible range. In selecting different combinations of LID modules, the desired values of performance indicators may be utilized as selection criteria.

4. Conclusions

The purpose of this study is to evaluate the influence of low impact development (LID) modules on the resilience of the water supply system of a rural community. Therefore, this study develops a model to simulate a community water supply system. The proposed research method can be applied to different cases. Furthermore, indicators are developed to evaluate the performance of the LID modules. Civil engineers may be the potential users, who can design a water supply system at the community scale by comparing the performances of different combinations of LID modules.
The historical rainfall data can help to design the capacity of the rainwater harvesting system, which is taken as the difference between the low quality water demand and rainfall. The capacity can be selected depending on the reliability of supplying the low quality water demand. When deciding the capacity of a rainwater harvesting system, users need to consider its costs. The results show that the rainwater harvesting system significantly increases the domestic water saving efficiency (WSE), saving up to 25.8% of the external domestic water supply system. On the other hand, the constructed wetland significantly increases the water saving efficiency (WSE) in irrigation, reducing the irrigation demand from the external agricultural water supply system by 40%. The results for the tolerance duration (TD) indicate that the rainfall harvesting system can provide a longer duration of normal domestic water supply. In other words, it can shorten the water deficit period and thus increase the resilience of the domestic water supply system. The results of cases 3, 5, and 8, which include the rainwater harvesting system, indicate that the LIDs may supply water for up to 2.4 days. The water use efficiency (WUE) evaluates the ratio of crop yields to the total water consumption in the growing season. The reclaimed water from the wetland leads to higher WUE values in cases 2, 4, 6, 7, and 8 because of lower irrigation water demands on the external agricultural water supply system. In conclusion, the wetland and rainwater harvesting systems perform well in the authors’ study. All the results in this study are only applied to the rural community in northern Taiwan. The framework proposed in this study may be applied in different areas. The results may be different in different research areas.
There are many parameters in SMMM and the community water supply model. The related researches indicated that the sensitive parameters in SWMM include the characteristic width of the region, impervious coefficient, Manning coefficient, and storage of the impervious and pervious areas [26,27]. These sensitive parameters will significantly influence the amount of runoff. The most important parameter in the community water supply model is the capacities of the rainwater harvesting system and constructed wetland. The capacity of the rainwater harvesting system is determined by the low water quality demand and local rainfall characteristics. The size of the constructed wetland needs to consider the available land area. The area size and depth of constructed wetland may be the major uncertainty source of results. In this study, the percentage of constructed wetland area to total area is 1.67% based on land use data from the government database, and the depth of constructed wetland is 1 m. Beside the above discussions, the potential sources of error may also include the estimates of water supply from the external domestic and agricultural water supply system. The community water supply system may be integrated with the regional water supply model for more reasonable simulations in the future.
The next research step is to develop the model as a usable software tool, and consider the impacts of climate change. Climate change may influence the performance of LID measures, and thus, it must be taken into account while designing LID modules for a community. This requires an evaluation of climate risks and devising strategies to strengthen the resilience of the community water supply system. The latter can be effected using performance indicators that can evaluate the adaptation options for different combinations of LID modules. An optimization model may also be required to determine the best combination of LID modules. Future research in this area may consider the effects of water quality.

Acknowledgments

This research was funded by the Ministry of Science and Technology, Taiwan (R.O.C.) under the Contract No. 105-2313-B-002-025-MY3 with the National Taiwan University.

Author Contributions

Yuan-Hua Li conducted the simulation and wrote the paper. Ching-Pin Tung designed the research framework and modified the paper. Pei-Yuan Chen contributed to the results and discussion.

Conflicts of Interest

The authors declare no conflict of interest.

References

  1. Pachauri, R.K.; Allen, M.; Barros, V.; Broome, J.; Cramer, W.; Christ, R.; Church, J.; Clarke, L.; Dahe, Q.; Dasgupta, P. Climate Change 2014: Synthesis Report. Contribution of Working Groups I, II and III to the Fifth Assessment Report of the Intergovernmental Panel on Climate Change; Intergovernmental Panel on Climate Change (IPCC): Geneva, Switzerland, 2014. [Google Scholar]
  2. Lin, B.S.; Ho, H.C.; Hsiao, C.Y.; Keck, J.; Chen, C.Y.; Chi, S.Y.; Chien, Y.D.; Tsai, M.F. Using multi-scale sediment monitoring techniques to evaluate remediation effectiveness of the Tsengwen reservoir watershed after sediment disasters induced by typhoon Morakot. In Proceedings of the 18th International Conference for Soil Mechanics and Geotechnical Engineering, Paris, France, 2–6 September 2013; pp. 571–574. [Google Scholar]
  3. Damodaram, C.; Giacomoni, M.H.; Prakash Khedun, C.; Holmes, H.; Ryan, A.; Saour, W.; Zechman, E.M. Simulation of Combined Best Management Practices and Low Impact Development for Sustainable Stormwater Management1. J. Am. Water Resour. Assoc. 2010, 46, 907–918. [Google Scholar] [CrossRef]
  4. Jia, Z.; Wu, Z.; Luo, W.; Xi, W.; Tang, S.; Liu, W.L.; Fang, S. The impact of improving irrigation efficiency on wetland distribution in an agricultural landscape in the upper reaches of the Yellow River in China. Agric. Water Manag. 2013, 121, 54–61. [Google Scholar] [CrossRef]
  5. Abdulla, F.A.; Al-Shareef, A.W. Roof rainwater harvesting systems for household water supply in Jordan. Desalination 2009, 243, 195–207. [Google Scholar] [CrossRef]
  6. Villarreal, E.L.; Dixon, A. Analysis of a rainwater collection system for domestic water supply in Ringdansen, Norrköping, Sweden. Build. Environ. 2005, 40, 1174–1184. [Google Scholar] [CrossRef]
  7. Wu, Y.; Jia, Z.; Ren, X.; Zhang, Y.; Chen, X.; Bing, H.; Zhang, P. Effects of ridge and furrow rainwater harvesting system combined with irrigation on improving water use efficiency of maize (Zea mays L.) in semi-humid area of China. Agric. Water Manag. 2015, 158, 1–9. [Google Scholar] [CrossRef]
  8. Lai, F.H.; Dai, T.; Zhen, J.; Riverson, J.; Alvi, K.; Shoemaker, L. Sustain—An Epa Bmp Process and Placement Tool for Urban Watersheds. In Proceedings of the Water Environment Federation 2007 TMDL Specialty Conference, Bellevue, WA, USA, 24–27 June 2007; pp. 946–968. [Google Scholar]
  9. Rossman, L.A. Storm Water Management Model User’s Manual Version 5.1; EPA-600/R-14/413b; National Risk Management Research Laboratory, United States Environmental Protection Agency (USEPA): Cincinnati, OH, USA, 2015.
  10. Alfredo, K.; Montalto, F.; Goldstein, A. Observed and Modeled Performances of Prototype Green Roof Test Plots Subjected to Simulated Low- and High-Intensity Precipitations in a Laboratory Experiment. J. Hydrol. Eng. 2010, 15, 444–457. [Google Scholar] [CrossRef]
  11. Burszta-Adamiak, E.; Mrowiec, M. Modelling of green roofs’ hydrologic performance using EPA’s SWMM. Water Sci. Technol. 2013, 68, 36–42. [Google Scholar] [CrossRef] [PubMed]
  12. Jia, H.; Lu, Y.; Yu, S.L.; Chen, Y. Planning of LID–BMPs for urban runoff control: The case of Beijing Olympic Village. Sep. Purif. Technol. 2012, 84, 112–119. [Google Scholar] [CrossRef]
  13. Lee, J.M.; Hyun, K.H.; Choi, J.S.; Yoon, Y.J.; Geronimo, F.K.F. Flood reduction analysis on watershed of LID design demonstration district using SWMM5. Desalin. Water Treat. 2012, 38, 255–261. [Google Scholar] [CrossRef]
  14. Zhang, S.; Guo, Y. SWMM Simulation of the Storm Water Volume Control Performance of Permeable Pavement Systems. J. Hydrol. Eng. 2014, 20, 06014010. [Google Scholar] [CrossRef]
  15. Abi Aad, M.P.; Suidan, M.T.; Shuster, W.D. Modeling Techniques of Best Management Practices: Rain Barrels and Rain Gardens Using EPA SWMM-5. J. Hydrol. Eng. 2010, 15, 434–443. [Google Scholar] [CrossRef]
  16. Steffen, J.; Jensen, M.; Pomeroy, C.A.; Burian, S.J. Water Supply and Stormwater Management Benefits of Residential Rainwater Harvesting in U.S. Cities. J. Am. Water Resour. Assoc. 2013, 49, 810–824. [Google Scholar] [CrossRef]
  17. Walsh, T.C.; Pomeroy, C.A.; Burian, S.J. Hydrologic modeling analysis of a passive, residential rainwater harvesting program in an urbanized, semi-arid watershed. J. Hydrol. 2014, 508, 240–253. [Google Scholar] [CrossRef]
  18. Li, Y.H.; Chen, P.Y.; Lo, W.H.; Tung, C.P. Integrated water resources system dynamics modeling and indicators for sustainable rural community. Paddy Water Environ. 2015, 13, 29–41. [Google Scholar] [CrossRef]
  19. Saving Water Use Indicators, Water Resources Agency. Available online: http://www.wcis.org.tw/Home/Case_3 (accessed on 5 July 2017). (In Chinese).
  20. Jothiprakash, V.; Sathe, M.V. Evaluation of Rainwater Harvesting Methods and Structures Using Analytical Hierarchy Process for a Large Scale Industrial Area. J. Water Resour. Prot. 2009, 1, 427–438. [Google Scholar] [CrossRef]
  21. Kang, S.; Shi, W.; Zhang, J. An improved water-use efficiency for maize grown under regulated deficit irrigation. Field Crop. Res. 2000, 67, 207–214. [Google Scholar] [CrossRef]
  22. Jia, H.; Yao, H.; Tang, Y.; Yu, S.; Zhen, J.; Lu, Y. Development of a multi-criteria index ranking system for urban runoff best management practices (BMPs) selection. Environ. Monit. Assess. 2013, 185, 7915–7933. [Google Scholar] [CrossRef] [PubMed]
  23. Li, Z.; Boyle, F.; Reynolds, A. Rainwater harvesting and greywater treatment systems for domestic application in Ireland. Desalination 2010, 260, 1–8. [Google Scholar] [CrossRef]
  24. Profile on Taiwan Water Resources, Water Resources Agency. Available online: https://www.ncdr.nat.gov.tw/itp2006/download/02.reports/01.Taiwan/06Profile%20on%20Taiwan%20Water%20Resources.pdf (accessed on 26 June 2017).
  25. Sadras, V.O.; Grassini, P.; Steduto, P. Status of Water Use Efficiency of Main Crops: SOLAW Background Thematic Report—TR07; Food and Agriculture Organization of the United Nations (FAO): Rome, Italy, 2012. [Google Scholar]
  26. Zaghloul, N.Z. Sensitivity Analysis of the SWMM runoff-transport parameters and the effects of catchment discretisation. Adv. Water Res. 1983, 6, 214–223. [Google Scholar] [CrossRef]
  27. Zhao, D.Q.; Wang, H.Z.; Chen, J.N.; Wang, H.C. Parameters uncertainty analysis of urban rainfall-runoff simulation. Adv. Water Sci. 2009, 20, 45–51. [Google Scholar]
Figure 1. The framework of a water resource system in a rural community and the connective relationships among the various components.
Sustainability 09 01206 g001
Figure 2. Conceptual diagram of a permeable pavement and the hydrological processes involved.
Sustainability 09 01206 g002
Figure 3. The deficits of low quality water demand. NRD and DL denote the total rainwater deficit and low quality water demand, respectively.
Sustainability 09 01206 g003
Figure 4. Determining the capacity of the rainwater harvesting system using its reliability.
Sustainability 09 01206 g004
Figure 5. Monthly averages of water saving efficiency for domestic use.
Sustainability 09 01206 g005
Figure 6. Consecutive dry days in the monthly averages.
Sustainability 09 01206 g006
Table 1. The component layers of low impact development modules in the Storm Water Management Model.
LID ModuleSurfacePavementSoilStorageDrain
Bio-retention cellV--VV*
Rain gardenV--V----
Green roofV--VVV
Infiltration trenchV----V*
Permeable pavementVV*V*
Rainwater harvesting system------VV
Rooftop disconnectionV------V
Vegetative swaleV--------
V: required; *: optional.
Table 2. The eight design cases of the low impact development modules.
Design CasesConstructed Wetland (WL)Rainwater Harvesting System (RB)Green Roof (GR)Permeable Pavement (PP)
Case 1--------
Case 2V------
Case 3--V----
Case 4V--V--
Case 5--VV--
Case 6V----V
Case 7V--VV
Case 8VVVV
V: required.
Table 3. Water saving efficiency for domestic use for design cases 3 and 5.
WSEd (%)MinQ1Q2Q3Max
3 (RB)47.662.868.473.280.6
5 (RB + GR)47.562.768.273.280.5
Q1, Q2, and Q3 denote the first, second, and third quartile, respectively.
Table 4. Capacities of the rainwater harvesting system and water saving efficiency corresponding to reliabilities.
ReliabilityCapacity (m3)WSEd
50%288049.5%
70%578363.2%
75%714067.5%
80%884872.1%
99%30,86393.7%
Table 5. Water saving efficiency for agricultural use for five design cases.
WSEagri (%)MinQ1Q2Q3Max
Growth period1212121212
2 (WL)12.21.715.56.919.910.723.012.927.619.5
4 (WL + GR)13.11.417.97.021.711.824.615.430.423.2
6 (WL + PP)15.50.721.68.625.013.129.518.137.429.0
7 (WL + PP + GR)16.00.523.09.226.713.831.320.040.032.1
8 (WL + PP + RB + GR)12.20.017.77.119.911.325.714.831.126.0
Q1, Q2, and Q3 denote the first, second, and third quartile, respectively.
Table 6. Tolerance duration of eight design cases.
TDMinQ1Q2Q3Max
1 (Baseline)11111
2 (WL)11111
3 (WL + RB)22222
4 (WL + GR)11111
5 (RB + GR)22222
6 (WL + PP)11111
7 (WL + PP + GR)11111
8 (WL + PP + RB + GR)22222
Q1, Q2, and Q3 denote the first, second, and third quartile, respectively.
Table 7. Water use efficiency in the first and second growth periods.
WUE (kg/m3)MinQ1Q2Q3Max
Growth period1212121212
1 (Baseline)0.150.180.300.290.350.470.410.530.510.58
2 (WL)0.210.220.410.360.460.490.580.540.750.70
3 (RB)0.150.180.300.290.350.470.410.530.510.58
4 (WL + GR)0.220.220.430.350.470.490.590.550.770.73
5 (RB + GR)0.150.180.300.290.350.470.410.530.510.58
6 (WL + PP)0.250.210.450.350.490.520.610.570.840.78
7 (WL + PP + GR)0.250.210.450.350.500.520.630.580.860.80
8 (WL + PP + RB + GR)0.210.190.400.300.450.490.570.560.790.73
Q1, Q2, and Q3 denote the first, second, and third quartile, respectively.

