1. Introduction
The debate on whether to require mandatory labeling of genetically modified organisms (GMOs) on food labels [
1] was partially settled on 29 July 2016, when President Obama signed the National Bioengineered Food Disclosure Standard into public law [
2]. The law provides a deadline of July 2018 for the U.S. Secretary of Agriculture to develop a national mandatory disclosure standard and all relevant accompanying procedures and requirements (e.g., the amount of GMO content allowed before an item is considered a bioengineered food). The law effectively suspends any state-level mandatory labeling requirements meaning that any GMO labeling in the United States will continue to be voluntary on the part of firms until at least July 2018.
It is estimated that 70–80% of the foods consumed in the United States contain ingredients that are genetically modified [
3]. Hence, mandatory labeling of foods containing genetically modified ingredients would alter a large portion of the current products available on U.S. grocery shelves. Beginning in 2002 with the state of Oregon, more than 25 states have considered GMO labeling actions via ballot initiative or legislative action [
4], including 70 state bills directly related to the labeling of GMOs during 2016 state legislative sessions [
5]. Sponsors of legislation and ballot initiatives along with others supportive of mandatory labeling argue that consumers have a ‘right to know’ about the technologies used in the production of the food they consume [
6,
7,
8]. Those opposed to mandatory policies or more skeptical of a mandatory labeling approach worry that mandatory labels may be ineffective as many consumers lack a fundamental understanding of the issue [
9]. Skeptics and opponents also note that the U.S. Food and Drug Administration continues to assess GMOs for risks to human health and the environment [
10] and point to a recent assessment by the National Academy of Sciences that summarizes “… no substantiated evidence that foods from GE [genetically engineered] crops were less safe than foods from non-GE crops…” nor conclusive cause-and-effect evidence of environmental problems from GE crops [
11].
While the Vermont Genetically Engineered Food Labeling Act was not the first state-level law enacted in the United States (Connecticut and Maine passed bills contingent upon neighboring states enacting similar laws while Alaska passed a law requiring the labeling of genetically engineered fish should such product enter the market), the May 2014 legislation was the first to motivate widespread alteration of commercial activity [
12]. Thousands of food products with genetically modified content were not shipped to Vermont after the law took effect in July of 2016 despite the fact that consumers were barred from suing firms in violation of the act until July 2017 [
12]. The law opened firms to potential liability for selling foods containing more than 0.9% of genetically modified content by weight without an appropriately worded package or shelf label, stating that the product is ‘partially produced with genetic engineering’, ‘may be produced with genetic engineering’, or ‘produced with genetic engineering’ [
13].
The Federal Standard, passed and signed within a month of the Vermont law’s enforcement, superseded the Vermont law and ended Vermont’s requirement of mandatory labeling of GMO ingredients via messages printed on labels or on shelves [
6]. In contrast to the state of Vermont’s requirement that would require disclosure of GMO ingredients on food packages or shelf labels, the Federal Standard also allows for disclosure of bioengineered ingredients to consumers via symbols, electronic or digital links, or phone numbers. The enabling Federal legislation further requires that a study assess the ability of consumers to access such information via these methods prior to the Federal regulations taking effect.
The purpose of this communication is to analyze survey responses from 525 adults to investigate whether U.S. consumers are able to obtain information per the disclosure methods allowed in the Federal Standard. The survey probes further to investigate consumer perceptions of GMOs and if consumers would likely use the tools available to access disclosure about bioengineered ingredients. Findings from the survey show that 93.8% of respondents have the ability to access information with those unable to access the information primarily from the lowest income and oldest age groups.
2. Materials and Methods
The online survey was administered over 12 days in October 2016 and completed by 525 adult participants from the United States who were recruited by Qualtrics LLC from online panels maintained by Qualtrics partners. The survey (see the
Supplementary Materials for exact text) included questions about personal and household demographics, the questions analyzed in this research, and questions about other food policy topics not analyzed here. Qualtrics prescreened potential participants by gender, income, and education to enhance national representativeness. However, weighting was also utilized to adjust for differences between the sample and U.S. Census figures using a race by age by income weighting approach to further enhance representativeness. Recruitment yielded 784 respondents who began the survey, which yields a 67% completion rate. Recruitment materials do not mention genetic modification or the term GMO, which may mitigate concerns that respondents with strong opinions or views on these topics were more likely to begin the survey. Ethics approval was received from The Ohio State University Office of Responsible Research Practices’ Institutional Review Board (protocol #2016E0645).
A total of 12 questions will be analyzed here. The first set of questions asked respondents about their personal access to smartphones to connect to the wireless internet or a cellular network. They were asked if they can access online information while at the grocery store where they most often shop and if they can make phone calls at this same grocery store. The variable ‘Lack Access’ was coded = 1 if respondents answered ‘no’ to both of these questions and = 0 otherwise, and it is the key variable for assessing whether the methods in the proposed disclosure standard limit access to the population. Next, respondents were asked about their interest in knowing whether their food contained genetically modified ingredients (GMOs). The variable ‘GMO Interest’ was coded = 1 if they answered ‘yes’ to this question, and zero otherwise. Respondents were asked to answer how likely they were to use both a smartphone and an instore-scanner to scan a Quick Response (QR) code to determine if ingredients were genetically modified with the response options of ‘extremely likely’, ‘somewhat likely’, ‘neither likely or unlikely’, ‘somewhat unlikely’, and ‘extremely unlikely’. The variable ‘QR Likely’ = 1 if subjects responded ‘extremely likely’ or ‘somewhat likely’ to either question and = 0 otherwise. This pair of questions featuring five response options for each question was condensed into a single binary variable so that the dependent variable for likely use of QR codes would mirror the dependent variable for access to disclosure methods, which facilitates comparison. A probit regression model is estimated for each of these three variables (Lack Access, GMO Interest, and QR Likely). The model estimates the probability that the dependent variable equals one as a function of a common set of independent variables. The marginal effects and accompanying p-values for each independent variable are presented.
Respondents were also asked “When it comes to Genetically Modified Ingredients (GMOs), how important are the following publicized concerns to you?” Respondents were presented a list of 16 publicized concerns with the order of presentation randomized to minimize any order effects and asked to rate how important each was with the response options of ‘extremely important’ (coded = 5), ‘very important’ (=4), ‘moderately important’ (=3), ‘somewhat important’ (=2), and ‘not important’ (=1). To determine if the sample average ratings for each of the 16 publicized concerns were statistically different from one another, we employ pairwise t-tests.
All statistical and regression analyses were conducted in Stata Version 14. All analyses use the constructed sample weights.
3. Results
The characteristics of the sample and the recent U.S. census figures are displayed in
Table 1. Despite the use of weights, the sample underrepresents those in the highest income group and over-represents the lowest income group. Some misalignment between sample and census also occurs with respect education, which was not a weighting factor. Specifically, the sample underrepresents those with a high school degree or less.
The first mandated study item was the availability of wireless internet or cellular networks available to consumers. Of the survey respondents, 84.8% replied they have a smartphone with access to the wireless internet or a cellular network. When asked to think about the store where they regularly shop and if they have access to the wireless internet or a cellular network while in the store 71.7% of respondents stated they had access. The other option to obtain disclosure information would be by calling through a phone available to respondents at the store (either a personal device or land line via a toll free number). A total 91.6% of respondents stated they had such access. Altogether, 93.8% of respondents had access to at least one of these alternatives for accessing the disclosure information. This means that all but 6.2% of respondents to this survey have the ability to access GMO labeling information as detailed in the National Biotechnology Disclosure Standard.
We now assess the demographic characteristics of those respondents that lack access to these disclosure methods.
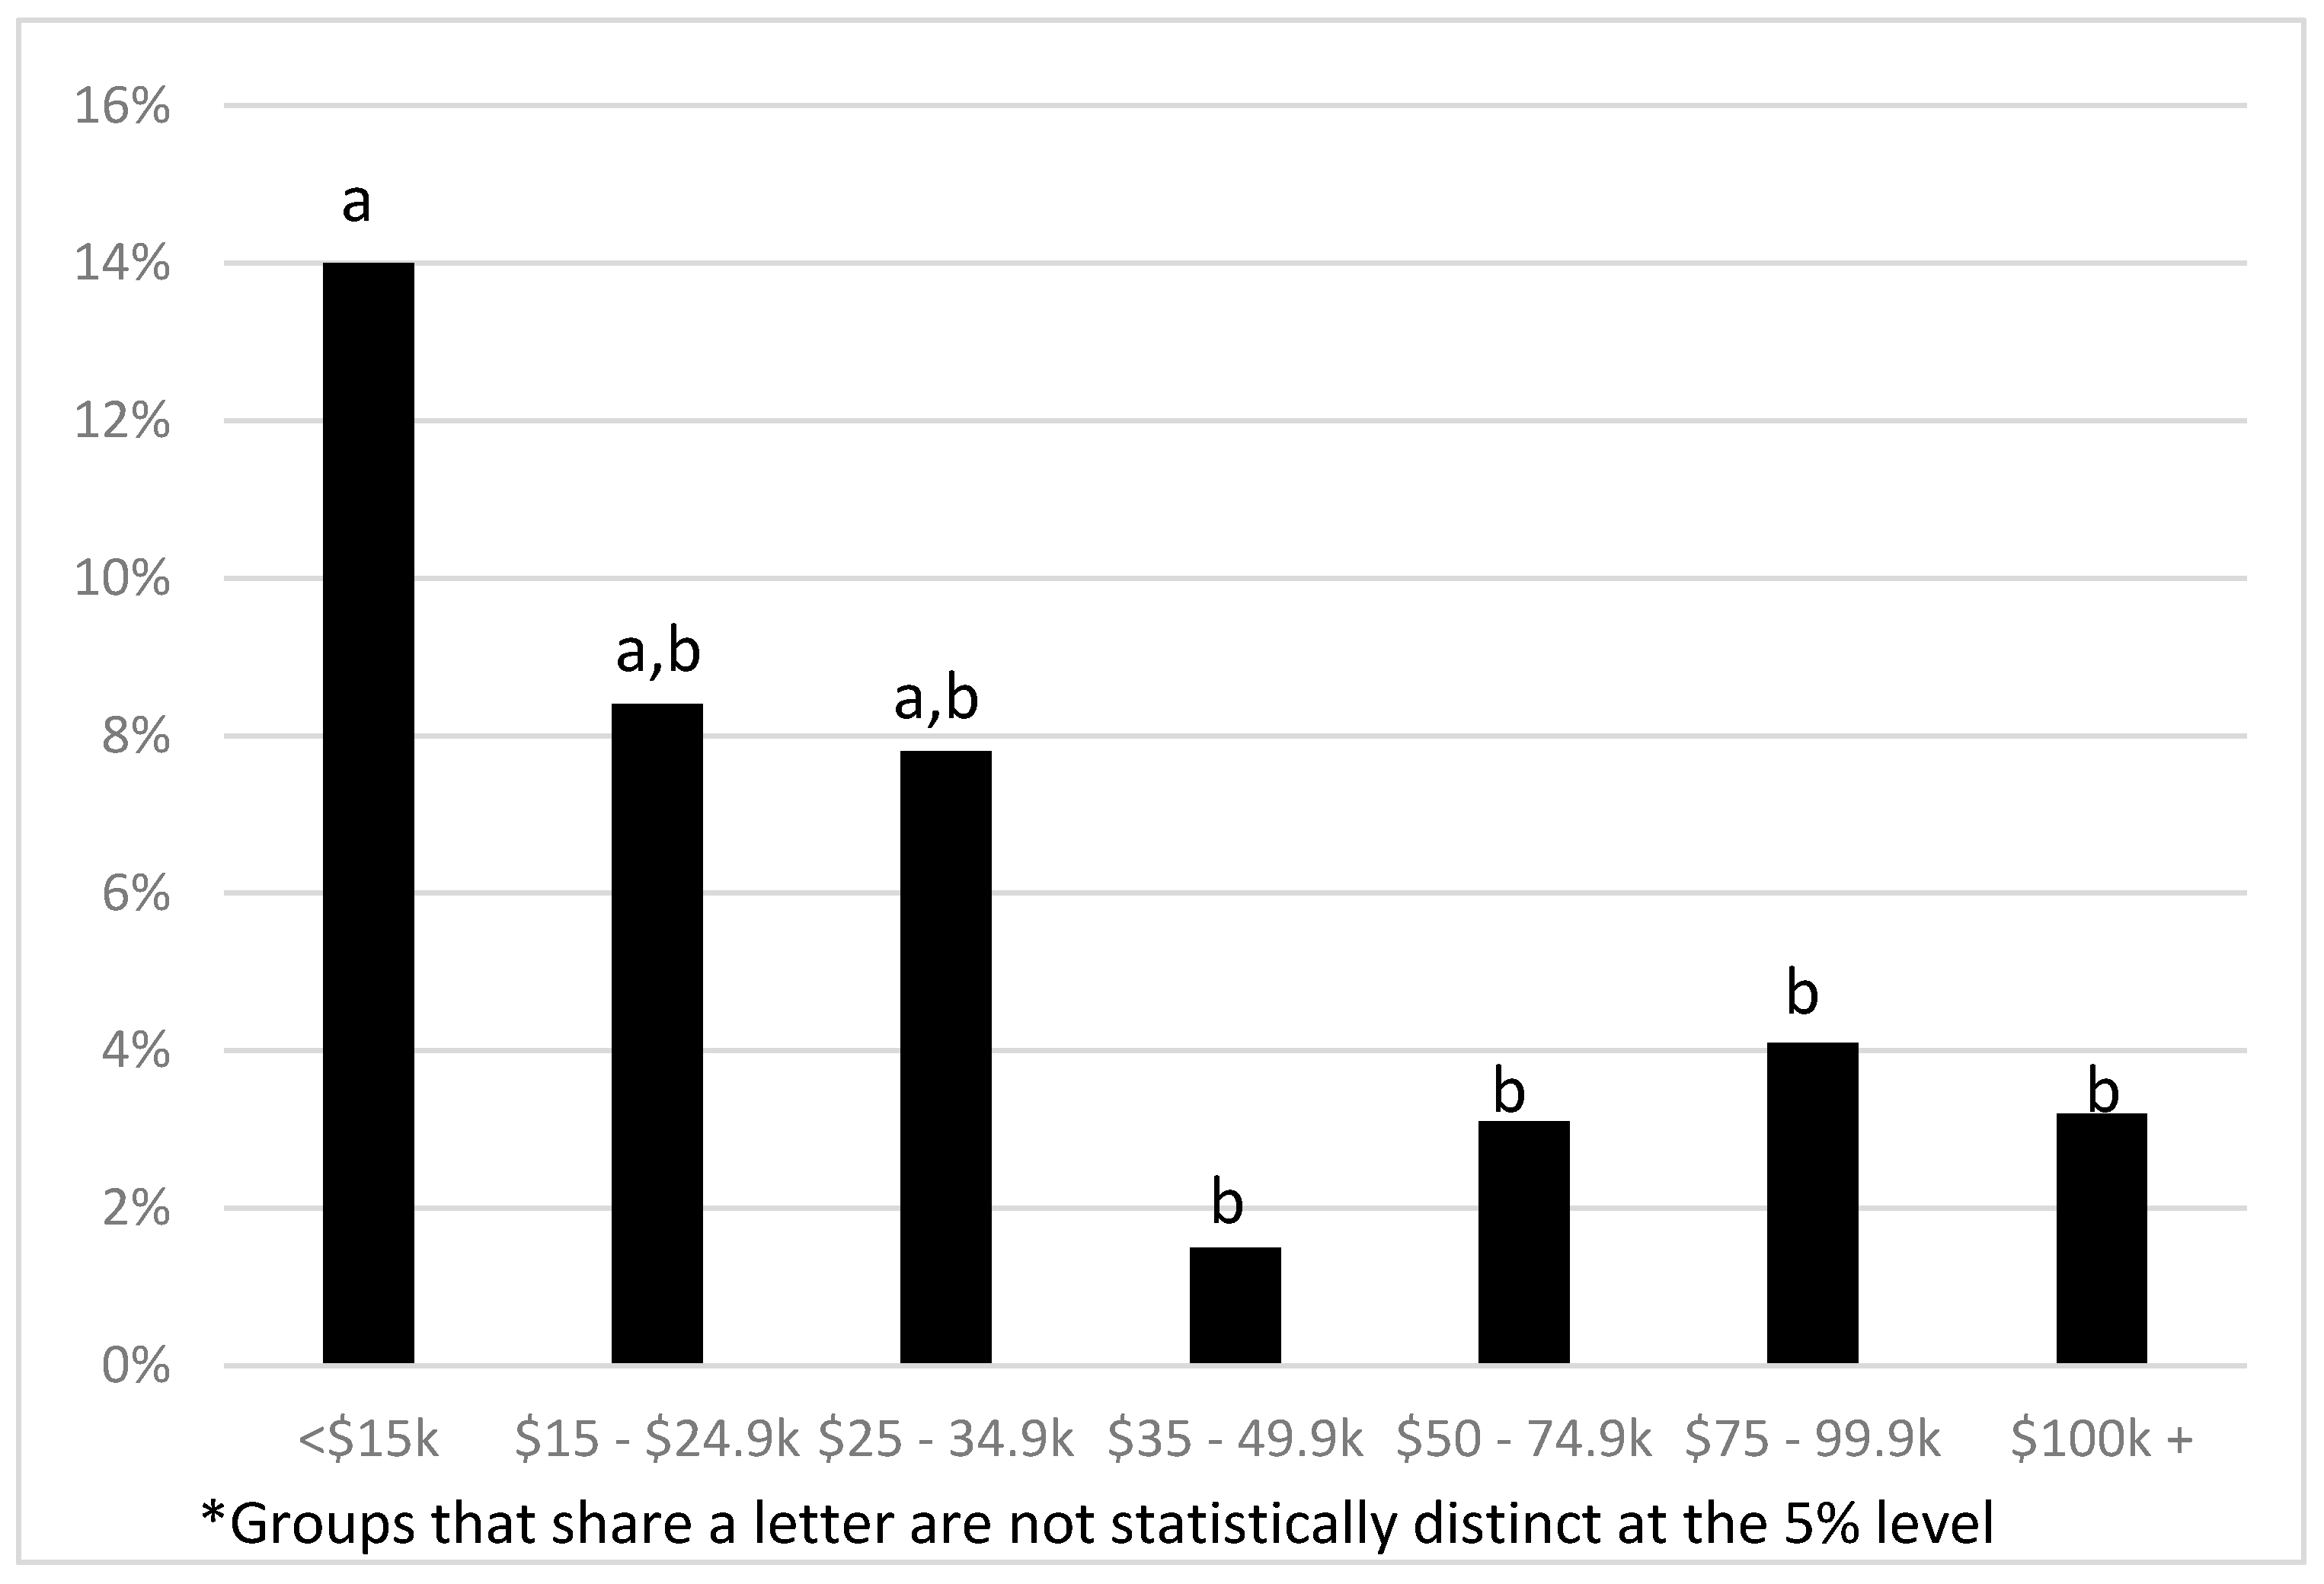
Figure 1 graphs the percent of each income category that lacks access to these disclosure approaches. Pairwise
t-tests are conducted to assess if differences between categories reach statistical significance. Categories that share a lowercase letter in the graph (displayed at the top of each bar) are not statistically different at the 5% level. The lowest income group (<
$15,000 annual household income) has the least access with about 14% lacking access. This group has significantly less access than those in the highest four income groups (
$35,000–
$49,999,
$50,000–
$74,999,
$75,000–
$99,999, and
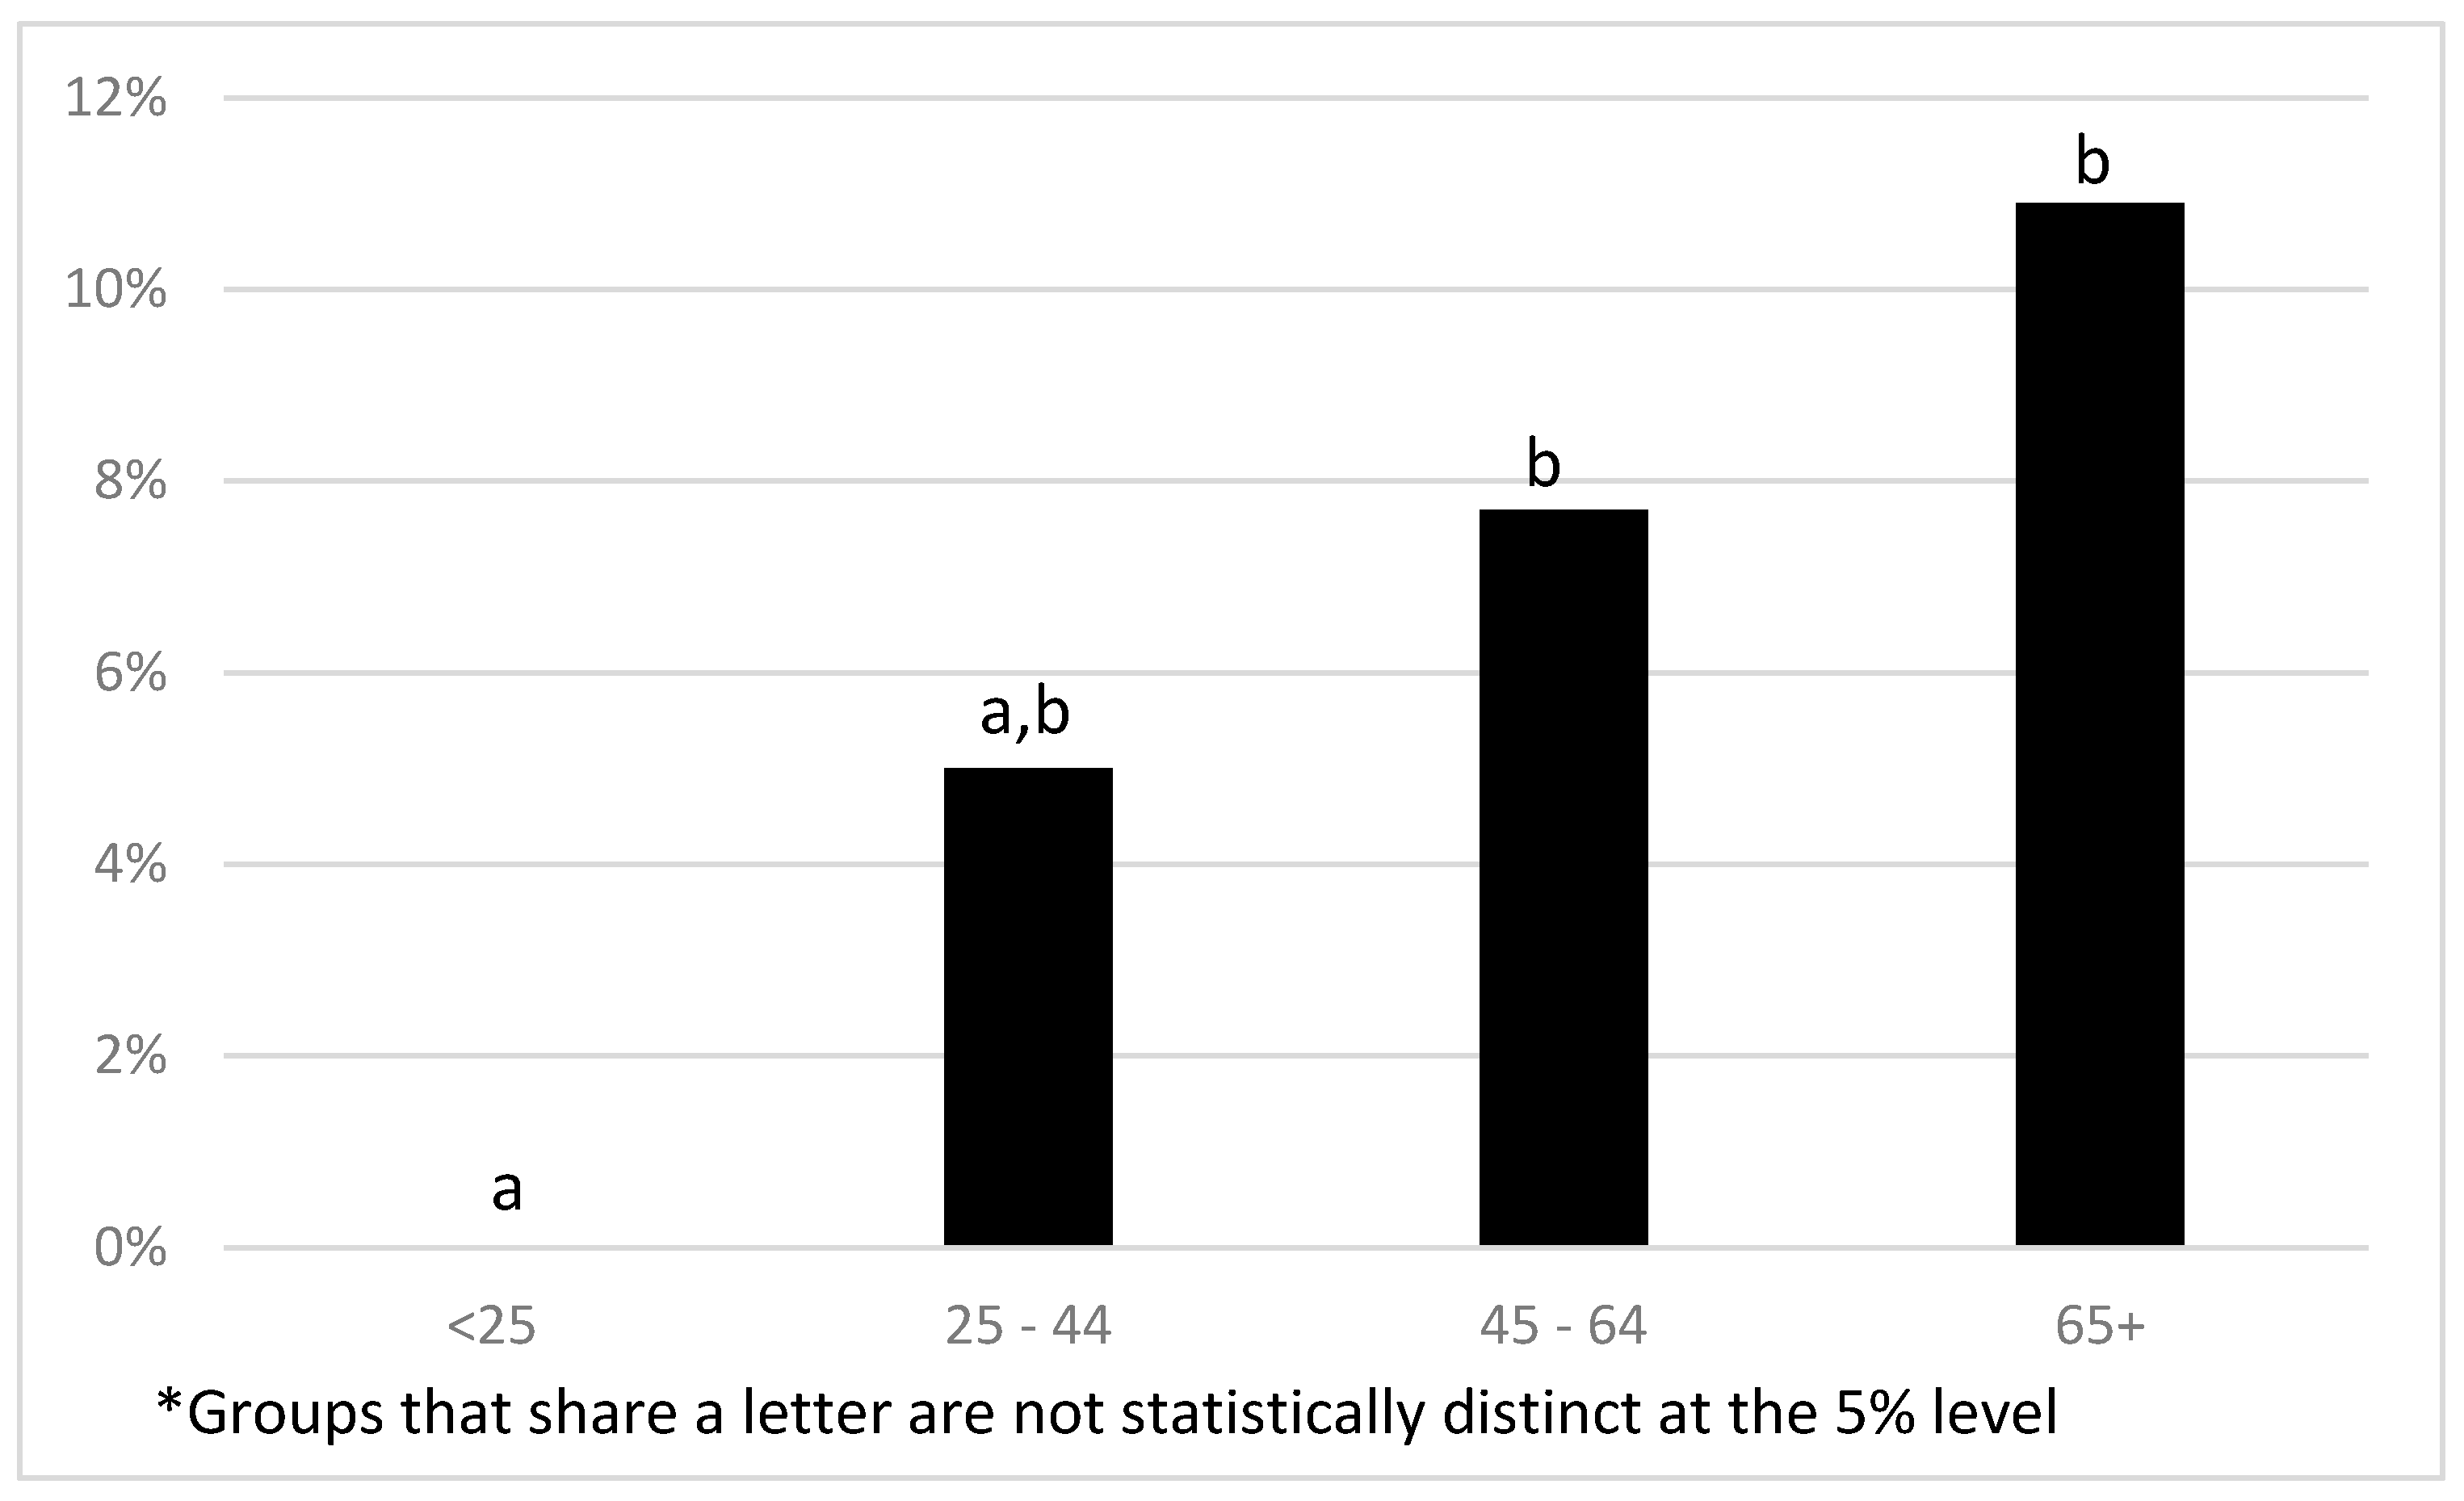
$100,000+). There were also statistically significant differences by age group, as displayed in
Figure 2 via the same lettering system used in
Figure 1. All respondents in the youngest age group (<25) reported having access, while 7.7% of the 45–64 age group and 10.9% of the 65+ age group lacked access, both of which were statically different from the youngest age group at the 5% level. Across the 28 possible age by income categories (4 age × 7 income), those simultaneously in the lowest income and highest age category (those with household annual income less than
$15,000 who were also 65 years old or older) reported the least access with 25.9% responding that they lacked in-store access. There were no significant differences in access by race, gender, or presence of children in the household (univariate analyses not reported). Regression analysis (
Table 2, column entitled ‘Lack Access’), which controls for all these factors simultaneously, reinforces the above pairwise results: age and income remain as significant demographic correlates of access while race, gender, and presence of children are insignificant.
Survey respondents were also asked about their general interest in GMOs. A total 80.9% of consumers wanted to know if their food contained genetically modified ingredients with 50% being ‘very interested’ and 30.9% being ‘somewhat interested.’ Of the 6.2% that lack access to disclosure information, 3.7% expressed interest in knowing if foods contained GMOs while 2.5% expressed no such interest. Analysis of demographic factors was explored to determine if differences in responses varied for income, race, age, education, gender, and presence of children in the household. Regression analysis revealed significant differences in GMO interest by race with those identifying as white or black expressing less interest than other groups, and those in higher income groups expressing more interest than the lowest income group (see
Table 2, column entitled ‘GMO Interest’). No significant differences were identified by gender, age, or the presence of children in the household.
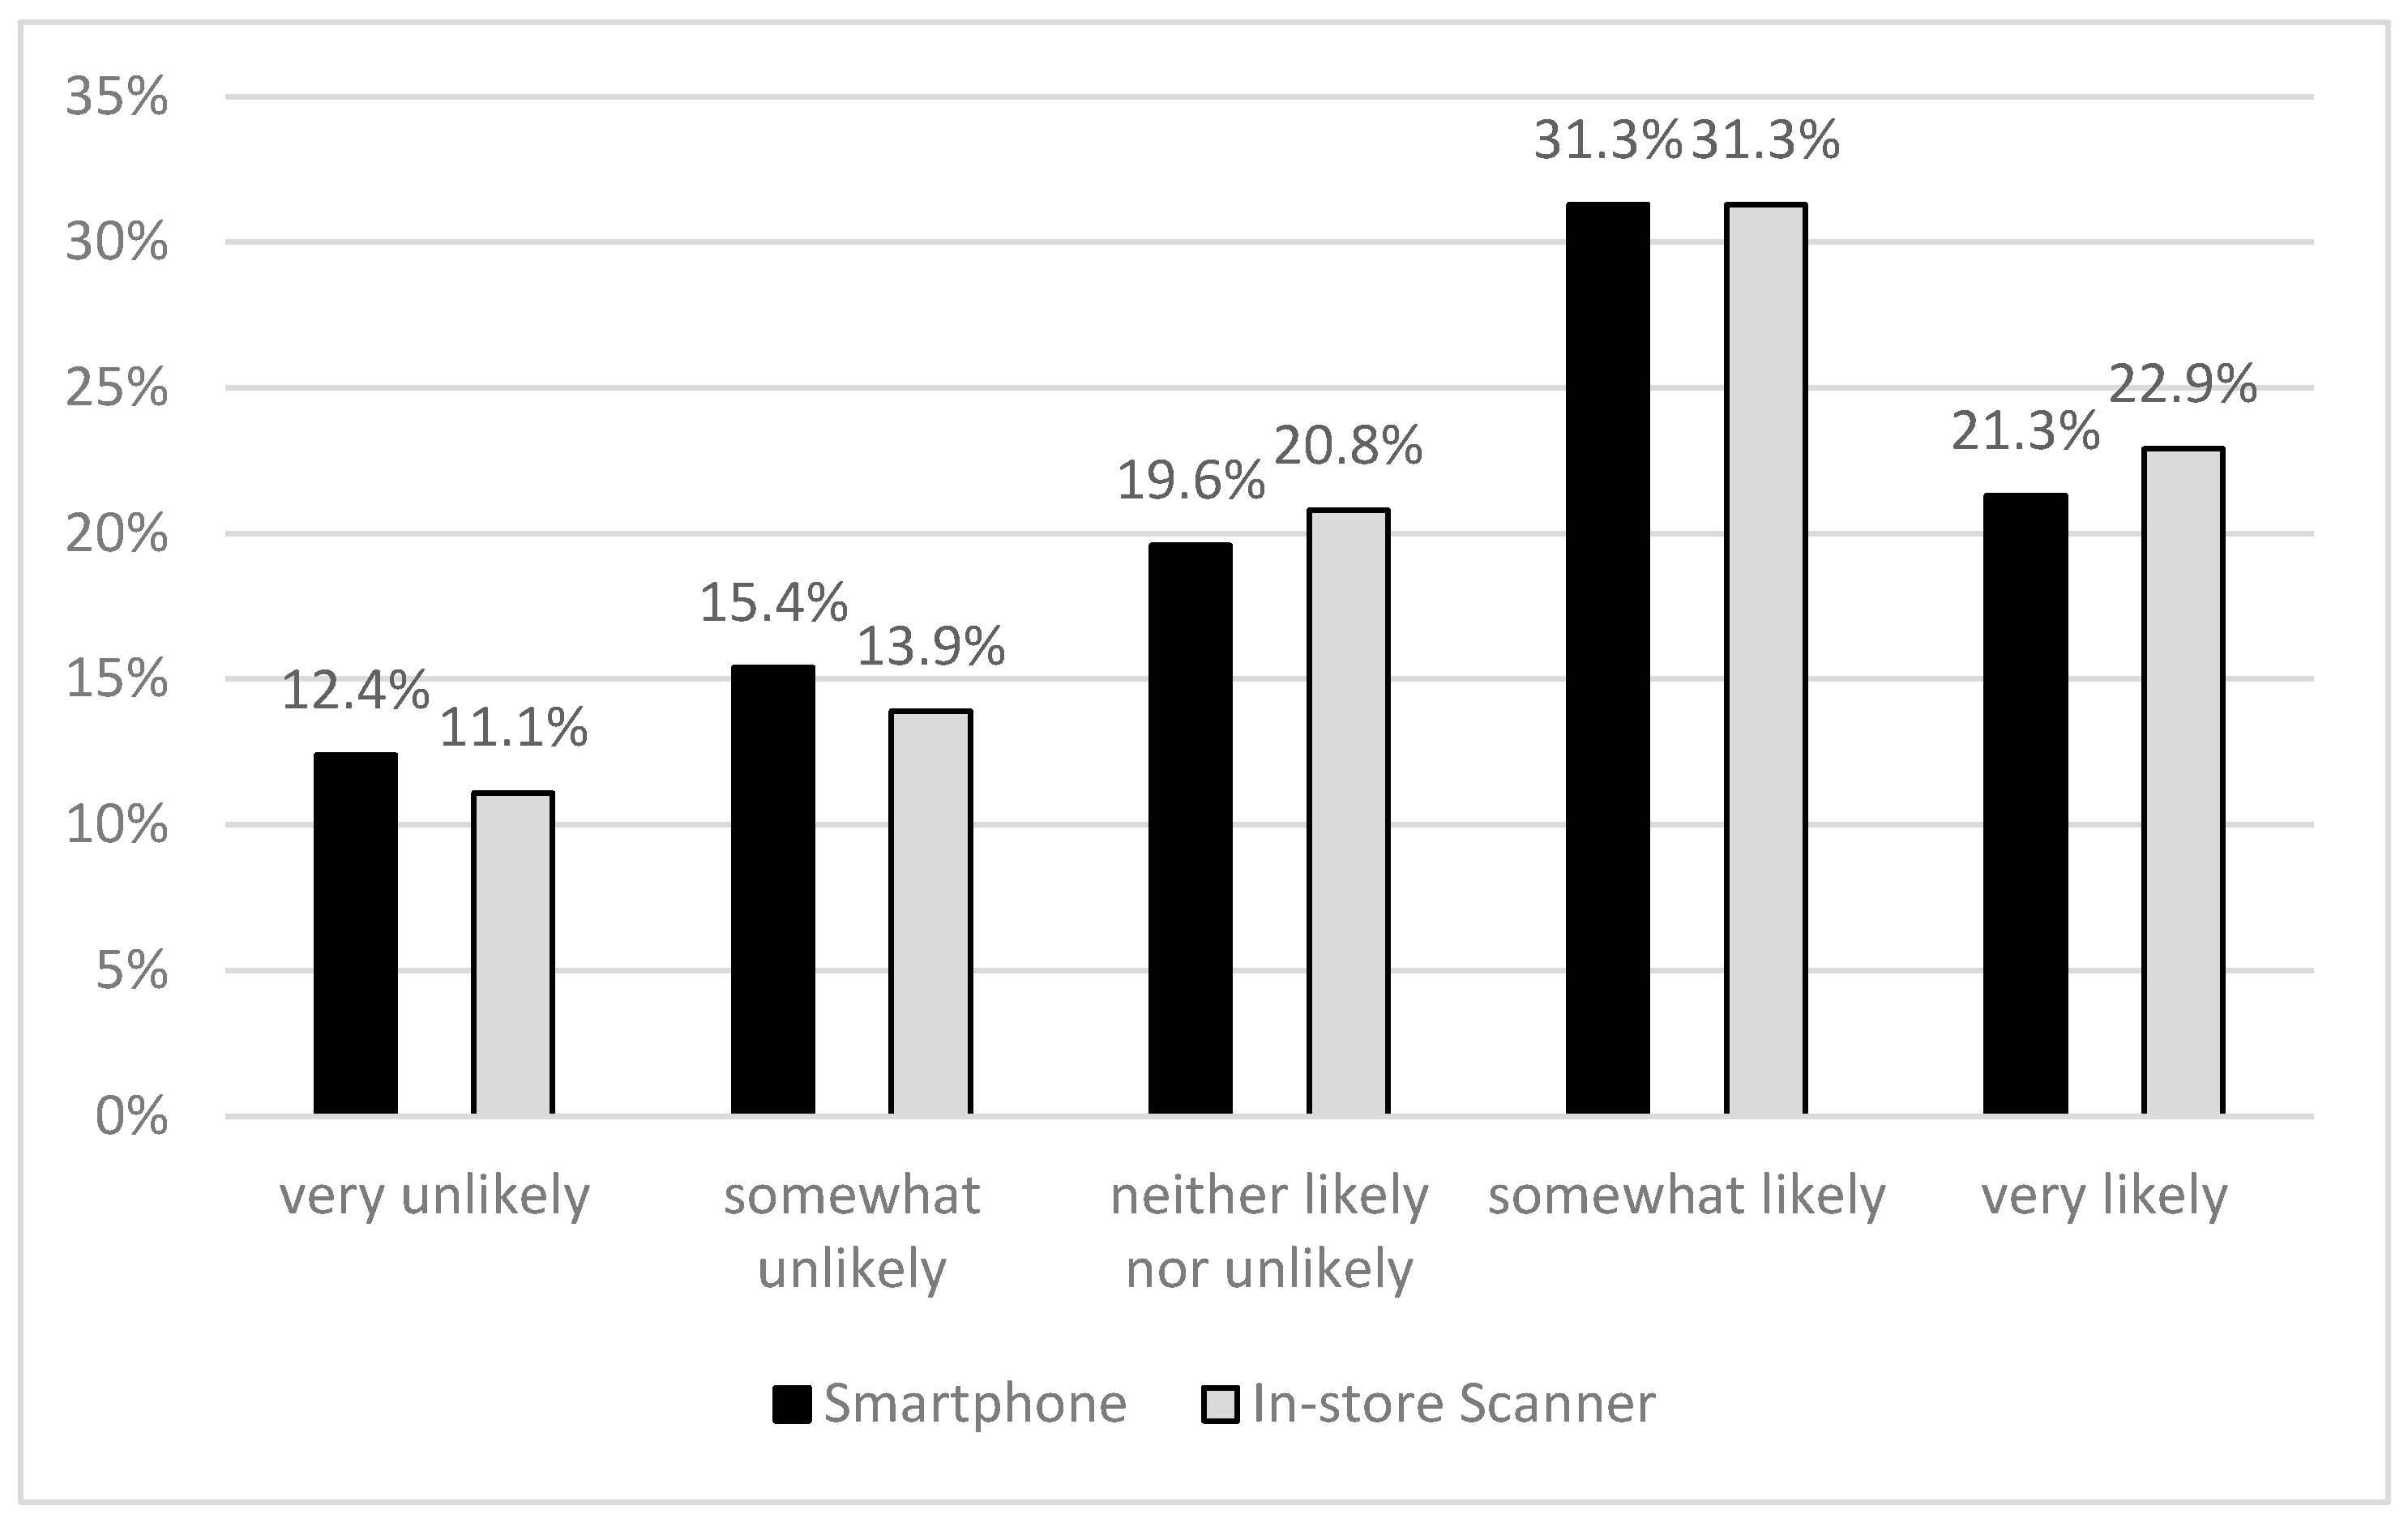
In addition to understanding whether consumers can access information via the proposed disclosure methods, we also probe respondents to consider if they would be likely to utilize disclosure via QR codes through their smartphones or a store provided scanner to access GMO information.
Figure 3 shows how respondents answered for using their smartphones (black bars) and for using an in-store scanner (gray bars). Of those consulted, 52.6% of consumers are ‘somewhat likely’ or ‘very likely’ to use a smartphone and 54.2% of consumers are ‘somewhat likely’ or ‘very likely’ to use an in-store scanner. Across the two methods, 63.9% of respondents responded that they are ‘somewhat likely’ or ‘very likely’ to use at least one of the two methods (smartphone and in-store scanner methods). On the contrary, 27.8% are ‘somewhat unlikely’ or ‘very unlikely’ to use their smartphones and 25% are ‘somewhat unlikely’ or ‘very unlikely’ to use an in-store scanner. A regression model is presented in
Table 2 (column entitle ‘QR Likely’) where the dependent variable equals one if the respondent answered ‘somewhat likely’ or ‘very likely’ to either question displayed in
Figure 3. Significant correlates are found for age, with the older group (65+) being significantly less likely to use QR codes; across income groups, with the lowest income group being least likely to use QR codes; and across racial identification groups, where there is significantly higher likelihood among respondents identifying as black than identifying as white.
Respondents were also asked about how important publicized concerns about GMOs were to them.
Table 3 displays average ratings for each publicized concern. The publicized concerns were chosen from a broad array of items concerning GMOs. Unknown long term health effects had a significantly higher rating than the second most highly rated concern. The next group of concerns, which include increased risk of antibiotic resistance, unknown/unanticipated production of toxins, increased use of pesticides, and unknown long-term environmental effect, are not significantly different from each other at the 5% level (in the table, concerns that share a common letter in the column furthest to the right are not statistically different from each other). The lowest rated concerns, which are not statistically different from one another at the 5% level include risks to species diversity, spread of herbicide tolerance to weeds, spread of pest resistance to undesirable weeds, control of agriculture by biotechnology companies, ethical issues with genetic modification of nature, and damage to topsoil.
4. Discussion and Limitations
Of the 525 survey respondents, 93.8% had access to the alternative means for accessing GMO information about foods allowed in the National Biotechnology Disclosure Standard signed into law in 2016. While promising in terms of ensuring widespread access to information via the methods proposed in the Standard, certain demographic groups—notably those 65 years and older with incomes below $15,000—had more than 25% of respondents that indicated they had no in-store access via wireless internet access or via cell phone access, which would disproportionately limit access to GMO disclosure information for this demographic subgroup.
One potential limitation of this study is the survey mode. While previous research suggests that opt-in online surveys produce results of similar accuracy as other modes of data collection in the realms of political and social indicators [
14], we suggest that additional survey research is warranted to confirm and refine the findings presented here, particularly because the online survey approach might incidentally draw respondents with greater technology access, comfort, and familiarity. Hence, a sample intercepted in the manner implemented for this study may overstate the access to information via the methods allowed in the Disclosure Standard compared to samples intercepted via alternative methods. A multimodal survey allowing for phone or mail survey responses might provide additional confidence that disclosure access is as widespread as was found in this sample.
The purpose of this communication is to report findings that address one key aspect of a pending regulatory process—that of access to information about the GMO content of foods via methods that require internet or phone access by shoppers while in stores. While accessibility of such information is an important aspect of any information policy, we recognize that many aspects of the Disclosure Standard were left to the discretion of the Secretary of Agriculture (e.g., the maximum threshold for GMO content before a food is deemed ‘bioengineered’ and exact language and symbols used in any disclosure) and will be determined prior to implementation. Each choice made during this process warrants detailed analysis and many may have ramifications for the types and amounts of information sought and received by consumers [
15], the resulting perceptions of GMOs held by consumers [
16], the willingness to pay for foods with GMOs [
17,
18,
19], the products and product formulations purchased and offered in the marketplace [
20,
21], the organization and investments made by firms throughout the food supply chain [
22], planting decisions made by farmers [
23], and the research and development investments made by plant genetics and life science firms [
24].


