Abstract
Ecosystem services may be underestimated, and consequently threatened, when land-use planning and management decisions are based on inadequate information. Unfortunately, most of the studies aimed to evaluate and map cultural ecosystem services (CES) are not used for actual decision support therefore there is a gap in the literature about its use in practice. This study aimed to reduce this gap by: (i) mapping CES perceived by city park users through participatory mapping (PPGIS); (ii) mapping CES arising from park management (management perception); (iii) comparing citizens and park management perception to identify matches or mismatches; and (iv) discussing the utility of the data acquired and the methodology proposed to inform urban planning. The methodology presented in this study resulted in data directly informative for urban planning. It provided spatially explicit data about perceived cultural services of the park as well as information about the matching or mismatching patterns about cultural services provision comparing the users’ view with the management dimension. This research demonstrated a way to use the potential of ES mapping to inform urban planning and explored the local management demand for CES mapping, showing this to be a valuable tool for effective integration into actual decision making.
1. Introduction
Besides many environmental and ecological services, urban green spaces provide important social and psychological benefits to human societies, which enrich human life with meanings and emotions [1,2,3,4]. Cultural ecosystem services (CES) provided by urban green areas are one of the most important services from the perspective of urban dwellers [5]. CES provide benefits that are directly and subjectively recognized by people [6]. It has been illustrated that despite the concept of ecosystem services being new and unfamiliar to many actors in urban land-use planning, the issues contained in the concept have been included in land-use planning principles based on sustainable development [5]. In fact, even if it is not explicit, many decisions are made for the purposes of generating benefits for people. For example, recreational facilities (like benches or tables) are placed with the intention to providing benefits in terms of social relations or to permit relaxation, just as a tree-lined avenue in a park is intended to provide aesthetic benefits and a setting for active or passive recreation. However, ecosystem services may be underestimated, and consequently threatened, when land-use planning and management decisions are based on inadequate information. Unfortunately, most of the studies aimed to map CES have not been used for actual decision support in land-use planning and there is a gap in the literature about its use in practice [7]. Therefore, there is a need to demonstrate a pathway from the inception of mapping of CES through integration and use of the information for land use decision support [7].
Moreover, a focus on CES may offer a gateway to ES stewardship through civic engagement and public support [6]. Research suggests that there is a strong connection among CES, civic engagement and ES stewardship; threatened or reduced positive experiences of nature interactions seem to be important factors in the emergence of civic participation in stewardship of urban ecosystems [8]. For example, it has been shown that people are able to forcefully organize to protect urban open spaces such as community gardens when these spaces, and the benefits they provide, are threatened [9,10,11]. An awareness of CES can help park management anticipate and address conflicts in cases where ecologically important changes are expected to have negative effects, or alternatively, can thus facilitate community support for ecologically motivated management actions when these have positive effects on valued CES.
CES arise from human perception of ecosystem benefits, rather than of the ecosystem itself [6,12]. Assessment of CES is therefore different to other ES because often the benefits accord with the dependence on an individual’s value system which cannot be presented using spatial geographical units for assessment [13]. Assessment of CES is less quantitative than for other ecosystem services (e.g., provisioning services, which can be quantified independently from human’s perception). Moreover, perception of ecosystem services is context dependent [14]. A study of specific green spaces may lead us to determine which specific services are relevant to the local context. Measuring services at broad scales is mostly reliant on modeling approaches, which are often limited by the coarse resolution of the input data [15]. In order to inform local decision-making, there is a growing need to measure ecosystem services at individual sites at a fine spatial grain, as this is the scale at which many land-use decisions are typically made and need to be informed [15]. In this context, it is important to identify which benefits are recognized by urban citizens in order to evaluate the perceived value and quality of existing urban green spaces [14] and to support effective management decisions. Mapping cultural services might be informative in order to detect if citizens’ perception of benefits correspond with those of management authority which aim to enhance public experiences of parks. The study presented here aimed to achieve the following. (i) Public perception of benefits: Identify which cultural benefits are perceived by city park users and map them through public participatory mapping (PPGIS). (ii) Management perception of benefits: Identify and map the cultural benefits that park management intend to provide (management perception). (iii) Comparison analysis: Understand if the benefits perceived by citizens and park management match or mismatch by type and distribution. (iv) User demand for PPGIS of CES: Understand if this approach might be informative for decision-making process in park’s management by discussing utility of the data acquired and potential/limits of the methodology.
2. Materials and Methods
2.1. Study Area
Parco Nord (45°53′71″N, 9°20′97″E) is a peri-urban park that extends for 640 hectares in the northern part of the city of Milan (1.25 million inhabitants) (Figure 1) and is comprised of six different municipalities (Milan, Bresso, Cusano Milanino, Cormano, Cinisello Balsamo and Sesto San Giovanni). Parco Nord was established as a Regional Park in 1975. It is situated in one of the most densely urbanized areas of Europe that was once characterized by historic machinery industries (nowadays mostly disappeared as a result of the de-industrialization) and now includes large areas of construction with a few remnants of agriculture.
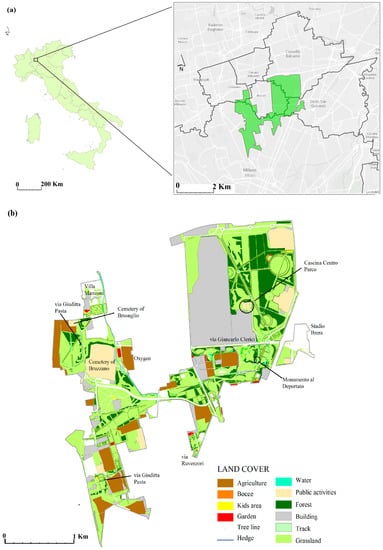
Figure 1.
Location of the study area (a) and land use and land cover map of the Parco Nord of Milan (b).
The chaotic expansion of the urban fabric in this area has led the north periphery of the city of Milan to be connected with the nearby hinterland without strategic urban planning. The idea to establish a park emerged in the late 1960s. The park was created to improve the quality of life of citizens in a problematic area and followed the reorganization of the city through the creation of a green lung approach to planning. The development of a park was strongly supported by the local community and the civic engagement was so influential that the park is known today as Il parco voluto dai cittadini (The Park desired by citizens). The park is characterized by “work in progress”, in which new intervention of forestation and restoration were made progressively in the past years (Figure 2). Despite its recent creation, Parco Nord provides a fundamental service to the ecological and social restoration of the North of Milan, and civic support is still very high with local associations actively involved in the safeguarding of the park.
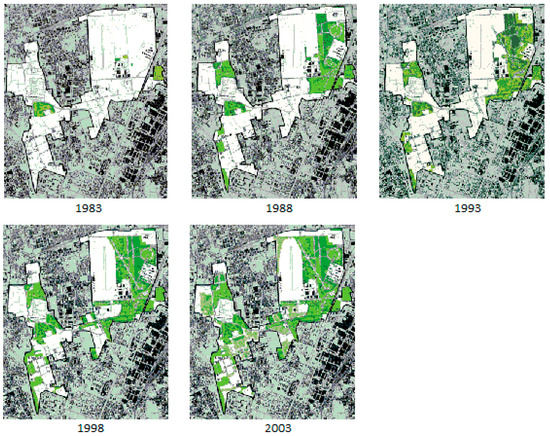
Figure 2.
Restoration process of Parco Nord, a “work in progress”: The first interventions date to 1983. Green areas represented new intervention of renewal (forestation, land remediation, and establishment of meadows). Today, almost 350 hectares of the park are green areas (forests, clearings, rows, bush shrubs, hedges and little water bodies).
2.2. Participatory Mapping of CES
Public participation geographic information systems (PPGIS) refers to spatially explicit methods and technologies for collecting and using non-expert spatial information [7]. It is used to inform planning processes with public knowledge by inviting participants to provide geospatial information about perceived attributes of place [16]. Participatory mapping is a method that can be used to assess and map CES [17,18]. In PPGIS mapping, information is solicited by requesting participants to identify perceived place attributes and to mark their locations on a map. A common approach for soliciting and collecting spatial information using PPGIS is participatory workshops. A diversity of approaches to participatory mapping (map attributes, sampling, purpose, technology and location) provides a large number of mapping design options. In order to collect data about people perception of cultural services, public workshops involving randomly selected citizens was organized between spring and summer 2016. Six workshops were organized with the collaboration of the park authorities as well as local cultural association and promoted through public events, social media and official mailing lists. Workshops were held in the main building of the park where cultural activities take place (Cascina Centro Parco) and in local cultural association buildings close by to the park. Each workshop was about two hours long and divided into two parts. First, each workshop started with an introduction to and clarification of the ecosystem services framework, cultural benefits were presented and described (Table 1) and the purpose of this study presented [19]. Then, respondents were familiarized with the map of the study area and informed about the mapping process [19]. In the second part of the workshop a four-page questionnaire (Appendix A, Table A1, Table A2, Table A3 and Table A4) was used, along with an official hardcopy map of the park (Appendix A, Figure A1). The questionnaire comprised: (1) the list of cultural benefits with the codes to use for the mapping; (2) the list of cultural benefits to which to give a score (from 0 to 10); (3) 13 questions on socio-demographic and site-specific information (about the park); and (4) a blank page where people were free to add their impressions about the exercise. The interviews centered on the following: “Where in this area do you find or use cultural services? Please identify on the map the places in the park where you perceive (find or use) cultural benefits” [15,19]. During the process of mapping, participants marked on the map (using pencils or markers) and linked the places marked to an acronym so that it was possible to identify which benefit was identified and where it was located [20,21,22]. Maps and questionnaires were individually created by participants, but group discussion was also facilitated with one or more experts supervising the exercise and assisting people in the mapping process. This interaction can assist with orientation on the map and may result in more reliable spatial data [20].

Table 1.
List of cultural benefits used in this study (adapted from TESSA toolkit [15]).
Cultural benefits arising from park management were also mapped during a one-day workshop organized with a selected group of staff (n = 6) with diverse tasks (planners, designer, environmental education office, forester ranger, technician cartographer). The staff members were first introduced to the theoretical contents and aims of the study. They were then asked to produce a single map for each benefit (using the same pre-structured list of cultural benefits devised in the citizens workshops) working collaboratively. The workshop centered on the following: “Where in this area can users find or use cultural services? Please identify on the map the places in the park where you want to provide cultural benefits”. During the mapping process, debate and discussion between staff members with different areas of responsibility and experience was facilitated. A researcher supervising the mapping process also took notes on reasons why the CES benefits were identified at specific places.
2.3. Data Analysis
Data collected from respondents and from the park management were digitalized into a GIS (ArcGIS 10.2.2). In order to define the spatial units with which to record the data on CES, the management zonation of the park was used. It constituted of 49 spatial units (“zones”) (Appendix A, Figure A2). Cultural benefits were attributed to each zone on the map if one point or one polygon drawn by people or park staff intersected that zone. For cartographic representation, the absolute number of entries by park users for each zone, was merged. Perceived cultural benefits were displayed on separate maps. In addition, the aggregated patterns of cultural ecosystem were mapped [15] and, for this purpose, richness (the number of different benefits per land unit) was calculated separately for both the park user map and the park management map.
2.4. User Feedback: Consultation on Potential Application of the Method
Following the analysis, the methods and results were presented to park staff, delegates of local cultural organizations and communities of interest during a single-day collective workshop in order to get their feedback on the potential application of the method. Local organizations were involved in this step as they represent an intermediary between the park management and the park users given their role in promoting and organizing cultural events of various scales within the park. By answering specific questions posed by the researchers, the consultees were asked to discuss: (i) the utility of the data acquired; and (ii) the potential/limits of the method proposed. Both questions were investigated by means of structured questioning (see Appendix A, Table A5). The output of this debate informs the discussion at the end of this paper about the user demand for PPGIS of CES.
3. Results and Discussion
3.1. CES Perceived in Parco Nord
3.1.1. Demographics of Park Users Sample
Thirty-one people participated in the study (19 males and 12 females) (Table 2). The age class most represented was 51–70 years old, while young people (20–30 years old) were not easy to contact. Most of the participants were frequent visitors, i.e. local residents living close to the park in the surroundings municipalities. Respondents visited the park mainly for walking, sport, relaxation (“other” in Table 2), to meet other people and for volunteering. Other reasons for visits, not listed in the questionnaire but added by respondents, were: environmental activities, work, cultural events, naturalistic photography, birdwatching, biking and recreational activities.
Table 2.
Demographics about citizens participating to the workshops (N = 31) (see also the questionnaire in Appendix A, Table A3). “None” when no answer was provided.
3.1.2. Cultural Benefits Perceived by Citizens
The cultural benefits scored highest by people were those related to education and ecological knowledge, health (mental and physical), bequest values, aesthetic and cultural heritage (score > 8) (Table 3).
Table 3.
Cultural benefits scored by citizens.
On average, all of the benefits (except those related to spiritual and religious values and to artistic inspiration) were scored quite high (>7.5). The score defined how important people believed a benefit to be for the urban park, and do not refer to specific locations inside Parco Nord. This helped to determine the absolute “weight” of each benefit and may be considered as indication of the people’s “demand” or desires for CES benefits within this park. Cultural services were not scattered randomly across the landscape, but rather follow specific patterns in terms of the intensity of their provision (number of marks for each site) leading to the expression of distinct focal points for cultural services [23,24] (Figure 3).
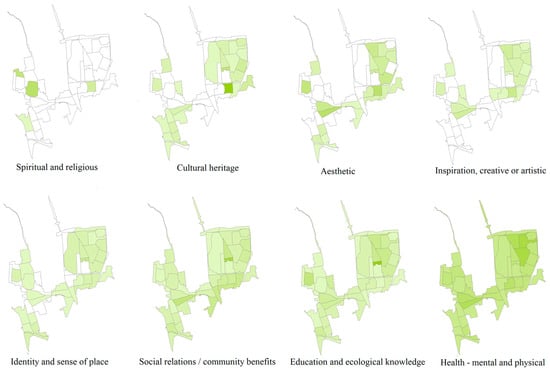
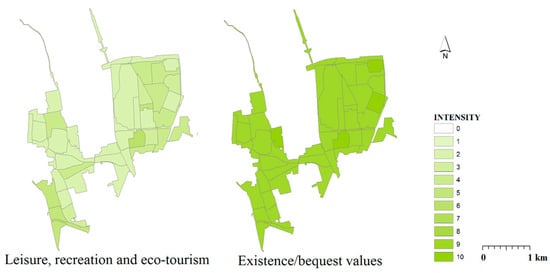
Figure 3.
Maps of singular cultural benefits perceived by citizens. Increase in intensity indicates an increase in the number of marks.
Benefits Related to Education in Ecological Knowledge, and Mental and Physical Health
The scores given to benefits highlight that citizen believed the urban park to be important mainly for its function of education in ecological knowledge. Interestingly, education in ecological knowledge was also one of the benefits most frequently marked on the map (the second highest ranked benefit for the total number of marks, with a focal point for the single benefit corresponding with Cascina Centro Parco, where the main cultural activities normally take place). Ecological knowledge can be acquired through experience of environmental settings that are valuable surroundings for outdoor learning [25,26]. The park is also seen to be an important place for mental and physical health. This positive effect of nature experience on human health and well-being has been extensively documented [27,28]. Health benefits were reported quite frequently by respondents (the fourth highest ranked benefit for the total number of marks) and they were identified in places that corresponded with some “symbolic” natural features (forests, lakes). The environmental settings of the park provided many places where people can undertake physical activity (bike and pedestrian paths, sport facilities, see Appendix A, Figure A1) or where they can interact with nature and improve mental and emotional well-being.
Benefits Related to Community Relations, and Recreational Benefits
Benefits related to community and social relations were among the lowest scores in terms of importance for people, but they were perceived frequently in the park and mainly in the area of Cascina Centro Parco and the surrounding of the entrance of via Giancarlo Clerici. Community and social relations included perception of the park as a place for social integration, to overcome the loneliness of the city and to strengthen personal social relations [25]. Open spaces are normally used as a resting or meeting point, for festivities, as a living or dining space: for people who do not have home gardens or balconies, urban green spaces provide crucial opportunities to leave the apartment and have an outdoor place to meet [25] and this may be particularly relevant for park placed in high density areas. Recreation benefits and benefits relating to identity and sense of place were ranked equal on average (7.9). Recreational benefits were perceived frequently and were mostly associated with presence of facilities (play area, bocce area or walk path). Recreational benefits are mainly identified as the possibility of relaxing or enjoying pleasant activities such as sport, play, walk or practical work like gardening.
Benefits Related to Cultural Heritage and, Identify and Sense of Place
Cultural heritage was scored high on average (8.13) and its perception was distributed heterogeneously in the park with some focal points corresponding to historical features (i.e., Monumento al Deportato and Villa Torretta). Cultural heritage values, identity and sense of place are referred mainly as special or historic features within a landscape that remind us of our collective and individual roots, providing a sense of continuity and understanding of our place in our natural and cultural environment and may thus may be conceptualized as landscape-related “memories” [29]. Participants had a low perception of benefits relating to identity and sense of place, which was common for the whole park.
Benefits Related to Aesthetic Values, Artistic Inspiration, and Bequest Values
Aesthetic benefits were mainly perceived in correspondence to natural features (forests, lakes, meadows, and tree rows) or architectural features (historical buildings). Aesthetic values addressed a feeling of beauty and other studies have found that they often emerge from diversity in landscapes, from rivers or lakes, from a broad panorama view, or they are mostly related to green spaces that seem “natural” and do not show signs of human construction [25]. Benefits related to artistic inspiration were perceived had low scores. This may be because, compared to other benefits, their perception is dependent to artistic sensitivity that is not as common as other sensibilities or other factors. Spiritual benefits had a low number of scores but were clearly corresponded with religious/spiritual features (the cemetery of Bruzzano, cemetery of Brusuglio and Monumento al Deportato). Bequest values (benefit of the park for future generations) were among the highest values. The park therefore is valued not only for contribution to valued experiences, but also, simultaneously and sometimes inseparably, for its existence, independent of experience [30]. All the respondents defined the perception of this value “for the whole park” without specifying any particular location. The importance of such metaphysical values reflected altruistic, existence motivations values and can be based on virtues, principles, or preferences [30,31].
3.1.3. Cultural Benefits Arising from Park Management
The mapping of CES by park management produced 10 maps of individual cultural benefits (Figure 4) and an aggregated map of benefits (Figure 5b). Spiritual and religious benefits were mainly placed in correspondence of physical objects (such as Cemeteries of Bruzzano, Brusuglio, Churches of Villa Torretta, Villa Manzoni, of Comboni Missionaries), of buildings were religious aggregation occurs (Sala del Regno of Jehovah’s Witnesses, a religious school) or where religious events took place in the past (hosting of the Pope Benedetto XVI, and visiting of Buddhist monk Thich Nhat Hanh). Places of cultural heritage were associated with historical artifacts for water (Villoresi and Breda canals, and Seveso River), traditional buildings (farmhouses), industrial artifacts (Hangar Breda, Bunkers Breda, and Breda tracks), historical buildings (Villa Torretta, Villa Manzoni, and tomb of family Manzoni) or to places where memorials existed (Monumento al Deportato). Aesthetic benefits were intended to be provided in almost the whole park. A few zones identified particular aesthetic degradation, mainly due to the presence of junkyards, human artifacts, or ex-industrial areas not yet restored by park management. Creative or artistic inspiration benefits were placed in zones where artistic performance normally take places or had taken place in the past (October of Manzoni, theatre exhibitions, murals, wall mosaics, and Centro Cascina Parco) or where the beauty and tranquility of the natural landscape may be a source of inspiration (forests, water bodies, and tree streets). Benefits derived from identity and sense of place were placed in those zones where facilities helped people to conduct cultural practices or activities important to their sense of identity (such as gardens, bocce, and sport fields), but also corresponded to the location of a school or to zones that stimulate a sense of belonging (Montagnetta and Cascina Centro Parco). Social relations and community benefits were identified in areas corresponding to settings and features for social groups and collective activities (bocce, sport fields, play areas for kids, dog areas, Cascina Centro Parco, school). Opportunities for education and ecological knowledge corresponded to zones where is easier to observe flora and fauna or make astrological observations (forests, water bodies), or where specific events of environmental education were organized (Labyrinth in the corn fields, firefly observations, bunker visits, the school). Mental and physical health benefits corresponded to sport or outdoor activities facilities (gardens, sport fields, bike and pedestrian paths). Benefits derived from leisure and recreation were placed in the whole park. Instead, benefits from tourism were separated because the touristic activity was recognized to be different, as the park is mainly visited by local residents rather than tourists. Tourist benefits were placed in zones with symbolic features (Cascina Centro Parco, Montagnetta, and large round) or with cultural monuments and manufactures (bunkers, Villa Torretta, Villa Manzoni, and tomb of family Manzoni). Existence and bequest values were particularly appreciated by park management. No lighting was provided in these zones of the park. Despite being popular with citizens during the day, the park policy is to not disturb local fauna and this would lead people to value the fact that the park “is there” despite not being visited.
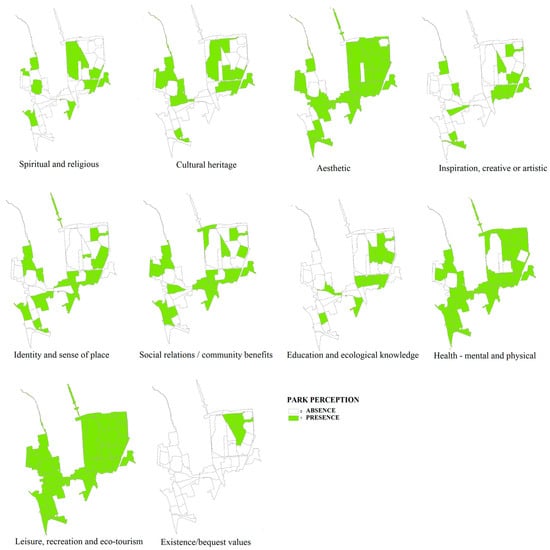
Figure 4.
Maps of singular cultural benefits perceived by park management. Colors indicate the presence or absence of benefits perceived.
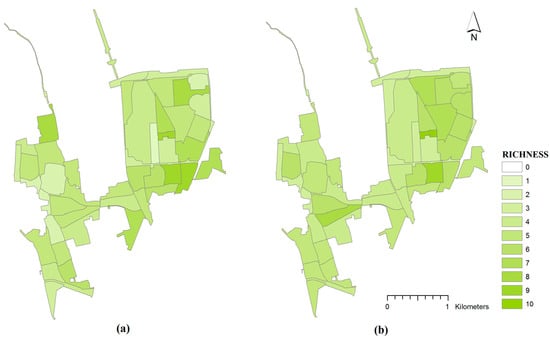
Figure 5.
Map of richness (number of perceived benefits) perceived by: citizens (a); and park management (b).
3.2. Comparison of Maps of CES
Maps of richness of CES (Figure 5) were obtained by merging the number of cultural benefits perceived by people and those to be provided by park management. Maps showed places that have “bundles” of different values. Overall, in the park, benefits to be provided by park management were mostly aesthetic, mental and physical health and social relations, while benefits people perceived mostly were those related to intrinsic values, mental and physical health, recreation, social relations and environmental education (Table 4). This indicates a mismatch between intended park management objectives and the perceived benefits of the public. Based on the maps obtained, the cultural benefits perceived by people are higher (in richness) than the park management intended to furnish. The higher richness of benefits perceived by people was due in part to some benefits being marked by people “for the whole park”, without indicating specific zones. This derives by the fact that some people were not able to distinguish those areas that provided most of a certain benefit. This should probably be avoided in future participatory mapping in order to have more accurate data. On the contrary, the benefits mapped by the park management were never marked “for the whole park”, rather park management considered the presence of specific features in each of the land units. As this work aim to have decision-relevance, it is important to remind the uncertainty that accompanies ES assessments [32,33] due to their high complexity and their integrative position between human and environmental systems [34] and the difficulties associated with accurate representation [35].
Table 4.
CES perceived by park management and citizens for Parco Nord.
The resulting focal points of cultural benefits provision in this study is consistent with what is found in other studies and were normally related to landscape features, land cover forms [19,36] or to specific features of the area, like such as the presence of historical buildings, or facilities for outdoor activities. The many positive matches between cultural benefits in the same places (the “bundled” occurrence of cultural services) [37] showed that there is considerable overlap between individual services. This may be due to the aggregation of distinct features of the park in certain areas (for example, outdoor facilities, and natural features such as lakes and forests). In part, this may indicate that people do not clearly separate one cultural service category from the other [19]. This can be understood—and appreciated—as evidence of the interlinked, holistic nature of cultural ecosystem services [38,39,40]. These results also confirmed the contribution of public parks to people’s wellbeing in urban areas. It also demonstrates that the public can find various cultural values in their everyday surroundings and not only in landscapes of outstanding biodiversity, heritage, or scenery [19].
4. Conclusions
Participatory mapping can shed light into how urban parks are perceived and experienced by citizens. It has been demonstrated that spatially explicit information on CES that incorporates the differentiated perceptions of the local population provides a rich basis for the development of sustainable land management strategies [7,41]. Several studies supported the view that a collaborative, demand-side assessment of cultural services should become part of landscape planning [42], thus incorporating the local values attached to landscapes overcomes the one-sidedness of expert-based approaches [43]. However, cultural services differ in various aspects from other ecosystem services and present some barriers toward their broader incorporation [22,30]. Likewise, management plans are not ordinarily designed to take intangible cultural benefits into account. The mapping of ES using PPGIS is a relatively new field that offers a supplemental approach to expert-driven ecosystem service mapping and modeling [7]. It has been found that a mismatch can occur between the purpose of mapping and its use within decision making [44]. On the other hand, it is claimed that there is a strong demand for approaches that are able to involve local governance networks and thereby move ecosystem services research away from static mapping and evaluation approaches [45]. Because the PPGIS for mapping ecosystem services is relatively recent, it is not surprising that there are few or any examples in the literature describing how mapped ecosystem service data are used for actual decision support [7].
In order to explore the opportunities of map-based data to inform land-use planning, a discussion with park management and local cultural associations represented a valuable way to link the mapping exercise with the local governance. The methodology presented in this study moves towards a mapping process that, through a comparison analysis of different CES perceptions, results in data that may directly inform management. In the first instance, it provided spatially explicit data about perceived cultural services of the park. Moreover, it provided information on matching or mismatching patterns of perceptions about cultural services provision by comparing the users’ views with the management dimension. In order to be useful at the site scale, the method produced data relevant to decisions affecting that site, that are practical and affordable (in terms of expertise, equipment and time) and that provide results in an accessible form to actors such as policy-makers, planners and land managers [15].
The topic of CES is especially pertinent to Parco Nord as the park is recognized as having a fundamental cultural dimension in the metropolitan area of Milan. The park management highlighted how people or visitors to cities who have an interest in culture do not choose to visit an urban park, as cultural places are normally associated with museums or other cultural or heritage destinations. This study (and the public participatory mapping process) represented a suitable means of raising people’s awareness of the cultural values of the park, for public education and to better communicate these values to local government. Moreover, the focus of many (and different) cultural benefits, their detailed description and a common discussion of their perception from the point of view of park management were recognized as a powerful method to enhance tools and ideas for park management. Aggregation indices of cultural services (i.e., richness) point to different facets of cultural values in landscapes and are useful for identifying priority areas [36]. Park management found it of interest also to understand the use citizens make of the park. When discussing the methodology, the main concern of the park management was the size of the sample. In order to improve the representativeness of the sample and to collect data of value for park decision making, it may help to organize workshops with pre-selected user categories that the park is interested in (i.e., families, strangers, etc.). Improvement of the size of the sample would also in part reduce the uncertainty related to CES assessment with positive consequences for the effectiveness of the method. In fact, decision-makers are more likely to meaningfully incorporate scientific information into their decisions if they deem it credible and salient [46,47].
PPGIS integrated with a comparison analysis may help in offering a practical toolset with which to efficiently capture and analyze stakeholder preferences, allowing managers to make informed decisions and understand trade-offs [48]. Moreover, the density of cultural values and the types of values that congregate in various places can help decision-makers anticipate conflict among user groups [49]. The data acquired in terms of the distribution, richness, density and type of benefits perceived are valuable information for local association that want to find “empty” spaces in the park to promote cultural values (i.e., through cultural events).
Mapping cultural services might be informative also in order to detect if there are conflicts between nature conservation and recreation that could occur in particular in densely populated areas [5]. In such cases, urban planners have to generate diversified and good-quality local recreational services, alongside nature conservation areas [50].
Urban planners and policy makers are increasingly aware of the need to take into account citizens’ perception of urban nature design and use into account, and there are many different ways in which they attempt to study this subject [14]. Cultural ecosystem services are generally overlooked by conventional biophysical and economic assessments and, therefore, they are under-appreciated compared to other more easily quantifiable ecosystem services [51,52]. Participatory mapping of cultural benefits can signify the importance of existing urban green space from the user perspective rather than from planners’ perspective [53] and may provide a strong entry point for improving human–nature interactions in cities thereby helping to meet both socially acceptable and ecologically functional sustainability goals [4,6]. On one side, CES are consistently recognized as important, necessary, and vital contributors to human wellbeing [54], while, on the other side, there are few policies specifically in place to maintain CES [55,56] and thus CES have a limited incidence in decision-making. By enhancing the reliability of maps for decision-making it would be possible to overcome the common lack of consistency between procedures and assessment purposes [43,44,57]. Despite methodological challenges, cultural services mapping assessments have many promising potential uses and therefore should be pushed ahead as indispensable elements in the management and protection of landscapes [19]. This research has drawn a way to use this potential to inform urban planning and explore the local management demand for CES mapping, which could be indispensable for integration into actual decision making.
Acknowledgments
This work was supported by the Ministry of Education, Universities and Research within the research program PRIN 2012 (Research projects of relevant national interest), NEUFOR research, grant number 2012K3A2HJ. PRIN provided a research scholarship to C.C. We want to thank the park staff who participated to this study, in particular R. Gini, T. Colombo, G. Carbonara, F. Campana, P.M. Caporale, V. dalla Francesca, M. Siliprandi, M. Urso. We also thank the delegates of the organizations (OrtoComune Nigurda, Ass IDEA, Coop. Pandora Onlus, EcoMuseo Urbano, Casa Testori, E&L VALUE, INTERAZIONE) and the citizens which participated to the workshops. We also want to thank M. Convertino and another anonymous reviewer for constructive comments.
Author Contributions
C.C., C.B., D.J., M.C. and E.P.S. conceived and designed the experiments; C.C. performed the experiments; C.C., analyzed the data; C.C., C.B., D.J., M.C. and E.P.S. wrote the paper.
Conflicts of Interest
The authors declare no conflict of interest.
Appendix A
Table A1.
Page 1 of the four-pages questionnaire presented during the participatory mapping to park users (original questionnaire was in Italian): the list of cultural benefits with the codes to use for the mapping were presented to people.
Table A1.
Page 1 of the four-pages questionnaire presented during the participatory mapping to park users (original questionnaire was in Italian): the list of cultural benefits with the codes to use for the mapping were presented to people.
| QUESTIONNAIRE—PART 1 | ||
| Where in this area do you perceived cultural services? | ||
| Identify and mark on the map the places in the park where you perceived (find or use) the following cultural benefits. | ||
| (Remember to always link the places marked on the map with the CODE of the corresponding cultural benefit) | ||
| CODE | Cultural Benefits | Description |
| SP | Spiritual and religious | I value this place for its spiritual or religious values. |
| CULT | Cultural Heritage | This place has an historical past (social, natural) that link to my cultural heritage. |
| EST | Aesthetic | This place has an aesthetic value (scenery, landscape, sounds or smells). |
| ISP | Inspiration, creative or artistic | This place is a source of inspiration (for photography, painting, writing, music and other artistic or creative arts). |
| APP | Sense of place and Identity | This place produces a feeling of belonging and identity (to feel “at home”, a feeling of familiarity, to identify yourself in the place and in its characteristics). |
| REL | Social relations/community benefits | This place allows social interaction and relationship opportunities (friends, family, and community). |
| ED | Education and ecological knowledge | This is a place where ecological knowledge and environmental education can be developed. |
| SAL | Health—mental and physical | This place contributes to mental (emotional, serenity) and physical (open-air activities) health. |
| RIC | Leisure, recreation and eco-tourism | This place gives recreational and/or touristic opportunities (walk, run, dog, play with friends, observe flora and fauna) |
| INT | Existence/bequest values | This place has its own intrinsic value, regarding to my utility. I value the fact that this place exists and will exist for future generations. |
Table A2.
Page 2 of the four-pages questionnaire presented during the participatory mapping to park users (original questionnaire was in Italian): people were asked to give a score (from 1 to 10) to cultural benefits perceived.
Table A2.
Page 2 of the four-pages questionnaire presented during the participatory mapping to park users (original questionnaire was in Italian): people were asked to give a score (from 1 to 10) to cultural benefits perceived.
| QUESTIONNAIRE—PART 2 | ||
| How important are these benefits to you? | ||
| (Think about how much do you think these benefits are important in this urban park itself). | ||
| Give a score to each cultural benefit from 1 to 10, where | ||
| 1 = minimum (I don’t think it is important at all), | ||
| 10 = maximum (I think it is of fundamental importance) | ||
| CODE | Cultural Benefits | Score |
| SP | Spiritual and religious | x |
| CULT | Cultural heritage | x |
| EST | Aesthetic | x |
| ISP | Inspiration, creative or artistic | x |
| APP | Sense of place and Identity | x |
| REL | Social relations/community benefits | x |
| ED | Education and ecological knowledge | x |
| SAL | Health—mental and physical | x |
| RIC | Leisure, recreation and eco-tourism | x |
| ES | Existence/bequest values | x |
Table A3.
Page 3 of the four-pages questionnaire presented during the participatory mapping to park users (original questionnaire was in Italian): people were asked to provide socio-demographic and site-specific information answering to 13 questions.
Table A3.
Page 3 of the four-pages questionnaire presented during the participatory mapping to park users (original questionnaire was in Italian): people were asked to provide socio-demographic and site-specific information answering to 13 questions.
| QUESTIONNAIRE—PART 3 | |||||
| Age: | 20–30 | 31–40 | 41–50 | 51–60 | 61–70 |
| Gender: | M | F | |||
| Employment: | Student | Retired/unemployed | Part-time worker | Full-time worker | Other |
| Education: | Primary school | Secondary school | High school | University | |
| Do you have children (less than 14 years old)? | Yes | No | |||
| Do you have a dog? | Yes | No | |||
| Where do you live? (indicate the municipality) | |||||
| You live in | Apartment | House with garden | Other | ||
| How far do you distance from the park? | Less than 15 min | Between 15 and 30 min | Between 30 and 60 min | More than 1 h | |
| Do you work close to the park? | Yes | No | |||
| For what reasons do you visit the park? | Walk Volunteer | Children Launch-break | Sport Other | Dog Meet people/ friends | |
| How often do you visit the park? | Every day | At least three times a week | At least one time a week | At least one time per month | |
| At least 1 time per month | Only during festivity/events | Other | |||
| How long does every visit last on average? | 1 h | Half a day | One day | Other | |
Table A4.
Page 4 of the four-pages questionnaire presented during the participatory mapping to park users (original questionnaire was in Italian): optional section where people were free to add their impressions about the exercise.
Table A4.
Page 4 of the four-pages questionnaire presented during the participatory mapping to park users (original questionnaire was in Italian): optional section where people were free to add their impressions about the exercise.
| QUESTIONNAIRE—PART 4 (Optional) |
| Do you want to add some impression about this exercise? ____________________________________________________________________________________ ____________________________________________________________________________________ ____________________________________________________________________________________ |
Table A5.
Questions posed in order to consult on the potential application of the method.
Table A5.
Questions posed in order to consult on the potential application of the method.
| Data Questions |
| a) Was the data on cultural values preferences in the study something they had they ever thought about or come across before? Did they like the idea? What might the barriers be to do this task within their work? |
| b) Do they think this type of data is relevant and useful to their work in terms of park design and management or education activities? |
| c) Do they think the data might be useful for other reasons (e.g., explaining the benefits of having a park to funding agencies, ensuring that its value is recognized by local government, the public or environmental education, for other reasons etc.) |
| d) Based on the results of the study, would the park management consider trying to enhance the cultural values that are considered the most important to the participants in the study (e.g., ecological education, mental and physical health)? |
| Process Questions |
| e) Do they think it is a good idea to consult with the public about how they experience and use the park from time to time? What are the barriers to this? What are the benefits? |
| f) How do they think this methodology can be implemented in terms of data collection (e.g., representativeness of the sample, benefits perception monitoring, additional information about reasons for identifying specific places etc.)? |
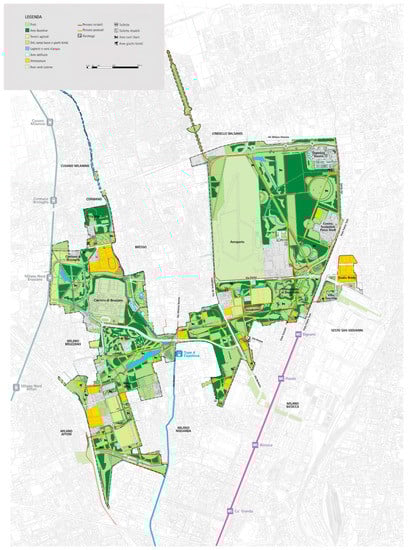
Figure A1.
Map of the park used in the participatory mapping (hardcopy).
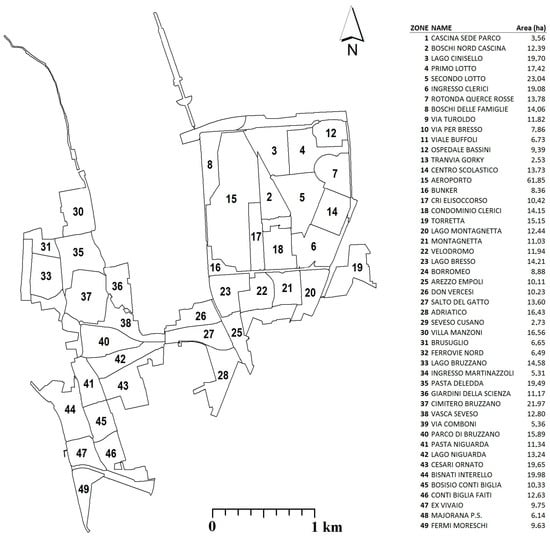
Figure A2.
Management zoning recently adopted by the Parco Nord (zones = 49).
References
- Chiesura, A. The role of urban parks for the sustainable city. Landsc. Urban Plan. 2004, 68, 129–138. [Google Scholar] [CrossRef]
- Sandifer, P.A.; Sutton-Grier, A.E.; Ward, B.P. Exploring connections among nature, biodiversity, ecosystem services, and human health and well-being: Opportunities to enhance health and biodiversity conservation. Ecosyst. Serv. 2015, 12, 1–15. [Google Scholar] [CrossRef]
- Haase, D.; Frantzeskaki, N.; Elmqvist, T. Ecosystem services in urban landscapes: Practical applications and governance implications. Ambio 2014, 43, 407–412. [Google Scholar] [CrossRef] [PubMed]
- Gómez-Baggethun, E.; Gren, Å.; Barton, D.N.; Langemeyer, J.; McPhearson, T.; O’Farrell, P.; Andersson, E.; Hamstead, Z.; Kremer, P. Abstract Urban Ecosystem Services. In Urbanization, Biodiversity and Ecosystem Services: Challenges and Opportunities; Springer: Dordrecht, The Netherlands, 2013; pp. 175–251. [Google Scholar]
- Niemelä, J.; Saarela, S.R.; Söderman, T.; Kopperoinen, L.; Yli-Pelkonen, V.; Väre, S.; Kotze, D.J. Using the ecosystem services approach for better planning and conservation of urban green spaces: A Finland case study. Biodivers. Conserv. 2010, 19, 3225–3243. [Google Scholar] [CrossRef]
- Andersson, E.; Tengö, M.; McPhearson, T.; Kremer, P. Cultural ecosystem services as a gateway for improving urban sustainability. Ecosyst. Serv. 2015, 12, 165–168. [Google Scholar] [CrossRef]
- Brown, G.; Fagerholm, N. Empirical PPGIS/PGIS mapping of ecosystem services: A review and evaluation. Best Pract. Mapp. Ecosyst. Serv. 2015, 13, 119–133. [Google Scholar] [CrossRef]
- Hunter, M.R. Impact of ecological disturbance on awareness of urban nature and sense of environmental stewardship in residential neighborhoods. Landsc. Urban Plan. 2011, 101, 131–138. [Google Scholar] [CrossRef]
- Ernstson, H.; Sörlin, S. Weaving protective stories: Connective practices to articulate holistic values in the Stockholm National Urban Park. Environ. Plan. A 2009, 41, 1460–1479. [Google Scholar] [CrossRef]
- Saldivar-Tanaka, L.; Krasny, M.E. Culturing community development, neighborhood open space, and civic agriculture: The case of Latino community gardens in New York City. Agric. Hum. Values 2004, 21, 399–412. [Google Scholar] [CrossRef]
- Schmelzkopf, K. Incommensurability, Land Use, and the Right to Space: Community Gardens in New York City. Urban Geogr. 2002, 23, 323–343. [Google Scholar] [CrossRef]
- Kaplan, R.; Kaplan, S. The Experience of Nature: A Psychological Perspective; Cambridge University Press: Cambridge, UK, 1989. [Google Scholar]
- La Rosa, D.; Spyra, M.; Inostroza, L. Indicators of Cultural Ecosystem Services for urban planning: A review. Ecol. Indic. 2016, 61, 74–89. [Google Scholar] [CrossRef]
- Buchel, S.; Frantzeskaki, N. Citizens’ voice: A case study about perceived ecosystem services by urban park users in Rotterdam, The Netherlands. Ecosyst. Serv. 2015, 12, 169–177. [Google Scholar] [CrossRef]
- Peh, K.S.H.; Balmford, A.; Bradbury, R.B.; Brown, C.; Butchart, S.H.M.; Hughes, F.M.R.; Stattersfield, A.; Thomas, D.H.L.; Walpole, M.; Bayliss, J.; et al. TESSA: A toolkit for rapid assessment of ecosystem services at sites of biodiversity conservation importance. Ecosyst. Serv. 2013, 5, 51–57. [Google Scholar] [CrossRef]
- Sieber, R. Public participation geographic information systems: A literature review and framework. Ann. Assoc. Am. Geogr. 2006, 96, 491–507. [Google Scholar] [CrossRef]
- Brown, G.; Kyttä, M. Key issues and research priorities for public participation GIS (PPGIS): A synthesis based on empirical research. Appl. Geogr. 2014, 46, 126–136. [Google Scholar] [CrossRef]
- Brown, G.G.; Reed, P. Public participation gis: A new method for use In national forest planning. For. Sci. 2009, 55, 166–182. [Google Scholar]
- Plieninger, T.; Dijks, S.; Oteros-Rozas, E.; Bieling, C. Assessing, mapping, and quantifying cultural ecosystem services at community level. Land Use Policy 2013, 33, 118–129. [Google Scholar] [CrossRef]
- Wolf, I.D.; Wohlfart, T.; Brown, G.; Bartolomé Lasa, A. The use of public participation GIS (PPGIS) for park visitor management: A case study of mountain biking. Tour. Manag. 2015, 51, 112–130. [Google Scholar] [CrossRef]
- Fagerholm, N.; Käyhkö, N.; Ndumbaro, F.; Khamis, M. Community stakeholders’ knowledge in landscape assessments—Mapping indicators for landscape services. Ecol. Indic. 2012, 18, 421–433. [Google Scholar] [CrossRef]
- Klain, S.C.; Chan, K.M.A. Navigating coastal values: Participatory mapping of ecosystem services for spatial planning. Ecol. Econ. 2012, 82, 104–113. [Google Scholar] [CrossRef]
- Van Berkel, D.B.; Verburg, P.H. Spatial quantification and valuation of cultural ecosystem services in an agricultural landscape. Ecol. Indic. 2014, 37, 163–174. [Google Scholar] [CrossRef]
- Willemen, L.; Verburg, P.H.; Hein, L.; Van Mensvoort, M.E.F. Spatial characterization of landscape functions. Landsc. Urban Plan. 2008, 88, 34–43. [Google Scholar] [CrossRef]
- Maraja, R.; Jan, B.; Teja, T. Perceptions of cultural ecosystem services from urban green. Ecosyst. Serv. 2016, 17, 33–39. [Google Scholar]
- Church, A.; Fish, R.; Haines-Young, R.; Mourator, S.; Tratalos, J.; Stapleton, L.; Willis, C.; Coates, P.; Gibbons, S.; Leyshon, C.; et al. UK National Ecosystem Assessment Follow-on Phase. Work Package Report 5: Cultural Ecosystem Services and Indicators; UNEP-WCMC, LWEC: Swindin, UK, 2014. [Google Scholar]
- Lafortezza, R.; Davies, C.; Sanesi, G.; Konijnendijk, C.C.C. Green Infrastructure as a tool to support spatial planning in European urban regions. iFor. Biogeosci. For. 2013, 6, 102–108. [Google Scholar] [CrossRef]
- Van den Berg, A.E.; Hartig, T.; Staats, H. Preference for nature in urbanized societies: Stress, restoration, and the pursuit of sustainability. J. Soc. Issues 2007, 63, 79–96. [Google Scholar] [CrossRef]
- Hassan, R.; Scholes, R.; Ash, N. Millennium Ecosystem Assessment. In Ecosystems and Human Well-Being : Current State and Trends : Findings of the Condition and Trends Working Group; Island Press: Washinton, DC, USA, 2005. [Google Scholar]
- Chan, K.M.A.; Satterfield, T.; Goldstein, J. Rethinking ecosystem services to better address and navigate cultural values. Ecol. Econ. 2012, 74, 8–18. [Google Scholar] [CrossRef]
- Chan, K.M.A.; Guerry, A.D.; Balvanera, P.; Klain, S.; Satterfield, T.; Basurto, X.; Bostrom, A.; Chuenpagdee, R.; Gould, R.; Halpern, B.S.; et al. Where are Cultural and Social in Ecosystem Services? A Framework for Constructive Engagement. Bioscience 2012, 62, 744–756. [Google Scholar]
- Hou, Y.; Burkhard, B.; Müller, F. Uncertainties in landscape analysis and ecosystem service assessment. J. Environ. Manag. 2013, 127, S117–S131. [Google Scholar] [CrossRef] [PubMed]
- Convertino, M.; Muñoz-Carpena, R.; Chu-Agor, M.L.; Kiker, G.A.; Linkov, I. Untangling drivers of species distributions: Global sensitivity and uncertainty analyses of MaxEnt. Environ. Model. Softw. 2014, 51, 296–309. [Google Scholar] [CrossRef]
- Scolozzi, R.; Morri, E.; Santolini, R. Delphi-based change assessment in ecosystem service values to support strategic spatial planning in Italian landscapes. Ecol. Indic. 2012, 21, 134–144. [Google Scholar] [CrossRef]
- Collier, M.J.; Scott, M. Conflicting rationalities, knowledge and values in scarred landscapes. J. Rural Stud. 2009, 25, 267–277. [Google Scholar] [CrossRef]
- Bryan, B.A.; Raymond, C.M.; Crossman, N.D.; Macdonald, D.H. Targeting the management of ecosystem services based on social values: Where, what, and how? Landsc. Urban Plan. 2010, 97, 111–122. [Google Scholar] [CrossRef]
- Raudsepp-Hearne, C.; Peterson, G.D.; Bennett, E.M. Ecosystem service bundles for analyzing tradeoffs in diverse landscapes. Proc. Natl. Acad. Sci. USA 2010, 107, 5242–5247. [Google Scholar] [CrossRef] [PubMed]
- Hernández-Morcillo, M.; Plieninger, T.; Bieling, C. An empirical review of cultural ecosystem service indicators. Ecol. Indic. 2013, 29, 434–444. [Google Scholar] [CrossRef]
- Bieling, C.; Plieninger, T. Recording Manifestations of Cultural Ecosystem Services in the Landscape. Landsc. Res. 2013, 38, 649–667. [Google Scholar] [CrossRef]
- Daniel, T.C.; Muhar, A.; Arnberger, A.; Aznar, O.; Boyd, J.W.; Chan, K.M.A.; Costanza, R.; Elmqvist, T.; Flint, C.G.; Gobster, P.H.; et al. Contributions of cultural services to the ecosystem services agenda. Proc. Natl. Acad. Sci. USA 2012, 109, 8812–8819. [Google Scholar] [CrossRef] [PubMed]
- Lynam, T.; De Jong, W.; Sheil, D.; Kusumanto, T.; Evans, K. A review of tools for incorporating community knowledge, preferences, and values into decision making in natural resources management. Ecol. Soc. 2007, 12, 5. [Google Scholar] [CrossRef]
- Termorshuizen, J.W.; Opdam, P. Landscape services as a bridge between landscape ecology and sustainable development. Landsc. Ecol. 2009, 24, 1037–1052. [Google Scholar] [CrossRef]
- Martínez-Harms, M.J.; Balvanera, P. Methods for mapping Ecosystem Service supply: A review. Int. J. Biodivers. Sci. Ecosyst. Serv. Manag. 2012, 8, 17–25. [Google Scholar] [CrossRef]
- Nahuelhual, L.; Laterra, P.; Villarino, S.; Mastrángelo, M.; Carmona, A.; Jaramillo, A.; Barral, P.; Burgos, N. Mapping of ecosystem services: Missing links between purposes and procedures. Ecosyst. Serv. 2014, 13, 162–172. [Google Scholar] [CrossRef]
- Opdam, P. Using ecosystem services in community-based landscape planning: Science is not ready to deliver. In Landscape Ecology for Sustainable Environment and Culture; Springer: Dordrecht, The Netherlands, 2013; pp. 77–101. [Google Scholar]
- Hamel, P.; Bryant, B.P. Uncertainty assessment in ecosystem services analyses: Seven challenges and practical responses. Ecosyst. Serv. 2017, 24, 1–15. [Google Scholar] [CrossRef]
- Cash, D.W.; Clark, W.C.; Alcock, F.; Dickson, N.M.; Eckley, N.; Guston, D.H.; Jager, J.; Mitchell, R.B. Knowledge systems for sustainable development. Proc. Natl. Acad. Sci. USA 2003, 100, 8086–8091. [Google Scholar] [CrossRef] [PubMed]
- Cox, C.; Morse, W.C.; Anderson, C.; Marzen, L. Applying public participation geographic information systems to wildlife management. Hum. Dimens. Wildl. 2014, 19, 200–214. [Google Scholar] [CrossRef]
- Van Riper, C.J.; Kyle, G.T.; Sutton, S.G.; Barnes, M.; Sherrouse, B.C. Mapping outdoor recreationists’ perceived social values for ecosystem services at Hinchinbrook Island National Park, Australia. Appl. Geogr. 2012, 35, 164–173. [Google Scholar] [CrossRef]
- Arnberger, A.; Brandenburg, C. Past on-site experience, crowding perceptions, and use displacement of visitor groups to a peri-urban national park. Environ. Manag. 2007, 40, 34–45. [Google Scholar] [CrossRef] [PubMed]
- Gee, K.; Burkhard, B. Cultural ecosystem services in the context of offshore wind farming: A case study from the west coast of Schleswig-Holstein. Ecol. Complex. 2010, 7, 349–358. [Google Scholar] [CrossRef]
- Norton, L.R.; Inwood, H.; Crowe, A.; Baker, A. Trialling a method to quantify the “cultural services” of the English landscape using Countryside Survey data. Land Use Policy 2012, 29, 449–455. [Google Scholar] [CrossRef]
- Peschardt, K.K.; Stigsdotter, U.K. Associations between park characteristics and perceived restorativeness of small public urban green spaces. Landsc. Urban Plan. 2013, 112, 26–39. [Google Scholar] [CrossRef]
- Pleasant, M.M.; Gray, S.A.; Lepczyk, C.; Fernandes, A.; Hunter, N.; Ford, D. Managing cultural ecosystem services. Ecosyst. Serv. 2014, 8, 141–147. [Google Scholar] [CrossRef]
- Rönnbäck, P.; Kautsky, N.; Pihl, L.; Troell, M.; Söderqvist, T.; Wennhage, H. Ecosystem goods and services from Swedish coastal habitats: Identification, valuation, and implications of ecosystem shifts. Ambio 2007, 36, 534–544. [Google Scholar] [CrossRef]
- Barbier, E.B.; Hacker, S.D.; Kennedy, C.; Kock, E.W.; Stier, A.C.; Silliman, B.R. The value of estuarine and coastal ecosystem services. Ecol. Monogr. 2011, 81, 169–193. [Google Scholar] [CrossRef]
- Hauck, J.; Görg, C.; Varjopuro, R.; Ratamäki, O.; Maes, J.; Wittmer, H.; Jax, K. “Maps have an air of authority”: Potential benefits and challenges of ecosystem service maps at different levels of decision making. Ecosyst. Serv. 2013, 4, 25–32. [Google Scholar] [CrossRef]
© 2017 by the authors. Licensee MDPI, Basel, Switzerland. This article is an open access article distributed under the terms and conditions of the Creative Commons Attribution (CC BY) license (http://creativecommons.org/licenses/by/4.0/).