1. Introduction
Urban-rural fringes are peculiar places. Places where rural and urban dimensions (town and country) overlap and often collide, characterised by low-density residential settlements and the prevalence of single-function land-uses; with the places of everyday activities usually far off from one another, thus forcing people to greatly rely on automobiles for transportation. Every day, many people traverse those fringe areas for work and school, and the proximity of more urbanised areas, together with the multitude of commercial activities, services, and urban amenities located in the fringe, lead to intense flows of energy and matter. A multitude of transportation infrastructures usually traverse these environments, so they are often among the most inter-linked, traversed, and visited areas. However, in many cases, functions are separated by traffic-congested roads, creating distinctive, and often largely insurmountable spatial barriers. This brings about spatial and functional fragmentation and limits the possibilities for people to walk to the variety of activities localised in the fringe. Non-motorised transportation modes are generally less practiced because of the long, uncomfortable, unpleasant distances to travel—so the car reigns.
That notwithstanding, compared to a “purely” rural setting, an urban-rural fringe has a greater potential for being conducive to walking since the distances to some facilities are not excessive, while compared to denser urban fabric, a fringe area may offer pleasant ecological and cultural landscapes, promoting physically active lifestyle, also attractive for leisure and social intersections. Collins et al. [
1] observed that young people who live in urban fringe areas use them to stroll the countryside in their free time more than their peers do from rural and urban settings.
But, as we already mentioned, urban fringes are also often distinguished by inconsistent and poorly integrated mix of land uses and functions which leads to spatial and functional fragmentation and isolation. Such conditions require planners and policy makers to adopt specific strategies and measures in order to bring about a progressive integration and to promote synergies with the urban and peri-urban systems and functions. One such strategy and family of measures is to improve the walkability of places.
Scholars recognise walkability as an important factor for both the quality of urban space and people’s quality of life [
2,
3,
4]. It is a spatial requisite of the built environment which greatly contributes to its liveability and enables people to more effectively and fully use, and benefit from, urban opportunities. The possibility for the people with different motility [
5] (ages, gender, residential location, socio-economic status, personal abilities, etc.) to reach valuable destinations and places “on their own” and by foot is an important capability with respect to their “right to the city”. Such a possibility becomes particularly consequential for the people living in the spatially and socially marginalised urban-rural areas. That is why investigating factors of walkability in the fringe areas may offer useful insights on how to extend urban quality and liveability there. Moreover, in our exploration of how to best measure and assess the walkability of such peculiar built environments, we believe to offer a useful operational support for both planners and decision makers involved in addressing policies and strategies to help urban-rural fringe areas fulfil their considerable potential for a greater environmental sustainability.
Improving walkability entails, among other things, improving the spatial qualities of those living environments perceived as physically uncomfortable and emotionally unpleasant, especially for pedestrians. One set of improvements for this purpose regards spatial connectivity: the creation of continuous, “fluid” routes that give access to different destinations and are able to accommodate modes of mobility alternative to cars. Connected, well-maintained pedestrian networks allow people to safely and conveniently perform local activities (related to both urban and agricultural production), reach basic facilities (commercial, offices, schools, businesses, leisure, etc.) and collective spaces (green open spaces, public amenities), thus providing greater opportunities for social engagement and economic transactions.
With respect to environmental sustainability, an improved walkability can produce positive impacts on people’s behaviours and lifestyles. Cross-disciplinary studies [
6,
7] have shown that a walkable environment encourages healthier lifestyles, with benefits for both people and the environment: walking is an easy and inexpensive form of physical activity, with consequent health benefits for people of all ages. In addition, a habitual practice of walking and cycling contributes to reduce car trips and thereby decreases harmful gas emissions [
8].
Often, the problem with urban-rural fringes isn’t the lack of “connections”, the quantity and the variety of roads traversing the area. The problem, rather, is their quality, especially the poor pedestrian experience they offer due to a systematic deficit and neglect of spatial attributes and features of the built environment which encourage walking. Among the spatial factors affecting people’s choice to walk, in this work we focus on the role of road intersections and their hindering effect on pedestrian accessibility. Intersections, by their very nature, are places of a considerable potential for conflict among different street users. They are topological interruptions of a pathway which, depending on the geometric and operational characteristics, tangibly hamper the trip experience towards the destination, causing delays, exposing pedestrians to risks of traffic accidents, and generally interrupting the continuity of the walk. Intersections are among the key impedance factors of walkability.
In this work we propose a method for evaluating the impact intersections exercise on the pedestrian experience. The primary purpose of the method is to assist planners and policy makers by assessing the condition and the effect of intersections on walkability, and by suggesting the priority of interventions and measures of street improvements. In the next section (
Section 2) we present a review of the state of the art in methods and tools for evaluating intersections effects on walking. Then, in
Section 3 we go on to present the evaluation procedure for rating intersections with respect to walkability. In particular, we illustrate the procedures we conducted: (i) to identify intersection attributes most relevant for the walking experience; (ii) to specify the ELECTRE TRI [
9,
10] rating evaluation model; (iii) to apply the classification model to a case study. Next, in
Section 4, we present and illustrate the evaluation procedure for prioritising actions and interventions with respect to the functional and perceptive elements that foster the walkability and the walking experience across urban-rural fringes. The paper ends with a few conclusive remarks.
2. Intersections in Walkability Studies: State of the Art
In the last decade urban and transportation studies has been particularly productive in exploring how different features of the built environment influence the practice and the experience of walking (e.g., for a review see [
11,
12,
13,
14]). However, despite the continuity of paths being one of the main spatial conditions of people’s propensity to walk, these studies have predominantly concentrated their attention on the features of streets (segments) and of their surrounding environment [
15], while only minor attention has been given to intersections as hindering factors of walking. Most studies on the conduciveness of urban space to walking consider road intersections merely in terms of “density”, following the idea that a higher number of urban intersections per unit area improves pedestrian mobility by increasing optionality in route selection. The geometric, functional and operational characteristics of street intersections usually receive little mention, except for the rough typological features such as the number of streets converging at each node. This, for instance, is the case of the so called spatial connectivity indicators included in the most widely used methods for urban walkability evaluation [
16,
17], expressed as the number and type of nodes (commonly number of legs joining in each node) within large spatial units (square km, block, neighbourhood). As a result, the incorporation of spatial connectivity indicators into the composite indicators of walkability can lead to unreliable aggregate results, given that they combine detailed data on street segments, with rougher and less detailed description of intersections.
In our proposal, we hold that a more detailed micro-analysis of intersections is essential for the overall proper assessment of urban walkability, since often even some micro-spatial, functional and operational characteristics of crossings may be truly hindering, or conducive, of the practicability, comfort and pleasantness of a walking route to pedestrians.
The so called pedestrian level-of-service (PLOS) measures and assessments is a field of studies which deals more deeply with the factors of the built environment responsible of the hindering effect of road intersections on the pedestrian accessibility. The PLOS introduced by Fruin [
18] and later adopted by the Transportation Research Board’s Highway Capacity Manual [
19] is a measure of the operational quality of pedestrian facilities based on a fine-grained analysis of physical space and traffic flows. Researchers broadly employ this method to enrich the set of factors affecting pedestrian behaviour, both along sidewalks and at crossings. The concerns for traffic safety, the comfort requirements and the pedestrian delay are among the key performance indicators of walking impedance of crossings [
20]. More recent studies combine the physical and operational variables with the pedestrian’s perception of safety and comfort, measured by collecting data on pedestrians through direct observation or by means of surveys. Sisiopiku and Akin [
21] studied the pedestrian perceptions of various signalised and un-signalised intersections and suggested that the distance of the crosswalk to the desired destinations is the most influential factor in making a decision to cross. Basile et al. [
22] used the AHP method to assess the safety level of pedestrians at regulated and not regulated crossings: a composite indicator for crossing safety, together with some other specific indicators included in the assessment allowed to rank the crossings on the basis of their spatial characteristics and to suggest the priority of interventions by highlighting the issues that need to be addressed. The absence of pedestrian refuge islands, improper traffic light timing, on-street car parking obstructing the visibility, and accessibility problems due to obstacles along the pedestrian crossing, emerged as the most influential factors for pedestrian safety.
The majority of studies resort to field-calibrated statistical models based on multiple linear, logit, or probit models. Petritsch et al. [
23] provide a measure of the pedestrian’s perception on how well geometric and operational characteristics of an intersection meet the pedestrian’s needs. The formal relation suggested by the authors is based on three terms: (1) the perceived conflicts due to the turning traffic (right-turn-on-red vehicles and permitted-left turn); (2) the perceived exposure due to volume and speed of the perpendicular traffic and to the number of lanes to cross; and (3) the waiting time. By comparing objective data on the crossing areas (geometric, operational and traffic characteristics) with the pedestrian perception of safety and comfort, Muraleetharan et al. [
24] developed a LOS estimation method which ranks intersections based on their walkability performance. Factors such as space at corner, crossing facilities, turning vehicles, delay at signals, and pedestrian-bicycle interaction were identified as the most important factors affecting the pedestrian LOS at intersections. A similar model based on multiple linear regression analysis was proposed by Bian, Zhao and Jian [
25] for un-signalised intersections: in this case the conflicting traffic of motor vehicles and bicycles together with the crossing distance were found as the most relevant factors. Hubbard et al. [
26] used a binary logit model to study the factors which affect the safety of pedestrians when approaching intersections and recognised “traffic turning right on green” as the element with most influence, a result which was even stronger on the crosswalks located in suburban areas.
According to this set of studies, the barrier effect caused by both motorised and non-motorised traffic, and the crossing distance represent the two main obstacles perceived by pedestrians at intersections. A careful spatial configuration of the crossing areas, together with their equipment, are thus essential in order to encourage walking.
4. Evaluation of Road Intersections in the City of Alghero
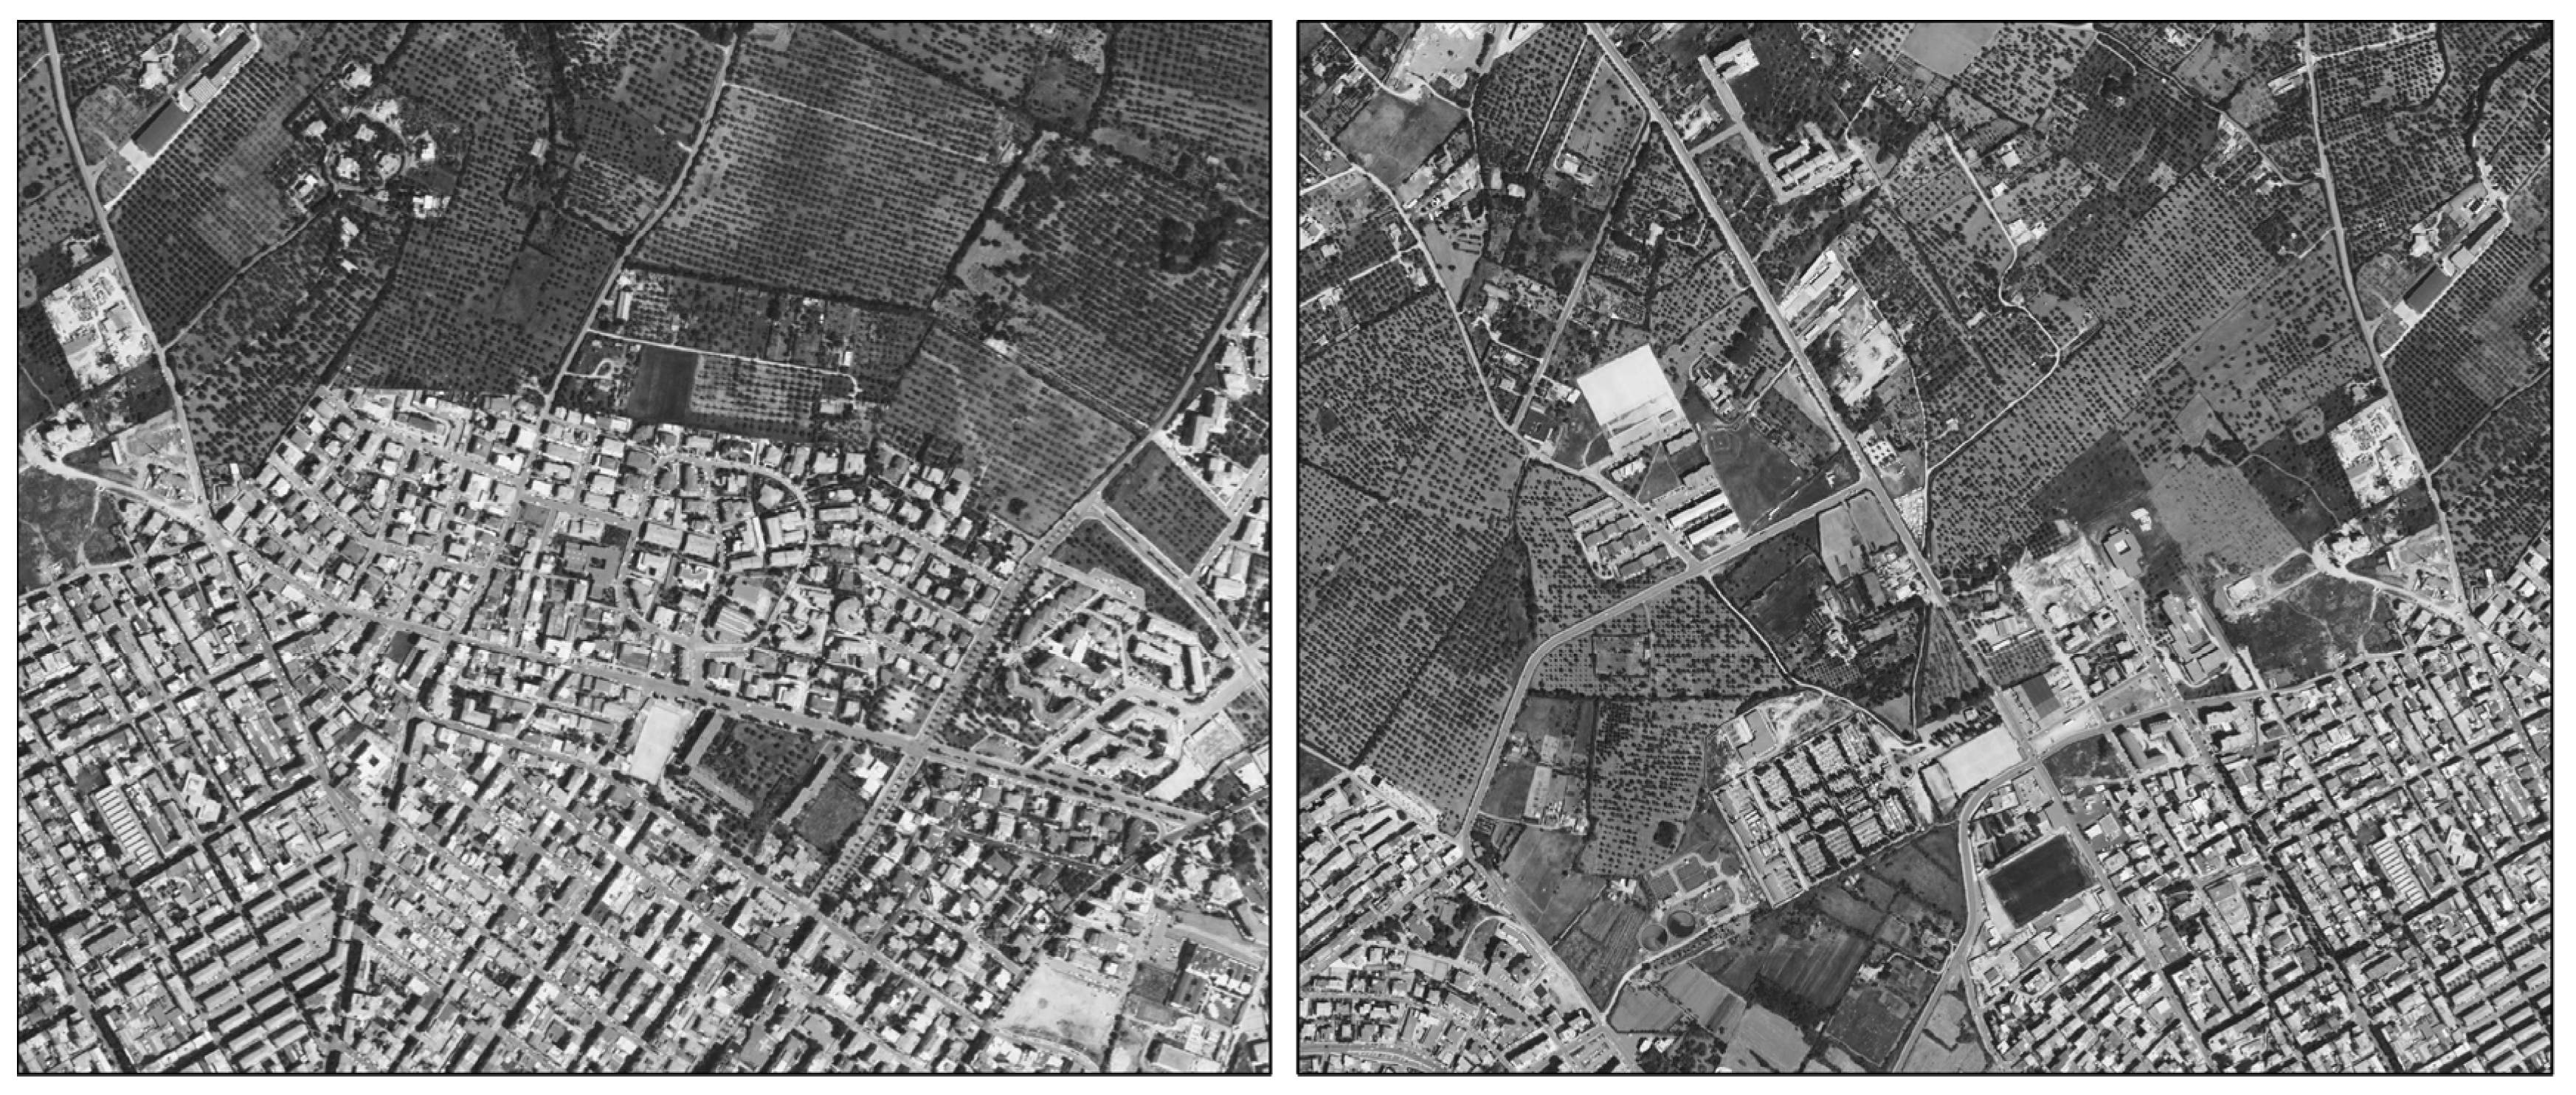
We have tested the procedure on the city of Alghero, a town of about 40,000 inhabitants in North-Western Sardinia in Italy. The city has a compact urban fabric along the coastline, with gradually lower density urban expansions in the surrounding rural area. In this context we identified the rural-urban fringe as the scattered settlements in between the compact city and the countryside. This built up area is a combination of various land-uses with rural and urban functions mingled together and often in conflict with each other. Thus, besides residential areas, the rural-urban fringe of Alghero holds commercial activities, agricultural lands, natural and recreational open areas, waste disposal sites, dismissed lands, transport infrastructures. The rural-urban fringe considered in this research does not have a rigid limit due to the variability of its components: in some parts the border marks a very clear shift between built up areas and open spaces just located on opposite sides, in others the shift is more gradual with the edge corresponding to a more extended low density strip of land with mixed urban uses alternated with vacant lands and portions of rural landscape.
Figure 2 shows the two mentioned configurations assumed by the urban-rural fringe of Alghero.
4.1. Experimental Design
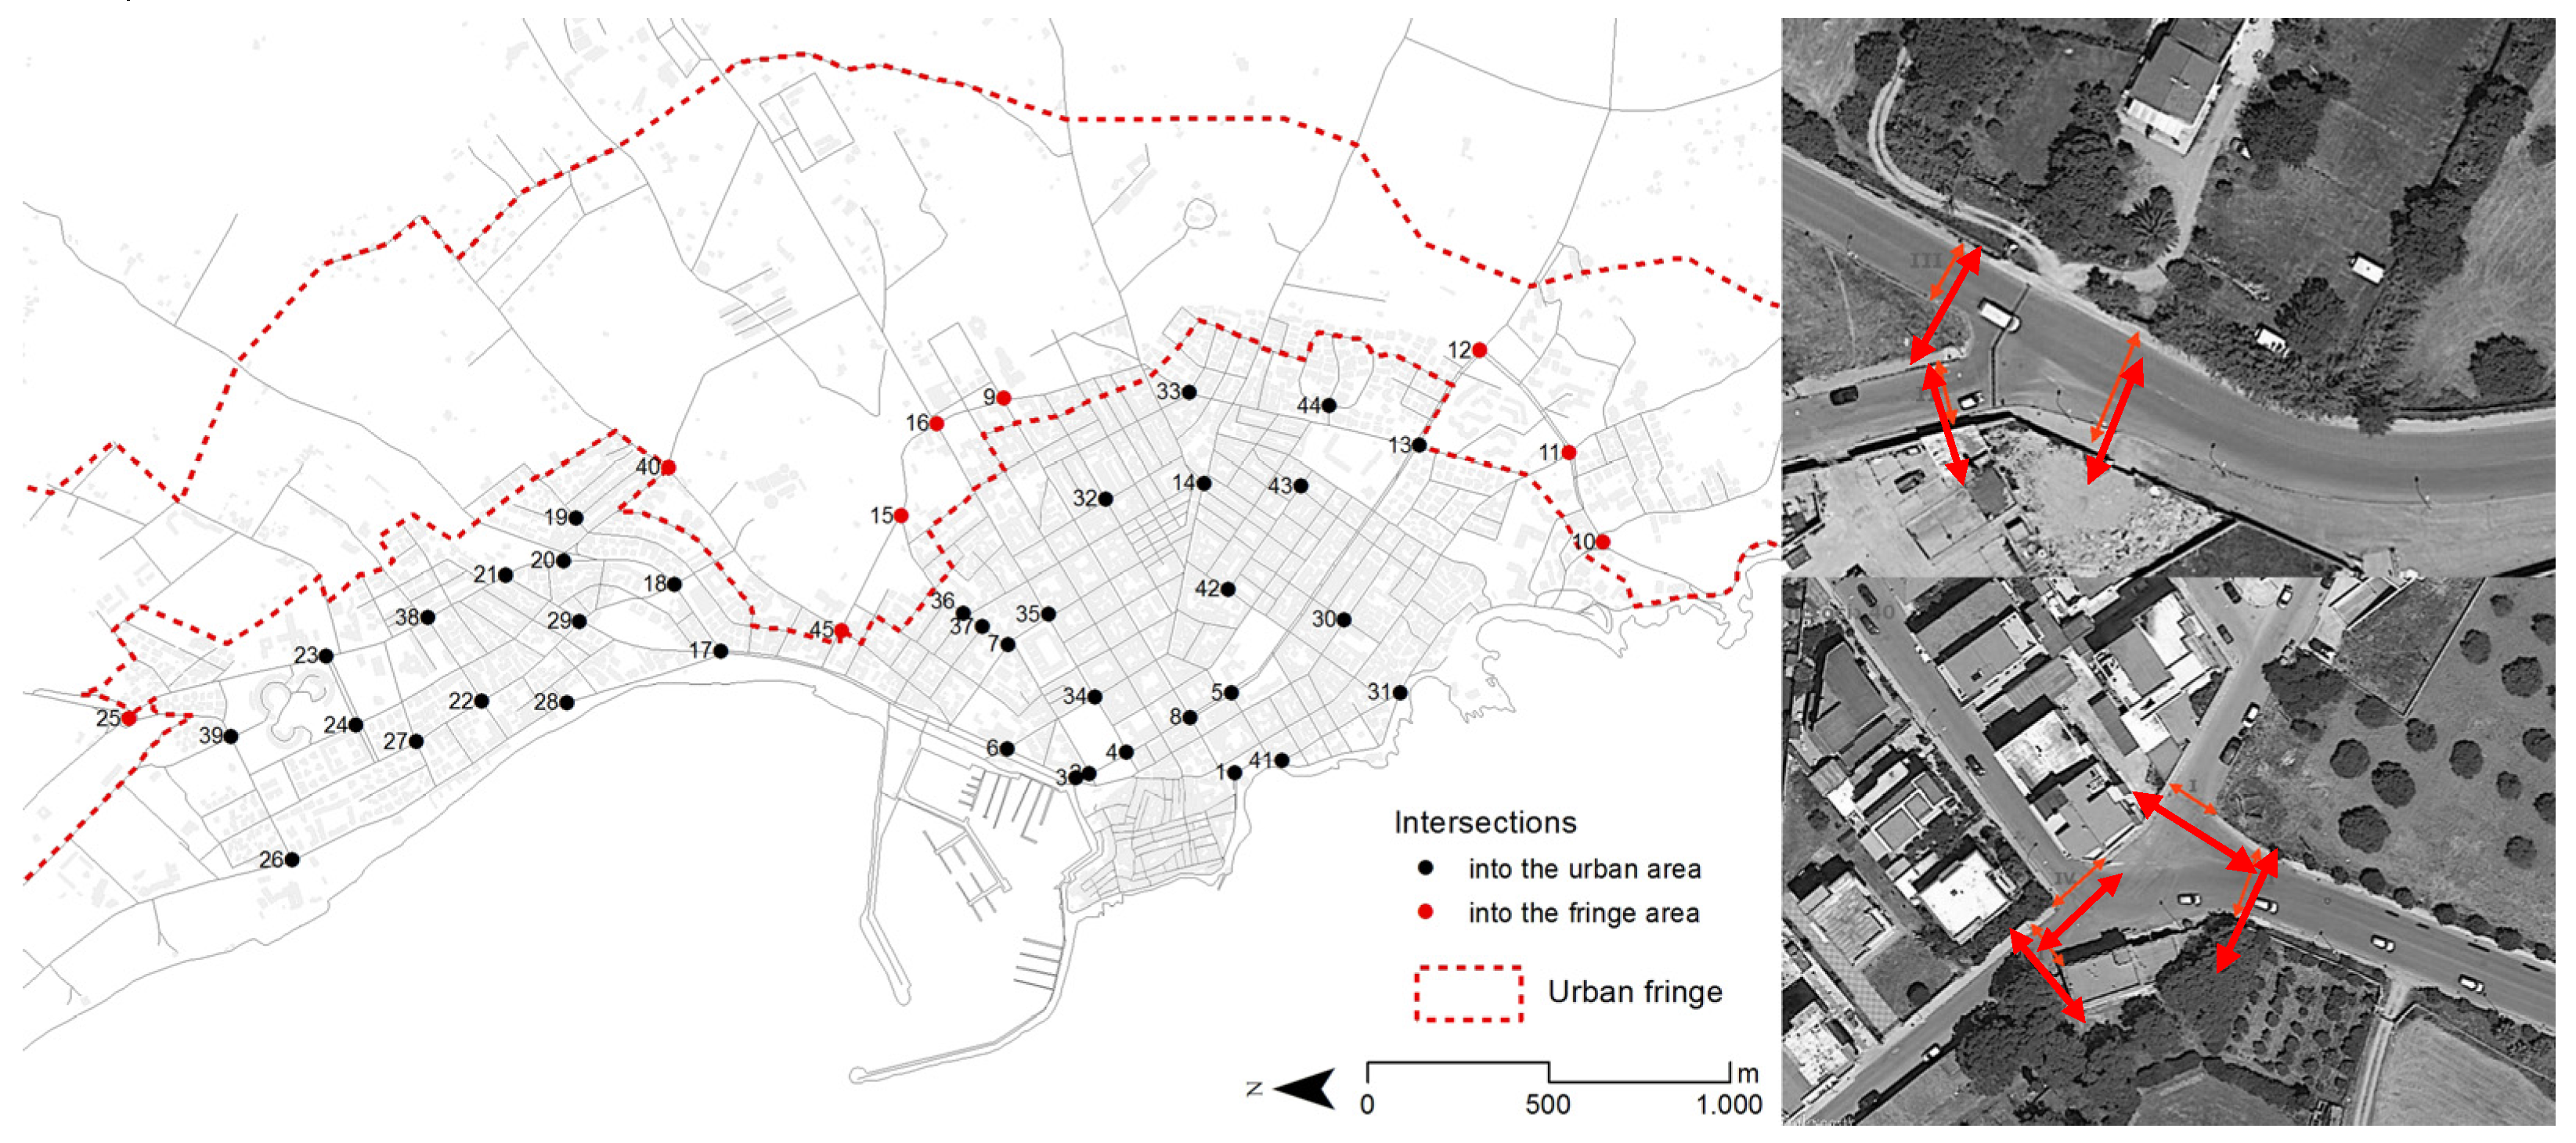
We conducted a contingent field survey on 180 crossings belonging to 45 intersections (
Figure 1). For practical purposes, we subdivided each intersection into individual lane crossings a pedestrian can walk in order to consider all the routing alternatives (see
Figure 3,
right). The intersections we selected were not only in the urban-rural fringe, but were evenly distributed over the town, in order to have a heterogeneous, more representative, sample of different conditions for the pedestrians. In our choice, we took into account the importance of intersections, based on their localisation with respect to urban facilities, and on the spatial and operational characteristics of the approaching road (functional classification, number of lanes, crossing distances, etc.).
With the support of a group of postgraduate students, we have conducted a field survey of all the crossings composing each intersection. Two sets of measures were collected for each crossing: (1) a detailed audit of 24 attributes summarised in
Table 1; and (2) a synthetic subjective judgment of the “cross-ability” based on the safety and comfort features perceived by pedestrians. Both sets of measures were collected twice, once in the morning and once in the evening, to capture possible variability in flows, traffic and environmental conditions at the intersections. To avoid possible biases in judgements, the surveyors were assigned to intersections in such a way to not have the same observer both conduct the detailed audit and provide the synthetic subjective judgement for the same intersection.
The audit was conducted by taking the direct measurements of each crossing’s physical characteristics and with the support of video recordings for the counting of vehicular and pedestrian volumes. Each individual crossing was then audited for the attributes reported in
Table 1. As one can observe, the crossing attributes refer: (1) to the spatial configuration of crosswalks (geometry and dimensions); (2) to the obstacles to visibility, with information on the position, size, consistency, permanence of the view-obstructing elements; and (3) to the practices of use (count of motorised and non-motorised flows, vehicle speeds and waiting time to cross).
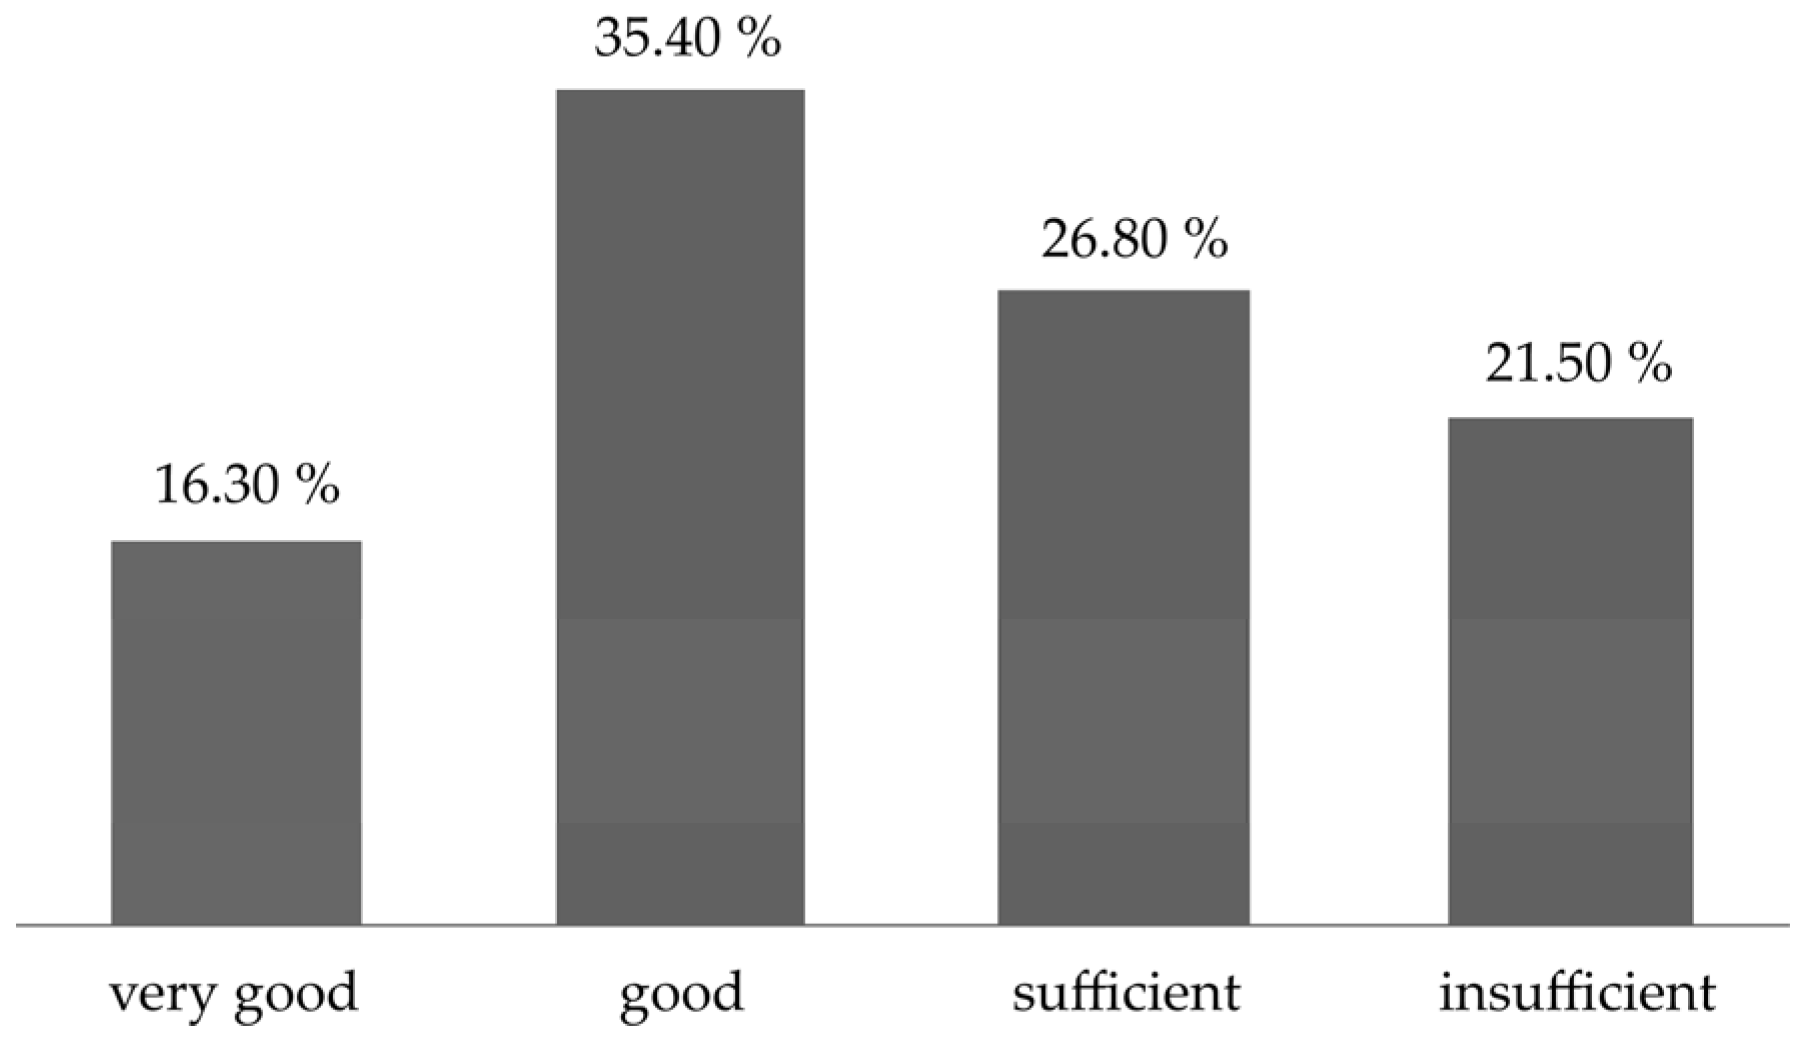
Regarding the synthetic subjective evaluation of the conduciveness to walk of crossings, the surveyors were asked to cross each crossing of the intersection and to express an overall evaluative judgment on their experience as pedestrians, on an ordinal 4-level qualitative scale {insufficient, sufficient, good, very good}. We report in
Table 2 the qualitative definition of each evaluation level defined on the basis of the spatial configuration and of the safety and comfort perceived while crossing.
4.2. Identification of Significant Attributes
A frequency analysis of the perceived judgment of crossings (
Figure 4) shows a prevalently positive perception of the quality of the crossings.
The audit data were processed to combine left and right side measures into a single variable (i.e., minimum sidewalk width between left and right side of the crosswalk as well as to reduce measurement errors by converting cardinal variables into ordinal ones. (i.e., vehicle speed measures were converted into 5 classes <5; 5–25; 25–40; 40–60; >60 km/h).Thereafter we attempt to fit several multiple linear regressions with the purpose of exploring the correlation between the perceived evaluations of pedestrian quality of crossing (dependent variable) and the attributes of crossings (independent variables) and thus to identify the attributes most influential for the conduciveness to walking of the intersections. Three different regression models are reported in
Table 3. The model A uses all the attributes and yields R-squared = 0.72. The model B (R-squared = 0.66), uses only the variable with
p-value < 0.01 in the model A: (X1) carriageway width; (X6) traffic light; (X7) couple of curb cut, (X9) crossing island; (X11) sidewalk extensions; (X12) crosswalks condition; (X14) position of crosswalks; (X20) bicycles flow rate, (X21) car flow rate and (X24) pedestrian flow rate. The sign of coefficients of each variable confirms the intuitive idea that attributes X1, X20 and X21 have a negative influence on the safety and comfort of crossing, while the other statistically significant variables influence it positively, considering that they consist of pedestrian-friendly equipment such as medians, sidewalk adjustments, control systems, etc. The relative importance of the independent variables investigated by mean of separate univariate linear regression for variables in the model B is reported in
Table 4. These results evidenced the strongest individual effect (R-squared > 0.10) on the variables X6, X7, X12 X14 and X24. These variables were then taken as the sole factors included in Model C (R-squared = 0.59).
4.3. Accuracy of the Models
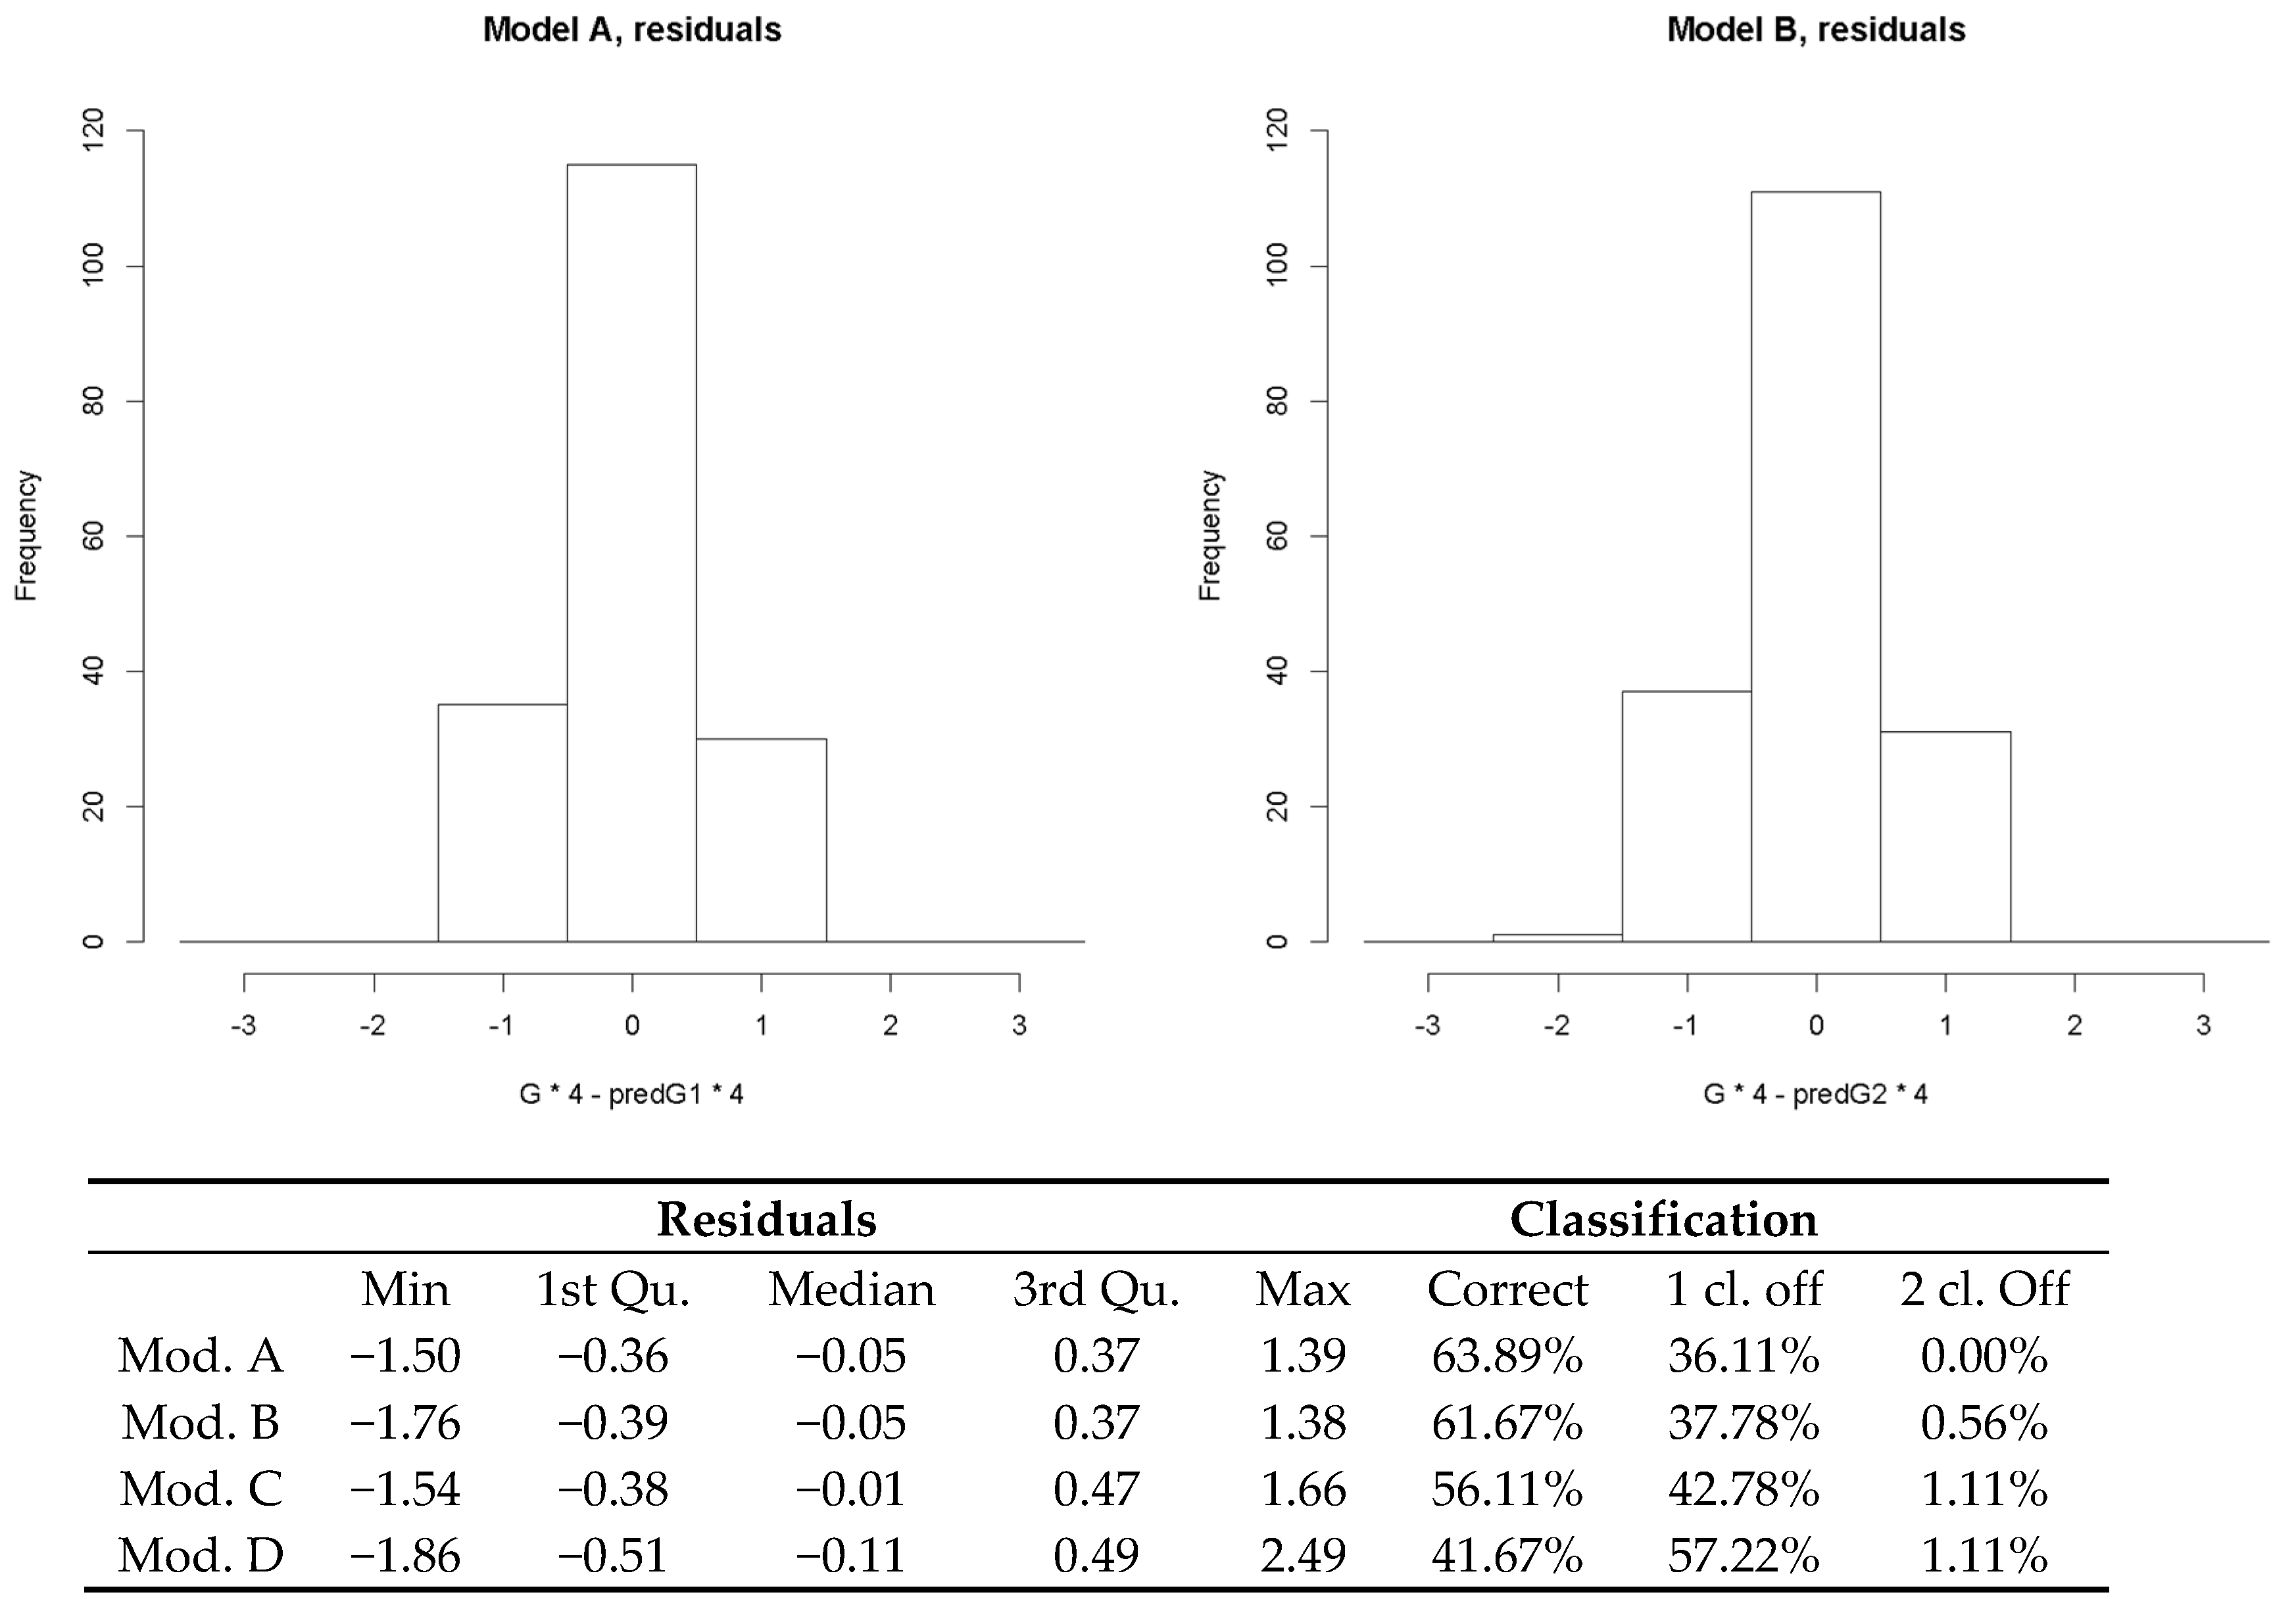
To assess the relative performance of the three models, in
Figure 5 we report the comparison between the predicted and the empirically observed values. Model A performs best (63.9% of crossing correctly classified, 36.1% classified one class off and none two classes off). Model B is altogether not too far off, with 99.5% of probability to classify crossing at most one class off. Given its relative greater simplicity, we use the factors from model B for the next stage in our evaluation procedure (for more detailed discussion of this regression analysis and the comparisons among the three models see [
27]).
4.4. Classification of Intersections
4.4.1. Evaluation Procedure
In the next phase of the procedure, we used ELECTRE TRI method to class intersections according to their conducive or hindering effect on pedestrian mobility, with the final objective being to identify critical factors of intersection design and operation which limit walking, and thus setting the stage for the subsequent prioritisation of intersections for street improvements.
Among the multiple criteria evaluation rating methods, ELECTRE TRI has several properties useful for our purposes: (i) it allows for the sorting of street intersections by priority based to their performance on the criteria; (ii) the criteria aggregation is flexible and permits the elicitation of the relative weights, clusters of coalitions (majority rule) and possible veto powers; (iii) it allows a prudential non-compensatory aggregation with limited loss of information during the consecutive stages of evaluation; (iv) it is a procedure that resembles individual models of judgment; and (v) the outcomes are reasonably simple to interpret and communicate.
For these reasons, ELECTRE TRI is a method widely used in urban and transportation planning and decision aiding. Among examples close to our case, we mention Fancello et al. [
28] (who resort to this method to support decision makers in the definition of intervention priorities to ensure safety conditions on roads), and Sousa et al. [
29] (who used ELECTRE TRI to assess sidewalks performance in the sense of their suitability for walking).
4.4.2. A Brief Reminder of the ELECTRE TRI Sorting Model
Electre Tri model is a method that assigns alternatives to pre-defined categories. Each alternative an is composed by a group of criteria h1, h2, …, hn that are assigned to one and only performance class.
Generally, when variables are continuous, in the ELECTRE TRI model each class C
k is defined by a limiting profile π
k on the criteria. Formally:
where P indicates the binary outranking relation meaning “has the same or higher priority than”.
Whereas, with discrete variables, such as in our case, each modality is directly assigned to one class.
According to the method, each alternative is assigned to one class C
k when there is a “significant coalition” of criteria for which “has the same or higher priority than” π
k (concordance principle) and there are no “significant opposition” against this proposition (discordance principle). Formally:
where:
- -
C(a, πk) means there is a majority of criteria supporting the proposition that a belongs to C.
- -
D(a, πk) means there is a strong opposition to the proposition that a belongs to C. This opposition is expressed by veto rules.
- -
hi, I = 1, ..., n are the criteria (the higher the value the higher the priority),
- -
wi are the coefficients of importance (weights) associated with each criterion,
- -
hi(x) is the evaluation of x on the criterion hi,
- -
H(x, y) is the set of criteria for which x has the same or higher evaluation than y, that is, for which hi(x) ≥ hi(y),
- -
γ is the majority threshold,
- -
vi is the veto threshold on criterion hi.
4.4.3. Evaluation Criteria
For the evaluation of the 45 road intersections in our sample, we defined three classes for the levels of walkability: C
1—“Conducive to walk”, C
2—“Supports walking”, C
3—“Obstacle to walk”. The three classes correspond to the qualitative requirements in
Table 5.
Each individual crossing within an intersection was evaluated on six criteria (h
1, h
2, …, h
6) defined on the basis of the spatial and operational attributes which resulted statistically significant in our previous regression model (Model B
Section 4.1). The six criteria reflect the performance of the crossing with regard to its conduciveness to walk derived from the respective attributes.
Table 6 and
Table 7 provide details on the six criteria. In particular,
Table 6 summarises the variables used in the ELECTRE TRI model, together with their respective modalities and weights. From the previous regression analysis, each variable has a coefficient (β) that can be interpreted as the influence of the variable on the quality level of crossings. Based on this consideration, we used the β coefficient values (normalised such that ∑w = 1) as the weight of each variable in the ELECTRE TRI procedure.
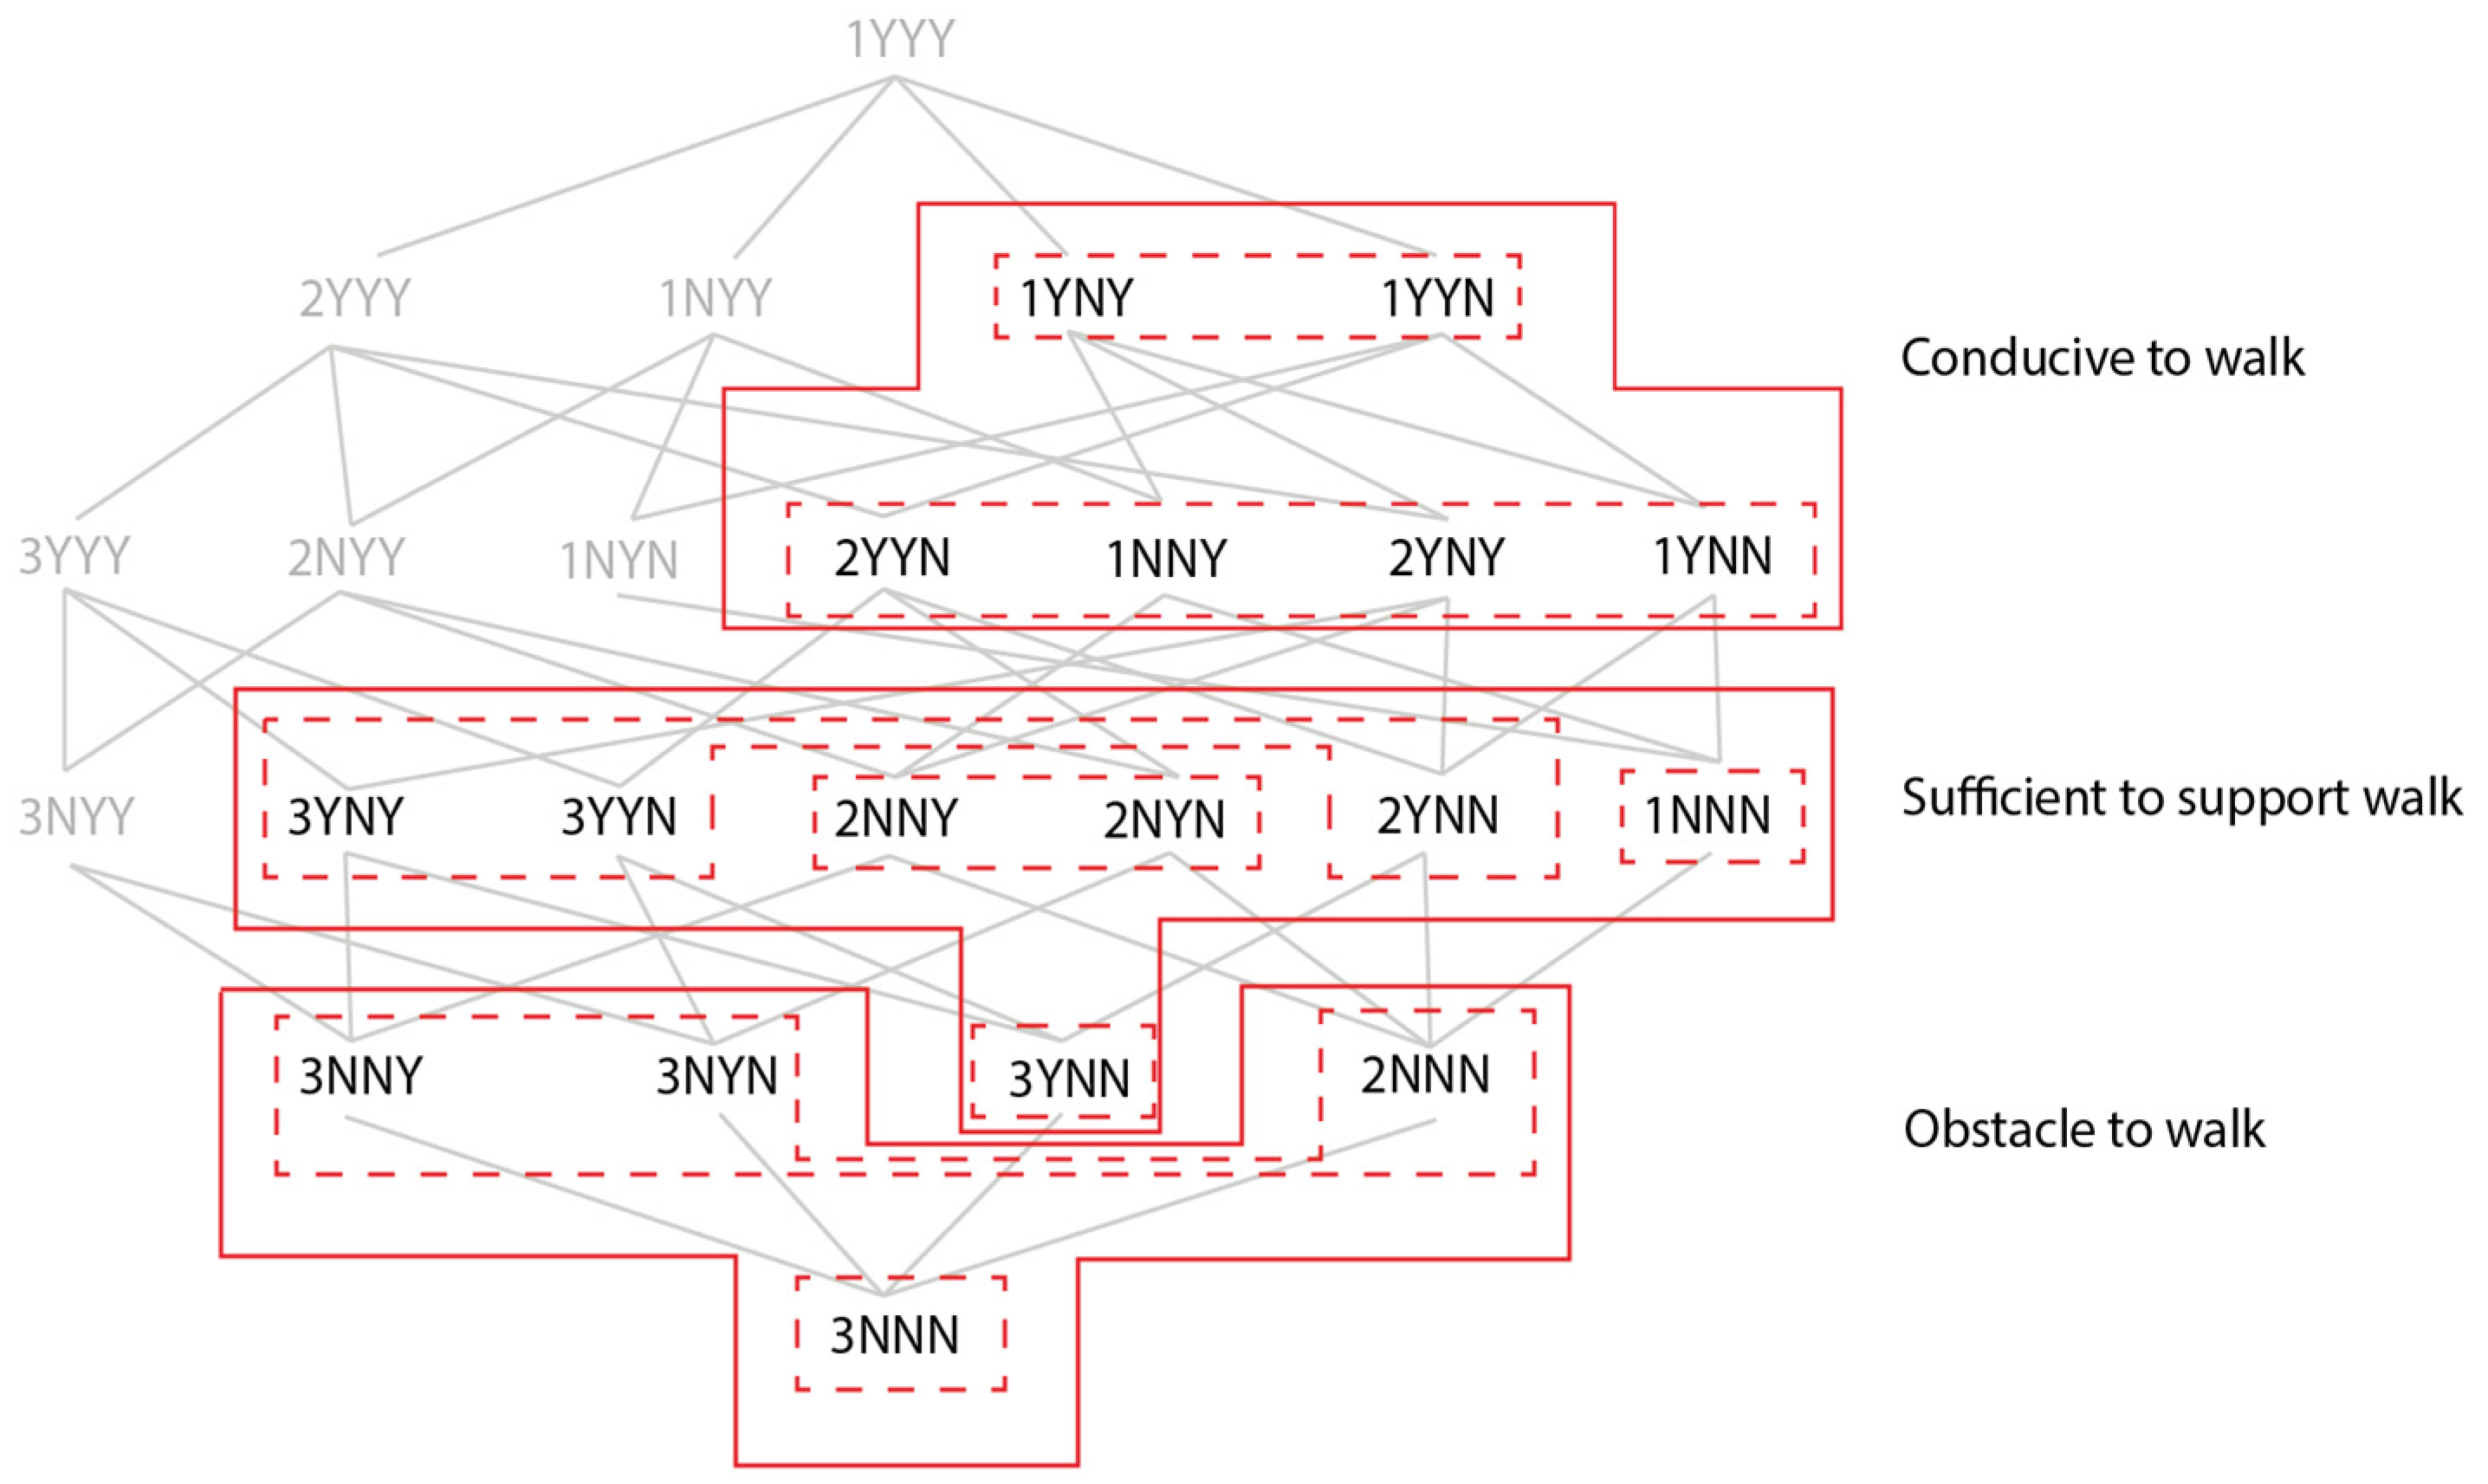
Because of the mutual relationships between variables, we decided to aggregate some variables in several super-indicators, following the inclusion relation and the Hasse diagram procedure [
30] (the diagram in
Figure 6 represents all the possible combinations of variables which compose the super-indicator and the relative dominance relation).
To be more precise, we define two groups of super-indicators: one is composed of the variables (X1) carriageway width (converted into number of lanes), (X6) presence of traffic light, (X9) presence of the crossing island and (X11) sidewalk extension; the second group is composed of the variables (X12) zebra crossing condition and (X14) zebra crossing position. Each possible alternative to be classified is represented by a sequence of four values, one for each variable. For example, the alternative 3YNY indicates an intersection with carriageway width ≥9 m (means 3 or more lanes), with traffic light, no crossing island, with sidewalk extension. Following the same relations of inclusion represented in the diagram in
Figure 6 we assigned the possible combinations of variables X1, X6, X9, and X11 to three classes of pedestrian quality of crossings. As one can expect, there is a non-linear relationship between the variables included in a group. For instance, the carriageway width is not so important if the traffic light is present. Also, the sidewalk extension and the crossing island are not necessary if the number of lanes is less than two.
According to Hasse’s procedure, the variables are aggregated into equivalence and indifference classes. With reference to
Figure 6, equivalent combination of variables form groups (dashed line shapes); some combination of groups are indifferent (continuous line shapes). As an example, the two combinations 1YNY and 1YYN are equivalent and form the first group (class of equivalence, dashed line shapes); in the same way, the combinations 2YYN, 1NNY, 2YNY and 1YNN are equivalent and form the second group. For decision makers committed in the assignment of a super-indicator to a class, the two groups are indifferent (class of indifference, continuous line shapes).
Moreover,
Figure 6 shows that each possible combination is associated with one and only one class (e.g., 1YNY is indifferent to 2YNY or to 1YNN and are all classified as C
1) and that super-indicators in C
1 “conducive to walk” are preferred to those in C
2 “support walk”, which in turn are preferred to super-indicators in C
3 “obstacle to walk”.
In other words, the combinations of variables that are “indifferent to” or “at least as good as” are assigned to the same class, even though some of them can be “objectively” better than the others (e.g., “1YNY ≽ 2YNY” means that the second alternative is considered at least as good as the first one, even though the first one is better. Thus, both are classified in C1).
In the case of “better than”, the alternatives belong to different classes (e.g., “1YNN ≻ 3YNY” means that the first alternative is better than the second one, thus they are assigned to different classes).
In the same way, the super-indicator composed of zebra crossing condition and position belongs to C1 “conducive to walk” if zebra crossing is in-line and well-defined; it is classified as C2 “supports walk” if the zebra crossing is lateral and at least faded or if it is in-line and at least faded; and finally it is assigned to C3 “obstacle to walk” if there is no zebra crossing.
The weight of each super-indicator is defined by the sum of the normalised weights of each variable composing the super-indicator itself (wSi = ∑wi).
The ELECTRE TRI model therefore runs on six criteria, two of which are super-indicators.
Table 7 summarises the six criteria, their relative weights and the conditions of inclusion in the three classes.
In order to classify crossings with respect to the specific coalitions of indicators, we set the majority threshold to 51%. In this way the class is attributed only by a coalition of the first (super)indicator (X1 + X6 + X9 + X11) with at least one of the others (excluding X7), or with the combination of the four indicators (X12 + X14), X20, X24 and X21. Based on this outcome of the classification, the indicator X7 (couple of curb cut) does not influence the decision process. This result confirms the low weight reached by the variable in the statistical model (β = 0.08 in model B).
4.4.4. Results and Accuracy of the Classification Model
According to our classification model, we obtained 5 crossings in the first class C1 “Conducive to walk”, 104 in the second C2 “Support walk” and 71 in the last class C3 “Obstacle to walk”. Among the 180 crossings analysed, 43 (24%) of them are located within the rural-urban fringe areas, 27 of which fall in class C3, and the remaining 16 in the second class C2. None was classified as fully conducive to walk (class C1).
In order to test if our rating model is capable to express classifications in concordance with the perceived judgments of the crossing quality expressed by pedestrians, we compared the latter with the outputs of the ELECTRE TRI model. For this purpose, we assumed that the crossings judged as “insufficient” by the surveyors represent an “obstacle to walking” (C
3), those judged “sufficient” and “good” “support walking” (C
2), and those evaluated “very good” correspond to crossings “conducive to walk” (C
1). The confusion matrix in
Table 8 is used for the comparison.
The overall concordance (i.e., the ratio between the diagonal and all the classification) indicates the precision of the ELECTRE TRI model in the classification of the alternatives (59%). The producer’s concordance (sensitivity) is the ratio between the number of correct classifications in X and the number of actual values belonging to X. It reflects the capacity of the model to predict the true positives. In our case, the results show that the predicted crossings in C3 and C2 are most of the time classified in concordance with the judgment classes, while alternatives in C1 have a 15% probability to be correctly classified. Looking at the data, the results are, however, acceptable. Indeed, what happens is that the “conducive to walk” alternatives are frequently classified in “supports walk”, underestimating the effective quality of the crossing to promote walking, in our case this assumption is better than an overestimation.
The user’s concordance (precision) is the ratio between the number of classification in X correspondent in both the model and the empirical observation and the total number of alternatives predicted in X (it is possible that some crossing does not belong to X according to pedestrian judgements). This ratio shows the capacity of the model to avoid wrong classifications. In this case, we obtain good results for the classes C1 and C2, but lower precision for the class C3 (39%).These results mean that the model (about class C3) can be interpreted as a “pessimistic” model, that adopts a precautionary principle. That is, in case of uncertainty, it classifies the alternative in the lowest class. Among the 71 crossing classified by the model as obstacles for walking, only 38 crossings (39%) have been considered hindering by interviewees, while the remaining 43 are considered non hindering.
To better understand to what extent the ELECTRE TRI model performs well (in terms of classification in concordance with the judgements of pedestrians) an additional test consists in the comparison with a random classification method. A random classifier, based on the frequency of revealed preferences, randomly assigns classes with probability P(C1) = 18.3%, P(C2) = 63.4%, and P(C3) = 18.3% respectively. So the overall concordance of the random classifier is 33%, slightly more than half that of our ELECTRE TRI model.
4.5. Prioritizing Intersections
The final objective of our evaluation procedure is to outline an operational method to orient policy makers in recognition of the needs, and in the prioritisation of interventions in urban-rural fringe areas to make them more pedestrian-friendly.
With respect to this objective, the above-described classification alone is not sufficient to establish an order of priority among possible interventions of improvement. In fact, it is based exclusively on the variables that ultimately concern the spatial and operational characteristics of the crossings areas, and do not take into account any information about their importance within their geographical setting, such as the location of the crossing with respect to the overall urban fabric or the surrounding land uses.
We thus employ a second classification procedure that considers the urban quality of the context in which the intersections are located, and its potentials as a walkable space. In particular, we are interested in the predisposition of the urban setting to support the development of spatial and territorial relationships, through the improvement of walkability as an enabling spatial requirement.
The ability of the context to nurture spatial and social links with the surrounding areas is, in fact, influenced by the way the built environment is organised and the mix of functions it offers. A walkable-friendly environment includes areas which are traversable, physically-enticing and safe [
31]. This capacity of urban space becomes fundamental for marginal areas like urban-rural fringes, whose improvement of liveability strongly depends on the quality of space as well as on the possibility of effective integration into the overall urban organisation.
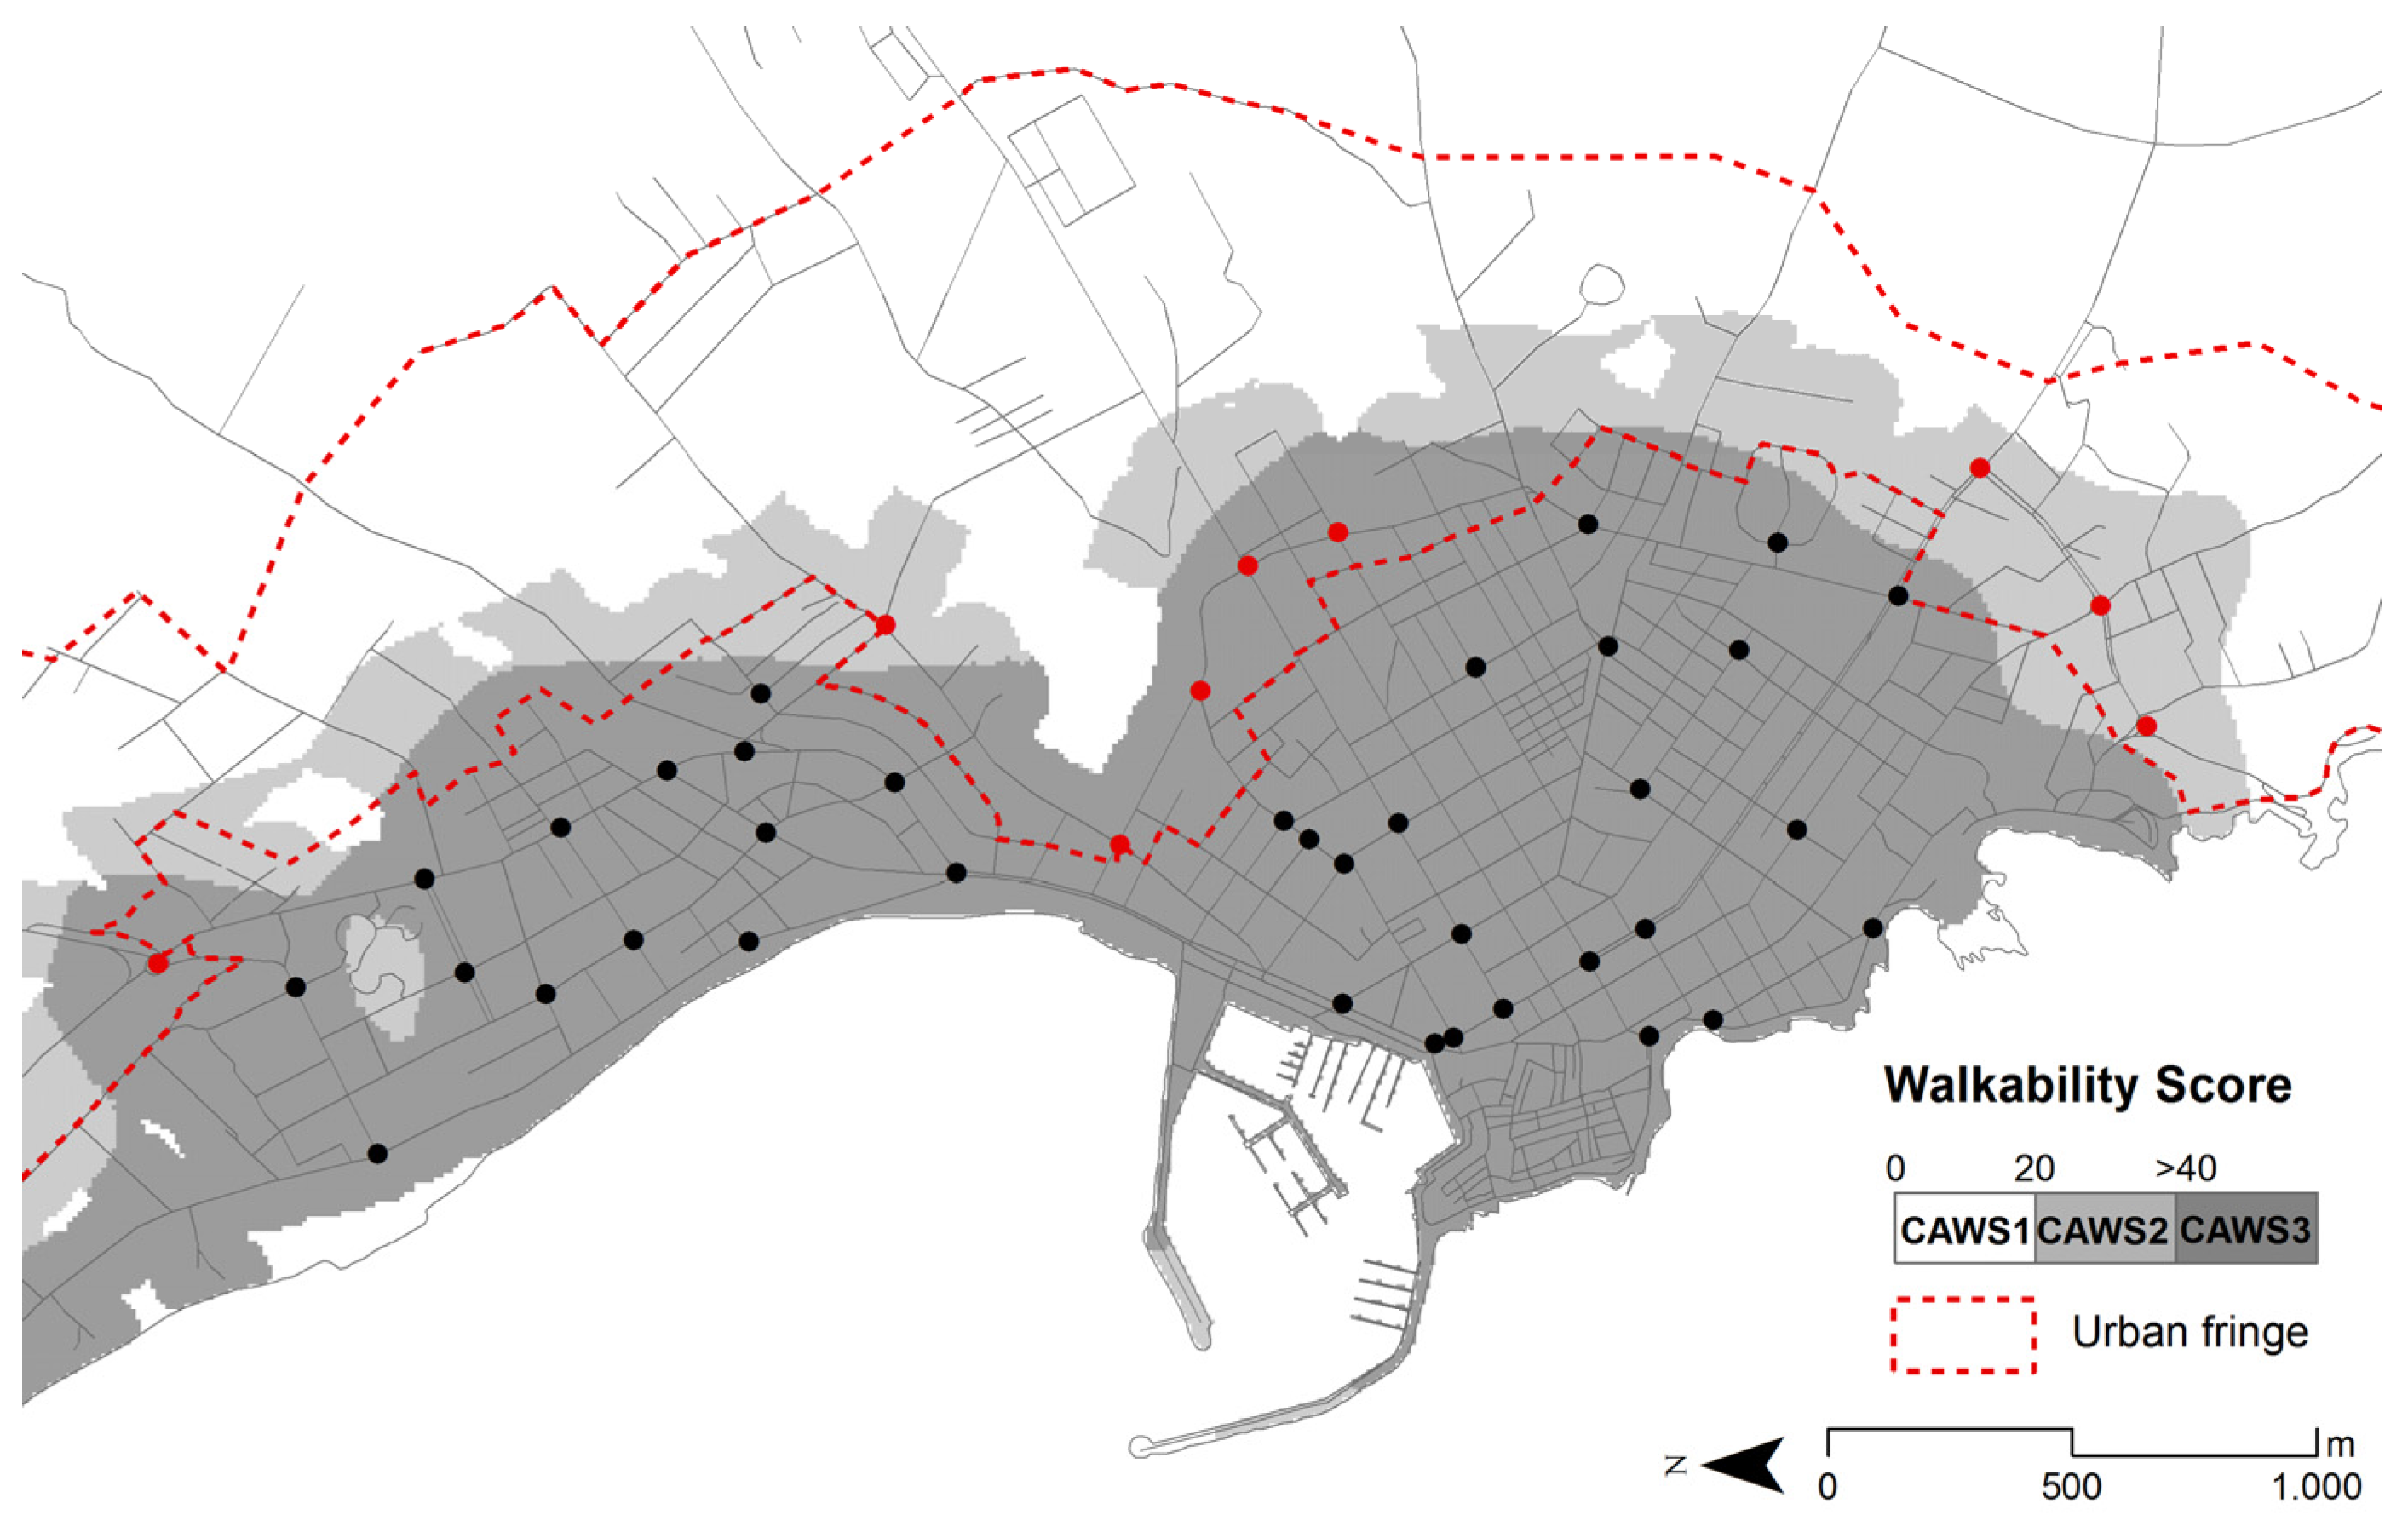
To capture this quality of urban space, we resort to the “capability-wise walkability score” (CAWS) evaluation method [
32] which is an analytical measure of the mutual relations between the urban organisation and the people’s attitudes in space. More specifically, it is the result of an evaluation method founded on the capability approach, which assesses the quality of the urban environment and its capacity to embrace and promote pedestrian mobility.
From an operational point of view, CAWS was designed to bring together three distinct features into a single indicator: (1) the number and variety of destinations (i.e., urban opportunities) reachable by foot from a place; (2) their distances; and (3) the quality of urban environment and pedestrian routes leading to these destinations. Thus, it takes into account both the opportunity sets distributed in space, as well as the characteristics of urban environment which affect walking and are relevant for the relationship people may entertain with that urban space. Rather than indicating how much a specific place is in itself walkable given its intrinsic characteristics (as the majority of walkability evaluation methods and indicators), CAWS reflects where to and how a person can walk starting from that place; in other words, not how walkable the place is, but rather what is the walkability it is endowed with. According to these assumptions, CAWS assigns a walkability score to each point in space and thus maps the capability-wise walkability.
Figure 7 shows the CAWS walkability map obtained for the town of Alghero with intersections and the limit of the rural-urban fringe. Three classes of urban walkability are defined based on walkability scores: CAWS1 for walkability score lower than 20; CAWS2 for values included between 20 and 40 and CAWS3 for values bigger than 40.
To establish an order of priority among crossings, in terms of their need for improvements, we considered the following two priority criteria:
- -
spatial and operational performance class, based on the previous rating classification (
Section 4): each crossing is assigned to one of the three classes C
1, C
2, C
3;
- -
walkability of the site: each crossing is assigned to one of the three classes (CAWS1, CAWS2 or CAWS3) based on the CAWS score of the area in which it is located.
Considering the preferences of a hypothetical decision maker, and assigning a numeric value to each crossing according to the classes and equivalent to their scale order (Borda rule with CAWS1 = 1, CAWS2 = 2 or CAWS3 = 3), we finally arrive at a priority rating. For example, if we assume that for a given decision maker the intersection performance has the priority (weight 60%) over site’s walkability (40%), the resulting rating (with the percentage of crossings included in each class) would be that shown in
Table 9.
The crossings classified as obstacles for their spatial and operational characteristics (class C3) and located in areas scored CAWS3 or CAWS2 deserve the highest attention (order of priority 1 and 2) because of their important role in facilitating the integration of the fringe with the rest of the city. Crossings with a strong hindering effect (C3) located in areas with low level of urban walkability (CAWS1) receive an intermediate level of priority (4/9), while those that support walking (C2) and are located in areas with high level of urban walkability obtain low priority level (priority 3).
With regard to the intersections located within the urban-rural fringe in our Alghero case study, the majority have obtained high priority, as shown in
Table 10.
5. Conclusions
Among the attributes influencing people’s decision to walk, the walkability of intersections represent an important factor. However, much of the literature on walkability is generally focused on the spatial features of uninterrupted sidewalks. Much less attention has been dedicated to intersections, although they are constitutive components of the road network which necessarily influence walking behaviour and the perception of safety, comfort and pleasantness of a walking route.
In this paper, we have proposed an assessment procedure to explore and evaluate the hindering effect of street intersections on pedestrian accessibility, and to guide the prioritisation of strategies and actions for enhancing the walkability in urban-rural fringe areas. This capacity of the urban space to foster walking becomes fundamental in the urban-rural fringes of cities; peripheral areas with rural and urban functions mingled together and often in conflict with each other. Here the provision of spatial conditions informed by principles of sustainability, such as the promotion of walkability and an active lifestyle, represent an effective opportunity.
The application of the method to 45 intersections in the city of Alghero led us to recognise the usefulness of including in assessment methods of urban walkability both objective information and pedestrian preferences on physical and functional attributes of crossing areas and their surroundings. The procedure we propose is an operational method planners may use for advancing their project-oriented understanding of the city and for planning interventions aimed at improving the liveability of urban space by enhancing the safety, comfort, usefulness and attraction of the space for walking.


