Public Response to the Regulation Policy of Urban Household Waste: Evidence from a Survey of Jiangsu Province in China


School of Management, China University of Mining and Technology, Da Xue Road 1, Xuzhou 221116, China
*
Authors to whom correspondence should be addressed.
†
These authors contributed equally to this work.
Sustainability 2017, 9(6), 1034; https://doi.org/10.3390/su9061034
Submission received: 6 May 2017
/
Revised: 10 June 2017
/
Accepted: 12 June 2017
/
Published: 15 June 2017
Abstract
:The attitudes and response of “policy receivers” should be taken into more consideration when governments make regulation policy. This paper discusses the public’s degree of understanding, support willingness, implement willingness, and influence willingness to the policy, as well as the mutually responding scenario by using the quadratic response surface regression analysis from the perspective of “policy receivers”. The statistics of 951 segments of valid sample data and the regression analysis suggest that: (1) 42.51% of individuals have poor understanding with regard to the command and control policy of household waste, which indicates a deficiency in the publicity effectiveness of the policy; (2) the public’s understanding, support, implement, and influence of the policy present an inverted U shape change, indicating a low degree of understanding and influence willingness, and high support willingness and implement willingness; (3) overall, only support willingness can significantly affect the public’s willingness to implement the policy, while both the degree of understanding and support willingness can positively predict influence willingness significantly; (4) the consistency between the degree of understanding and support willingness has an incremental effect on implement willingness and influence willingness; and (5) the implement level to the charge collection policy increases when the degree of understanding exceeds support willingness by a certain value.
1. Introduction
With the rapid development of economy, various economic and social problems spring out under pressure of the shortage of energy supply and endless demand, which has arisen wide concern among the public. In such circumstances, the concept of circular economy has been proposed, which aims to replace the traditional linear economic growth model relying on resource and energy consumption with the circular and ecological economic model depending on ecologic resources [1]. In this process, as a kind of waste being consumed, urban household waste (also known as municipal solid waste, MSW) is the main pollutant of urban environment and also the resource and energy needed to be developed again [2]. Currently, two aspects can mainly show how to turn MSW into resource and energy again: one is to transform waste to energy by incineration and bio-degradation [3,4], and the other is to recycle waste and put them into use again. To turn MSW into treasure, promote the reducing, reusing, recycling, and energy regeneration of MSW, and realize the sustainable development of resource and energy, governments formulated a series of policies to regulate MSW, which have become a major tool for MSW management.
Since 1986, the Chinese Government promulgated a series of basic laws including Cleaner Production Promotion Law of the People’s Republic of China (2003), Solid Waste Pollution Prevention and Control Law of the People’s Republic of China (2005), Circular Economy Promotion Law of the People’s Republic of China (2008), etc. Moreover, the departmental rules and regulations represented by the Technical Standard for Sanitary Landfill of Municipal Solid Waste (2004), Measures for the Administration of Renewable Resource Recovery (2006), and Measures for the Management of Municipal Solid Waste (2007) were formulated. However, no noticeable effect was observed despite several domestic waste control policies formulated by the government, and the waste utilization as energy and resources stay in the long slump [5].
Through literature review, we can note that the garbage classification system program and the formulation of the existing urban life garbage regulation policies mainly draw on the experience of waste management from developed countries [6,7]. “The formulation side” (the government) determines the promulgation and implementation of the policy, and the people-centeredness or effectiveness of the policy is seldom considered from the perspective of “policy receivers” (the public). These policies aim to save resources and reduce pollution to establish a healthy and harmonious living environment. During policy formulation and implementation, the attitude and response of the policy implementer are often ignored, deviating from the realistic trend of cooperative governance of MSW by multi-agent including the public, enterprises, and the government [8,9]. Furthermore, the adoption of an improper policy system to constrain individual behaviors is likely to result in reappearance of negative behaviors after the system is void [10]. Therefore, it is necessary to discuss the attitudes and responses of the policy implementers (the public) to the MSW regulation policy.
Based on the model of cognition, emotion, and intention of attitude [11], this study constructs four-dimensional structures of public attitudes and responses to the MSW regulation policy. Current urban residents’ attitudes and responses to the regulation policy are discussed from four perspectives of degree of understanding, support willingness, implementation willingness, and influence willingness. Specifically, the degree of understanding refers to the individual awareness and cognition level to the policy content. Support willingness indicates the degree to which individuals identify with a policy. Implement willingness indicates the degree of compliance of individuals to this policy, and influence willingness denotes the degree to which individuals are willing to promote and drive others to follow the policy.
The province is the highest administrative unit in China so it is logical that it should be the main focus of waste management practices. Jiangsu Province is one of the fastest developing provinces in China. As the “Demonstration Area of Breaking Resource and Environment Constraints in China”, it is proposed to construct a low-carbon, green, and sustainable strategic framework as early as 2010 [12]. Moreover, Jiangsu is located in the east of China and has highly developed transportation network and diversified population framework of urban residents. Based on the above, the urban residents of Jiangsu Province were selected for the investigation to obtain the attitudes and responses of “policy receivers” to the policy. The relationship and influence mechanism of understanding level, support willingness, implement willingness, and influence willingness are further analyzed to provide reference for improving the effectiveness of the governmental policy, and promoting the regeneration and sustainable development of resource and energy.
2. Literature Review
2.1. Theoretical Research on Public Response
In recent years, China has frequently formulated MSW regulation policy and constructed the policy system of garbage classification and recycling in aspects of standards, charge, control, and public supervision. The breadth and intensity of regulation are constantly increased. However, compared with developing countries, the garbage classification and recycling status are relatively backward in China, which might be related to the timeliness of the policy to a certain extent [13]. However, the effectiveness of the policy is the key factor. To this end, many scholars have carried out in-depth theoretical and empirical tests on specific policies. Many factors, such as technology, environment and health, economy and finance, society, and organization, were used to evaluate the regulation policy of domestic waste and other environmental policies [14,15,16]. However, these evaluations have not analyzed the feasibility and effectiveness of the policies or considered the people-centeredness and effectiveness of the policies from the public perspective.
Wang (2007) [17] analyzed the regulation effects not only from the perspective of organization response, but also from the level of family satisfaction to the policies. He found that 16.5% of residents do not agree with the garbage charge policy, which influenced the executive effects of the policy. This is consistent with the view that environmental attitudes can predict the performance of environmental behavior [18,19]. The public’s attitude towards the domestic garbage regulation policy also determines whether they will participate in garbage collection and recycling. Attitude also includes the dimensions of cognition, emotion, and behavior intention [11]. Wang (2007) [17] analyzed the responses of urban residents to the “dumping charges” garbage regulation policy based on the “recognition degree” (partial to emotion), which cannot comprehensively interpret the public’s attitude towards the policy.
First, the public will have a sense of identity with the regulation policy of the domestic waste because of endogenous factors (such as healthy living awareness, environmental responsibility, and civic awareness) [20,21,22]. However, if it is not established based on a full understanding of the policy and a clear judgment of the interest relationship with them, this sense of identity will not be sustainable [23]. In other words, the public’s sense of identity formed based on cognition to the policy will be more stable and lasting. Second, in the public’s attitude and response to policies, the intention to follow and implement the policy is the most direct embodiment of the policy effectiveness. Long-term and stable behavior intention is influenced by various factors, such as an awareness of social responsibility, economic cost, living habits, degree of trust, herd mentality, and comfort preference [24,25].
The implement willingness will not be ignored, but the policy implementers should also set an example and spread the policy ideas to others with a “missionary” attitude to drive others to implement the policy system. The Theory of Planned Behavior also indicates that individual behaviors are influenced by subjective norms. If people with important status believe that it is important to conduct an act, the public is more likely to comply with their wishes for the act [26]. It follows that, in addition to the cognition degree, recognition degree, and implement willingness, the measurement of the public’s attitude and response to the policy should also pay attention to the interaction effects between individuals, namely, “the influence willingness”. Although scholars have not explicitly proposed the concept of “policy-influence willingness”, in research on environmental behaviors, they utilize “persuasive action” to express individuals’ drive to other people to participate in environmental protection [27]. To summarize, this research believes that individual attitudes and responses to the regulation policy of MSW are the comprehensive embodiment of recognition, cognition, implement willingness, and influence willingness.
The research theory related to behavior indicates that cognition is the foundation of behavior intention [28,29]. The urban residents’ cognition to regulation policy of MSW is reflected in the degree of understanding and recognition to the contents of the policy, while the behavior intention is reflected in the compliance of policies and the promotion to others to drive more people to follow the policies. Jin and Liu (2012) [30] studied the latest agricultural insurance subsidy policy and indicated that policy cognition can affect individual behavior choices. However, some scholars believe that there is no necessary connection between individual cognition and behavior choice. For instance, Chang et al., (2016) [31] studied the public’s attitudes towards the mandatory water saving policy and public awareness of policy effectiveness, and discovered that the policy was still effective and the local residents would still save water, even if they did not support the mandatory water saving policy.
It can be observed that the degree of understanding and support willingness belong to the individual cognitive and emotional level of the attitudes towards the policies, and implement willingness and influence willingness are the behavioral intention level of the individual attitudes towards the policy. The relationship and influencing mechanism among degree of understanding, support willingness, implement willingness, and influence willingness must be further explored. Comprehensive experimental technology in statistics generally uses the output as the response results after the variable input to solve the problem from complex systems. In this research, the concept and method are introduced to study the influence of individual cognition and emotion on behavior intention, and discuss the response of public understanding, support willingness, implement willingness, and influence willingness to the policy.
2.2. Classification of MSW Regulation Policy
Economists and regulators have proposed several regulation policies aimed at dealing with MSW, including a garbage charge policy, raw materials taxation, recycled material subsidy, advance payment or consumption tax, deposit refund system, producer responsibility extension system, standard foe cycle material content, recovery rate standard, product durability standards, etc. [17,32,33]. Scholars have classified and studied these policies and regulations. Liao (2000) [34] summarized the regulation policies of MSW in some developed countries (such as Europe, Japan, and the United States), and believed that these countries have generally developed waste regulation policies in three aspects: law, economy, and management.
Wang and Peng (2006) [35] classified the regulation policy of urban domestic waste in China into three categories of downstream policy, upstream policy, and comprehensive policy from the perspective of the waste disposal industry chain. Downstream policy directly deals with domestic waste disposal and consumption behavior. Upstream policy is related to the production behavior of manufacturers. Comprehensive policy includes policies that affect the behaviors of both manufacturers and urban residents. Yuan (2016) [36] believes that the MSW regulation and control policies introduced by the Chinese Government generally covered the three major regulation means: added-value tax refund after collection, domestic waste charge system, and regeneration link subsidy policy. Lu and Du (2016) [37] divided the Japanese garbage regulation policy into four categories from the perspective of the regulators: civil participation, education publicity, legal constraints, and government incentives.
Generally speaking, the research classifies the regulation policy of urban domestic waste from the perspective of policy makers. This classification method represents that, on the one hand, the policy content will be more than the regulation on urban domestic waste and includes responsibility assignments and requirements for law executors and manufacturers, while, on the other hand, the research perspective is from the government rather than the main body of the policy implement. Therefore, it cannot effectively analyze urban residents’ attitudes and responses to these policies. Tvinnereim and Ivarsflaten (2016) [38] divide the climate policy from the perspective of the social individual, they believe that social individuals would spend money to implement the policy, and based on this, the policy was further divided into high-cost policies, low-cost policies/opportunities, and policies with ambiguous costs. Taking this method as a reference, this research considers the actual situation of the MSW regulation policy in China and divides the MSW regulation policy into four types: technical standards, charge collection, command and control, and participation and supervision from the public perspective. All kinds of policies are state-led; that is, no matter which category (policy of technical standards, charge collection, command control, and participation and supervision) they belong to, the policies have similar contents, though there exist some differences in policies promulgated among provinces and cities.
3. Research Method
3.1. Quadratic Response Surface Regression Analysis Methodology
The response surface methodology uses the comprehensive experimental technique of statistics to solve the relationship between the input (variable) and output (response) of complex systems. The mathematical expression of the response surface methodology is the multiple linear regression analysis, as shown in Equation (1).
where n is design variable, is the constant term undetermined coefficient, is the linear term undetermined coefficient, and is the quadratic term undetermined coefficient.
The quadratic response surface regression analysis method is a combination of the quadratic polynomial regression and response surface method. This method is mainly applied in the study of person-organization fit theory [39,40,41]. There is also a fitting relationship between the degree of understanding and support willingness, which refers to the “consistency” degree between the public’s understanding and support to the policy. It is similar to the fit connotation in the person-organization fit theory. Therefore, this research plans to utilize the quadratic response surface regression analysis method to deeply discuss the response relationship of the degree of understanding, support willingness, implement willingness, and influence willingness of the public to the MSW regulation policy. Moreover, the consistency degree is defined as the score of degree of understanding is equal to the score of support willingness. The score is divided into five points in accordance with the scale grade. The higher scores indicate greater consistency in degree. This research defines the inconsistency as the difference between the degree of understanding score and the support willingness score. If the former is higher than the latter, it is known as “forward sequence” inconsistent. In contrast, if the degree of understanding score is lower than the support willingness score, it is known as “inverted sequence” inconsistent. When the degree of inconsistency is closer to 0 this indicates a higher degree of consistency.
3.2. Scale and Samples
This study collected and made a review of the important waste regulation policies issued by Chinese government in recent years, and designed relevant scale items. According to the four-dimensional structure of public attitudes and reactions mentioned above, namely, the degree of understanding, support willingness, implement willingness and influence willingness, the respondents were evaluated by the cognition and behavior willingness of the policies. In addition, 13 professionals (2 professors, 2 associate professors, 4 lecturers, and 5 doctoral candidates majoring in management) were invited to discuss and determine the correctness, scale feasibility, and statement readability of the question items in the scale. The scale adopts the Lickert5 graduation measurement: 1 to 5 represent extremely inconsistent to extremely consistent. The respondents completed the evaluation according to the contents described in each question item and their own actual cognition and behaviors. To ensure the reliability and validity of the questionnaire, a pre-survey was conducted 21–29 February 2016 in Suzhou and Xuzhou city, Jiangsu Province, by face-to-face interviews. During the process, the respondents were told that the questionnaire responses would be used only in scientific research. We promised that any personal information would be kept confidential, and emphasized the importance of answering the questionnaire truthfully. Finally, we gave gifts to the respondents for their participation. A total of 207 questionnaires were issued in Suzhou and Xuzhou, and 195 questionnaires were received with a reception rate of 94.2%. Nine invalid questionnaires were rejected. Finally, 186 valid questionnaires were left out, and the valid rate was 89.9%. The reliability and validity of the questionnaire in the pre-test were analyzed to correct the questions and form the formal questionnaire.
The formal questionnaire contains two parts. The first part is the investigation of basic information. The second part investigates the degree of understanding, support willingness, implement willingness, and influence willingness of the public. The policies include four categories, technical standard, charge collection, command and control, and participation and supervision, containing 44 government-implemented policies in total. The measurement examples of the degree of understanding, support willingness, implement willingness, and influence willingness of each policy are presented in Table 1. It covers the description of the policy name, issue department, issue data, major contents of the policy, degree of understanding, support willingness, implement willingness, and influence willingness of the public, as well as the grade measurement.
Sample size is determined by the overall size, the accuracy and reliability of the sampling, and the heterogeneity of the total. Under a certain heterogeneity level of the total, sample size can be determined using Scheaffer Equation [42]:
where n is the sample size, N is overall total, and δ is the acceptable sampling error. In 2016, the total population of Jiangsu Province was 79.76 million. This means that N for Jiangsu Province was 79.76 million. The sampling error δ is generally set as 0.05. Therefore, the statistical theoretical sample size in Jiangsu Province was about 400. Since there are multiple deviations in surveys, the minimum sample size should be over 600 to reduce the deviation between the estimated and real value within 15% [43].
The formal investigation was conducted from 1 March to 15 April 2016 in Jiangsu Province. We used the same method in the pre-survey to control the quality of questionnaire filling. The questionnaires were collected by face-to-face interviews in residential areas, office buildings, urban libraries, fast food restaurants, and other commercial establishments. A total of 1177 questionnaires were issued and 951 valid questionnaires were received with a valid rate of 80.80%, thus meeting the requirements for a reliable survey. The sample structure is shown in Table 2, where the gender, age, education background, monthly income, and other variables distribute reasonably, which can be regarded as representative.
4. Data Analysis
4.1. Factor Analysis
This research adopted AMOS17.0 to analyze the confirmatory factor of the validity of the questionnaire structure. After adjusting the model twice, the final fitting indicators are χ2 (Chi-square) = 1088.393, df (Degree of freedom) = 341, χ2/df = 3.192, RMSEA (Root mean square error of approximation) = 0.050, GFI (Goodness-of-fit index) = 0.912, IFI (Incremental fit index) = 0.900, CFI (Comparative fit index) = 0.900, and TLI (Tacker-Lewis index) = 0.889. All indices are in the favorable range. The reliability of the samples is analyzed based on the SPSS21.0 software, and the results show that the Cronbach’s alpha coefficients of each dimension are greater than 0.700. The coefficients of technical standard, charge collection, command and control, and participation and supervision are 0.733, 0.729, 0.721, and 0.801, respectively, which indicate the internal consistency of the data in the scale. To summarize, the four-dimensional structure of the MSW regulation policy, namely technical standard, charge collection, command and control, and participation and supervision, is proven.
4.2. Statistics Analysis
The frequency of the degree of understanding, support willingness, implement willingness, and influence willingness of the sample policies is summarized (Table 3). “Extremely inconsistent” and “Relatively inconsistent” belong to low values, which represent “not to or never” understand, support, implement, promote or drive others to follow this policy and the inferior characteristics. As shown in the Table 3, the degree of understanding of 42.51% population is low. In addition, the inferior value of the policy influence willingness reaches a relatively high level (12.52%).
According to the data obtained from the questionnaire, “extremely inconsistent”, “relatively inconsistent”, “general, relatively consistent”, and “extremely consistent” are valued at 1, 2, 3, 4, and 5, respectively. Through calculating, the degree of understanding, support willingness, implement willingness, and influence willingness of the public to different types of policies could be obtained. The average values of degree of understanding, support willingness, implement willingness, and influence willingness of the public to the policy are calculated to obtain the conditions of the public to understand, support, implement, promote, and influence others to comply with the MSW regulation policy, which are as shown in Figure 1. Obviously, the public’s understanding, support, implement, and driving situations of the policy present an “inverted U” change, presenting the characteristics of a low degree of understanding (average value of 2.61), and high support willingness and implement willingness (average values are up to 3.77 and 3.78). Moreover, the public’s publicity and driving behaviors to the policies are at the general level (average value of 3.51).
4.3. Quadratic Response Surface Regression Analysis
Based on the above analysis, the quadratic response surface regression analysis method is applied to the conceptual model established in this research. The following two models are established from the implement willingness and influence willingness, which are implement willingness/influence willingness model 1 (Equations (3) and (5)), and implement willingness/influence willingness model 2 (Equations (4) and (6)). To avoid multi-collinearity, the public’s degree of understanding (X), support willingness (Y), implement willingness (Z1), and influence willingness (Z2) are subjected to centralization processing to calculate the quadratic term X2 and Y2, as well as the product term X × Y of X and Y. All of the above operations are processed by SPSS20.0.
Implement M1:
Implement M2:
Influence M1:
Influence M2:
4.3.1. Response of the Publics’ Overall Degree of Understanding and Support Willingness to Their Implement Willingness and Influence Willingness
According to the correlation analysis (Table 4), there are significantly positive correlations among the degree of understanding, support willingness, implement willingness, and influence willingness of the public to policies, a similar finding was observed for the technical standard, charge collection, command and control, and participation and supervision.
Based on the results of the regression analysis (Table 5), both implement M1 and implement M2 show that the linear correlation exists only between support willingness and implement willingness, while the adjustment R2 of implement M2 to implement M1 presents a rising trend. This indicates that implement M2 has a relatively high explanatory power and can better show the correlation between independent variables and dependent variables.
Edwards (2002, 2008) [41,42] pointed out that when the polynomial regression model containing multiple quadratic terms is significant, the relationship between the independent variables and the dependent variables must be expressed through the three-dimensional diagram. Therefore, this research used the three-dimensional diagram to conduct the response surface analysis on the regression model. Specifically, Matlab7.6.0 software is used to draw the three-dimensional diagram of the relationship between the degree of understanding, support willingness, implement willingness, and influence willingness of the public to policies. In the diagram, the X-axis represents the degree of understanding, the Y-axis represents support willingness, and the Z-axis represents implement willingness or influence willingness.
Y = X transversal line is the so-called congruence, indicating that the two measurement indicators on the X-Y plane are in the same direction and the values are the same. Y = −X transversal line is the dis-congruence, which indicates that the values of the two measurement indicators on the X-Y plane are the same, but the directions are opposite. To summarize, one can note that the diagram of the response of the public’s degree of understanding and support willingness to the implement willingness is along the transversal lines of Y = X and Y = −X (Figure 2b,c).
As shown in Figure 2b, when the degree of understanding and support willingness are consistent, and the degree of consistency is relatively high, the public’s willingness to implement the policy is higher. In contrast, when the degree of understanding and support willingness are “inverted sequence” inconsistent, the implement willingness is lower. For the “forward sequence” inconsistency, implement willingness is continuously lower (Figure 2c). According to the calculation formula of the inconsistency between the degree of understanding and support willingness, the inconsistency line Y = −X shows that implement willingness and the negative of support willingness are related, which further verifies that the public’s overall support willingness and implement willingness to the policy are positively correlated.
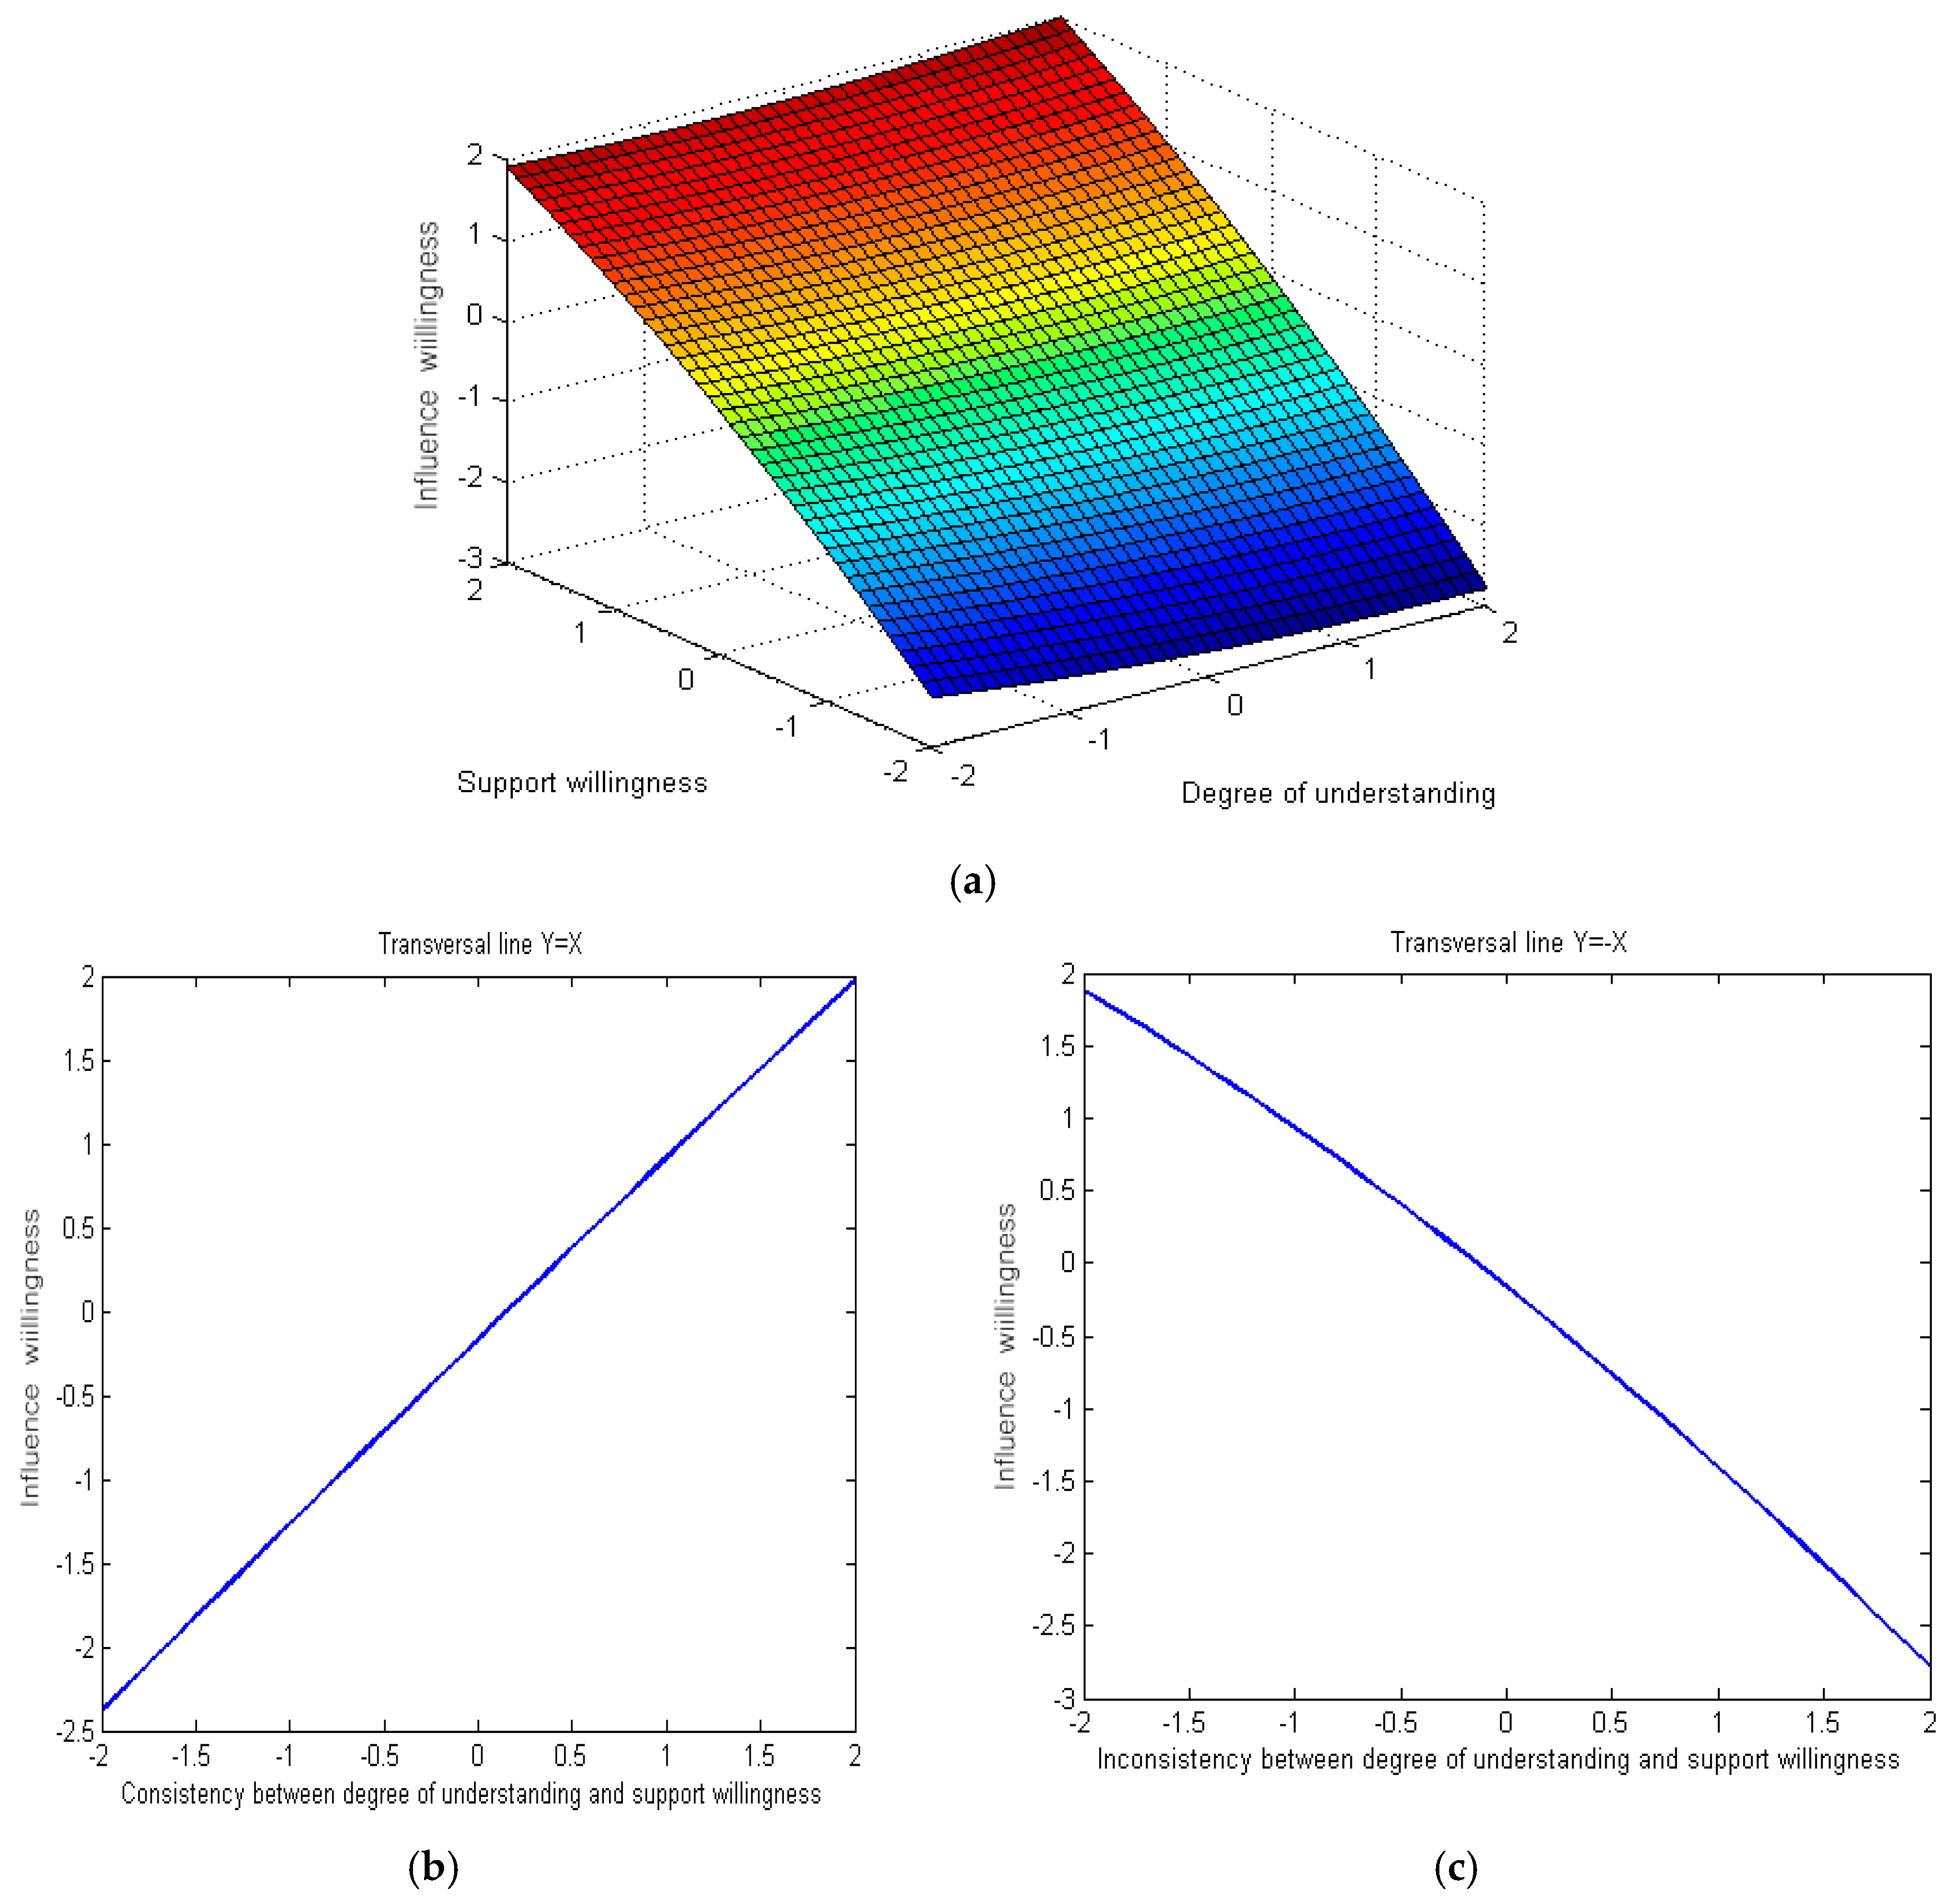
The same method is adopted to analyze the public’s overall degree of understanding and support willingness to influence willingness. According to the regression analysis results (Table 5) in influence M1, the public’s degree of understanding and support willingness can significantly predict influence willingness. In influence M2, only the public’s support willingness can significantly predict influence willingness. Moreover, the adjustment R2 of influence M2 to influence M1 shows a declining trend, which proves that implement M2 does not have high explanatory power, and implement M1 can better show the relationship between independent variables and dependent variables. However, to directly show the response of the public’s degree of understanding and support willingness to implement willingness and the response of the consistency between the public’s degree of understanding and support willingness to influence willingness, this research still uses the three-dimensional diagram to conduct the response surface analysis on the regression model. Figure 3b also indicates that the value of the public’s influence willingness to the policy is higher when the consistency between degree of understanding and support willingness is at a high level. The calculation formula of the inconsistency between degree of understanding and support willingness proves that the inconsistency Y = −X shows the correlation between influence willingness and negative of support willingness. That is, Figure 3c further verifies the correlation between the public’s support willingness and influence willingness.
4.3.2. Response of the Degree of Understanding and Support Willingness for Different Types of Policies to Implement Willingness and Influence Willingness
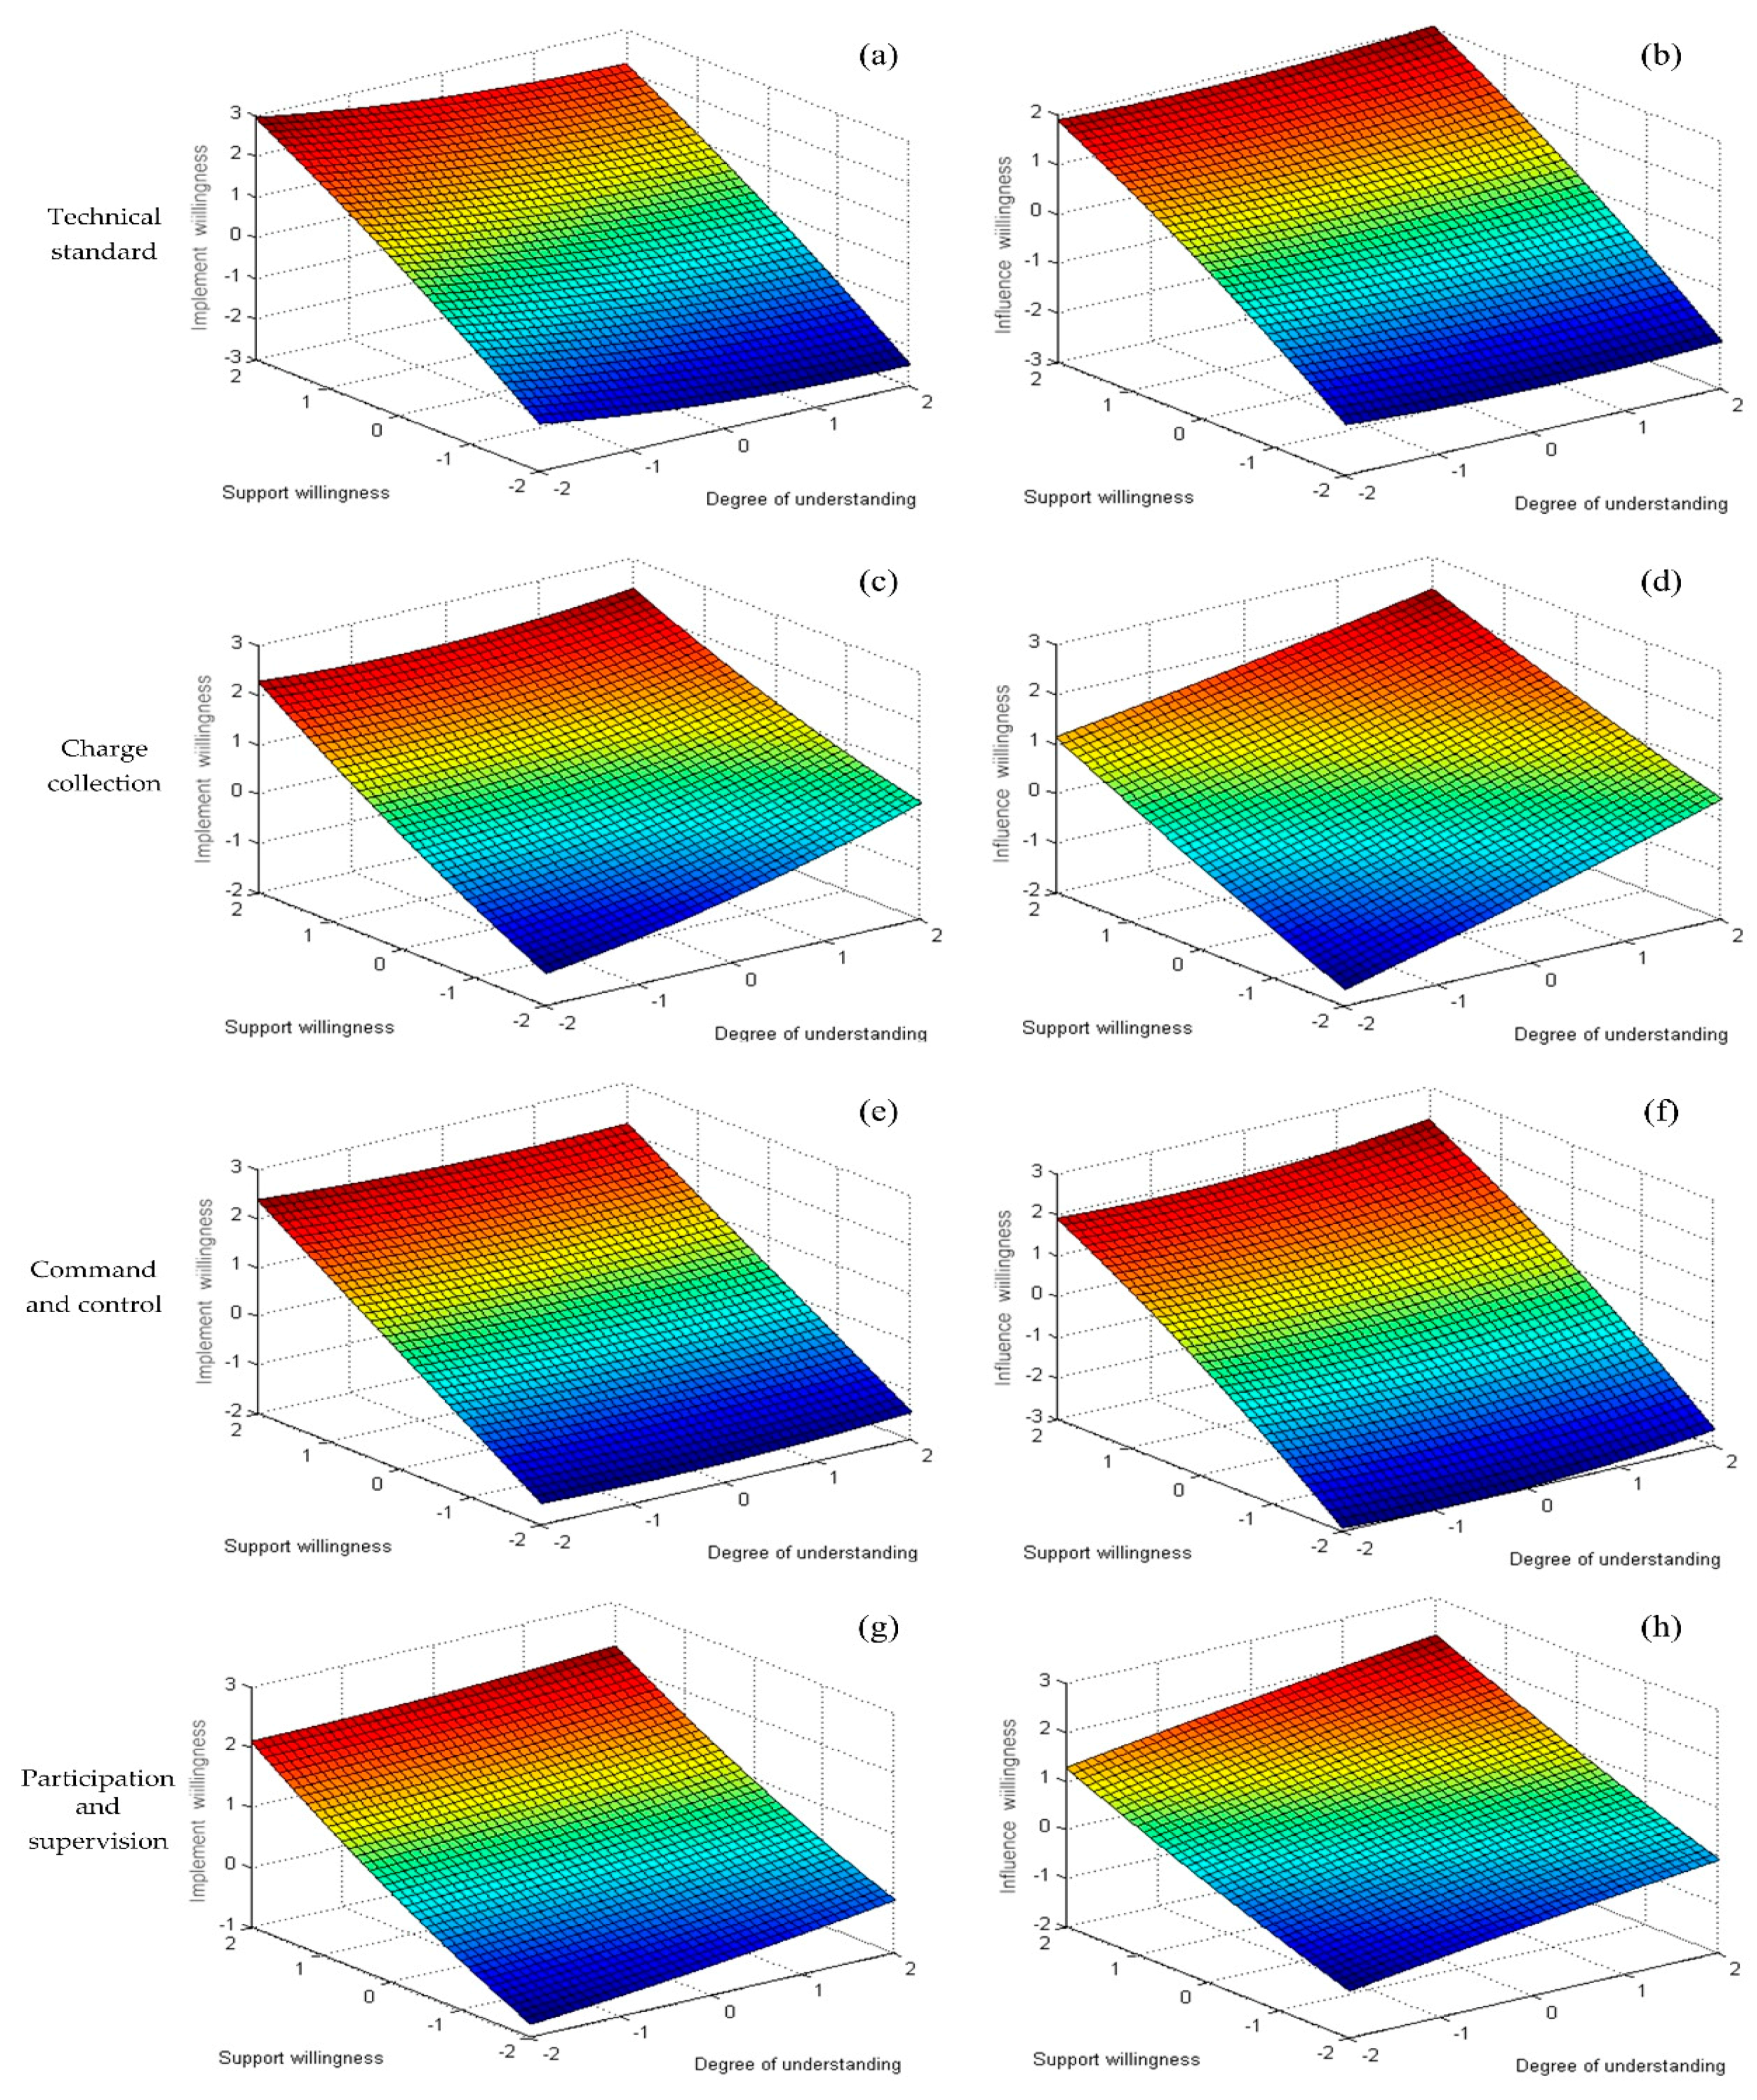
This research further adopts the response surface analysis method to discuss the response of the public’s degree of understanding and support willingness to implement willingness and influence willingness for different types of policies of technical standard, charge collection, command and control, and participation and supervision.
With regard to the technical standard policy, according to the results of the regression analysis on the response of the public’s degree of understanding and support willingness to implement willingness (Table 6), both implement M1 and implement M2 show that the linear correlation exists only between support willingness and implement willingness. The adjustment R2 of implement M2 to implement M1 presents the rising trend and shows relatively high explanatory power. Implement M2 can better present the relationship between independent variables and dependent variables.
The response surfaces are shown in Figure 4. As shown in Table 7, when the degree of understanding and support willingness are consistent, and the degree of consistency is relatively high, the public’s willingness to implement the technical standard policy is higher. When the degree of understanding and support willingness are “inverted sequence” inconsistent, the implement willingness is lower. For the “forward sequence” inconsistency, the implement willingness is continuously lower. However, according to the calculation formula of the inconsistency between the degree of understanding and support willingness, the inconsistency line Y = −X shows that implement willingness and the negative of support willingness are related, which further verifies that the public’s support willingness and implement willingness to the technical standard policy are positively correlated.
In influence M1, the public’s degree of understanding and support willingness to technical standard policy can significantly predict implement willingness. In influence M2, only the public’s support willingness to the technical standard policy can significantly predict implement willingness. Moreover, the adjustment R2 of influence M2 to influence M1 shows a declining trend, which proves that the implement M2 does not present high explanatory power, and implement M1 can better present the relationship between independent variables and dependent variables. For the technical standard policy, when the degree of understanding and support willingness are consistent, and the degree of consistency is relatively high, the public’s willingness to implement the technical standard policy is higher. Table 7 shows that, when the degree of understanding and support willingness are “inverted sequence” inconsistent, the implement willingness is lower. For the “forward sequence” inconsistency, the implement willingness is continuously lower.
With regard to the charge collection policy, according to the results of the regression analysis on the response of the public’s degree of understanding and support willingness to implement willingness (Table 6), both implement M1 and implement M2 show that the linear correlation exists only between support willingness and implement willingness. The adjustment R2 of implement M2 to implement M1 presents a declining trend, indicating that implement M2 does not show a relatively high explanatory power, while implement M1 can better present the relationship between independent variables and dependent variables. On Y = X line, the slope is greater than 0, indicating that compared with the inconsistency, when the public’s degree of understanding and support willingness are consistent, the implement willingness value is higher. As shown in Table 7, when the consistency between the public’s degree of understanding and support willingness to the charge collection policy is enhanced, the implement willingness value increases. When the response surface is concave along the inconsistency line Y = −X, according to the calculation, the inflection point coordinate is (1.32, 0.28). When the degree of understanding and support willingness of the public to the charge collection policy are inverted sequence consistent, implement willingness decreases. However, when the degree of understanding exceeds support willingness, implement willingness will slightly decrease to a certain extent and then increase.
In influence M1, the public’s degree of understanding and support willingness to the charge collection policy can significantly predict implement willingness. In influence M2, neither the degree of understanding nor support willingness of the public to the charge collection policy can predict influence willingness. Moreover, the adjustment R2 of influence M2 to influence M1 shows a declining trend, which proves that influence M2 does not present high explanatory power, while influence M1 can better present the relationship between independent variables and dependent variables. On Y = X line, the slope is equal to and smaller than 0, indicating that compared with the inconsistency, when the public’s degree of understanding and support willingness are consistent, the implement willingness value is higher. As shown in Table 7, when the consistency between the public’s degree of understanding and support willingness to the charge collection policy is enhanced, the implement willingness value increases. When the response surface is concave along the inconsistency line Y = −X, according to the calculation, the inflection point coordinate is (1.21, 0.22). When the degree of understanding and support willingness of the public to the charge collection policy are inverted sequence consistent, implement willingness decreases. However, when the degree of understanding exceeds support willingness, implement willingness will decrease slightly to a certain extent and then increase.
In terms of charge collection policies, the public shows a relatively lower degree of understanding and support willingness in the “dark space” during the early stage of implementation. With the deepening implementation of the policy, the “inverted sequence” inconsistencies from the public’s degree of understanding and support willingness demonstrated an upward tendency, while the policy response level showed a downward trend. However, when the degree of understanding and support willingness appear in a “forward sequence” inconsistent order, implement willingness and influence willingness reversed small increase and arrived at the “bright space” stage.
As for the command and control policy, according to the results of the regression analysis on the response of the public’s degree of understanding and support willingness to implement willingness (Table 6), both implement M1 and implement M2 show that the linear correlation exists only between support willingness and implement willingness. The adjustment R2 of implement M2 to implement M1 presents a declining trend, which indicates that implement M2 does not show a relatively high explanatory power. Implement M1 can better present the relationship between independent variables and dependent variables. As shown in Table 7, when the degree of understanding and support willingness are consistent, and the degree of consistency is relatively high, the public’s willingness to implement the command and control policy is higher. When the degree of understanding and support willingness are “inverted sequence” inconsistent, implement willingness is lower. For the “forward sequence” inconsistency, implement willingness is continuously lower. However, according to the calculation formula of the inconsistency between the degree of understanding and support willingness, the inconsistency line Y = −X shows that implement willingness and the negative of support willingness are related, which further verifies that the public’s support willingness and implement willingness to the command and control policy are positively correlated.
In influence M1, the public’s degree of understanding and support willingness to the command and control policy can significantly predict implement willingness. In influence M2, only the public’s support willingness to the command and control policy can significantly predict implement willingness. Moreover, the adjustment R2 of influence M2 to influence M1 shows a declining trend, which proves that implement M2 does not present high explanatory power, and implement M1 can better present the relationship between independent variables and dependent variables. As shown in Table 7, when the degree of understanding and support willingness are consistent, and the consistency degree is relatively high, the public’s willingness to implement the command and control policy is higher. The public’s support willingness and implement willingness to the command and control policy are positively correlated.
As for participation and supervision policy, according to the results of the regression analysis on the response of the public’s degree of understanding and support willingness to implement willingness (Table 6), both implement M1 and implement M2 show that the linear correlation exists only between support willingness and implement willingness. The adjustment R2 of implement M2 to implement M1 presents a rising trend, which shows a relatively high explanatory power. Implement M2 can better present the relationship between independent variables and dependent variables. As shown in Table 7, when the degree of understanding and support willingness are consistent, and the degree of consistency is relatively high, the public’s willingness to implement, participate, and supervise the policy is higher. When the degree of understanding and support willingness are “inverted sequence” inconsistent, the implement willingness is lower. For the “forward sequence” inconsistency, implement willingness is continuously lower. However, according to the calculation formula of the inconsistency between the degree of understanding and the support willingness, the inconsistency line Y = −X shows that implement willingness and the negative of support willingness are related, which further verifies the public’s support willingness and implement willingness to the participation and supervision policy are positively correlated.
In influence M1, the public’s degree of understanding and support willingness to the participation and supervision policy can significantly predict the implement willingness. In influence M2, neither the degree of understanding nor the public’s support willingness to the participation and supervision policy can predict influence willingness. Moreover, the adjustment R2 of influence M2 to influence M1 shows a declining trend, which proves that the implement M2 does not present high explanatory strength, and implement M1 can better present the relationship between independent variables and dependent variables. As shown in Table 7, for the participation and supervision, when the degree of understanding and support willingness are consistent, and the degree of consistency is relatively high, the public’s willingness to implement the technical standard policy is higher. The public’s support willingness and implement willingness to the participation and supervision policy are positively correlated.
5. Discussion
According to the descriptive statistics analysis in the samples, 42.51% of individuals had a low degree of understanding of the MSW regulation policy, which reflects the lack of understanding and recognition of the policy due to the deficiency in publicity of the policy by the government. Two major reasons may cause the phenomena. Firstly, the policy-making side (the government) is weak in communication, causing the public lack of awareness and understanding to the policy. Secondly, the “policy receivers” lack the willingness to understand the policy. Ren et al. (2016) [44] pointed out that the public’s willingness to learn and understand the policy is closely related to the perception of harm from waste pollution. Therefore, the government should not only strengthen the policy communication, but also enable the public to realize the harm to themselves and their families from waste pollution. In addition, compared with influence willingness and implement willingness for the policy, the inferior value also reaches a higher level (12.52%). It requires individuals to have higher environmental awareness and citizen consciousness to promote the policy standard to others and drive more people to follow the policy. According to previous research, there is certain room for Chinese residents’ environmental awareness and citizen consciousness to be further improved [45]. In addition, individuals’ supervision and urge for people to follow the waste regulation policy might be regarded as officiousness, which will further result in interpersonal gap. Deniz et al. (2013) [46] pointed out that individuals will take no action or keep silent due to concerns about the interpersonal gap or incompatible with the community. These factors make a large number of residents reluctant to drive others to understand and follow the policy standards.
Interestingly, the public’s understanding, support, implement, and influence situations of the existing waste regulation policy present an “inverted U” change, showing the characteristics of a low degree of understanding and influence willingness (the average value is 2.61), and high support willingness and implement willingness (the average values are up to 3.77 and 3.78). This proves that although residents do not know much about the policy, they will still support and implement the relevant policies. Liu et al. (2015) [47] also found there are a high proportion of residents who may support the policies about consumption behaviors adjustment towards energy-saving and low-carbon pattern, but currently the residents’ awareness are still not desirable. The possible reason is that individuals have the endogenous environmental protection and energy-saving behavior tendency, which originate from healthy living consciousness [20], environmental responsibility [21], civic consciousness [22], etc. This will increase support willingness and compliance degree to waste classification, recycling, and other activities, as well as the government regulation policies. In addition, normative concentration induces motivation to observe law and discipline [48] to further obey the rules and regulations.
The quadratic response surface analysis results show that the public’s support willingness to the policy can positively affect implement willingness. However, the degree of understanding cannot significantly predict the public’s willingness to implement the MSW regulation policy. The knowledge-attitude-behavior model [49,50] points out that behavior is related to knowledge and belief. External conditions are required to transform knowledge into behavioral intention, and the establishment of faith is the key factor of behavioral intention. Public support for policy is a positive emotion and belief, and can predict the intention to compliance behavior. However, the public’s understanding of the policy cannot be directly converted into implement. Negash et al. (2015) [51] believe that education was an important external condition to promote the knowledge to transform into behavioral intention.
With regard to the response to influence willingness, the public’s degree of understanding and support willingness to different policies can significantly predict influence willingness. Since the policy standard contains some environmental protection knowledge, understanding of the policy will increase the individuals’ environmental knowledge. Bradley et al. (1999) [52] and Zsóka et al. (2013) [53] pointed out that environmental knowledge and environmental protection willingness can enhance individuals’ environmental responsibility, which further leads to the occurrence of pro-environment behaviors, including management behavior, consumption behavior, persuasive behavior, and citizenship behavior. It is an environmental persuasive behavior to promote and drive more people to follow the policy norms. In addition, Valkila and Saari (2013) [54] found an inconsistency between the statements and actions of environmental protection behaviors. Environmental persuasive behavior and other behaviors conducive to society can establish a positive image for the actors. However, this does not mean that they will protect the environment and save energy. Therefore, it is understandable that the degree of understanding can predict influence willingness, rather than implement willingness.
For different MSW regulation policy, the consistency between the degree of understanding and support willingness has an “incremental” response to implement willingness and influence willingness. That is, when the degree of understanding and support willingness are consistently at a high level, the values of implement willingness and influence willingness are higher. This indicates that it is not inevitable that the public’s understanding and support of the policy will have a high willingness to implement or make the policy influential. If the degrees of understanding and support willingness are inconsistent in “forward sequence”, individuals might disagree with the policy and are unwilling to passively follow or promote it after sufficiently understanding the contents of the policy. If the degree of understanding and the support willingness are inconsistent in “inverted sequence”, although the individuals will support the policy, the sense of identity may originate from the endogenous environmental protection and energy-saving behavior. The public will lack understanding of the policy; there will be no regulation to follow, and they will not act to promote the policy or persuade others to comply with it. Kaiser et al. (1999) [55] and Richard et al. (2001) [56] also pointed out that individuals are more likely to translate their cognition into behavioral intentions when they attach individual positive emotions to the cognition. This also means that individuals will have higher implement willingness and influence willingness when they understand the policy with emotional support.
It is worth noting that the response of the inconsistency between the degree of understanding and support willingness for the charge collection policy with implement willingness and influence willingness shows a “concave” change. Implement willingness decreases when the degree of understanding and support willingness for the charge collection policy are “inverted sequence” consistent. However, implement willingness increases after the degree of understanding exceeds support willingness (“forward sequence” inconsistent) by a certain value. The response of influence willingness of the charge collection policy also presents similar characteristics. This shows that the residents will have exclusive behaviors when they do not understand the MSW regulation system, which is consistent with the opinion of the Economic Person Assumption [57]. The public will not be willing to pay extra costs for the waste. However, after residents deeply understand the content, standards, and reason for the waste disposal charge, they will realize that waste disposal requires a large number of human and material resources. The charge is to enable them to live in a better environment. In addition, China implements the waste disposal charge system according to households and people; each family must pay 4 Yuan a month, equivalent to 0.079% of the overage family monthly expenditure (5053.3) [5]. Therefore, this charge can be negligible, and the public will be willing to comply with the charging system. Residents are reluctant to pay the public service independently, which will create a feeling of unfairness. Therefore, they are more willing to encourage others to comply with this charging system.
6. Conclusions and Policy Implication
6.1. Conclusions
(1) According to the sample data statistics and response surface regression analysis results, 42.51% of individuals lack understanding of the waste regulation policy.
(2) Overall, the public’s understanding, support, implement, and influence of the policy show an “inverted U” change, suggesting characteristics of a low degree of understanding and influence willingness, and high support willingness and implement willingness.
(3) With regard to the relationship mechanism, support willingness can significantly affect the public’s willingness to implement the policy. Understanding alone does not have a significant impact function, while the degree of understanding and support willingness can significantly and positively predict influence willingness.
(4) The consistency between the degree of understanding and support willingness has an “incremental” response to implement willingness and influence willingness. When the degree of understanding and support willingness are consistently at a high level, the values of implement willingness and influence willingness are higher.
(5) The inconsistency between the degree of understanding and support willingness to the charge collection policy indicates a concave change to the response of implement willingness and influence willingness. The implement level will decrease for the reversed order inconsistency between the degree of understanding and support willingness. However, implement level will increase when the degree of understanding exceeds support willingness by a certain value (“forward sequence” inconsistent).
6.2. Policy Enlightenment
To improve the public’s response to the policy, ensure the regulatory effectiveness of MSW, recycling process and energy conversion, and promote the resource and energy sustainable development, this research proposes the following policy enlightenments according to the analysis results:
(1) Compensate the short board factors in the “inverted U” phenomenon. According to the analysis, if the public’s support willingness and implement willingness are not established based on the full understanding of the policy and a clear judgment of their own interest relationship, they will not have sustainability. Therefore, on the one hand, the government must continue with the pace of policy-making in the publicity and compensate the short board of the public’s degree of understanding to the policy through innovating means and channels of propaganda. On the other hand, the government should emphasize more on promoting the formation of a positive social atmosphere to lay the foundation for enhancing the public’s influence willingness.
(2) Awareness and support of the policy are facilitated by synchronization. Research results show that the public exhibit unanimity in awareness and support of the policy, and they showed a higher level of implement and influence willingness (high policy response). However, the reality is that the level of awareness is lower than support intention, which hinders a positive outcome. Therefore, the government should innovate work methods, strengthen the public’s understanding and support information, take timely and appropriate measures, and promote the consistency level of public understanding and support.
(3) The government should facilitate the implementation of expense-collecting policies, establish an information disclosure system during the whole implementation process, and strengthen the image of trustworthy institutions. Through the inconsistency analysis, the public will demonstrate a higher level of implement and influence willingness (a higher level of policy response at the initial stage) due to identification with government authority when the public show lower-level awareness and support of policies, namely, in the “dark space” during the early stage of implementation. With the deepening implementation of the policy, the “inverted sequence” inconsistencies from the public’s degree of understanding and support willingness demonstrated an upward tendency, while the policy response level showed a downward trend. However, when the degrees of understanding and support willingness were “forward sequence” inconsistent, implement willingness and influence willingness reversed with a small increase. Such results show that there exists a “concave” response process for the enactment and implementation of expenses-collecting policies. The entire process should be more open and transparent and the length of stay in lower response area shortened. At the early stage of policy implementation, the government should establish a mechanism of mutual benefit and trust through constant communication with the public, improve government credibility, take the initiative to reduce risks of a low-level policy response from “inverted order” inconsistency, promote steady policy implementation, and finally guide the public’s response scenario transforming it from concave to an increase type.
Supplementary Files
Supplementary File 1Acknowledgments
This study was supported by the Fundamental Research Funds for the Central Universities (2017XKZD12), the Innovation Team Program of the China University of Mining and Technology (grant No. 2015ZY003), and “13th Five Year” Brand Discipline Construction Funding Project of China University of Mining and Technology (2017).
Author Contributions
Hong Chen and Ruyin Long came up with the original idea for this article; Feiyu Chen designed the theoretical model, collected the data and wrote the paper; Xinru Huang, Hui Lu, Ting Yue polished the article. All authors read and approved this version.
Conflicts of Interest
The authors declare that they have no conflict of interest.
References
- Wang, Y. A discussion on why and where to develop cyclic economy for China’s mining industry. Eng. Sci. 2005, 7, 140–142. [Google Scholar]
- Mühle, S.; Balsam, I.; Cheeseman, C.R. Comparison of carbon emissions associated with municipal solid waste management in Germany and the UK. Resour. Conserv. Recycl. 2010, 54, 793–801. [Google Scholar] [CrossRef]
- Cheng, H.; Zhang, Y.; Meng, A.; Li, Q. Municipal solid waste fueled power generation in China: A case study of waste-to-energy in Changchun City. Environ. Sci. Technol. 2007, 41, 7509–7515. [Google Scholar] [CrossRef] [PubMed]
- Hsu, C.T.; Yao, D.J.; Ye, K.J.; Yu, B. Renewable energy of waste heat recovery system for automobiles. J. Renew. Sustain. Energy 2010, 2, 1–12. [Google Scholar] [CrossRef]
- National Bureau of Statistics of the People’s Republic of China (NBSC). China Statistical Yearbook; China Statistical Press: Beijing, China, 2015.
- Ding, C. International experience of charge system of municipal solid rubbish and enlightenment. Collect. Essays Financ. Econ. 2007, 4, 7–13. [Google Scholar]
- Du, J. Experiences of waste treatment in metropolis of Japan. Study Explor. 2010, 6, 154–156. [Google Scholar]
- Aleluia, J.; Ferrão, P. Characterization of urban waste management practices in developing Asian countries: A new analytical framework based on waste characteristics and urban dimension. Waste Manag. 2016, 58, 415–429. [Google Scholar] [CrossRef] [PubMed]
- Flynn, A.; Yu, L.; Feindt, P.; Chen, C. Eco-cities, governance and sustainable lifestyles: The case of the Sino-Singapore Tianjin Eco-City. Habitat Int. 2016, 53, 78–86. [Google Scholar] [CrossRef]
- Chen, H.; Qi, H. Effectiveness of Coal Mine Safety Management System from the Perspective of Positive Safety Management; Science Press: Beijing, China, 2013. [Google Scholar]
- Breckler, S.J. Empirical validation of affect, behavior, and cognition as distinct components of attitude. J. Pers. Soc. Psychol. 1984, 47, 1191–1205. [Google Scholar] [CrossRef] [PubMed]
- Xiao, X. Study on Spatial and Temporal Changes of Carbon Emission in Jiangsu Province in the Past 15 Years. Master’s Thesis, Nanjing University, Nanjing, China, 2011. [Google Scholar]
- Liu, Y.S. Research on the timeliness of interest rate adjustment policy in China’s macroeconomic regulation and control system. Southeast Acad. Res. 2007, 6, 59–67. [Google Scholar]
- Zurbrügg, C.; Caniato, M.; Vaccari, M. How assessment methods can support solid waste management in developing countries—A critical review. Sustainability 2014, 6, 545–570. [Google Scholar] [CrossRef]
- Gregorio, M.D.; Nurrochmat, D.R.; Paavola, J.; Sari, I.M.; Fatorelli, L.; Pramova, E.; Locatelli, B.; Brockhaus, M.; Kusumadewi, S.D. Climate policy integration in the land use sector: Mitigation, adaptation and sustainable development linkages. Environ. Sci. Policy 2017, 67, 35–43. [Google Scholar] [CrossRef]
- Wang, Q.W.; Su, B.; Sun, J.; Zhou, P.; Zhou, D.Q. Measurement and decomposition of energy-saving and emissions reduction performance in Chinese cities. Appl. Energy 2015, 151, 85–92. [Google Scholar] [CrossRef]
- Wang, J.M. A Theoretical and Empirical Study on the Control Policy of Municipal Solid Waste; Economy & Management Publishing House: Beijing, China, 2007. [Google Scholar]
- Chen, H.; Long, R.Y.; Niu, W.J.; Feng, Q.; Yang, R.R. How does individual low-carbon consumption behavior occur? An analysis based on attitude process. Appl. Energy 2014, 116, 376–386. [Google Scholar] [CrossRef]
- Wei, J.; Hansen, A.; Zhang, Y.; Li, H.; Liu, Q.; Sun, Y.; Bi, P. Perception, attitude and behavior in relation to climate change: A survey among CDC health professionals in Shanxi Province, China. Environ. Res. 2014, 134, 301–308. [Google Scholar] [CrossRef] [PubMed]
- Asensio, O.I.; Delmas, M.A. Nonprice incentives and energy conservation. Proc. Natl. Acad. Sci. USA 2015, 112, 510–515. [Google Scholar] [CrossRef] [PubMed]
- Babiak, K.; Trendafilova, S. CSR and environmental responsibility: Motives and pressures to adopt green management practices. Corp. Soc. Responsib. Environ. Manag. 2011, 18, 11–24. [Google Scholar] [CrossRef]
- Mckinley, E.; Fletcher, S. Improving marine environmental health through marine citizenship: A call for debate. Mar. Policy 2012, 36, 839–843. [Google Scholar] [CrossRef]
- Tversky, A.; Kahneman, D. The framing of decisions and the psychology of choice. Science 1981, 211, 453–458. [Google Scholar] [CrossRef] [PubMed]
- Liu, C.J. A review of researches on the antecedents and mechanism of consumers’ behavior intention. Soft Sci. 2014, 11, 107–110. [Google Scholar]
- Jiang, P.; Chen, Y.; Xu, B.; Dong, W.; Kennedy, E. Building low carbon communities in China: The role of individual’s behavior change and engagement. Energy Policy 2013, 60, 611–620. [Google Scholar] [CrossRef]
- Ajzen, I. The theory of planned behavior. Organ. Behav. Hum. Decis. Process. 1991, 50, 179–211. [Google Scholar] [CrossRef]
- Lee, Y.; Kim, S.; Kim, M.S.; Choi, J.G. Antecedents and interrelationships of three types of pro-environmental behavior. J. Bus. Res. 2014, 67, 2097–2105. [Google Scholar] [CrossRef]
- Rachlin, H.; Logue, A.W.; Gibbon, J.; Frankel, M. Cognition and behavior in studies of choice. Psychol. Rev. 1985, 93, 33–45. [Google Scholar] [CrossRef]
- Costa-Gomes, M.A.; Crawford, V.P. Cognition and behavior in two-person guessing games: An experimental study. Am. Econ. Rev. 2006, 96, 1737–1768. [Google Scholar] [CrossRef]
- Jin, G.; Liu, Q.R. Subsidy incentive, policy cognition and contribution grade choosing of personal account of new rural pension system. Popul. Dev. 2012, 4, 39–46. [Google Scholar]
- Chang, G.; Wang, L.; Zhang, W. Perceptions of peasants in Minqin County for the water conservation polices of Shiyang River basin and their effects. J. Arid Land Resour. Environ. 2016, 30, 13–19. [Google Scholar]
- Pires, A.; Martinho, G.; Chang, N.B. Solid waste management in European countries: A review of systems analysis techniques. J. Environ. Manag. 2011, 92, 1033–1050. [Google Scholar] [CrossRef] [PubMed]
- Moh, Y.C.; Manaf, L.A. Overview of household solid waste recycling policy status and challenges in Malaysia. Resour. Conserv. Recycl. 2014, 82, 50–61. [Google Scholar] [CrossRef]
- Liao, Y.Z. Control policy of municipal solid waste in foreign countries and its enlightenment. China Soft Sci. 2000, 14, 28–29. [Google Scholar]
- Wang, J.M.; Peng, X.L. Review on the regulation policy of municipal solid waste—Advancing the frontier areas of circular economy. Foreign Econ. Manag. 2006, 28, 59–64. [Google Scholar]
- Yuan, L. Regulation model and policy evaluation of municipal solid waste. Macroecon 2016, 2, 64–69. [Google Scholar]
- Lu, W.X.; Du, J. Japan’s waste classification management experience and its inspiration to China. J. Cent. China Norm. Univ. 2016, 55, 39–53. [Google Scholar]
- Tvinnereim, E.; Ivarsflaten, E. Fossil fuels, employment, and support for climate policies. Energy Policy 2016, 96, 364–371. [Google Scholar] [CrossRef]
- Edwards, J.R. Alternatives to difference scores: Polynomial regression and response surface methodology. Adv. Meas. Data Anal. 2002, 350–400. Available online: https://doi.org/10.1037/e576892011-020 (accessed on 14 June 2017).
- Edwards, J.R. Person-environment fit in organizations: An assessment of theoretical progress. Acad. Manag. Ann. 2008, 2, 167–230. [Google Scholar] [CrossRef]
- Zhang, S.; Zhang, J.; Zhou, M. The quadratic polynomial regression with response surface analysis and its use in person-environment fit research. Adv. Psychol. Sci. 2012, 20, 825–833. [Google Scholar] [CrossRef]
- Scheaffer, R.L.; Mendenhall, W.; Ott, L. Elementary Survey Sampling, 5th ed.; PWS-Kent: Boston, MA, USA, 1996. [Google Scholar]
- Fischhoff, B.; Mitchell, R.C.; Carson, R.T. Review: Using surveys to value public goods: The contingent valuation method. Land Econ. 1990, 72, 153–163. [Google Scholar]
- Ren, X.; Che, Y.; Yang, K.; Tao, Y. Risk perception and public acceptance toward a highly protested waste-to-energy facility. Waste Manag. 2016, 48, 528–539. [Google Scholar] [CrossRef] [PubMed]
- Li, Y.X. The positive construction of Chinese citizen consciousness in the social transition period—From the perspective of relationships in various field of social life. Soc. Stud. 2010, 1, 35–38. [Google Scholar]
- Deniz, N.; Noyan, A.; Ertosun, Ö.G. The relationship between employee silence and organizational commitment in a private healthcare company. Procedia Soc. Behav. Sci. 2013, 99, 691–700. [Google Scholar] [CrossRef]
- Liu, L.C.; Wu, G.; Zhang, Y.J. Investigating the residential energy consumption behaviors in Beijing: A survey study. Nat. Hazards 2015, 75, 243–263. [Google Scholar] [CrossRef]
- Higgins, E.T. Making a good decision: Value from fit. Am. Psychol. 2000, 55, 1217–1230. [Google Scholar] [CrossRef] [PubMed]
- Dutt, S.N.; Mcdermott, A.L.; Irving, R.M.; Donaldson, I.; Pahor, A.L.; Proops, D.W. Prescription of binaural hearing aids in the United Kingdom: A knowledge, attitude and practice (KAP) study. J. Laryngol. Otol. Suppl. 2002, 116, 2–6. [Google Scholar] [CrossRef]
- Andargie, G.; Kassu, A.; Moges, F.; Kebede, Y.; Gedefaw, M.; Wale, F.; Alem, A.; Andualem, B.; Adungna, S. Low prevalence of HIV infection, and knowledge, attitude and practice on HIV/AIDS among high school students in Gondar, Northwest Ethiopia. Ethiop. J. Health Dev. 2007, 21, 179–182. [Google Scholar] [CrossRef]
- Negash, Y.; Gebre, B.; Benti, D.; Bejiga, M. A community based study on knowledge attitude and practice (KAP) on HIV/AIDS in Gambella town western Ethiopia. Ethiop. J. Health Dev. 2015, 50, 234–235. [Google Scholar]
- Bradley, J.C.; Waliczek, T.M.; Zajicek, J.M. Relationship between environmental knowledge and environmental attitude of high school students. J. Environ. Educ. 1999, 30, 17–21. [Google Scholar] [CrossRef]
- Zsóka, Á.; Szerényi, Z.M.; Széchy, A.; Kocsis, T. Greening due to environmental education? Environmental knowledge, attitudes, consumer behavior and everyday pro-environmental activities of Hungarian high school and university students. J. Clean. Prod. 2013, 48, 126–138. [Google Scholar] [CrossRef]
- Valkila, N.; Saari, A. Attitude-behavior gap in energy issues: Case study of three different Finnish residential areas. Energy Sustain. Dev. 2013, 17, 24–34. [Google Scholar] [CrossRef]
- Kaiser, F.G.; Ranney, M.; Hartig, T.; Bowler, P.A. Ecological behavior, environmental attitude, and feelings of responsibility for the environment. Eur. Psychol. 1999, 4, 59–74. [Google Scholar] [CrossRef]
- Richard, J.; Boland, J.; Jagdip, S.; Paul, S.; John, D.A.; Sharon, Y.F.; Prasert, K. Knowledge representations and knowledge transfer. Acad. Manag. J. 2001, 44, 393–417. [Google Scholar]
- Hollis, M. Rational economic man. Telos 1975, 17, 235–238. [Google Scholar]
Figure 1.
“Inverted U” change trend of the public’s understanding, support, implement and driving situations of the policy.
Figure 1.
“Inverted U” change trend of the public’s understanding, support, implement and driving situations of the policy.
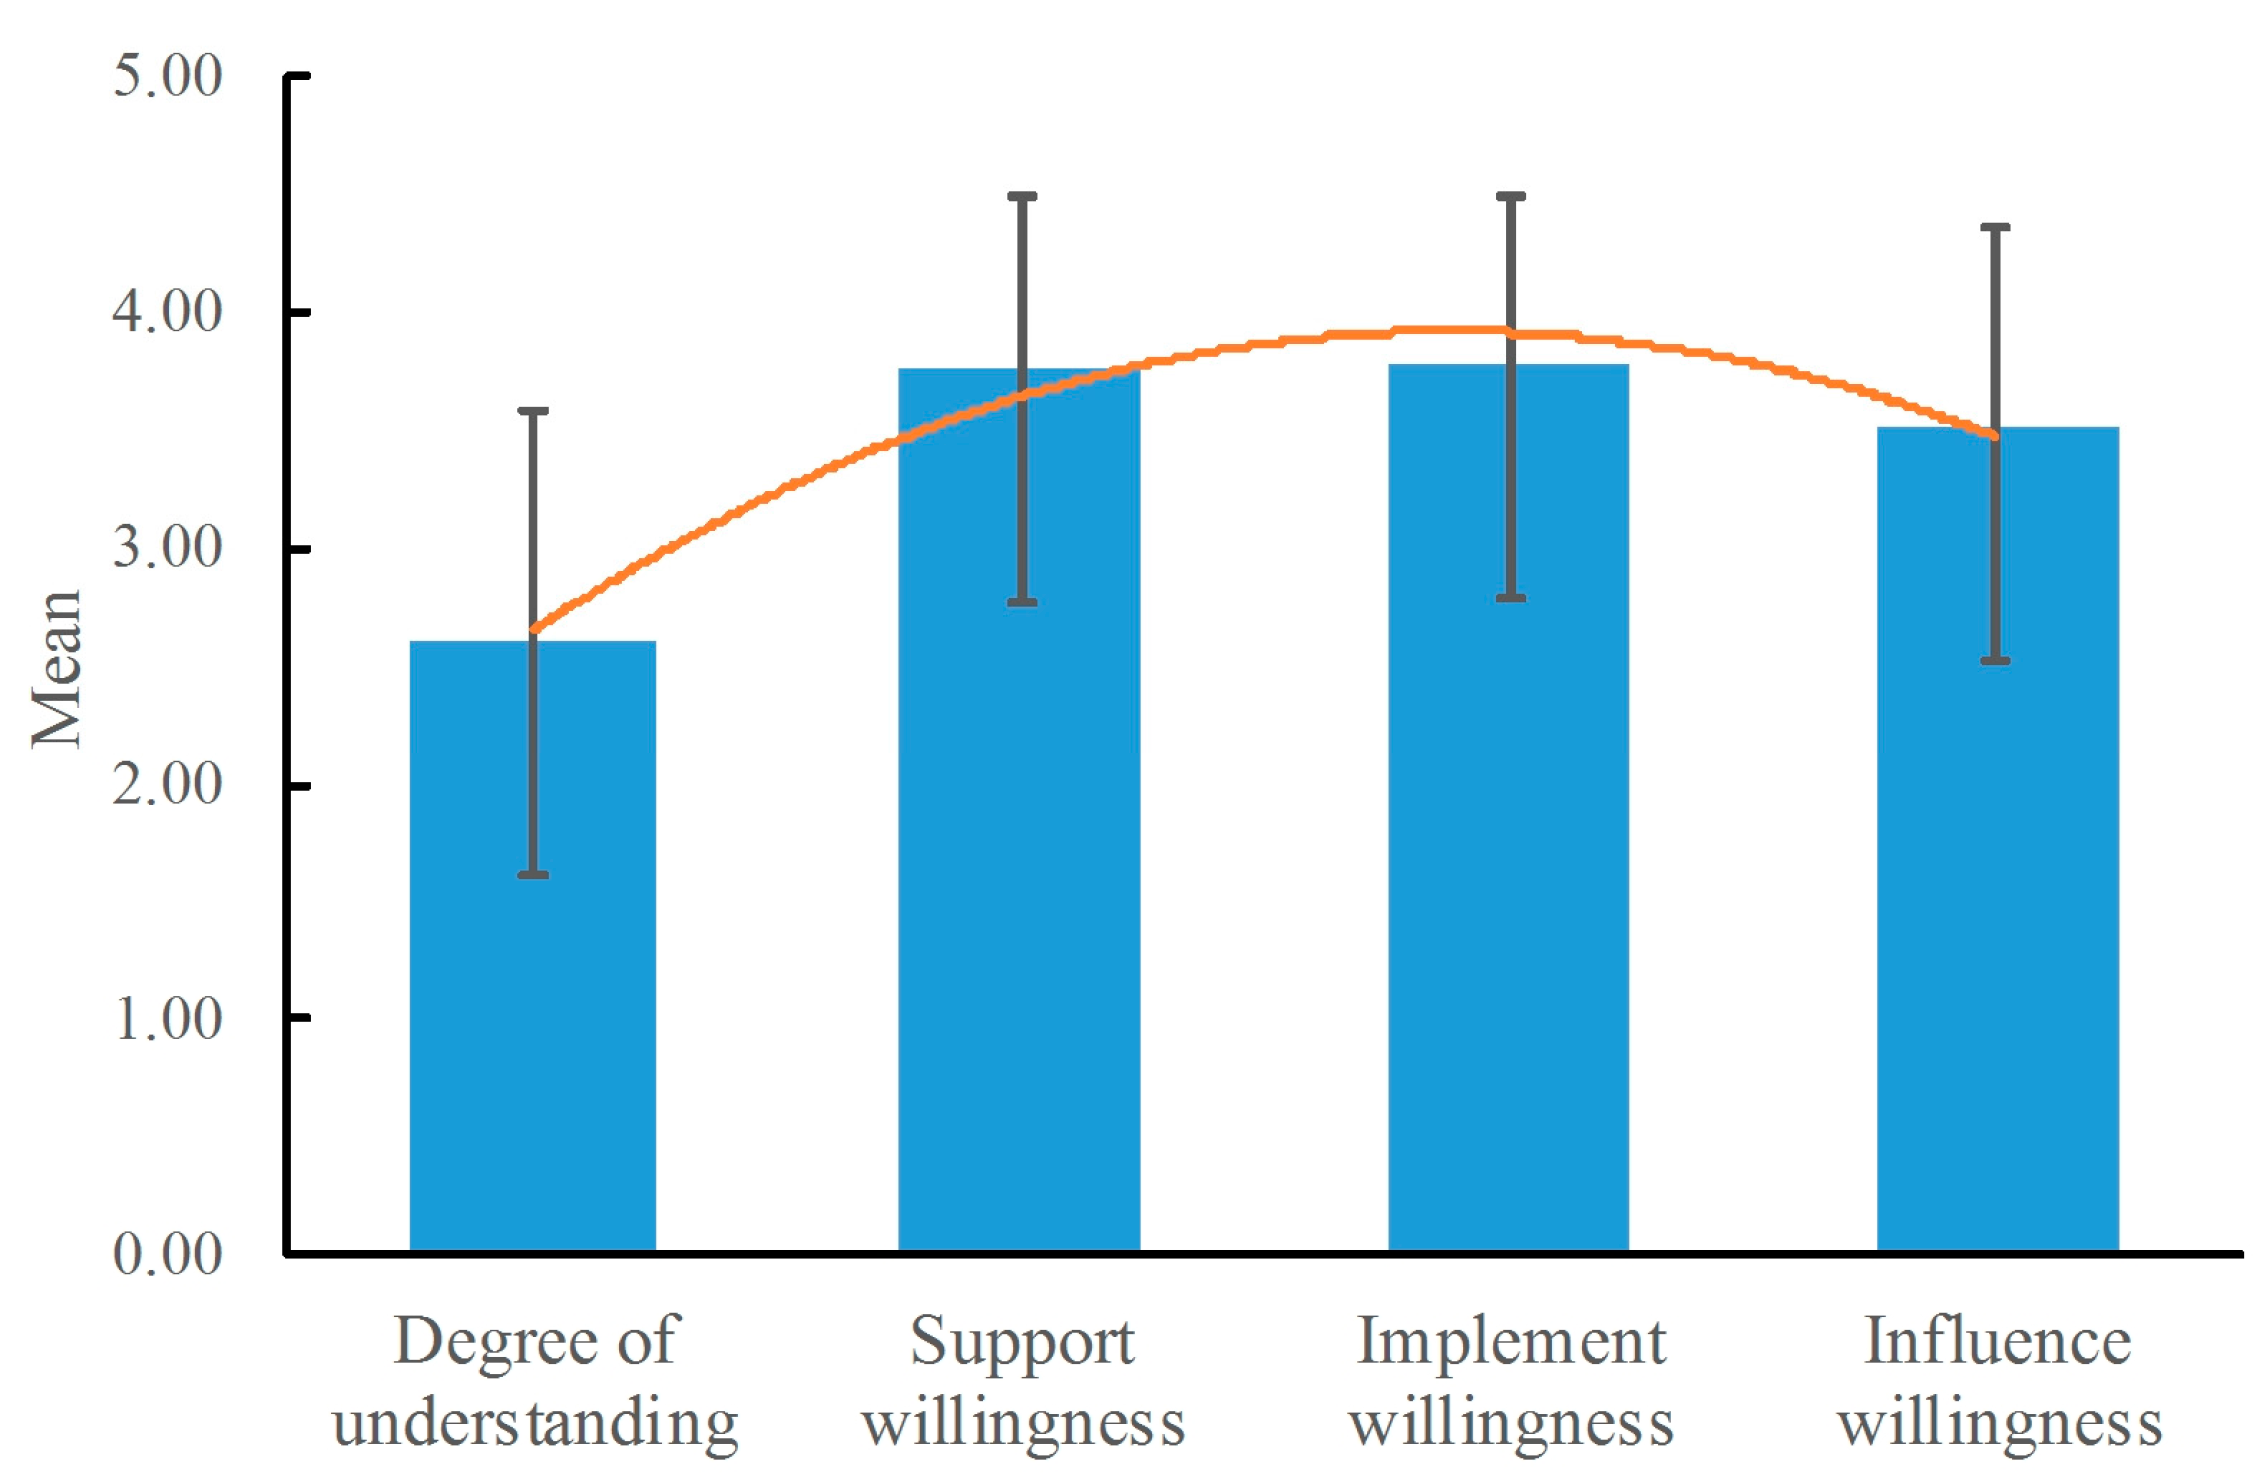
Figure 2.
Diagram of the response of the public’s degree of understanding and support willingness to implement willingness.
Figure 2.
Diagram of the response of the public’s degree of understanding and support willingness to implement willingness.
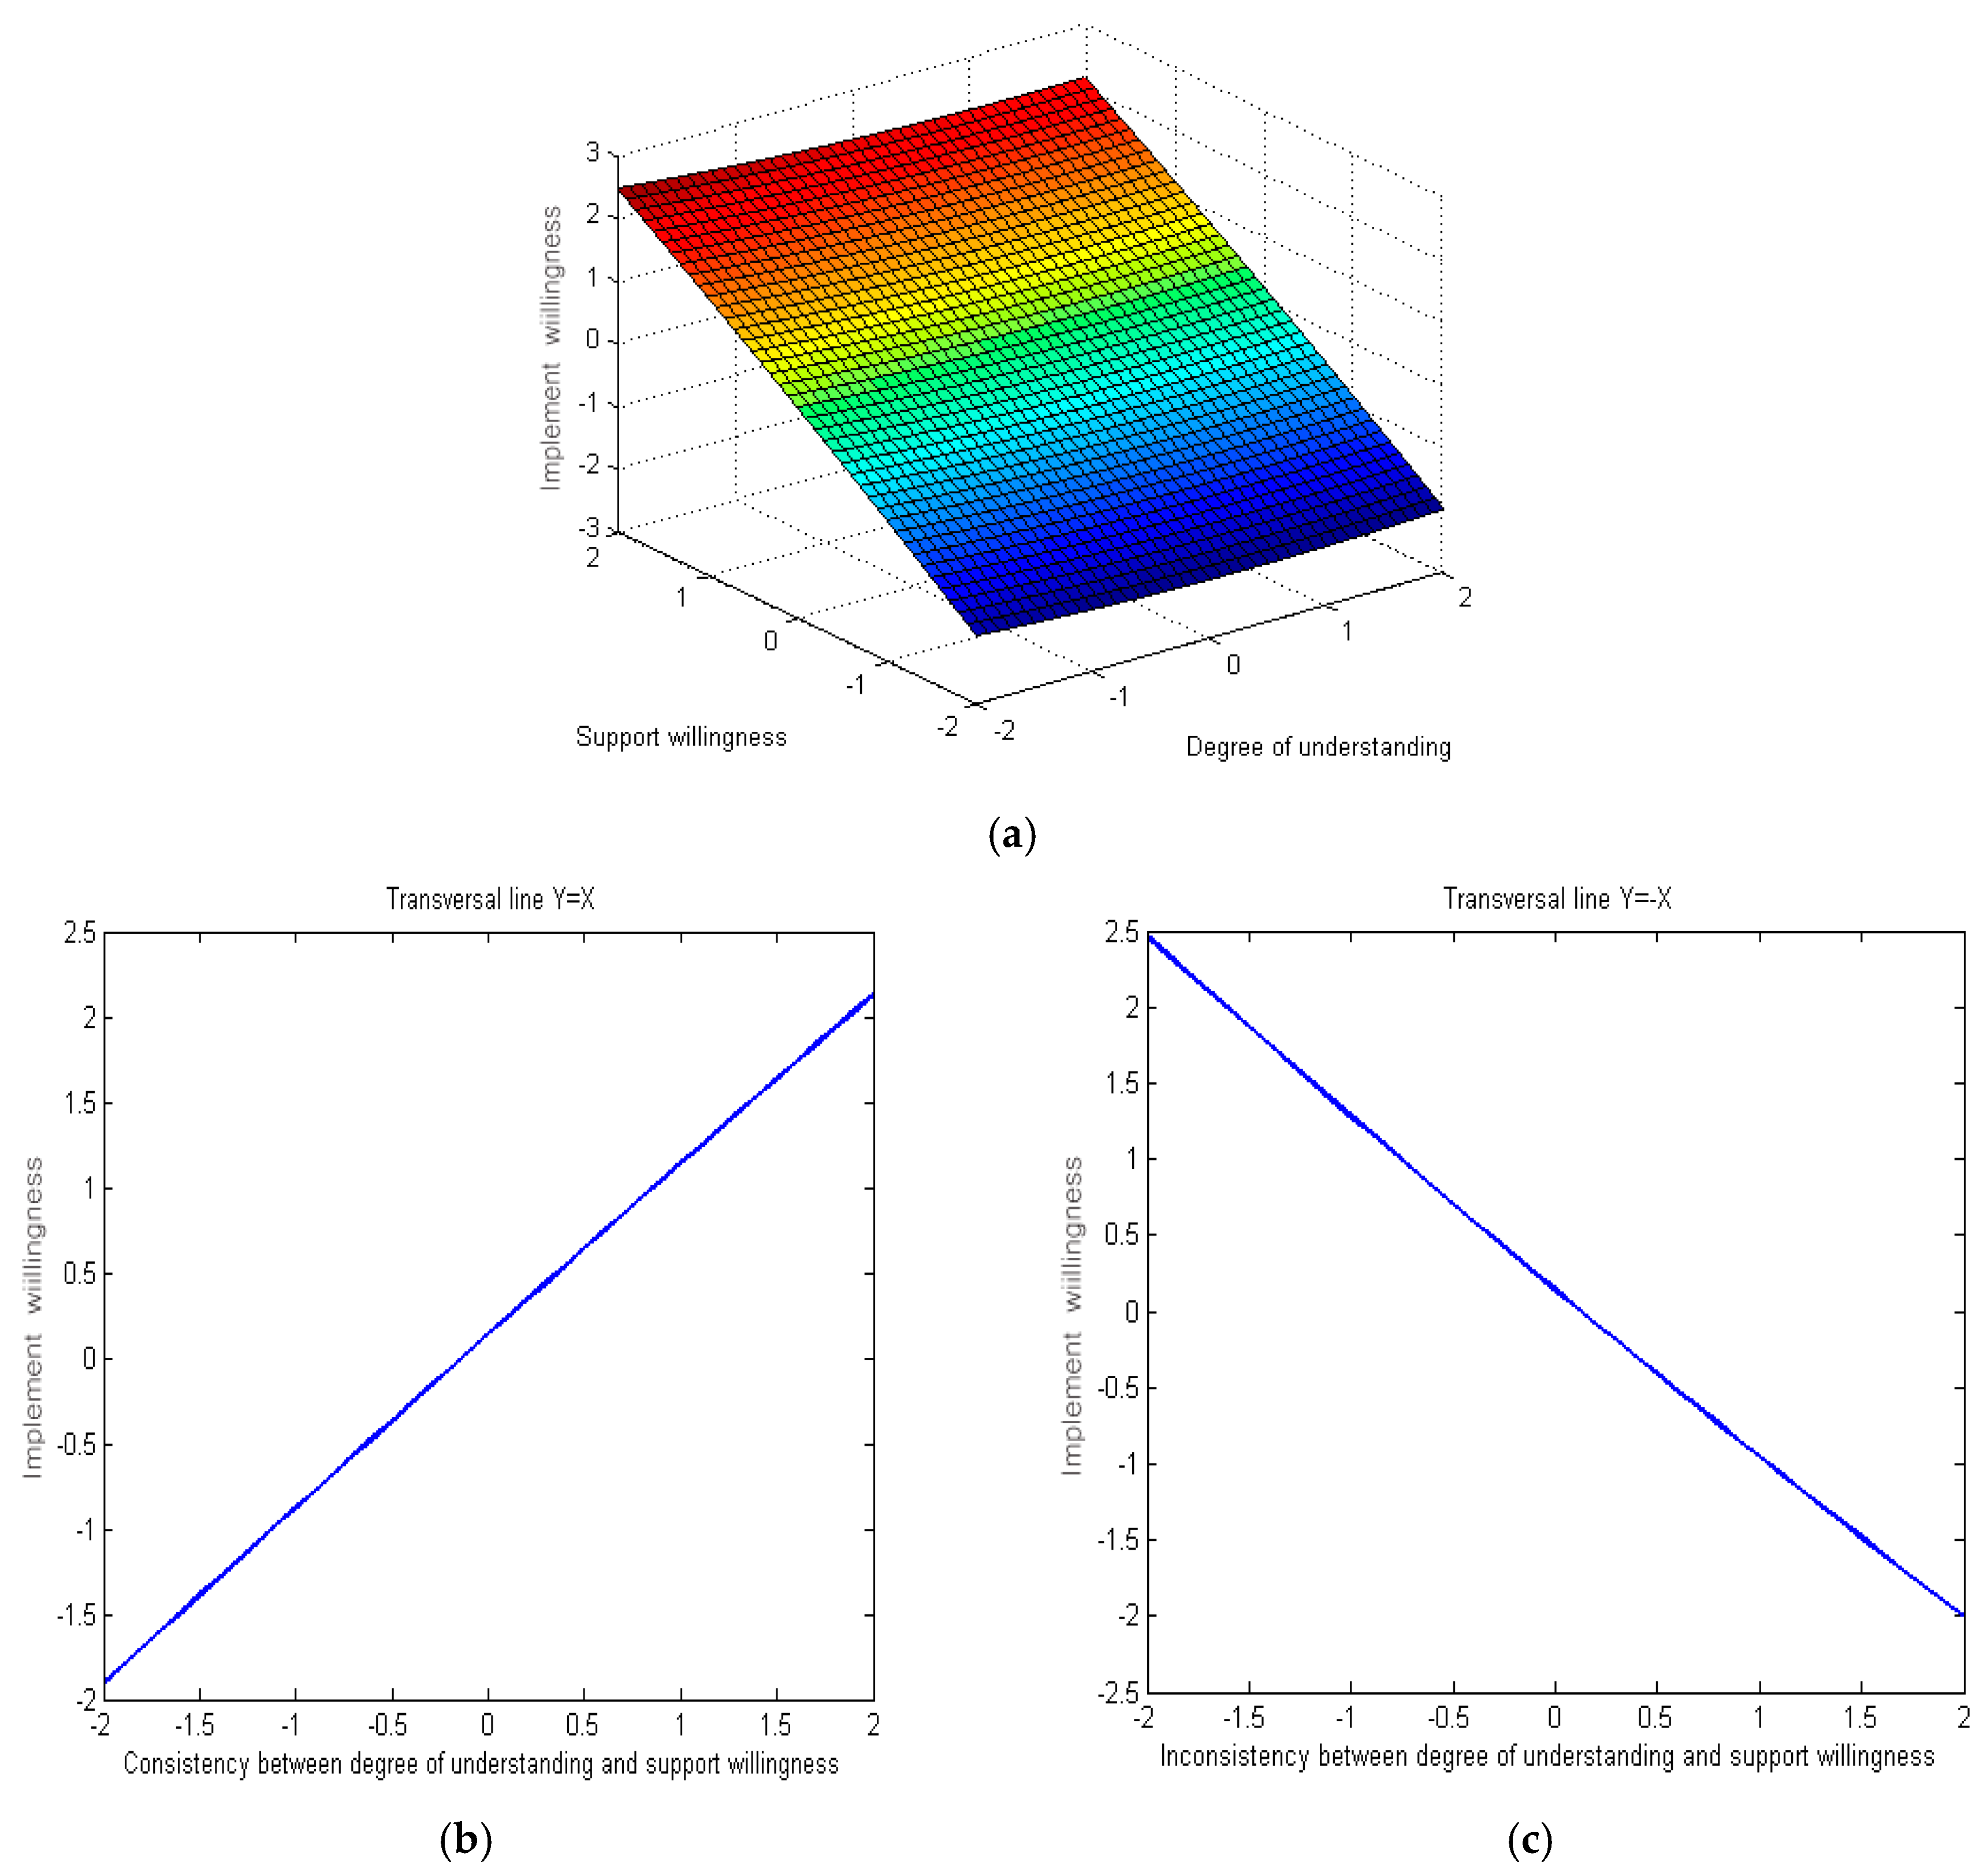
Figure 3.
Diagram of the response of the public’s degree of understanding and support willingness to influence willingness.
Figure 3.
Diagram of the response of the public’s degree of understanding and support willingness to influence willingness.

Figure 4.
Diagram of the response of the degree of understanding and support willingness for different types of policies to implement willingness and influence willingness.
Figure 4.
Diagram of the response of the degree of understanding and support willingness for different types of policies to implement willingness and influence willingness.


Table 1.
Measurement examples of the degree of understanding degree, support willingness, implement willingness, and influence willingness of the policy.
Table 1.
Measurement examples of the degree of understanding degree, support willingness, implement willingness, and influence willingness of the policy.
| Extremely Inconsistent | Relatively Inconsistent | General | Relatively Consistent | Extremely Consistent | |
|---|---|---|---|---|---|
| I understand the specific content of the policy standards | 1 | 2 | 3 | 4 | 5 |
| I support this policy standard | 1 | 2 | 3 | 4 | 5 |
| I will obey or follow this policy standard | 1 | 2 | 3 | 4 | 5 |
| I will promote this policy standard to other people and promote more people to follow it | 1 | 2 | 3 | 4 | 5 |
Classification and Evaluation Standard of Municipal Solid Waste Classification (2005, National Ministry of Construction). Major content: Specification and evaluation standard of classification, delivery, collection and transportation of MSW.
Table 2.
Sample structure.
| Social Demographic Variables | Frequency | Percentage | Social Demographic Variables | Frequency | Percentage | ||
|---|---|---|---|---|---|---|---|
| Gender | Male | 484 | 50.9% | Monthly income | ≤2000 | 121 | 12.7% |
| Female | 467 | 49.1% | 2000–4000 | 233 | 24.6% | ||
| One child | Yes | 385 | 40.5% | 4000–6000 | 294 | 30.9% | |
| No | 566 | 59.5% | 6000–8000 | 117 | 12.3% | ||
| Education background | Junior high school or below | 56 | 5.9% | 8000–10,000 | 82 | 8.6% | |
| Senior high school or technical secondary school | 151 | 15.9% | 10,000–30,000 | 60 | 6.4% | ||
| Junior college | 233 | 24.6% | >30,000 | 42 | 4.4% | ||
| Bachelor | 411 | 43.1% | Monthly family income | ≤2000 | 26 | 2.7% | |
| Master or above | 99 | 10.5% | 2000–4000 | 82 | 8.6% | ||
| Marital status | Unmarried | 249 | 26.2% | 4000–6000 | 130 | 13.6% | |
| Married | 670 | 70.5% | 6000–8000 | 130 | 13.6% | ||
| Divorced | 13 | 1.4% | 8000–10,000 | 237 | 24.9% | ||
| Remarried | 11 | 1.2% | 10,000–30,000 | 290 | 30.5% | ||
| Others | 9 | 0.9% | >30,000 | 56 | 5.9% | ||
| Age | ≤20 | 104 | 10.9% | Number of family members | 1–2 | 108 | 11.4% |
| 21–30 | 203 | 21.4% | 3 | 393 | 41.4% | ||
| 31–40 | 316 | 33.2% | 4 | 268 | 28.2% | ||
| 41–50 | 186 | 19.6% | ≥5 | 182 | 19.1% | ||
| >50 | 142 | 15.0% | |||||
Table 3.
Frequency statistics of the degree of understanding, support willingness, implement willingness, and influence willingness of the policies.
Table 3.
Frequency statistics of the degree of understanding, support willingness, implement willingness, and influence willingness of the policies.
| Extremely Inconsistent | Relatively Inconsistent | General | Relatively Consistent | Extremely Consistent | Inferior Value (Extremely/ Relatively Inconsistent) | |
|---|---|---|---|---|---|---|
| Understand the policy | 25.33% | 17.18% | 33.32% | 17.04% | 7.13% | 42.51% |
| Be willing to support the policy | 1.98% | 4.99% | 31.41% | 34.46% | 27.15% | 6.97% |
| Be willing to implement the policy | 2.07% | 4.74% | 29.78% | 37.50% | 25.93% | 6.81% |
| Be willing to influence others to comply with the policy | 4.84% | 7.68% | 36.32% | 30.15% | 21.01% | 12.52% |
Table 4.
Correlation analysis.
| 1 | 2 | 3 | 4 | ||||||
| 1. DU | 1 | ||||||||
| 2. SW | 0.138 * | 1 | |||||||
| 3. IW1 | 0.177 ** | 0.916 ** | 1 | ||||||
| 4. IW2 | 0.356 ** | 0.640 ** | 0.756 ** | 1 | |||||
| 5 | 6 | 7 | 8 | 9 | 10 | 11 | 12 | ||
| 5. DU/TS | 1 | 9. DU/CC1 | 1 | ||||||
| 6. SW/TS | 0.201 ** | 1 | 10. SW/CC1 | 0.181 ** | 1 | ||||
| 7. IW1/TS | 0.194 ** | 0.893 ** | 1 | 11. IW1/CC1 | 0.232 ** | 0.849 ** | 1 | ||
| 8. IW2/TS | 0.354 ** | 0.678 ** | 0.754 ** | 1 | 12. IW2/CC1 | 0.379 ** | 0.583 ** | 0.729 ** | 1 |
| 13 | 14 | 15 | 16 | 17 | 18 | 19 | 20 | ||
| 13. DU/CC2 | 1 | 17. DU/PS | 1 | ||||||
| 14. SW/CC2 | 0.240 ** | 1 | 18. SW/PS | 0.112 | 1 | ||||
| 15. IW1/CC2 | 0.271 ** | 0.928 ** | 1 | 19. IW1/PS | 0.153 * | 0.913 ** | 1 | ||
| 16. IW2/CC2 | 0.394 ** | 0.709 ** | 0.793 ** | 1 | 20. IW2/PS | 0.306 ** | 0.659 ** | 0.779 ** | 1 |
Note: “DU” indicates degree of understanding, “SW” indicates support willingness, “IW1” indicates implement willingness, “IW2” indicates influence willingness, “TS” indicates technical standard policy, “CC1” indicates charge collection policy, “CC2” indicates command and control policy, and “PS” indicates participation and supervision policy. * indicates p < 0.05, ** indicates p < 0.01, *** indicates p < 0.001.
Table 5.
Regression analysis of the response of the policies’ degree of understanding and support willingness to implement willingness and influence willingness.
Table 5.
Regression analysis of the response of the policies’ degree of understanding and support willingness to implement willingness and influence willingness.
| Variable | Implement M1 | Implement M2 | Influence M1 | Influence M2 |
|---|---|---|---|---|
| Constant | 0.335 ** | 0.137 | 0.256 | −0.168 |
| Understanding | 0.037 | −0.054 | 0.236 *** | −0.039 |
| Support | 0.889 *** | 1.063 *** | 0.701 *** | 1.129 ** |
| Understanding*Understanding | 0.028 | 0.027 | ||
| Support*Support | −0.020 | −0.067 | ||
| Understanding*Support | −0.015 | 0.031 | ||
| Adjustment R2 | 0.840 | 0.842 | 0.478 | 0.475 |
Note: * indicates p < 0.05, ** indicates p < 0.01, *** indicates p < 0.001.
Table 6.
Regression analysis of the response of different types of policies’ degree of understanding and support willingness to implement willingness and influence willingness.
Table 6.
Regression analysis of the response of different types of policies’ degree of understanding and support willingness to implement willingness and influence willingness.
| Variable | Implement M1 | Implement M2 | Influence M1 | Influence M2 | Implement M1 | Implement M2 | Influence M1 | Influence M2 |
|---|---|---|---|---|---|---|---|---|
| Technical standard | Charge collection | |||||||
| Constant | 0.458 *** | 0.170 | 0.263 | 0.020 | 0.575 *** | 0.554 | 0.641 ** | 0.448 |
| Understanding | 0.012 | −0.181 | 0.207 *** | 0.006 | 0.062 * | 0.226 | 0.246 *** | 0.411 |
| Support | 0.872 *** | 1.173 *** | 0.708 *** | 0.988 ** | 0.811 *** | 0.704 *** | 0.591 *** | 0.589 |
| Understanding*Understanding | 0.044 | 0.027 | 0.046 | 0.009 | ||||
| Support*Support | −0.041 | −0.043 | 0.041 | 0.015 | ||||
| Understanding*Support | −0.008 | 0.014 | −0.098 | −0.053 | ||||
| Adjustment R2 | 0.796 | 0.797 | 0.505 | 0.500 | 0.724 | 0.729 | 0.412 | 0.406 |
| Command and control | Participation and supervision | |||||||
| Constant | 0.282 ** | 0.277 | 0.098 | −0.324 | 0.325 ** | 0.651 | 0.312 | 0.532 |
| Understanding | 0.037 | −0.013 | 0.206 *** | 0.073 | 0.036 | 0.105 | 0.196 *** | 0.236 |
| Support | 0.901 *** | 0.939 *** | 0.757 *** | 1.202 ** | 0.890 *** | 0.657 ** | 0.727 *** | 0.574 |
| Understanding*Understanding | 0.024 | 0.050 | 0.012 | −0.009 | ||||
| Support*Support | 0.000 | −0.061 | 0.039 | 0.020 | ||||
| Understanding*Support | −0.020 | 0.000 | −0.030 | 0.002 | ||||
| Adjustment R2 | 0.863 | 0.862 | 0.552 | 0.550 | 0.834 | 0.835 | 0.484 | 0.477 |
Note: * indicates p < 0.05, ** indicates p < 0.01, *** indicates p < 0.001.
Table 7.
The response of the public’s degree of understanding and support willingness to implement willingness and influence willingness.
Table 7.
The response of the public’s degree of understanding and support willingness to implement willingness and influence willingness.
| Types of the Policies | Implement Willingness | Influence Willingness | ||
|---|---|---|---|---|
| Y = X Transversal Line (Congruence) | Y = −X Transversal Line (Dis-Congruence) | Y = X Transversal Line (Congruence) | Y = −X Transversal Line (Dis-Congruence) | |
| Technical standard | congruence , implement willingness | dis-congruence , implement willingness | congruence , implement willingness | dis-congruence , implement willingness |
| Charge collection | congruence , implement willingness | Inverted sequence: dis-congruence , implement willingness Forward sequence: dis-congruence , implement willingness | congruence , implement willingness | Inverted sequence: dis-congruence , implement willingness Forward sequence: dis-congruence , implement willingness |
| Command and control | congruence , implement willingness | dis-congruence , implement willingness | congruence , implement willingness | dis-congruence , implement willingness |
| Participation and supervision | congruence , implement willingness | dis-congruence , implement willingness | congruence , implement willingness | dis-congruence , implement willingness |
© 2017 by the authors. Licensee MDPI, Basel, Switzerland. This article is an open access article distributed under the terms and conditions of the Creative Commons Attribution (CC BY) license (http://creativecommons.org/licenses/by/4.0/).
Share and Cite
MDPI and ACS Style
Chen, F.; Chen, H.; Huang, X.; Long, R.; Lu, H.; Yue, T. Public Response to the Regulation Policy of Urban Household Waste: Evidence from a Survey of Jiangsu Province in China. Sustainability 2017, 9, 1034. https://doi.org/10.3390/su9061034
AMA Style
Chen F, Chen H, Huang X, Long R, Lu H, Yue T. Public Response to the Regulation Policy of Urban Household Waste: Evidence from a Survey of Jiangsu Province in China. Sustainability. 2017; 9(6):1034. https://doi.org/10.3390/su9061034
Chicago/Turabian StyleChen, Feiyu, Hong Chen, Xinru Huang, Ruyin Long, Hui Lu, and Ting Yue. 2017. "Public Response to the Regulation Policy of Urban Household Waste: Evidence from a Survey of Jiangsu Province in China" Sustainability 9, no. 6: 1034. https://doi.org/10.3390/su9061034
Note that from the first issue of 2016, this journal uses article numbers instead of page numbers. See further details here.