Assessing the Effect of Carbon Tariffs on International Trade and Emission Reduction of China’s Industrial Products under the Background of Global Climate Governance


Abstract
:1. Introduction
2. Literature Review
2.1. Research on the Effect of a Carbon Tariff on the Economy and Trade
2.2. Research on the Effect of a Carbon Tariff on Carbon Emission Reduction
2.3. Research on a Carbon Tariff by the GTAP Model
3. GTAP Model Specification
3.1. The Introduction of the GTAP Model
3.2. Area Dimensions
3.3. Sector Dimensions
3.4. Setting Situation
3.5. Calculation of a Carbon Tariff
4. The Effect of Carbon Tariffs on China’s Industrial Sector
4.1. Changes of Exports in China’s Industrial Sector
4.2. Changes of Imports in China’s Industrial Sector
4.3. Changes of Output in China’s Industrial Sector
4.4. Impact of a Carbon Tariff on Carbon Emission Reduction in China’s Industrial Sector
5. Conclusions and Suggestions
5.1. Conclusions
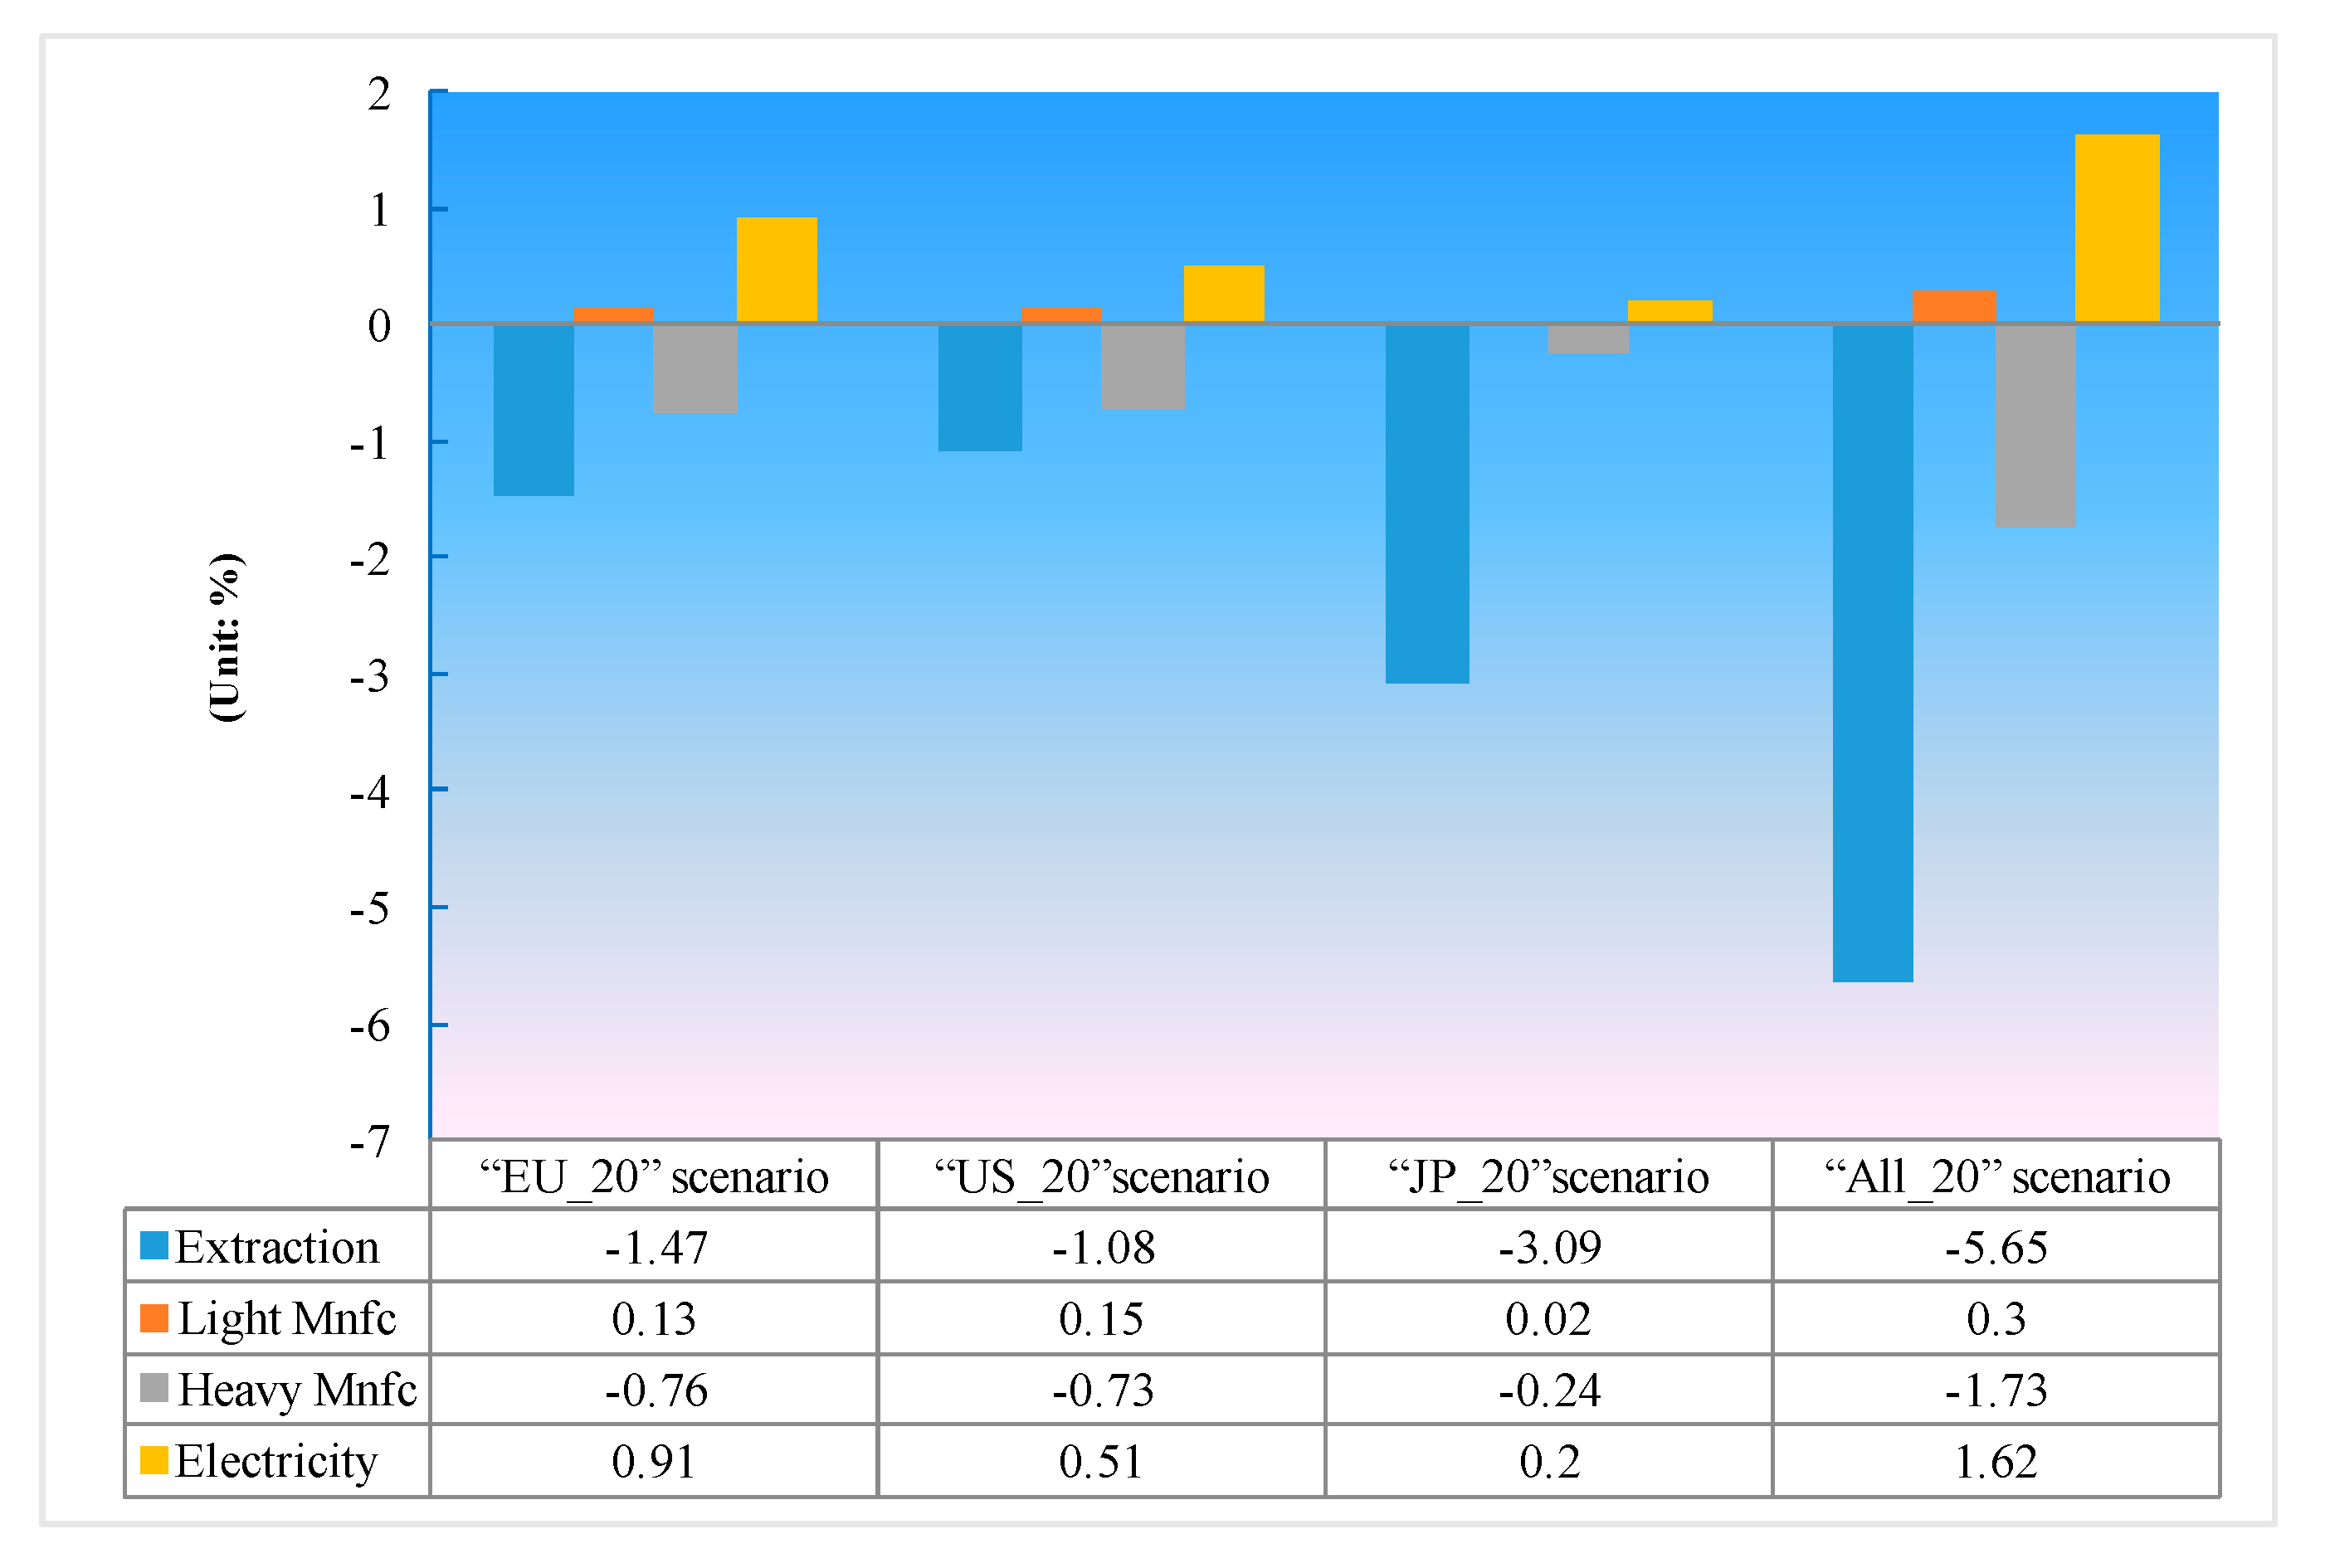
- (1)
- A carbon tariff will cause a decrease in exports for high-carbon industries and generate an increase in exports for low-carbon industries. The simulation outcome shows that, under the four scenarios, high-carbon emission industries, like the extraction industry and heavy industry, will suffer a decrease in exports and low carbon emission industries, like light industry and electricity power, will receive an increase. Since the extraction industry makes up the greatest proportion in China’s industrial exports to Japan, its exports decrease more among all of the industrial sectors under the scenario of a single carbon tariff by Japan. For heavy industry, China’s exports take up a relatively larger share in the EU and US rather than Japan, so China’s heavy industry exports decrease more under the scenario of a carbon tariff by the EU or the US than that of Japan. For electrical power and light industry, they have a low carbon emission advantage, so the exports in these two sectors can see an increasing trend under all of the four scenarios.
- (2)
- A carbon tariff will cause a greater reduction on imports for low-carbon industries than that for high-carbon industries. Under all four scenarios, carbon tariffs will cause a decrease in China’s imports of its industrial sectors. Since China imports more industrial products from the EU and the US, a carbon tariff by the EU or the US has a larger negative effect on China’s imports than that by Japan. When the carbon tariff of All_20 is imposed, imports in industrial sectors suffer the largest negative influence. At the same time, light industry and the electrical power industry with low-carbon intensity will face a decrease in exports less than the extraction industry and heavy industry. This is mainly due to the substitution effect between imports and domestic products. A carbon tariff on the extraction industry and heavy industry with high carbon emission intensity can cause a decline in its exports, and then the output of production will decline and excessive production capacity will be turned to sectors with low carbon emission intensity. This increased output can help to meet the domestic demand and eventually cause a decrease in demand for imports.
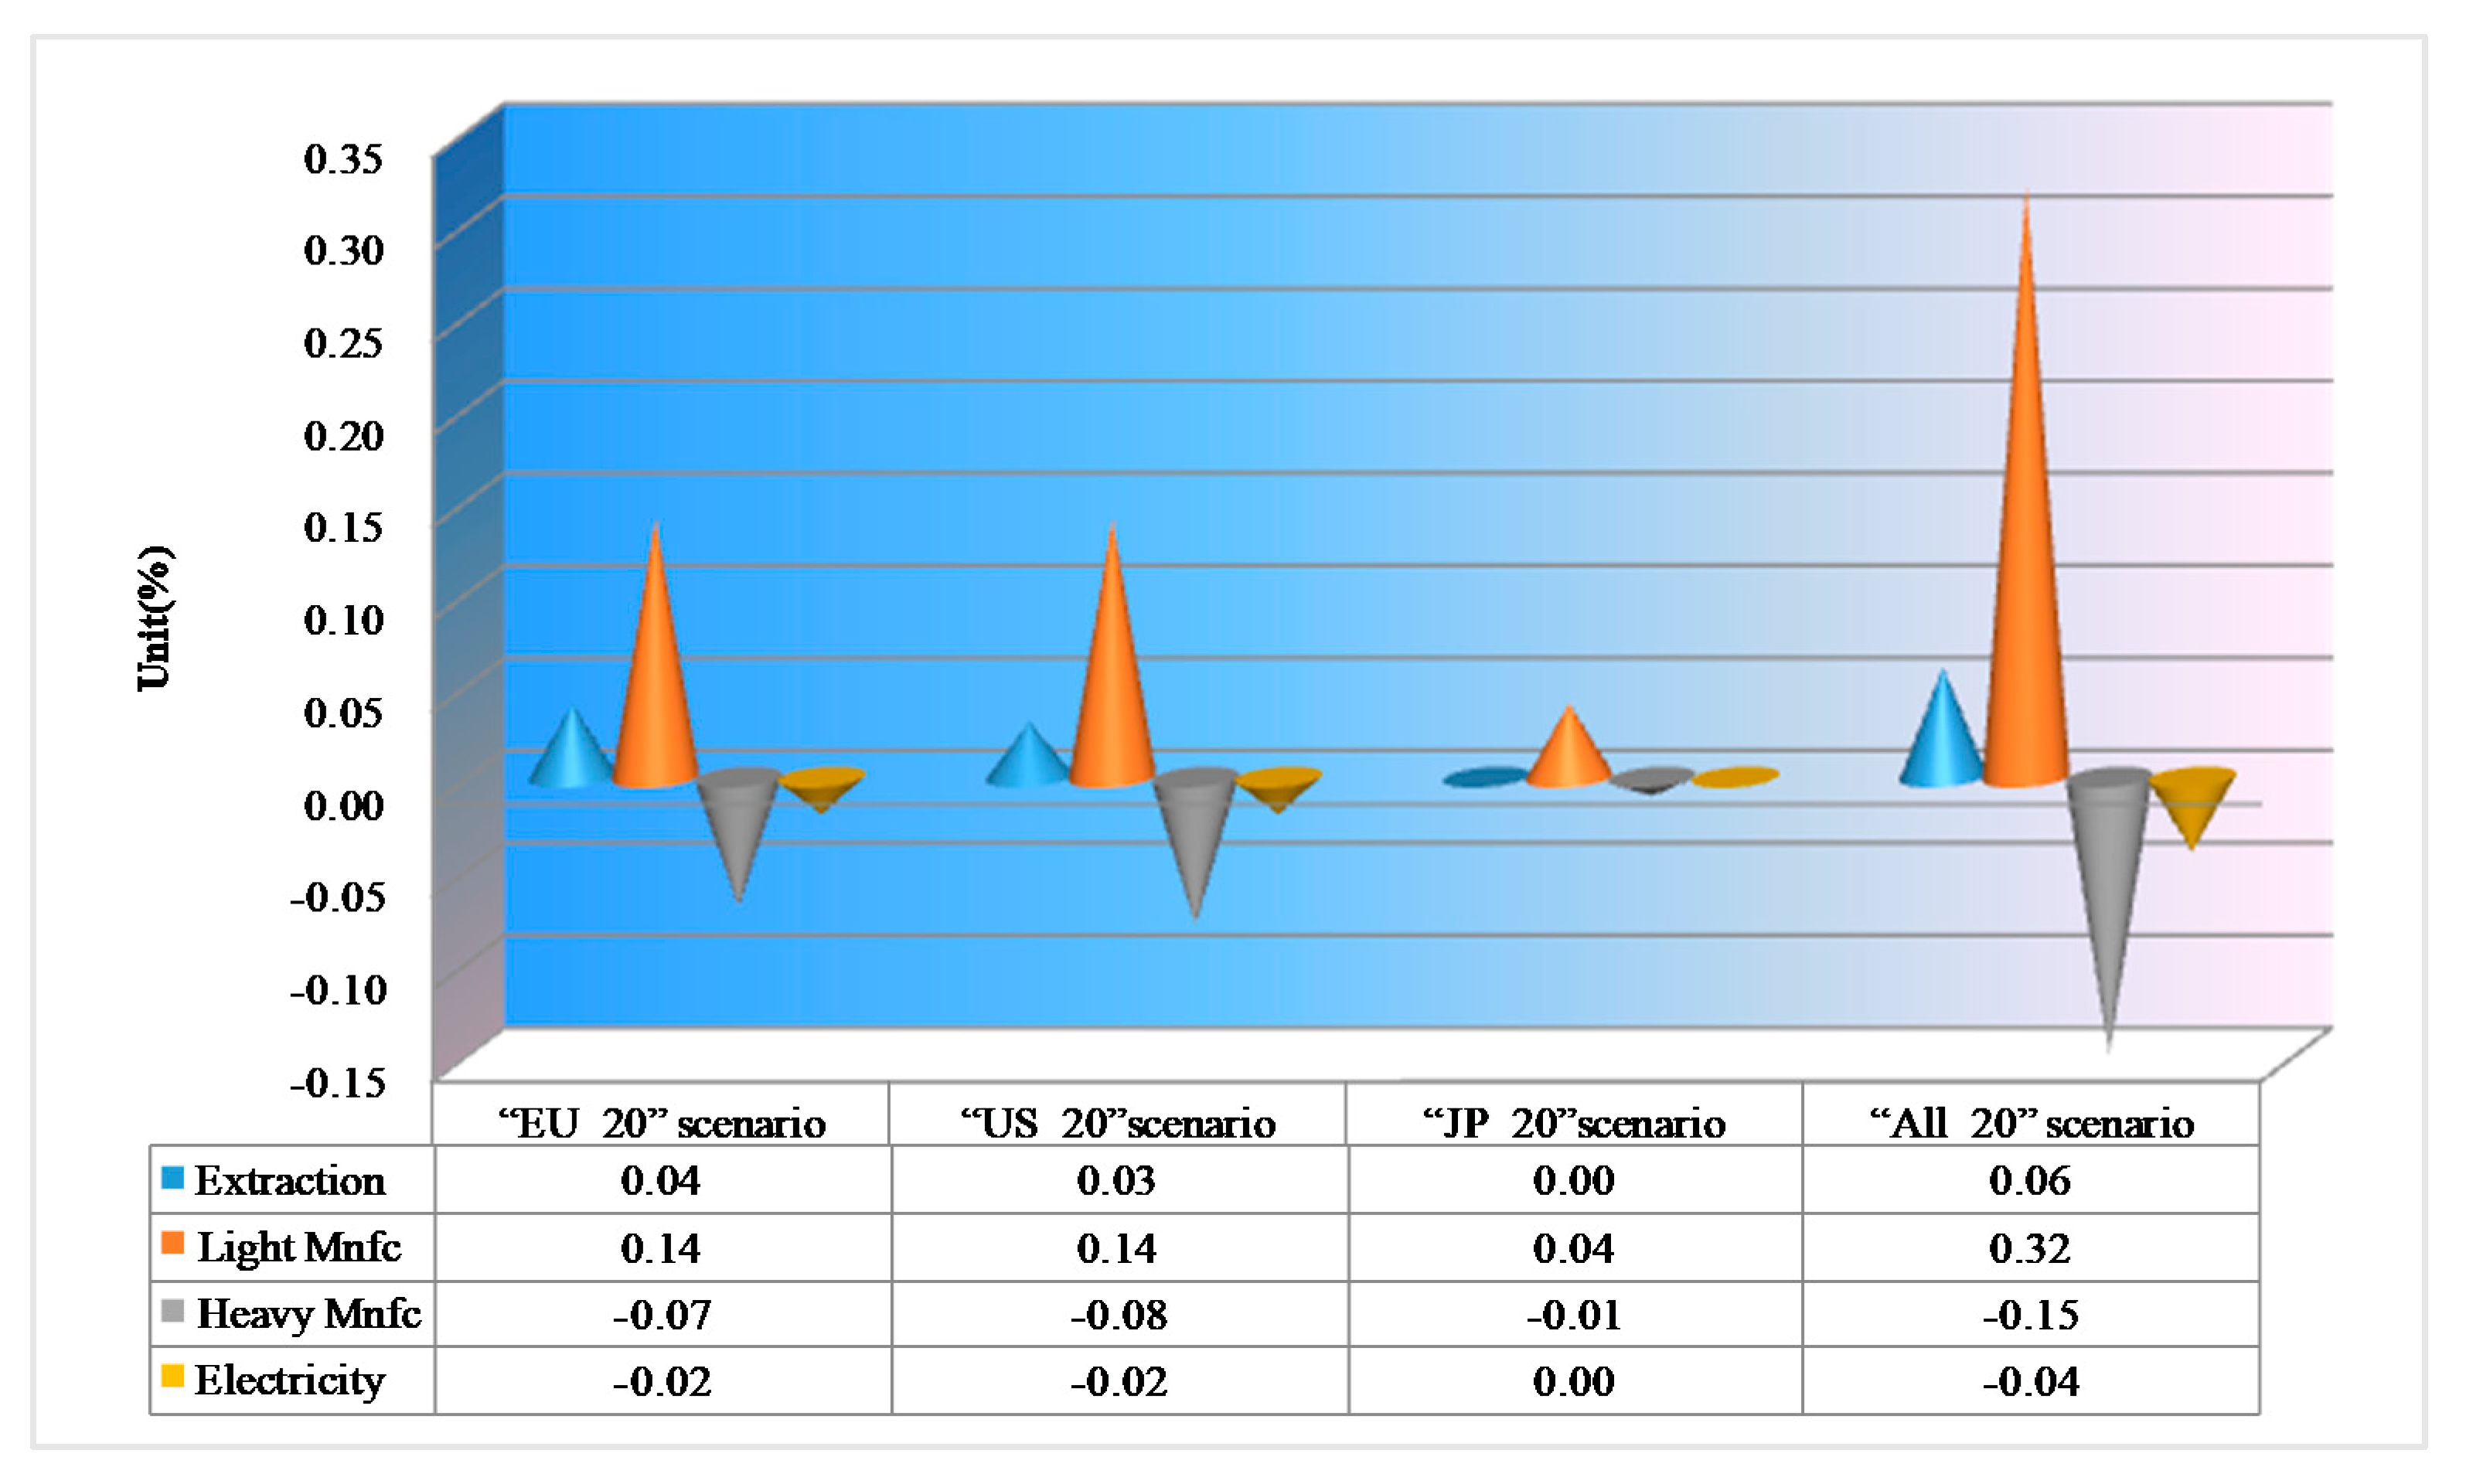
- (3)
- A carbon tariff will also generate a noticeable increase in output for light industry and a decrease in output for heavy industry. Under all four scenarios, a carbon tariff can bring higher output in China’s light industry and the extraction industry and cause downward output in heavy industry and the electrical power industry. Under the scenario of All_20, output in light industry and the extraction industry increase by 0.32% and 0.06%, respectively, while output in heavy industry and the electrical power industry decrease by 0.15% and 0.04%, respectively. Changes in output are mainly caused by changes in imports and exports. Thus, the output of heavy industry with a high carbon emission intensity will decrease as a result of a carbon tariff. Then production capacity will be transformed to light industry, which has relatively low carbon emission intensity, while for the electrical power industry, it does not collect carbon traffic; however, the production of this industry relays energy (especially coal, which accounts for 68.7%). When the cost for energy increases, the production of the electrical power industry decreases.
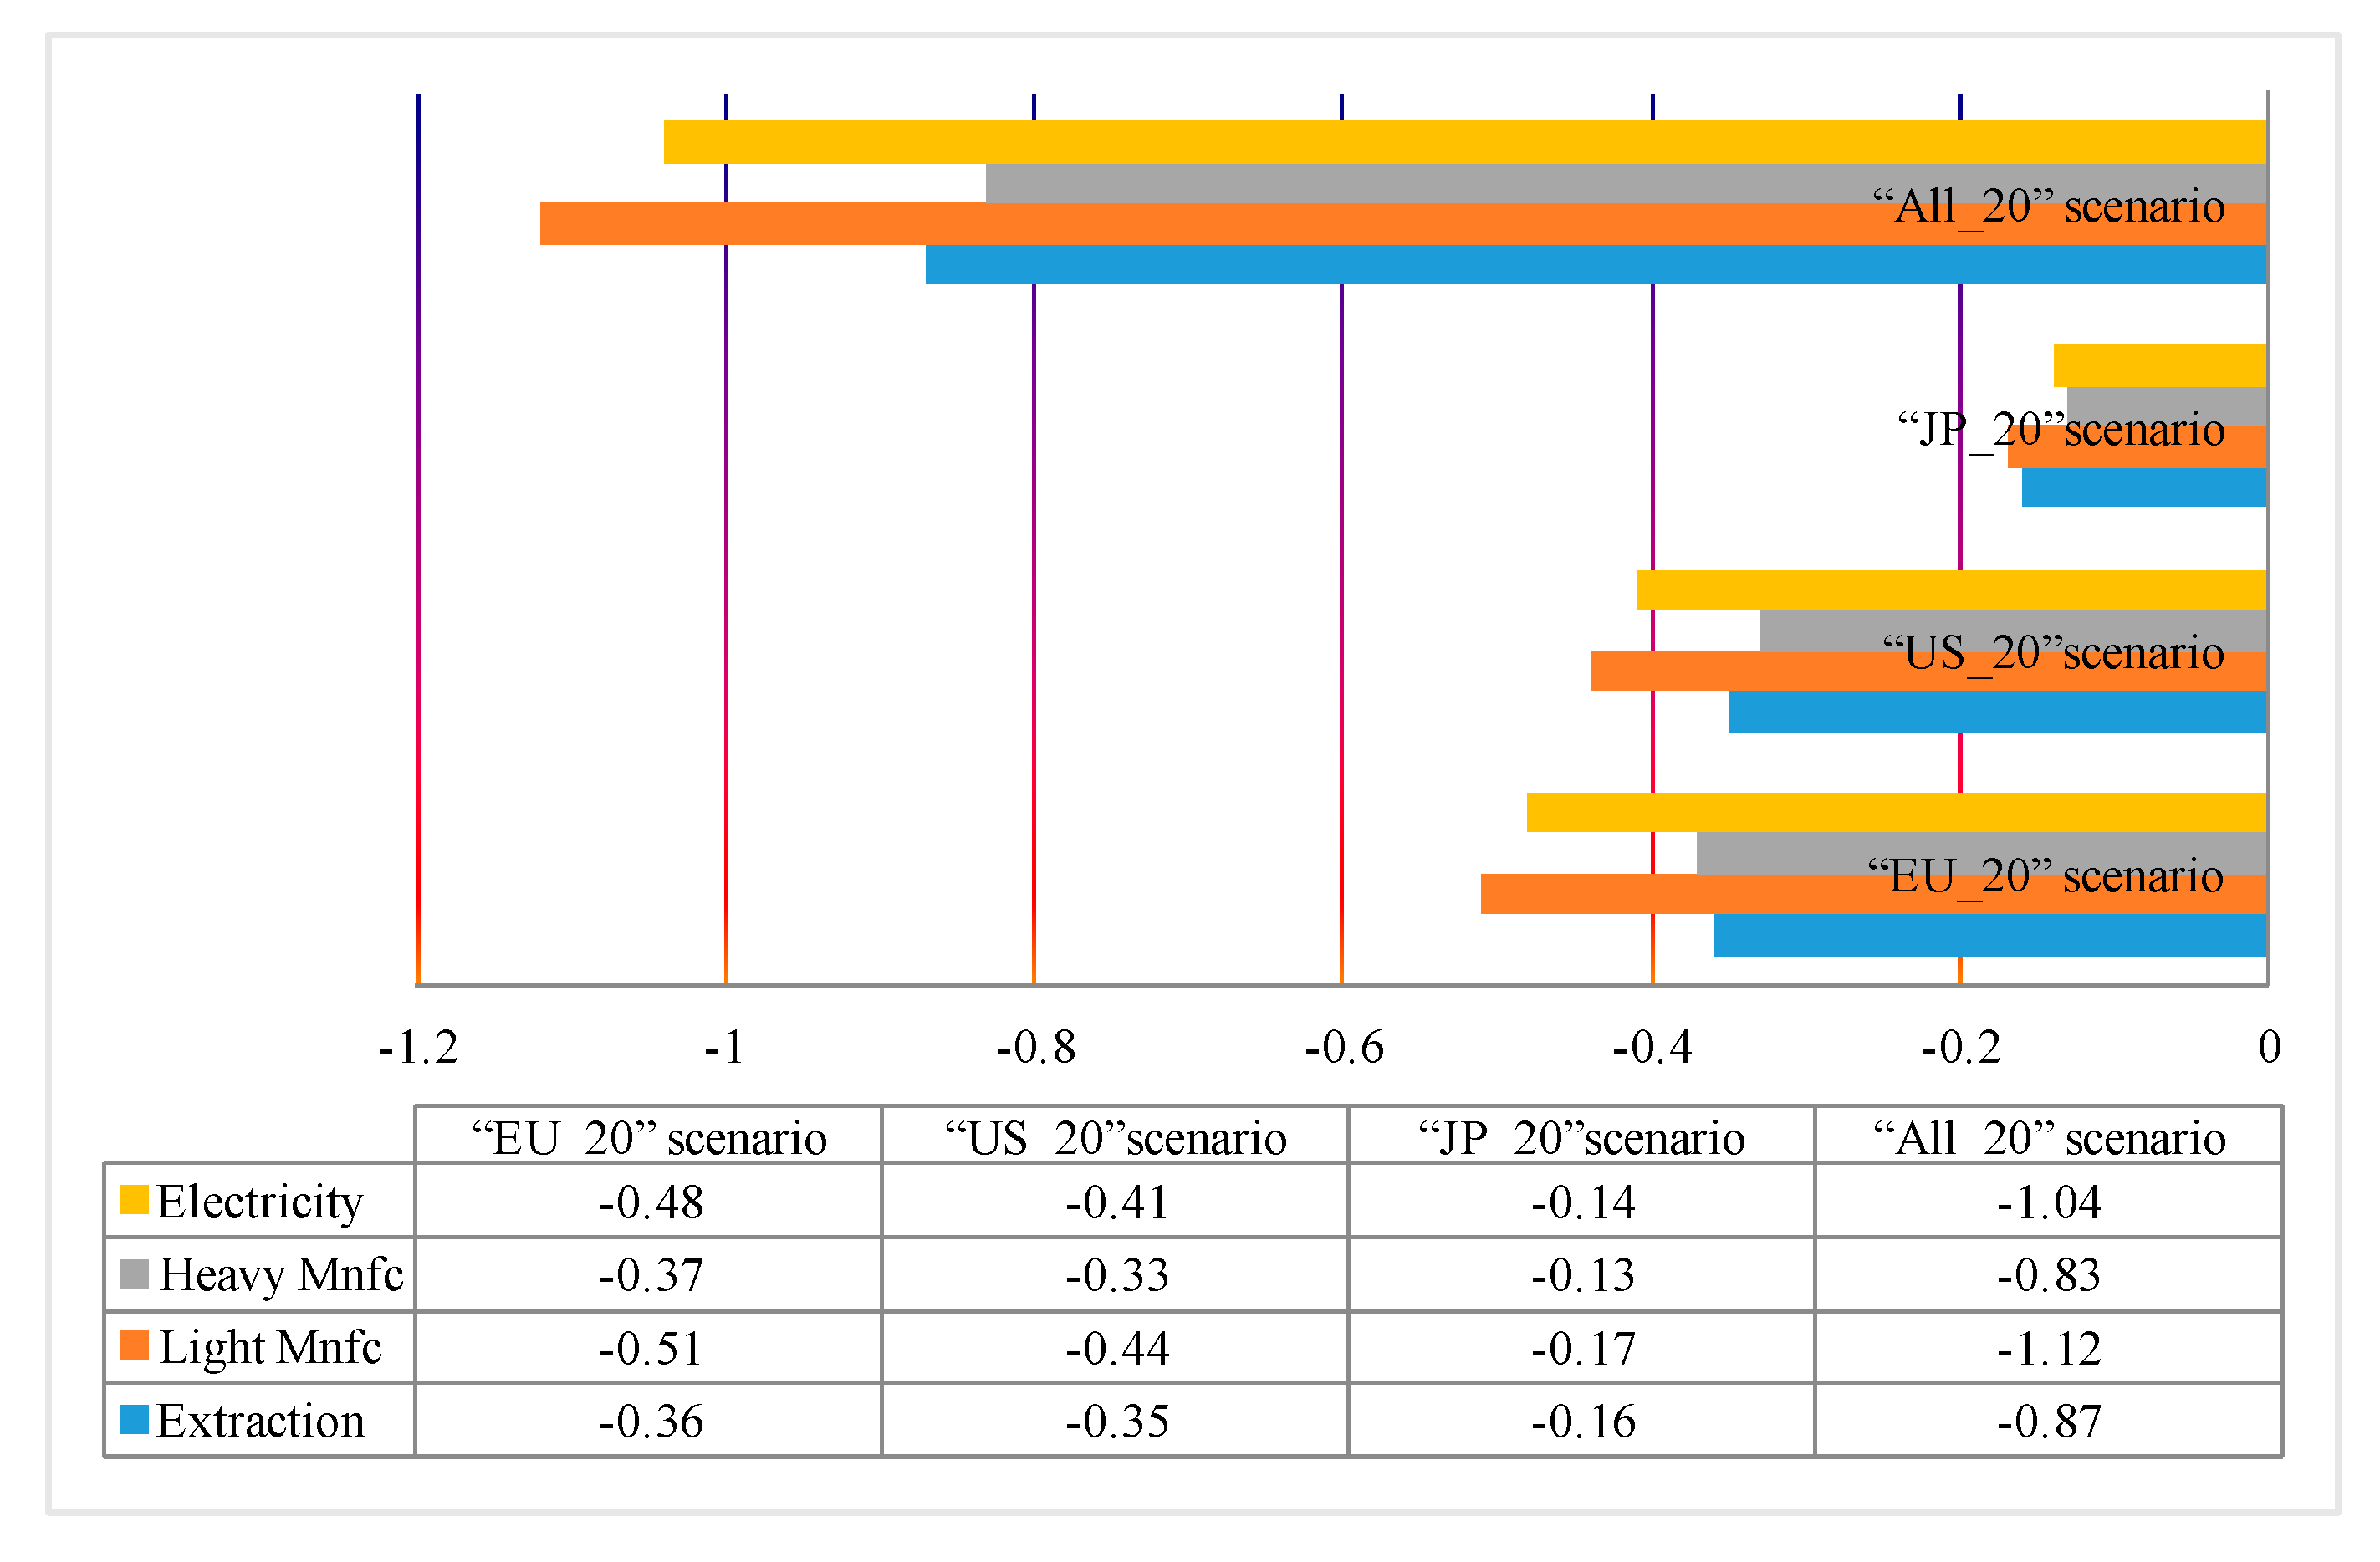
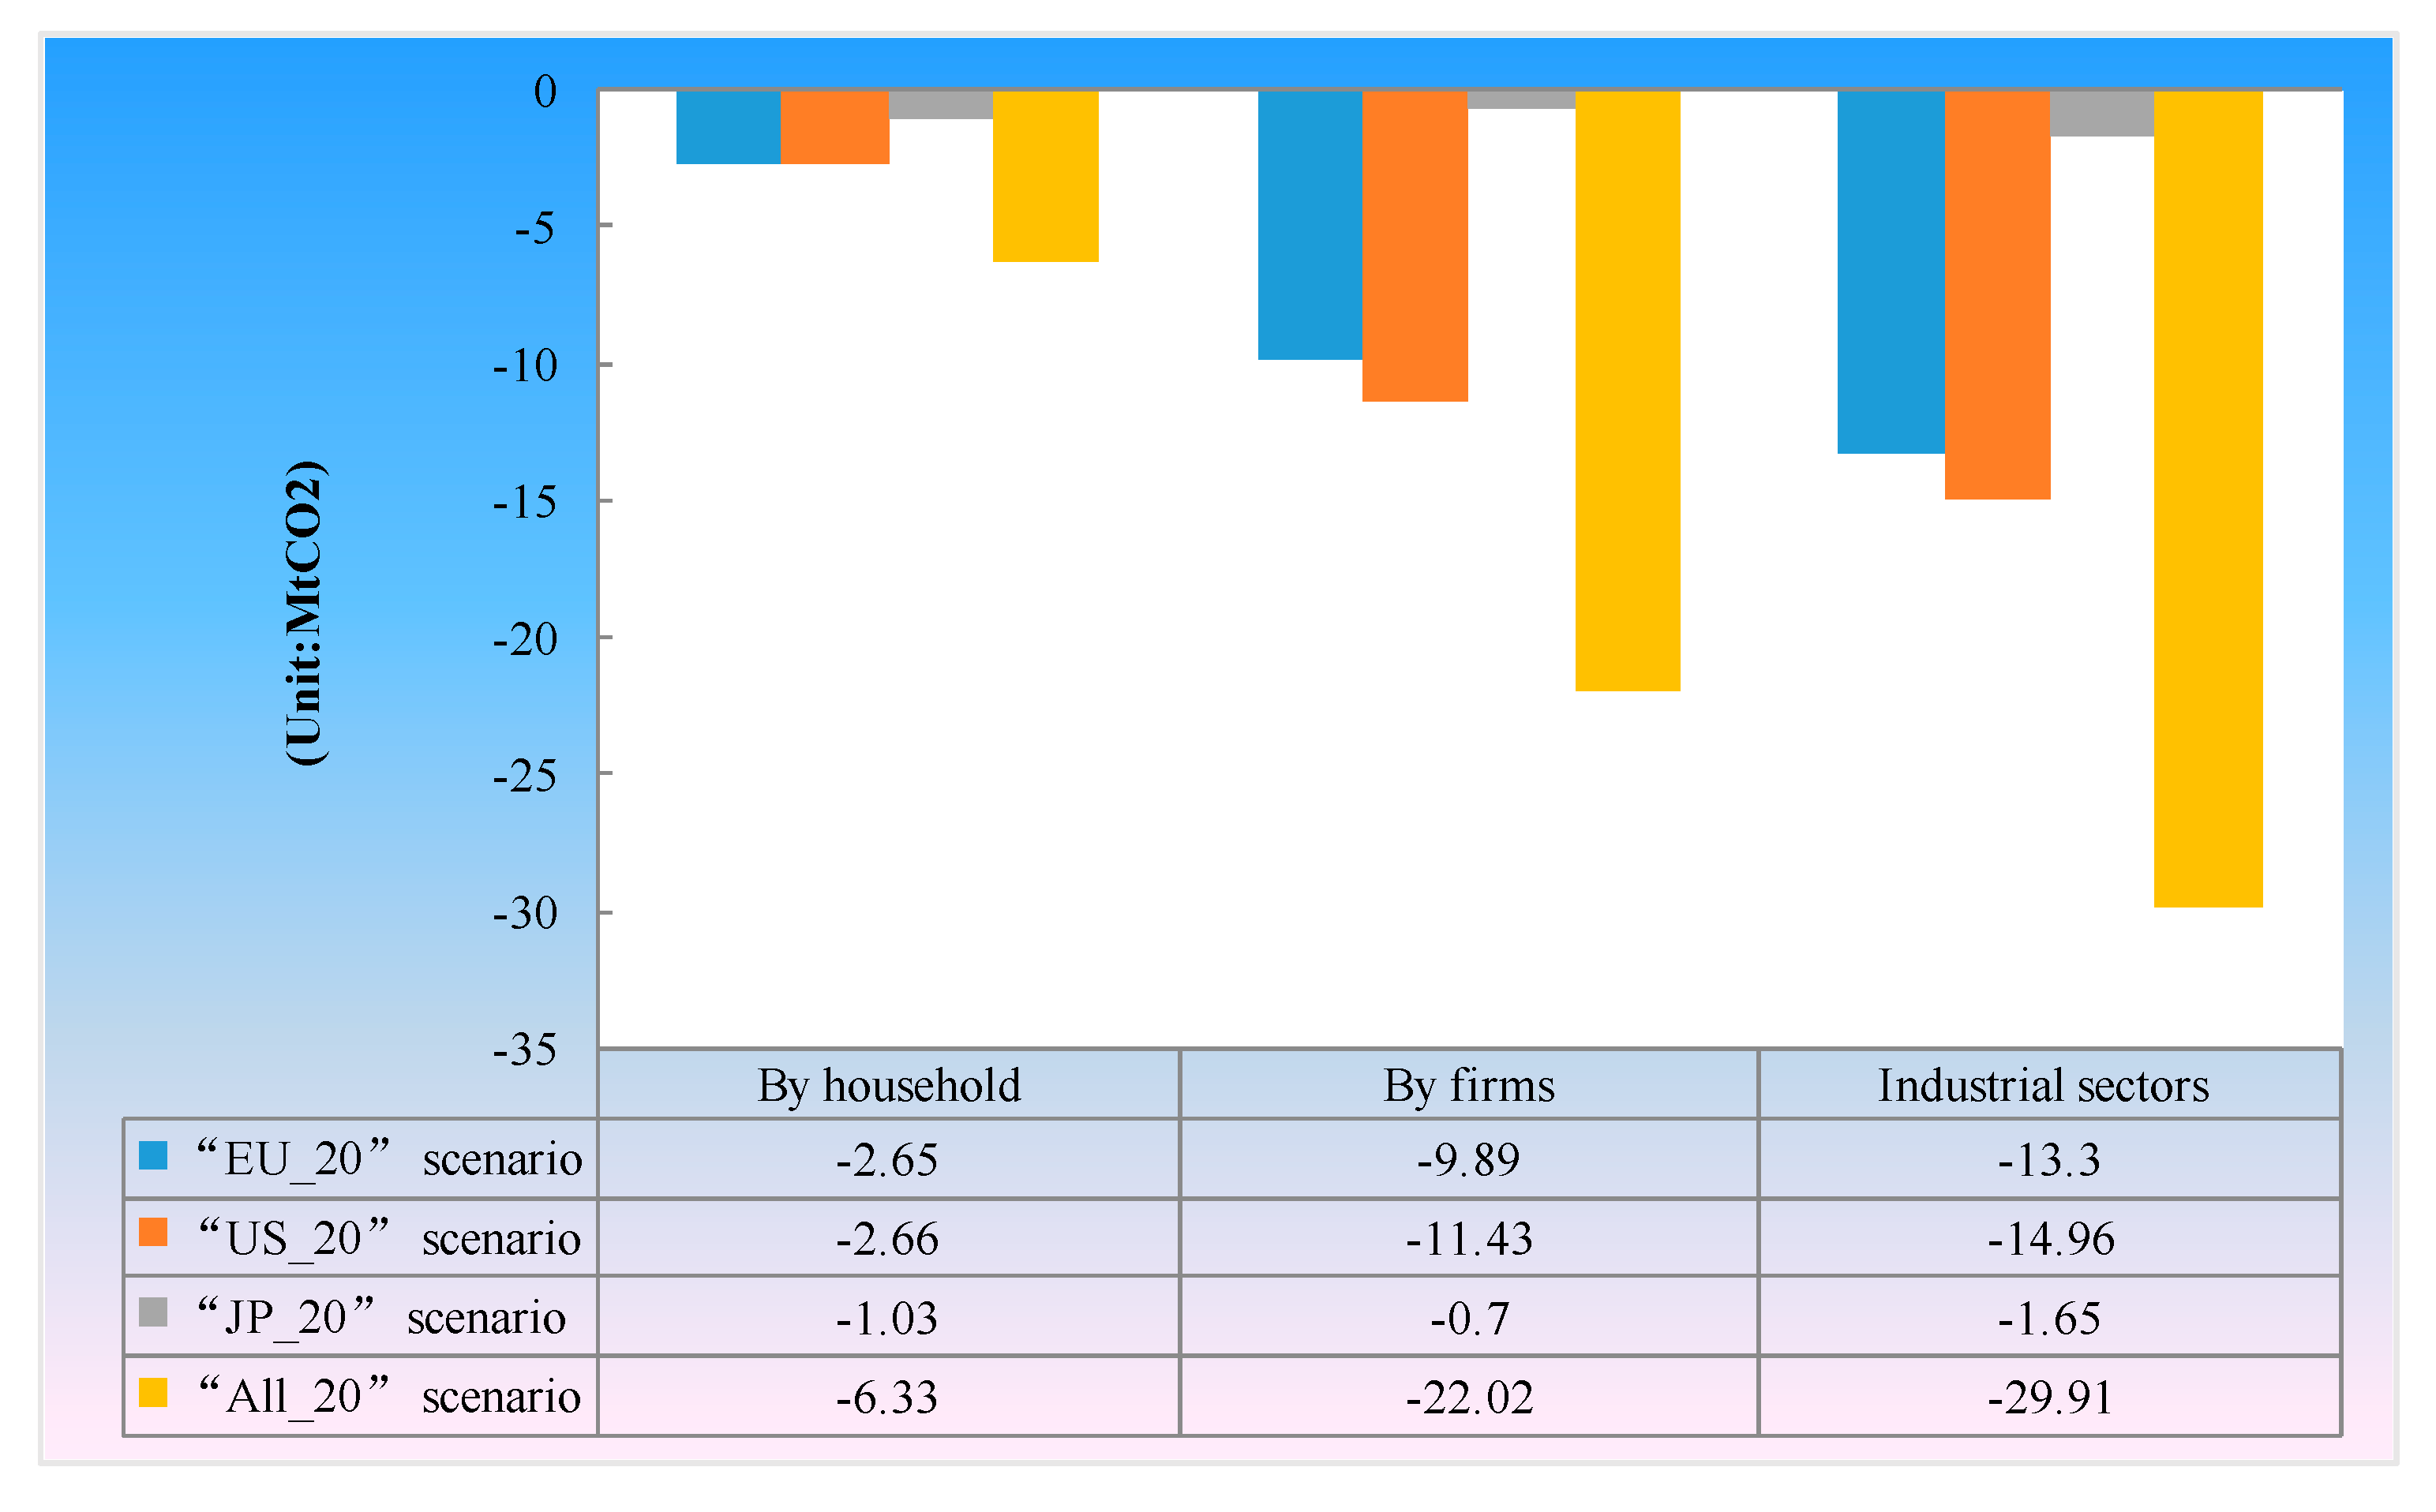
- (4)
- A carbon tariff can have an obviously positive effect on emission reduction for China’s industrial sector, which takes the most responsibility in emission reduction. Under the three scenarios of a single carbon tariff, the effect of a carbon tariff by the EU or the US on carbon emission in China’s industrial sector is more significant than that by Japan. The main reason is that the Japanese market is relatively smaller than the EU and the US, so a carbon tariff by Japan does not have an obvious positive influence compared with the EU and the US. During the process of carbon reduction, firms hold more responsibility than households under the scenario of a single carbon tariff by the EU or the US. However, there is higher efficiency in household emission reduction than firms under a carbon tariff by Japan alone. In fact, China’s industrial sector is the main body of carbon emission reduction and the main reasons are that most products manufactured in China have the characteristics of high carbon intensity and the important trade partner relationship between China and the United States.
5.2. Suggestions
- (1)
- Take precautions to deal with the forthcoming carbon tariff. A carbon tariff will definitely bring revolutions to the international economy and reshape the international trade structure. It is necessary for the Chinese government to take the initiative to formulate related policies and measures and seize the opportunity for the next era of an international low-carbon economy.
- (2)
- Strive for emerging international markets and enlarge the share in international markets for China’s industrial products. The world trade structure will be greatly changed if the EU, the US, and Japan implement a carbon tariff policy. Therefore, the Chinese government should encourage Chinese corporations to go out and provide favorable policies for them to seek emerging markets in Southeast Asian countries, BRICS, African countries, and so on. Additionally, it is also necessary for Chinese export-oriented firms to make adjustments to adapt themselves to the new situation of international trade other than the EU, US, and Japan.
- (3)
- Develop a low-carbon economy and build a comprehensive low-carbon society. Since a carbon tariff is unavoidable, it is better to seek advantages and avoid disadvantages at its early stage. Firstly, the government should give more support for the research and development of low-carbon technology and help corporations to increase their efficiency of energy utility. Secondly, keep reshaping and optimizing traditional industries and develop innovative low-carbon environmentally-friendly industries. Thirdly, develop and produce low-carbon products which can help break the trade barriers and enhance market share. Additionally, educate citizens and publicize the concept of low-carbon environmental protection. The government should reduce its imports for carbon-intensive products and protect the fragile environment in order to occupy the advantageous position in international competition.
Acknowledgments
Author Contributions
Conflicts of Interest
References
- The United Nations Framework Convention on Climate Change (UNFCCC). Adoption of the Paris Agreement. In Proceedings of the GE.15 Conference of the Parties, Paris, France, 11 December 2015; Available online: http://unfccc.int/resource/docs/2015/cop21/eng/l09r01.pdf (accessed on 25 December 2015).
- Xinhua News Agency. Premier Wen Jiabao at the Copenhagen Climate Change Conference. In Proceedings of the Copenhagen Climate Change Conference, Copenhagen, Denmark, 19 December 2009; Available online: http://www.fmprc.gov.cn/ce/cgvienna/eng/xw/t648555.htm (accessed on 9 April 2016).
- Wang, W.X.; Kuang, Y.Q.; Huang, N.S. Study on the decomposition of factors affecting energy-related carbon emissions in Guangdong province, China. Energies 2011, 4, 2249–2272. [Google Scholar] [CrossRef]
- World Bank. The World Bank Annual Report 2014 Year in Review; World Bank: Washington, DC, USA, 2014. [Google Scholar]
- Meng, M.; Fu, Y.N.; Wang, T.Y.; Jing, K.Q. Analysis of low-carbon economy efficiency of Chinese industrial sectors based on a RAM Model with undesirable outputs. Sustainability 2017, 9, 451. [Google Scholar] [CrossRef]
- Song, H.Y.; Cen, Y. Literature Review of Research on Carbon Tariff Impacting International Trade. J. Zhejiang Educ. Inst. 2010, 4, 8–13. [Google Scholar]
- Lockwood, B.; Whalley, J. Carbon Motivated Border Tax Adjustments: Old Wine in Green Bottles? NBER Working Paper, No. 14025; National Bureau of Economic Research (NBER): Cambridge, MA, USA, 2008. [Google Scholar]
- Martin, R.; Muûls, M.; Wagner, U.J. The impact of the European Union Emissions Trading Scheme on regulated firms: What is the evidence after ten years? Rev. Environ. Econ. Policy 2016, 10, 129–148. [Google Scholar]
- Oestreich, A.M.; Tsiakas, I. Carbon emissions and stock returns: Evidence from the EU Emissions Trading Scheme. J. Bank. Financ. 2015, 58, 294–308. [Google Scholar] [CrossRef]
- Moore, M.O. Implementing Carbon Tariffs: A Fool’s Errand? World Econ. 2011, 34, 1679–1702. [Google Scholar] [CrossRef]
- Cosbey, A. Border Carbon Adjustment; IISD Background Paper for the Trade and Climate Change Seminar; International Institute for Sustainable Development (IISD): Winnipeg, MB, Canada, 2008; pp. 18–20. [Google Scholar]
- Kasterine, A.; Vanzetti, D. The Effectiveness, Efficiency and Equity of Market-Based and Voluntary Measures to Mitigate Greenhouse Gas Emissions from the Agri-Food Sector; Trade and Environmental Review; United Nations Conference on Trade and Development (UNCTAD): Geneva, Switzerland, 2010. [Google Scholar]
- Liang, Q.M.; Wang, T.; Xue, M. Addressing the competitiveness effects of taxing carbon in China: Domestic tax cuts versus border tax adjustments. J. Clean. Prod. 2015, 112, 1568–1581. [Google Scholar] [CrossRef]
- Kiuila, O.; Wójtowicz, K.; Żylicz, T.; Kasek, L. Economic and environmental effects of unilateral climate actions. Mitig. Adapt. Strateg. Glob. Chang. 2016, 21, 263–278. [Google Scholar] [CrossRef]
- Mckibbin, W.J.; Wilcoxen, P.J. The Economic and Environmental Effects on Border Tax Adjustments for Climate Policy; CAMA Working Papers; Australian National University, Centre for Applied Macroeconomic Analysis (CAMA): Canberra, Australia, 2009. [Google Scholar]
- Ghosh, M.; Luo, D.M.; Siddiqui, M.S.; Zhu, Y. Border tax adjustments in the climate policy context: CO2 versus broad-based GHG emission targeting. Energy Econ. 2012, 34, S154–S167. [Google Scholar] [CrossRef]
- Springmanna, M. Carbon tariffs for financing clean development. Clim. Policy 2013, 13, 20–42. [Google Scholar] [CrossRef]
- Mathiesen, L.; Maestad, O. Climate Policy and the Steel Industry: Achieving Global Emission Reductions by an Incomplete Climate Agreement. Energy J. 2004, 25, 91–114. [Google Scholar] [CrossRef]
- Dissou, Y.; Eyland, T. Carbon control policies, competitiveness, and border tax adjustments. Energy Econ. 2011, 33, 556–564. [Google Scholar] [CrossRef]
- Keena, M.; Kotsogiannis, C. Coordinating climate and trade policies: Pareto efficiency and the role of border tax adjustments. J. Int. Econ. 2014, 94, 119–128. [Google Scholar] [CrossRef]
- Dong, Y.; Whalley, J. How Large Are the Impacts of Carbon Motivated Border Tax Adjustments; Working Paper 15613; National Bureau of Economic Research (NBER): Cambridge, MA, USA, 2009. [Google Scholar]
- Dong, Y.; Whalley, J. Carbon Motivated Regional Trade Arrangements: Analytics and Simulations; NBER Working Paper 14880; National Bureau of Economic Research (NBER): Cambridge, MA, USA, 2009. [Google Scholar]
- Winchester, N.; Paltsev, S.; Reilly, J.M. Will Border Carbon Adjustments Work? BE J. Econ. Anal. Policy 2011, 11, 432–440. [Google Scholar] [CrossRef]
- Li, A.J.; Zhang, A.Z.; Ca, H.B.; Li, X.F.; Peng, S.S. How large are the impacts of carbon-motivated border tax adjustments on China and how to mitigate them? Energy Policy 2013, 63, 927–934. [Google Scholar] [CrossRef]
- Zhou, X.; Yano, T.; Kojirna, S. Proposal for a national inventory adjustment for trade in the presence of border carbon adjustment: Assessing carbon tax policy in Japan. Energy Policy 2013, 63, 1098–1110. [Google Scholar] [CrossRef]
- Veenendaal, P.; Manders, T. Border Tax Adjustment and the EU-ETS. A Quantitative Assessment; CPB Netherlands Bureau for Economic Policy Analysis: Hague, The Netherlands, 2008. [Google Scholar]
- Kuik, O.; Hofkes, M. Border adjustment for European emissions trading: Competitiveness and carbon leakage. Energy Policy 2010, 38, 1741–1748. [Google Scholar]
- Hubler, M. Carbon tariffs on Chinese exports: Emissions reduction, threat, or farce? Energy Policy 2012, 50, 315–327. [Google Scholar] [CrossRef]
- Eyland, T.; Zaccour, G. Carbon tariffs and cooperative outcomes. Energy Policy 2014, 65, 718–728. [Google Scholar] [CrossRef]
- Demailly, D.; Quirion, P. European Emission Trading Scheme and competitiveness: A case study on the iron and steel industry. Energy Econ. 2008, 30, 2009–2027. [Google Scholar] [CrossRef]
- Grubb, M.; Neuhoff, K. Allocation and competitiveness in the EU emissions trading scheme: Policy overview. Clim. Policy 2006, 6, 7–30. [Google Scholar]
- Ismer, R.; Neuhoff, K. Border tax adjustment: A feasible way to support stringent emission trading. Eur. J. Law Econ. 2007, 24, 137–164. [Google Scholar] [CrossRef]
- Naghavi, A. Can R&D-inducing green tariffs replace international environmental regulations? Resour. Energy Econ. 2007, 29, 284–299. [Google Scholar]
- Courchene, T.J.; Allan, J.R. Climate change: The case for a carbon tariff/tax. Policy Options Montr. 2008, 29, 59. [Google Scholar]
- Helm, D.; Hepburn, C.; Ruta, G. Trade, climate change, and the political game theory of border carbon adjustments. Oxf. Rev. Econ. Policy 2012, 28, 368–394. [Google Scholar] [CrossRef]
- Chang, N. Sharing responsibility for carbon dioxide emissions: A perspective on border tax adjustments. Energy Policy 2013, 59, 850–856. [Google Scholar] [CrossRef]
- Chen, W.; Zhou, J.F.; Li, S.Y.; Li, Y.C. Effects of an energy tax (carbon tax) on energy saving and emission reduction in Guangdong province-based on a CGE model. Sustainability 2017, 9, 681. [Google Scholar] [CrossRef]
- Dong, Y.; Whalley, J. Carbon, Trade Policy, and Carbon Free Trade Areas; National Bureau of Economic Research (NBER): Cambridge, MA, USA, 2008. [Google Scholar]
- Atkinson, G. Trade in “virtual carbon”: Empirical results and implications for policy. Glob. Environ. Chang. 2011, 21, 563–574. [Google Scholar] [CrossRef]
- Badri, N.G.; Walmsley, T.L. Global Trade, Assistance, and Production: The GTAP 7 Data Base; Purdue University: Purdue, IN, USA, 2008. [Google Scholar]
- Hertel, T.W. Global Trade Analysis: Modeling and Applications; Cambridge University Press: Cambridge, UK, 1999. [Google Scholar]
- Cong, X.N. The Modeling Development and Application of Global Multi-Regional CGE for Geopolionmic Analysis. Ph.D. Thesis, Graduate University of Chinese Academy of Sciences, Beijing, China, 2012. (In Chinese). [Google Scholar]
- Liu, Y.F. Be Cautious about the Environmentallism Shadow Induced by Carbon Traffics. Available online: http://news.xinhuanet.com/world/2009-12/09/content_12616583.htm (accessed on 5 June 2016). (In Chinese).
- Bao, Q.; Tang, L.; Yang, L.X. The Impact of Carbon Motivated Border Tax on China: An Analysis Based on Computable General Equilibrium Model. Manag. Rev. 2010, 6, 25–33. (In Chinese) [Google Scholar]
- Xie, L.H.; Chen, Y. Has China Over-reacted to the Carbon Tariff Proposal? Int. Econ. Rev. 2010, 4, 135–146. (In Chinese) [Google Scholar]
- Shen, K.T.; Li, G. The Impacts of Carbon-Motivated Border Tax Adjustment to China’s Industrial Exports-A CGE Based Analysis. Financ. Trade Econ. 2010, 1, 75–82. (In Chinese) [Google Scholar]
- Huang, L.Y.; Li, X. Impact of US intending to Impose Carbon Tariffs on Chinese Economy: Based on Empirical Analysis of GTAP Model. J. Int. Trade 2010, 11, 93–98. (In Chinese) [Google Scholar]


| Areas | Description |
|---|---|
| EU | Britain, France, Germany, Italy, Austria, Greece, Denmark, Belgium, Spain, Sweden, Finland, Poland, The Netherlands, Portugal, Cyprus, Czech Republic, Estonia, Romania, Hungary, Latvia, Bulgaria, Ireland, Luxembourg, Slovenia, Slovakia, Lithuania |
| US | The United States |
| JPN | Japan |
| CHN | Mainland China |
| ASE | Indonesia, Malaysia, Philippines, Singapore, Thailand, Vietnam |
| AFR | The African countries except South Africa |
| BRIC | Russia, India, Brazil and South Africa |
| ROW | The rest of the world |
| Sectors | Description |
|---|---|
| Agricultural sectors | Paddy rice, Wheat, Cereal grains, Vegetables, fruit, nuts, Oil seeds, Sugar cane, sugar beet, Plant-based fibers, Crops, Animal products, Raw milk, Wool, silk-worm cocoons, Forestry, Fishing, Sugar, Beverages and tobacco products, Dairy products, Processed rice, Vegetable oils and fats, Food product, Meat products |
| Industrial sectors | Industrial sectors |
| Extraction | Extraction industry and Extraction |
| Light Mnfc | Light Manufacturing |
| Heavy Mnfc | Heavy Manufacturing |
| Electricity | Utilities and Construction |
| Service | Transport and Communication |
| Sources | Carbon Tariff Rate |
|---|---|
| Atkinson [39] | $50 per ton carbon equivalent |
| Kasterine and Vanzetti [12] | $100 per ton carbon equivalent |
| Baoqin et al. [44] | $10–100 per ton carbon equivalent |
| Xie and Chen [45] | $10, $30, or $50 per ton CO2 |
| Shen and Li [46] | $30–60 per ton carbon equivalent |
| Huang and Li [47] | $10–70 per ton carbon equivalent |
© 2017 by the authors. Licensee MDPI, Basel, Switzerland. This article is an open access article distributed under the terms and conditions of the Creative Commons Attribution (CC BY) license (http://creativecommons.org/licenses/by/4.0/).
Share and Cite
Chen, W.; Guo, Q. Assessing the Effect of Carbon Tariffs on International Trade and Emission Reduction of China’s Industrial Products under the Background of Global Climate Governance. Sustainability 2017, 9, 1028. https://doi.org/10.3390/su9061028
Chen W, Guo Q. Assessing the Effect of Carbon Tariffs on International Trade and Emission Reduction of China’s Industrial Products under the Background of Global Climate Governance. Sustainability. 2017; 9(6):1028. https://doi.org/10.3390/su9061028
Chicago/Turabian StyleChen, Weiguang, and Qing Guo. 2017. "Assessing the Effect of Carbon Tariffs on International Trade and Emission Reduction of China’s Industrial Products under the Background of Global Climate Governance" Sustainability 9, no. 6: 1028. https://doi.org/10.3390/su9061028