1. Introduction
In the social aspect of sustainability, segregation has been an important issue in the planning literature, as it has entailed various enclaves in residential areas, ranging from ghettos to gated communities [
1,
2]. In Korea, residential segregation, specifically focusing on apartment complexes, has also become a concern of researchers [
3,
4,
5].
We raise the question that a similar phenomenon of “segregation”, as an intended and enforced spatial separation, or at least “differentiation”, as an unintended and voluntary one, may take place in commercial areas as well, if visitors with similar demographic and socioeconomic characteristics are concentrated at certain commercial areas. This phenomenon, often heralded as “birds of a feather flock together”, may simply indicate the “differentiation” of commercial areas, because it reflects differences in tastes and preferences that are affected not only by income but also by gender and age. In this sense, it may not involve social exclusion and discrimination in an explicit and compulsory way. Nevertheless, it may still share some characteristics of “segregation” if a particular group concentrated at a certain commercial area represents the socially disadvantaged or advantaged by gender, age, and income.
To be operational, we borrow a concept of what communication and network researchers, and sociologists, call “homophily”, which means that people with similar characteristics have more interactions, and engage in more effective communication [
6]. Accordingly, in an urban context, we further define a concentration of homogeneous people at certain commercial areas as “spatial homophily.”
The purpose of this paper is to empirically identify the characteristics of spatial homophily in the shopping and leisure activity centers in Seoul, Korea. To identify the commercial centers and obtain information on the gender, age, and income of visitors, the paper utilizes the shopping and leisure trip data of the 2010 Household Travel Survey (HTS) in the Seoul metropolitan area (SMA). Various aspects of spatial homophily are examined using simple statistics, such as average (AVG) and coefficient of variation (CV), as well as cluster analysis by gender, age, and income groups.
After summarizing the major findings of the existing literature on gender, age, and income homophily in shopping and leisure activities, we describe the data and select the major commercial centers of Seoul. For each center, we measure and compare the degrees of gender, age, and income homophily based on visitor information. By integrating gender, age, and income homophily, we also differentiate the characteristics of shopping and leisure activity centers. The paper concludes with planning implications.
2. Literature Review
2.1. Homophily by Gender, Age, and Income
According to McPherson, Smith-Lovin, and Cook (2001) [
7], there are various dimensions of homophily, such as gender, race, age, religion, social class, network position, behavior, and attitude. However, we focus only on the very basic dimensions (i.e., gender, age, and income) because of data availability.
Among gender, age, and income, Louch (2000) [
8] and McPherson, Smith-Lovin, and Cook (2001) [
7] pointed out that gender homophily is weaker than the other dimensions because of the existence of a spouse. Children are likely to have gender homophily by having social play patterns [
9]; however, for adults, networks of “discussing important matters” are more gender mixed and heterogeneous [
10].
Age homophily is highly revealed for non-kin relations beyond family [
8,
11]. In particular, Burt (1990, 1991) [
12,
13] found that the over 60 age group has more trouble associating with other age groups. Income homophily has received the least attention among researchers, because many researchers have focused on more specific dimensions such as education and occupation. In relation to income, however, property is regarded as the most impermeable, strong boundary for building a friendship [
14].
2.2. Shopping and Leisure Behaviors by Gender, Age, and Income
Homophily is realized in urban commercial areas, as people seek different kinds of values of shopping and leisure activities by gender, age, and income. Consequently, different shopping and leisure behaviors affect where people frequently visit, as distinguished from other groups. In this way, spatial homophily can take place.
In terms of gender and age, peer groups may pursue their own values, which represent a kind of sensibility (i.e., senses of belonging, superiority, and freedom). Chung (2008) [
15] interviewed old men who frequently visited the park in the center of Seoul, and argued that they have a “hang-out culture” by enjoying a “we-feeling” among old and lonely males. For other age groups, Tauber (1972) [
16] and Pickering, Kintrea, and Bannister (2012) [
17] pointed out that teenagers have a desire to gather with their peer group, and even develop pride and interest in the group. Shim, Santos, and Choi (2013) [
18] also found that young recreational visitors describe the shopping mall as “our hottest youthful place”.
When focusing on gender effects only, the differences in shopping and leisure behaviors between men and women are not clear. Jansen-Verbeke (1987) [
19] argued that women tend to visit urban centers for shopping and visiting family, while men are likely to stroll around freely. In contrast, Shim, Santos, and Choi (2013) [
18] contended that men tend to act as shoppers, while recreational visitors are more likely to be women.
Depending on their purchasing power, the income groups also have different values of shopping and leisure activities, such as the maintenance of reputation, frugality, and self-contentment. Moye and Kincade (2003) [
20] segmented American female apparel consumers, and found that members in the higher income group pursue their ability and reputation, but members in the lower income group look for bargains or do not hesitate to make a purchase if they like the good. These groups choose different kinds of stores as well. Both groups prefer department stores; however, the second choice is specialty stores for the higher income group, and discount stores for the lower income group.
2.3. Homophily and Segregation
Spatial homophily may be value-neutral per se. However, if members of a certain group, classified by gender, age, or income, are reluctant to visit a particular commercial area because they feel uncomfortable and have difficulty assimilating with other visitors there, we might be concerned about a social barrier similar to segregation, and a resultant exclusion. This is particularly so if a certain group represents the socially and economically disadvantaged, such as females, older people, and lower income groups.
In this sense, an analogy from residential segregation may be useful. Segregation can occur when the disadvantaged are excluded (e.g., ghettos) or the advantaged voluntarily assemble and exclude others simultaneously (e.g., gated communities) [
2]. Roitman (2005) [
21] pointed out the drawbacks of both cases. On the one hand, ghetto residents are usually isolated from job opportunities and public services. On the other hand, residents in gated communities reinforce a social division, with an insufficient network of people of diverse backgrounds. Nonetheless, it has been recognized that the ghetto effects related to poverty and members of the underclass are more critical, and there are urgent issues that need to be addressed [
22,
23].
Of course, we need to take note of the dissimilarities between residential and commercial areas when applying the concept of segregation. Since people can freely choose shopping and leisure destinations, the concentration of a certain group in a particular commercial area may not be enforced, but voluntary. Moreover, unlike gated communities, it is legally and practically impossible to block visitors’ entry into certain commercial areas in a city.
3. Identifying Shopping and Leisure Activity Centers
The empirical data for this study were derived from the 2010 HTS of the Korea Transport Database. The HTS consists of personal trips classified by the purpose of the trip, the day of the week, the origin, and the destination specified at the administrative level of a precinct called a dong. It also contains a traveler’s personal information regarding gender and age (year of birth), as well as household information regarding household size and monthly household income.
This study focuses only on the trips for shopping and leisure purposes that occurred during weekends, because those trips include the largest cases of travelers visiting commercial areas, who are free from commuting to work on weekdays. With regard to origin and destination, the study also focuses only on the trips generated in the SMA, which comprises the city of Seoul, and the surrounding Gyeonggi Province and Incheon. In this way, the commercial centers of Seoul can be identified among the destinations of weekend shopping and leisure trips in the SMA.
Taking into account the number of trips, we select the top 20 destinations in Seoul as the study area, based on the following criteria. First, since the study areas should be characterized notably by commercial activities, we exclude the destinations that do not belong to Korea’s 100 biggest commercial areas listed in the 2012 annual report of MK News—a media outlet specializing in economy and business in Korea—even if there are a relatively large number of trips to those destinations. Also, we exclude the areas specialized for outdoor leisure activities, particularly mountain climbing, as exemplified by Dobong-dong around the Dobong mountain.
Second, we also exclude intra-dong trips because most of these trips reflect daily routine activities made on foot around residences, offices, and schools. Finally, to take into account the geographic spillover of commercial activities, we merge adjacent dongs into a single destination if they share similar commercial activities. These cases include Yeouido-Dangsan, Sinchon-Daesin-Changcheon, Seogyo-Donggyo-Sangsu, Jongno5-6ga-Euljiro, and Guro-Gasan.
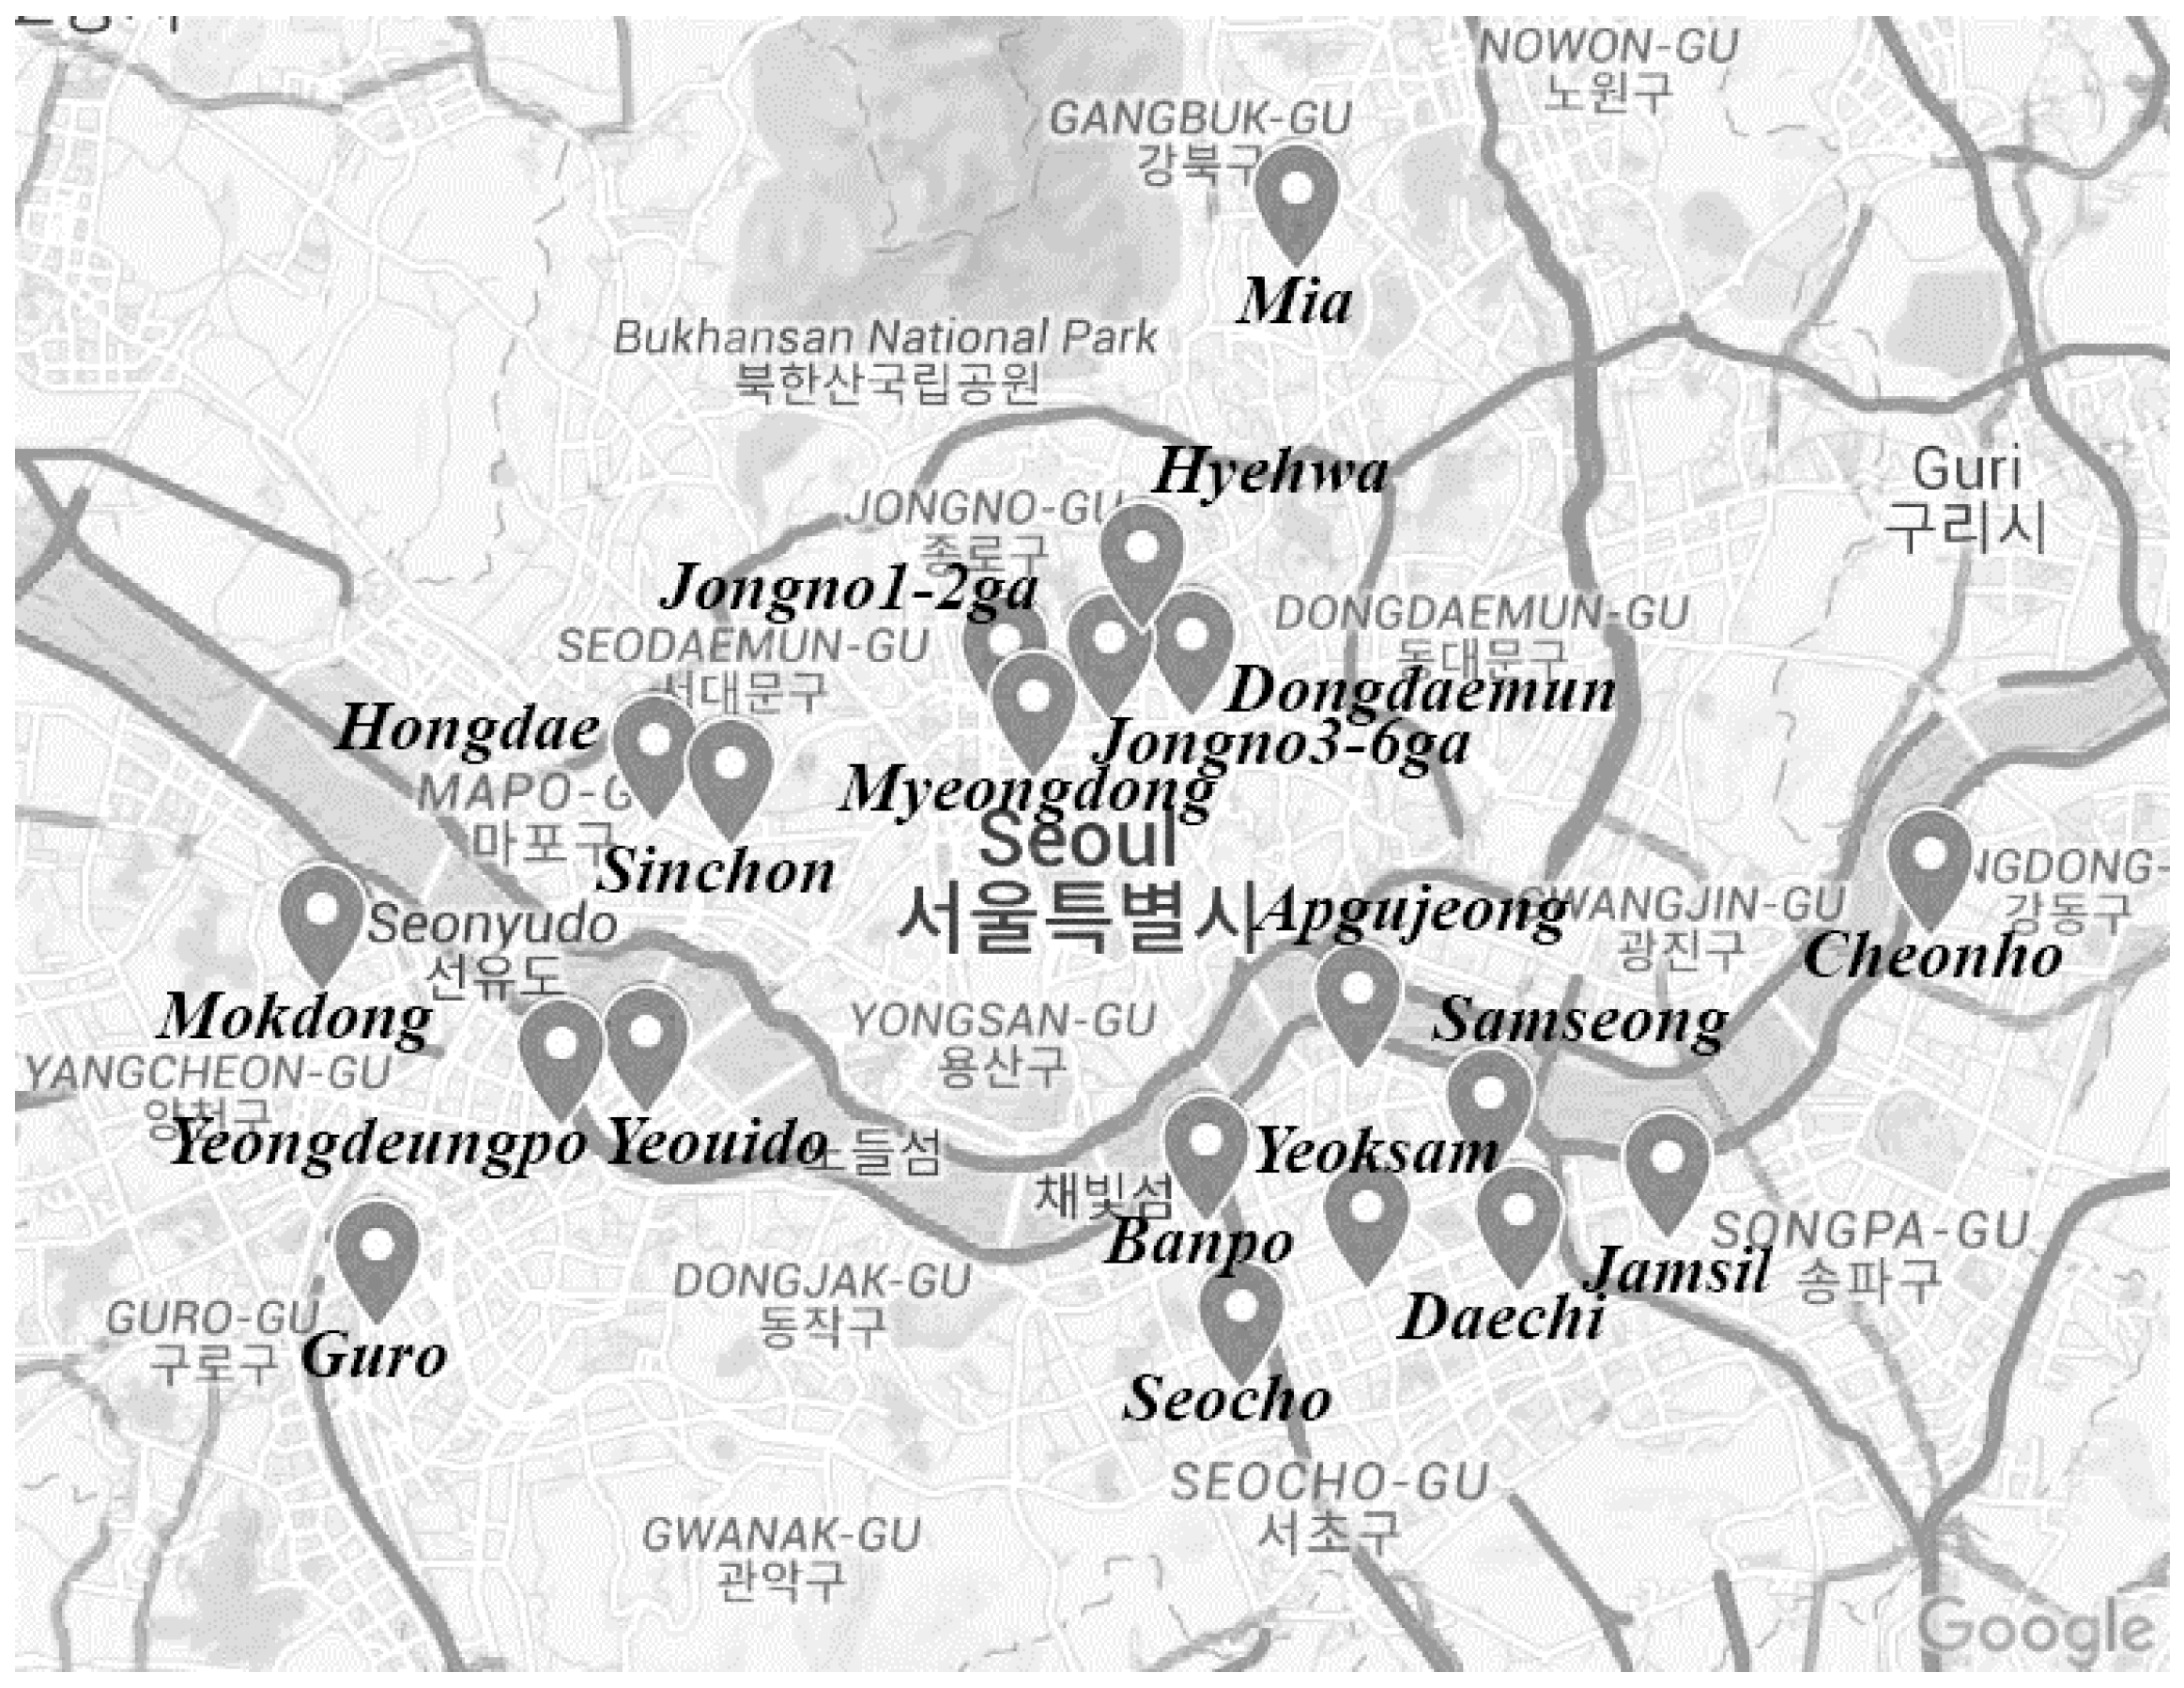
Like a rank–size distribution, the number of trips to a destination decreases at an increasingly smaller rate as its rank increases. Accordingly, we decided to focus on major commercial areas only, by setting up 20th place in the ranking as the threshold, because the number of trips becomes relatively small and indistinguishable among the destinations beyond 20th place. In this way, the data include 20 destinations with a total of 2822 trips. Jamsil-dong was the destination with the largest number of trips (265), while Daechi-dong was the destination with the smallest number of trips (71). The average number of trips was 141. These 20 study areas are illustrated in
Figure 1 and listed in
Table 1,
Table 2,
Table 3 and
Table 4.
Among the 20 destinations, there are some distinguished areas. Jongno3-6ga is known for its old downtown area with historical sites, parks, traditional markets, located at the center of Seoul. Hongdae, Myeongdong, Jamsil, Sinchon, and Hyehwa are famous places for retail, entertainment, and food and beverage (F&B), and are easily accessible to students. In addition, Yeouido, Yeoksam, Guro, and Samseong act as major business districts and employment centers, which accommodate prime office buildings with mixed-use developments. Finally, Daechi, Apqujeong, Mokdong, Samseong, and Yeoksam at the south of the Han river are newly developed areas, characterized by affluent inhabitants residing in modern apartments (condominia).
4. Homophily by Gender, Age, and Income
For each of the 20 destinations, travelers’ personal and household information regarding gender, age, and income are collected to identify the characteristics of each destination. The characteristics are summarized in terms of visitors’ gender, age, and income distribution using the simplest, but the most significant, statistics: average (AVG); standard deviation (SD); and coefficient of variation (CV) (
Appendix A). In addition, the chi-square test, correlation analyses, simple regressions, and a cluster analysis are applied.
The AVG is useful to identify whether or not a destination is preferred relatively by males or females, young or old people, and low-income or high-income groups. The SD and CV are key statistics to measure the level of homogeneous or heterogeneous age and income distribution (i.e., homophily). We use the CV instead of the SD because the CV is a dimensionless statistic, and useful for comparing the age and income distribution of different units. When the CV is computed for each destination, more attention should be given to smaller values of the CV, because the smaller the CV, the more homophilous the destination.
4.1. Gender
Since gender is a nominal variable, the gender-specific characteristic of a destination is summarized by the percentage of male and female visitors, as shown in descending order in
Table 1. Across the 20 destinations, the percentage of female visitors ranges from 50.6% to 70.9%, with the average being 57.9%. Therefore, it is evident that the shopping and leisure activity centers in Seoul are generally female oriented, as females occupy more than half of the visitors.
Although it is impossible to calculate the SD and CV in the case of a nominal variable, a variation of the female percentage is somewhat noticeable, as the largest difference amounts to 20.3% p (= 70.9% − 50.6%). The chi-square test confirms the variation, as there is a statistically significant difference in male and female frequencies among the 20 destinations. On the one hand, the destinations with a relatively lower percentage of female visitors (i.e., a higher percentage of male visitors compared to other destinations) are characterized by the old downtown area (i.e., Jongno3-6ga), as well as major office districts and employment centers (e.g., Yeouido, Yeoksam, Guro, and Samseong). On the other hand, the destinations with a relatively high percentage of female visitors include famous places of retail, entertainment, and F&B (e.g., Myeongdong, Jamsil, Sinchon, and Hyehwa).
4.2. Age
The AVG and CV of age are calculated for each destination, and illustrated in descending order, respectively, in
Table 2. The average age ranges from 31.7 years to 44.1 years across the 20 destinations. The destination with the oldest age is Jongno3-6ga, which is located in the old downtown area, and is also characterized by a relatively higher percentage of male visitors. In contrast, the destinations of the younger age group include famous places of retail, entertainment, and F&B (e.g., Hongdae, Myeongdong, and Hyehwa), which are also characterized by a relatively higher percentage of female visitors.
The CV varies from 34.9 to 50.3. Interestingly, the destinations of the older age group have a relatively smaller CV (e.g., Seocho, Banpo, Jongno3-6ga, and Daechi), while those of the younger age group have a relatively larger CV (e.g., Jongno1-2ga, Yeouido, Hongdae, and Hyehwa). Accordingly, it is postulated that the destinations of the older age group are more homogeneous in age distribution, while those of the younger age group are more age mixed.
To investigate the relationship between the AVG and CV in a simplified way, we employ a quintile analysis. The 20 destinations in descending order of AVG (i.e., from old to young age) are classified into five quintile groups, with each group composed of four destinations, respectively. For each quintile group, the AVG of the CV is calculated for comparisons across the five groups. The result is also included in
Table 2. The AVG and CV of age show a linear relationship. As the quintile group becomes older, the CV becomes smaller. Accordingly, the youngest group has the largest CV, and the oldest group has the smallest CV.
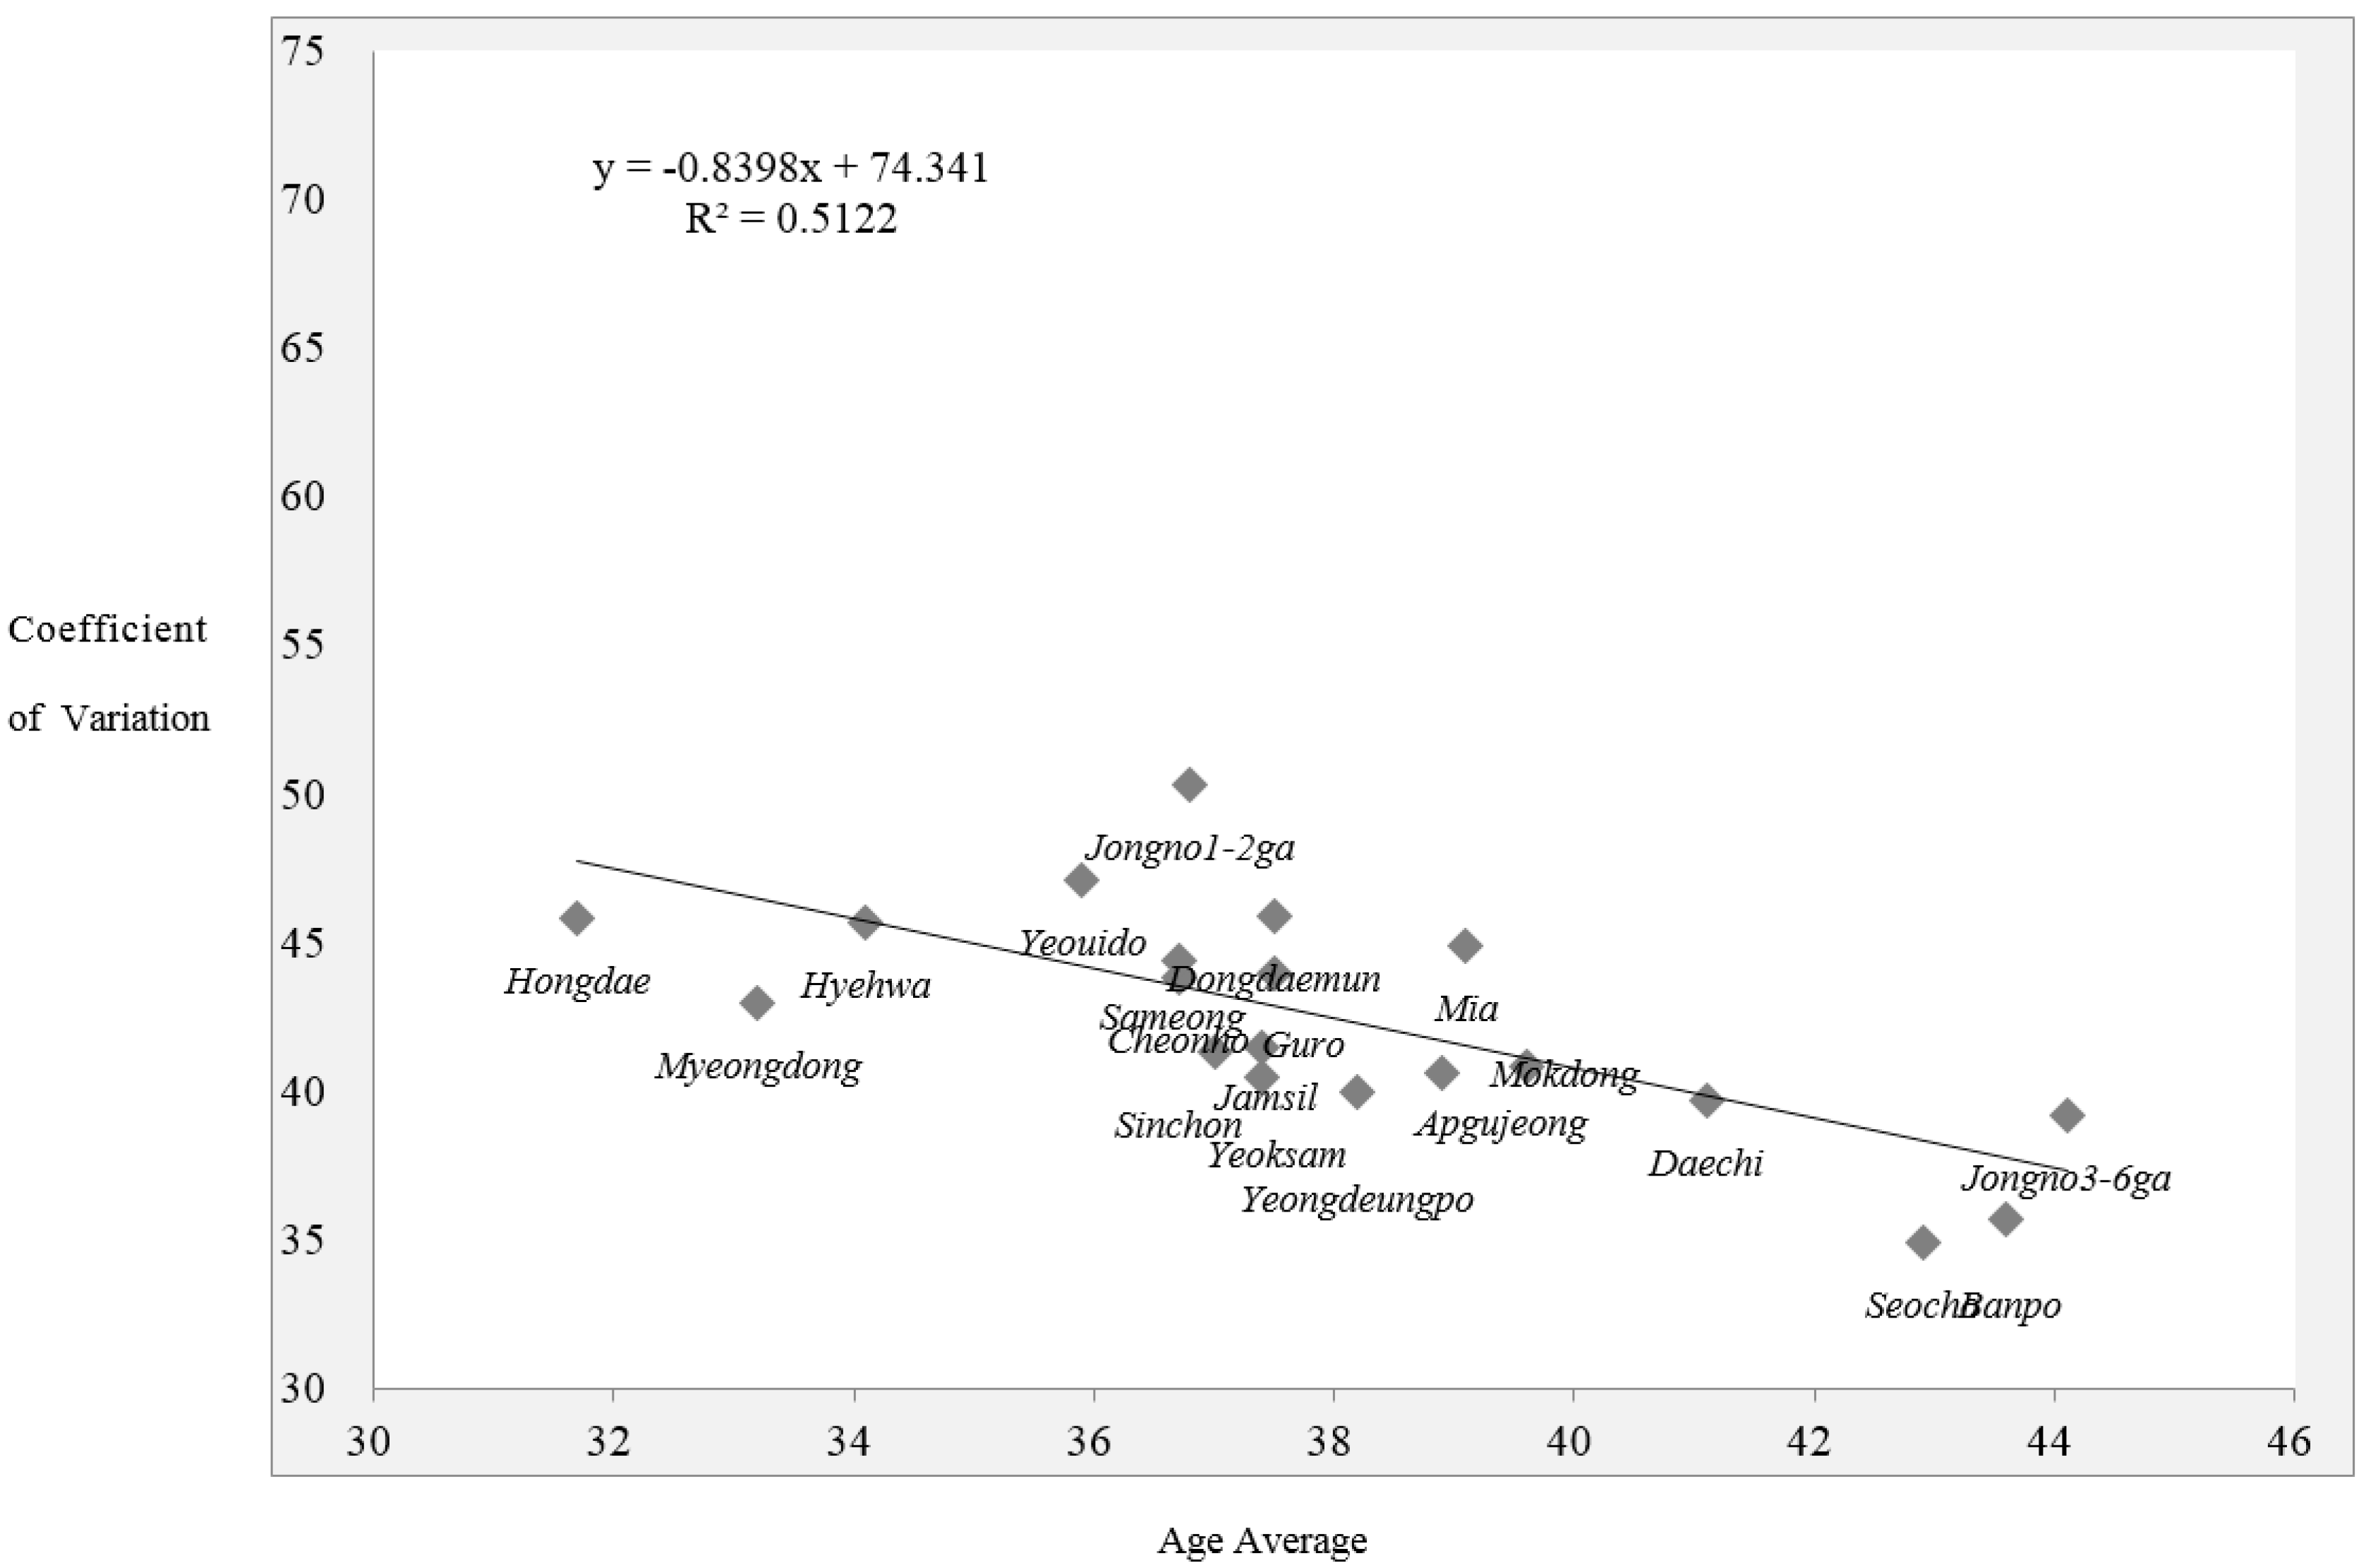
This relationship between the AVG and CV is finally confirmed by a correlation coefficient and a scatter plot. The correlation coefficient between the AVG and CV of age is −0.716, and is statistically significant (
p = 0.000).
Figure 2 illustrates the linear relationship between the AVG and CV with a fitted regression line. These results confirm that the elderly are more homophilous, as they tend to gather with their age peer group, away from the younger group. On the contrary, the destinations of the younger group tend to accommodate visitors from various age groups.
4.3. Income
Since income data are obtained in the form of household income, the data first need to be converted into individual income because the consumption of goods and services in a commercial area is made on an individual basis. For this purpose, we adopt the method of a square root scale in which household income is divided by the square root of household size [
24] (
Appendix A). This method has been employed widely in many OECD publications to compare income inequality and poverty across countries.
The AVG and the CV of personal income by destination are summarized in descending order, respectively, in
Table 3. The average income varies from 179.6 to 258.3 won per month across the 20 destinations. The destinations of the higher income group are located in newly developed areas characterized by affluent inhabitants (e.g., Daechi, Apqujeong, Mokdong, Samseong, and Yeoksam), while those of the lower income group include Jongno3-6ga, which is located in the old downtown area, as well as famous places of retail, entertainment, and F&B (e.g., Hongdae and Sinchon).
The CV of income ranges from 45.9 to 71.5. The destinations with a relatively small CV are represented by Mokdong and Seocho, while those with a relatively large CV include Yeouido, Samseong, Myeongdeong, and Guro. Therefore, it is not clear whether or not the destinations of the higher or lower income groups are associated with a relatively small or large CV.
Similarly to the case of age, the relationship between the AVG and CV of income is first examined using a quintile analysis.
Table 3 also shows the AVG of the CV calculated for each quintile group, as the 20 destinations are classified into five quintile groups in descending order of AVG (i.e., from high to low income). Relatively low values of CV are found in the highest income quintile, as well as the second lowest and the lowest income quintiles, implying a parabolic relationship in which the high- and low-income groups are more homophilous than the middle-income group.
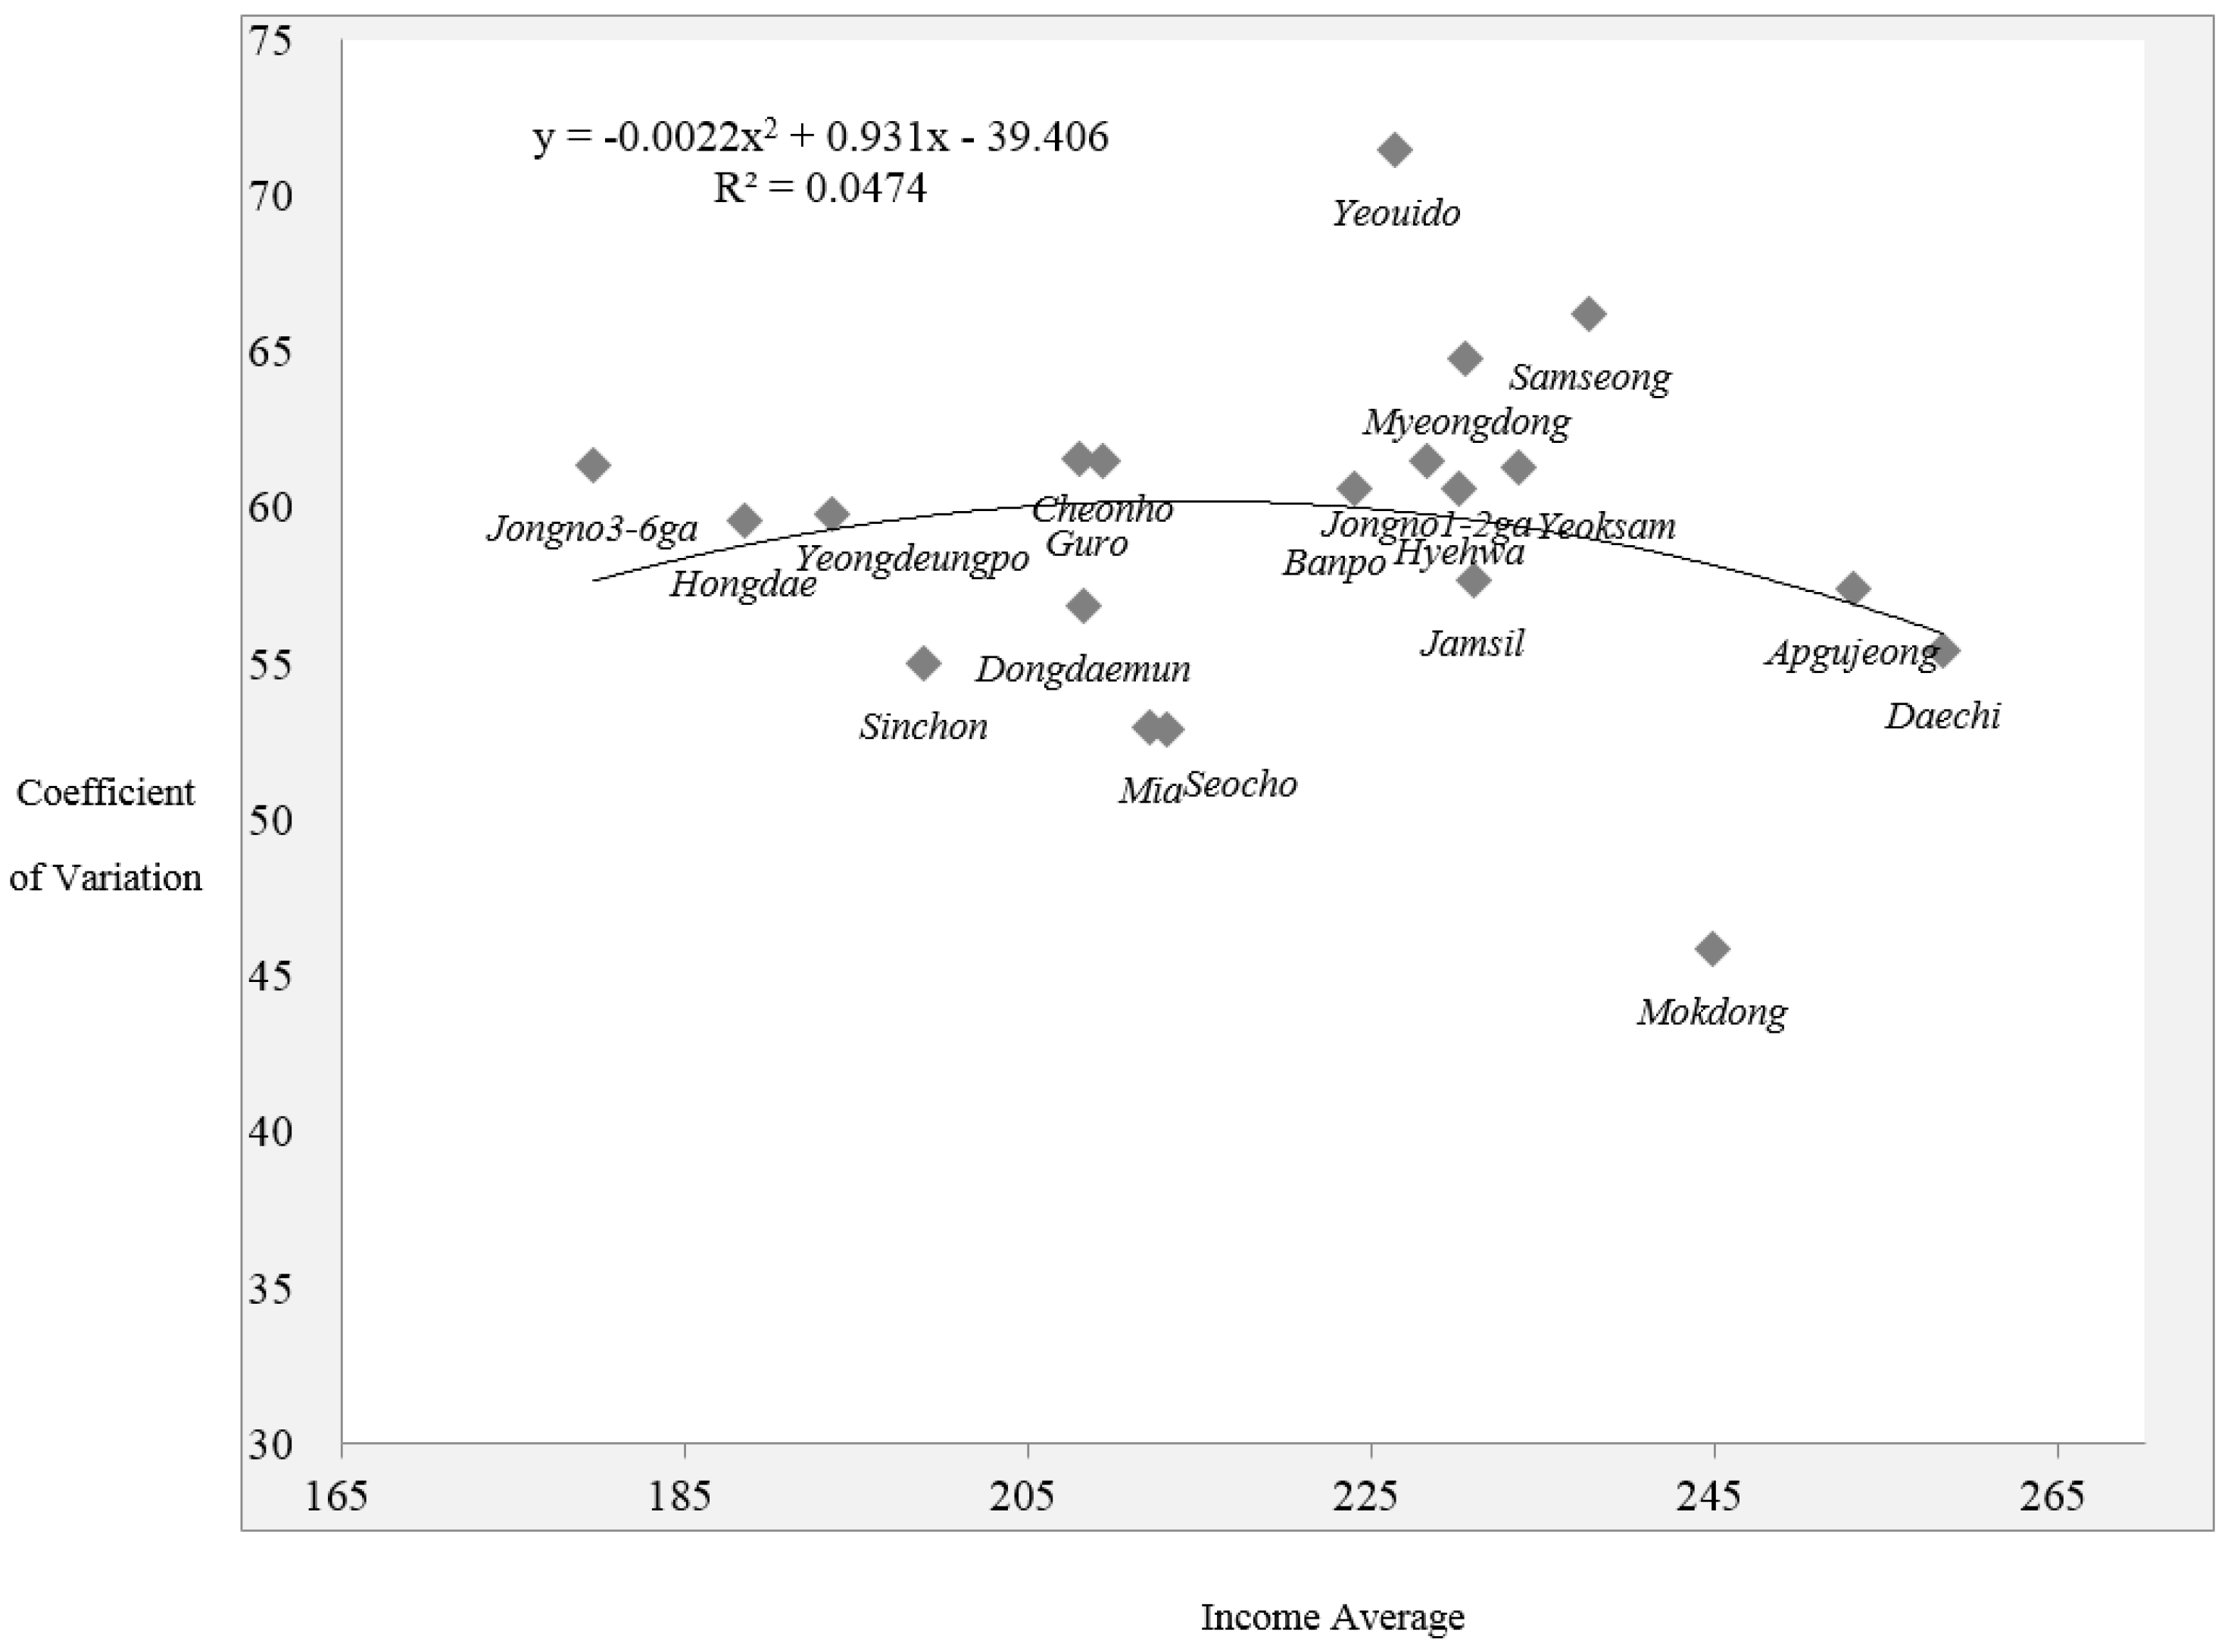
The parabolic relationship of income homophily is illustrated in the scatter plot with the fitted regression curve in
Figure 3. As the AVG increases, the CV tends to increase and then decrease. Due to the parabolic nature, the correlation coefficient between the AVG and CV is only −0.086, and is statistically insignificant (
p = 0.719). These results demonstrate that the destinations of the higher and lower income groups are characterized by a concentration of visitors with a similar income level, respectively, suggesting a segregation of commercial areas by income class.
5. Spatial Homophily of Shopping and Leisure Activity Centers
In this section, we compare and integrate the results of the individual analyses carried out by gender, age, and income, respectively, to identify which demographic and socioeconomic groups, and which shopping and leisure activity centers, play relatively important roles in shaping spatial homophily. Here, the comparative and integrated analyses are based mainly on age and income variables, because the gender variable does not have a comparable AVG and CV due to the ratio scale. Gender is considered only marginally.
5.1. Degree of Age and Income Homophily
To answer the question of which demographic and socioeconomic groups are more homophilous, we compare the CV of age and income. First, we can compare the distribution of the CV calculated for each of the 20 destinations in
Table 2 and
Table 3. This CV indicates the intra-destination difference derived from the age and income distributions within each destination. The CV of age ranges from 34.9 to 50.3, and the CV of income ranges from 45.9 to 71.5, showing that the range of the age CV is overall smaller than that of the income CV. Accordingly, the age distribution is more homophilous than the income distribution within each destination. That is, the age group is more homogeneously concentrated than the income group in each destination.
Second, we also need to compare the inter-destination difference of age and income among the 20 destinations. For this purpose, we produce a single CV across all 20 destinations based on the AVG of each of the 20 destinations. This CV of inter-destination is 8.5 for age and 9.5 for income, showing that the difference in income is wider than that of age across the 20 destinations (
Appendix A).
Therefore, by combining these two results, it is evident that the range of the age distribution is relatively narrow (i.e., homogeneous in each destination), and the difference in age among the 20 destinations is relatively small. On the contrary, the range of the income distribution is relatively wide (i.e., heterogeneous in each destination), and the difference in age among the 20 destinations is relatively large. Therefore, the age group appears to assemble together with more segmented units, differentiated with a relatively small difference in age. Meanwhile, the income group is relatively mixed, although the income differential is more distinguishable among the destinations.
5.2. Homophily of Shopping and Leisure Activity Centers
We turn to the question of which shopping and leisure activity centers are distinctively characterized by spatial homophily. For this purpose, we integrate the age and income distributions, focusing on the AVG, while taking into account gender in part.
When integrating the results of the individual analyses in the last chapter, some destinations emerge with relatively distinctive characteristics. The old downtown area is represented by Jongno3-6ga, and is characterized by visitors who are relatively male, older in age, and members of the lower income group. In contrast, some famous places of retail, entertainment, and F&B are characterized by visitors who are relatively female, younger in age, and members of the lower income group. Meanwhile, some of the office districts are dominated by a relatively higher percentage of males and members of the higher income group. These results demonstrate that some of the shopping and leisure activity centers in Seoul have been differentiated by the gender, age, and income of visitors. In particular, combined with the CV, it becomes evident that Jongno3-6ga in the old downtown area is more exclusively dominated by the older age group.
Going forward, we attempt to identify the specific shopping and leisure activity centers that have similar or different characteristics of spatial homophily. For this purpose, we apply a cluster analysis to the 20 destinations based on two factors: the AVG of age and the AVG of income. Gender is excluded due to the ratio scale. It is found that the convergence to five clusters is statistically significant and most plausible (based on K-means), while each cluster contains one to eight destinations. The results are presented in
Table 4 with additional information. The two factors are statistically significant at the 90% level.
The characteristics of the five clusters are basically classified by a combination of age and income, subdividing their level into high, medium, and low, respectively. The five clusters are evenly distributed from low to high income and from young to old age. Cluster 1 represents “Middle Age, Middle Income”. Cluster 2 is characterized by “Old Age, High Income”, and consists of newly developed areas with affluent inhabitants (e.g., Apgujeong, Daechi, and Mokdong). Cluster 3 contains only one destination, Jongno3-6ga in the old downtown area, and has the distinctive character of “Old Age, Low Income.” Cluster 3 is also characterized by the highest percentages of male visitors—even though percentage of female visitors is higher than that of male visitors—specifying its characteristic as “Male-Oriented, Old Age, Low Income.”
Cluster 4 is a combination of “Young Age, High Income”, and composed of Jamsil, Hyehwa, Yeouido, Myeongdong, and others. Cluster 5 is characterized by “Young Age, Low Income”, and includes famous places of retail, entertainment, and F&B (e.g., Sinchon, and Yeongdeungpo). Cluster 5 also has the lowest percentage of male visitors or the highest percentage of female visitors, specifying its character further as “Female-Oriented, Young Age, Low Income”.
Finally, focusing on the CV again, Cluster 3 of “Male-Oriented, Old Age, Low Income” has the smallest value of age CV (39.2), and Cluster 2 of “Old Age, High Income” has the next smallest value of age CV (40.4). Accordingly, these two clusters are the most homophilous in terms of age. Furthermore, Cluster 2 has the smallest value of income CV, demonstrating that the “Old Age, High Income” cluster is characterized by both age and income homophily.
6. Conclusions
This paper attempts to answer the question of whether or not “segregation”, or at least “differentiation”, takes place in commercial areas in terms of “spatial homophily”. Based on the 2010 HTS data in the SMA, we first identified Seoul’s top 20 destinations for weekend shopping and leisure trips. Then, using traveler information regarding gender, age, and income, we calculated the percentage of female visitors, as well as the AVG and CV of age and income for each destination. These statistics are widely employed to identify which demographic and socioeconomic groups, and which shopping and leisure activity centers, are distinctively characterized by spatial homophily.
It is found that the destinations with a relatively higher percentage of male visitors are distinguished from those of female visitors. Similarly, the destinations of the older age group are differentiated from those of the younger age group, while the destinations of the higher income group are distinguished from those of the lower income group. Interestingly, homophily is more prominent in the destinations of the older age group, as well as both the high- and low-income groups.
In general, age is distributed more homophilously within each destination, while each destination is differentiated by a relatively small difference in age. On the contrary, the income group is relatively mixed within each destination, while the destinations of the high- and low-income groups are distinguished by a relatively large difference in income. Among the clusters of shopping and leisure activity centers identified by the cluster analysis, three clusters are noticeable: the “Old Age, Low Income plus Male-Oriented” cluster (in the old downtown area), the “Old Age, High Income” cluster (in the newly developed areas with affluent inhabitants), and the “Young Age, Low Income plus Female-Oriented” cluster (comprised of famous places of retail, entertainment, and F&B).
In summary, it is proved empirically that at least “differentiation” takes place in commercial areas in terms of “spatial homophily” (i.e., “birds of a feather flock together”). Moreover, by paying attention to the “Old Age, Low Income” cluster in the old downtown area, we can raise the possibility of “segregation” of the commercial areas, as this cluster represents the socially and economically disadvantaged group in terms of both age and income. In particular, if this cluster is contrasted with the “Old Age, High Income” cluster, these two clusters, which are the most homophilous, represent segregation by income among the aged group. In the aging society, these two clusters may imply ghettos and gated communities, respectively, for shopping and leisure activities.
The segregation of commercial areas by age and income groups may pose a serious challenge to the sustainable development of a city in terms of social integration. Since outdoor activities in shopping and leisure centers—including major streets—are more distinguishable, such segregation can foster an atmosphere of social disharmony in a more sensible way. In this regard, planners need to pay attention to the role of public spaces, which can mediate and mitigate the separation and isolation of commercial areas, and promote a social mix towards an inclusive city. In particular, priority should be given to planning policies that aim to provide more easily accessible public space for the disadvantaged, such as the “Old Age, Low Income” group, so that they can be removed from isolation and enjoy various leisure activities.
This study is not without limitations. The sample size is limited to 20 destinations in Seoul, while the spatial unit of data adopted is an administrative precinct, or dong, which does not necessarily correspond to the functional boundaries of commercial areas. All of the results are derived from purely quantitative analyses, based on relatively simple statistical methods. Some qualitative analyses need to be performed in the future, focusing more on the unique and specific characteristics of the shopping and leisure activity centers in Seoul.


