
A Smartness Assessment Framework for Smart Factories Using Analytic Network Process


1
Department of Industrial Engineering, Seoul National University, Seoul 08826, Korea
2
School of Industrial Engineering, Purdue University, West Lafayette, IN 47907, USA
3
Department of Industrial & Management Engineering, Kyonggi University, Suwon 16227, Korea
*
Author to whom correspondence should be addressed.
Sustainability 2017, 9(5), 794; https://doi.org/10.3390/su9050794
Submission received: 19 March 2017
/
Revised: 25 April 2017
/
Accepted: 6 May 2017
/
Published: 10 May 2017
(This article belongs to the Special Issue Sustainability in Manufacturing)
Abstract
:The so-called smart factory is a novel paradigm that is rapidly gaining ground in scenarios for factories of the future. Many manufacturing companies try to raise the level of smartness by considering a number of aspects related to the smart factory. However, there is a lack of field-oriented systematic research to help them fit the interest of industry for promoting interest and diffusion of smart factory. Moreover, it is still difficult to assess whether the vision of the future factory that incorporates information and communication technologies is implemented. Therefore, in this study, we propose a smartness assessment framework for smart factories which is based on the concept of operation management so as to be easy to make manufacturing companies to understand and apply. The framework is composed of evaluation criteria and sets the weightings of the criteria using analytic network processes. From a case study based on 20 small and medium-sized manufacturing enterprises, the effectiveness of the proposed framework has been verified.
1. Introduction
Enhancement of productivity has long been an issue in manufacturing companies as it is the main cause for budget and time overruns. Moreover, the manufacturing industry has been facing numerous issues, such as sustainability, because of changes in the landscape of global manufacturing [1]. However, small and medium-sized enterprises (SMEs) do not have substantial opportunities for growth, compared with globally competitive big companies. To strengthen the overall competitiveness of manufacturing and narrow the gap between SMEs and big companies in productivity, it is necessary to markedly accelerate SME’s productivity improvement.
Systems of know-how on innovation to improve productivity, including the rationalization of information and communication technologies (ICT), should be established, and should seamlessly support the manufacturing process through equipment and management systems. However, SMEs face difficulties in being highly-skilled in smart factory technologies because of the lack of manpower and investment in emerging ICT [2]. Nonetheless, SMEs should be able to become smarter and conduct self-led innovation that detects and improves problems in manufacturing.
The application of the word ‘smart’ has extended from electronic devices into services and facilities like buildings, cities, farms, and factories. In this context, the concept of smart manufacturing or smart factories draws public attention by aggregating industrial data from sensors through networks. Furthermore, the application of smart factories is accelerating further with the introduction of Industrie 4.0 in Germany. The concept of smart factories began to be established as a combination of ICT and digital automation solutions throughout the overall production process, in areas such as product design and development, manufacturing and logistics, improving productivity, quality and customer satisfaction. With the revival of manufacturing worldwide, factories are being innovated using ICT solutions and the Korean government is promoting key aspects of the ‘Manufacturing Innovation 3.0’ strategy, including the diffusion of smart factories. Companies are also expected to achieve enterprise-wide optimization by introducing the concept of the smart factory.
Many manufacturing companies make an effort to raise the level of smartness by considering a number of aspects related to smart factories with automated data collection from sensor networks. Despite the increasing amount of shop floor data, it is becoming more difficult for manufacturing companies to identify useful information. In order to address this problem, systems of know-how for evaluating the smartness level of the manufacturing company and exploiting the deluge of manufacturing information are essential for surviving in changed competitive environments. An appropriate assessment of manufacturing companies has long been an important issue, as it should consider a lot of quantitative and qualitative criteria and their interdependencies.
However, even though there are a lot of definitions and various criteria related to smart factories according to the size and type of a manufacturing company, there is little previous literature dealing with the assessment of the smart factory. To achieve a higher level of smart factory, a new assessment methodology for factories is required to evaluate the performance and competitiveness of factories with the application of Big-data or Internet of Things (IoT) technologies. In addition to these technologies, the methodology should consider the integration of production process and operations management. Thus, in this paper, we develop a new assessment methodology for smart factories to holistically diagnose the level of smartness for factories and propose solutions for advancement.
It is necessary to continuously evaluate and analyze whether the competitiveness of the manufacturing industry has been enhanced by utilizing advanced ICT such as IoT or Big-data [3]. In particular, systematic evaluation of the implementation results of smart factories, taking into consideration not only ICT, but also manufacturing process management and production management, will enable continuous improvement by evaluating relative competitiveness and improving it successively. To do so, it is necessary to develop certification standards and operating systems that can diagnose the level of a smart factory in the manufacturing industry.
The certification of a smart factory requires the use of an appropriate evaluation model that provides an overall analysis based on various criteria. The evaluation model consists of an evaluation framework and evaluation criteria for the level of smartness. This study suggests a new assessment methodology that composes an evaluation framework and sets the weightings of evaluation criteria. If the evaluation criteria are not exclusive and dependent, the correlation between the criteria should be considered. The influence of interdependencies among criteria relevant to smart factories has only been examined in a few studies. In this study, therefore, the weights according to the evaluation criteria were set using the analytic network process (ANP) methodology. This study also explains the results of analyzing the application cases to 20 companies based on the evaluation model.
The remainder of this paper is organized as follows. Section 2 reviews previous studies about the concept of the smart factory and assessment methodologies for factories, including smart factories. Assessment criteria for smart factories are defined and an ANP-based method is adopted for estimating weightings among the criteria in Section 3. Section 4 describes a case study of real-world SMEs to verify the validity of our approach and summarizes the result. Finally, Section 5 states our conclusions and briefly discusses the scope for future work.
2. Previous Research on Factory Assessment
2.1. Assessment and Certification Systems of Factories
Researchers of Stuttgart University and the Fraunhofer institute suggested a next generation model of a factory that uses ubiquitous computing technologies. They defined a smart factory as a context-aware factory that assists people and machines in the execution of their tasks and could communicate and interact with its environment [2]. It exploits distributed information and network structure to optimize production processes and real-time manufacturing. Zuehlke represented the automation pyramid in terms of smart factory consisting of four levels: from field devices (sensors/actuators) and programmable logic controllers (PLC), through process management and manufacturing execution systems (MES), to enterprise level (ERP) software [3]. Wang et al. showed that the three revolutionary stages of Industrie 4.0 consist of (1) horizontal integration for inter-corporation collaboration; (2) vertical integration of hierarchical subsystems inside a factory for flexible and reconfigurable manufacturing system; and (3) end-to-end engineering integration across the entire value chain for product customization [4].
Despite the large amount of literature on definitions, it is difficult to find literature on what level of factory is clearly defined as a smart factory. Chen et al. reviewed the previously introduced tools relevant to manufacturing SMEs and presented a holistic and rapid sustainability assessment tool for them [5]. A research project of VDMA (Mechanical Engineering Industry Association in Germany) suggested a model of ‘Industrie 4.0 Readiness’ [6]. The model consists of 6 dimensions and 18 fields. 6 dimensions include 4 dimensions of Industrie 4.0—Smart factory, Smart products, Smart operations, Data-driven services—and two more dimensions representing ‘Strategy and organization’ and ‘Employees’. The model defines 6 levels of Industrie 4.0 implementation, that is, outsider, beginner, intermediate, experienced, expert, and top performer. In addition to this research, there is an article mentioning the level of smart products. Porter and Heppelmann grouped the capabilities of smart, connected products into four areas: monitoring, control, optimization and autonomy [7]. Each builds on the preceding one.
Most of the existing studies are about simple performance evaluation and measurement indicators. Jung et al. proposed a method for assessing readiness levels, which provides users with an indication of their current factory state [8]. Gunasekaran reviewed the literature that studied performance measurement and metrics in accordance with the supply chain process and proposed a framework for performance measurement of the supply chain [9]. Chen and Paulraj also developed key SCM constructs and measurements [10]. Performance measures can be obtained through a combination of various operation measurements, i.e., key performance indicators (KPIs). ISO-22400 defines the application of KPIs, which are presented with their formulas and corresponding elements [11].
There are various evaluation and certification systems for existing general factories or manufacturing companies. The Baldridge, Deming and European Foundation for Quality Management (EFQM) models are the most well-known and commonly used models throughout the world [12]. In Korea, with the supports of the Korean government, the Korea Productivity Center developed a manufacturing innovation methodology (called KPS) that is suitable to SMEs’ circumstances for their self-initiated innovation. KPS has a list of 140 assessment items for evaluation of core activities of manufacturing companies [13], but the models and KPS still do not consider the concept of the smart factory.
2.2. Methodology for Multi-Criteria Decision Making (MCDM)
Assessing the level of a smart factory with various criteria is difficult because one's viewpoint can be oriented to a specific side of the problem. For example, some experts put emphasis on quality management and production planning for a smart factory while other experts set a high value on information systems. Furthermore, interdependencies exist among criteria which affect the weight of each criterion for assessing the level of smart factory. Thus, the assessment and certification of the level of smart factory is a kind of multi-criteria decision making (MCDM) problem with interdependencies. The goal of this paper is to determine the weights of the elements in the assessment model.
The MCDM methods are applied for objectively solving decision-making problems that have multiple criteria for a specific goal. When taking into account a single criterion, a decision-making problem is simple and intuitive because the alternative with the highest preference rating is selected. However, when there are multiple criteria many problems like determining weightings of criteria and interdependencies among criteria become extremely complicated and more sophisticated methods are required to solve these problems.
In order to deal with MCDM problems, there are several methods, such as elimination and choice translating reality (ELECTRE), the technique of ordering preference by similarity to ideal solution (TOPSIS), the analytic hierarchy process (AHP), the analytic network process (ANP), interpretive structural modeling (ISM), decision-making trial and evaluation laboratory (DEMATEL), and fuzzy cognition maps (FCM) [14]. Among these, AHP and ANP are widely used methods owing to the simplicity and structural integrity of the Google Scholar service in generating 2700 searches in 2015 and 3250 searches in 2016.
The AHP was proposed by Thomas Saaty and it has been widely used to evaluate alternatives by deriving relative priorities on absolute scales from both discrete and continuous paired comparisons in multi-level hierarchic structures [15]. However, AHP has to assume that the criteria are independent. Many decision problems cannot be structured hierarchically because they involve the interaction and dependence of higher-level elements on lower-level elements.
To deal with interdependencies and feedbacks between criteria, Saaty proposed the ANP [16], which is an extended version of AHP. Unlike AHP, the network model of ANP includes cycles connecting its components of elements and loops that connect a component to itself. A source node is an origin of paths of importance and a sink node is a destination of paths of influence. Because of feedback loops and interdependencies, the calculation process of ANP becomes more complicated than AHP. However, identifying interdependencies and applying them in the ANP model is essential for evaluating the level of smart factory more precisely. Hence, we use the basic concepts of ANP to determine the weightings of criteria, which can be used to determine the key factors for decision-making.
3. Proposed Methodology
3.1. Identifying the Assessment Criteria Based on Literature Review
Various definitions of smart factories have appeared in the literature and governmental plans. We have summarized the major elements from the smart factory definitions as follows, and we used them when establishing a conceptual framework for assessing and defining criteria and assessment items.
- Objective: Optimal management of production process, Zero waste, Maximum efficiency, Product customization, Strengthening manufacturing competitiveness, Asset utilization, Innovation of supply chain and logistics
- Direction to pursue: Intellectualization and optimization, Responding to changes in the external environment, ICT-integration of processes, Organic connection of functions, Control improvement, Context-sensitive
- Necessary technologies: Automation technology, IoT, Big-data, Cyber-physical system (CPS), etc.
- Applicable object: Facilities, Devices, Workers, Material/Part/Product
- Applied processes: (Product lifecycle view) Product design, Production planning, Process control, Quality control, Logistics, Sales (Behavioral view) Sensing, Controlling, Actuating
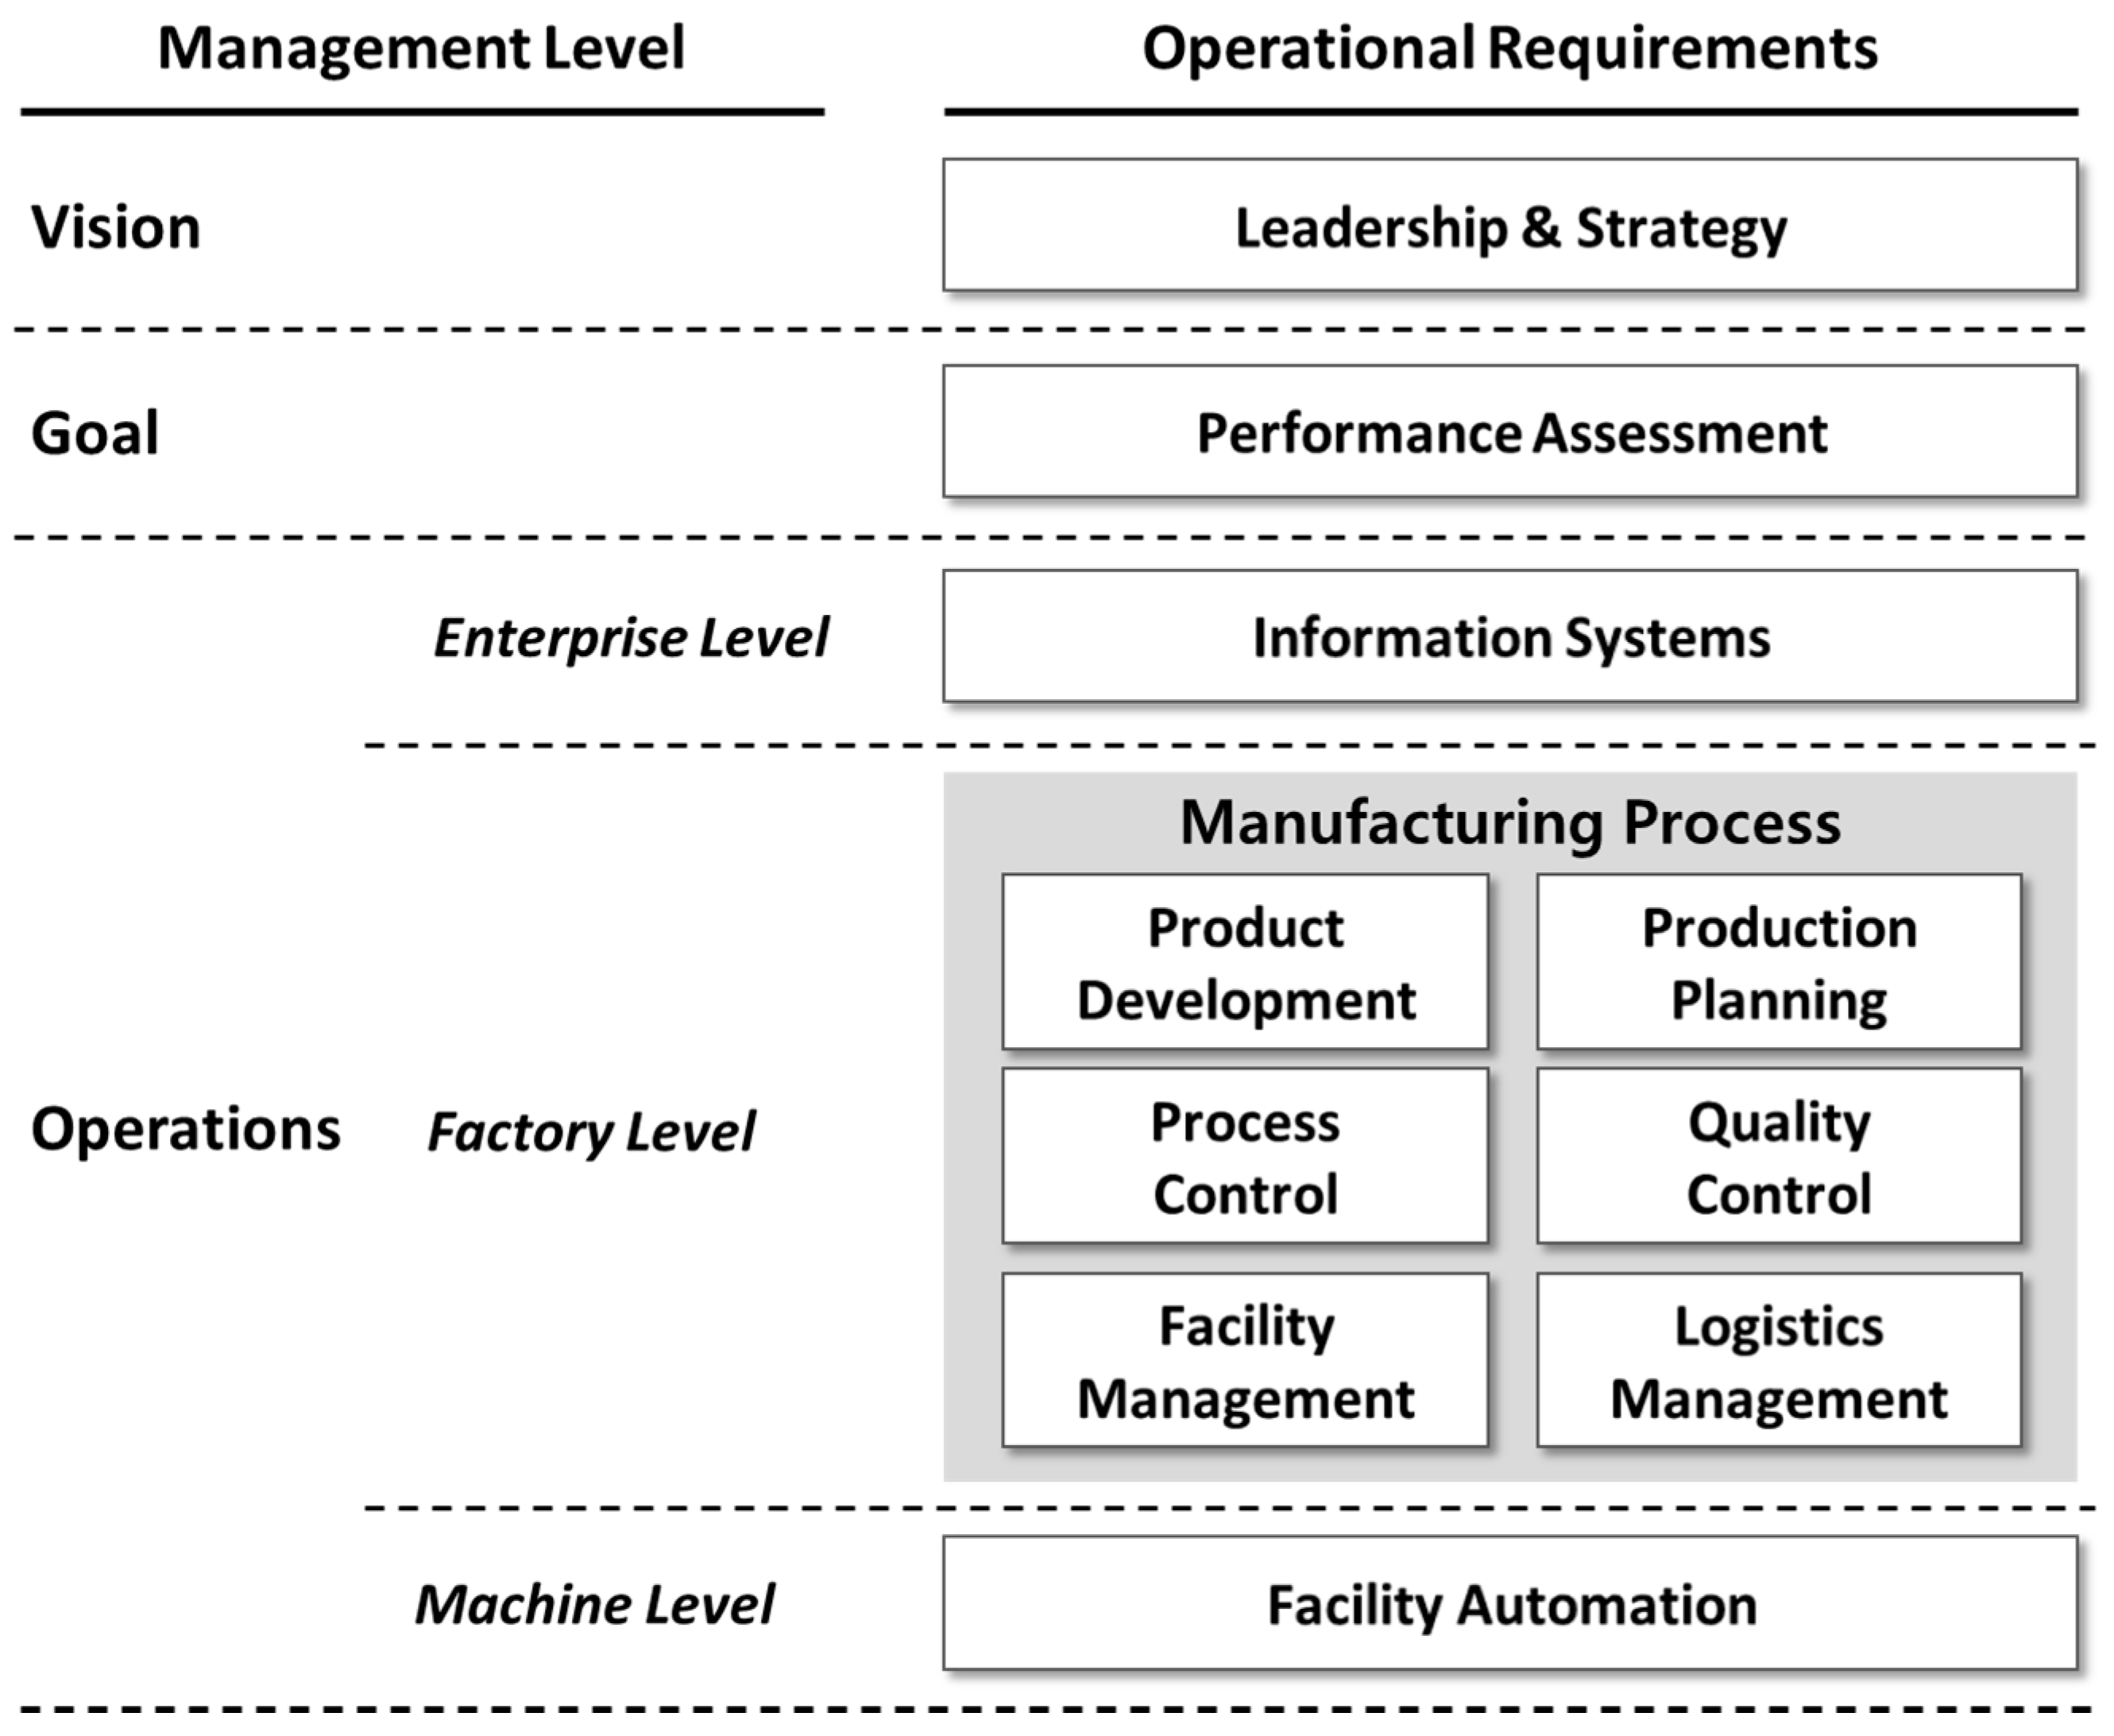
Generally, the level of management activities can be divided into strategic planning, management control, and operational control [17]. In order to make the management activities at the factory smarter, it is necessary to provide operational requirements for each activity. Therefore, smart factory operating system is divided into ‘Vision’ based on high-level strategy, ‘Goal’ based on performance evaluation for management control, and ‘Operations’ at the lower level; with Operations being subdivided according to enterprise-, factory-, and machine levels.
Enterprise-level requirements mean that not only enterprise information systems such as product lifecycle management (PLM), enterprise resource planning (ERP), supply chain management (SCM) and manufacturing execution systems (MES); but also factory energy management systems (FEMS). In addition, security should be implemented. Factory-level requirements mean that step-by-step manufacturing processes such as product development, production planning, process control, quality control, facility management and logistics management should be intelligently implemented. Machine-level requirements mean that the automation of factory facilities, such as production facility, logistics facility, inspection facility and equipment information networking, should be implemented. The conceptual framework is depicted as shown in Figure 1.
At first, we selected assessment items from existing literatures [8,10,11,18], identifying the list of criteria and sub-criteria with consultants and scholars and specifying the detailed core activities of each criterion as shown in Table 1. Based on the field survey with five consultants who had experience with manufacturing innovation projects, we narrowed down the list to 4 criteria and 10 sub-criteria according to the conceptual framework, and grouped 46 assessment items according to the criteria. For evaluating each sub-criterion, we first scored each assessment item from 0 to 5 by the field study of consultants. We then calculated the average of assessment items in the sub-criterion. Finally, we determined the maturity level of smart factory by calculating the weighted average score with predetermined weightings of criteria. The initial weightings of criteria were determined through consensus of consulting experts just as the weightings for the assessment criteria of the KPS methodology [13] had been determined. And the weightings were based on the proportion of the number of all assessment items. From here on, the methodology that has these initial weightings will be called the simple methodology.
3.2. Implementing the Model with Consulting Experts
We now apply the proposed methodology, which determines the weightings using ANP, and compare the result with the ‘simple’ methodology. In our proposed methodology, an ANP model is made based on the criteria and assessment items as shown in Figure 2. We identify the influence between assessment items in sub-criteria and specify interdependencies between them, shown with arrows. Arc-type arrows mean self-dependencies among sub-criteria in the modules.
3.3. Formulating an ANP Model
Step 1. Aggregating individual judgments
At first, the network structure with decision elements are generated by collecting extensive opinions from experts such as scholars and consultants. Pairwise comparisons are made for all combinations of relevant decision elements using the nine-point comparison scale. After the pairwise comparisons are completed, ANP uses the principal eigenvector of the judgment matrix.
Let be an n × n positive reciprocal matrix:
In the judgment matrix A, an element represents the relative importance of the ith element to that of the jth element and the reciprocal of the element is the element . The relative importance of an element can be represented on a scale ranging from one to nine.
Step 2. Checking the consistency index
To evaluate the weights of the elements, the principal eigenvector W of the judgment matrix A is calculated as follows:
where is the principal eigenvalue of A.
A judgment matrix A should be verified by using the consistency ratio (CR) because the result of pairwise comparison can be distorted by subjective and inconsistent opinions. The CR is expressed by the consistency index (CI) and random index (RI) as follows:
The CI for a judgment matrix can be computed as a function of its maximum eigenvalue and the order n of the matrix. The CI is expressed as follows:
where n is the number of elements being compared in the matrix.
The CR of a pairwise comparison matrix is the ratio of its CI to the corresponding RI value in Table 2.
As suggested by Saaty [12], the upper threshold CR values are 0.05 for a 3 × 3 matrix, 0.08 for a 4 × 4 matrix, and 0.10 for larger matrices. If the consistency test is not satisfied, the result of the pairwise comparison matrix should be revised by discussion between experts.
Step 3. Calculating the limit super matrix
The priorities derived from the pairwise comparisons of elements are used to create the unweighted super matrix. When an element has no influence on another element, its priority value is zero. Applying the clusters to their corresponding blocks in the unweighted super matrix yields the weighted matrix. Limiting priorities for each node in the model are obtained through infinite multiplication. The limit matrix consists of synthesized values that represent the relative priorities of both the alternatives and elements in the clusters. The final weight vector is shown in the equation below:
3.4. Maturity Level of Smart Factory
We have reflected the level of the four steps about the capabilities of smart, connected products presented in a previous study [5], and divided it into the following five levels by adding the basic level of ‘Checking’.
- Checking. Factories satisfying this level have performance checklists and can collect the data related to the factory’s environments and conditions and notice changes of shop floor but the system is not linked to an external monitoring system.
- Monitoring. Factories in this level can gather the data linked to the external monitoring system and notice changes based on the information. They manage the data visually.
- Control. Based on the result of monitoring the data from shop floor and external system, a factory with the Control level can analyze abnormalities and recover from them automatically.
- Optimization. A factory with Optimization level can integrate all the data of factory and finally optimize the entire manufacturing system by interfacing with devices, facilities, external and internal systems from a holistic viewpoint.
- Autonomy. A factory that reaches Autonomy maturity level can operate the factory without any intervention and diagnose abnormalities for itself based on artificial intelligence.
4. Case Study
4.1. Description of Companies
To validate and verify how the proposed methodology can be applied, we will illustrate the process of employing the methodology through a case study of manufacturing companies. We selected only 20 SMEs in the Republic of Korea due to budget constraints. First, we selected 10 companies through open recruitment for smart factory diagnosis. And we selected 10 more companies out of 20 companies, which were recommended by the Korea Smart Factory Foundation as best-practice companies, avoiding oversights of size, industry, and region. We named 20 companies from A to T. The average turnover of the 20 companies was about USD 25.7 million and the average number of employees 107 in 2014. The manufacturing processes of the companies consisted of molding, assembling, machining, painting, and casting.
4.2. Experimental Results
4.2.1. Hierarchical Cluster Analysis According to the Importance of Value Chain
The main objective of hierarchical cluster analysis is to classify SMEs in the Republic of Korea in terms of the importance of their value chain. Based on the result of hierarchical cluster analysis, we will compare the weights of the proposed methodology with those of the existing methodology. Before the cluster analysis, we collected datasets of SMEs with consultants and categorized them as three levels according to the importance for each process of value chain as shown in Table 3. To conduct a quantitative analysis we transform the three levels into scores (1, 5, and 10). Because we selected 20 companies to evaluate the maturity level of smart factory, the MES part of all companies in the value chain is important.
The data were classified using hierarchical cluster analysis, which is a multivariate statistical technique that is used to classify cases according to the similarity or dissimilarity of their characteristics by minimizing within-group variance while also maximizing between-group variance. We used a package hclust in R program, which is a software environment for statistical computing, to classify SMEs on the basis of the importance of value chain instead of predetermined criteria. The result of hierarchical clustering analysis is given in Table 4.
Table 4 reveals that the clusters contain the following numbers of companies: Facility-centered group (7 companies), Purchase and inventory-centered group (6 companies), and All-round group (7 companies). Facility-centered group consists of companies with strong importance of the facility control in value chain. The second group called Purchase and inventory-centered group mainly emphasizes the Purchasing & Inventory Management process in their value chain. All-round group companies place at least moderate importance on every part of the value chain. For all groups, MES is always important and considered to be a backbone of a smart factory because of the importance of monitoring and control.
4.2.2. Application of the Proposed Methodology for Each Cluster
In order to calculate the importance of each alternative solution according to our overall objective, we carry out a pairwise comparison for every element and cluster in the network structure. The priority vectors are used to create an unweighted super matrix, which is presented in Table 5.
Finally, we convert the unweighted super matrix into a weighted super matrix in Table 6. The weight of each cluster is calculated by using pairwise comparisons between each pair of clusters. These weights are multiplied by the sub-matrix of the corresponding super matrix and a weighted super matrix is generated. From this weighted super matrix, we can then derive the limit matrix, which is shown in Table 7. As a result, each column represents the final weights of sub-criteria considering interdependencies between criteria.
4.3. Result and Implications
The weightings of each criterion for the proposed methodology is presented in Figure 3 compared to those of the simple methodology. Figure 3 shows that the weightings of Production Planning and Process Management increased significantly because of considering interdependencies in the network model. On the other hand, Leadership & Strategy substantially decreased due to the low importance as a result of the pairwise comparisons related to the criterion. Overall, weights of the proposed method clearly reveal the emphasis placed by the smart factory on Process and System & Automation modules. Improving the core activities’ score of Process and System & Automation modules could be crucial for achieving a higher maturity level of smart factory.
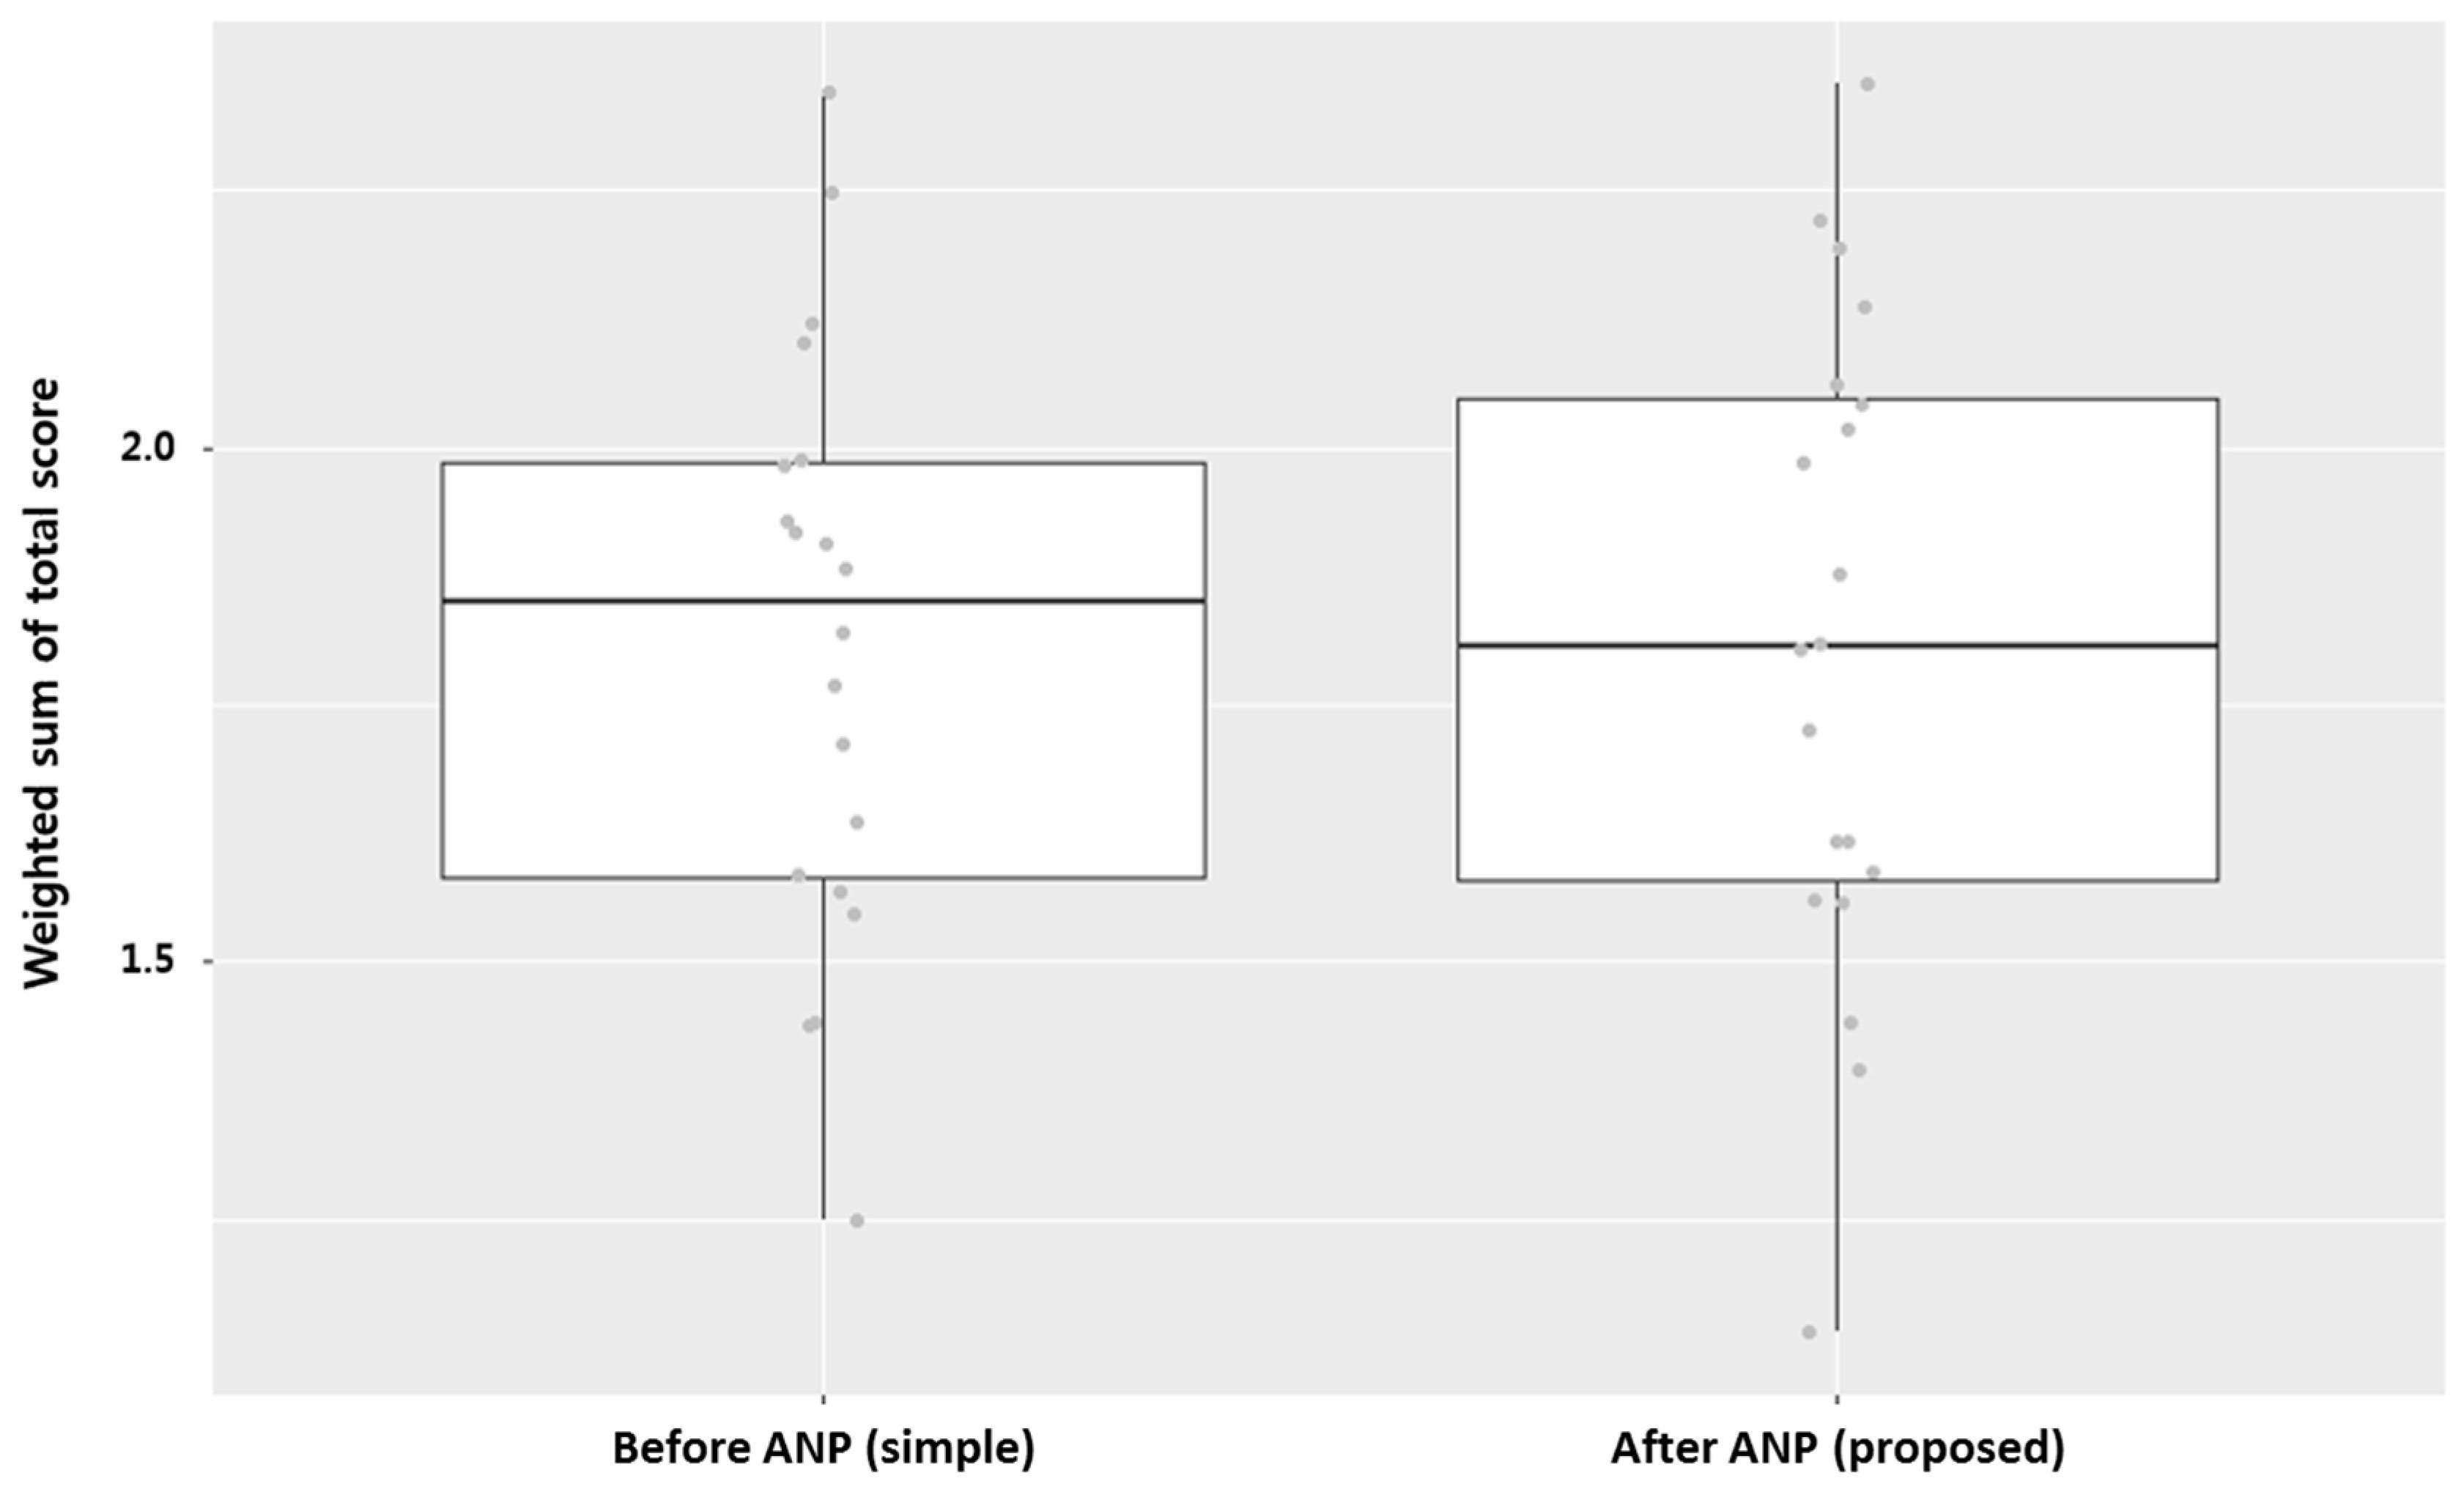
In terms of weighted sum of score, the comparison of simple (BeforeANP) and proposed (AfterANP) methodologies is summarized in Figure 4. The scatter and box plot shows that ANP strengthened power of discrimination among companies because the sparsity of score and the gap between the first quartile and the third quartile increased.
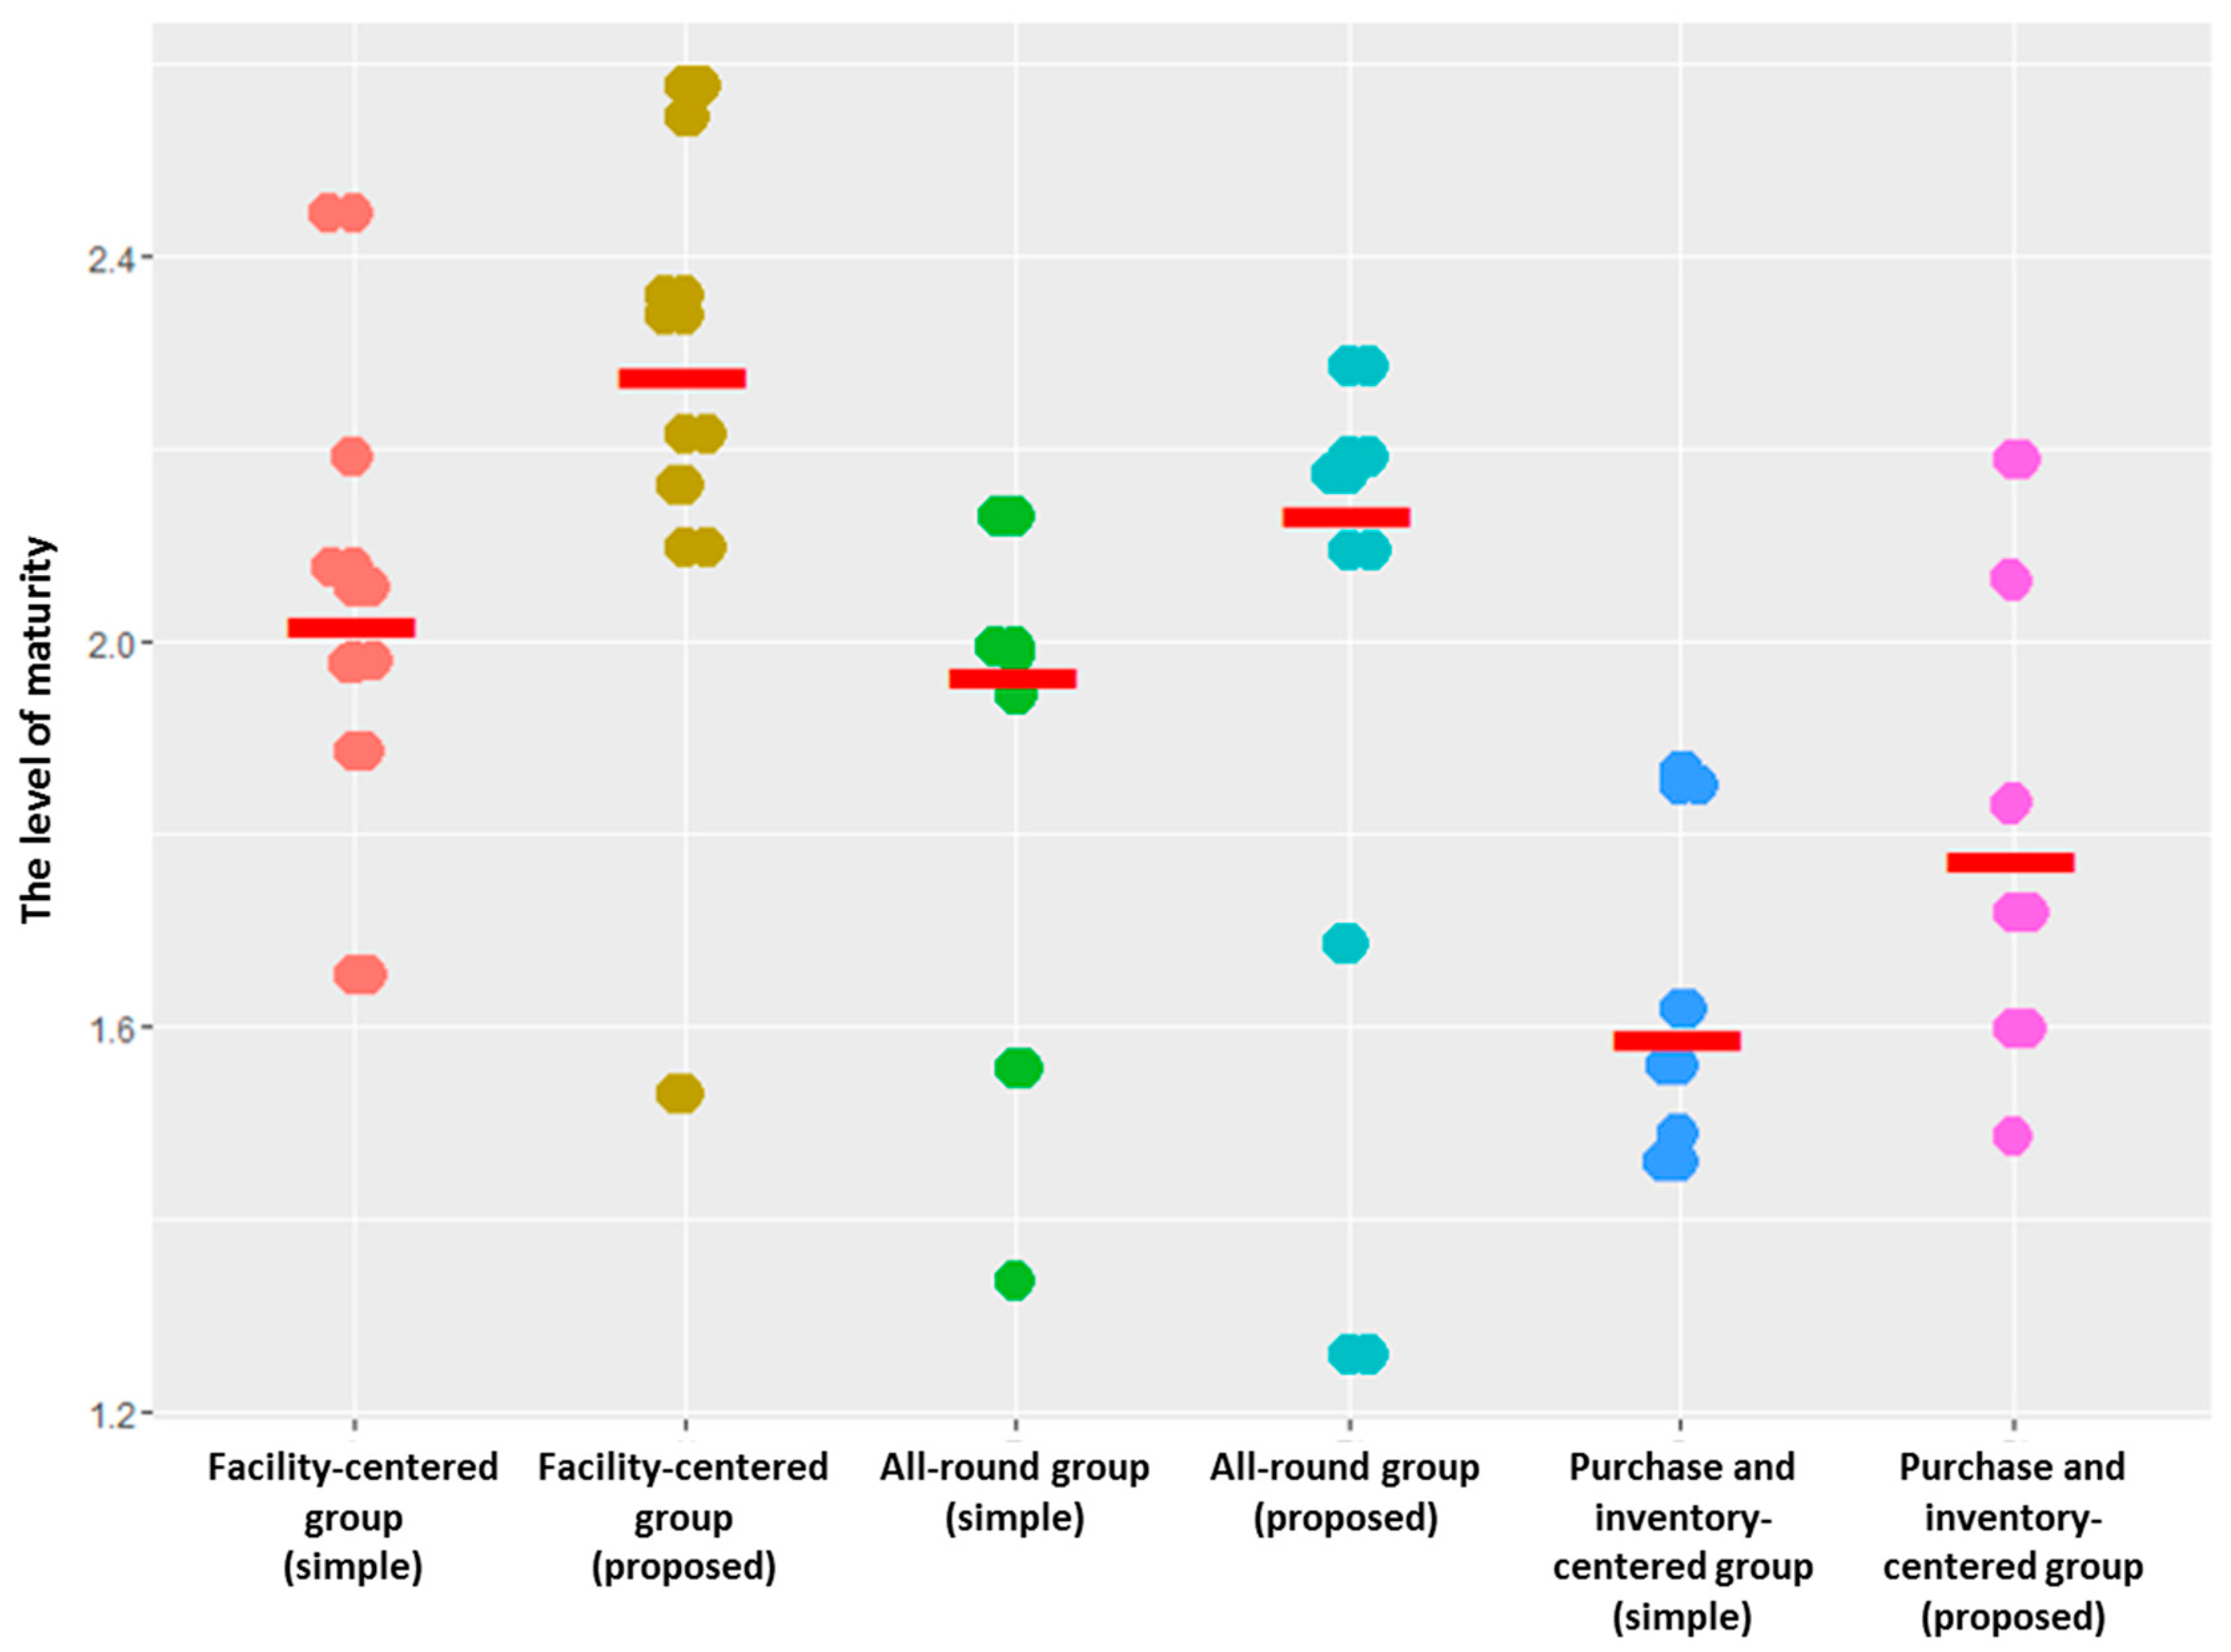
In addition to the sum of weighted score, the median and distribution of simple and proposed score for each group are summarized in Figure 5. As shown in the figure, the median and sparsity of each group has increased significantly by applying the proposed methodology. Also, the median and sparsity of each group is diverse according to the parts of value chain that are companies focus on. In particular, the gap between the highest and lowest score for each group increased significantly. These results show that the proposed methodology provides a better understanding of the maturity level of smart factory because of the improved power of discrimination.
5. Conclusions
In order to propose a smartness assessment methodology for factories, this paper set up a conceptual framework of smart factory and organized criteria and assessment items. We also proposed an assessment framework so that we could evaluate the smartness for factories. With ANP and clustering methods, we set the weights for criteria of the framework and performed a case study of SMEs.
The legacy simple weighting models for smart factories merely considered the judgment of the decision maker or involved partially revising existing models. To overcome the limitation, our proposed methodology considers interdependencies among criteria for the assessment of smart factory. We used ANP to create a network structure that can incorporate correlations among criteria that are influential for evaluating the performance assessments of a smart factory. Moreover, the study was supplemented with a case study of SMEs to compare the maturity level of smart factories and verify the proposed model.
As a result, the application of ANP leads to more precise calculation of weightings because of the consideration of interdependencies between criteria. Furthermore, hierarchical cluster analysis was used to classify SMEs into three types: Facility-centered group, All-round group, and Purchase and inventory-centered group. In practice, the information on the clusters, criteria, and interdependencies of industries can be obtained to consider the characteristics of each industry because the importance of each module can vary according to the specific industry. For example, factories that follow make-to-order (MTO) manufacturing processes have low importance on the Product Development module. Meanwhile, the importance of production planning can be weakened if the manufacturing process is simple. By considering additional factors or providing more detailed specifications for the criteria for existing factors, it is possible to further improve the accuracy and reliability of the ANP model’s results.
Author Contributions
Lee and Chang conceived and designed the framework; Lee, Jun and Chang performed a case study; Jun analyzed the data; Lee, Jun, Chang and Park wrote the paper.
Conflicts of Interest
The authors declare no conflict of interest.
References
- Herrmann, C.; Schmidt, C.; Kurle, D.; Blume, S.; Thiede, S. Sustainability in Manufacturing and Factories of the Future. Int. J. Precis. Eng. Manuf. Green Technol. 2014, 1, 283–292. [Google Scholar] [CrossRef]
- Lucke, D.; Constantinescu, C.; Westkämper, E. Smart Factory—A Step towards the Next Generation of Manufacturing. In Manufacturing Systems and Technologies for the New Frontier, Proceedings of the 41st CIRP Conference on Manufacturing Systems, Tokyo, Japan, 26–28 May 2008; Mitsuishi, M., Ueda, K., Kimura, F., Eds.; Springer: London, UK, 2008; pp. 115–118. [Google Scholar]
- Zuehlke, D. SmartFactory—Towards a factory-of-things. Annu. Rev. Control 2010, 34, 129–138. [Google Scholar] [CrossRef]
- Wang, S.; Wan, J.; Li, D.; Zhang, C. Implementing smart factory of Industrie 4.0: An outlook. Int. J. Distrib. Sens. Netw. 2016. [Google Scholar] [CrossRef]
- Chen, D.; Thiede, S.; Schudeleit, T.; Herrmann, C. A holistic and rapid sustainability assessment tool for manufacturing SMEs. CIRP Ann. Manuf. Technol. 2014, 63, 437–440. [Google Scholar] [CrossRef]
- Lichtblau, K.; Goericke, D.; Stich., V. Industrie 4.0 Readiness, VDMA. Available online: https://www.industrie40-readiness.de/?lang=en (accessed on 26 October 2016).
- Porter, M.E.; Heppelmann, J.E. How smart, connected products are transforming competition. Harv. Bus. Rev. 2014, 92, 64–88. [Google Scholar]
- Jung, K.; Kulvatunyou, B.; Choi, S.; Brundage, M.P. An Overview of a Smart Manufacturing System Readiness Assessment. In Proceedings of the International Conference on Advances in Production Management Systems, Iguassu Falls, Brazil, 3–7 September 2016. [Google Scholar]
- Gunasekaran, A.; Patel, C.; McGaughey, R.E. A framework for supply chain performance measurement. Int. J. Product. Econ. 2004, 87, 333–347. [Google Scholar] [CrossRef]
- Chen, I.J.; Paulraj, A. Towards a theory of supply chain management: The constructs and measurements. J. Oper. Manag. 2004, 22, 119–150. [Google Scholar] [CrossRef]
- Hwang, G.; Lee, J.; Park, J.; Chang, T. Developing performance measurement system for Internet of Things and smart factory environment. Int. J. Product. Res. 2017, 55, 2590–2601. [Google Scholar] [CrossRef]
- Al-Dhaafri, H.S.; Al-Swidi, A.K.; Al-Ansi, A.A. Organizational Excellence as the Driver for Organizational Performance: A Study on Dubai Police. Int. J. Bus. Manag. 2016, 11, 47. [Google Scholar] [CrossRef]
- Kim, C.M.; Lee, J.C.; Choi, S.W. Study for Development Directions and Real Application Cases of Korea Production System (KPS). Appl. Mech. Mater. 2015, 752, 1320–1332. [Google Scholar] [CrossRef]
- Tzeng, G.H.; Huang, J.J. Multiple Attribute Decision Making: Methods and Applications; CRC Press: Boca Raton, FL, USA, 2011. [Google Scholar]
- Saaty, T.L. How to make a decision: The analytic hierarchy process. Eur. J. Oper. Res. 1990, 48, 9–26. [Google Scholar] [CrossRef]
- Saaty, T.L. Decision Making with Dependence and Feedback: The Analytic Network Process; RWS Publications: Pittsburgh, PA, USA, 1996; Volume 4922. [Google Scholar]
- Anthony, R. Planning and Control: A Framework for Analysis; Division of Research, Harvard University Graduate Business School of Business Administration: Boston, MA, USA, 1965. [Google Scholar]
- Arndt, A.; Anderl, R. Employee Data Model for Flexible and Intelligent Assistance Systems in Smart Factories. In Advances in Ergonomics of Manufacturing: Managing the Enterprise of the Future; Springer: Cham, Switzerland, 2016; pp. 503–515. [Google Scholar]
Figure 1.
Conceptual framework for assessment.

Figure 2.
A network model based on the criteria and assessment items.
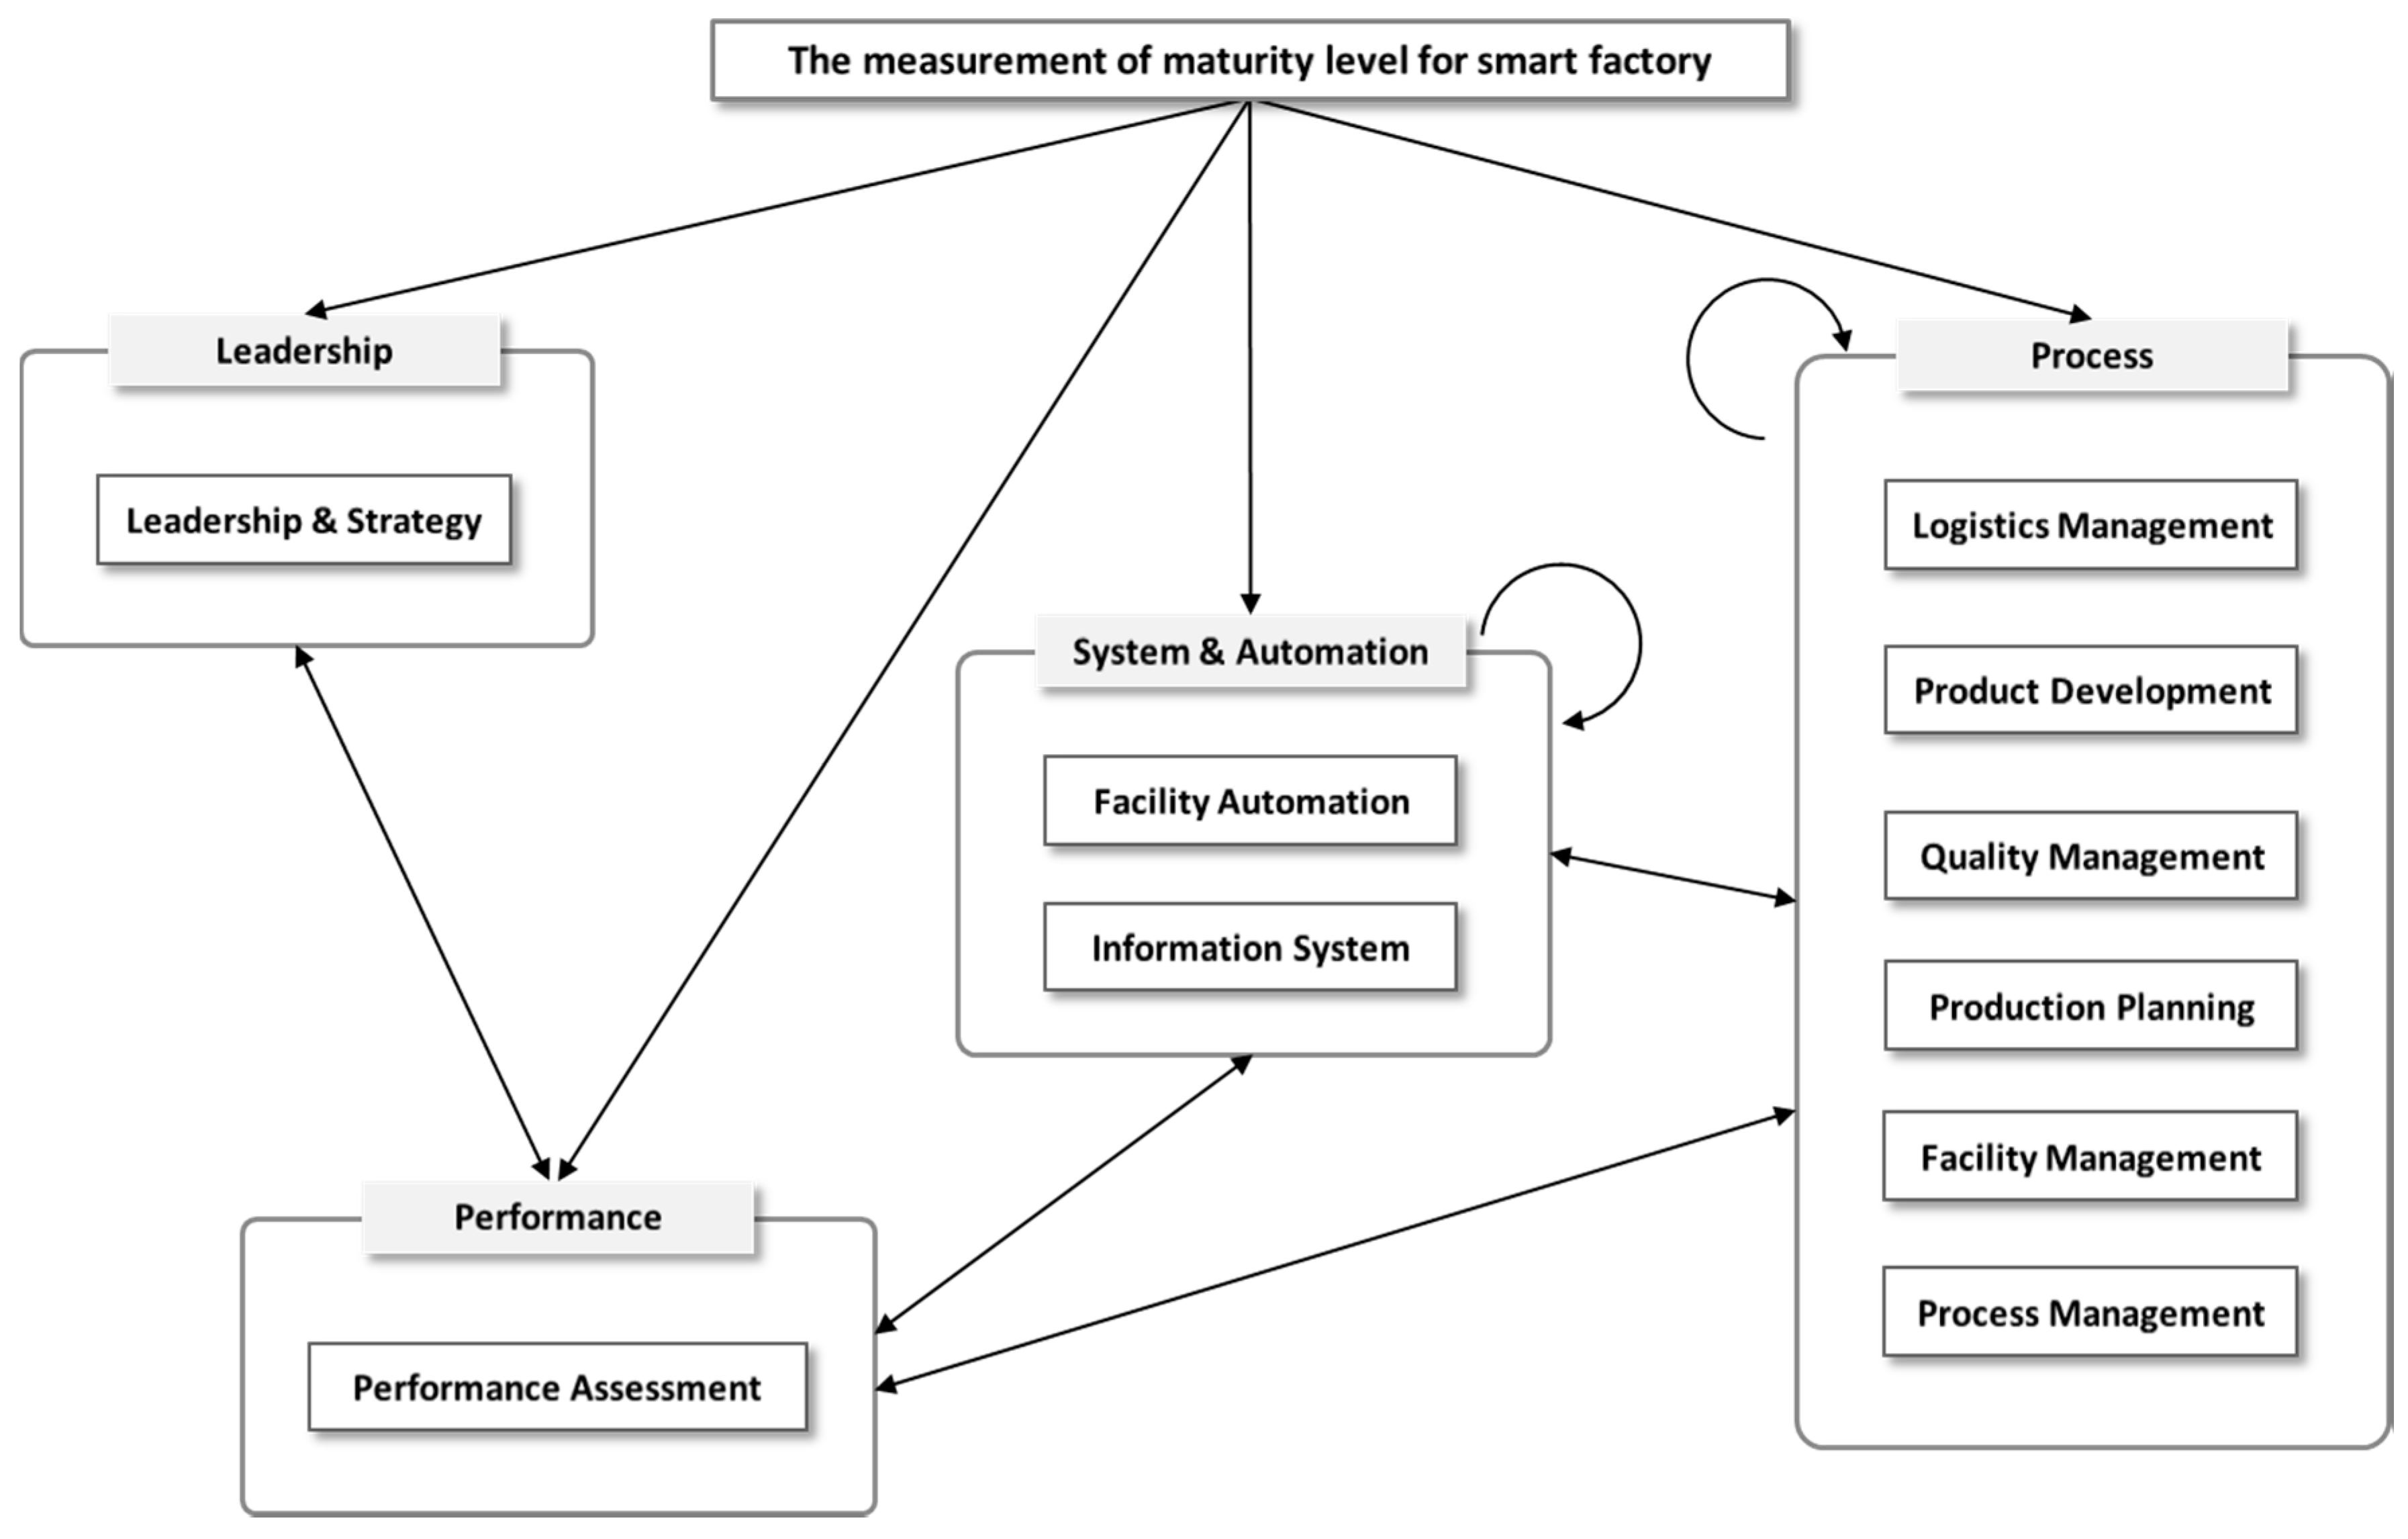
Figure 3.
Weights of criteria calculated by the proposed methodology.
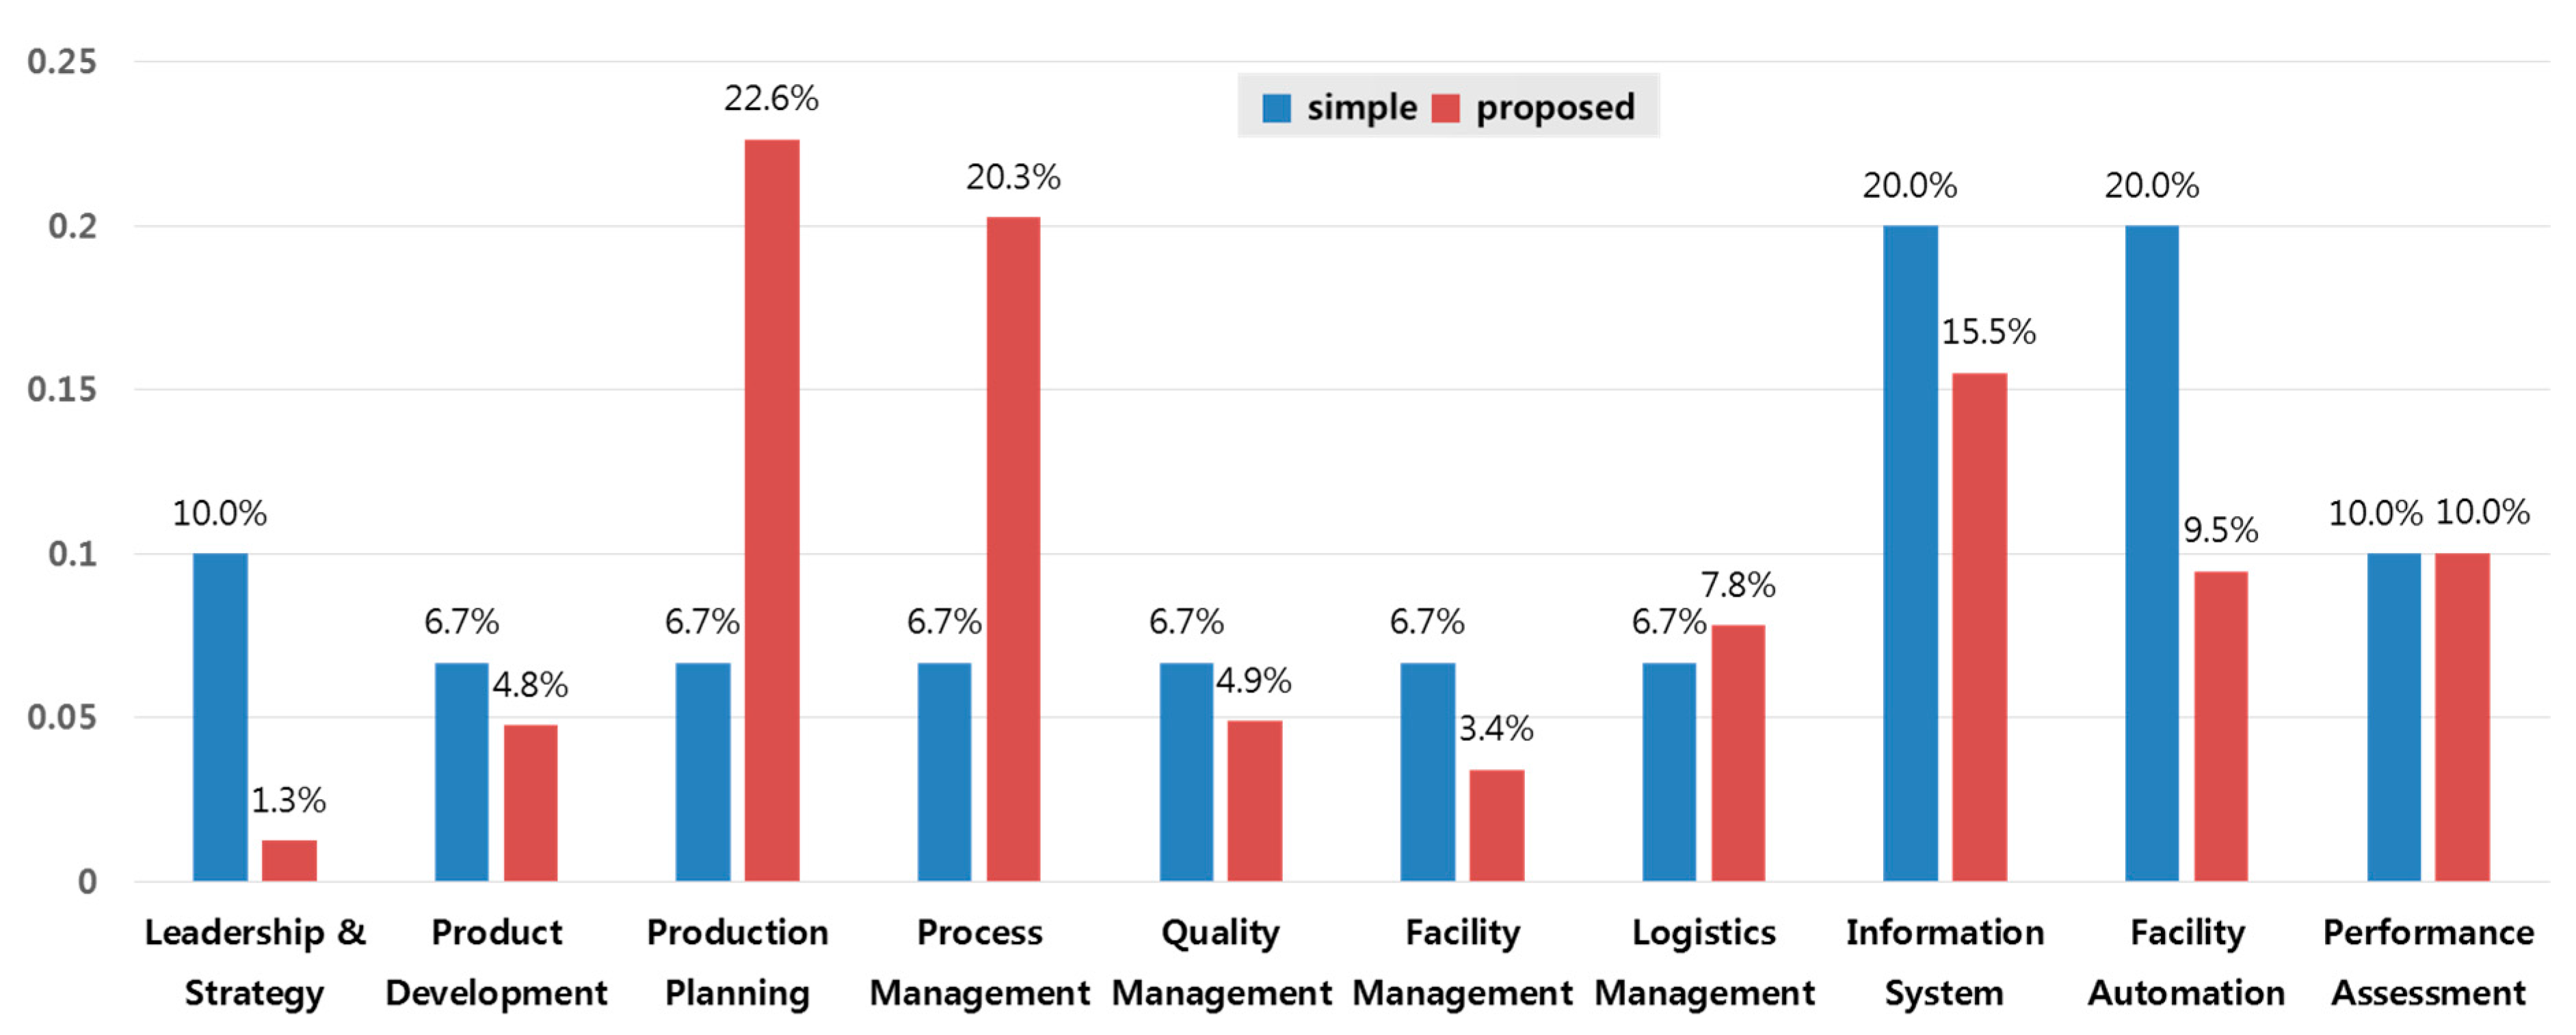
Figure 4.
Weighted sum of total score.

Figure 5.
Weights of groups classified by the importance of value chain.

Table 1.
Criteria, Sub-criteria and Assessment Items.
| Criteria | Sub-Criteria | Assessment Items |
|---|---|---|
| Leadership | Leadership & Strategy | CEO leadership Strategy and plan for implementing smart factory Management of organization and capability of smart factory Management of KPIs (key performance indicators) |
| Process | Product Development | Procedure of product development Product design and evaluation Process design and evaluation Management of product information Management of technical information |
| Production Planning | Management of information for production planning Demand and order planning Sales and operation planning Master production scheduling | |
| Process Control | Development of the detailed job schedule and order Management of the production progress Management of abnormalities in the manufacturing process | |
| Quality Control | Management of information for quality control Management of documents of standards for quality control Management of testing data Management of machines and equipment for quality control | |
| Facility Management | Management of the operation of facilities Maintenance of facilities Management of spare parts Management of molds, jigs, and tools | |
| Logistics Management | Management of the demand of materials Management of orders and lead times Management of storing and releasing products in a warehouse Management of racking systems Management of peaking and delivering products Management of information about delivering and tracking | |
| System & Automation | Information System | Utilization of ERP and SCM Utilization of MES Utilization of PLM Utilization of FEMS Management of information security |
| Facility Automation | Automation of manufacturing facilities Automation of logistics facilities Automation of evaluation and testing facilities Automation of information network for facilities Management of energy, safety, and environment | |
| Performance | Performance Assessment | Productivity Quality Cost Lead time Safety Environment |
Table 2.
Random index values according to n.
| n | 1 | 2 | 3 | 4 | 5 | 6 | 7 | 8 | 9 | 10 | 11 |
|---|---|---|---|---|---|---|---|---|---|---|---|
| RI | 0.00 | 0.00 | 0.58 | 0.90 | 1.12 | 1.24 | 1.32 | 1.41 | 1.45 | 1.49 | 1.51 |
Table 3.
Evaluation results of the importance of value chain.
| Companies and Their Product Types | Value Chain | ||||||
|---|---|---|---|---|---|---|---|
| Product Development & Design | Production Planning | MES (Process/Quality/Facility) | Purchase & Inventory Management | Delivery | Facility Control | ||
| A | Display inspection facilities | ★ | ○ | ★ | ○ | △ | △ |
| B | Injection molding | △ | ★ | ★ | △ | △ | ★ |
| C | Telecommunication devices | ★ | △ | ★ | ○ | △ | △ |
| D | Plates | △ | ○ | ★ | △ | △ | △ |
| E | Medical devices | △ | ○ | ★ | ○ | △ | ○ |
| F | Automotive parts | △ | ○ | ★ | △ | △ | ★ |
| G | Springs and pins | △ | ★ | ★ | ○ | △ | △ |
| H | Hydraulic valves | △ | ○ | ★ | ★ | △ | ○ |
| I | Sheet metal | △ | ○ | ★ | ○ | △ | △ |
| J | Automotive parts | △ | ★ | ★ | △ | △ | ★ |
| K | Heat treatment | △ | ○ | ★ | ○ | ○ | ★ |
| L | Automotive parts | ★ | ○ | ★ | ○ | ○ | ★ |
| M | Electronic parts | ○ | ○ | ★ | ○ | ○ | ★ |
| N | Gear pump and Hydraulic motor | ★ | ○ | ★ | ○ | ○ | ★ |
| O | Industrial pump | ○ | ○ | ★ | ★ | ○ | ○ |
| P | Telecommunication devices | ○ | ○ | ★ | ○ | △ | △ |
| Q | Fine ceramic, quartz, and glass | △ | ○ | ★ | ○ | △ | ○ |
| R | Safety glasses | ★ | ○ | ★ | ★ | ○ | ○ |
| S | Medical devices | ★ | ○ | ★ | ★ | ○ | ○ |
| T | Antennas | ★ | ○ | ★ | ○ | ○ | ○ |
★: Strong Importance; ○: Moderate Importance; △: Weak Importance.
Table 4.
The result of hierarchical cluster analysis.
| Group | Companies | Description |
|---|---|---|
| Facility-centered group | B, F, J, K, L, M, N | The importance of Production Planning and Facility Control process in value chain is greater than other processes. |
| Purchase and inventory-centered group | A, C, D, G, I, P | Purchasing & Inventory Management process is relatively more important than other groups. |
| All-round group | E, H, O, Q, R, S, T | Most of processes in value chain are significant and have balanced importance. |
Table 5.
Unweighted super matrix.
| Leadership & Strategy | Product Development | Production Planning | Process Management | Quality Management | Facility Management | Logistics Management | Information System | Facility Automation | Performance Assessment | |
|---|---|---|---|---|---|---|---|---|---|---|
| Leadership & Strategy | 0 | 1 | 0 | 0 | 0 | 0 | 0 | 0 | 0 | 0 |
| Product Development | 1 | 0 | 1 | 1 | 1 | 1 | 1 | 1 | 1 | 1 |
| Production Planning | 0 | 0.04168 | 0 | 0 | 0 | 0.66667 | 0 | 0 | 0.05862 | 0.05893 |
| Process Management | 0 | 0.10490 | 0 | 0 | 0.2 | 0 | 0.19469 | 0 | 0.11590 | 0 |
| Quality Management | 0 | 0.27814 | 0 | 0.5 | 0 | 0 | 0.71723 | 0 | 0.29724 | 0.25157 |
| Facility Management | 0 | 0.08447 | 1 | 0 | 0 | 0 | 0.08808 | 0 | 0 | 0.13131 |
| Logistics Management | 0 | 0.31584 | 0 | 0.5 | 0.8 | 0.33333 | 0 | 0 | 0.33675 | 0.36937 |
| Information System | 0 | 0.17497 | 0 | 0 | 0 | 0 | 0 | 0 | 0.19149 | 0.18882 |
| Facility Automation | 0 | 0 | 0.66667 | 1 | 0.66667 | 0 | 0.5 | 0.33333 | 0 | 1 |
| Performance Assessment | 0 | 0 | 0.33333 | 0 | 0.33333 | 1 | 0.5 | 0.66667 | 0 | 0 |
Table 6.
Weighted super matrix.
| Leadership & Strategy | Product Development | Production Planning | Process Management | Quality Management | Facility Management | Logistics Management | Information System | Facility Automation | Performance Assessment | |
|---|---|---|---|---|---|---|---|---|---|---|
| Leadership & Strategy | 0 | 0.12500 | 0 | 0 | 0 | 0 | 0 | 0 | 0 | 0 |
| Product Development | 1 | 0 | 0.07796 | 0.07796 | 0.07796 | 0.07796 | 0.07796 | 0.21349 | 0.15046 | 0.08362 |
| Production Planning | 0 | 0.03647 | 0 | 0 | 0 | 0.42323 | 0 | 0 | 0.04980 | 0.02782 |
| Process Management | 0 | 0.09179 | 0 | 0 | 0.12697 | 0 | 0.12360 | 0 | 0.09846 | 0 |
| Quality Management | 0 | 0.24337 | 0 | 0.31742 | 0 | 0 | 0.45533 | 0 | 0.25251 | 0.11877 |
| Facility Management | 0 | 0.07391 | 0.63484 | 0 | 0 | 0 | 0.05591 | 0 | 0 | 0.06199 |
| Logistics Management | 0 | 0.27636 | 0 | 0.31742 | 0.50787 | 0.21161 | 0 | 0 | 0.28608 | 0.17438 |
| Information System | 0 | 0.15310 | 0 | 0 | 0 | 0 | 0 | 0 | 0.16267 | 0.08914 |
| Facility Automation | 0 | 0 | 0.19147 | 0.28720 | 0.19147 | 0 | 0.14360 | 0.26217 | 0 | 0.44427 |
| Performance Assessment | 0 | 0 | 0.09573 | 0 | 0.09573 | 0.28720 | 0.14360 | 0.52434 | 0 | 0 |
Table 7.
Limit matrix.
| Leadership & Strategy | Product Development | Production Planning | Process Management | Quality Management | Facility Management | Logistics Management | Information System | Facility Automation | Performance Assessment | |
|---|---|---|---|---|---|---|---|---|---|---|
| Leadership & Strategy | 0.01251 | 0.01251 | 0.01251 | 0.01251 | 0.01251 | 0.01251 | 0.01251 | 0.01251 | 0.01251 | 0.01251 |
| Product Development | 0.04759 | 0.04759 | 0.04759 | 0.04759 | 0.04759 | 0.04759 | 0.04759 | 0.04759 | 0.04759 | 0.04759 |
| Production Planning | 0.22629 | 0.22629 | 0.22629 | 0.22629 | 0.22629 | 0.22629 | 0.22629 | 0.22629 | 0.22629 | 0.22629 |
| Process Management | 0.20260 | 0.20260 | 0.20260 | 0.20260 | 0.20260 | 0.20260 | 0.20260 | 0.20260 | 0.20260 | 0.20260 |
| Quality Management | 0.04898 | 0.04898 | 0.04898 | 0.04898 | 0.04898 | 0.04898 | 0.04898 | 0.04898 | 0.04898 | 0.04898 |
| Facility Management | 0.03415 | 0.03415 | 0.03415 | 0.03415 | 0.03415 | 0.03415 | 0.03415 | 0.03415 | 0.03415 | 0.03415 |
| Logistics Management | 0.07815 | 0.07815 | 0.07815 | 0.07815 | 0.07815 | 0.07815 | 0.07815 | 0.07815 | 0.07815 | 0.07815 |
| Information System | 0.15510 | 0.15510 | 0.15510 | 0.15510 | 0.15510 | 0.15510 | 0.15510 | 0.15510 | 0.15510 | 0.15510 |
| Facility Automation | 0.09451 | 0.09451 | 0.09451 | 0.09451 | 0.09451 | 0.09451 | 0.09451 | 0.09451 | 0.09451 | 0.09451 |
| Performance Assessment | 0.10011 | 0.10011 | 0.10011 | 0.10011 | 0.10011 | 0.10011 | 0.10011 | 0.10011 | 0.10011 | 0.10011 |
© 2017 by the authors. Licensee MDPI, Basel, Switzerland. This article is an open access article distributed under the terms and conditions of the Creative Commons Attribution (CC BY) license (http://creativecommons.org/licenses/by/4.0/).
Share and Cite
MDPI and ACS Style
Lee, J.; Jun, S.; Chang, T.-W.; Park, J. A Smartness Assessment Framework for Smart Factories Using Analytic Network Process. Sustainability 2017, 9, 794. https://doi.org/10.3390/su9050794
AMA Style
Lee J, Jun S, Chang T-W, Park J. A Smartness Assessment Framework for Smart Factories Using Analytic Network Process. Sustainability. 2017; 9(5):794. https://doi.org/10.3390/su9050794
Chicago/Turabian StyleLee, Jeongcheol, Sungbum Jun, Tai-Woo Chang, and Jinwoo Park. 2017. "A Smartness Assessment Framework for Smart Factories Using Analytic Network Process" Sustainability 9, no. 5: 794. https://doi.org/10.3390/su9050794
Note that from the first issue of 2016, this journal uses article numbers instead of page numbers. See further details here.