
Specific Features of Parks and Their Impact on Regulation and Cultural Ecosystem Services Provision in Warsaw, Poland

Department of Landscape Architecture, Warsaw University of Life Sciences—SGGW, ul. Nowoursynowska 159, 02-776 Warsaw, Poland
*
Author to whom correspondence should be addressed.
Sustainability 2017, 9(5), 792; https://doi.org/10.3390/su9050792
Submission received: 31 December 2016
/
Revised: 4 May 2017
/
Accepted: 7 May 2017
/
Published: 10 May 2017
(This article belongs to the Special Issue Maintaining Ecosystem Services to Support Urban Needs)
Abstract
:Urban parks are important elements of city green infrastructure. Many studies highlight their positive influence on the quality of life and human well-being as well as their significance for sustaining natural processes in built-up areas. For the last decade, much has been written about urban ecosystem services (ES), however in comparison with the abundance of studies on the potential for delivering ecosystem services by different land use and land cover types, research on the capacity of parks to deliver these services depending on site-specific elements, is relatively uncommon. Thus, this paper reports on research that explored levels of local regulating and cultural ecosystem services delivered by Warsaw parks, as these services are considered as the most important for urban dwellers. The authors based the study on data included in existing policy documents related to environmental and spatial planning for Warsaw, and evaluation of Warsaw green spaces. The assessment included 10 ecosystem services: micro-climate regulation, air quality regulation, noise reduction, balancing rainwater peaks, recreation, social inclusion, physical health benefits, nature experiences, aesthetic appreciation, and sense of identity. The assessment was performed for all Warsaw public parks, covering an area over 2 ha (n = 82). The results enabled us: (1) to assess all parks with respect to their actual impact in delivering 10 studied ecosystem services; (2) to designate their potential capacity to deliver regulating and cultural services; and (3) to allocate all assessed parks into categories that represent their predominant character (multifunctional, with cultural advantage, with regulating advantage or without any predominant function).

1. Introduction
Parks, beside water bodies and forests are regarded as basic elements of green infrastructure (GI) that provide ecosystem services (ES) in urban areas [1,2,3,4,5]. The green infrastructure concept is tightly linked with ES, as green infrastructure is designed and managed in order to deliver a wide range of ES to residents [6]. Among the wide variety of ecosystem services listed in CICES (The Common International Classification of Ecosystem Services), urban parks provide mostly ES in regulating and maintenance, as well as cultural services. It is widely acknowledged that urban parks provide primarily regulating and cultural services of local importance [1,7,8] thus; these services directly influence human wellbeing and quality of life [9]. A review of recent research revealed that the most frequently quoted ES provided by urban parks are: microclimate regulation, air quality regulation, noise reduction, water peak balancing, flood control, erosion control, recreation, social inclusion, psycho-physical health benefits, nature experience, aesthetic appreciation, sense of place and identity, and cognitive development (Table 1).
Many authors underline a positive influence of ES provided by urban parks on quality of life [1,12,15] or human health [16], as well as their significance for sustaining natural processes in built-up areas [17,18,19]. However, in comparison with the abundance of studies on the potential for delivering ecosystem services by different land use and land cover types, studies of the capacity for particular parks to deliver these services, are relatively uncommon (e.g., [2,20,21]).
Since urban ES are site-specific and dependent on local conditions [1,8,11], the characteristics and features of particular parks influence the set and degree of ES they offer. The capacities of urban parks in delivering ecosystem services may depend on various factors, e.g., size of the park [1,20], vegetation structure [2,17,22,23], land cover [11,22], user’s perception [14], accessibility, safety, aesthetics, facilities [20], or location [24]. In this study, we aimed to assess Warsaw parks: (1) in respect to their actual significance in delivering regulating and cultural services, and (2) to measure their potential for multifunctionality. Also, since multifunctionality is one of the principles of green infrastructure [25], the degree of potential multifunctionality of GI objects (e.g., urban parks) is a valuable information source for urban planners and local city authorities [26]. The concept of green infrastructure is in its initial phase of implementation in Warsaw, yet ecosystem services are not regarded as a planning target in official planning documents. In other words, the ES concept is discussed by academics, but not implemented into practice, even though an ecological approach has been present in Polish planning practice for decades [26]. We believe that research on Warsaw parks can advance the implementation of the ES concept into Warsaw green space planning policy. In regards to changing paradigms in understanding the role of urban green spaces, the authors have attempted to translate existing data into prospective indicators of park ES capacity levels. This paper demonstrates that there is a potential to develop an extensive assessment of Warsaw ES on the basis of existing data.
2. Materials and Methods
To assess the potential for parks to provide ecosystem services, we applied a qualitative tool based on a set of expert judgments, including official analytical and planning documents. The main body of our research was based on analysis of existing data. As the concept of ES is not yet included in Polish urban planning and management practice, this analysis uses indirect references to the ES concept. Alike Hansen et al. [27] we based our research on conceptual frameworks similar to ES—“landscape/ecological functions” and “benefits” that humans derive from nature. Following Burkhard et al. [10], we assumed that urban parks deliver ecosystem services at varying degrees. Parks contain different site-specific elements that affect the level of ecosystem services provision [21,24]. The possibility of ecosystem service evaluation at the city scale requires an application of uniform data for all ES providing units. Thus, the first step of our research was to identify comparable data sources for all urban parks. From the point of view of the purpose of this study, the most important sources of information about Warsaw parks were: Warsaw Public Parks’ Assessment (WPPA) [28], Warsaw Spatial Policy (WSP) [29] and Warsaw Environmental Study (WES) [30].
The WPPA is a non-mandatory sectoral study evaluating all Warsaw parks in regards to four issues: recreational qualities, technical state and safety of equipment and vegetation, environmental functioning, and cultural values. The WPPA methodology includes 34 criteria addressing the 4 above mentioned issues, and each criterion is described by a set of questions to be answered. Altogether, there are 217 cross-cutting questions to be responded, and their scope requires both field studies, GIS (Geographic Information System) analyses (e.g., of vegetation cover), and a review of official registers (e.g., a register of monuments). Thus, the WPPA also serves as a data base for Warsaw parks and green squares. It should be noted that the authors of this paper are the main authors of a methodology for the Warsaw Public Parks Assessment and they are experts who perform park assessments. The WSP and the WES are obligatory spatial planning documents elaborated at the city level. The WSP addresses issues such as directions and conditions for future spatial development, while WES presents characteristics of environmental principles that should be taken into account in a planning process.
The WSP, among other issues, explicitly defines the directions of change in the spatial structure and the land-use of a municipality, areas and the rules of preservation of the environment and its natural resources, and moreover, areas and rules of cultural heritage conservation.
The main role of the WES is to provide planners and policy makers with a wide environmental background for their development decisions. WES recommendations may refer to the adjustment of function, structure and intensity of spatial management to natural conditions, assuring the sustainability of natural processes, ensuring conditions for the renewability of natural resources, eliminating, limiting and mitigating threats or adverse impacts on the environment or people’s health, or determining the directions of degraded areas reclamation.
Both documents, the WSP and the WES, include detailed inventories and judgments related to land use, land cover, natural and cultural capital, and a quality of life. These documents are elaborated on the commission of the Warsaw municipality (i.e., Bureau of Environmental Protection and Bureau of Architecture and Planning) by experts from the fields of: spatial planning, landscape architecture, ecology, transport, social sciences, economy, cultural heritage and technical infrastructure. It should be noted that in general, planning and the policy documents are accepted by local governments and represent the up-to-date discourses of city urban planning practice [27].
The next step was to determine the scope of ES possible to address. Given the range of the available data and information examined, basing on the CICES conceptual framework [31] and literature review, we selected a set of regulating and cultural ecosystem services for further analyses (Table 2 and Table 3).
The ES related to urban parks studied in this paper included: micro-climate regulation, air quality regulation, noise reduction, water peak balancing, recreation, social inclusion, physical health benefits, nature experiences, aesthetic appreciation, and sense of identity. Other ES that may be of relevance to Warsaw parks were not considered in this study, due to a lack of available and comparable data on such services.
Using data included in the WPPA, the WSP and the WES, we determined the extent to which selected regulating and cultural ecosystem services were provided by Warsaw parks. All Warsaw parks covering an area exceeding 2 ha (n = 82) were assessed. For the purposes of this study, Warsaw parks were categorized in three size groups: small parks up to 5 ha, medium parks up to 30 ha, and large parks exceeding 30 ha. Table 4 presents the number of surveyed parks categorised by size, and the statistics calculated for each category: mean area (in ha), standard deviation, and a range of park sizes (in ha).
For each ecosystem service listed in Table 2 and Table 3, basing on the existing data, we identified its capacity. First, we performed a content analysis of existing documents in order to extract data relevant for evaluation of selected regulating and cultural ES (Table 5). As already mentioned, all surveyed documents contained expert judgments for different ecosystem functions. These judgments were essential for our assessment process. The characteristics assigned to parks’ features included in expertise (e.g., size, vegetation structure, noise level) were the point of departure for further multi-criteria analysis. For each ES we have attributed qualitative (e.g., dominance of high vegetation with diverse vertical layers, dominance of infiltration and interception), and/or quantitative (e.g., size in hectares, vegetation cover in percentage) indicators (Table 6 and Table 7), which allowed us to estimate the level of ES provision. Data contained in examined documents indirectly let us determine the extent to which the regulating and cultural services were realised.
For each individual ecosystem service based on performed assessments we applied a three level estimation scale of the ecosystem capacity level, assuming that depending on multiple park conditions and features, each park can deliver ES at low, medium or high level (Table 6 and Table 7).
This detailed evaluation of particular ES enabled us to perform an overall assessment of park’s regulating and cultural ES provision capacity. The assessment procedure involved awarding of 1 point for a “low” level, 2 points for a medium level, and 3 points for a “high” level of fulfilling the criteria. This allowed us to count the total outcome (referred later in this paper as summary score). The maximum summary score that could be gained by each park for regulating and cultural ES was 12 and 18 points respectively.
For this total outcome, we again applied a three level scale with equal intervals, and thus, we assumed that the park provided regulating or cultural ES at:
A “superior level”—if its combined result in provisioning of all individual ES (within regulating or cultural) was above 66%.
A “satisfactory level”—if its combined result in provisioning of all individual ES (within regulating or cultural) was between 34% and 66%.
A “noticeable level”—if its combined result in provisioning of all individual ES (within regulating or cultural) is less or equal to 33%.
Next, all assessed parks were qualified into four categories representing their predominant character and their potential multifunctionality:
- Multifunctional (if capacity level for providing both regulating and cultural ecosystem services is superior);
- Regulating advantage (if capacity level for providing the regulating ecosystem services is superior, and for the cultural services, is satisfactory or noticeable);
- Cultural advantage (if capacity level for providing the cultural ecosystem services is superior, and for regulating services, is satisfactory or noticeable);
- No predominant function (if capacity level for providing both regulating and cultural ecosystem services is satisfactory or noticeable).
To check the impact of particular variables on the summary score for regulating or cultural ES capacity levels of parks, a multiple linear regression was performed. Moreover, a multinomial logistic regression was applied for the selection of variables that had a significant effect for the final classification of the parks into one of the four categories (cultural advantage, regulating advantage, multifunctional, no predominant role). All statistical analyses were performed in IBM SPSS Statistics for Windows, Version 23.0 (IBM Corp, Armonk, NY, USA).
3. Results
Most of the assessed parks (51.2%) exhibited a superior capacity to deliver regulating ES, whereas only 32.9% of evaluated green spaces demonstrate superior capacity in cultural ES delivery (Figure 1). The results showed that provisioning of regulating ES by parks is more effective and easier to achieved, which was confirmed by the capacity level of regulating ES for 41.5% of parks being characterised as satisfactory, and only 7.3% of parks delivering them at a noticeable level. Furthermore, 65.85% of parks exhibited a satisfactory capacity for cultural ES provision, and only 1.2% of parks provided cultural ES at a noticeable level.
To summarise the results, and to measure the degree of potential multifunctionality among the urban parks examined, we qualified the parks according to their predominant character. The analysis revealed that the majority of Warsaw parks (41.5%) could not be characterised by their principal role in ES delivery (Table 8). Though these parks delivered both cultural and regulating ES at satisfactory and noticeable levels, they did not assume a leading role in terms of the two mentioned ES. On the other hand, 25.6% of parks were multifunctional, as they delivered both regulating and cultural ES at superior levels. Furthermore, another 25.6% of parks presented a regulating advantage (as their capacity level for providing the regulating ecosystem services was superior, and the cultural services were satisfactory or noticeable), and 7.3% of parks showed cultural advantage respectively.
Analyses of the ES delivery levels of parks allowed us to assume that the predominant character and potential multifunctionality of parks were linked with the size of the parks. Only large and medium parks were classified as multifunctional, as multifunctionality requires “space” to deliver ES at a superior level. At the same time, most large parks are multifunctional, and the rest demonstrate a regulating advantage. A very low p value for the statistical test indicated a significant relationship between the predominant character and the size of the parks (Table 8). To check the possible correlation, and to measure how well the size of parks and their regulating or cultural ES capacity levels were related, we calculated the Pearson’s correlation coefficient. The Pearson’s correlation coefficient suggested a moderate correlation and substantial relationship between the size of parks and their regulating ES capacity levels (r = 0.4258), and only a slight correlation and almost negligible relationship in relation to cultural ES was observed (r = 0.2669).
Furthermore, the results for medium parks demonstrated the widest differentiation, as they represented all park categories (Table 8). This means that size is not the only, or a leading, criterion for classifying parks into any of the four categories—other criteria play a role. Among medium parks, those with a regulating advantage predominated. Most of those parks played an important role in microclimate regulation and in balancing rainwater peaks.
In most cases, small parks did not show any predominant role in delivering ES, and only few of them demonstrated a cultural advantage. We can assume that their limited capacity in delivering regulating ES was caused by their minor size.
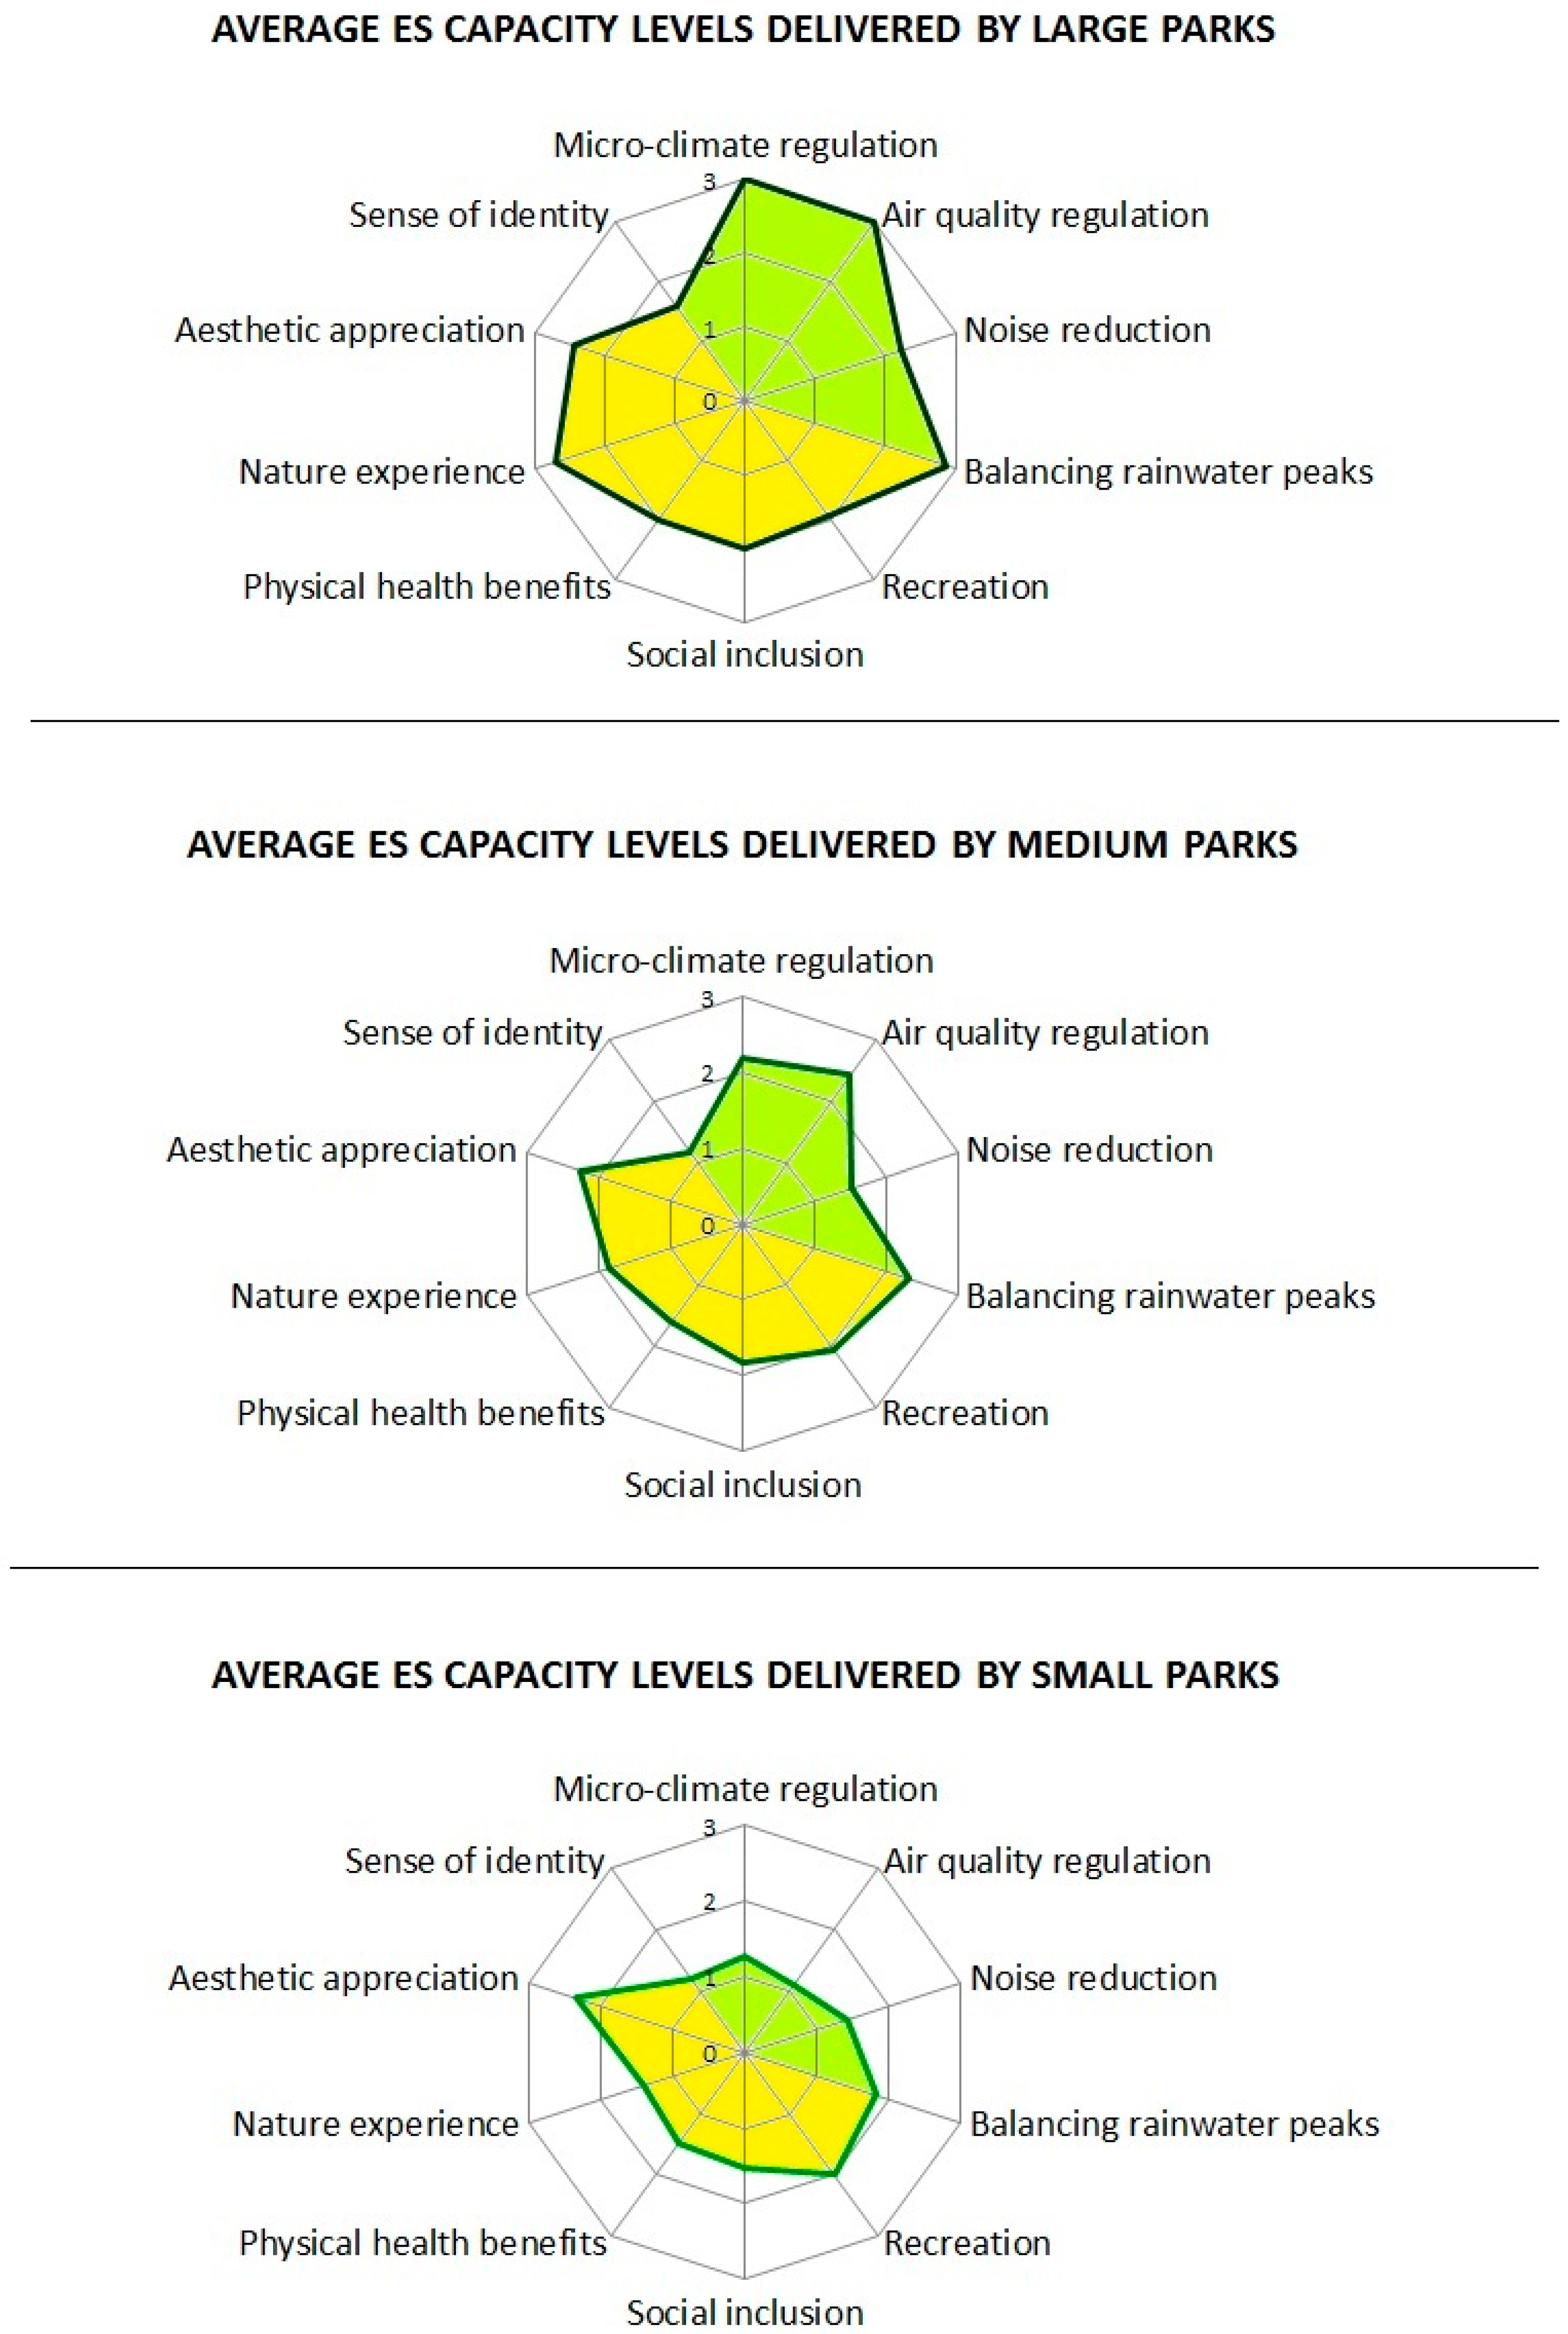
Figure 2 shows different average capacity levels of ES delivery depending on the size of evaluated parks. The bigger the park was, the more complete its potential in delivering ES.
In order to check the impact of particular variables on the summary score for regulating or cultural ES capacity levels of parks, multiple linear regression was applied (Table 9).
From the multiple linear regression results, a significant positive effect (p < 0.05) on the summary regulating score was observed for following factors: “park size”, “compact shape” and “presence of water bodies”. This meant that bigger park size, the presence of water bodies, and a compact shape (rather than fragmented) clearly raised park’s capacity to perform regulating ES. At the same time, a significant negative effect of “noise level within the entire park exceeding 60 dB” and “domination of infiltration” was noticed. Thus, the presence of these factors decreased the delivery level of regulating ES. As it concerns the delivery levels of cultural ES, the significant positive effect was caused by three variables: “large number of recreational facilities”, “habitats for rare wild fauna” and “parks listed in monument register”.
Moreover, in order to check which variables mostly influenced the final classification of parks into categories describing their predominant character (i.e., “cultural advantage”, “regulating advantage”, “multifunctional”, “no predominant role”), a multinomial logistic regression was applied (Table 10). This multinomial logistic regression was performed only for selected variables, which had a significant effect based on a Chi-square test (p < 0.05). Basing on the results of this multinomial logistic regression, amongst significantly important variables, the strongest influence was observed for: “park size”, “large number of recreational facilities” and “individual character of equipment”. For further interpretation of achieved coefficients of regression (B), we assumed that the two variables—“individual character of equipment” and “large number of recreational facilities” also influenced a potential for the park’s multifunctionality and cultural advantage, while on the contrary, a variable “park size” was linked with the potential for the park’s regulating advantage and multifuctionality. Besides, the park’s regulating advantage was better predicted by “presence of water bodies” than size. The multinomial logistic regression model may have caused ambiguous interpretation of results, due to strong correlations between variables (e.g., high coefficients’ values for domination of infiltration).
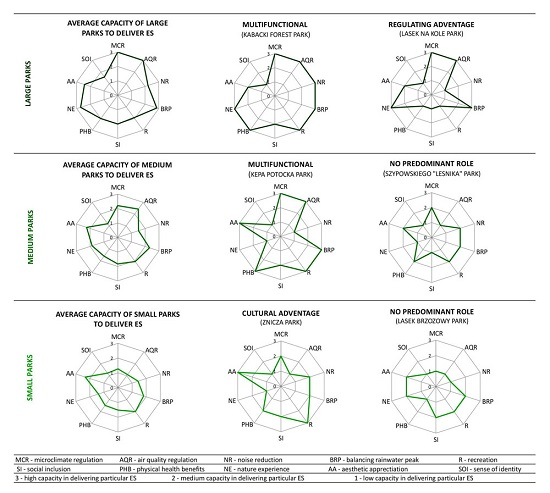
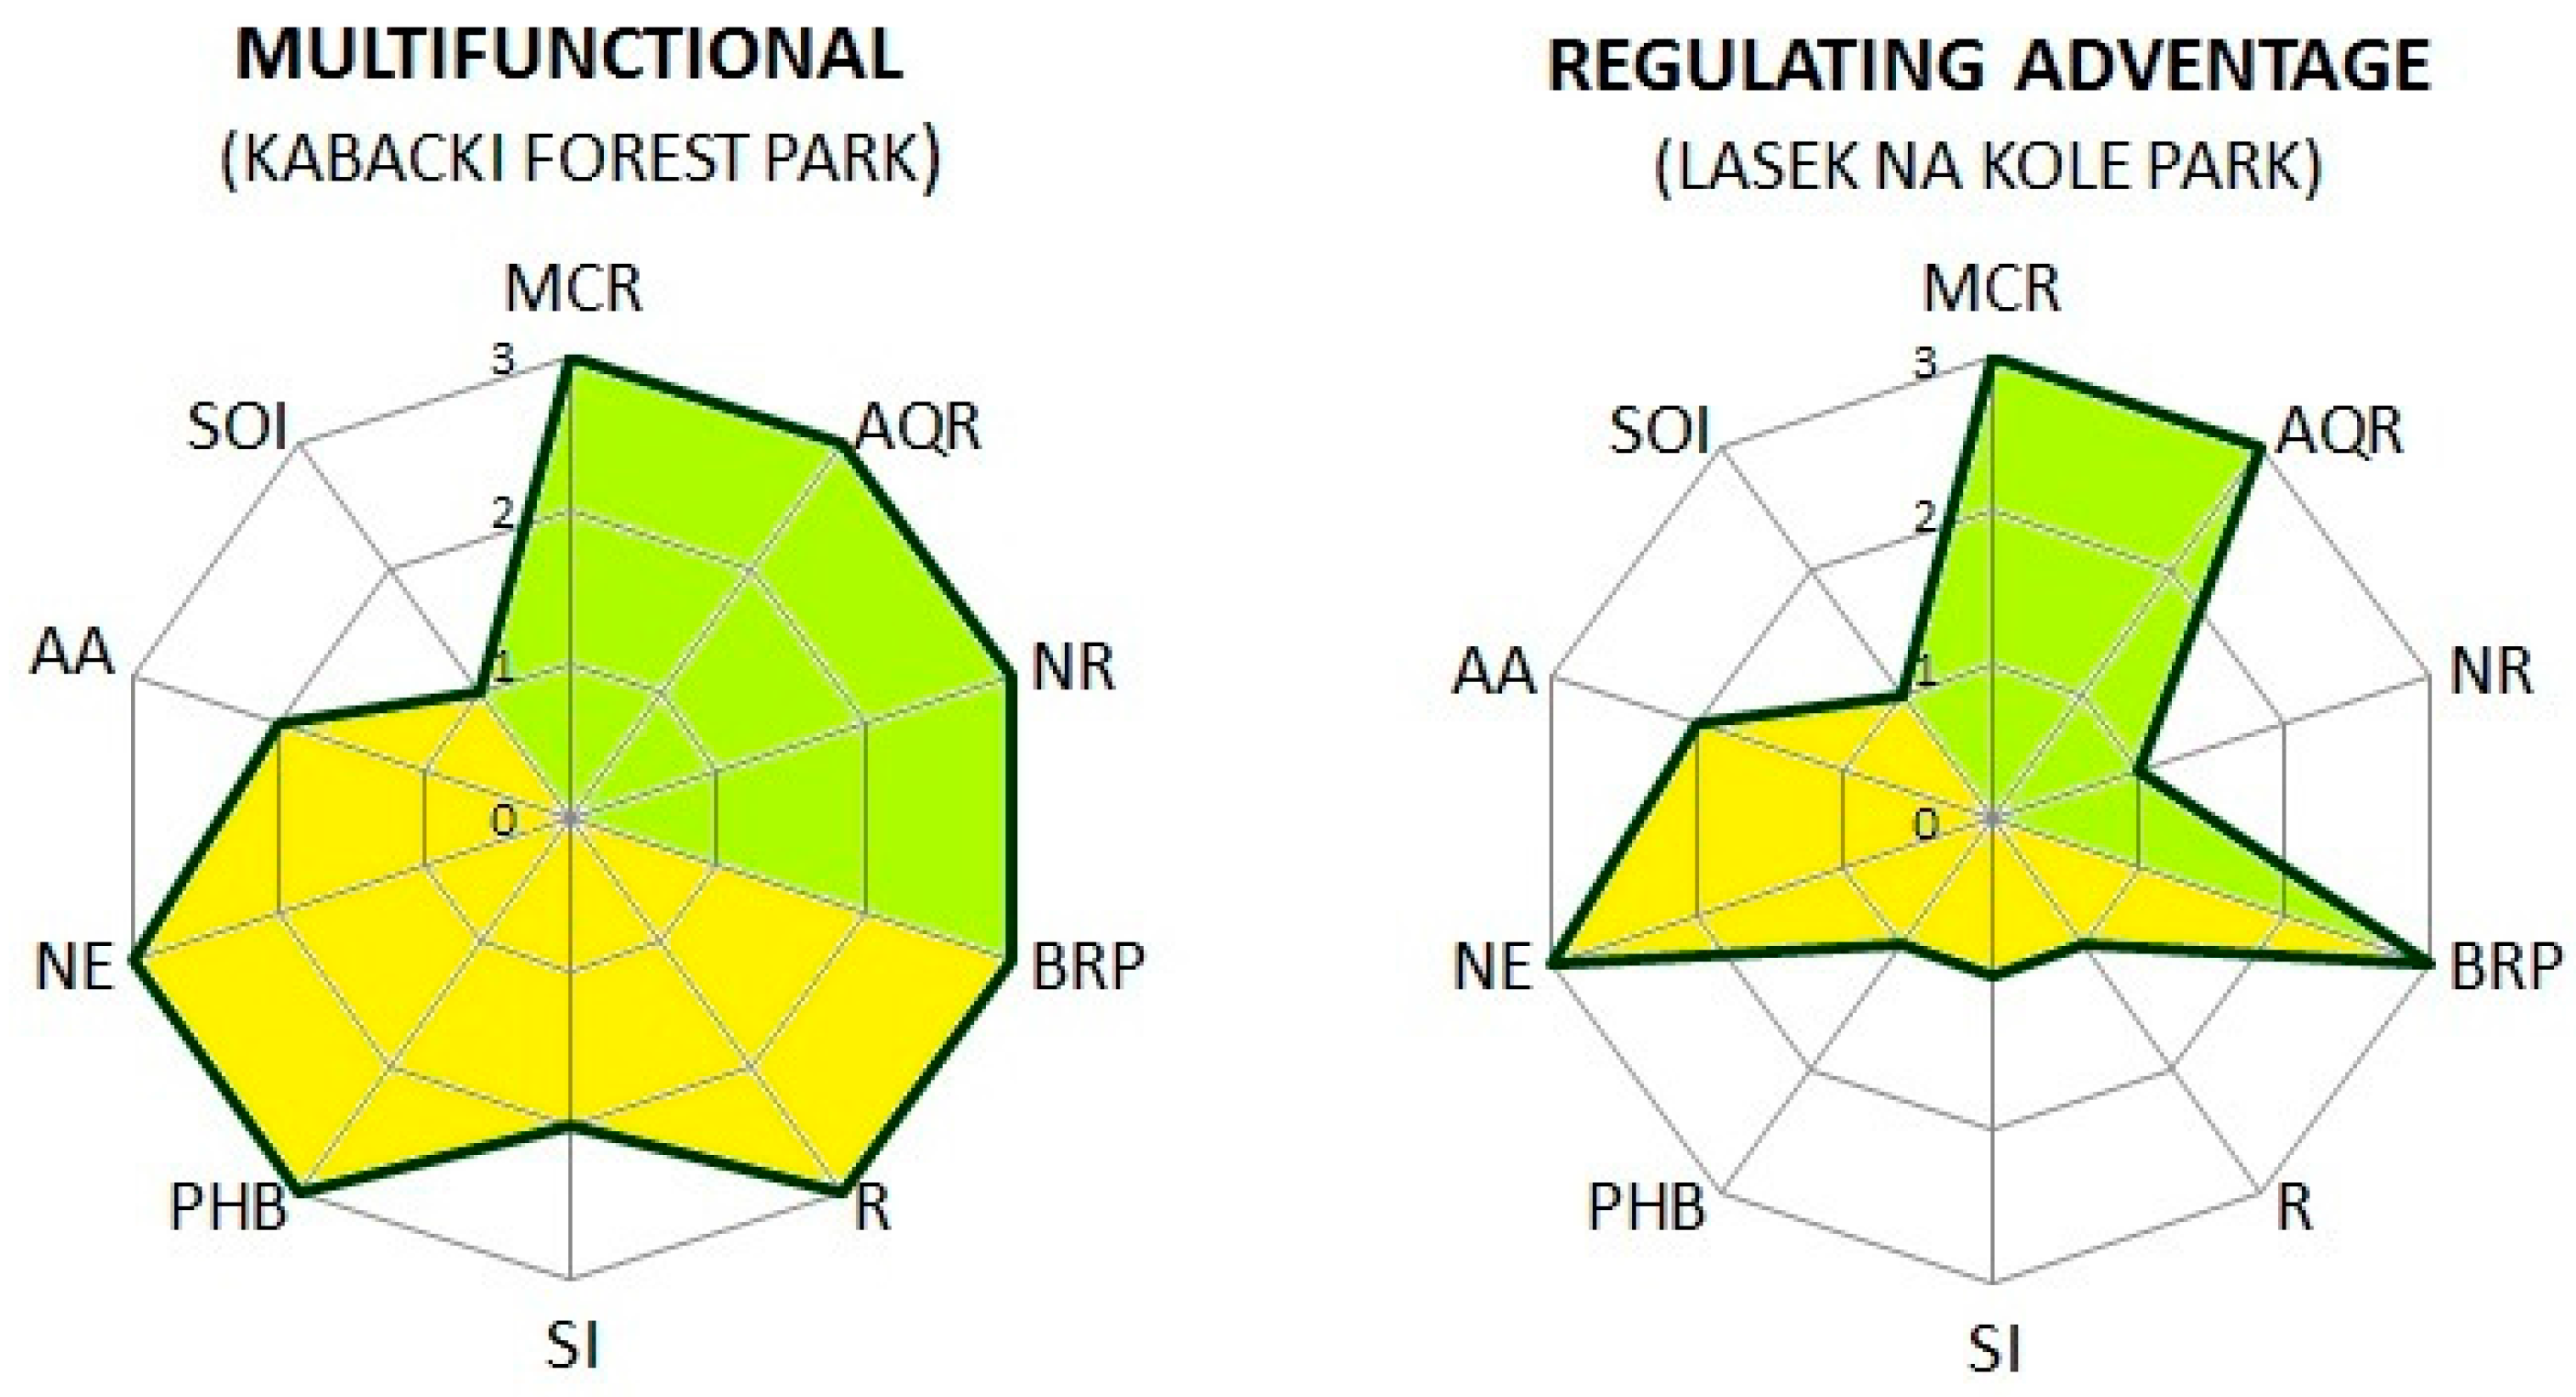
ES that were delivered at the highest possible level for the group of large parks were: microclimate regulation, air quality and balancing rainwater peaks. Besides this general trend, there were differences between particular parks. Within the group of large parks (which were represented only by multifunctional and regulating advantage categories) there were parks that exhibited varying potential for particular ES, e.g., “Kabaty Forest Park” and “Lasek na Kole Park”, both of which played an important role in natural experiences, however “Lasek na Kole Park” had a limited potential for other services, mainly recreation, social inclusion, and physical health benefits. This was resultant of a shortage of recreational facilities (Figure 3).
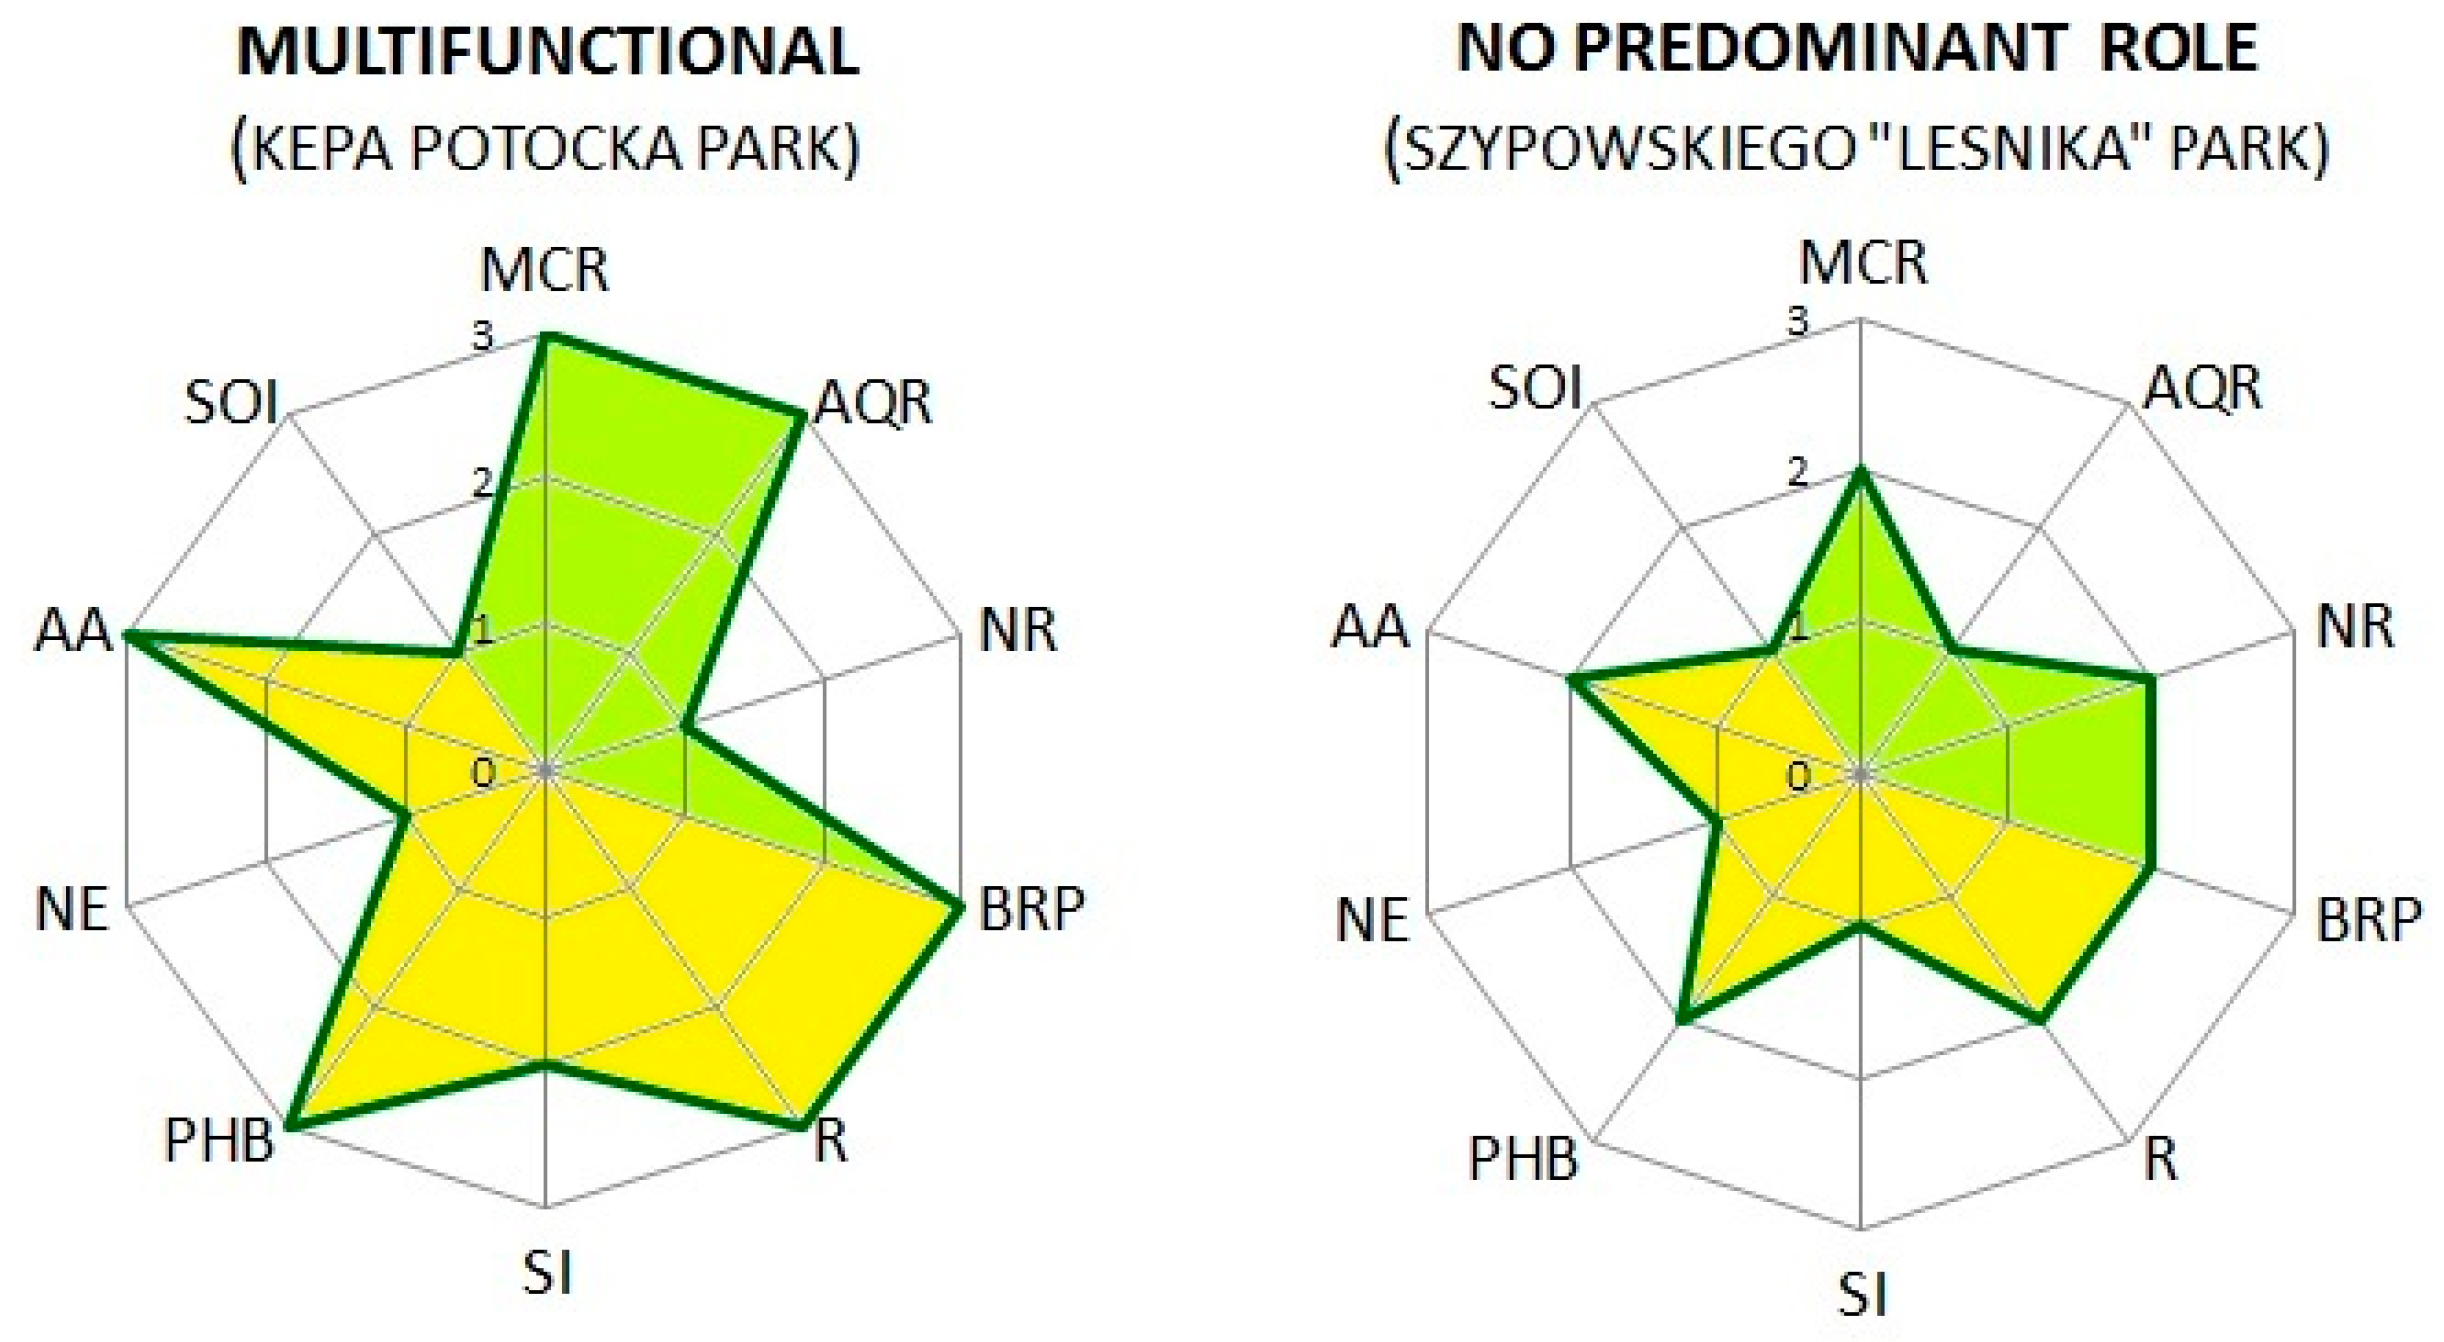
On the contrary, medium parks in general were important for recreation, aesthetic appreciation, microclimate regulation, air quality, and balancing rainwater peaks. However, the capacity level of the latter ES was lower than the case of big parks. As shown in Table 8, medium parks were multifarious. In this category, the example parks showed the most diverse results. “Kepa Potocka Park” was classified as a multifunctional, mainly due to its high level in delivering 6 out of 10 ES (Figure 4). Conversly, “Szypowskiego Lesnika Park” had no predominant role in delivering ES (Figure 4). This was due to a low level of maintenance, a big proportion of sealed surfaces, poorly differentiated vertical vegetation structure, and a smaller range of recreational facilities.
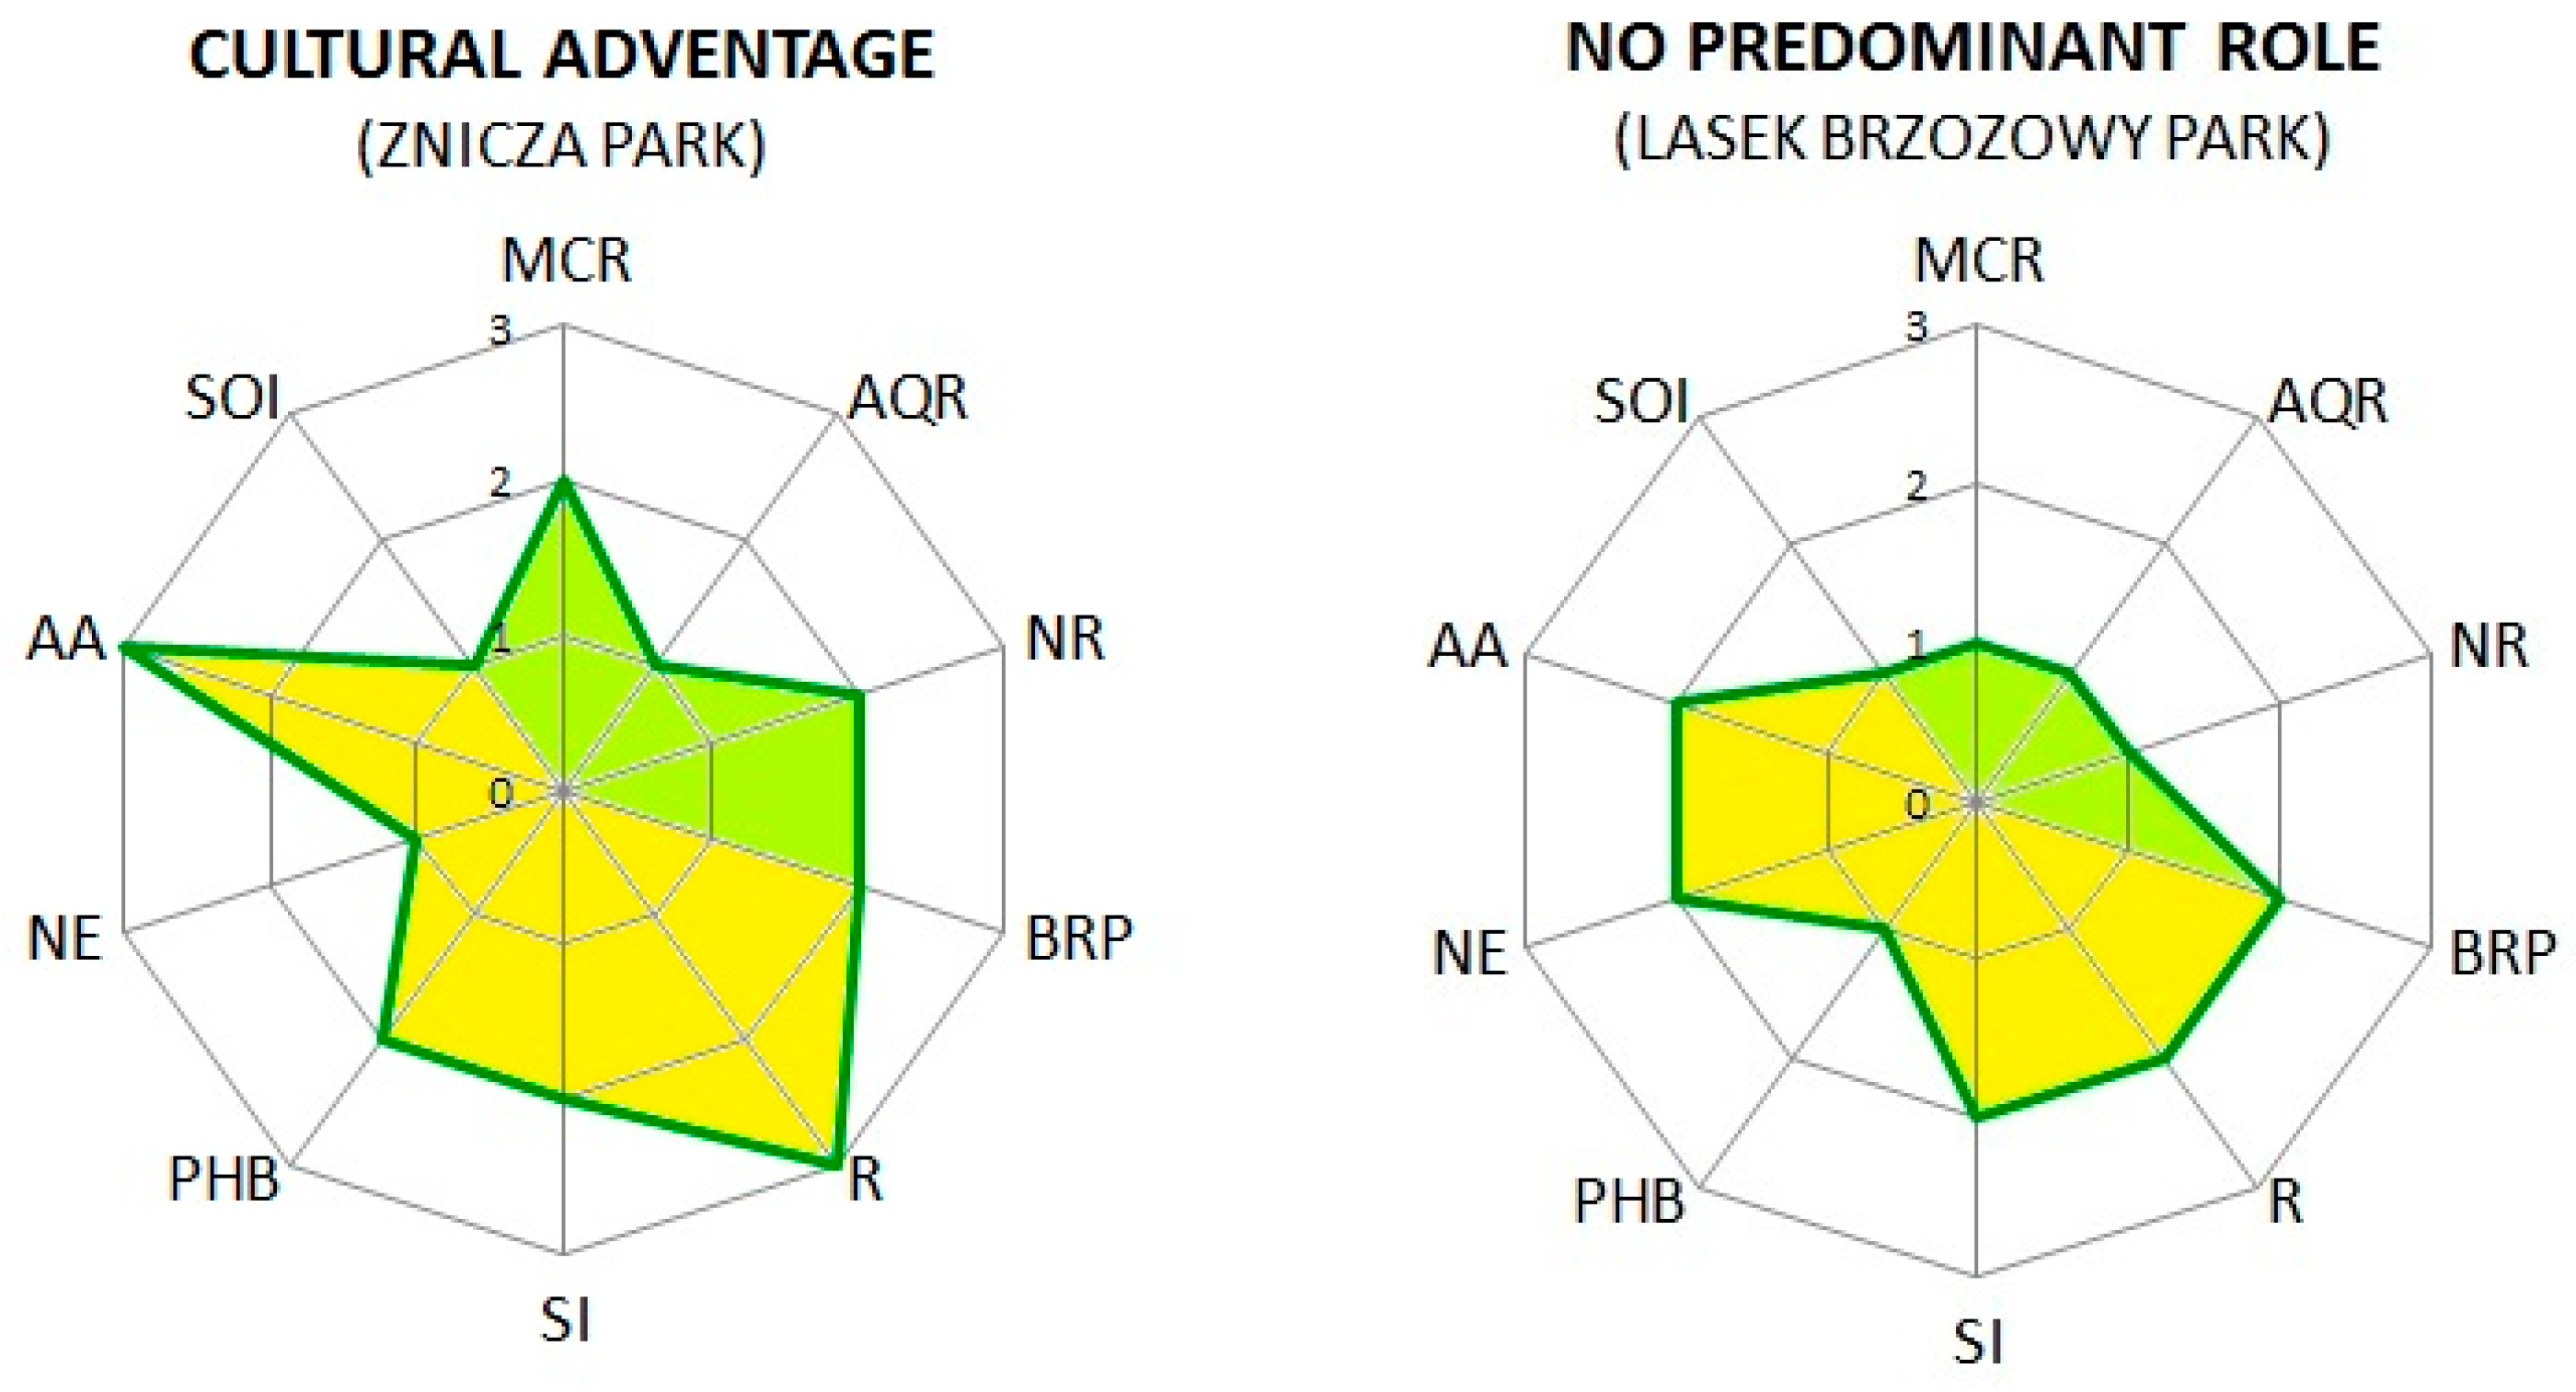
Warsaw’s small parks distinguished themselves by high-maintenance regimes, ornamental plantations, and an overall manicured character. Performed analyses demonstrated that these small green spaces served for local recreation and aesthetic appreciation. Due to their limited size, they had a low or medium capacity in delivering ES, e.g., “Lasek Brzozowy Park” (Figure 5). However, some small parks, especially those recently refurbished, provided dwellers with high-levels of recreational services, e.g., “Znicza Park” (Figure 5).
4. Discussion
Our study revealed that larger parks were generally more effective at providing regulating ES, while small parks were more likely to confer an advantage toward cultural ES. However, ES provision varied substantially based on a park context, and we identified a number of other natural and anthropogenic park features impacting both types of ES. The adopted approach fitted well a non-monetary assessment of ecosystem services that has gained popularity as a tool for supporting decision makers in valuing and promoting ES supply [21]. Measuring the capacity of the ecosystem to provide regulating services is a challenging task, and involves a broad understanding of ecological and hydrological processes [32]; however qualitative tools raise the potential for primary screenings, or rough assessments [33]. Also, quantifying cultural ES is arduous, as despite being commonly recognised as providing cultural ES, they are often reckoned as “intangible”, “subjective” and difficult to assess in monetary terms [34,35]. At the same time, there are many examples showing that certain landscape features (e.g., specific type of vegetation cover) are strongly associated with cultural identities and social practices, and understanding these relationships is a prospect for defining the right indicators for cultural ES evaluation [34]. Moreover, these intangible or nonmaterial dimensions of cultural ES can be potentially more desirable for people than material ones [35]. Thus, the importance of our research lies in advancing the knowledge on understanding how parks provide ES, and as highlighted by Maes [36], this knowledge is essential for responsible environmental management. Furthermore, the presented method can be considered as a low-cost tool that can act as a departure point for ecosystem service mapping, modelling or valuation [33].
According to Bennett et al. recommendations [37], the analysis of ES delivery cannot be based on a single type of data, i.e., a land cover, as such analysis lacks a socio–ecological connection, which is critical to understand the relation of multiple ecosystem services. Thus, in our research we tried to further incorporate park characteristics, or parameters describing park qualities. Our scope of criteria and results are in line with findings of Ibes [11] showing that the provisioning of recreation in urban parks is related to their accessibility, safety, aesthetics and facilities. On the other hand, our research revealed that the capacity of forest parks to provide ES was not always higher than other urban green spaces, as noted by Burkhard et al. [38]. The examples of studied Warsaw parks showed that depending on actual parks’ characteristics, the levels of ES provision may vary. Besides, the results of performed linear regression showed that the presence of water bodies increased the overall level of regulating ES provided by parks, which is also underscored in research by Burhard et al. [38].
Urban pressure on open spaces located within built environments also leads to local authorities being urged to design and manage multifunctional green spaces. An evaluation of the capacity of parks to deliver ES can help to acknowledge their significance both from a social and an environmental perspective. Moreover, quantifying those capacity levels can become an important tool for local authorities, in order to enhance sustainable open space management and planning. Our findings are in line with a current trend in wider research exploring the social recognition of the importance of biodiversity conservation, and the understanding of people’s attitudes and perceptions about ecosystem services [14,39,40,41]. It should be taken into account that ES capacity levels are site- and time-specific, but not static [32], and this capacity reacts to temporal and spatial changes of both natural and human-made conditions.
However, it should be also noted that as each research has its limitations, also in our case, we found some shortcomings. Those related, first of all, to data availability and their timeliness. The question of appropriate criteria for ES assessment was a key issue, as applying different measures could lead to other outcomes. Our research also may have been regarded as subjective, although expert-based assessments are strongly dependent on the experts’ experience, knowledge and objectivity [42].
5. Conclusions
In this paper we piloted a methodology to assess the capacity levels of parks in delivering ES. The presented research enabled us to determine the predominant character of Warsaw parks, and to measure their multifunctionality potential. We believe that our research fills the knowledge gap in regards to elaboration of a complete methodology enabling a diagnosis of the capacity levels of public parks in delivering ES. The elaborated methodology, and the elucidated criteria for the measurement of those capacity levels of ES, is an attempt to work out an assessment tool for allowing the integrated analysis of overlapping ecosystem services. Acknowledging those criteria for evaluation creates a possibility for intentional design, and planning and management of urban green spaces, which are extremely important, especially at present when we are facing challenges of increasing consumption of open spaces worldwide.
In general, Warsaw parks delivered ES at varied levels, depending on their characteristics. Our research showed that urban ES are site specific and rely on local conditions. Thus, altering the park’s features, such as enhancing bioretention facilities or vertical vegetation structures, can result in changes in regulating ES provided by particular parks. Likewise, enhancing access to recreational facilities can improve cultural ES provision. As a consequence, conscious planning of green spaces can influence the benefits that people obtain from specifically from parks.
Integration of the ES concept with planning and green space management practices requires the translation of scientific findings into actionable knowledge [36], which can be achieved by defining recommendations on how parks could be managed in the future. These recommendations may refer to the quality and quantity of park features. The study results showed that the size of a park is a very influential variable defining the delivery level of regulating ES. However, most cities struggle with urban pressure on green open spaces, and it is often not possible to enlarge the area of existing parks. Nevertheless, basing on the presented research results, some recommendations enhancing ES delivery levels of urban parks can be listed. The capacity level to deliver cultural ES of a park can be increased by introducing a wider array of recreational possibilities for urban dwellers. Moreover, designing park equipment with individual character is a very important factor. This individualisation of park space/park design should be a result of a co-creation process involving local residents and artists. The level of delivery of regulating ES can also be enhanced by taking greater account towards native vegetation, and dedicating spaces for water retention.
It should be emphasized that knowledge about how landscape features affect the ability for parks to deliver ES, is crucial for sustainable planning and management of green spaces. Hence, for ultimate success, constant monitoring of park features, and a systematic data collection are needed. Furthermore, users’ preferences in regards to design and management of parks should be taken into consideration, as they are the recipients of ecosystem services. Understanding the ability of parks to deliver multifarious ES is a sine qua non condition in reaching GI multifunctionality.
Acknowledgments
The work presented in this paper is a part of the project “The concept of green infrastructure” carried out in the Department of Landscape Architecture of Warsaw University of Life Sciences—SGGW. The research grant was provided by the Ministry of Science and Higher Education of Poland (in the framework of statutory research support, 2015–2016). The authors would like to thank Dariusz Gozdowski for his insights and help in statistical analyses.
Author Contributions
The overall planning and design of the presented research was done by Renata Giedych. The data collection, content analyses of documents and other subsequent investigations, interpretation of data, as well as writing the manuscript was done equally by Renata Giedych and Gabriela Maksymiuk.
Conflicts of Interest
The authors declare no conflict of interest. The founding sponsors had no role in the design of the study; in the collection, analyses, or interpretation of data; in the writing of the manuscript, and in the decision to publish the results.
References
- Bolund, P.; Hunhammar, S. Ecosystem services in urban areas. Ecol. Econ. 1999, 29, 293–301. [Google Scholar] [CrossRef]
- Breuste, J.; Qureshi, S.; Li, J. Scaling down the ecosystem services at local level for urban parks of three megacities. Hercynia-Ökologie Umw. Mitteleur. 2013, 46, 1–20. [Google Scholar]
- Taylor-Lovell, S.; Taylor, R.J. Supplying urban ecosystem services through multifunctional green infrastructure in the United States. Landsc. Ecol. 2013, 28, 1447–1463. [Google Scholar] [CrossRef]
- The Economics of Ecosystems and Biodiversity (TEEB). Mainstreaming the Economics of Nature a Synthesis of the Approach. Conclusions and Recommendations of TEEB; Progress Press: Valletta, Malta, 2010; p. 36. [Google Scholar]
- Li, F.; Ye, Y.P.; Song, B.W.; Wang, R.S.; Tao, Y. Assessing the changes in land use and ecosystem services in Changzhou municipality, Peoples’ Republic of China, 1991–2006. Ecol. Indic. 2014, 42, 95–103. [Google Scholar] [CrossRef]
- European Commission. Building a Green Infrastructure for Europe; Publications Office of the European Union: Luxembourg, 2013. [Google Scholar] [CrossRef]
- Bezak, P.; Lyytimaki, J. Complexity of Urban ecosystem services in the context of global change. Ecologia 2011, 30, 22–35. [Google Scholar] [CrossRef]
- Gómez-Baggethun, E.; Barton, D.N. Classifying and valuing ecosystem services for urban planning. Ecol. Econ. 2013, 86, 235–245. [Google Scholar] [CrossRef]
- Boyd, J.; Banzhaf, S. What are ecosystem services? The need for standardized environmental accounting units. Ecol. Econ. 2007, 63, 616–626. [Google Scholar] [CrossRef]
- Burkhard, B.; Kroll, F.; Müller, F.; Windhorst, W. Landscapes’ capacities to provide ecosystem services—A concept for land-cover based assessments. Landsc. Online 2009, 15, 1–22. [Google Scholar] [CrossRef]
- Niemelä, J.; Saarela, S.-R.; Soderman, T.; Kopperoinen, L.; Yli-Pelkonen, V.; Väre, S.; Kotze, D.J. Using the ecosystem services approach for better planning and conservation of urban green spaces: A Finland case study. Biodivers. Conserv. 2010, 19, 3225–3243. [Google Scholar] [CrossRef]
- Valles-Planells, M.; Galina, F.; van Eetvelde, V. A classification of landscape services to support local landscape planning. Ecol. Soc. 2014, 19. [Google Scholar] [CrossRef]
- Kazmierczak, A. The contribution of local parks to neighbourhood social ties. Landsc. Urban Plan. 2013, 109, 31–44. [Google Scholar] [CrossRef]
- Larson, L.R.; Keith, S.J.; Fernandez, M.; Hallo, J.C.; Shafer, C.S.; Jennings, V. Ecosystem services and urban greenways: What’s the public’s perspective? Ecosyst. Serv. 2016, 22, 111–116. [Google Scholar] [CrossRef]
- Tyrväinen, L.; Pauleit, S.; Seeland, K.; de Vries, S. Benefits and uses of urban forests and trees. In Urban Forests and Trees—A Reference Book; Konijnendijk, C.C., Nilsson, K., Randrup, T.B., Schipperijn, J., Eds.; Springer: Berlin, Germany, 2005; pp. 81–114. [Google Scholar]
- Jennings, V.; Larson, L.; Yun, J. Advancing sustainability through urban green space: Cultural ecosystem services, equity, and social determinants of health. Int. J. Environ. Res. Public Health 2016, 13, 196. [Google Scholar] [CrossRef] [PubMed]
- Tratalos, J.; Fuller, R.A.; Warren, P.H.; Davies, R.G.; Gaston, K.J. Urban form, biodiversity potential and ecosystem services. Landsc. Urban Plan. 2007, 83, 308–317. [Google Scholar] [CrossRef]
- Chiesura, A. The role of urban parks for the sustainable city. Landsc. Urban Plan. 2004, 68, 129–138. [Google Scholar] [CrossRef]
- Ginn, F.; Francis, R.A. Urban greening and sustaining urban natures in London. In Sustainable London? The Future of a Global City; Imrie, R., Lees, L., Eds.; Policy Press: Bristol, UK, 2014; pp. 283–302. [Google Scholar]
- Ibes, D.C. Integrating Ecosystem Services into Urban Park Planning & Design. Cities Environ. 2016, 9, 1–39. [Google Scholar]
- Wurster, D.; Artmann, M. Development of a Concept for Non-monetary Assessment of Urban Ecosystem Services at the Site Level. Ambio 2014, 43, 454–465. [Google Scholar] [CrossRef] [PubMed]
- Bastian, O.; Haase, D.; Grunewald, K. Ecosystem properties, potentials and services—The EPPS conceptual framework and an urban application example. Ecol. Indic. 2012, 21, 7–16. [Google Scholar] [CrossRef]
- Lehmann, I.; Mathey, J.; Rößler, S.; Bräuer, A.; Goldberg, V. Urban vegetation structure types as a methodological approach for identifying ecosystem services—Application to the analysis of micro-climatic effects. Ecol. Indic. 2014, 42, 58–72. [Google Scholar] [CrossRef]
- Verhagen, W.; van Teeffelen, A.J.A.; Compagnucci, A.B.; Poggio, P.; Gimona, A.; Verburg, P.H. Effects of landscape configuration on mapping ecosystem service capacity: A review of evidence and a case study in Scotland. Landsc. Ecol. 2016, 31, 1457–1479. [Google Scholar] [CrossRef]
- Hansen, R.; Pauleit, S. From Multifunctionality to Multiple Ecosystem Services? A Conceptual Framework for Multifunctionality in Green Infrastructure Planning for Urban Areas. Ambio 2014, 43, 516–529. [Google Scholar] [CrossRef] [PubMed]
- Szulczewska, B.; Giedych, R.; Maksymiuk, G. Can we face the challenge: How to implement a theoretical concept of green infrastructure into planning practice? Warsaw case study. Landsc. Res. 2016. [Google Scholar] [CrossRef]
- Hansen, R.; Frantzeskaki, N.; McPhearson, T.; Rall, E.; Kabisch, N.; Kaczorowska, A.; Kain, J.-H.; Artmann, M.; Pauleit, S. The uptake of the ecosystem services concept in planning discourses of European and American cities. Ecosyst. Serv. 2015, 12, 228–246. [Google Scholar] [CrossRef]
- Szulczewska, B.; Maksymiuk, G.; Gadomski, K.; Giedych, R.; Kosmala, M.; Łukaszkiewicz, J.; Szumański, M.; Wolski, P. Warsaw Public Parks Assessment; Department of Landscape Architecture WULS: Warsaw, Poland, 2011. (In Polish) [Google Scholar]
- Warsaw Architecture and Spatial Planning Department. Warsaw Spatial Policy, 3rd ed.; Warsaw Municipality: Warsaw, Poland, 2014. (In Polish) [Google Scholar]
- Warsaw Architecture and Spatial Planning Department. Warsaw Environmental Study; Warsaw Municipality: Warsaw, Poland, 2006. (In Polish) [Google Scholar]
- The Common International Classification of Ecosystem Services (CICES). Towards a Common International Classification of Ecosystem Services (CICES) for Integrated Environmental and Economic Accounting, CICES V4-3 s; European Environment Agency: Copenhagen, Denmark, 2013. [Google Scholar]
- Villamagna, A.M.; Angermeier, P.L.; Bennett, E.M. Capacity, pressure, demand, and flow: A conceptual framework for analyzing ecosystem service provision and delivery. Ecol. Complex. 2013, 15, 114–121. [Google Scholar] [CrossRef]
- Bagstad, K.J.; Semmens, D.J.; Waage, S.; Winthrop, R. A comparative assessment of decision-support tools for ecosystem services quantification and valuation. Ecosyst. Serv. 2013, 5, e27–e39. [Google Scholar] [CrossRef]
- Daniel, T.C.; Muhar, A.; Arnberger, A.; Aznar, O.; Boyd, J.W.; Chan, K.M.A.; Costanza, R.; Elmqvist, T.; Flint, C.G.; Gobster, P.H.; et al. Contributing of cultural services to the ecosystem services agenda. Proc. Natl. Acad. Sci. USA 2012, 109, 8812–8819. [Google Scholar] [CrossRef] [PubMed]
- Chan, K.M.A.; Guerry, A.D.; Balvanera, P.; Klain, S.; Satterfield, T.; Basurto, X.; Bostrom, A.; Chuenpagdee, R.; Gould, R.; Halpern, B.S.; et al. Where are cultural and social in ecosystem services? A framework for constructive engagement. BioScience 2012, 62, 744–756. [Google Scholar]
- Maes, J.; Liquete, C.; Teller, A.; Erhard, M.; Paracchini, M.L.; Barredo, J.I.; Grizzetti, B.; Cardoso, A.; Somma, F.; Petersen, J.-E.; et al. An indicator framework for assessing ecosystem services in support of the EU Biodiversity Strategy to 2020. Ecosyst. Serv. 2016, 17, 14–23. [Google Scholar] [CrossRef]
- Bennett, E.M.; Peterson, G.D.; Gordon, L.J. Understanding relationships among multiple ecosystem services. Ecol. Lett. 2009, 12, 1394–1404. [Google Scholar] [CrossRef] [PubMed]
- Burkhard, B.; Kandziora, M.; Hou, Y.; Müller, F. Ecosystem Service Potentials, Flows and Demands—Concepts for Spatial Localisation, Indication and Quantification. Landsc. Online 2014, 34, 1–32. [Google Scholar] [CrossRef]
- Martín-López, B.; Gómez-Baggethun, E.; González, J.A.; Lomas, P.L.; Montes, C. The assessment of ecosystem services provided by biodiversity: Re-thinking concepts and research needs. In Handbook of Nature Conservation; Aronoff, J.B., Ed.; Nova Science Publishers: New York, NY, USA, 2009; pp. 261–282. [Google Scholar]
- Baur, J.W.R.; Tynon, J.F.; Ries, P.; Rosenberger, R.S. Urban Parks and Attitudes about Ecosystem Services: Does Park Use Matter? J. Park Recreat. Adm. 2014, 32, 19–34. [Google Scholar]
- Sandifer, P.A.; Sutton-Grier, A.E.; Ward, B.P. Exploring connections among nature, biodiversity, ecosystem services, and human health and well-being: Opportunities to enhance health and biodiversity conservation. Ecosyst. Serv. 2015, 12, 1–15. [Google Scholar] [CrossRef]
- Burkhard, B.; Kroll, F.; Nedkov, S.; Müller, F. Mapping supply, demand and budgets of ecosystem services. Ecol. Indic. 2012, 21, 17–29. [Google Scholar] [CrossRef]
Figure 1.
Distribution of ES delivery levels for Warsaw parks (in % total parks surveyed).
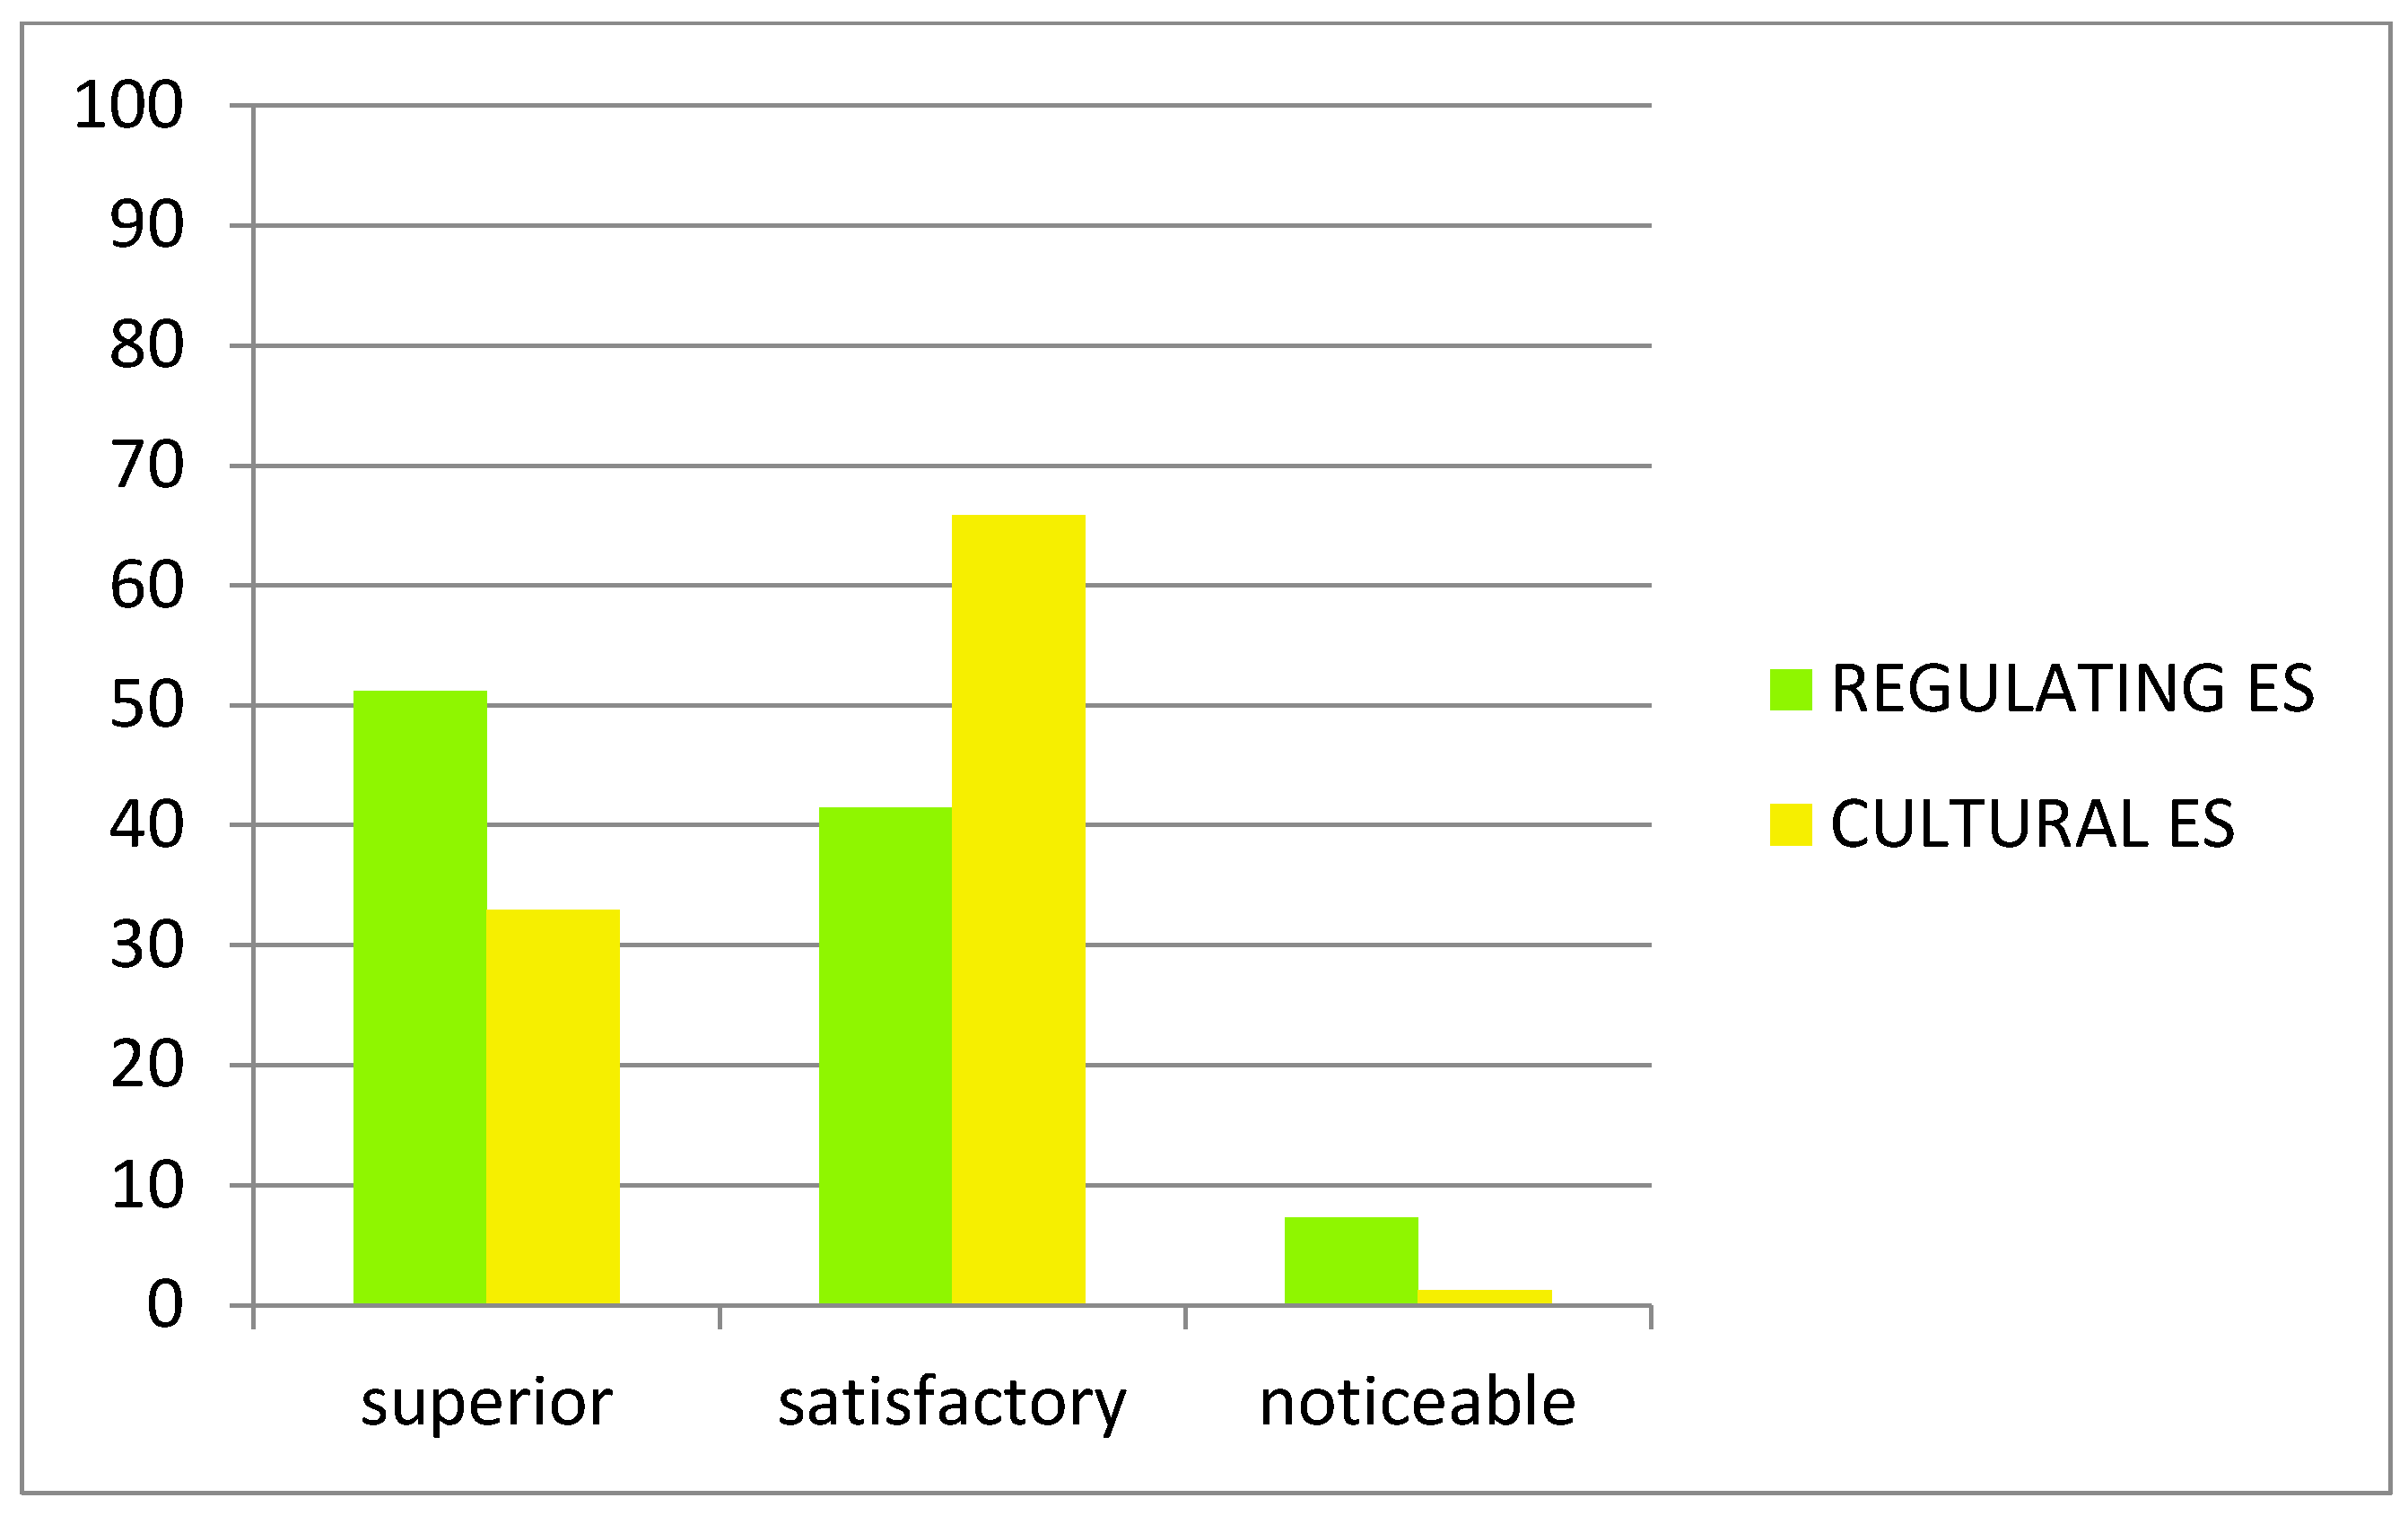
Figure 2.
Average ES capacity levels delivered by Warsaw parks (3—superior, 2—satisfactory, 1—noticeable).
Figure 2.
Average ES capacity levels delivered by Warsaw parks (3—superior, 2—satisfactory, 1—noticeable).

Figure 3.
Provision on ES by selected large parks—Capacity levels (3—high, 2—medium, 1—low) of 10 studied ES (MCR—microclimate regulation, AQR—air quality regulation, NR—noise reduction, BRP - balancing rainwater peak, R—recreation SI—social inclusion, PHB—physical health benefits, NE—nature experience, AA—aesthetic appreciation).

Figure 4.
Provision on ES by selected medium parks—Capacity levels (3—high, 2—medium, 1—low) of 10 studied ES (MCR—microclimate regulation, AQR—air quality regulation, NR—noise reduction, BRP—balancing rainwater peak, R—recreation SI—social inclusion, PHB—physical health benefits, NE—nature experience, AA—aesthetic appreciation).

Figure 5.
Provision on ES by selected small parks—Capacity levels (3—high, 2—medium, 1—low) of 10 studied ES (MCR—microclimate regulation, AQR—air quality regulation, NR—noise reduction, BRP—balancing rainwater peak, R—recreation SI—social inclusion, PHB—physical health benefits, NE—nature experience, AA—aesthetic appreciation).


Table 1.
Local regulating and cultural ecosystem services (ES) relevant to urban parks (based on a survey of literature).
Table 1.
Local regulating and cultural ecosystem services (ES) relevant to urban parks (based on a survey of literature).
| Type of ES | Key References |
|---|---|
| Regulating Services | |
| Microclimate regulation | Bolund and Hunhammar [1], Breuste et al. [2], Burkhard et.al. [10], Gómez-Baggethun and Barton [8], Niemelä et al. [11], TEEB [4]. |
| Air quality regulation | Bolund and Hunhammar [1], Burkhard et al. [10], Gómez-Baggethun and Barton [8], Niemelä et al. [11], Breuste et al. [2]. |
| Noise reduction | Bolund and Hunhammar [1], Gómez-Baggethun and Barton [8], Niemelä et al. [11], Valles-Planells [12]. |
| Water peak balancing | Bolund and Hunhammar [1], Niemelä et al. [11], Breuste et al. [2]. |
| Flood control | Gómez-Baggethun and Barton [8], TEEB [4]. |
| Erosion control | Burkhard et al. [10]. |
| Cultural Services | |
| Recreation | Bolund and Hunhammar [1], Breuste et al. [2], Gómez-Baggethun and Barton [8], Niemelä et al. [11], TEEB [4], Valles-Planells [12]. |
| Social inclusion | Kazmierczak [13], Larson [14]. |
| Psycho-physical health benefits | Niemelä et al. [11], TEEB [4], Valles-Planells [12]. |
| Nature experiences | Breuste et al. [2], Niemelä et al. [11], Valles-Planells [12]. |
| Aesthetic appreciation | TEEB [ 4], Valles-Planells [12]. |
| Sense of place and identity | TEEB [ 4], Valles-Planells [12]. |
| Cognitive development | Gómez-Baggethun and Barton [8], Valles-Planells [12]. |
Table 2.
The scope of possible regulating ES assessment due to accessible data—based on CICES (The Common International Classification of Ecosystem Services) [31].
Table 2.
The scope of possible regulating ES assessment due to accessible data—based on CICES (The Common International Classification of Ecosystem Services) [31].
| The Common International Classification of Ecosystem Services | Surveyed Regulating ES of Urban Parks | |||
|---|---|---|---|---|
| Section | Division | Group | Class | |
| Regulation & Maintenance | Mediation of waste, toxics and other nuisances | Mediation by biota | Bio-remediation by micro-organisms, algae, plants, and animals | |
| Filtration/sequestration/storage/accumulation by micro-organisms, algae, plants, and animals | ||||
| Mediation by ecosystems | Filtration/sequestration/storage/accumulation by ecosystems |  | ||
| Dilution by atmosphere, freshwater and marine ecosystems | ||||
| Mediation of smell/noise/visual impacts |  | |||
| Mediation of flows | Mass flows | Mass stabilisation and control of erosion rates | ||
| Buffering and attenuation of mass flows | ||||
| Liquid flows | Hydrological cycle and water flow maintenance |  | ||
| Flood protection | ||||
| Gaseous/air flows | Storm protection | |||
| Ventilation and transpiration | ||||
| Maintenance of physical, chemical, biological conditions | Lifecycle maintenance, habitat and gene pool protection | Pollination and seed dispersal | ||
| Maintaining nursery populations and habitats | ||||
| Pest and disease control | Pest control | |||
| Disease control | ||||
| Soil formation and composition | Weathering processes | |||
| Decomposition and fixing processes | ||||
| Water conditions | Chemical condition of freshwaters | |||
| Chemical condition of salt waters | ||||
| Atmospheric composition and climate regulation | Global climate regulation by reduction of greenhouse gas concentrations | |||
| Micro and regional climate regulation |  | |||
Table 3.
The scope of possible cultural ES assessment due to accessible data—based on CICES (The Common International Classification of Ecosystem Services) [31].
Table 3.
The scope of possible cultural ES assessment due to accessible data—based on CICES (The Common International Classification of Ecosystem Services) [31].
| The Common International Classification of Ecosystem Services | Surveyed of Urban Parks | |||
|---|---|---|---|---|
| Section | Division | Group | Class | |
| Cultural | Physical and intellectual interactions with biota, ecosystems, and land-/seascapes (environmental settings) | Physical and experiential interactions | Experiential use of plants, animals and land-/seascapes in different environmental settings | |
| Physical use of land-/seascapes in different environmental settings |  | |||
| Intellectual and representative interactions | Scientific | |||
| Educational | ||||
| Heritage, cultural |  | |||
| Entertainment | ||||
| Aesthetic |  | |||
| Spiritual, symbolic and other interactions with biota, ecosystems, and land-/seascapes (environmental settings) | Spiritual and/or emblematic | Symbolic | ||
| Sacred and/or religious | ||||
| Other cultural outputs | Existence |  | ||
| Bequest | ||||
Table 4.
Surveyed parks’ basic data.
| Total | Large Parks | Medium Parks | Small Parks | |
|---|---|---|---|---|
| Number of surveyed parks | 82 | 14 | 35 | 33 |
| Mean area (ha) | 33.92 | 158.21 | 12.88 | 3.52 |
| Standard deviation | 110.78 | 237.00 | 6.83 | 0.97 |
| Range (ha) | 2.05–902.68 | 30.11–902.68 | 5.06–29.5 | 2.05–4.92 |
Table 5.
The basis for determining the capacity of Warsaw parks to provide ES.
| The Scope of Evaluation Related to Warsaw Parks in Existing Documents | Data Retrieved from Document | Name of Document | |
|---|---|---|---|
| REGULATING SERVICES | |||
| Micro-climate regulation | Influence on local climate conditions | • Park size | WPPA |
| • Area shape | WPPA | ||
| • Vegetation structure | WPPA | ||
| • Water bodies | WPPA | ||
| Air quality regulation | Importance to air regeneration | • Park size | WPPA |
| • Vegetation cover | WPPA | ||
| • Vegetation structure | WPPA | ||
| Noise reduction | Noise level reduction | • Noise level within a park | WSP |
| Balancing rain water peaks | Outflow reduction | • Park size | WPPA |
| • Hydrological processes | WES | ||
| • Drainage system | WSP | ||
| • Vegetation cover | WPPA | ||
| • Vegetation structure | WPPA | ||
| CULTURAL SERVICES | |||
| Recreation | Recreation quality | • Recreational facilities | WPPA |
| • Conflicts between users | WPPA | ||
| • Accessibility | WPPA | ||
| Social inclusion | Fostering social inclusion | • Mass events facilities | WPPA |
| • Accessibility for disabled people | WPPA | ||
| • Educational facilities | WPPA | ||
| Physical health benefits | Fostering active recreation | • Sport and active recreation facilities | WPPA |
| Nature experience | Nature functioning and preservation of nature heritage | • Naturalness of vegetation | WPPA |
| • Habitats for wild fauna | WPPA | ||
| • Legal protection | WSP | ||
| Aesthetic appreciation | Aesthetic value | • Spatial structure | WPPA |
| • Maintenance | WPPA | ||
| • Character of park equipment | WPPA | ||
| Sense of identity | Preservation of cultural heritage | • Historical value | WPPA |
| • Iconic objects | WPPA | ||
| • Legal protection | WSP | ||
Table 6.
Capacity of parks in providing regulating ES.
| ES | Park Characteristics (Based on Data Retrieved from Surveyed Documents) | Capacity Level | |||
|---|---|---|---|---|---|
| Low | Medium | High | |||
| Microclimate regulation | Shape | Fragmented | X 1,2 | X 2 | |
| Compact | X 1 | X 2,3 | |||
| Vegetation structure | Dominance of low vegetation and groups of shrubs and single trees | X 1,2 | X 2 | ||
| Dominance of high vegetation with diverse vertical layers | X 1 | X 2,3 | |||
| Water bodies | No water bodies | X 1,2 | |||
| Presence of waterbodies | X 1,2 | X 2,3 | |||
| Air quality regulation | Vegetation structure | Dominance of low vegetation and groups of shrubs and single trees | X 1,2 | X 2 | |
| Dominance of high vegetation with diverse vertical layers | X 1 | X 2,3 | |||
| Vegetation cover | Less than 60% | X 1,2 | |||
| 60–70% | X 2 | ||||
| Over 70% | X 1 | X 2,3 | |||
| Noise reduction | Noise level | A noise level within all park exceeding 60 dB | X | ||
| A noise level within all park varies from 50 to 60 dB | X | ||||
| A noise level does not exceed 50 dB in more than 50% of park | X | ||||
| Balancing rain water peaks | Hydrological processes | Dominance of infiltration | X 1,2 | ||
| Dominance of infiltration and interception | X 1,2 | ||||
| Dominance of infiltration and interception, water retention | X 2,3 | ||||
| Drainage system | Water partially drained to the sewage system | X 1,2 | |||
| Vegetation cover | Less than 60% | X 1,2 | X 2 | ||
| 60–70% | |||||
| Over 70% | X 1 | X 2,3 | |||
| Vegetation structure | Dominance of low vegetation, groups of shrubs, and single trees | X 1,2 | |||
| Dominance of high vegetation with diverse vertical layers | X 1,2 | X 2,3 | |||
Park characteristics: true for all parks sizes (small medium, big)—X; X 1—for small parks; X 2—for medium parks; X 3—for big parks.
Table 7.
Capacity of parks in providing cultural ES.
| ES | Park Characteristics (Based on Data Retrieved from Surveyed Documents) | Capacity Level | |||
|---|---|---|---|---|---|
| Low | Medium | High | |||
| Recreation | Recreational facilities | Limited number of recreational facilities | X | ||
| Large number of recreational facilities | X | X | |||
| Unique recreational facilities at the district scale | X | ||||
| Unique recreational facilities at the city scale | X | ||||
| Conflicts between users | Potential conflict of recreational usage | X | |||
| No potential conflicts between users | X | ||||
| Accessibility | Limited access | X | X | ||
| Free access | X | ||||
| Social inclusion | Accessibility for disabled people | A limited accessibility for disabled people | X | ||
| Full accessibility for disabled people | X | X | |||
| Educational facilities | Limited educational facilities | X | |||
| Park adapted to the educational function | X | ||||
| Mass events facilities | Park adapted to the mass events | X | |||
| Physical health benefits | Active recreation facilities | Limited number of active recreational facilities | X | ||
| Large number of active recreational facilities | X | X | |||
| Sport facilities | Limited number of sport facilities | X | |||
| Large number of sport facilities | X | ||||
| Dominance of participatory sport facilities | X | ||||
| Nature experience | Vegetation character | Dominance of ornamental plants | X | ||
| Dominance of native vegetation | X | X | |||
| Fostering biodiversity | Habitats for rare wild fauna | X | |||
| Legal protection | Nature reserves | X | |||
| Aesthetic appreciation | Spatial structure | Unclear spatial structure | X | ||
| Clear spatial structure | X | X | |||
| Equipment | Individual character | X | |||
| Innovative design solution | X | ||||
| Standard equipment | X | ||||
| Equipment in poor condition | X | ||||
| Maintenance | Well maintained | X | |||
| Poorly maintained | X | X | |||
| Sense of identity | Historical value | Low historical value | X | ||
| High historical value | X | X | |||
| Image of place | Iconic objects | X | |||
| Legal protection | Objects listed in monument register | X | |||
Table 8.
Overview of the predominant character and multifunctionality potential of parks (% total parks surveyed); (A) in relation to a number of parks in particular size group (large n = 14, medium n = 35, small n = 33), (B) in relation to a total number of assessed parks (n = 82).
Table 8.
Overview of the predominant character and multifunctionality potential of parks (% total parks surveyed); (A) in relation to a number of parks in particular size group (large n = 14, medium n = 35, small n = 33), (B) in relation to a total number of assessed parks (n = 82).
| Multifunctional | Regulating Advantage | Cultural Advantage | No Predominant Role | |||||
|---|---|---|---|---|---|---|---|---|
| (A) | (B) | (A) | (B) | (A) | (B) | (A) | (B) | |
| Large parks | 71.43 | 12.2 | 28.57 | 4.9 | 0 | 0 | 0 | 0 |
| Medium parks | 31.43 | 13.4 | 48.57 | 20.7 | 2.86 | 1.2 | 17.14 | 7.3 |
| Small parks | 0 | 0 | 0 | 0 | 15.15 | 6.1 | 84.85 | 34.2 |
| All parks | 25.6 | 25.6 | 7.3 | 41.5 | ||||
Chi-square test (based on number of observations in columns B): Χ2 = 66.62; p value < 0.001.
Table 9.
Results of multiple regression based on a linear model where dependent variables are summary regulating ES score and summary cultural ES score.
Table 9.
Results of multiple regression based on a linear model where dependent variables are summary regulating ES score and summary cultural ES score.
| Regression Coefficient (B) | Standard Error for B | Standardized Regression Coefficient | p Value | |
|---|---|---|---|---|
| Dependent Variable: SUMMARY REGULATING ES SCORE R2 = 0.528 | ||||
| Intercept | 7.911 | 0.669 | ||
| Park size | 0.007 | 0.002 | 0.347 | <0.001 * |
| Compact shape | 0.886 | 0.400 | 0.188 | 0.030 * |
| Dominance of high vegetation with a diverse vertical layers | 0.875 | 0.407 | 0.188 | 0.035 * |
| Presence of water bodies | 1.342 | 0.400 | 0.293 | 0.001 * |
| A noise level within the entire park exceeding 60 dB | −1.199 | 0.392 | −0.261 | 0.003 * |
| Domination of infiltration | −1.577 | 0.497 | −0.266 | 0.002 * |
| Rainwater partially drained to the sewage system | −0.668 | 0.569 | −0.095 | 0.244 |
| Dependent Variable: SUMMARY CULTURAL ES SCORE R2 = 0.638 | ||||
| Intercept | 4.947 | 1.488 | ||
| Large number of recreational facilities | 2.031 | 0.456 | 0.409 | <0.001 * |
| Free access | 1.681 | 1.078 | 0.126 | 0.128 |
| Mass events facilities | 0.992 | 0.516 | 0.159 | 0.058 |
| Educational facilities | 0.216 | 0.512 | 0.041 | 0.668 |
| Dominance of native vegetation | 1.581 | 1.035 | 0.294 | 0.131 |
| Dominance of ornamental plants | 0.666 | 0.978 | 0.118 | 0.495 |
| Habitats for rare wild fauna | 1.562 | 0.583 | 0.277 | 0.009 * |
| Equipment in a poor condition | −0.394 | 0.747 | −0.046 | 0.612 |
| Well-maintained | 0.793 | 0.590 | 0.116 | 0.185 |
| Individual character of equipment | 0.506 | 0.461 | 0.103 | 0.269 |
| Innovative design solutions | 1.027 | 0.992 | 0.084 | 0.344 |
| Historical value | −0.022 | 0.574 | −0.024 | 0.809 |
| Iconic objects | 0.962 | 0.712 | 0.125 | 0.188 |
| Parks listed in monument register | 1.240 | 0.661 | 0.219 | 0.037 * |
* Indicate significant effect at p < 0.05.
Table 10.
Results of multinomial regression based on logistic model where dependent variable is the park’s predominant character (categorical variable with four levels) and their reference category is: “no predominant role”.
Table 10.
Results of multinomial regression based on logistic model where dependent variable is the park’s predominant character (categorical variable with four levels) and their reference category is: “no predominant role”.
| Coeff. of Regression (B) (vs. No-Predominant Role) | |||||
|---|---|---|---|---|---|
| Cultural Advantage | Multifunctional | Regulating Advantage | Chi-Square Statistics | p Value | |
| Intercept | −5886.7 | −2023.3 | −341.7 | ||
| Park size | −12.5 | 149.9 | 150.2 | 109.3 | <0.001 |
| Compact shape | −2460.6 | −142.9 | 195.2 | 49.2 | <0.001 |
| Presence of water bodies | 307.7 | −14.9 | 656.0 | 17.0 | 0.001 |
| A noise level within all park exceeds 60 dB | 233.0 | 10.2 | 336.7 | 10.9 | 0.012 |
| Domination of infiltration | 2468.1 | 199.7 | 216.9 | 51.2 | <0.001 |
| Rainwater partially drained to the sewage system | 114.9 | −1067.6 | −386.1 | 27.0 | <0.001 |
| Large number of recreational facilities | 2802.8 | 655.8 | −351.7 | 68.3 | <0.001 |
| Free access | −7.3 | −108.4 | −1126.2 | 26.8 | <0.001 |
| Educational facilities | 328.9 | −138.1 | −465.4 | 10.7 | 0.013 |
| Dominance of native vegetation | 969.7 | −69.3 | 278.9 | 46.6 | <0.001 |
| Habitats for rare wild fauna | −912.3 | 262.8 | −765.5 | 29.0 | <0.001 |
| Well maintained | 149.0 | −56.0 | −401.2 | 19.9 | <0.001 |
| Individual character of equipment | 2661.5 | 730.1 | 387.7 | 58.9 | <0.001 |
| Innovative design solutions | 2463.3 | 1479.0 | −266.7 | 24.0 | <0.001 |
Cox and Snell pseudo R2 = 0.916.
© 2017 by the authors. Licensee MDPI, Basel, Switzerland. This article is an open access article distributed under the terms and conditions of the Creative Commons Attribution (CC BY) license (http://creativecommons.org/licenses/by/4.0/).
Share and Cite
MDPI and ACS Style
Giedych, R.; Maksymiuk, G. Specific Features of Parks and Their Impact on Regulation and Cultural Ecosystem Services Provision in Warsaw, Poland. Sustainability 2017, 9, 792. https://doi.org/10.3390/su9050792
AMA Style
Giedych R, Maksymiuk G. Specific Features of Parks and Their Impact on Regulation and Cultural Ecosystem Services Provision in Warsaw, Poland. Sustainability. 2017; 9(5):792. https://doi.org/10.3390/su9050792
Chicago/Turabian StyleGiedych, Renata, and Gabriela Maksymiuk. 2017. "Specific Features of Parks and Their Impact on Regulation and Cultural Ecosystem Services Provision in Warsaw, Poland" Sustainability 9, no. 5: 792. https://doi.org/10.3390/su9050792
Note that from the first issue of 2016, this journal uses article numbers instead of page numbers. See further details here.