1. Aims and Background
The main phases of the Disaster Management Cycle are: prevention, mitigation, preparedness, response, recovery and rebuilding. Environmental pollution risk analysis and risk management related to industrial activities are significant in order to prevent chemical disasters which may lead to negative effects on the environment and human health.
The actual tendency concerning the quality evaluation of environmental components (air, water, soil, and human health), is to integrate the environmental impact assessment with environmental risk assessment into one analytical procedure. The Environmental Impact Assessment (EIA) has tended to focus on the identification of impacts associated with planned activities, whereas Environmental Risk Assessment (ERA) involves a rigorous analysis of those impacts: the calculation of the probability and magnitude of effects [
1,
2]. So, the EIA presumes to identify, predict, evaluate and communicate the environmental impacts that an existing or proposed facility, programme or policy is having, or would have, on the natural environment. Risk assessment is a scientific tool that is used for identifying hazards, estimating risks arising out of any possible exposure and is providing answers with concern as to how much impact a specific threat might have on humans. Whether we are talking about EIA or ERA, both could be used as a decision support system in order to adopt measures and practices to minimize impact/risks; additionally, by combining EIA and ERA more useful analysis would be obtained.
In order to estimate the influence of certain human activities upon the environment, different methods and techniques are employed. These are based on graphics, diagrams, checklists, impact matrix and integrated models [
3,
4,
5,
6,
7].
One of the applied methods for impact assessment in Romania is the Global Estimation Methodology for the Ecosystem State proposed by Rojanschi in 1991 [
8]. Rojanschi’s method enables the global estimation of the ecosystem state by means of a synthetic assessment and, lately, it was also considered at the international level [
9,
10]. According to this method, firstly, the quality indicators are identified for each environmental component. A quality indicator represents a pollutant level or a specific property for the given environmental component (Air, Water or Soil). For instance, typical quality indicators for the environmental component Air are: NO
x, SO
x, CO, VOCs, suspended particles, Hg-vapors, and others. According to [
11,
12,
13], air pollution remains a critical global health and justice problem. In case of the environmental component Water, the common quality indicators are: COD, BOD, suspended solids, floating solids, oily products, dissolved substances such as salts or phenols, and others. Likewise, water pollution index might be estimated using a single value by decreasing the number of parameters and representing data in a simple way [
14,
15,
16,
17]. According to some previous research papers [
18,
19,
20,
21,
22], the representative quality indicators for Soil are: total organic carbon (TOC), extractible compounds, soil pH, etc.
For each quality indicator, an individual grade is assigned ranging from 1 to 10 based on the pollutant concentration. Hence, the assigning of the individual grade for a quality indicator depends on the pollutant level and how it fits into an evaluation scale developed by the environmental specialist according to the national legislation. For example, if the pollutant level is lower than the maximum allowed concentration (MAC) then the attributed individual grade for this quality indicator is 10 (maximal value). In contrast, if the pollutant level is much higher than MAC (e.g., ten-fold higher or even more), the individual grade for the quality indicator is equal to 1 (minimal value). Further, the evaluation grade for the environmental component is calculated as the mean value of individual grades of quality indicators. So, the evaluation grades for the environmental components also range from 1 to 10. In addition, Rojanschi proposed a graphical method to give a unique indicator for the characterization of the environmental state on the basis of evaluation grades of the environmental components.
This indicator is known as the index of global pollution (
IGP) and is defined as the relationship between the ideal and the real environmental state giving an account of global pollution value of the ecosystem. According to Rojanschi’s methodology, the values of the index of global pollution indicate the human activities effects upon the environment (ecosystem), as it is shown in
Table 1 [
8,
22]. Thus, Rojanschi proposed a scale for the index of global pollution values that ranges from 1 to 6. Accordingly, the ecosystems may be classified into six classes ranged from A to F. Each one describes the different effects of human activities upon the environment (
Table 1).
Since 1991, this method has been applied for many case studies in Romania, revealing the significance of such a tool within the national and regional policy framework for environmental protection. However, it is worth mentioning that implementation of this methodology may include some subjective elements concerning the assignments of evaluation grades. In this regard, the competence and expertise of the evaluators is very important.
Note that Rojanschi’s method can be employed only for the applications where three or more environmental components are considered, such as Air, Water, Soil, Flora, Fauna and Population. Since many environmental impact assessment applications rely on analysis of only two environmental factors, the aim of this work was to develop a graphical method to extend Rojanschi’s approach for the case of two environmental components.
2. Rojanschi’s Method and Concentric Circles Methodology
In the last few decades, Rojanschi’s method has received great attention for environmental impact assessments in Romania. However, as mentioned previously, this method is limited for at least three environmental components
n = 3 (Air, Water and Soil) [
6]. In 2005, Popa and co-workers proposed a simplified method for the estimation of the pollution index based on the average values of the evaluation grades [
22]. The graphical aspects of both methods are presented in the following paragraphs, pointing out the joint and discrepancy elements between them.
Both methods for the Global Estimation of the Ecosystem State start with the evaluation grades (noted as bi, i = 1, 2, …, n), which are calculated for each environmental component based on the individual grades of quality indicators. Note that the individual grades of each quality indicator are appraised taking into consideration the national or regional guideline for environmental protection or an own scale (matrix) developed by the experts. Subsequently, the values of the evaluation grades are used for a graphical representation that plots the synergetic effect induced by all types of pollution. The ideal state of an ecosystem is represented by a regular geometric figure, constructed using the maximal values of the evaluation grades (bimax = 10 units), depicting the natural quality of the environment. Consecutively, the real state of the ecosystem will be represented by connecting the dots resulted from the real values of the evaluation grades. Thus, an irregular geometric figure with smaller area will be enclosed into the regular geometric figure, corresponding to the real and ideal ecological state, respectively.
Both methods (Rojanschi’s and Popa’s) assume that the index of global pollution (
IGP) is calculated as the ratio between the ideal (
Sideal) and real (
Sreal) surfaces of the geometric figures:
According to Rojanschi’s method, for the case of
n ≥ 3 environmental components, the index of global pollution can be expressed in terms of evaluation grades as follows [
8,
22]:
where
n is the number of environmental components;
b1,
b2, …,
bi, …,
bn—the corresponding evaluation grades and
bmax is the maximal value of the evaluation grade (i.e.,
bmax = 10 units).
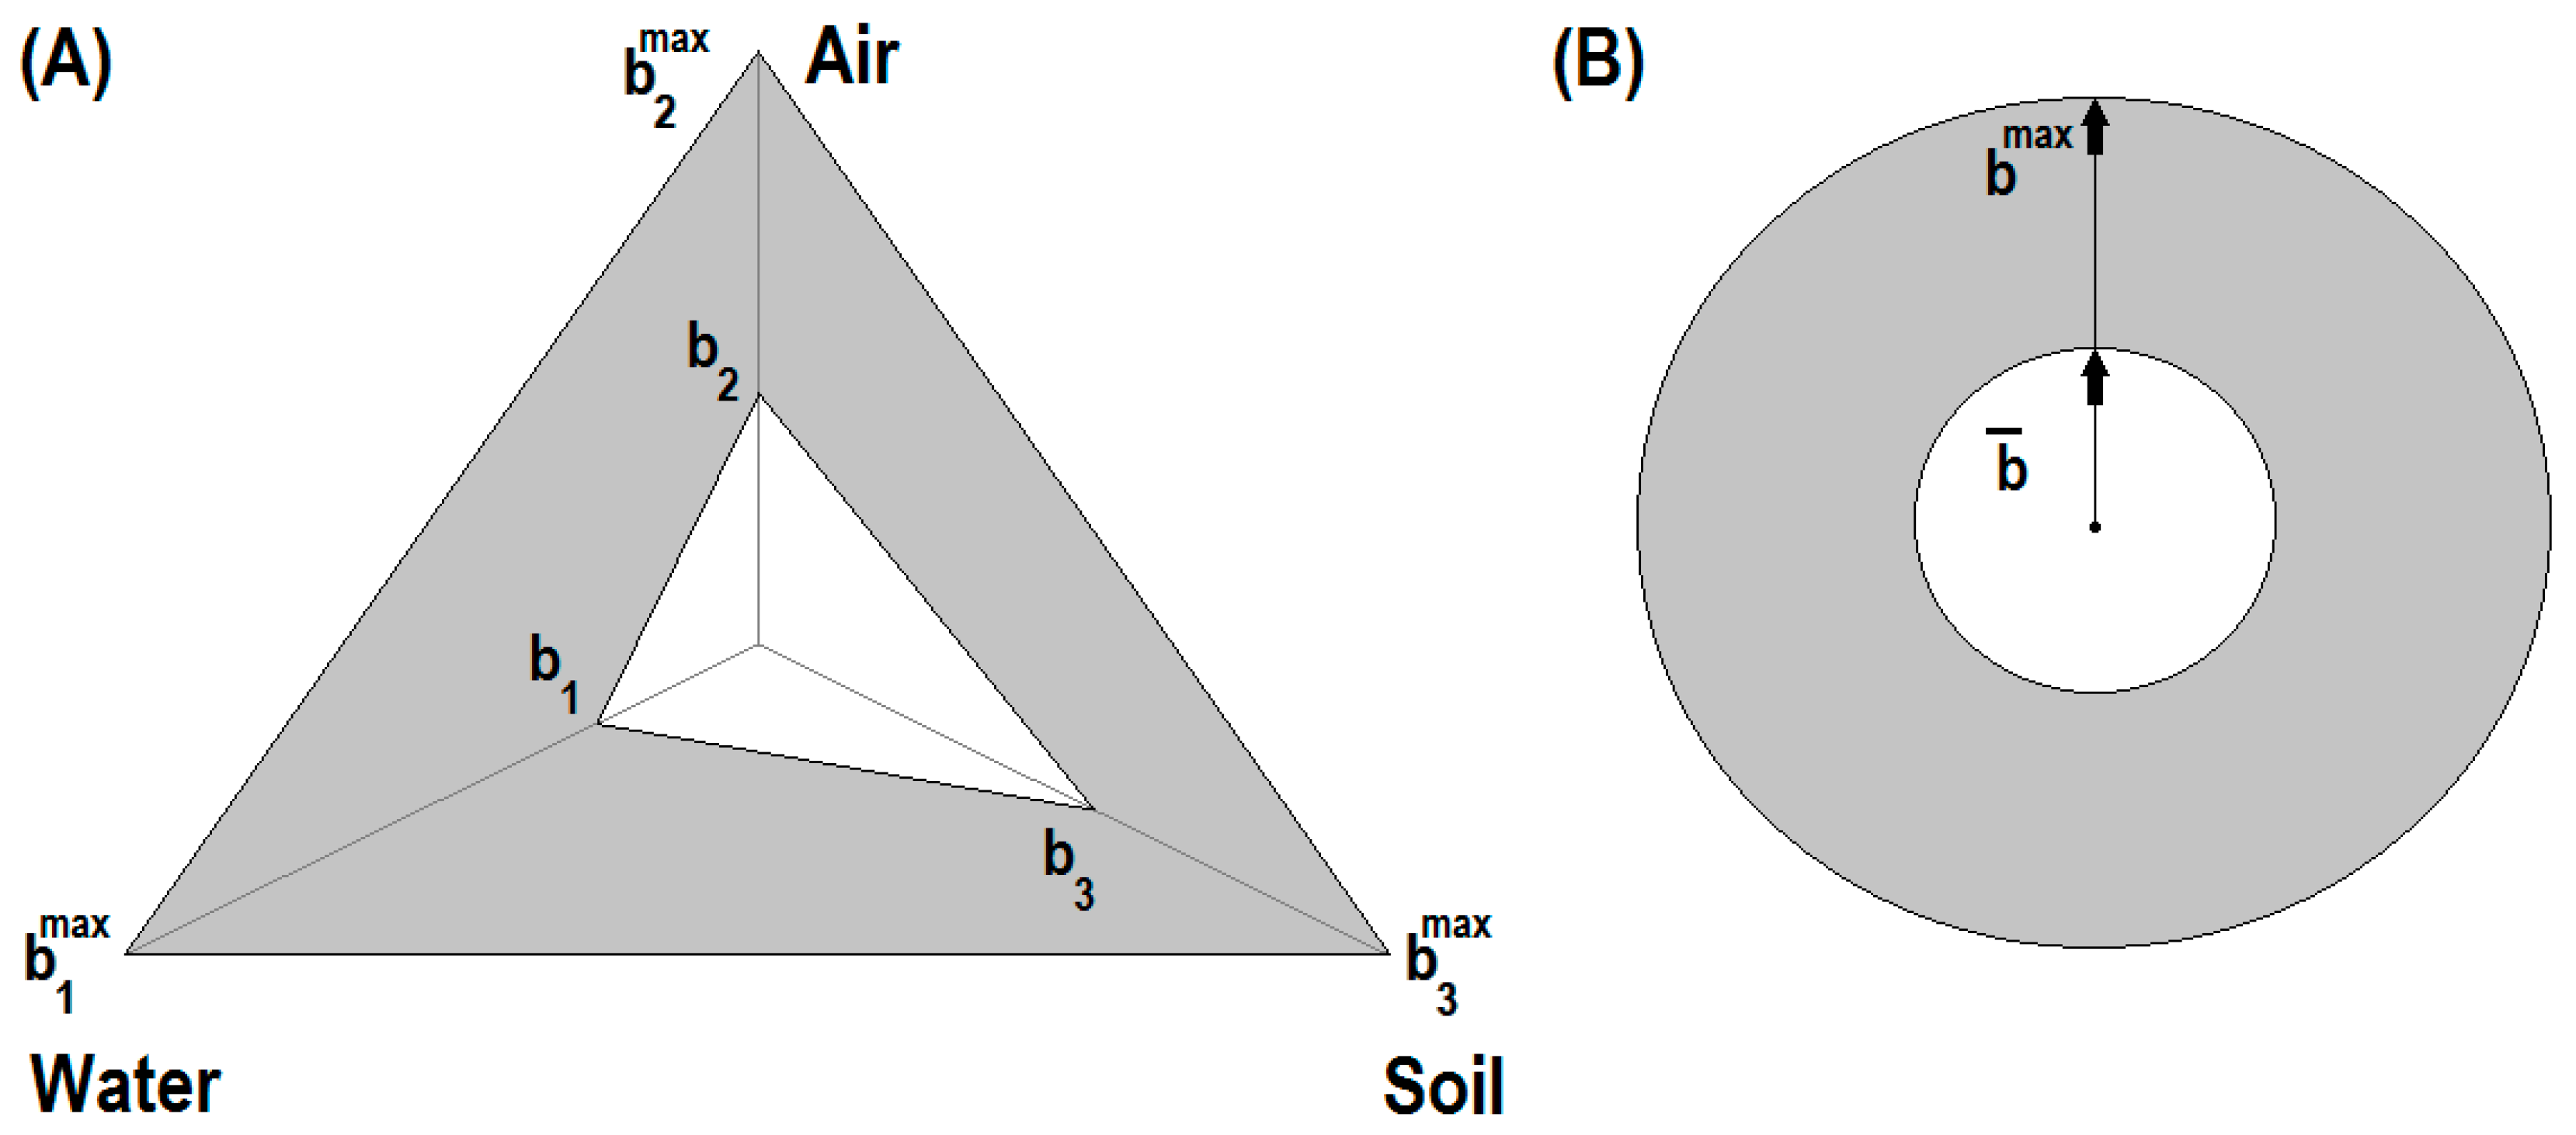
For the case of three environmental components
n = 3, Rojanschi’s method operates with equilateral triangle to describe the ideal surface and a smaller enclosed triangle to depict the real surface (see
Figure 1A). According to Equation (2), the index of global pollution for the case of
n = 3 (Air, Water and Soil) is given by:
The simplified method proposed by Popa et al. for estimation of the index of global pollution is based on the arithmetic mean of the evaluation grades, i.e.,
. Therefore, the graphical correspondence of this methodology is related to the concentric circles (
Figure 1B), and the index of global pollution is estimated by a simplified relation [
22]:
Hence, by means of this equation (Equation (4)), the index of global pollution may be calculated very facile using only the arithmetic mean of the evaluation grades.
As it can be noticed from
Figure 1, the difference between ideal and real surfaces ∆
S =
Sideal −
Sreal can serve as a graphical pollution indicator. For ∆
S = 0, the index of global pollution is equal to
IGP = 1 and the ecosystem corresponds to the natural environment not influenced by human activities. As ∆
S departs from zero and
IGP departs from unity, it means that the environment is changed by human activities. In
Figure 1, the difference between ideal and real surfaces ∆S is plotted by a gray-colored zone. The larger the gray zone (∆
S), the higher the negative impact on the environment induced by the industrial and economical activities.
Zaharia and Surpateanu [
23] have compared Rojanschi’s and the concentric circles methods for calculating the index of global pollution and the environmental impact assessment of a heat and power co-generation plant. The authors have monitored the quality indicators for three environmental components (
n = 3). Thus, the individual grades, given in parentheses, for each pollutant from Air were: SO
2 (1), NO
x (4), CO (5) and suspended solids (1). The evaluation grade for Air component was calculated as the average value of individual grades of quality indicators, i.e., (1 + 4 + 5 + 1)/4 = 2.75. For Water component, the found evaluation grade was 6.00 (BOD (7), extractible substances (6), SO
4-(5)). In the case of environmental component Soil, the evaluation degree was 5.67 (TOC (5), pH (9), extractible compounds (4)). Having the evaluation grades for each environmental component (Air = 2.75, Water = 6.00 and Soil = 5.67), the authors calculated the index of global pollution using Rojanschi’s approach (Equation (3)) and the concentric circles method (Equation (4)). As such, a good agreement was found between both methodologies for the quantification of the environmental impact. The index of global pollution values were
IGP = 4.538 and
IGP = 4.328, given by the Rojanschi and concentric circles methods, respectively. Thus, both methodologies indicated the same state of the ecosystem corresponding to class E, i.e., “environment modified by industrial/economic activities dangerous to life form”.
By proposing their method [
22], Popa and co-workers suggested that the concentric circles methodology gives similar results to Rojanschi’s method if there are no significant discrepancies between evaluation grade values.
There are many situations in which the ecological state is affected only by two environmental components with improper quality indicators, mostly by air and water, since the human activity can be conducted on the isolated or impermeable ground. In this case, Rojanschi’s method is not applicable because it requires at least three environmental components to be considered. Hence, the single option remaining is the simplified methodology suggested by Popa and co-workers [
22]. However, this method is not very exact for a situation in which the values of the evaluation grades are considerably different.
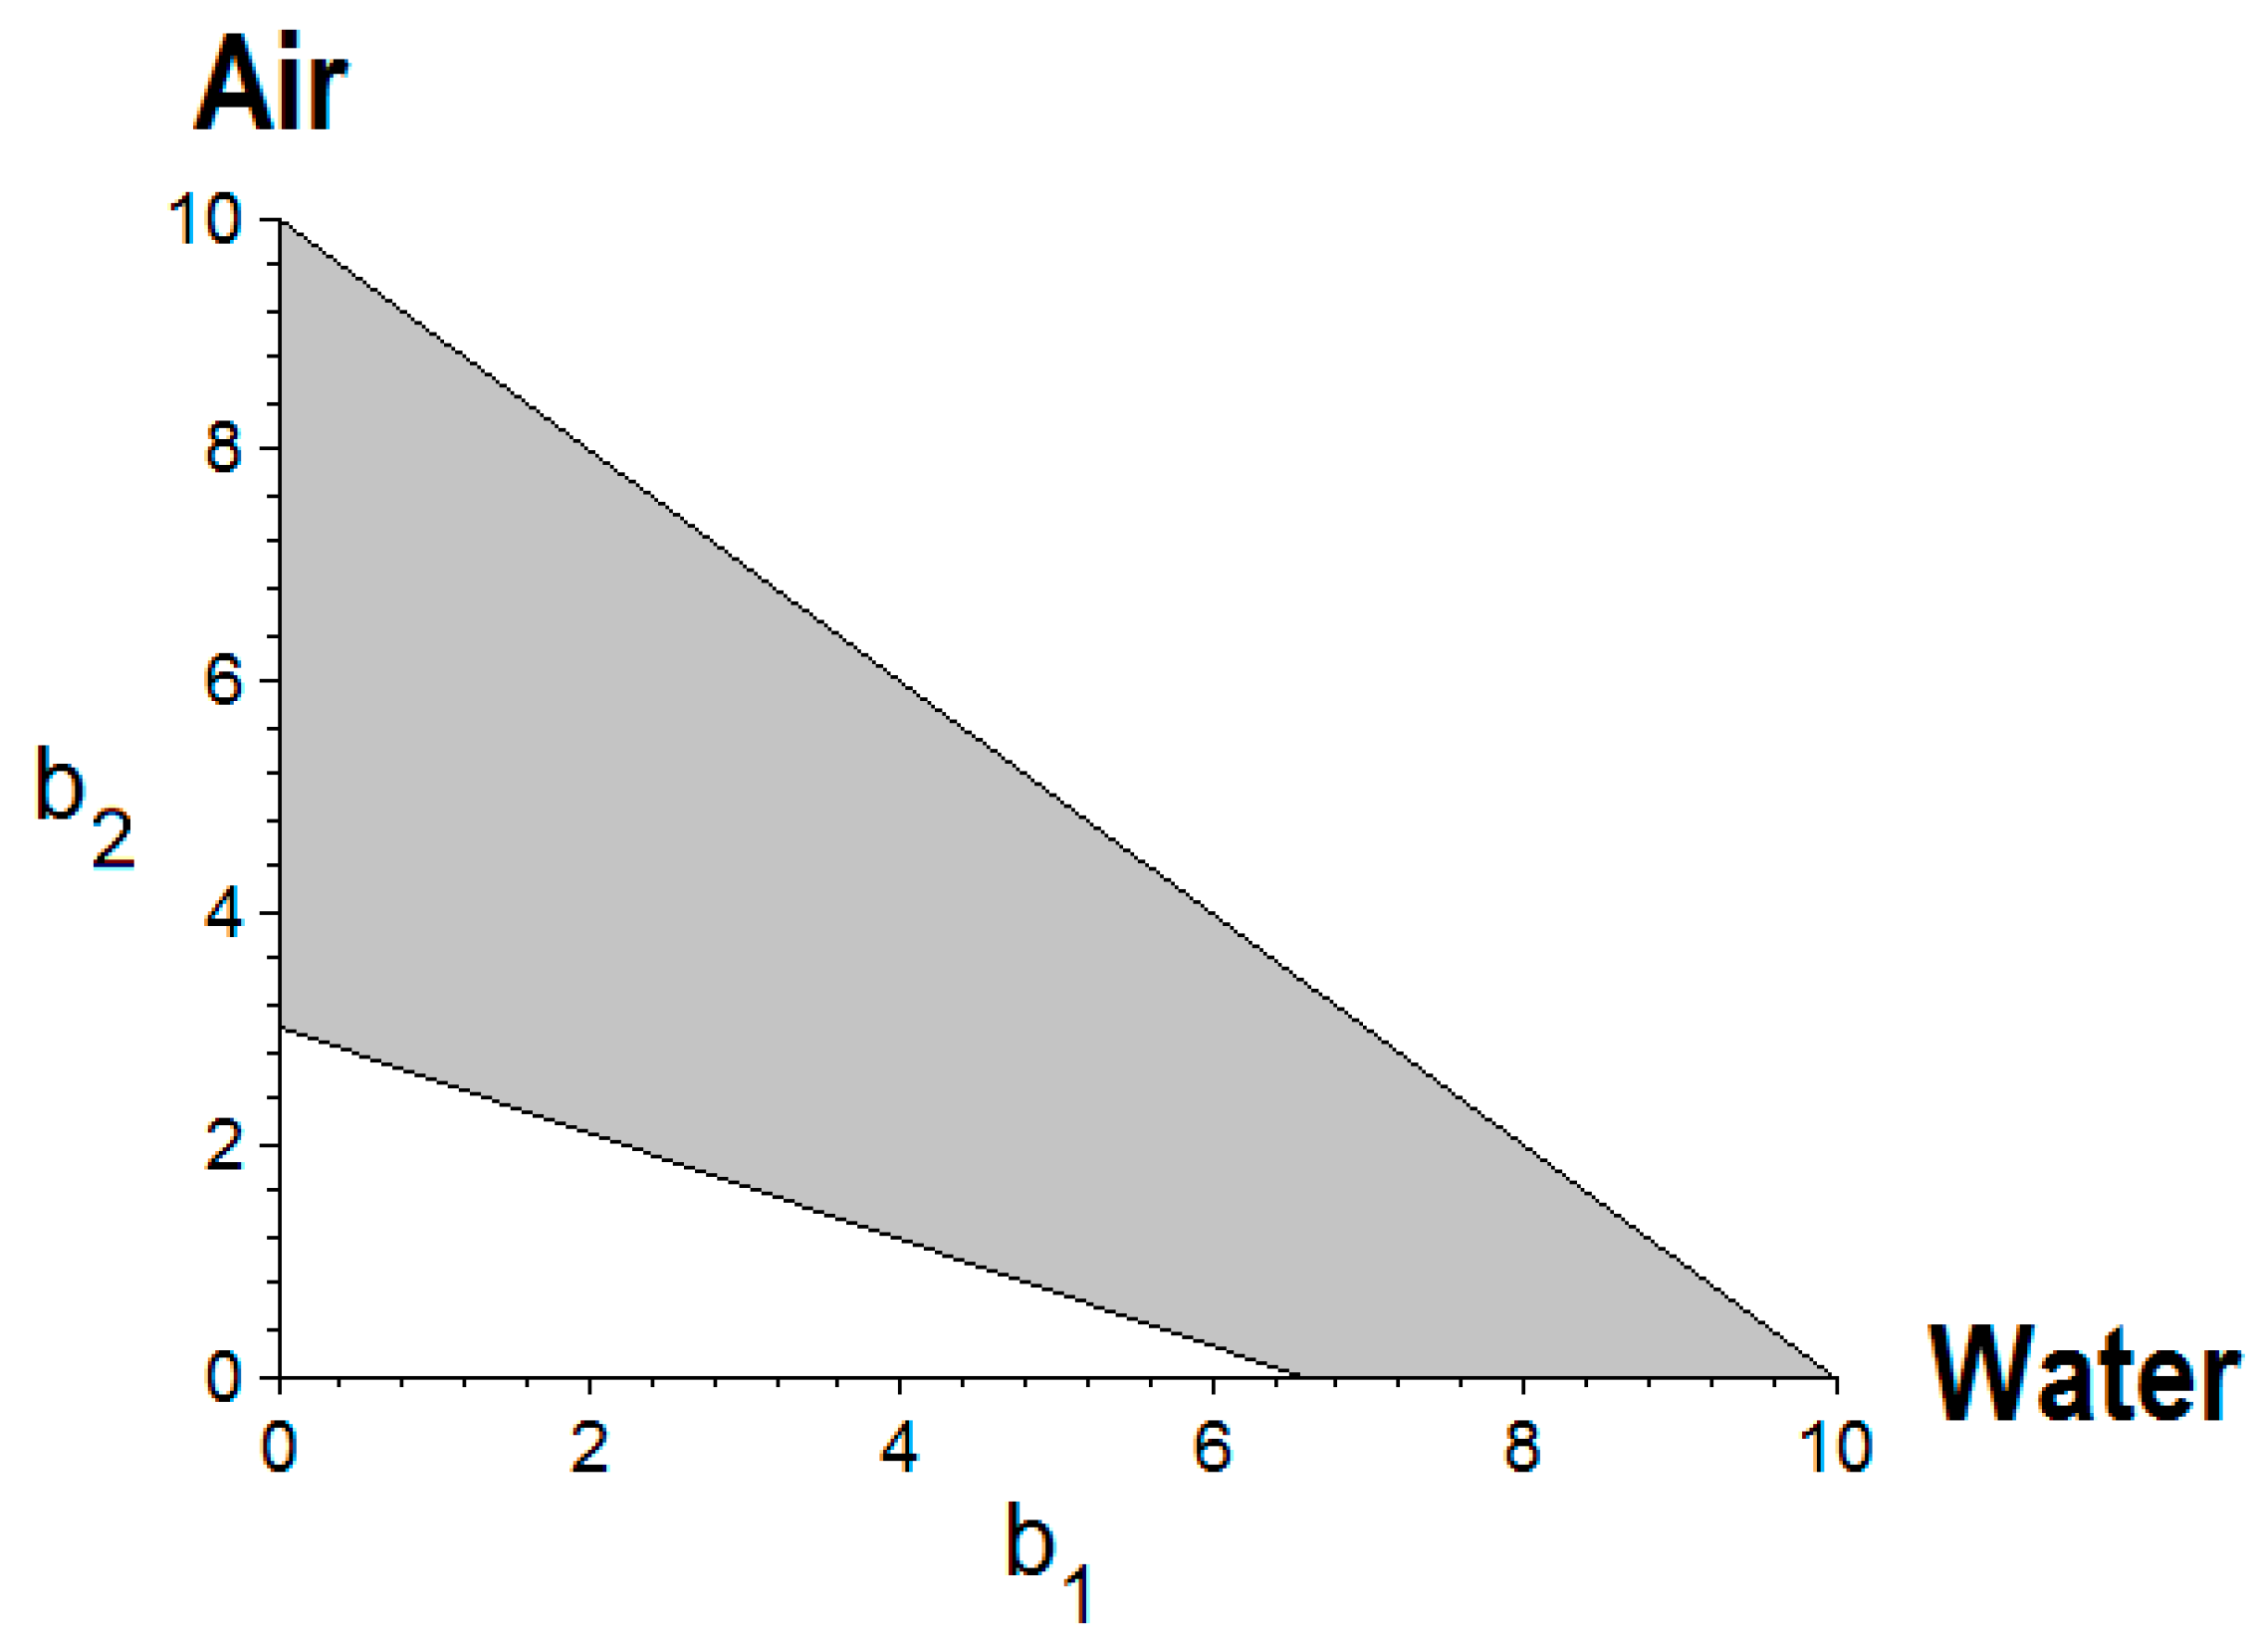
Proposed Method Based on Right-Triangle Graph
The proposed method in this work relies on Rojanschi’s basic idea to avoid the average value of evaluation grades and to use only the graphical correspondence for calculation of the index of global pollution. In this respect, we propose a graphical method based on right-angle triangle, where leg bases (catheti) represent the values of the evaluation grades, and hypotenuse has the role of the connection line between these values (
Figure 2). The area of a right-angle triangle is one-half the product of catheti. Thus, the surface area of the right triangle representing the ideal state of ecosystem is one-half the product of maximal values of the evaluation grades (
bmax = 10 units), that is:
The smaller area of the enclosed right-angle triangle depicting the real ecological state is given by the following relation:
Following Rojanschi’s approach, the index of global pollution for the case of two environmental components (
Figure 2) may be written as:
So, the right-angle triangle methodology can be applied for the environmental impact assessment of the ecosystem state for the case of two environmental components. The final expression for the index of global pollution given by this method is:
It should be noted that Equation (8), derived from the right-triangle graphical method, resembles Equation (4) obtained from concentric circle methodology [
22]. Interestingly, for the equal values of evaluation grades, i.e.,
b1 =
b2, both graphical models (Equations (4) and (8)) converge to the identical numerical results.
The comparison between the concentric circles approach and the proposed graphical method (right-triangle) is reported in
Table 2. Herein, a set of evaluation grade values has been simulated and the index of global pollution (
IGP) has been calculated using both models, i.e., Equations (4) and (8).
According to the results reported in
Table 2, for the same values of the evaluation grades
b1 =
b2, there is no divergence between the indexes of global pollution (
IGP) calculated by different methods. For the relatively close values of evaluation grades (i.e.,
b1 ≈
b2,
b1 >
b2 or
b1 <
b2), the discrepancy between indexes of global pollution is not very notable and both methods conduct to the same classification of the ecosystem state. When evaluation grades differ dramatically from each other (i.e.,
b1 >>
b2 or
b1 <<
b2), more precisely if the difference ∆
b =|
b1 −
b2| > 4, then the divergence between these two methods is significant. For such situations, the right-angle triangle graph method is more accurate than the concentric circles methodology, since the former is based on the original Rojanschi approach, which avoids the average value of evaluation grades and uses directly the geometrical correlation method for the estimation of the index of global pollution.
3. Application of the Right-Triangle Graphical Method
The following example demonstrates the applicability of the proposed graph method (right-triangle) for a real case study reported previously in the literature [
5]. This case study dealt with environmental impact assessment for a refinery located on the Romanian Black Sea Coast where two environmental components were considered: Air and Water. Therefore, the authors applied the simplified index of global pollution method [
22] to estimate the ecosystem state. In this example, we compare the results of the right-triangle graph method proposed in this work, and the concentric circle methodology used previously by the authors [
5]. According to [
5], two groups of chemical analyses were carried out to appraise the magnitude of pollution: (1) analyses of the specific air pollutants (i.e., NO
x, CO and SO
2); and (2) analyses of the surface water, nearby the evaluated site, where wastewaters were discharged into the Black Sea; thus, the main quality indicators of treated wastewaters included pH, COD, BOD
5, (H
2S/S
2−), phenols, floating solids, oily products and residues. By developing the evaluation scale (matrix) for two environmental components, the authors [
5] identified the evaluation grades of 3.00 and 6.57 for Air and Water, respectively. Finally, they calculated the index of global pollution, using simplified method (concentric circles), which was
IGP = 4.367.
For this case study, the right-triangle graph has been employed to test and validate the proposed method on a real application. The geometrical correlation for this situation is shown in
Figure 3.
Considering the values of evaluation grades
b1 = 6.57,
b2 = 3.00 and applying Equation (8), the index of global pollution given by the right-triangle methodology is equal to
IGP = 5.074, which differs somewhat from
IGP = 4.367. However, both methods converged to the same class E (
Table 1), suggesting that the environment is substantially modified by this industrial activity, being dangerous for life forms in the vicinity of the investigated site nearby the Romanian Black Sea Coast. For this case study, the graphical pollution indicator ∆
S given by the difference between ideal and real surface areas is equal to ∆
S = 40.145, suggesting a significant pollution nearby the refinery.
3.1. Supplementary: Evaluation Scale Protocol
The subjective aspects of the index of global pollution methods are connected to the development of the evaluation scale used for the quantification of the individual grade (
β) for a given quality indicator. Note that the term “individual grade” is also known as “quality grade” [
22]. Commonly, the evaluation scales are developed based on some national regulations regarding the goals for classification of the quality of the environmental components. The elaboration of an appropriate evaluation scale depends on the experience and expertise of the evaluators. However, as a general scheme for evaluation scale, we found from literature that the correlation scale reported by Damo and Icka [
10] is the most appropriate in this sense. Therefore, we followed the same correlation scale [
10] with few minor modifications.
Table 3 summarized the evaluation/correlation scale used in our case. This scheme was developed based on the alert thresholds and the maximum allowed level/concentration for a given quality indicator.
According to this scheme (
Table 3), the maximal individual grade (
β =10 units) for a quality indicator is attributed when the concentration of the pollutant in the environmental component is zero or in the limits of the background level. If the pollutant concentration is higher, but does not exceed 20% from the MAC value, then the individual grade is equal to
β = 9. If the concentration is pinpointed into the interval of 20–70% from the MAC value, then the quality grade is equal to
β = 8, and so on (see
Table 3). Following this scheme, for higher pollutant concentration the corresponding individual grade is lower. For a contaminant concentration greater than 20-fold MAC value, the individual grade has the minimal magnitude of
β = 1. The evaluation grade (
bi) for an environmental component is calculated as the average value of individual grades (
βj), Equation (9):
where
m is the number of quality indicators identified for a given environmental component. The suggested scheme for the evaluation scale development is designed for general purpose and can be employed for preliminary studies or for cases when the elaboration of more comprehensive scales is time-consuming. This methodology can be further improved by the experienced evaluators in the environmental protection field.
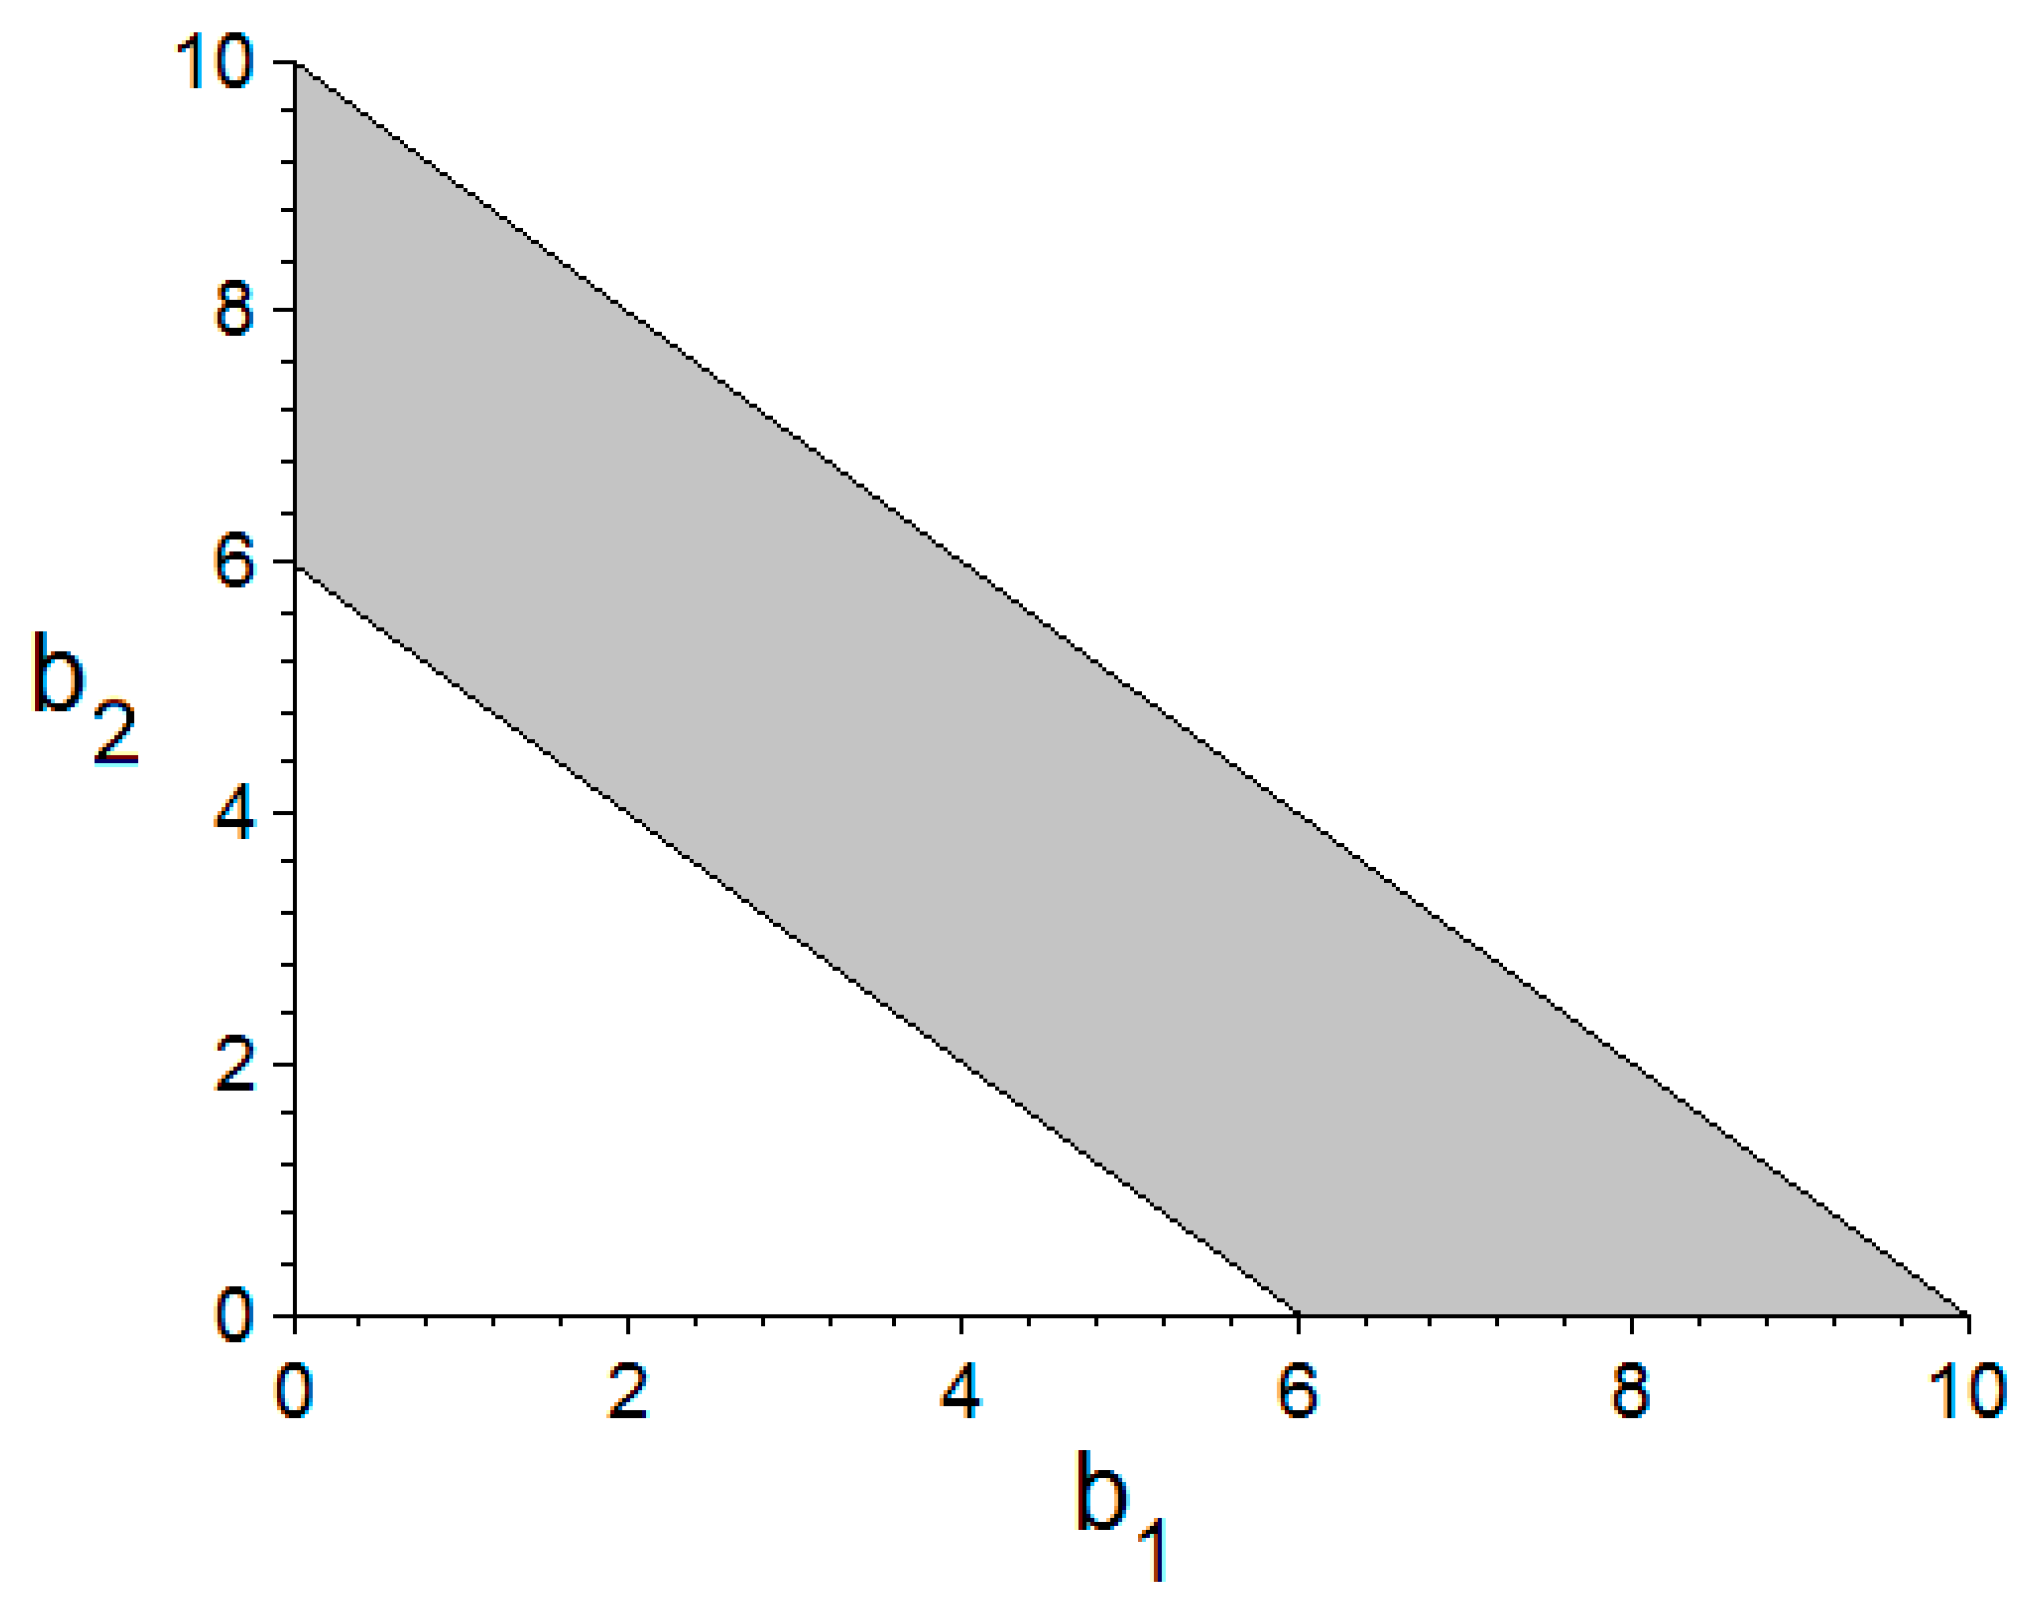
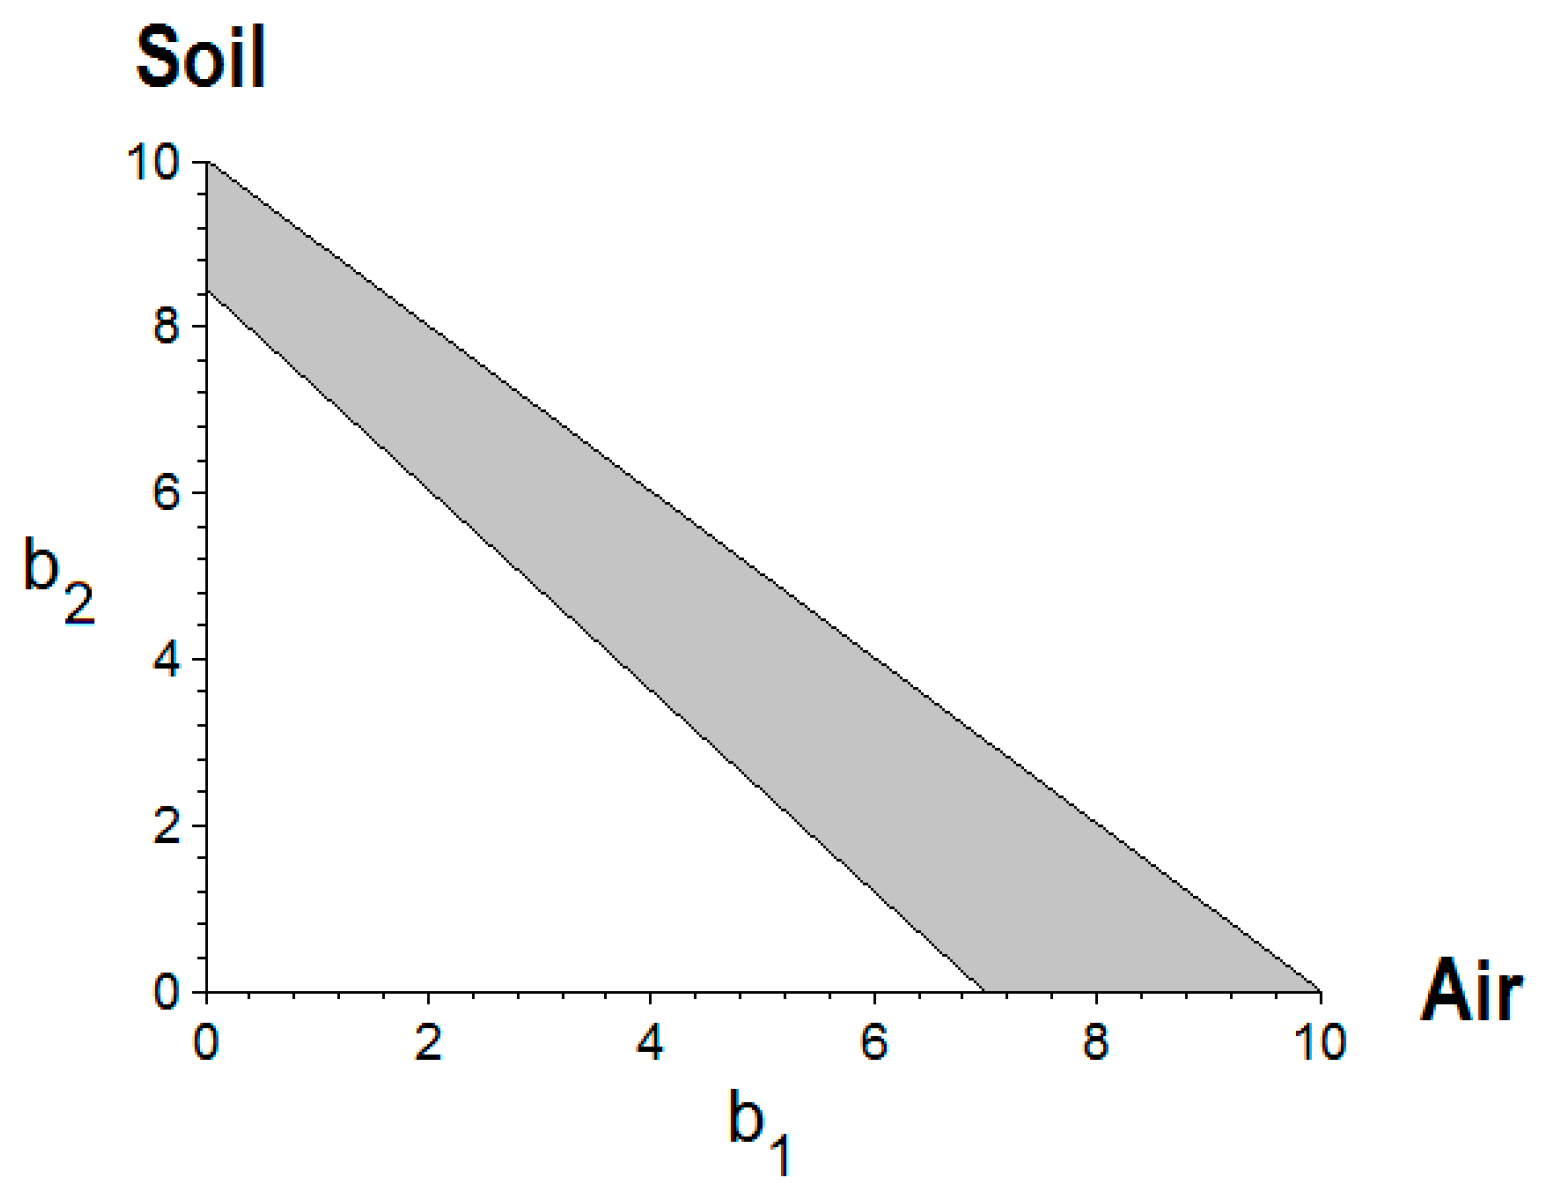
3.2. Estimation of the Index of Global Pollution for a Thermoelectric Plant—A Case Study
The application of the new proposed method is illustrated next as an example for the evaluation of the index of global pollution for an ecosystem in the vicinity of a thermoelectric plant from the North-East part of Romania. Two environmental components
Air and
Soil were ascertained in terms of quality indicators. The quality of
Air was estimated by monitoring of total particulate matters (TSP), PM
10 and PM
2.5. In turn, the quality of
Soil was evaluated by monitoring the content of heavy metals.
Table 4 summarizes the monitored quality indicators for each environmental component and their maximum allowed concentration (MAC) according to Romanian national legislation. In addition,
Table 4 reports the ratio between observed levels (OL) of pollutant to its maximum admissible level (MAC) as well as the attributed individual grade values (
βj). Note that the ratio OL/MAC was calculated to assign individual grade values (
βj) according to the proposed methodology presented in the previous section (
Table 3).
On the basis of data given in
Table 4, the evaluation grades
b1 and
b2 for environmental components
Air and
Soil, respectively, were calculated as average values of individual grades, as follows:
Hence, the index of global pollution (
IGP) was calculated according to the right-triangle graphical method as follows:
The graphical representation of the right-triangle method for this case study is depicted in
Figure 4.
According to
Figure 4, the
graphical pollution indicator ∆
S is equal to ∆
S = 20.25, revealing an environment changed in the acceptable limits nearby the thermoelectric plant. Also, from
Figure 4 one can discern that
Air component is more affected than
Soil component.
For this case study, the average value of evaluation grades is equal to . Consequently, the index of global pollution IGP calculated by the concentric circles method (Equation (4)) is equal to 1.665, which is in reasonable agreement with the value of 1.681 determined by the right-triangle method proposed in this paper.
In addition, we have validated our method by comparison with another method proposed recently by Abu Shaid [
9]. For the case of two environmental components, Abu Shaid suggested two different approaches. According to the first approach, the pollution index can be calculated directly from the individual grades (quality grades) of both environmental components. For this situation, the author proposed a model resembling Equation (2) but using the quality grades instead of the evaluation grades, that is:
where
m denotes herein the total number of the individual grades.
For our particular case study (thermoelectric plant,
Table 4), the calculation of the pollution index according to Equation (13) gives:
The second approach proposed by Abu Shaid [
9] involves the average values of quality indicators, i.e., evaluation grades. From a graphical standpoint, this approach resembles the proposed method by Popa et al. [
22] (concentric circles) with some modifications. For the second approach, the author Abu Shaid deduced the following equation for the pollution index [
9]:
For our case (thermoelectric plant,
Table 4), Equation (15) can be re-written as:
As one may observe, this value of 1.665 from Equation (16) is identical to the pollution index value given by Popa’s method (1.665). This may be explained by the fact that Equation (15) is a mathematical reordering of the initial Equation (4) that can be obtained after explicit substitution of the average value via its components in Equation (4).
By comparing pollution index values determined through different methods, the following remarks should be mentioned. The right-triangle method provided the highest value of the pollution index (1.681) for this case study, suggesting a more damaged environment. This may be attributed to the fact that the proposed right-triangle method (for two environmental components) is the closest graphical method to the Rojanschi’s first principle.
Overall, the values of index of global pollution IGP determined by four methods suggested the same class B of the ecosystem, i.e., the environment in the vicinity of the considered thermoelectric plant was changed by human activities in the acceptable limits.
4. Conclusions
In this work, a new graphical method was developed to extend the Rojanschi approach for the case of two environmental components. The proposed method relied on the basic idea to avoid the average value of evaluation grades and to use only the graphical correspondence for calculation of the index of global pollution. To this end, a right-angle triangle graph methodology was proposed, where bases (catheti) represented the values of the evaluation grades, and hypotenuse had the only role of the connection line between these values. Finally, for the case of two environmental components, the index of global pollution (IGP) was calculated as the relation between the ideal and real ecosystem states represented by the ratio between surface areas of external and enclosed right triangles. The proposed graphical method was tested and validated for a real case study, dealing with environmental impact assessment of a refinery located on the Romanian Black Sea Coast, considering two environmental components, i.e., Air and Water. Our method yielded IGP = 5.073, suggesting that the environment was substantially modified by the refinery activity, being dangerous for life forms. In addition, a general scheme was suggested for the evaluation scale development on the basis of the maximum allowed concentrations of pollutants. This scheme was exemplified for a case study related to a thermoelectric power plant as a pollution source. It was illustrated in this way how potential risk assessment could be estimated by pollution indices in order to prevent man-made disasters linked to pollution of water, soil or air. In addition, the proposed method for the evaluation of the pollution index was validated by comparison with other three-alternative methods existing in the literature. All considered methods (including the right-triangle graphical method) converged to the same class of the ecosystem, thus corroborating our approach proposed in this paper.


