
An ESCO Business Model Using CER for Buildings’ Energy Retrofit


1
Department of Architectural Engineering, Hanyang University, Seoul 133-791, Korea
2
Innovative Durable Building and Infrastructure Research Center, Hanyang University, Seoul 133-791, Korea
*
Author to whom correspondence should be addressed.
Sustainability 2017, 9(4), 591; https://doi.org/10.3390/su9040591
Submission received: 20 January 2017
/
Revised: 27 March 2017
/
Accepted: 29 March 2017
/
Published: 12 April 2017
(This article belongs to the Special Issue Sustainable Built Environment of Post-Carbon Era (Sustainable Built Environment 2016 Seoul Conference))
Abstract
:This study proposes an Energy Service Company (ESCO) business model to which Certified Emission Reduction (CER) is applied mainly for guaranteed savings. To verify the effectiveness of this ESCO business model, option theory is used. Notably, along with call and put options, which are appropriate for profit structure evaluation of existing guaranteed savings contract, an up and knock-out option was used to analyze the option of securing profit from CER. Based on this analysis, the values of the guarantee acquired by an energy user from the change in the amount of energy savings and the values of an ESCO’s right to profit from energy savings and CER, were calculated. Through these valuations, the profit sharing ratio between energy users and the ESCO was estimated. When the model proposed in this paper was applied to a project case, the profit sharing ratio was 16.37%. The model proposed in this paper is useful for motivating ESCOs to save more energy during operating periods by effectively using profit from CER. Additionally, this model will contribute to the expansion of ESCO market and the effectiveness of energy performance projects in Korea.
1. Introduction
The 21st Conference of the Parties to the United Nations Framework Convention on Climate Change (COP21) was recently hosted to establish a new climate change convention that will replace the Kyoto Protocol, which expires in 2020. At the conference, South Korea officially announced its target for carbon emissions reduction to be 37% against BAU in 2030. Therefore, it is absolutely crucial for Korea to explore strategies to further actively reduce greenhouse gas emissions.
According to the fifth Intergovernmental Panel on Climate Change (IPCC) report, the share of direct greenhouse gas (GHG) emissions from buildings is low at 6.4%. However, when indirect GHG emissions are also considered, the figure grows substantially to 19% of the entire GHG emissions representing a large share in GHG emissions along with the emissions from industry (31%) [1]. Therefore, efforts to reduce GHG emissions that focus on the industrial sector and buildings are required to fulfill national emission reduction targets. However, in Korea, industries including semi-conductor manufacturers, petroleum, and steel claim that cutting additional GHG emissions is difficult; therefore, a limit exists on emissions reductions in the industrial sector.
The International Energy Agency (IEA) stated in 2008 that increasing buildings’ energy efficiency, which is also a way to reduce GHG emissions, is cost-efficient in reducing energy consumption and GHG emissions [2]. The fourth IPCC report also found that the potential for GHG reduction is the greatest for buildings [3]. GHG emissions reduction for buildings can play a significantly larger role in effectively meeting the national emissions reduction target than the industrial sector. Additionally, because approximately 74% of the buildings in Korea were constructed before the year 2000, energy retrofit of buildings is an effective strategy for the fulfillment of Korea’s GHG emissions reduction target.
An effective business model can encourage energy retrofit of buildings based on market mechanisms. One of the most well-known business models of energy performance contracts is an energy service company (ESCO). An energy performance contract (EPC) is a financing package provided by ESCOs [4]. ESCOs typically offer comprehensive contracts that include energy information and control systems, energy audits, installation, operation and maintenance of equipment, competitive finance, and fuel and electricity purchasing. These contracts allow the client to reduce energy costs, transfer risk, and concentrate attention on core activities [5]. The ESCO contract model is largely divided into shared savings contracts and guaranteed savings contract. In advanced countries, such as the United States and European countries, the share of guaranteed savings contract is typically greater [6,7]. Similarly, in Korea, a guaranteed savings contract is recommended more than a share savings contract. An ESCO contract provides significant advantages for building clients to construct energy efficiency retrofit projects. However, both building clients and ESCOs are profit-oriented. In building an energy efficiency retrofit project, the main concern of building clients and ESCOs is their profit from an economic standpoint [4]. In other words, for the ESCO model to be applied to buildings’ energy retrofit based on market mechanisms, additional cash flow is required.
In addition to the cash flow from energy saving, CER trading is also a way to generate cash flow. A CER exchange was established in Korea in 2015. Although the emissions trading scheme is still in its early stages, the government of Korea has been exploring strategies to promote the emissions trading scheme and is attempting to enable CERs acquired from buildings’ emissions reduction to also be traded on the market. Therefore, if an ESCO business model that utilizes CER is developed according to an ESCO model’s structural characteristics, it will encourage energy retrofit for buildings.
Previous studies on ESCO contracts were conducted from a wide variety of perspectives including the future direction for further improvement of ESCO contracts, improvement of procedural loopholes, and analysis of obstacles. However, few studies have conducted an analysis of ESCO contracts’ profit structures and the application of ESCO contracts to buildings’ energy retrofit in connection with CER. Therefore, this paper reviews the structural characteristics of the ESCO business model to which CER is applied in terms of guaranteed savings contract for which utilization is more convenient than other ESCO contract models and to propose an ESCO business model for buildings’ energy retrofit to which CER is applied.
2. Background
2.1. Concept of an ESCO
An ESCO is a company that specializes in energy saving or an energy-saving service. The ESCO runs a business by providing technologies or the necessary financing for energy users to replace or enhance existing energy facilities for the purpose of saving energy. Then, the ESCO retrieves the investment with the profit generated from the saved energy [8]. The installation of energy-saving facilities by an ESCO does not require the energy user’s initial investment, and the related technological risk caused by investment in facilities can be reduced because the professional service from the ESCO is used. Additionally, the ESCO generates profits from the energy-saving service, verifies the volume of energy saving through monitoring and maintenance, and facilitates financing for investment in energy efficiency [9]. ESCO business models can be divided into shared savings contracts and guaranteed savings contract depending on the type of contract. Table 1 shows a comparison of the two types of contracts explained in preceding studies [10].
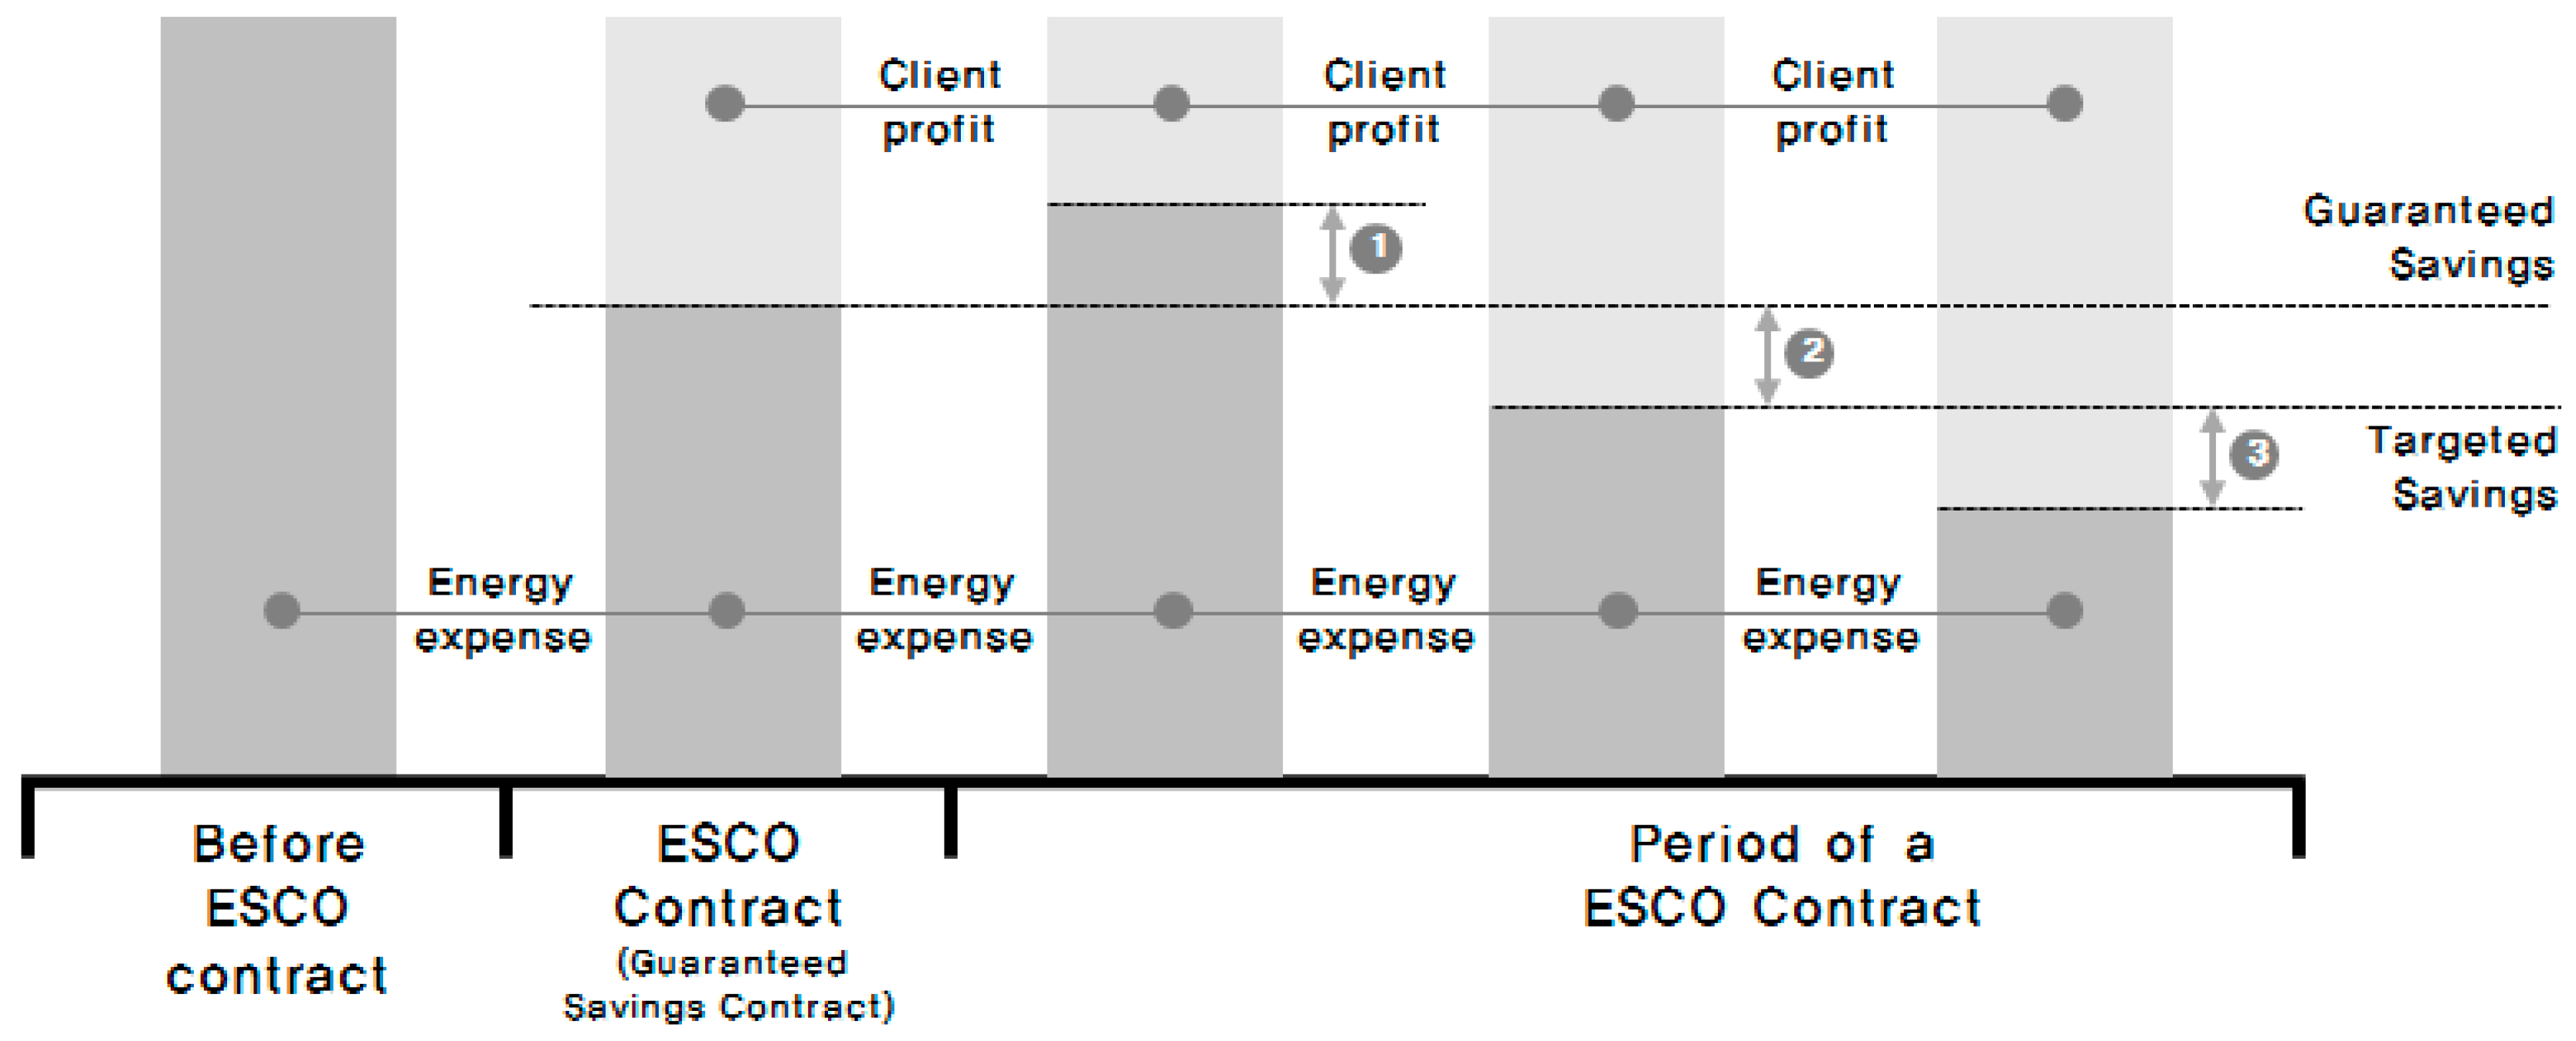
In advanced countries, the share of guaranteed saving contract is relatively higher [6], and the guaranteed savings contract is actively applied to the majority of ESCO businesses. Table 2 shows the terminologies used in the guaranteed savings contract in Korea [11].
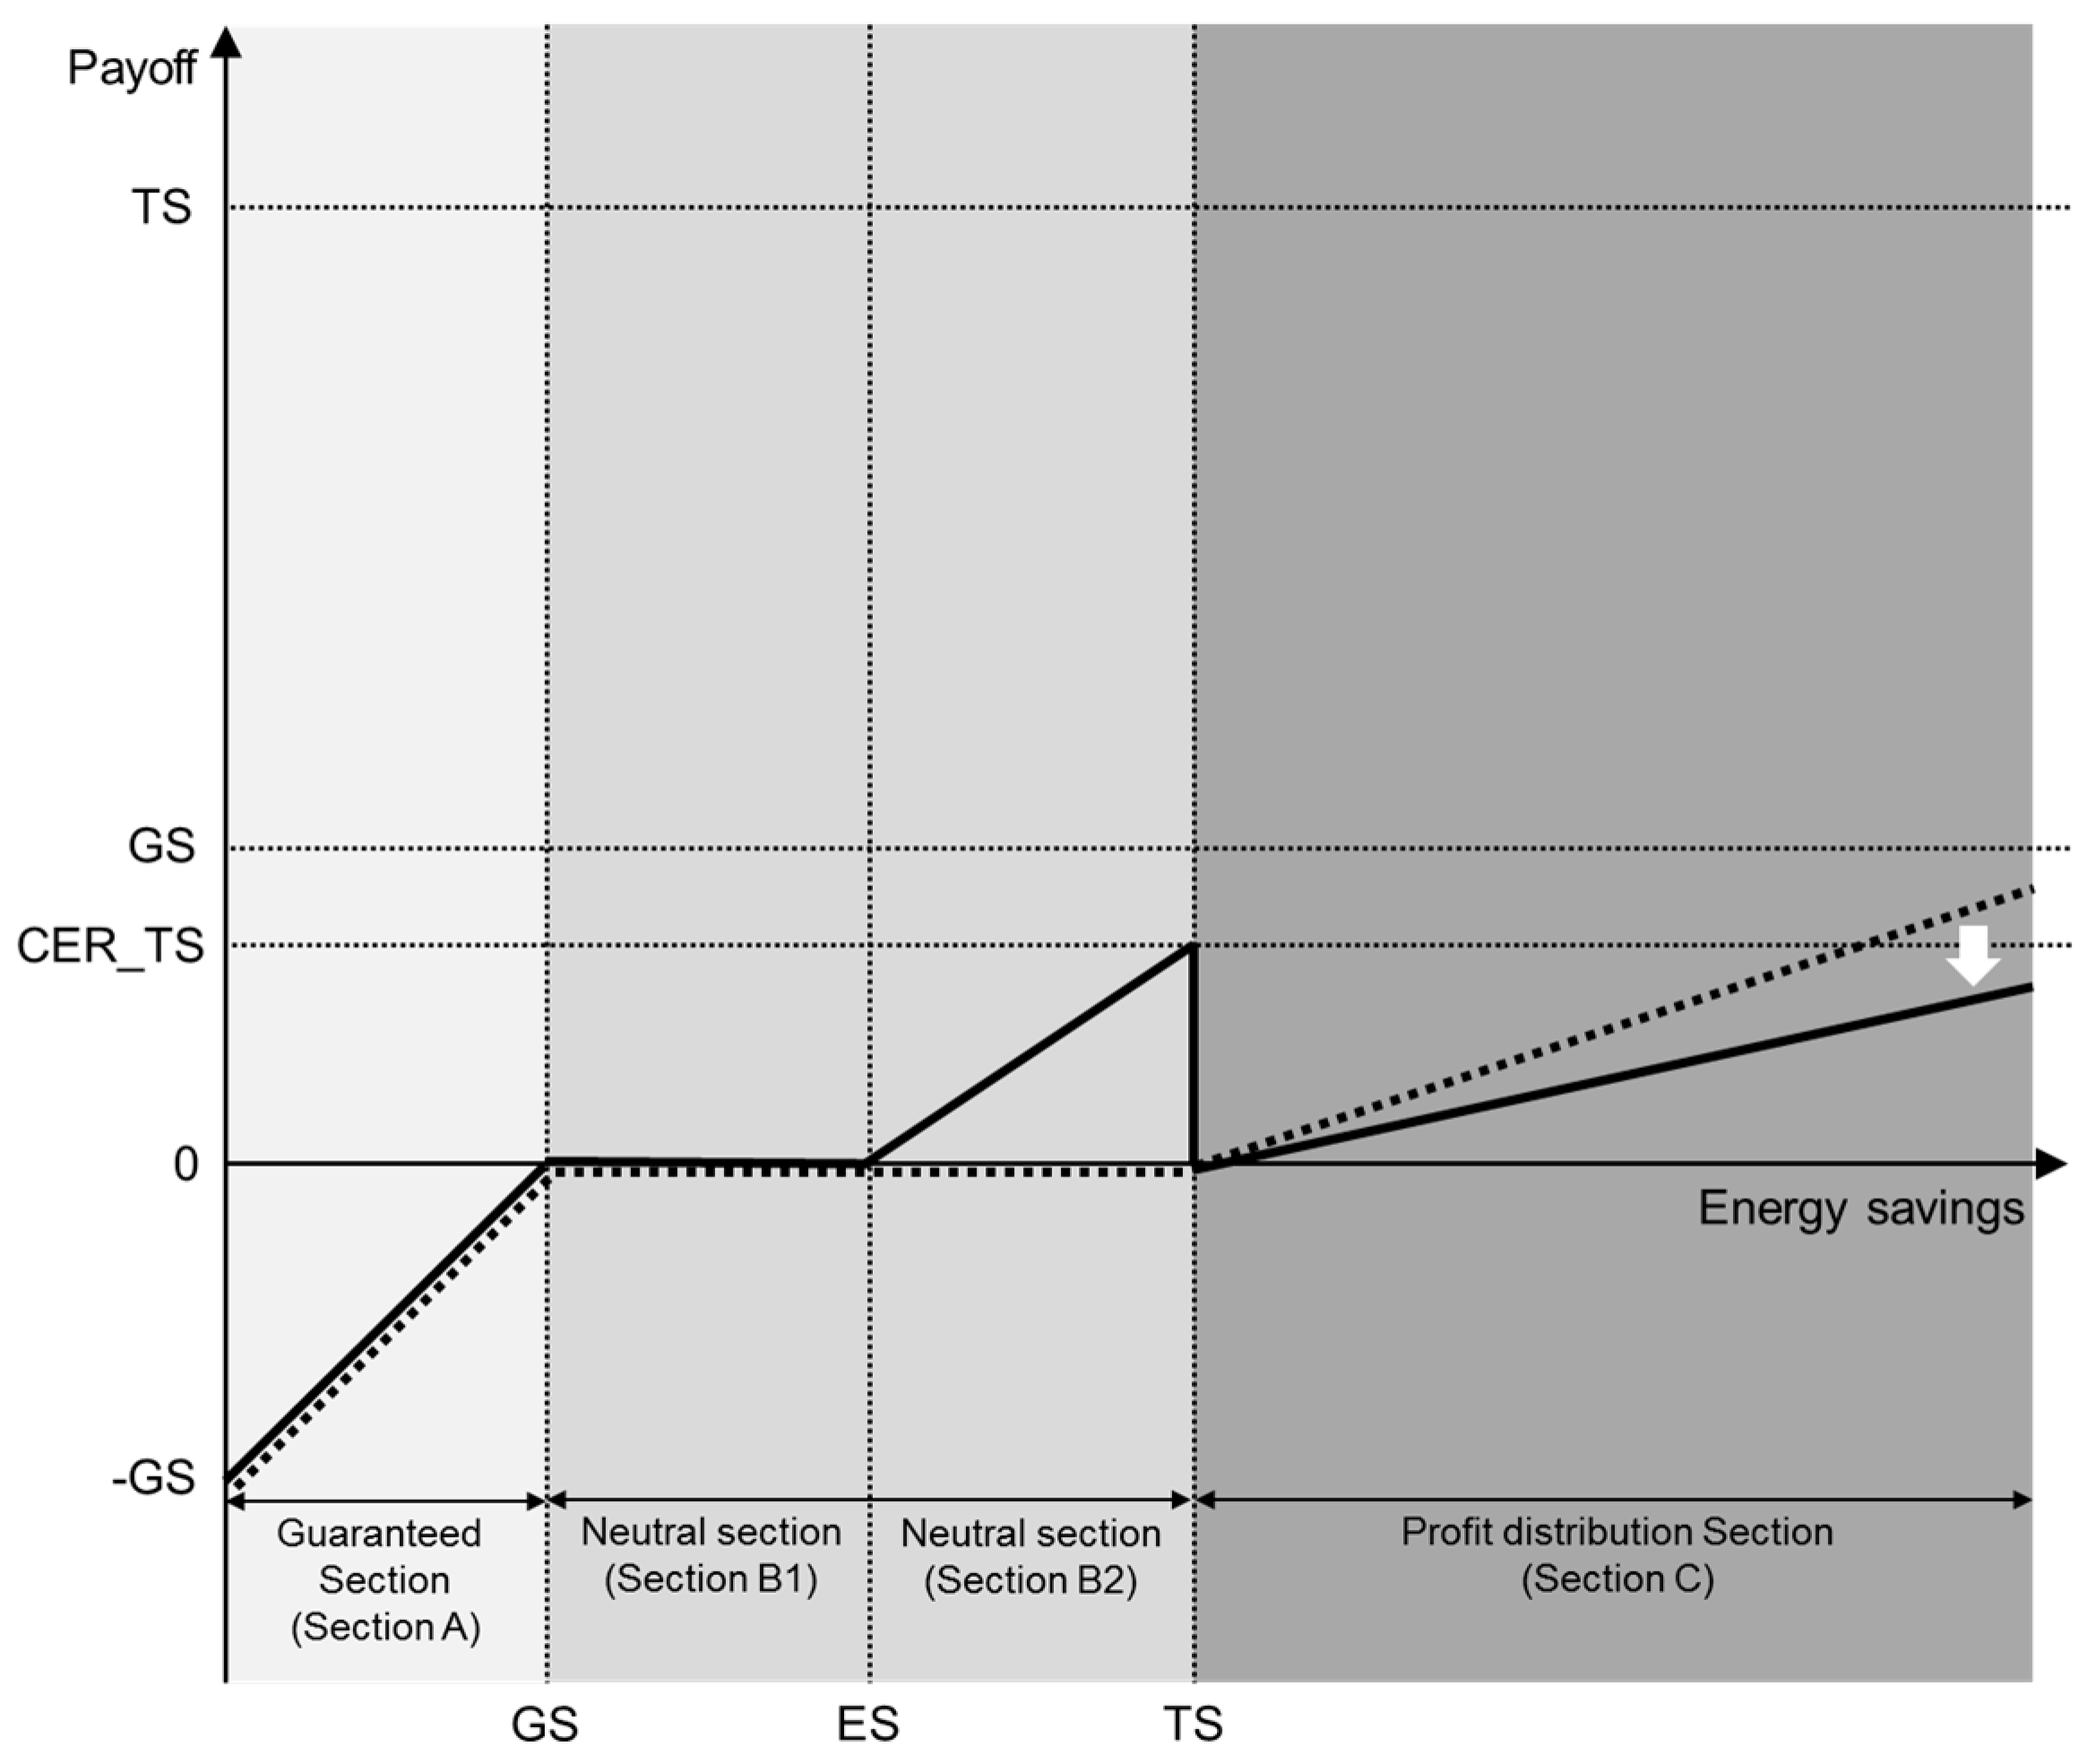
When the concept of a guaranteed savings contract, as in Table 1 and the most-used terminologies, as in Table 2 are considered, the profit structure of a guaranteed savings contract can be divided into three sections demonstrated in Figure 1. First, Section 2 is a type of neutral area where the energy savings are between the guaranteed savings and the target savings. In this section, the ESCO acquires profit from the cost of services required for the implementation of the energy-savings project for a user based on a general contract for the implementation of the energy-saving project. The standard contract states that when the energy saving are between the guaranteed savings and the target savings, the ESCO and the user of the service do not have any obligation with respect to guarantee or profit sharing. The most notable feature of a guaranteed savings contract is that it generates Section 1 and Section 3 in the profit structure. Section 1 is where energy savings are lower than the guaranteed savings. In such a case, the ESCO must pay the user the value of the difference based on additional contract terms for the guarantee of performance. In Section 3, the value of energy savings exceeds the value of TS. In such cases, ESCO acquires the rights to a portion of the performance achieved in excess of the target based on contract terms for the distribution of additional performance. Therefore, ESCO obtains the right to acquire a form of additional profit. In this case, the value of guarantee provided by the ESCO in section 1 and the value of the right to profit acquired by the ESCO in Section 3 are different depending on the levels set for the value of guaranteed savings and TS. Typically, the value of energy savings is suggested by the ESCO, but the service user verifies the figure by reading an energy use diagnosis report provided by an external professional institution. Considering that Section 2 is the baseline for general service contracts, the value of guarantee offered by the ESCO in Section 1 and the value of the right to profit obtained by the ESCO from the performance sharing contract in section 3 should be the same. Accordingly, the value guarantee by the ESCO in Section 1 is evaluated, and the profit sharing ratio is calculated in Section 3 in such a way that it becomes the same as the value of guarantee. Then, the guaranteed savings contract is signed between the ESCO and the user [11].
This study explores ways to encourage buildings’ energy retrofit by ESCOs based on the combination of guaranteed savings contract, which have characteristics and additional cash flow generated from CER.
2.2. Literature Review
As stated, buildings in Korea built before the year 2000 account for approximately 74% of all buildings in the nation. Therefore, the energy-saving effect of buildings’ energy retrofit is expected to be a significant issue. Additionally, the promotion of energy retrofit for buildings at the national level is a significant agenda item in Korea and other advanced countries. The most typical example is the Green Deal policy implemented in the United Kingdom. The Green Deal policy of the United Kingdom is a robust policy that publicly funds the promotion of energy retrofit for houses [12,13]. However, the existence of such policy implies, paradoxically, a financial barrier to the promotion of energy retrofit for buildings. Additionally, a number of preceding studies note financial barriers that hinder the promotion of energy retrofit for buildings.
Zhang et al. (2013) analyzed China’s policies on building energy efficiency from a macroscopic perspective and identified the main barriers in promoting building energy efficiency in China. This study showed that a lack of financial incentives and the mismatch of market mechanisms hamper the promotion of building energy efficiency [14]. Intrachooto et al. (2007) examined architectural endeavors in Europe, the United States, and Asia that emphasized energy efficiency and highlighted five circumstances from which financial obstacles emerge: (1) components interdependency; (2) speculative financial return; (3) a focus on lowest cost; (4) neglected innovative effort; and (5) financial misallocation [15]. Hwang et al. (2015) identified the risks in green retrofit projects in Singapore and provided mitigation measures for the critical risks. The study noted financial risk as the most critical risk for building energy efficiency [16]. Du et al. (2014) investigated several barriers with the aid of information collected from questionnaires and semi-structured interviews. This study showed that stakeholders' hesitation to buildings’ energy retrofit was the largest barrier followed by high initial investment and low profitability [17]. Therefore, technological advantages, appropriate policies, and a profitable business model that is functional in the market are crucial for promoting buildings’ energy retrofit. The ESCO business model is an alternative that meets these specifications.
Studies on ESCOs are largely divided into two groups. This study analyzes why the level of investment in energy efficiency differs from socially appropriate levels from the perspective of market barriers and approach the ESCO as a means to overcoming such barriers.
Fang et al. (2012) investigated the effect of ESCOs empirically on energy use using a dynamic IPAT model and a balanced panel dataset of 94 countries for the period 1981 to 2007. This study showed that ESCO activities are an effective policy tool in reducing energy use [18]. Goldman et al. (2005) comprehensively analyzed the characteristics and performance of ESCO projects implemented in the United States in terms of the type of companies, the average amount of investment by sector, regional characteristics, type of equipment, and the time taken for the retrieval of investment. The authors suggested ESCOs’ role as a way of overcoming market failure and barriers such as energy efficiency project risks, asymmetry in information, and trading costs. [7] Steinberger et al. (2009) stated a necessity to secure necessary funding, improve regulations on ESCO contracts, develop a standardized contracting protocol, train experts in the field, and spread the information on ESCOs to promote ESCOs as a performance-based energy policy measure for investment in energy efficiency at a socially appropriate level [9]. Patari et al. (2014) identified the main factors hindering the development of ESCO business and analyzed the potential need for renewal [10]. Qian et al. (2014) developed a revenue-sharing bargaining model between an energy service company (ESCO) and an energy-using organization (EU). This study suggested some policies for government departments to encourage the development of ESCOs [19].
The second group of studies on ESCOs focuses on empirically identifying barriers to ESCO business by analyzing ESCO policies and cases in Europe, Japan, the United States, and developing countries and suggesting practical improvements.
Kostka et al. (2013) argued that with sophisticated market institutions still evolving in China, trust-based relations between ESCOs and energy customers are essential for the successful implementation of energy efficiency projects [20]. Vine (2005) estimated the scale of the ESCO market by conducting surveys in 38 countries and analyzed the characteristics of each country’s ESCO investment sector, policy restrictions on ESCOs, and barriers from the users’ perspective [21]. Lee et al. (2003) found the reason why economically viable energy savings measures could not be implemented and how this could be corrected by examining Korean ESCOs [8]. Painuly et al. (2003) emphasized the potential of ESCO business as a fund-raising mechanism while noting the market, institutional, financial, and cultural barriers as factors that hinder the promotion of ESCO in developing countries [22]. Suhonen et al. (2013) focused on the application of ESCO as a business model for heat entrepreneurship in Finland. This study showed that the ESCO model is unattractive in the current business climate and requires modifications or integration with other housing association maintenance services [23].
Additionally, some studies address the potential of ESCOs’ application to buildings’ energy retrofit. Stuart et al. (2014) presented a method to estimate the market investment potential for ESPC (energy-saving performance contracts) and annual blended energy savings remaining in buildings typically addressed by US ESCOs [24]. Jensen et al. (2013) presented current research on Danish municipalities’ use of ESCOs as a way to improve the standards of public buildings and to increase energy efficiency [25]. Lee et al. (2015) identified the key risks inherent in EPC projects and investigated building owners' concerns with the use of EPC and proposed practical measures to enhance the wider adoption of EPC [26]. Lee et al. (2013) proposed a simulation-based method to evaluate the probability of energy-saving shortfall considering the variations in the influential parameters including weather conditions, occupancy, operating hours, and thermostat set-points during the contract period because the lack of a proper assessment method on performance risks in EPC projects was one of the reasons hindering the further development of the ESCO market [27]. These studies noted that although the energy retrofit of buildings can be an effective business model for ESCOs, the practical implementation of ESCO projects faces limitations because of the uncertainty in the energy-savings volume, which is the primary cash flow for energy performance contracts. To address these problems in terms of the business model, additional cash flow must be generated to supplement the existing cash flow of the ESCO model. Cash flow that can be applied to the ESCO model for such purposes is Certified Emission Reduction (CER).
Many studies have investigated the application of CER to energy performance contracts from different perspectives but mainly by using the clean development mechanism (CDM) which is one method of emissions trading. Wang et al. (2010) analyzed the role of the clean development mechanism (CDM) in promoting renewable energy development in China by reviewing CDM activities, particularly, renewable energy CDM activities in China. This study considers CDM an indispensable incentive and a viable choice to promote renewable energy deployment in China [28]. Rahman et al. (2015) examined the cost structure of certified emission reductions (CERs) through various types of projects under the clean development mechanism (CDM) of the Kyoto Protocol [29]. Ren et al. (2011) proposed a new international cooperative framework based on the combination of conventional ESCO and CDM concepts for the promotion of energy conservation activities in developing countries [30]. Sunderasan (2011) investigated the market efficiency for CER designed and traded under the Kyoto protocol and then proceeded to ascertain predictability and market efficiency [31]. However, the studies mentioned were limited in their comprehensive analysis of CER and the ESCO model for buildings from the perspective of a business model.
2.3. Real Options
The discounted cash flow (DCF) model has limitations in reflecting future uncertainties or risk factors. To address such limitations, a framework of real options as an investment decision-making model that uses option theory is suggested [32].
Real options apply option theory to the valuation of tangible physical assets, not financial assets. Notably, real options work as a model that is applied in a dynamic and uncertain business environment where flexible business decisions must be made for strategic capital investment, valuation on investment opportunities, or capital expenditure for a project, for example [33].
As real options are based on the application of financial options’ basic concepts to real asset investment, there are certain differences in the variables. However, Table 3 shows that the variables of real options and financial options are similar [34].
There are five methodologies for the valuation of options [35]. Table 4 shows that the result of evaluating a project’s value using RADT and MCS is inaccurate. Additionally, as this study estimates volatility using a singular variable, HRO is not required. BSOPM, which is typically used for financial options, assumes continuous time. Thus, it is not appropriate for application real options. This study uses BOPM for the valuation of an ESCO business model that uses CER.
3. Research Methodology
3.1. Proposal for a Guaranteed Savings Contract Model Using CER
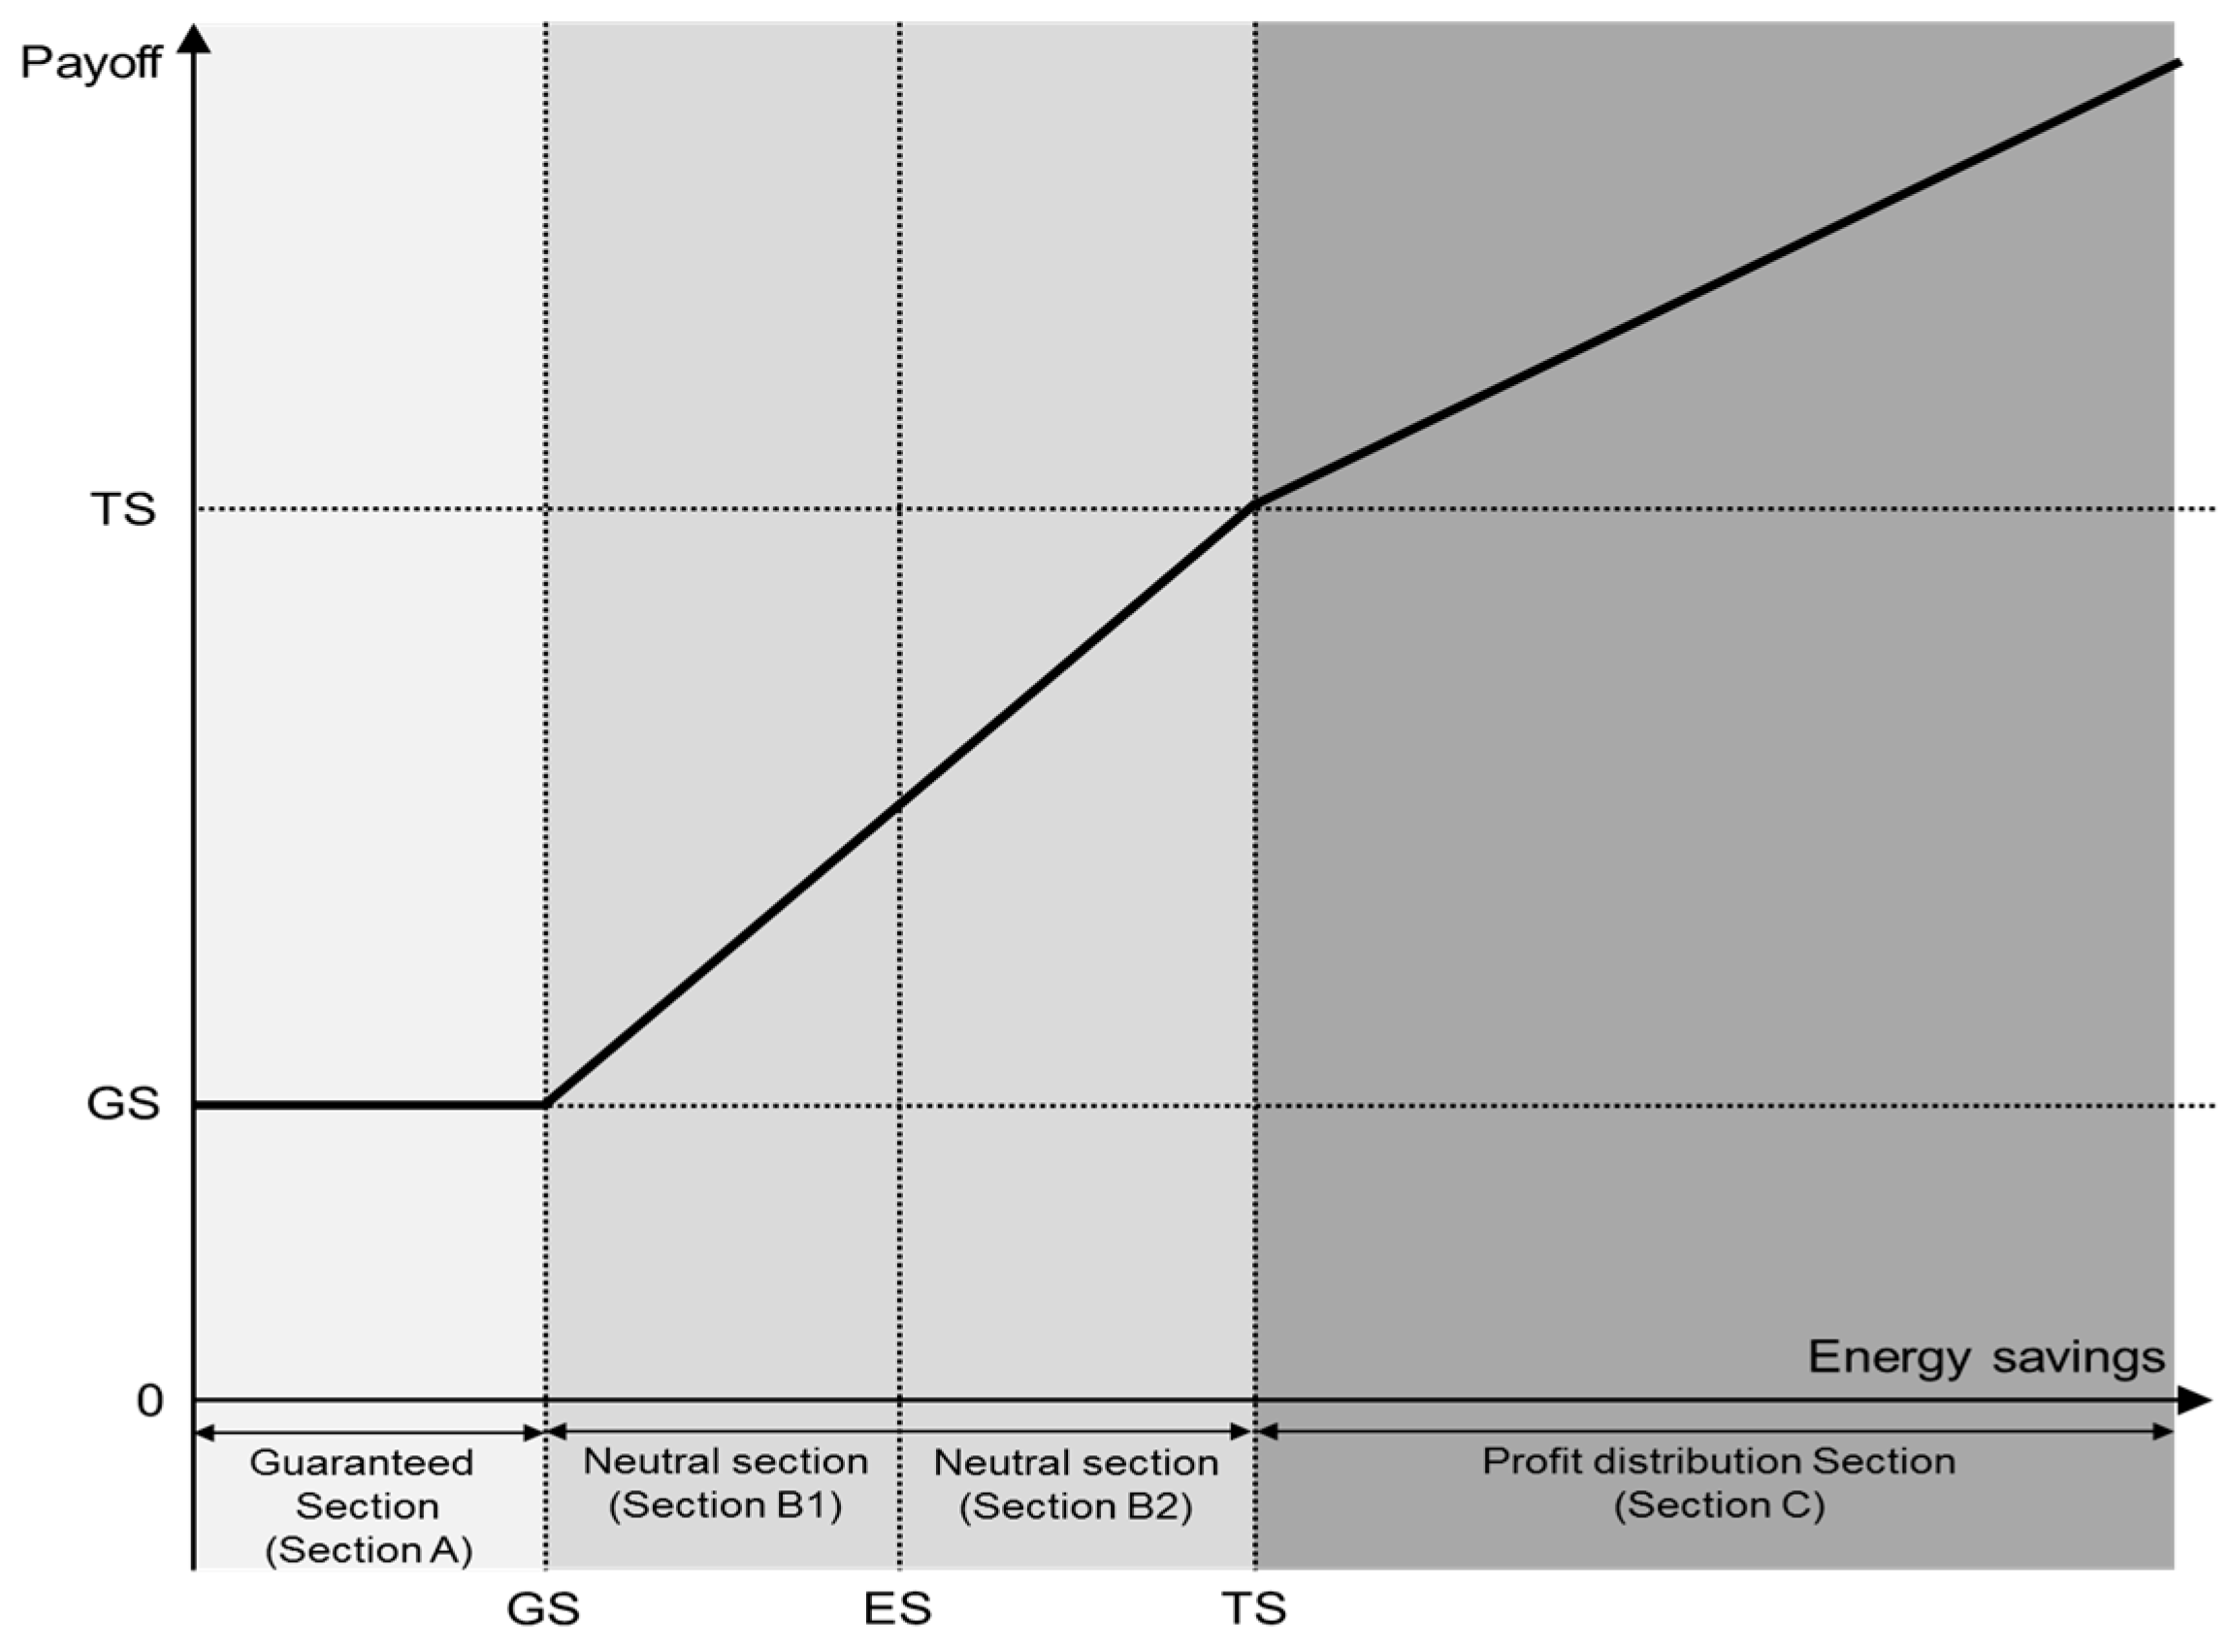
This chapter proposes a model that applies CER to a guaranteed savings contract, which is widely used as an ESCO business model. For that purpose, the profit structure of a guaranteed savings contract was reviewed from the perspective of the user and the ESCO. First, Figure 2 shows the change in profit of a guaranteed savings contract from the perspective of the user. Figure 2 shows that when the value of energy savings is lower than the value of guaranteed savings (GS) (Section A), the ESCO compensates for the difference so that energy savings of the volume of at least the guaranteed savings is possible. When the value of energy savings is higher than the value of guaranteed savings (GS) and lower than the value of TS (Section B), all the profits from energy savings are acquired by the user. Thus, the profit for the user increases following an increase in the energy-savings volume. Finally, when the value of energy savings is higher than the value of TS (Section C), the profit from the energy savings that exceeds the TS is distributed between the user and ESCO. The sum of the TS value and the value of savings that exceed the TS become the profit for the user, according to the pre-determined profit sharing ratio.
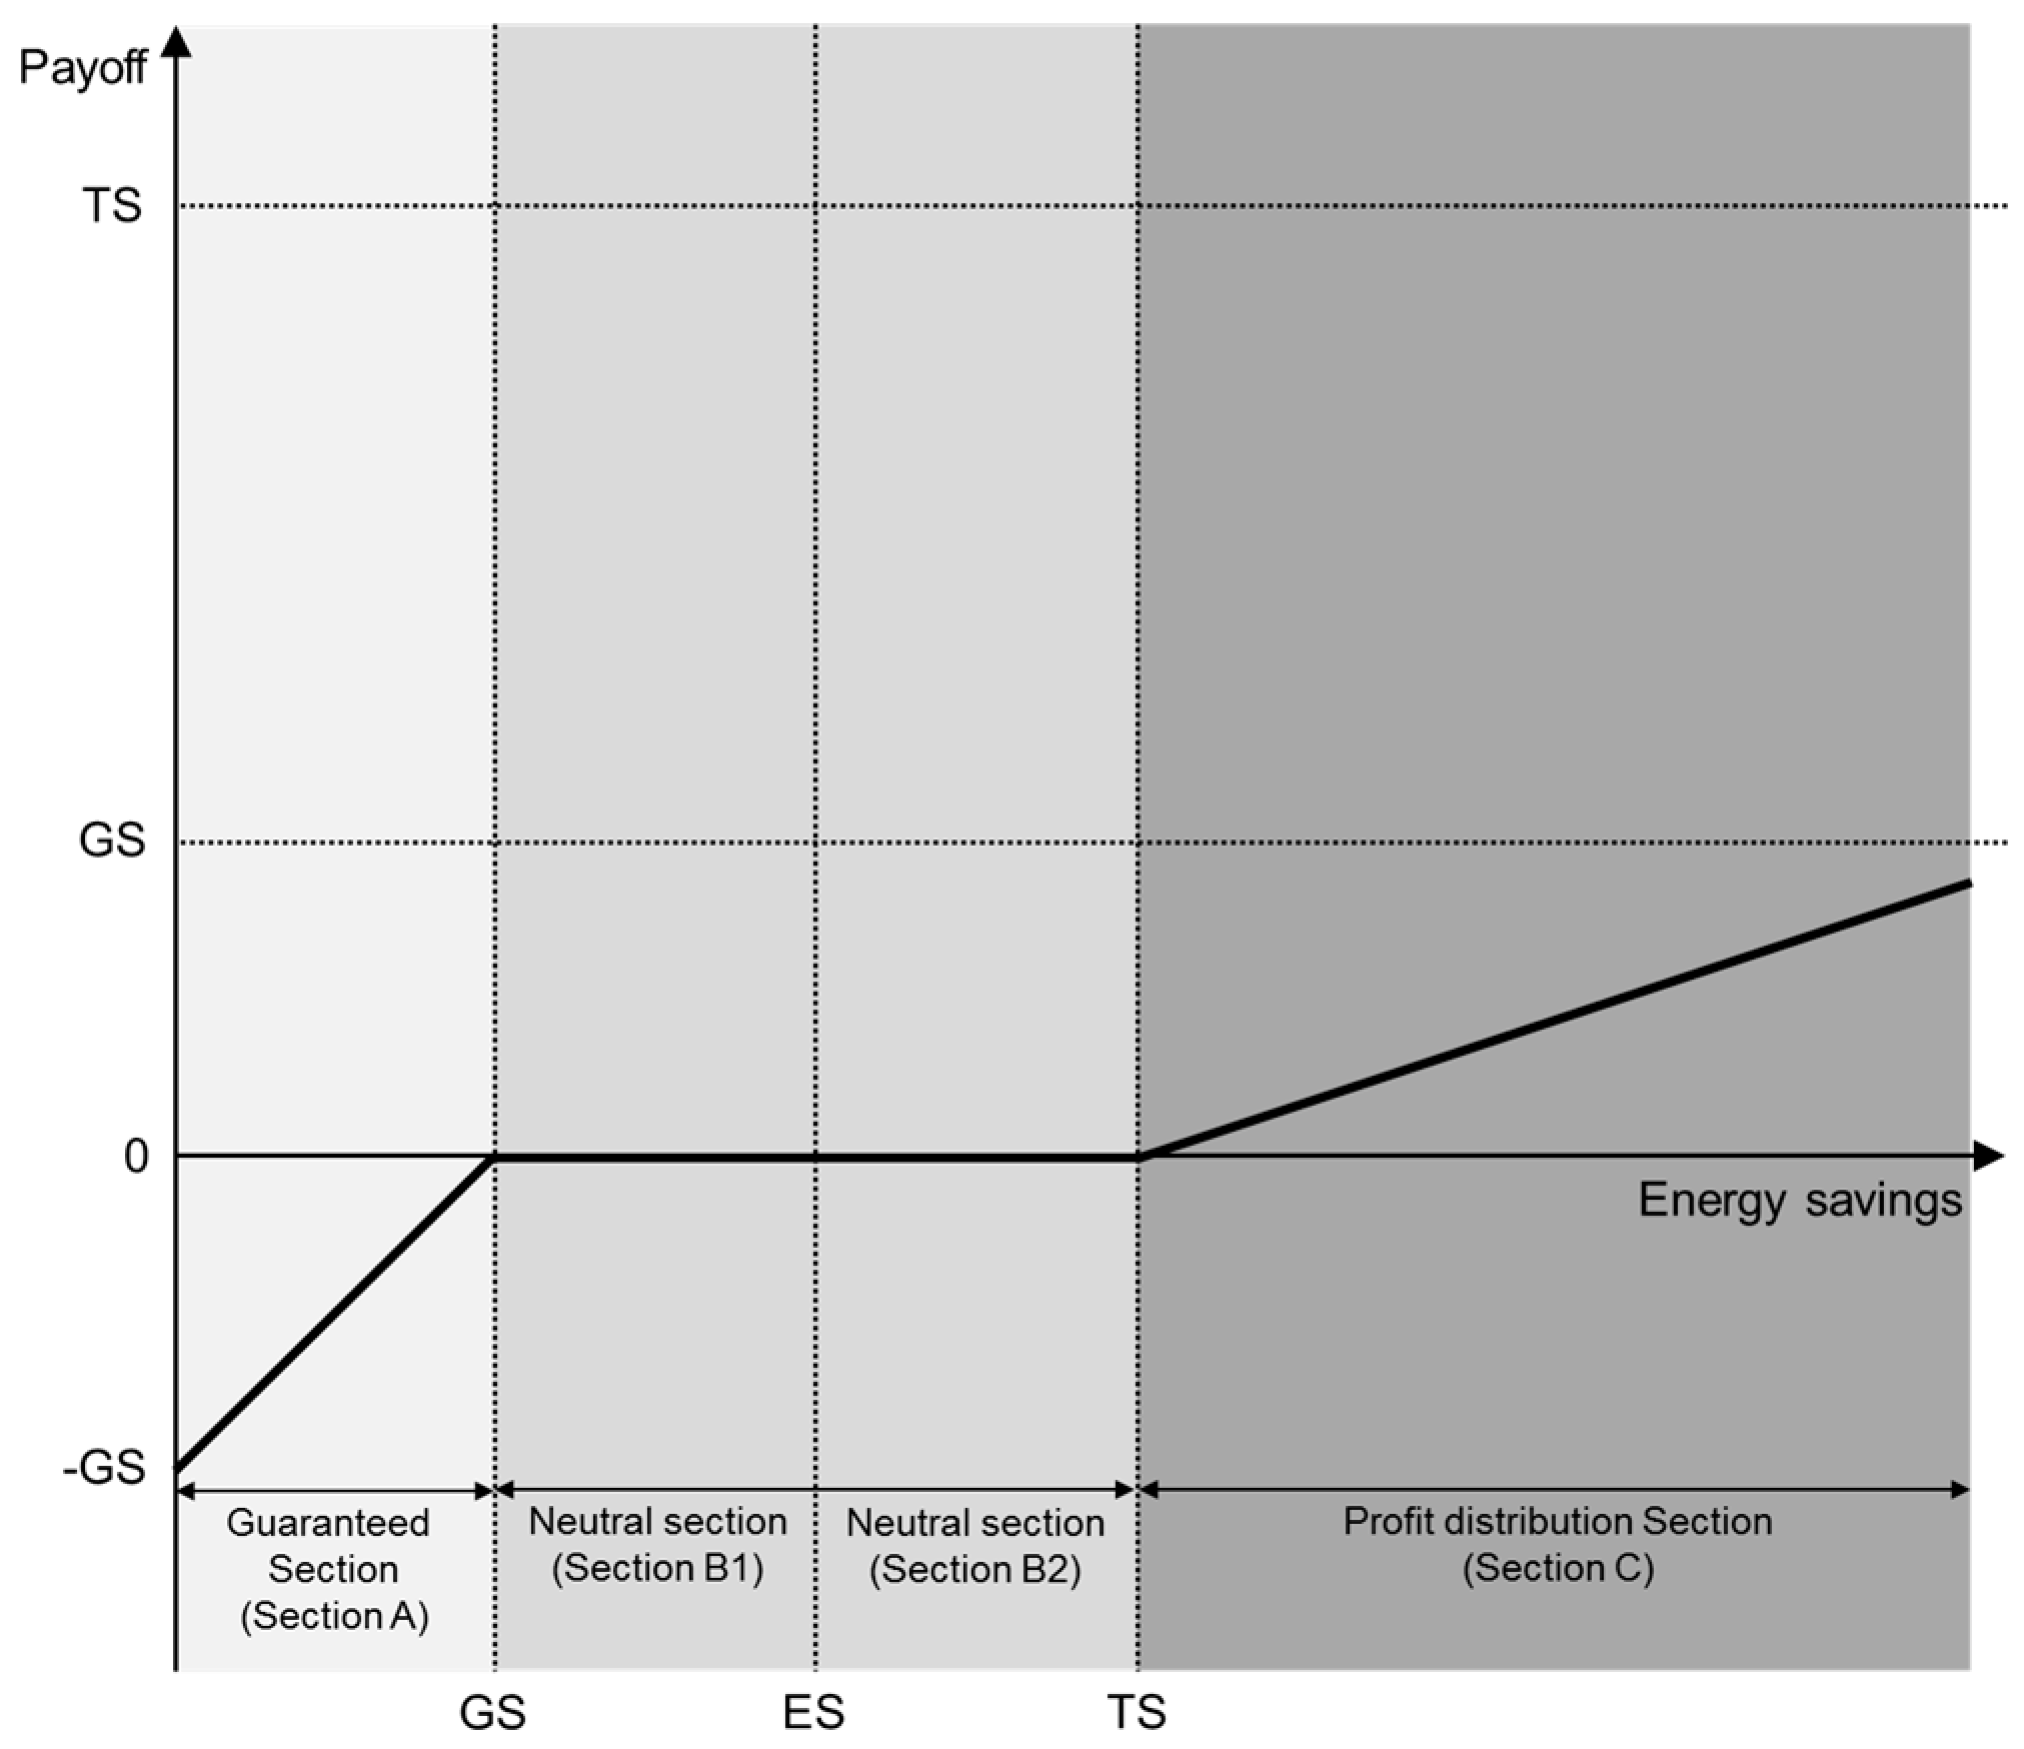
Figure 3 shows the change in the ESCO’s profit from a guaranteed savings contract. When energy savings are smaller than that of guaranteed savings (GS) (Section A), a loss occurs for the ESCO because the ESCO must assume responsibility to make up the difference between the guaranteed savings and the actual energy savings. When energy savings are greater than the value of guaranteed savings (GS) and smaller than the value of TS (Section B), there is no conflict of interest between the ESCO and the user; therefore, the ESCO acquires no profit. Finally, when the value of energy savings is greater than the value of TS (Section C), the ESCO profit is generated from the sharing of profit created from the energy-saving achieved in excess of the target.
In summary, for a project based on a guaranteed savings contract, project cost is financed by the user, and the energy efficiency project is implemented by the ESCO using that fund. Therefore, the ESCO at least earns the service fee for project implementation. Additionally, the guarantee segment (Section A) and the profit sharing segment (Section C) exist for current guaranteed savings contract, as shown in Figure 2 and Figure 3. Therefore, when the profit sharing ratio is set in such a way that profit for the ESCO has the same value as the ESCO’s guarantee, the guaranteed savings contract becomes reasonable.
The foci of this study are Sections B1 and B2. The ESCO obtains a service fee for implementing the energy performance project from the service’s user. In this context, the ESCO would focus more on the energy-savings volume in Section B1 than in Section B2 during the operating period. This is because in a situation where the ESCO has already secured a basic profit, a loss results if the actual energy-saving volume is smaller than the guaranteed savings (GS). The ESCO must strive harder during the operating period to increase the actual energy-savings volume to a level higher than the TS volume, which could also be a factor of additional cost. In contrast, greater energy-savings volume brings additional benefit for users; thus, users focus more on Section B2 than on Section B1. This is why users must motivate the ESCO to pay more attention to Section B2.
Thus, giving a certain proportion of the profit generated from the energy savings achieved in excess of TS to the ESCO in Section B2 is necessary. However, if a portion of the profit from energy savings, which is supposed to go to the user, is simply given to the ESCO, this incurs a disadvantage to the user in terms of profitability. In other words, if there is a way to gain additional profit other than the profit from the basic energy savings, the ESCO can acquire profit in Section B2 also. This study uses profit from CER to secure additional profit for the ESCO.
Figure 4 shows a guaranteed savings contract’s profit structure for the ESCO proposed by this study. Figure 4 is a variation of Figure 3, which explains the profit structure for the ESCO in existing guaranteed savings contract. There is a difference in Section B2. In Figure 3 there is no profit for the ESCO in Section B2 but, in Figure 4 profit is generated for the ESCO in Section B2.
The objective of the proposed model is to transfer the ESCO’s focus of interest from Section B1 to Section B2. Thus, the model defines that profit for the ESCO is initially generated from the point where the value of energy savings exceeds the value of expected savings (ES). Profit does not increase indefinitely following an increase in energy savings, but it reaches a peak at the TS value because when the value exceeds the TS, the value enters Section C. Additionally, when the value of energy savings increases to the TS level, the maximum amount of profit that can be acquired by ESCO becomes the TS value converted into profit from CER (CER_TS). However, considering that the profit from CER is, basically, the profit for users, providing the right to the ESCO to acquire the profit from CER for free is thought to be unreasonable. Thus, it is necessary to lower the ESCO’s share in the profit sharing ratio in Section C in consideration of the right to acquire the profit from CER. This amounts to a conversion of the ESCO’s profit, which is acquired when the value of energy savings exceeds the value of TS in Section B2.
3.2. Applying Real Options to the Proposed Model Valuation
In this study, option theory is used to assess the profit structure of a guaranteed savings contract that makes use of CER. For the valuation of each section of a guaranteed savings contract that uses CER, this study uses the put option, the call option, and the up and knockout option.
First, the put option was used for the valuation of the guaranteed section (Section A). If the energy savings (S) become smaller than the guaranteed savings (Xp), as shown in Figure 5 a guarantee value is generated because the user can secure the value that is lacking from energy savings (Xp) with the guarantee. However, when the energy savings (S) exceeds the guaranteed savings (Xp), the value of the guarantee is zero for the user. That is, a change in the value of guarantee shows the pattern illustrated in Figure 3 according to change in the energy savings (S), which is the same as the graph of the change in the value of the put option.
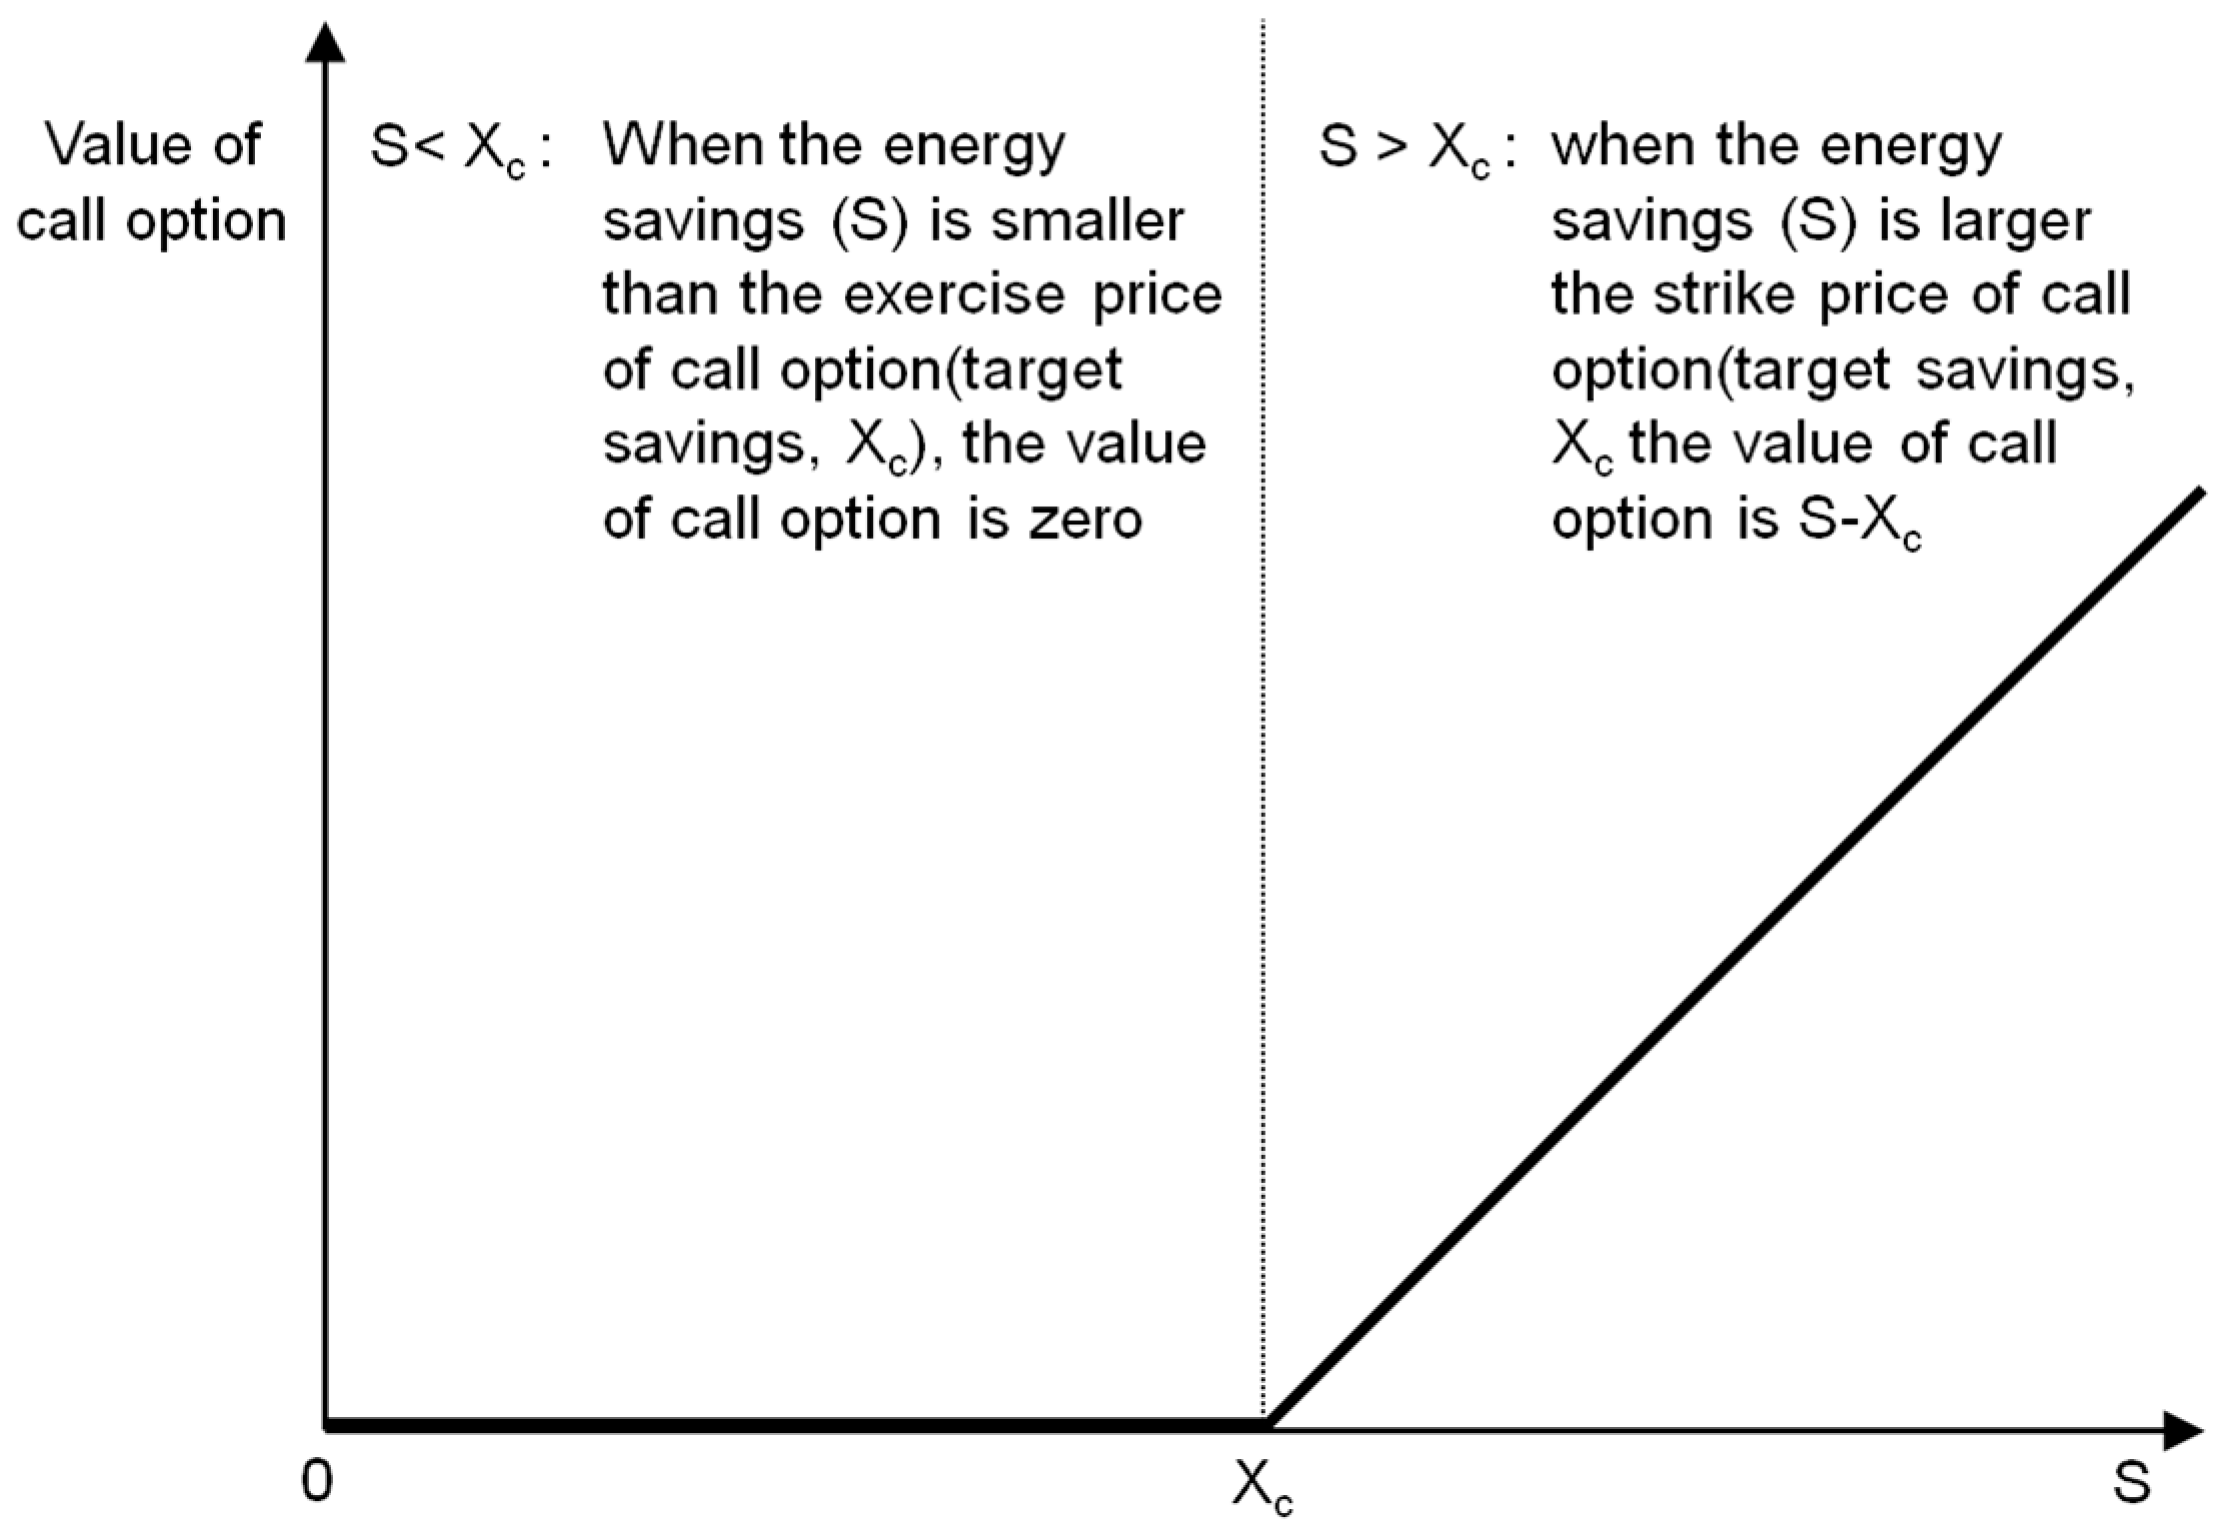
Second, the call option was used to assess the profit sharing section (Section C). When the actual energy savings (S) exceeds the target savings (Xc), as in Figure 6, the ESCO can secure profit from certain portions of the difference between the energy savings and the target savings. In contrast, when the energy savings (S) is lower than the target savings (Xc), the ESCO cannot acquire a profit. In other words, the ESCO’s right to acquire profit depends on the change in the energy savings compared to the benchmark value of the target savings. The change in the value of ESCO’s right to profit shows the pattern illustrated in Figure 6, which is the same as the graph of change in the value of the call option.
Finally, the up and knockout option was used for the valuation of Section B2. When the CER profit from actual energy savings (S_CER) exceeds CER profit from the expected energy savings (Xe), as shown in Figure 7 the ESCO can secure a profit that amounts to the value of energy savings converted into CER. In contrast, when the CER profit from actual energy savings (S_CER) is lower than the CER profit (Xe) from the expected savings, the ESCO cannot acquire a profit. Additionally, when the CER profit from the actual energy savings (S_CER) becomes larger than the CER profit from the target savings (H), the CER profit becomes zero. Such a change in the value of the option shows a pattern as illustrated in Figure 7, which is the same as the graph of the value of the up and knockout option.
In summary, the user secures a put option with an exercise price (Xp) that is the guaranteed savings. The ESCO owns a call option with an exercise price (Xc) that is the target savings and an up and knockout option with an exercise price (Xe) that is the CER based on the expected savings and whose barrier (H) is the CER based on the target savings. As a guaranteed savings contract is a reasonable agreement between the user and the ESCO, the value of options held by each party should be the same. The value of the put option held by the user is decided when the target energy savings and the guaranteed energy savings on the written contract between the ESCO and the user are determined. Eventually, the values of the options held by the user and the ESCO are the same by adjusting the slope of the profit sharing ratio (K) in Section C where the call option’s value is generated, as demonstrated in Equation (1).
: value of put option; : value of call option; : value of up and knock-out option; : Profit sharing ratio.
3.3. Binomial Lattice Model for Option Valuation
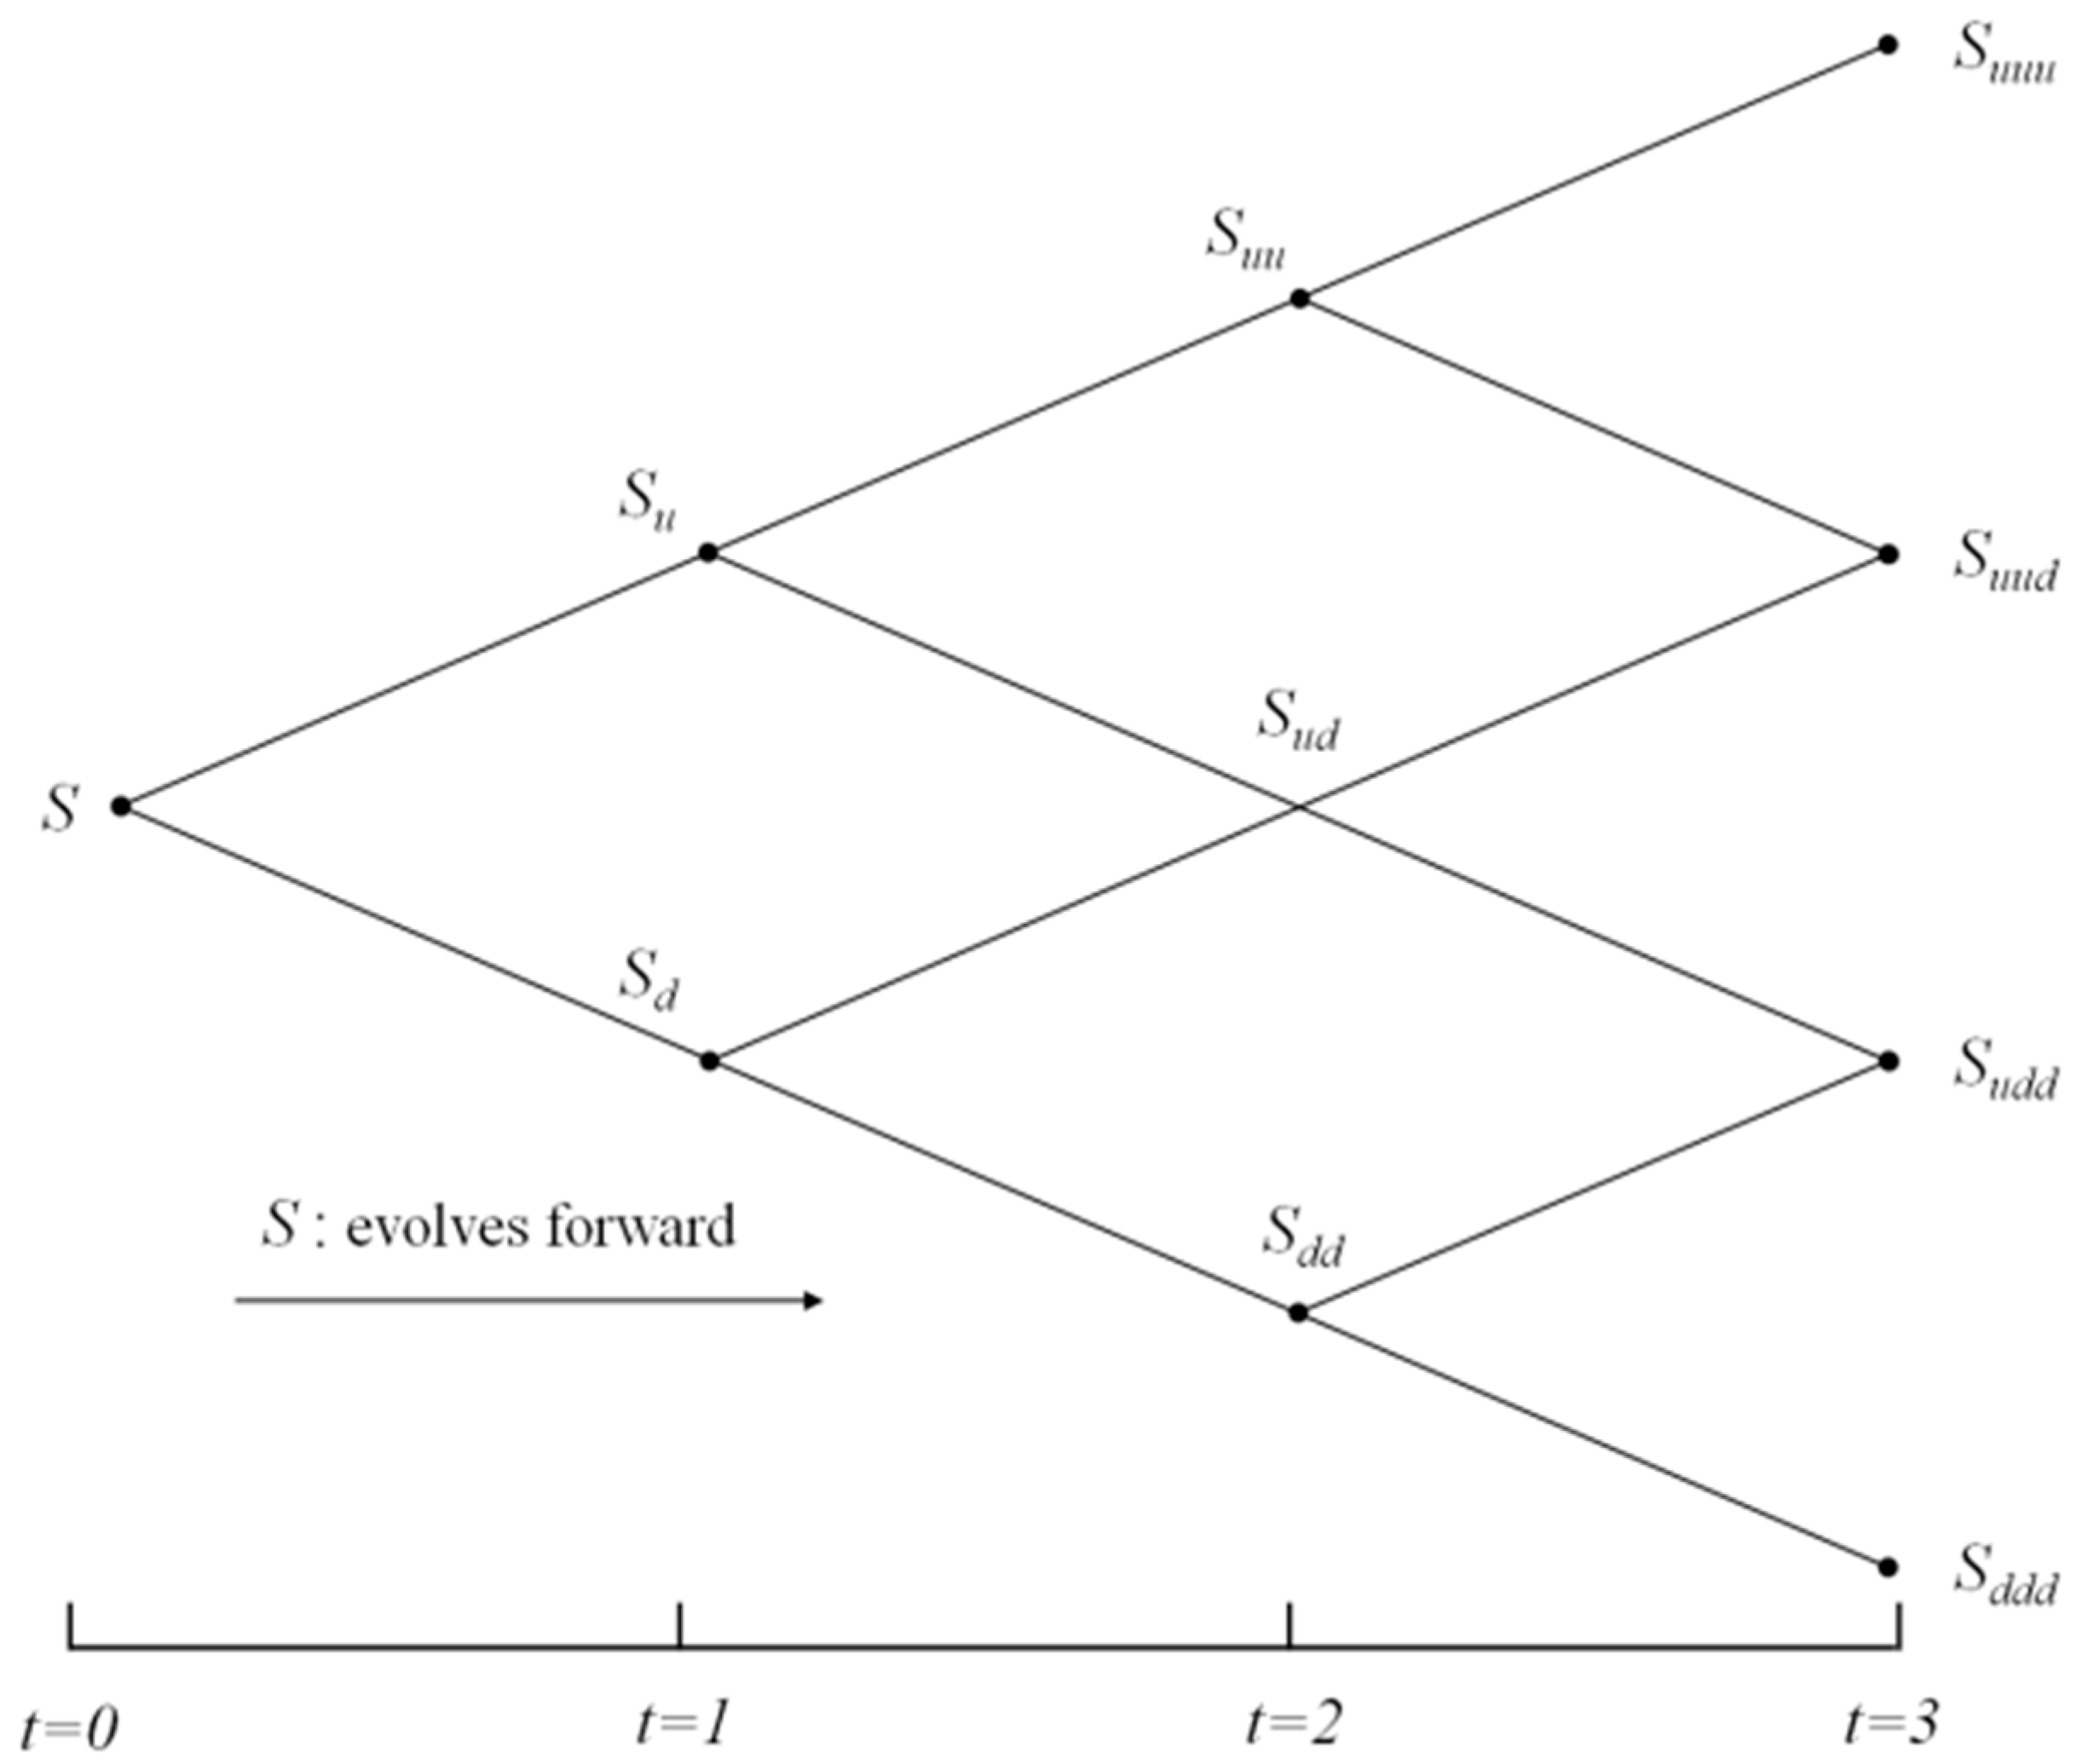
Cox et al. (1976) suggested a binominal lattice model as a method to value options assuming that a change in the value of the underlying asset follows binominal distribution [36]. A binomial lattice model can solve a more complex and realistic option pricing problem. The binomial lattice model requires two calculating processes: a process of creating the binomial tree for the underlying asset’s distribution, as shown in Figure 8 and another binomial tree creation process to calculate the option value as shown in Figure 9 [37]. First, the value of the underlying assets (S) needs to be determined for the binomial tree in Figure 8. In this study, a change in the value of options is caused by a change in the value of energy savings. Therefore, the present value of energy savings expected at the point of the guaranteed savings contract’s termination is used as the value of the underlying asset. The creation of the binomial trees through the forward process using the present value of energy savings, as demonstrated in Figure 8, is the process of generating cases in which the value can change with the flow of time because of uncertainty in the value of energy savings. In option theory, a binomial tree is calculated by first calculating the probability of a rise (u) and the probability of fall (d) using Equations (2) and (3) below and, then, calculating the probability of a rise (u) and the probability of a fall (d) along with the value of the underlying asset (S) repeatedly.
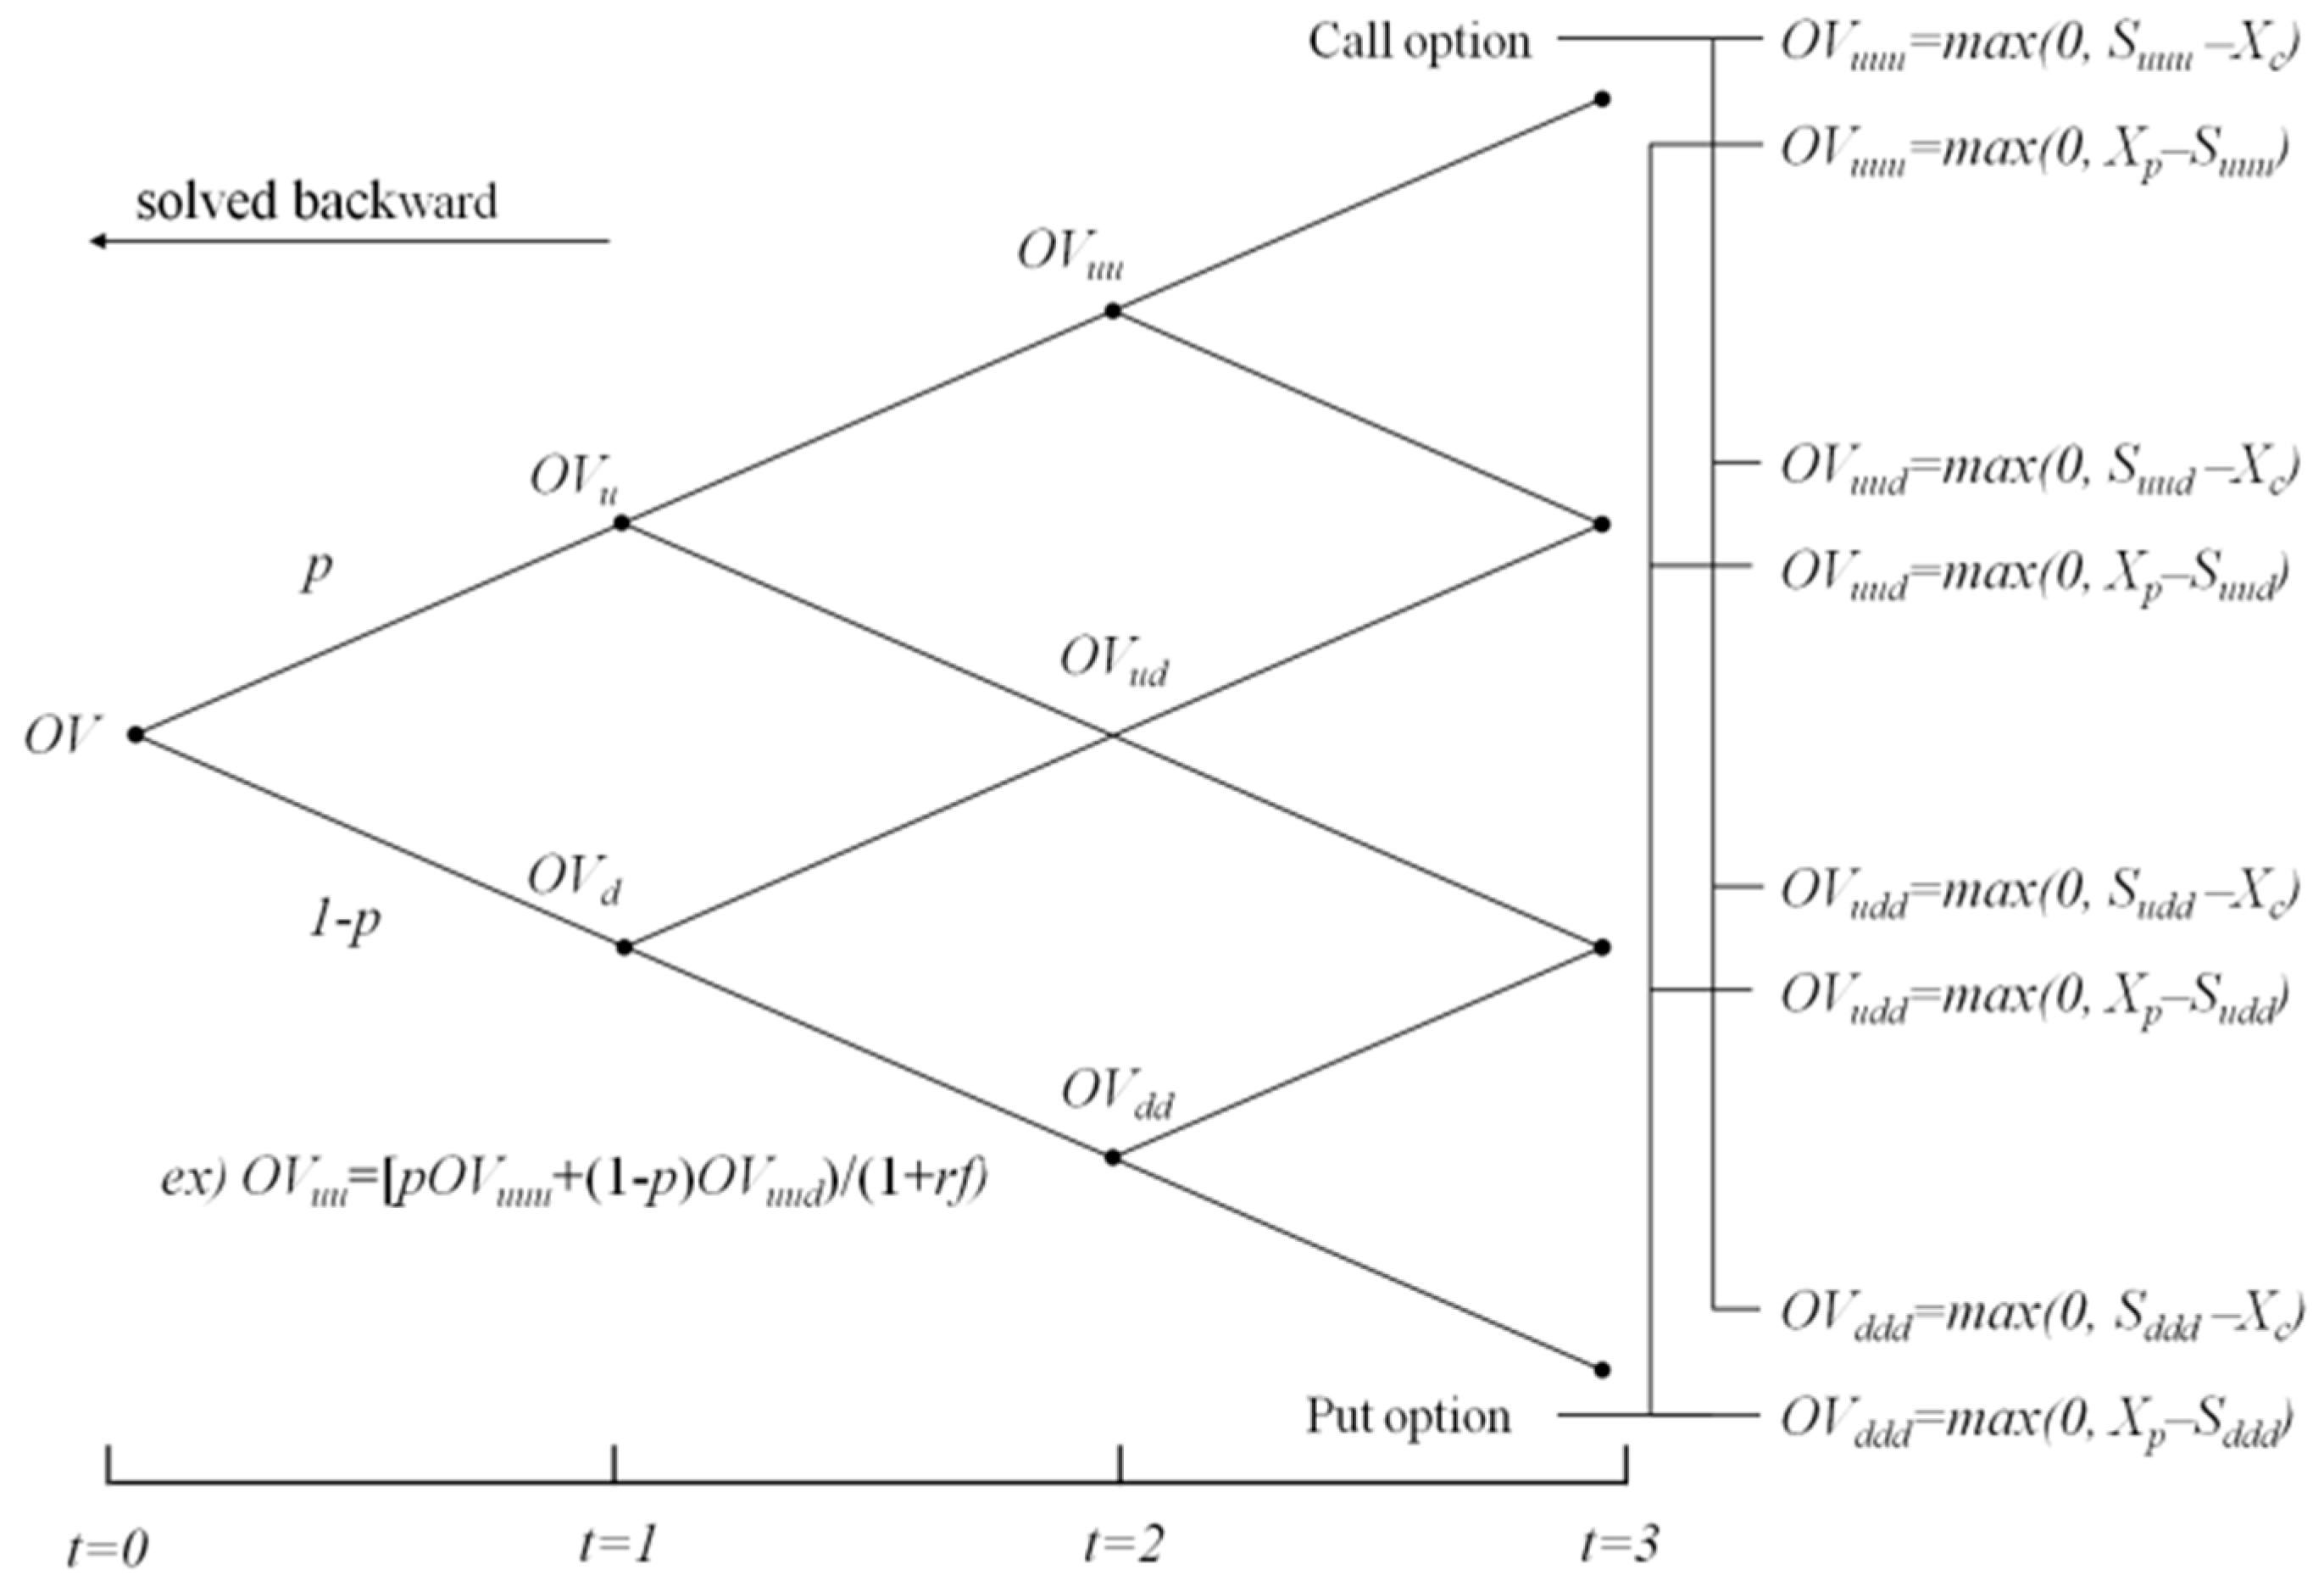
Based on the binomial tree completed using the forward process demonstrated in Figure 8 the option value is calculated after using the backward process shown in Figure 9. The binomial tree in Figure 9 shows the repeated calculations to obtain the present node by using Equation (4) after calculating the value of the call option or put option using the equation for the value at the final stage. Similarly, for the up and knockout option, calculations continue until the present node is obtained by setting the node that exceeds the barrier to zero after calculating the value of call option using the equation for the last moment. In this case, the risk-neutral probability (p) is calculated using Equation (5) below.
= risk-free rate; p = risk-neutral probabilities.
4. Applications
4.1. Data Collection
In this section, the ESCO business model that uses CER is verified. The project case for the verification is an energy retrofit project for the enhanced energy efficiency of an office building constructed 20 years ago and with 83,263.10 m2 of total floor area as shown in Table 5.
This case involves a project based on the guaranteed savings contract between the ESCO and the user and that includes insulation installation and window renovation for enhanced energy efficiency. The total project cost is 462,640 USD. Table 6 shows key project information that is written in the guaranteed savings contract. The target energy savings and the guaranteed energy savings are suggested by the ESCO. The annual value of energy savings is approximately 75,600 USD while the annual guaranteed energy savings is set at 60,480 USD. Additionally, the expected energy savings is verified by an energy assessment report by an external specialized organization. The value is approximately 66,528 USD during the performance guarantee period. The energy user checks the report and signs the guaranteed savings contract with the ESCO.
To set a performance guarantee period, first, the discount rate was calculated as shown in Table 7. The annual real discount rate was calculated using Equation (6), referring to interest rate and inflation rate, and the average was calculated. As a result of the calculation, the discount rate was set at 0.96%.
I = Real discount rate; i= interest rate; j = Inflation rate.
The period of recovery for USD 462,640, the investment cost, and the guaranteed savings is displayed in Table 8. In this study, the guaranteed energy savings was discounted to the present value using the discount rate mentioned above, and the figures were tallied to set the performance guarantee period. As shown in Table 8 the investment cost is recovered in approximately eight years. Therefore, the performance guarantee period was set at eight years for this study.
4.2. Results
For the valuation of the guaranteed savings contract using CER proposed in this paper, Section A and Section C were analyzed first. Table 9 shows the major variables for the analysis. First, the underlying asset is the starting point for calculating diverse estimated values of energy savings by applying volatility caused by uncertainties. For the underlying asset, the value of the asset is estimated for future works as a representative value. Therefore, in this study, the annual value of estimated savings for each year during the performance guarantee period is converted into present value to be used as the variable. The value of underlying assets (S) was set at USD 509,949. Then, the exercise price of the put option (Xp), which is the point at which the value of the guarantee is generated in Section A and where the energy savings becomes lower than the guaranteed savings, was set at USD 463,590. This represents the present value of the annual guaranteed energy savings. The exercise price of the call option (Xc), which is the point at which the value of the right to profit is generated in Section C where the energy savings becomes higher than the target energy savings, was set at USD 579,487, the present value of the annual value of target energy savings.
Volatility was calculated based on the annual use of city gas and electricity for the past 10 years, as shown in Table 10. The price of city gas and electricity differs for each year, but the price is assumed to be the same for this study because the energy price for an ESCO contract is set at the same standard price. Thus, the focus of the volatility estimation was on the change in the amount of energy saving rather than the change in price. The level of volatility calculated in such a process was 11%.
The risk-free rate (rf) was set at 2%, which is the interest rate for government and public bonds with three years of maturity. Based on this assumption, the rise rate, fall rate, and risk-neutral probability were calculated using Equation (2), Equation (3), and Equation (5), respectively, as demonstrated in Table 9.
Using the variables in Table 9 first, different numbers of underlying assets were produced using the forward process, as demonstrated in Table 11 below. The result confirmed that the maximum value of energy savings was approximately USD 1,226,988 and the minimum value was USD 211,832. For the binomial lattice model produced using the forward process, the backward process was applied to first draw the value of the guarantee acquired by the energy user using the put option model. Table 12 shows that the value of the guarantee acquired by the user was estimated at 17,021 USD. Next, the value of right to profit is the difference between the energy savings and the target savings in Section C, which is calculated using call option model. Table 13 shows that the value of the rights to profit was estimated at USD 70,855.
Then, the up and knockout option in Section B1 and B2, for which CER is the underlying asset, was valued. Table 14 shows the variables used for that analysis. The starting point for the analysis is to estimate different amounts of CER profit predicted for the future considering uncertainties. In this study, first, the amount of carbon emissions was calculated from the expected savings for each year during the performance guarantee period and, then, 18 USD/tco2, which is the current CER price at the CER Exchange in Korea, was applied to calculate the CER profit that can be acquired each year. The CER profit calculated was converted into present value to be defined as the underlying asset (S_CER). Then, the value of the underlying asset was calculated as USD 30,608. Additionally, because the CER profit available for the ESCO in Section B is the CER profit from the expected savings, the exercise price (Xe) was set at USD 30,608 in the same way as the definition of the underlying asset (S_CER). Moreover, as the CER profit from the target savings is the barrier (H), the present value of the figure was calculated in the same way, and the value of barrier (H) was defined as USD 34,782.
Volatility was calculated based on annual use of city gas and electricity, the carbon emissions coefficient, and the CER price for each year over the past 10 years, as demonstrated in Table 15. The price of CER was set at USD 18, which is the present price applied at the CER Exchange of Korea. The level of volatility drawn in that process was approximately 10%.
The risk-free interest rate (rf) was set at 2%, which is the interest rate for government and public bonds with three years of maturity, and the time interval was set at one year. Based on these assumptions, the rise rate, fall rate, and the risk-neutral probability were calculated using Equation (2), Equation (3), and Equation (5) above, as shown in Table 14.
Using the variables in Table 14 first, various numbers of cases for the underlying asset were produced using the forward process, as displayed in Table 16 below. As a result, the maximum and minimum CER profits were estimated as USD 68,035 and USD 13,773.
Based on the basic binomial lattice model produced using the forward process, the value of the right to CER profit that the ESCO can acquire in Section B was calculated by applying the backward process. The value of the right to CER profit was calculated based on the target energy savings as the baseline and by applying the up and knockout option valuation model in which a barrier exists. Table 17 shows that the value of the ESCO’s right to profit in Section B was USD 5420.
5. Discussion and Conclusions
In this study, a means to enhance the effect of energy performance projects by applying CER profit to guaranteed savings contract was explored. Thus, this study proposed the use of CER profit as a way to motivate ESCOs to raise the amount of energy savings to the target savings levels.
For the verification of the effect of the ESCO business model using the CER, which is suggested in this paper, option theory was applied. Notably, the up and knockout option was used to consider the option that can be used for securing profit from CER along with the call and put options, which are appropriate for the evaluation of the profit structure of existing guaranteed savings contract. Based on these considerations, the value of the guarantee acquired by the user and the value of the ESCO’s right to profit from energy savings and CER, were calculated to determine the ratio of sharing of the entire rights to profit in section C. When the model suggested in this paper was applied to a case project, the profit sharing ratio was 16.37%. This method of deciding the profit sharing ratio objectively based on a probabilistic model is expected to address problems in existing decision-making models based on past experiments. Additionally, the ESCO is expected to be motivated to save more energy by applying the profit generated from CER during the operating period. Moreover, the model enables a convenient calculation and comparison of the profit structure of various cases according to changes in the value of target energy savings, expected energy savings, and guaranteed energy savings. In other words, the model can augment effective verification of diverse cases of the profit structure of guaranteed savings contract to which CER is applied.
In the case of Korea, the level of building deterioration is high because approximately 74% of buildings were constructed over 20 years ago. The level of energy efficiency in most buildings is low. In terms of energy supply at the national level, the enhancement of buildings’ energy efficiency is an emerging critical issue and related technologies are rapidly evolving. Thus, the ESCO market in Korea has considerable growth potential. ESCO projects mostly depend on government financial support because the private market is not investing in these projects voluntarily. To encourage private entities to actively take part in ESCO projects, it is crucial to improve profitability, enhance transparency, and upgrade business in the sector. From this perspective, the ESCO business model suggested in this paper and to which CER is applied, will contribute to an enhanced effect of energy performance projects by applying the ESCO contracts.
Practical problems also exist in the ESCO business model to which CER is applied. First, most CERs are for energy plants because they can secure a large number of CERs for each energy plant unit project. For buildings, the amount of CERs that can be secured for each unit project is small, which is an obstacle to the further promotion of ESCO business’ application to buildings. However, there is a way for multiple small-sized energy-saving projects to trade CER together as one entity. Another problem is the reliability of diverse variables that are set in the initial contract including the value of guaranteed energy savings, TS, and ES. With a few exceptions, the ESCOs in Korea lack the technical skills needed for comprehensive energy use diagnosis and a professional workforce. Additionally, it is difficult for the ESCOs to have an accurate understanding of and make reasonable decisions on contract terms because energy users do not have professional knowledge of ESCO business.
To resolve these problems and promote the use of the ESCO business model to which CER is applied, verification of the terms and conditions of the initial contract with the ESCO to be managed by a public agency with firm public credibility on behalf of the users of the service may be effective. If such direct intervention by a public agency could pose a risk of market disturbance, an institution, such as an ESCO certification system, could be introduced to encourage greater confidence in ESCOs.
Acknowledgments
This research was supported by Basic Science Research Program through the National Research Foundation of Korea (NRF) funded by the Ministry of Science, ICT & Future Planning (No. 2015R1A5A1037548).
Author Contributions
Hyein Yi developed the concept and drafted the manuscript. Sanghyo Lee revised the manuscript and supervised the overall work. Jaejun Kim reviewed the manuscript. All authors read and approved the manuscript.
Conflicts of Interest
The authors declare no conflict of interest.
References
- Pachauri, R.; Meyer, L. IPCC Fifth Assessment Report; IPCC: Copenhagen, Denmark, 2014. [Google Scholar]
- International Energy Agency (IEA). World Energy Outlook 2008; IEA: Paris, France, 2008. [Google Scholar]
- Pachauri, R.; Reisinger, A. IPCC Fourth Assessment Report; IPCC: Geneva, Switzerland, 2007. [Google Scholar]
- Xu, P.; Chan, E.H.; Qian, Q.K. Success factors of energy performance contracting (EPC) for sustainable building energy efficiency retrofit (BEER) of hotel buildings in China. Energy Policy 2011, 39, 7389–7398. [Google Scholar] [CrossRef]
- Sorrell, S. The economics of energy service contracts. Energy Policy 2007, 35, 507–521. [Google Scholar] [CrossRef]
- Larsen, P.; Goldman, C.; Satchwell, A. Evolution of the U.S. energy service company industry: Market size and project performance from 1990–2008. Energy Policy 2012, 50, 802–820. [Google Scholar] [CrossRef]
- Goldman, C.; Hopper, N.; Osborn, J. Review of US ESCO industry market trends: An empirical analysis of project data. Energy Policy 2005, 33, 387–405. [Google Scholar] [CrossRef]
- Lee, M.; Park, H.; Noh, J.; Painuly, J.P. Promoting energy efficiency financing and ESCOs in developing countries: Experiences from Korean ESCO business. J. Clean. Prod. 2003, 11, 651–657. [Google Scholar] [CrossRef]
- Steinberger, J.; Niel, J.; Bourg, D. Profiting from megawatts: Reducing absolute consumption and emissions through a performance–based energy economy. Energy Policy 2009, 37, 361–370. [Google Scholar] [CrossRef]
- Patari, S.; Sinkkonen, K. Energy Service Companies and Energy Performance Contracting: Is there a need to renew the business model? Insights from a Delphi study. J. Clean. Prod. 2014, 66, 264–271. [Google Scholar] [CrossRef]
- Lee, S.; Tae, S.; Shin, S. Profit Distribution in Guaranteed savings contract: Determination Based on the Collar Option Model. Sustainability 2015, 7, 16273–16289. [Google Scholar] [CrossRef]
- Dowson, M.; Poole, A.; Harrison, D.; Susman, G. Domestic UK retrofit challenge: Barriers, incentives and current performance leading into the Green Deal. Energy Policy 2012, 50, 294–305. [Google Scholar] [CrossRef]
- Booth, A.T.; Choudhary, R. Decision making under uncertainty in the retrofit analysis of the UK housing stock: Implications for the Green Deal. Energy Build. 2013, 64, 292–308. [Google Scholar] [CrossRef]
- Zhang, Y.; Wang, Y. Barriers’ and policies’ analysis of China’s building energy efficiency. Energy Policy 2013, 62, 768–773. [Google Scholar] [CrossRef]
- Intrachooto, S.; Horayangkura, V. Energy efficient innovation: Overcoming financial barriers. Build. Environ. 2007, 42, 599–604. [Google Scholar] [CrossRef]
- Hwang, B.; Zhao, X.; See, Y.L.; Zhong, Y. Addressing Risks in Green Retrofit Projects: The Case of Singapore. Proj. Manag. J. 2015, 46, 76–89. [Google Scholar] [CrossRef]
- Du, P.; Zheng, L.; Xie, B.; Mahalingam, A. Barriers to the adoption of energy–saving technologies in the building sector: A survey study of Jing–jin–tang, China. Energy Policy 2014, 75, 206–216. [Google Scholar] [CrossRef]
- Fang, W.S.; Miller, S.M.; Yeh, C. The effect of ESCOs on energy use. Energy Policy 2012, 51, 558–568. [Google Scholar] [CrossRef]
- Qian, D.; Guo, J. Research on the energy–saving and revenue sharing strategy of ESCOs under the uncertainty of the value of Energy Performance Contracting Projects. Energy Policy 2014, 73, 710–721. [Google Scholar] [CrossRef]
- Kostka, G.; Shin, K. Energy conservation through energy service companies: Empirical analysis from China. Energy Policy 2013, 52, 748–759. [Google Scholar] [CrossRef]
- Vine, E. An International Survey of the Energy Service Company (ESCO) Industry. Energy Policy 2005, 33, 691–704. [Google Scholar] [CrossRef]
- Painuly, J.P.; Park, H.; Lee, M.; Noh, J. Promoting energy efficiency financing and ESCOs in developing countries: Mechanisms and barriers. J. Clean. Prod. 2003, 11, 659–665. [Google Scholar] [CrossRef]
- Suhonen, N.; Okkonen, L. The Energy Services Company (ESCo) as business model for heat entrepreneurship—A case study of North Karelia, Finland. Energy Policy 2013, 61, 783–787. [Google Scholar] [CrossRef]
- Stuart, E.; Larsen, P.H.; Goldman, C.A.; Gilligan, D. A method to estimate the size and remaining market potential of the U.S. ESCO (energy service company) industry. Energy 2014, 77, 362–371. [Google Scholar] [CrossRef]
- Jensen, J.O.; Nielsen, S.B.; Hansen, J.R. Greening Public Buildings: ESCO–Contracting in Danish Municipalities. Energies 2013, 6, 2407–2427. [Google Scholar] [CrossRef]
- Lee, P.; Lam, P.T.I.; Lee, W.L. Risks in Energy Performance Contracting (EPC) projects. Energy Build. 2015, 92, 116–127. [Google Scholar] [CrossRef]
- Lee, P.; Lam, P.T.I.; Yik, F.W.H.; Chan, E.H.W. Probabilistic risk assessment of the energy saving shortfall in energy performance contracting projects—A case study. Energy Build. 2013, 66, 353–363. [Google Scholar] [CrossRef]
- Wang, Q.; Chen, Y. Barriers and opportunities of using the clean development mechanism to advance renewable energy development in China. Renew. Sustain. Energy Rev. 2010, 14, 1989–1998. [Google Scholar] [CrossRef]
- Rahman, S.M.; Kirkman, G.A. Costs of certified emission reductions under the Clean Development Mechanism of the Kyoto Protocol. Energy Econ. 2015, 47, 129–141. [Google Scholar] [CrossRef]
- Ren, H.; Zhou, W.; Gao, W.; Wu, Q. Promotion of energy conservation in developing countries through the combination of ESCO and CDM: A case study of introducing distributed energy resources into Chinese urban areas. Energy Policy 2011, 39, 8125–8136. [Google Scholar] [CrossRef]
- Sunderasan, S. Optimal pricing instruments for emission reduction certificates. Environ. Sci. Policy 2011, 14, 569–577. [Google Scholar] [CrossRef]
- Myers, S. Finance theory and financial strategy. Interfaces 1984, 14, 126–137. [Google Scholar] [CrossRef]
- Mun, J. Real Options Analysis: Tools and Techniques for Valuing Strategic Investments and Decisions; John Wiley & Sons: Hoboken, NJ, USA, 2005. [Google Scholar]
- Copeland, T.; Antikarov, V. Real Options: A Practitioner’s Guide; Texere: New York, NY, USA, 2003. [Google Scholar]
- Martins, J.; Marques, R.C.; Cruz, C.O. Real Options in Infrastructure: Revisiting the Literature. J. Infrastruct. Syst. 2015. [Google Scholar] [CrossRef]
- Cox, J.; Ross, S.; Rubinstein, M. Option pricing: A simplified approach. J. Financ. Econ. 1979, 7, 229–263. [Google Scholar] [CrossRef]
- Ho, P.S.; Liu, L.Y. How to Evaluate and Invest in Emerging A/E/C Technologies under Uncertainty. J. Constr. Eng. Manag. 2003, 129, 16–24. [Google Scholar] [CrossRef]
Figure 1.
Profit Structure of a Guaranteed Savings Contract (Lee et al., 2015 [11]).
Figure 1.
Profit Structure of a Guaranteed Savings Contract (Lee et al., 2015 [11]).

Figure 2.
Guaranteed Savings Contract’s Profit Structure for the User.

Figure 3.
Guaranteed savings contract’s profit structure for the ESCO.

Figure 4.
The ESCO’s Profit Structure in a Guaranteed Savings Contract Using CER, Which is Proposed in This Study.
Figure 4.
The ESCO’s Profit Structure in a Guaranteed Savings Contract Using CER, Which is Proposed in This Study.

Figure 5.
Change in the Value of Guarantee According to a Change in the Energy Savings.

Figure 6.
Change in the Value of ESCO’s Right to Profit According to a Change in the Energy Savings.
Figure 6.
Change in the Value of ESCO’s Right to Profit According to a Change in the Energy Savings.

Figure 7.
Change in the Value of the Option that uses CER in Section B2 from a Change in Energy Savings.
Figure 7.
Change in the Value of the Option that uses CER in Section B2 from a Change in Energy Savings.

Figure 8.
Binomial Tree of S’s Distribution.

Figure 9.
Binomial Tree to Solve the Option Value.

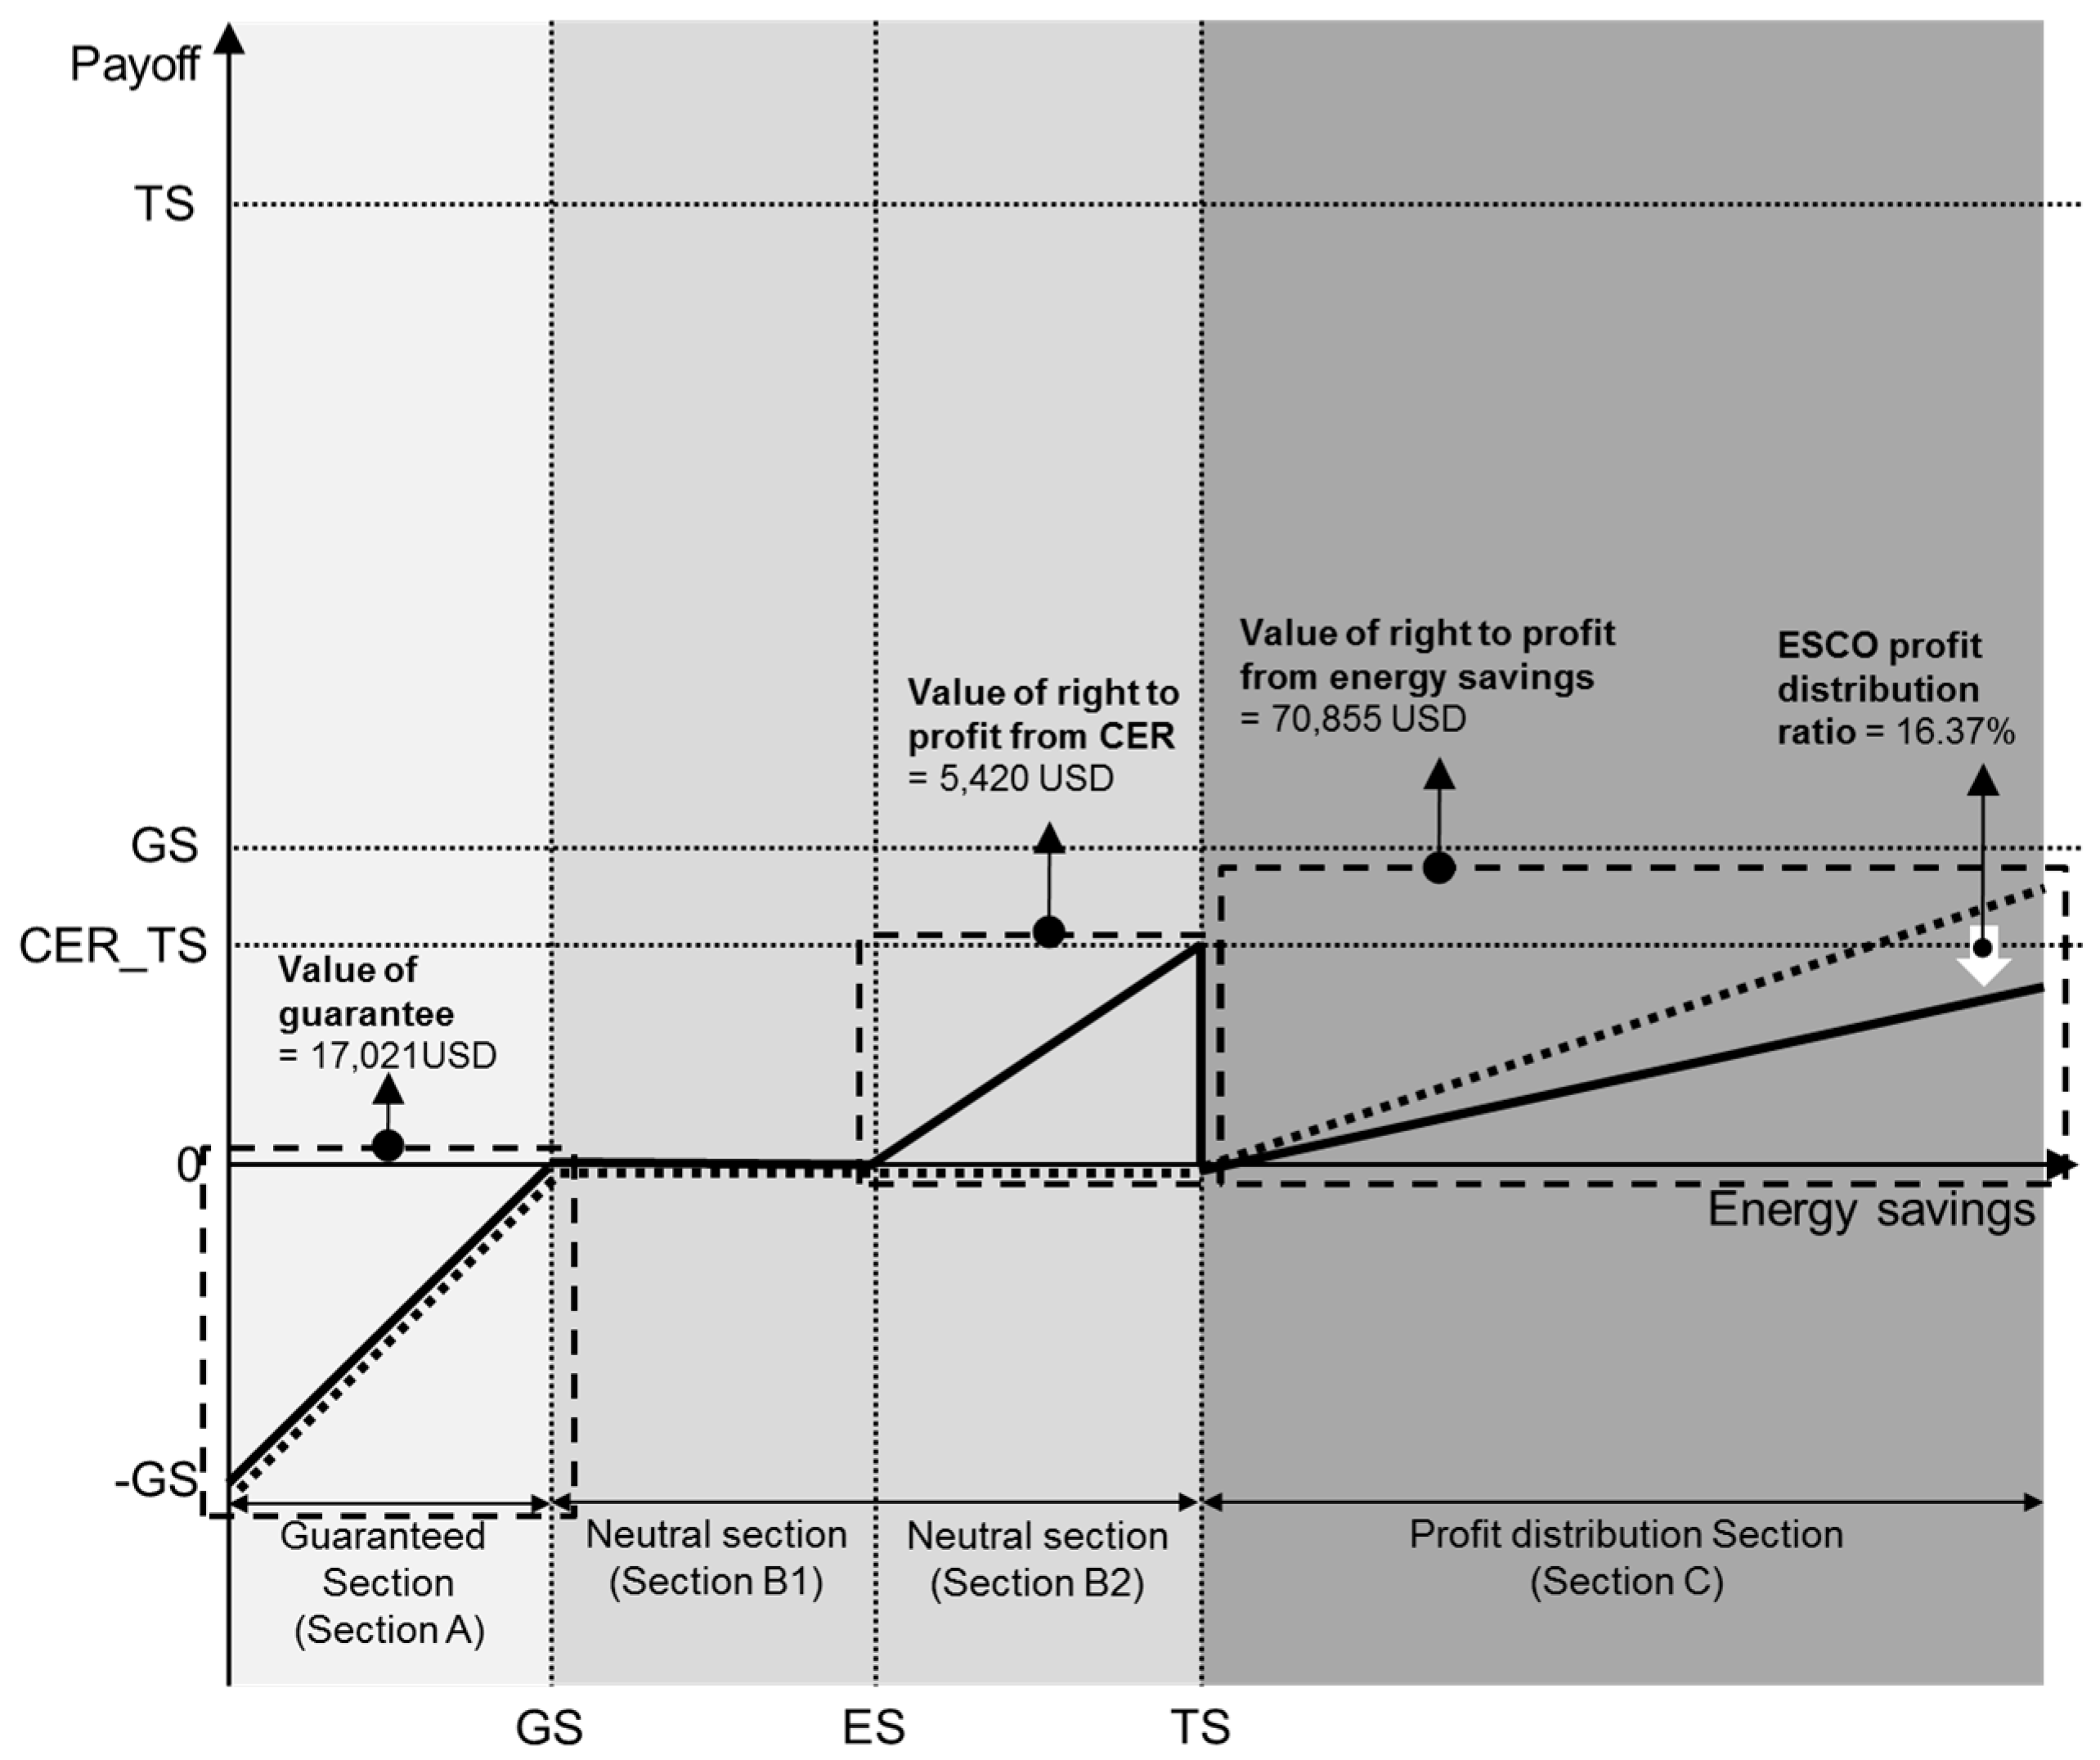
Figure 10.
Summary of Payoff Structure in the Proposed Model for the ESCO.

Table 1.
Energy Service Company (ESCO) Contract Models.
| Shared Savings Contract (SSC) | Guaranteed Savings Contract (GSC) | |
|---|---|---|
| Principle | Performance is related to the percentage of energy cost savings. Cost savings split for a pre-determined time in accordance with a prearranged percentage, based on the cost of the project, the length of the contract, and the risks assumed by the ESCO and the client. | Performance is related to the level of energy saved. The value of energy saved is guaranteed to cover the client’s annual debt obligations. |
| Financing | ESCO financing and/or TPF (through ESCO) | Client financing and/or TPF (through the client) |
| Risk taking | ||
| - Business | Client | Client |
| - Performance | ESCO (and client) | ESCO |
| - Credit | ESCO and/or financial institution | Client and/or financial institution |
| Advantages | Good introductory model in developing ESCO markets. The customer has no financial risks and is only obliged to pay a percentage of the actual savings to the ESCO over a specified period. This obligation is not considered a debt and does not appear on the customer’s balance sheet. | Fosters the growth and viability of newly established ESCOs that have limited resources and a credit history. |
| Disadvantages | ESCOs may become overly indebted, and may have difficulties in obtaining financing at a reasonable price and in contracting additional debt for subsequent projects. | It is challenging to function properly in countries with an undeveloped banking structure, insufficient technical expertise and a poor understanding of EE projects. |
Patari et al., 2014 [10].
Table 2.
Key Definitions for Standard Guaranteed Savings Contract in Korea.
| Term | Definition |
|---|---|
| Energy savings | Energy reductions from the installation of the energy reduction system |
| Target savings | The maximum energy savings that the ESCO calculates through an energy use diagnosis or other methods to guarantee a level of performance |
| Performance guarantee | The act of guaranteeing energy reduction value by installing the energy reduction system. ESCO provides this guarantee to the energy user |
| Guaranteed savings | The amount of guaranteed energy reductions that the ESCO provides to the user, which must be more than 80% of the target reduction value |
| Performance guarantee period | The period required to recover the entire project investment amount through guaranteed energy savings |
| Profit sharing | The sharing of profits resulting from surpassing the target reduction value between the energy user and the ESCO |
Lee et al., 2015 [11].
Table 3.
Comparison of Real Options’ Variables with Those of Financial Options.
| Financial Options | Real Options |
|---|---|
| Stock price | Present value of expected incomes |
| Exercise price | Costs of irreversible follow-on investment |
| Time to maturity | Time until the investment opportunity disappears |
| Volatility of stock return | Variability of project value |
| Risk-free rate of return | Risk-free rate of return |
Copeland et al., 2003 [34].
Table 4.
Valuation Methods.
| Methods | Advantages | Disadvantages |
|---|---|---|
| BSOPM | Simple calculation of option value. | Only applicable to European options; Only works with normal distributions; Require advanced financial knowledge; Required assumptions limit the use of the model(price, volatility, duration); Can only manage one factor of uncertainty. |
| BOPM | Effective when dealing with one factor of uncertainty; Provides project managers with an appropriate evolution of the underlying asset; Estimates the value of several option futures. | Requires advanced financial knowledge; Can only manage Able to deal with only one factor of uncertainty. |
| RADT | Allows the mapping of complex problems; Can manage multiple uncertainties; Enables decision makers to develop insights into ROs; Useful in the case of a possible drastic change in systems. | Does not provide the true value of the project; If the number of branches is high, the method becomes complicated and unclear. |
| MCS | Demonstrates graphically the analysis results; Can manage multiple uncertainties; a full understanding of financial theory is not required; Helpful for problems with path-dependency; User-friendly multiple document interface. | Lacks transparency; Difficult methodology to implement with US options. |
| HROs | Can manage multiple uncertainties; Combines the best of decision analysis and options analysis; Independent handling of technical and financial components. | Difficult methodology to implement (it requires highly sophisticated mathematical modeling skills). |
Martins et al., 2015 [35].
Table 5.
Project Overview.
| Category | Details | |
|---|---|---|
| Year Built | 1994 (21 years since completion) | |
| Site area | 83,263.10 m2 | |
| Principal use | Office | |
| Building size | 1 basement floor, 7 floors | |
| Building area | 15,010.83 m2 | |
| Total floor area | 25,840.80 m2 | |
| Equipment | Absorption chiller-heater, steam boiler | |
| Total project cost | Insulation | 242,203 USD |
| Window | 220,437 USD | |
| Total | 462,640 USD | |
Table 6.
Guaranteed Savings Contract: Key Information.
| Category | Estimated Value |
|---|---|
| Target savings | 75,600 USD/year |
| Guaranteed savings | 60,480 USD/year |
| Expected savings | 66,528 USD/year |
| Performance guarantee period | 8 years |
Table 7.
Discount Rate Calculation.
| Year | Interest Rate | Inflation Rate | Real Discount Rate | Average Discount Rate |
|---|---|---|---|---|
| 2004 | 3.75 | 3.6 | 0.14 | 0.96 |
| 2005 | 3.57 | 2.8 | 0.74 | |
| 2006 | 4.36 | 2.2 | 2.11 | |
| 2007 | 5.01 | 2.5 | 2.45 | |
| 2008 | 5.67 | 4.7 | 0.93 | |
| 2009 | 3.23 | 2.8 | 0.42 | |
| 2010 | 3.18 | 3.0 | 0.17 | |
| 2011 | 3.69 | 3.6 | 0.09 | |
| 2012 | 3.43 | 2.2 | 1.20 | |
| 2013 | 2.70 | 1.3 | 1.38 |
Table 8.
Calculation of the Performance Guarantee Period.
| Time | Investment Cost | Guaranteed Savings (Constant) | Guaranteed Savings (Discounted) | Guaranteed Savings (Discounted) Accumulated Sum |
|---|---|---|---|---|
| 0 | 462,640 | |||
| 1 | 60,480 | 59,905 | 59,905 | |
| 2 | 60,480 | 59,335 | 119,240 | |
| 3 | 60,480 | 58,771 | 178,011 | |
| 4 | 60,480 | 58,212 | 236,224 | |
| 5 | 60,480 | 57,659 | 293,882 | |
| 6 | 60,480 | 57,110 | 350,993 | |
| 7 | 60,480 | 56,567 | 407,560 | |
| 8 | 60,480 | 56,030 | 463,590 |
Table 9.
Guaranteed Savings Contract—Key Information.
| Variables | Estimated Value |
|---|---|
| Underlying asset (S) | 509,949 USD |
| Put option exercise price (Xp) | 463,590 USD |
| Call option exercise price (Xc) | 579,487 USD |
| Volatility (σ) | 11.0% |
| Risk-free rate (rf) | 2.00% |
| Time interval | 1 year |
| Rise rates (u) | 1.116 |
| Fall rates (d) | 0.896 |
| Risk-neutral probability (p) | 0.565 |
Table 10.
Volatility Estimation.
| Year | Gas | Electricity | Energy Cost (USD) | Change Rate | Volatility | ||
|---|---|---|---|---|---|---|---|
| Used Amount (Nm3) | Unit Price (USD/Nm3) | Used Amount (KWh) | Unit Price (USD/KWh) | ||||
| 2004 | 50,329 | 0.925 | 2,209,385 | 0.127 | 327,146 | 11.00 | |
| 2005 | 65,193 | 0.925 | 2,320,475 | 0.127 | 355,004 | 8.17 | |
| 2006 | 39,539 | 0.925 | 2,070,182 | 0.127 | 299,487 | −17.01 | |
| 2007 | 42,110 | 0.925 | 2,298,293 | 0.127 | 330,835 | 9.95 | |
| 2008 | 36,353 | 0.925 | 2,170,038 | 0.127 | 309,221 | −6.76 | |
| 2009 | 57,233 | 0.925 | 2,322,784 | 0.127 | 347,934 | 11.80 | |
| 2010 | 43,730 | 0.925 | 2,160,549 | 0.127 | 314,840 | −10.00 | |
| 2011 | 69,876 | 0.925 | 2,273,042 | 0.127 | 353,312 | 11.53 | |
| 2012 | 58,861 | 0.925 | 2,229,301 | 0.127 | 337,568 | −4.56 | |
| 2013 | 42,191 | 0.925 | 2,124,292 | 0.127 | 308,812 | −8.90 | |
Table 11.
Results of S’s Distribution Using the Forward Process.
| 0 | 1 | 2 | 3 | 4 | 5 | 6 | 7 | 8 |
|---|---|---|---|---|---|---|---|---|
| 509,949 | 569,103 | 635,119 | 708,793 | 791,013 | 882,770 | 985,172 | 1,099,452 | 1,226,988 |
| 456,914 | 509,916 | 569,067 | 635,078 | 708,747 | 790,962 | 882,714 | 985,109 | |
| 409,395 | 456,885 | 509,884 | 569,030 | 635,038 | 708,702 | 790,912 | ||
| 366,818 | 409,369 | 456,856 | 509,851 | 568,994 | 634,997 | |||
| 328,669 | 366,795 | 409,343 | 456,827 | 509,818 | ||||
| 294,487 | 328,648 | 366,771 | 409,317 | |||||
| 263,851 | 294,469 | 328,627 | ||||||
| 236,419 | 263,844 | |||||||
| 211,832 |
Table 12.
Valuation of Guarantees for the Energy User Using the Backward Process (put option).
| 0 | 1 | 2 | 3 | 4 | 5 | 6 | 7 | 8 | ||||||||
|---|---|---|---|---|---|---|---|---|---|---|---|---|---|---|---|---|
| 17,021 | 8711 | 3406 | 778 | 0 | 0 | 0 | 0 | 0 | ||||||||
| 28,534 | 15,963 | 6957 | 1818 | 0 | 0 | 0 | 0 | |||||||||
| 46,080 | 28,328 | 13,913 | 4249 | 0 | 0 | 0 | ||||||||||
| 71,121 | 48,246 | 27,034 | 9933 | 0 | 0 | |||||||||||
| 103,927 | 77,857 | 50,361 | 23,219 | 0 | ||||||||||||
| 142,364 | 116,940 | 87,729 | 54,273 | |||||||||||||
| 181,727 | 160,031 | 134,963 | ||||||||||||||
| 218,081 | 199,746 | |||||||||||||||
| 251,758 | ||||||||||||||||
Table 13.
Valuation of the Right to Profit Using the Backward Process (call option).
| 0 | 1 | 2 | 3 | 4 | 5 | 6 | 7 | 8 |
|---|---|---|---|---|---|---|---|---|
| 70,855 | 100,819 | 140,863 | 192,820 | 257,990 | 336,707 | 428,187 | 531,327 | 647,501 |
| 35,399 | 53,718 | 80,207 | 117,479 | 168,139 | 233,977 | 314,589 | 405,622 | |
| 13,361 | 21,964 | 35,741 | 57,428 | 90,804 | 140,578 | 211,425 | ||
| 2860 | 5176 | 9366 | 16,950 | 30,674 | 55,510 | |||
| 0 | 0 | 0 | 0 | 0 | ||||
| 0 | 0 | 0 | 0 | |||||
| 0 | 0 | 0 | ||||||
| 0 | 0 | |||||||
| 0 |
Table 14.
Variables Used for the Valuation of the Up and Knock-out Option in Section B1.
| Variables | Estimated Value |
|---|---|
| Underlying asset(S_CER) | 30,608 USD |
| Exercise price (Xe) | 30,608 USD |
| Barrier(H) | 34,782 USD |
| Volatility(σ) | 10.0% |
| Risk-free rate (rf) | 2.00% |
| Time interval | 1 year |
| Rise Rates (u) | 1.105 |
| Fall Rates (d) | 0.905 |
| Risk-neutral probability (p) | 0.576 |
Table 15.
Estimation of Volatility in CER Profit.
| Year | Gas | Electricity | CER Price (USD/ tonco2) | Value | Change Rate | Volatility | ||
|---|---|---|---|---|---|---|---|---|
| Used Amount (Nm3) | Conversion Coefficient (kg/kwh) | Used Amount (KWh) | Unit Price (USD/KWh) | |||||
| 2004 | 50,329 | 2.23 | 2,209,385 | 0.44 | 18 | 19,519 | 10.00 | |
| 2005 | 65,193 | 2.23 | 2,320,475 | 0.44 | 18 | 20,995 | 7.29 | |
| 2006 | 39,539 | 2.23 | 2,070,182 | 0.44 | 18 | 17,983 | −15.49 | |
| 2007 | 42,110 | 2.23 | 2,298,293 | 0.44 | 18 | 19,893 | 10.09 | |
| 2008 | 36,353 | 2.23 | 2,170,038 | 0.44 | 18 | 18,646 | −6.47 | |
| 2009 | 57,233 | 2.23 | 2,322,784 | 0.44 | 18 | 20,694 | 10.42 | |
| 2010 | 43,730 | 2.23 | 2,160,549 | 0.44 | 18 | 18,867 | −9.24 | |
| 2011 | 69,876 | 2.23 | 2,273,042 | 0.44 | 18 | 20,807 | 9.79 | |
| 2012 | 58,861 | 2.23 | 2,229,301 | 0.44 | 18 | 20,019 | −3.86 | |
| 2013 | 42,191 | 2.23 | 2,124,292 | 0.44 | 18 | 18,518 | −7.79 | |
Table 16.
Results of S_CER’s Distribution Using the Forward Process.
| 0 | 1 | 2 | 3 | 4 | 5 | 6 | 7 | 8 |
|---|---|---|---|---|---|---|---|---|
| 30,608 | 33,822 | 37,373 | 41,297 | 45,634 | 50,425 | 55,720 | 61,570 | 68,035 |
| 27,700 | 30,609 | 33,823 | 37,374 | 41,298 | 45,635 | 50,426 | 55,721 | |
| 25,069 | 27,701 | 30,610 | 33,824 | 37,375 | 41,299 | 45,636 | ||
| 22,687 | 25,069 | 27,702 | 30,610 | 33,824 | 37,376 | |||
| 20,532 | 22,688 | 25,070 | 27,702 | 30,611 | ||||
| 18,581 | 20,532 | 22,688 | 25,071 | |||||
| 16,816 | 18,582 | 20,533 | ||||||
| 15,219 | 16,817 | |||||||
| 13,773 |
Table 17.
Valuation of Right to CER Profit (Up and Knockout Option) in Section B2 Using the Backward Process.
Table 17.
Valuation of Right to CER Profit (Up and Knockout Option) in Section B2 Using the Backward Process.
| 0 | 1 | 2 | 3 | 4 | 5 | 6 | 7 | 8 |
|---|---|---|---|---|---|---|---|---|
| 5420 | 7201 | 9281 | 11,514 | 13,577 | 14,878 | 14,406 | 10,464 | |
| 3266 | 4725 | 6697 | 9264 | 12,456 | 16,215 | 20,418 | 25,113 | |
| 1446 | 2280 | 3539 | 5381 | 7956 | 11,292 | 15,028 | ||
| 386 | 684 | 1214 | 2152 | 3817 | 6768 | |||
| 0 | 1 | 1 | 2 | 3 | ||||
| 0 | 0 | 0 | 0 | |||||
| 0 | 0 | 0 | ||||||
| 0 | 0 | |||||||
| 0 |
Table 18.
ESCO Profit Sharing Ratio.
| Category | Estimated Value |
|---|---|
| Value of guarantee | 17,021USD |
| Value of right to profit from energy savings | 70,855 USD |
| Value of right to profit from CER | 5420 USD |
| ESCO profit sharing ratio | 16.37% |
© 2017 by the authors. Licensee MDPI, Basel, Switzerland. This article is an open access article distributed under the terms and conditions of the Creative Commons Attribution (CC BY) license (http://creativecommons.org/licenses/by/4.0/).
Share and Cite
MDPI and ACS Style
Yi, H.; Lee, S.; Kim, J. An ESCO Business Model Using CER for Buildings’ Energy Retrofit. Sustainability 2017, 9, 591. https://doi.org/10.3390/su9040591
AMA Style
Yi H, Lee S, Kim J. An ESCO Business Model Using CER for Buildings’ Energy Retrofit. Sustainability. 2017; 9(4):591. https://doi.org/10.3390/su9040591
Chicago/Turabian StyleYi, Hyein, Sanghyo Lee, and Jaejun Kim. 2017. "An ESCO Business Model Using CER for Buildings’ Energy Retrofit" Sustainability 9, no. 4: 591. https://doi.org/10.3390/su9040591
Note that from the first issue of 2016, this journal uses article numbers instead of page numbers. See further details here.