Article

Assessment of Alternative Scenarios for CO2 Reduction Potential in the Residential Building Sector

Korea Institute of Civil Engineering and Building Technology, 283 Goyangdae-Ro, Ilsanseo-Gu, Goyang-Si, Gyeonggi-Do 10223, Korea
Sustainability 2017, 9(3), 394; https://doi.org/10.3390/su9030394
Submission received: 19 December 2016 / Revised: 13 February 2017 / Accepted: 28 February 2017 / Published: 10 March 2017
(This article belongs to the Special Issue Sustainability Assessments of Buildings)

Abstract

:
The South Korean government announced its goals of reducing the country’s CO2 emissions by up to 30% below the business as usual (BAU) projections by 2020 in 2009 and 37% below BAU projections by 2030 in 2015. This paper explores the potential energy savings and reduction in CO2 emissions offered by residential building energy efficiency policies and plans in South Korea. The current and future energy consumption and CO2 emissions in the residential building were estimated using an energy–environment model from 2010 to 2030. The business as usual scenario is based on the energy consumption characteristic of residential buildings using the trends related to socio-economic prospects and the number of dwellings. The alternative scenarios took into account energy efficiency for new residential buildings (scenario I), refurbishment of existing residential buildings (scenario II), use of highly efficient boilers (scenario III), and use of a solar thermal energy system (scenario IV). The results show that energy consumption in the residential building sector will increase by 33% between 2007 and 2030 in the BAU scenario. Maximum reduction in CO2 emissions in the residential building sector of South Korea was observed by 2030 in scenario I. In each alternative scenario analysis, CO2 emissions were 12.9% lower than in the business as usual scenario by the year 2030.

1. Introduction

Since the 1992 Earth Summit in Rio de Janeiro, parties to the United Nations Framework Convention on Climate Change (UNFCCC) have developed strategies, policies, and measures to mitigate climate change and to reduce their respective greenhouse gas emissions, both within and outside the Kyoto Protocol agreement. It was noted that the greenhouse gas effect has caused the average temperature of the Earth to increase by 0.74 °C over the past century. Climatologists and environmental scientists say that if the earth’s average temperature increases by over 2–3 °C due to global warming, immense changes could occur and the human civilization may have to face severe damage. For this reason, international societies continually emphasize discussions and agreements on the importance of combating global warming, but no concrete outcome has yet been realized [1]. However, the global CO2 emissions are continually increasing because of various human activities. The increase in CO2 emissions has been attributed largely to the enormous consumption of fossil fuels for electricity production, transportation, industry and building operation, as well as the destruction of forested regions.
The building sector, including housing, constitutes 30%–40% of the society’s total energy demand and must be prioritized in order to reach a sustainable society within a reasonable period [2]. According to the report of International Energy Agency (IEA), CO2 emissions in the building sector, including indirect emissions from the use of electricity, account for almost 30% of global CO2 emissions [3]. Accordingly, global warming and increased CO2 emissions have elicited the greatest amount of interest from the building sector.
The world is striving to reduce global carbon intensity by increasing the energy efficiency of buildings and by strengthening building energy efficiency policies. Recently, potential CO2 emission reductions in the building sector have been widely investigated. The IEA analyzed the energy savings and the potential impact of global warming on buildings by developing energy efficiency technologies in the building sector [3]. Radhi asserted that the energy design measures and building envelope codes, such as thermal insulation, thermal mass and double glazing in building envelopes, are important in coping with global warming [4,5]. Gaterell and McEvoy suggested that climate change could have a considerable impact on the performance of energy efficiency measures and energy policies applied to existing dwellings in a case study [6]. Jun Li investigated the potentials of energy savings and CO2 reductions offered by the implementation of building energy efficiency policy scenarios in China [7]. Yu et al. assessed the long-term impacts of building codes on building energy consumption and CO2 emissions using the Global Change Assessment Model. This study found that building energy codes would reduce energy consumption in Chinese buildings by 13%–22% depending on building code scenarios [8].
According to a report by the Third National Communication of the Republic of Korea [9], primary energy consumption in South Korea reached about 243.3 Mtoe (million tons of oil equivalent) in 2009. South Korea imported 96.4% of its total energy consumed in 2009. With regard to final energy consumption by sector, the building sector accounted for about 19.6% of overall consumption. Total CO2 emissions reached 607.6 Mton CO2 (million tons of CO2 equivalent) in 2009, representing a 105% increase since 1990. This ranked South Korea ninth in the world in terms of CO2 production. The annual increase rate of CO2 emissions was 3.9% from 1990 to 2010, which was the top among the Organization for Economic Cooperation and Development (OECD) member nations.
The South Korean government announced at the Copenhagen climate change conference in 2009 its goal to reduce the country’s CO2 emissions by up to 30% below the business as usual (BAU) projections by 2020. Various policies and measures for reducing greenhouse gases are being rapidly established and implemented in South Korea. For the residential building sector, a 27% CO2 emission reduction target below BAU has been established [10,11]. The Paris Agreement was adopted as a post-2020 climate regime at the 21st Conference of Parties (COP21) in the United Nations Framework Convention on Climate Change in Paris, France (2015). South Korea has declared the establishment of a plan to reduce CO2 emissions by 37% by 2030. Accordingly, the South Korean government has been demanded to provide a measure of how to achieve this greenhouse gas reduction goal and corresponding strategy in building sector.
In South Korea, an action plan was established for green building activation toward low-energy and low-carbon green construction and zero-energy buildings in order to meet the country’s CO2 reduction goals by 2020. South Korea has concentrated its support on achieving energy efficiency in new and existing buildings, and has been continuously strengthening its energy policies for buildings. These efforts can help reduce CO2 emissions and the fossil fuel consumed for energy in the South Korean building sector.
Therefore, the assessment of alternative scenarios for CO2 reduction potential is a very important topic for fundamental study in South Korea in order to achieve the goal of CO2 mitigation in the post-2020 climate regime and pursue sustainable development. In this paper, we estimate and predict energy consumption and associated CO2 emissions in South Korea’s residential building sector. Based on scenario analysis, we also assess the potential for CO2 emission mitigation offered by the implementation of residential building energy efficiency policies in South Korea.

2. Methodology

2.1. ´Long-Range Energy Alternative Planning (LEAP) Model

This study used an accounting- and scenario-based modelling platform called ‘long-range energy alternative planning’ (LEAP) system to assess the impacts of alternative scenarios for energy consumption and CO2 emissions in the residential building sector.
LEAP is an energy–environment modelling tool for energy policy analysis, alternative energy technology analysis and climate change mitigation assessment, which was developed at the Stockholm Environment Institute (SEI). The central concept of LEAP is an end-use driven scenario analysis. LEAP contains a full energy system accounting framework, which considers both demand- and supply-side technologies and which accounts for the total system impacts. The LEAP software tool is used to analyze current energy patterns and simulate alternative energy futures, along with environmental emissions, under a range of user-defined assumptions. LEAP emphasizes the detailed evaluation of energy use and CO2 emissions within the context of integrated energy and environmental planning for each ‘what if’ scenario or combination of scenarios [12].
Several studies on energy consumption and CO2 emissions have been conducted in various energy sectors using the LEAP model. Bose et al. used LEAP to estimate the energy consumption pattern and environmental emission levels in the transport sector of Delhi city [13]. In California, LEAP was used for energy forecasting and for identifying energy scenarios [14]. The energy and CO2 emissions in the passenger transport sector of Rawalpindi and Islamabad were analyzed using the LEAP model [15]. Tao et al. published a study quantitatively describing China’s low-carbon economic development level in 2050 based on the LEAP model with three kinds of scenarios [16]. The Taiwan LEAP model was used to compare future energy demand and supply patterns, as well as CO2 emissions, for several alternative scenarios of energy policy and energy sector evolution [17]. In South Korea, the LEAP model was used to analyze future energy consumption in the electricity generation sector and to assess the environmental and economic impacts of renewable energy planning using alternative scenario investigations [18,19,20]. There have not been any studies assessing CO2 emissions and reduction potential in the building sector using the LEAP model. The LEAP model can analyze the reduction potential of energy consumption and CO2 emissions in each demand sector, including industry, transport, buildings and others.
In this study, the LEAP model as a building energy–environment model was used to analyze and forecast energy consumption and its related CO2 emissions under alternative strategies (scenarios) for the residential building sector in South Korea.

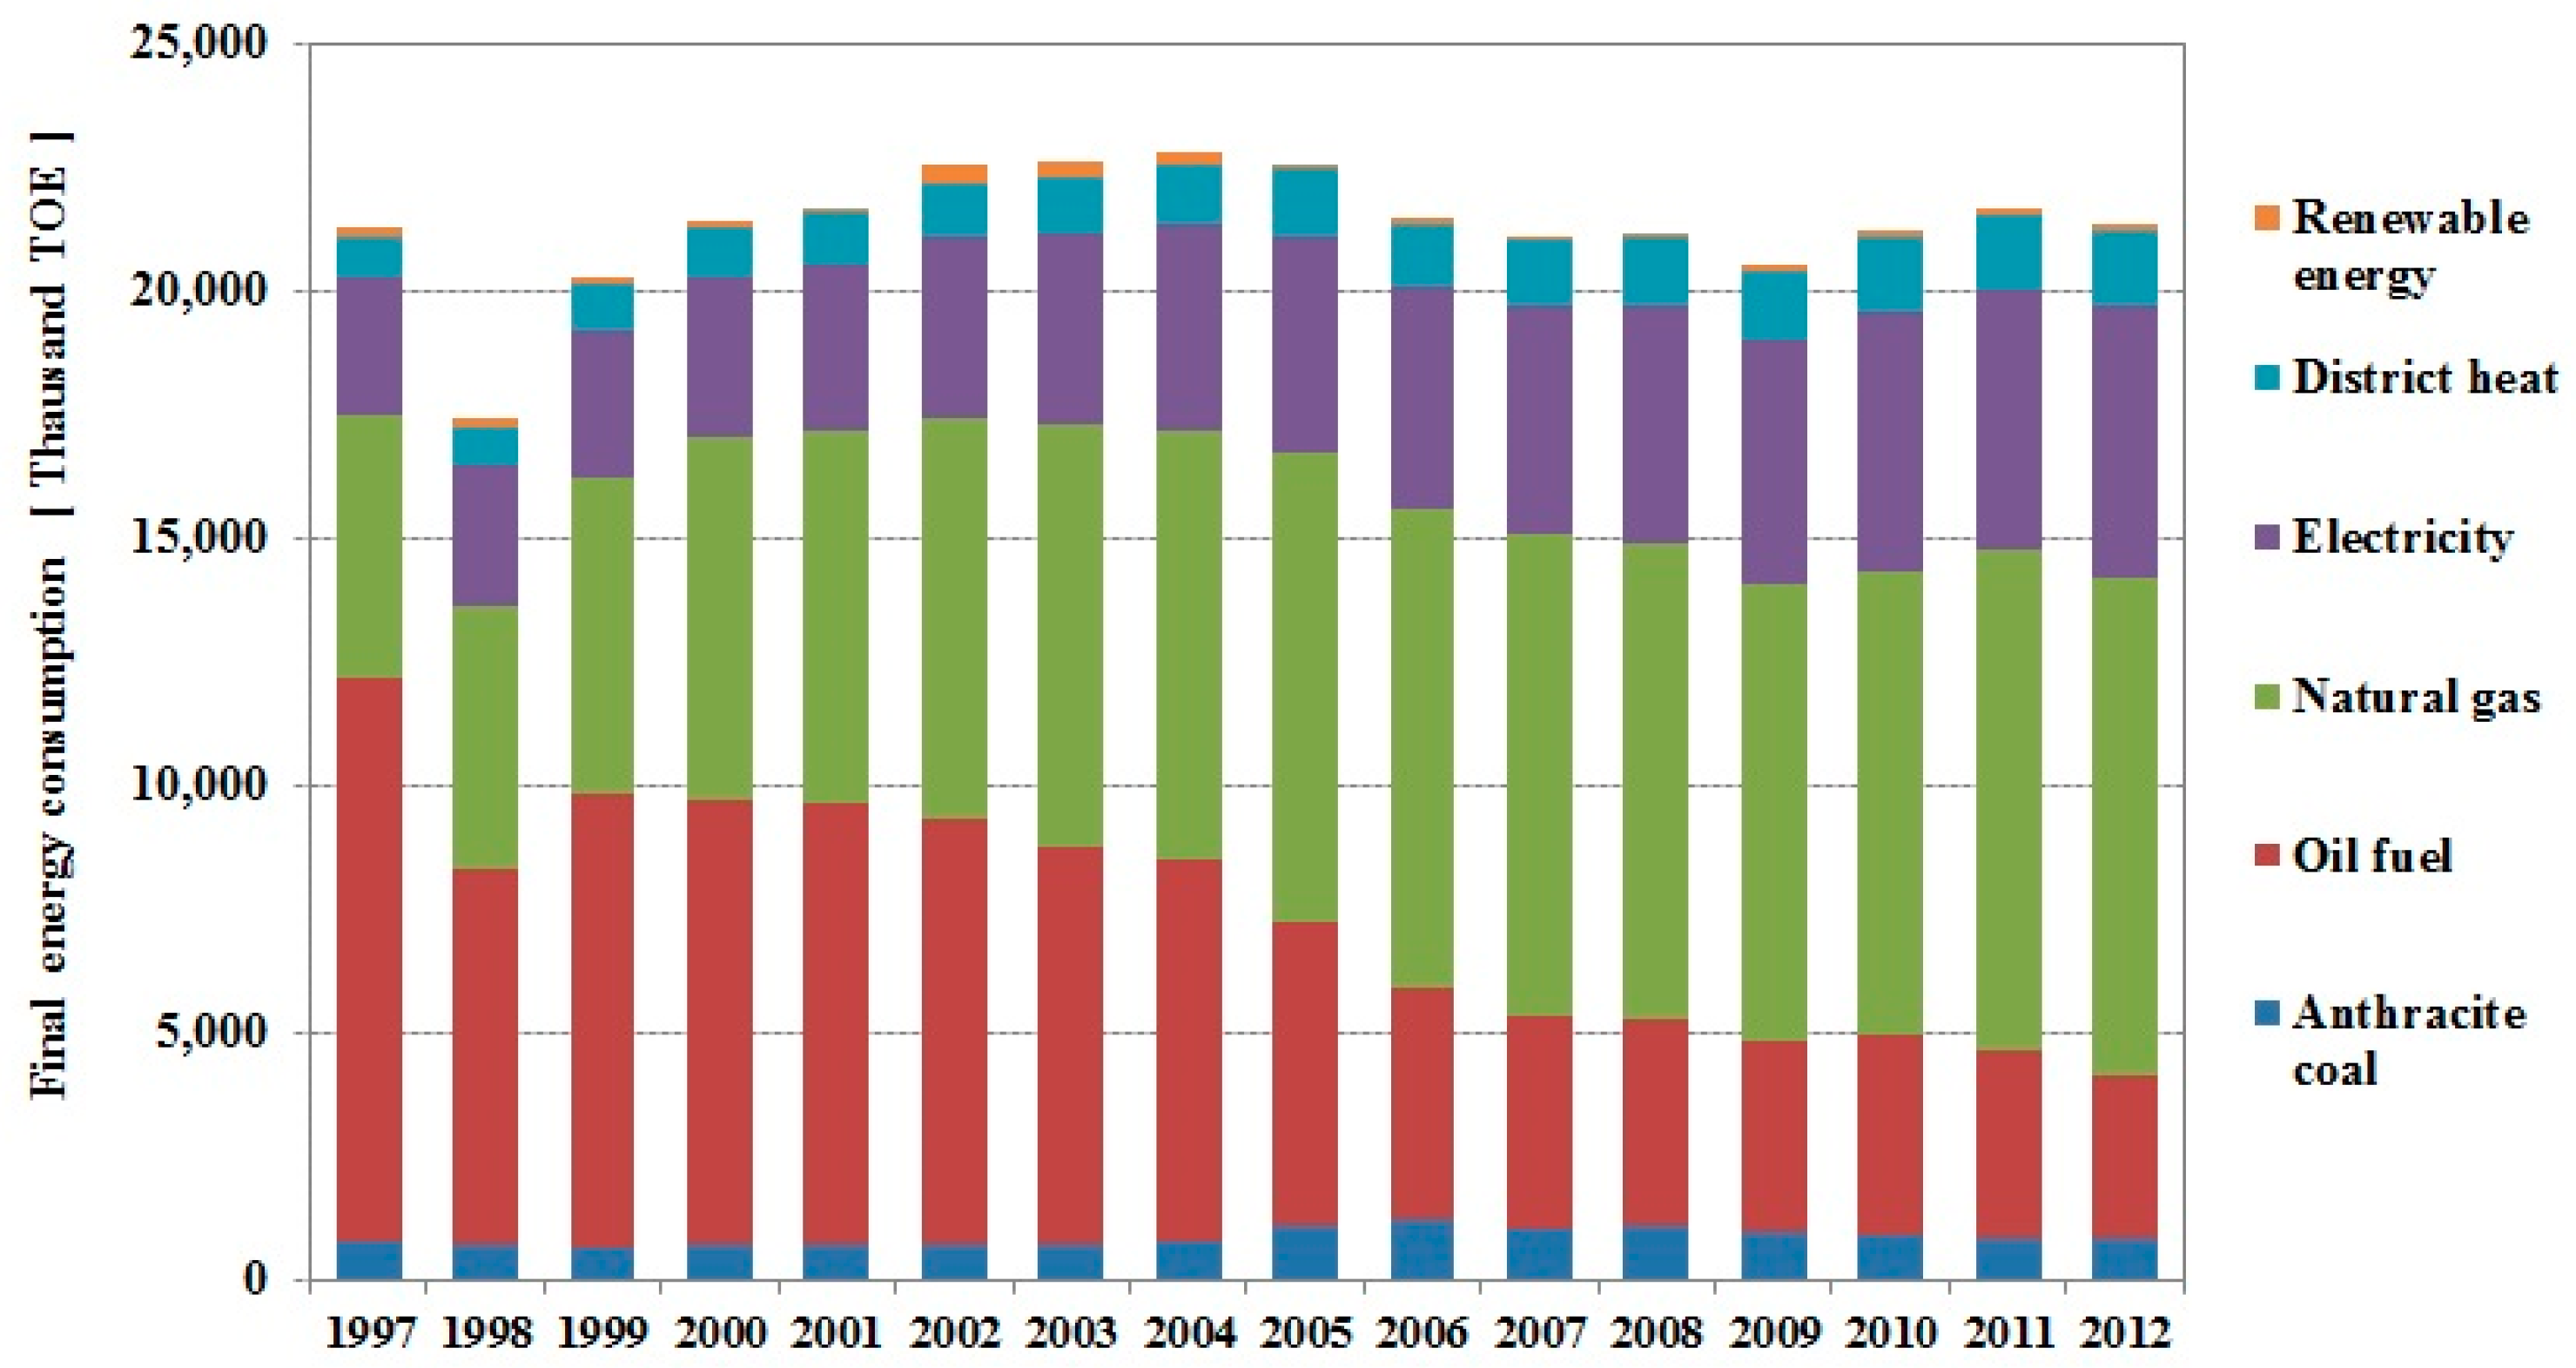
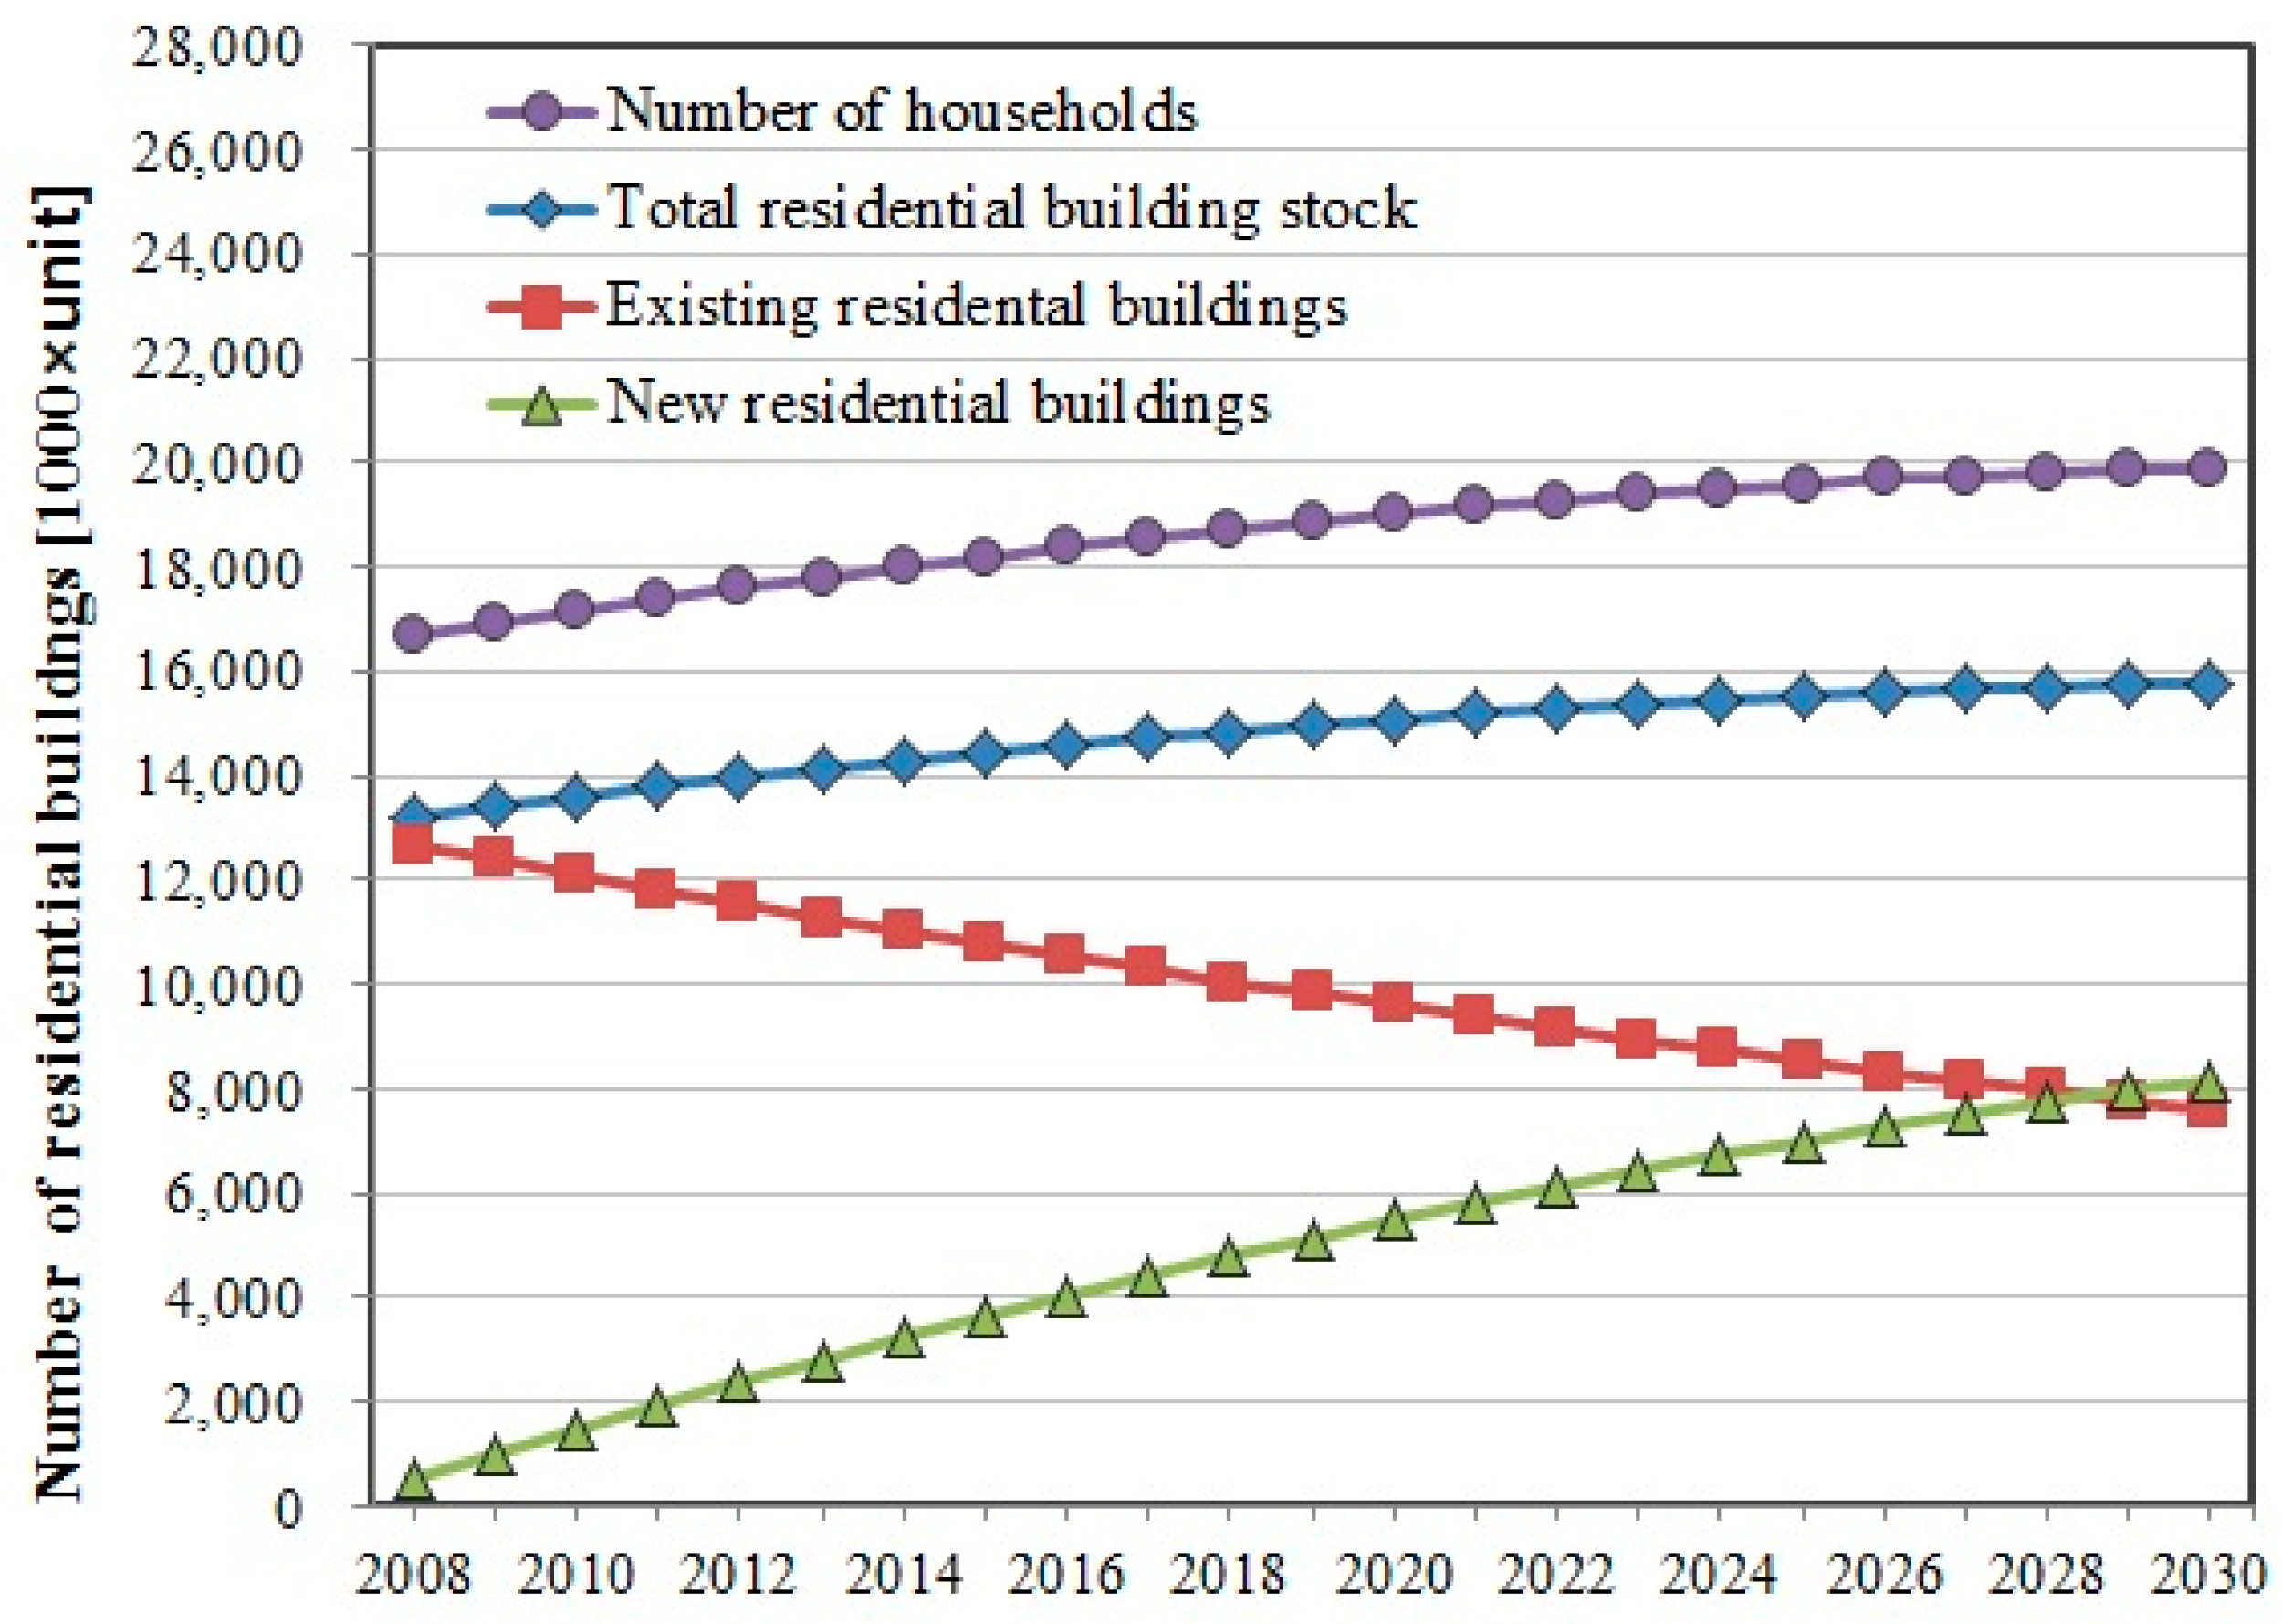
2.2. Background of South Korea’s Residential Building Sector

To develop the building energy–environment model and scenarios, we first studied building types, building stock and the historical trends of energy consumption in the residential building sector. South Korea is made up seven metropolitan cities, including Seoul, and nine local governments within a total land area of 99,392km2. It is located in a temperate climate zone with a moderate altitude. It is cold and dry in the winter and hot and humid in the summer due to the influence of the north Pacific anticyclone under conditions of high temperature and humidity.
There were major changes in residential building types between 1990 and 2010. In 1990, apartment buildings accounted for 22.7% of total residential buildings; detached houses constituted 66.0%; low-rise townhouses 8.4%; and other types made up the final 2.8%. However, in 2010 multi-family housing accounted for 71.0% of South Korea’s residential buildings. Apartment buildings with five stories or more accounted for 58.4% of residential buildings, whereas detached houses made up 27.9% [9]. As of 2010, there were about 13.6 million houses and 17.2 million households. It is evident that currently the most common building type is multi-family housing such as apartment buildings and townhouses. According to the construction statistics in Korea, the number of houses built per year for the past five years ranged from about 460,000 to 600,000 [21].
Figure 1 illustrates the final energy consumption in residential building sector. As for the final energy consumption by sector, the energy consumption of the residential building sector was 21.2 Mtoe in 2010, accounting for 10.8% of total national energy consumption and 56.9% of the energy consumed in the building sector, which is a very high proportion [22]. Residential buildings consumed 21.3 Mtoe of final energy in 2012 because use of natural gas continued to increase for space heating, water heating and cooking. In 2012, natural gas accounted for roughly 48% of total residential building final energy consumption (Figure 1). The penetration of electricity is still 25% of total energy used by residential buildings. Electricity is widely used for lighting and for powering household appliances. Oil fuel has been used for space heating in the form of kerosene and for cooking in the form of liquefied petroleum gas (LPG). Oil has decreased to an annual average growth rate of about –7.2%. Because of the penetration of district heat system in urban areas, district heat energy consumption represented 7.3% of the total energy used by the residential building sector. The use of oil is not common but is still used in the Korean buildings, mostly for space heating, water heating and cooking. Space heating, water heating and space cooling roughly accounted for 70% of residential energy consumption.

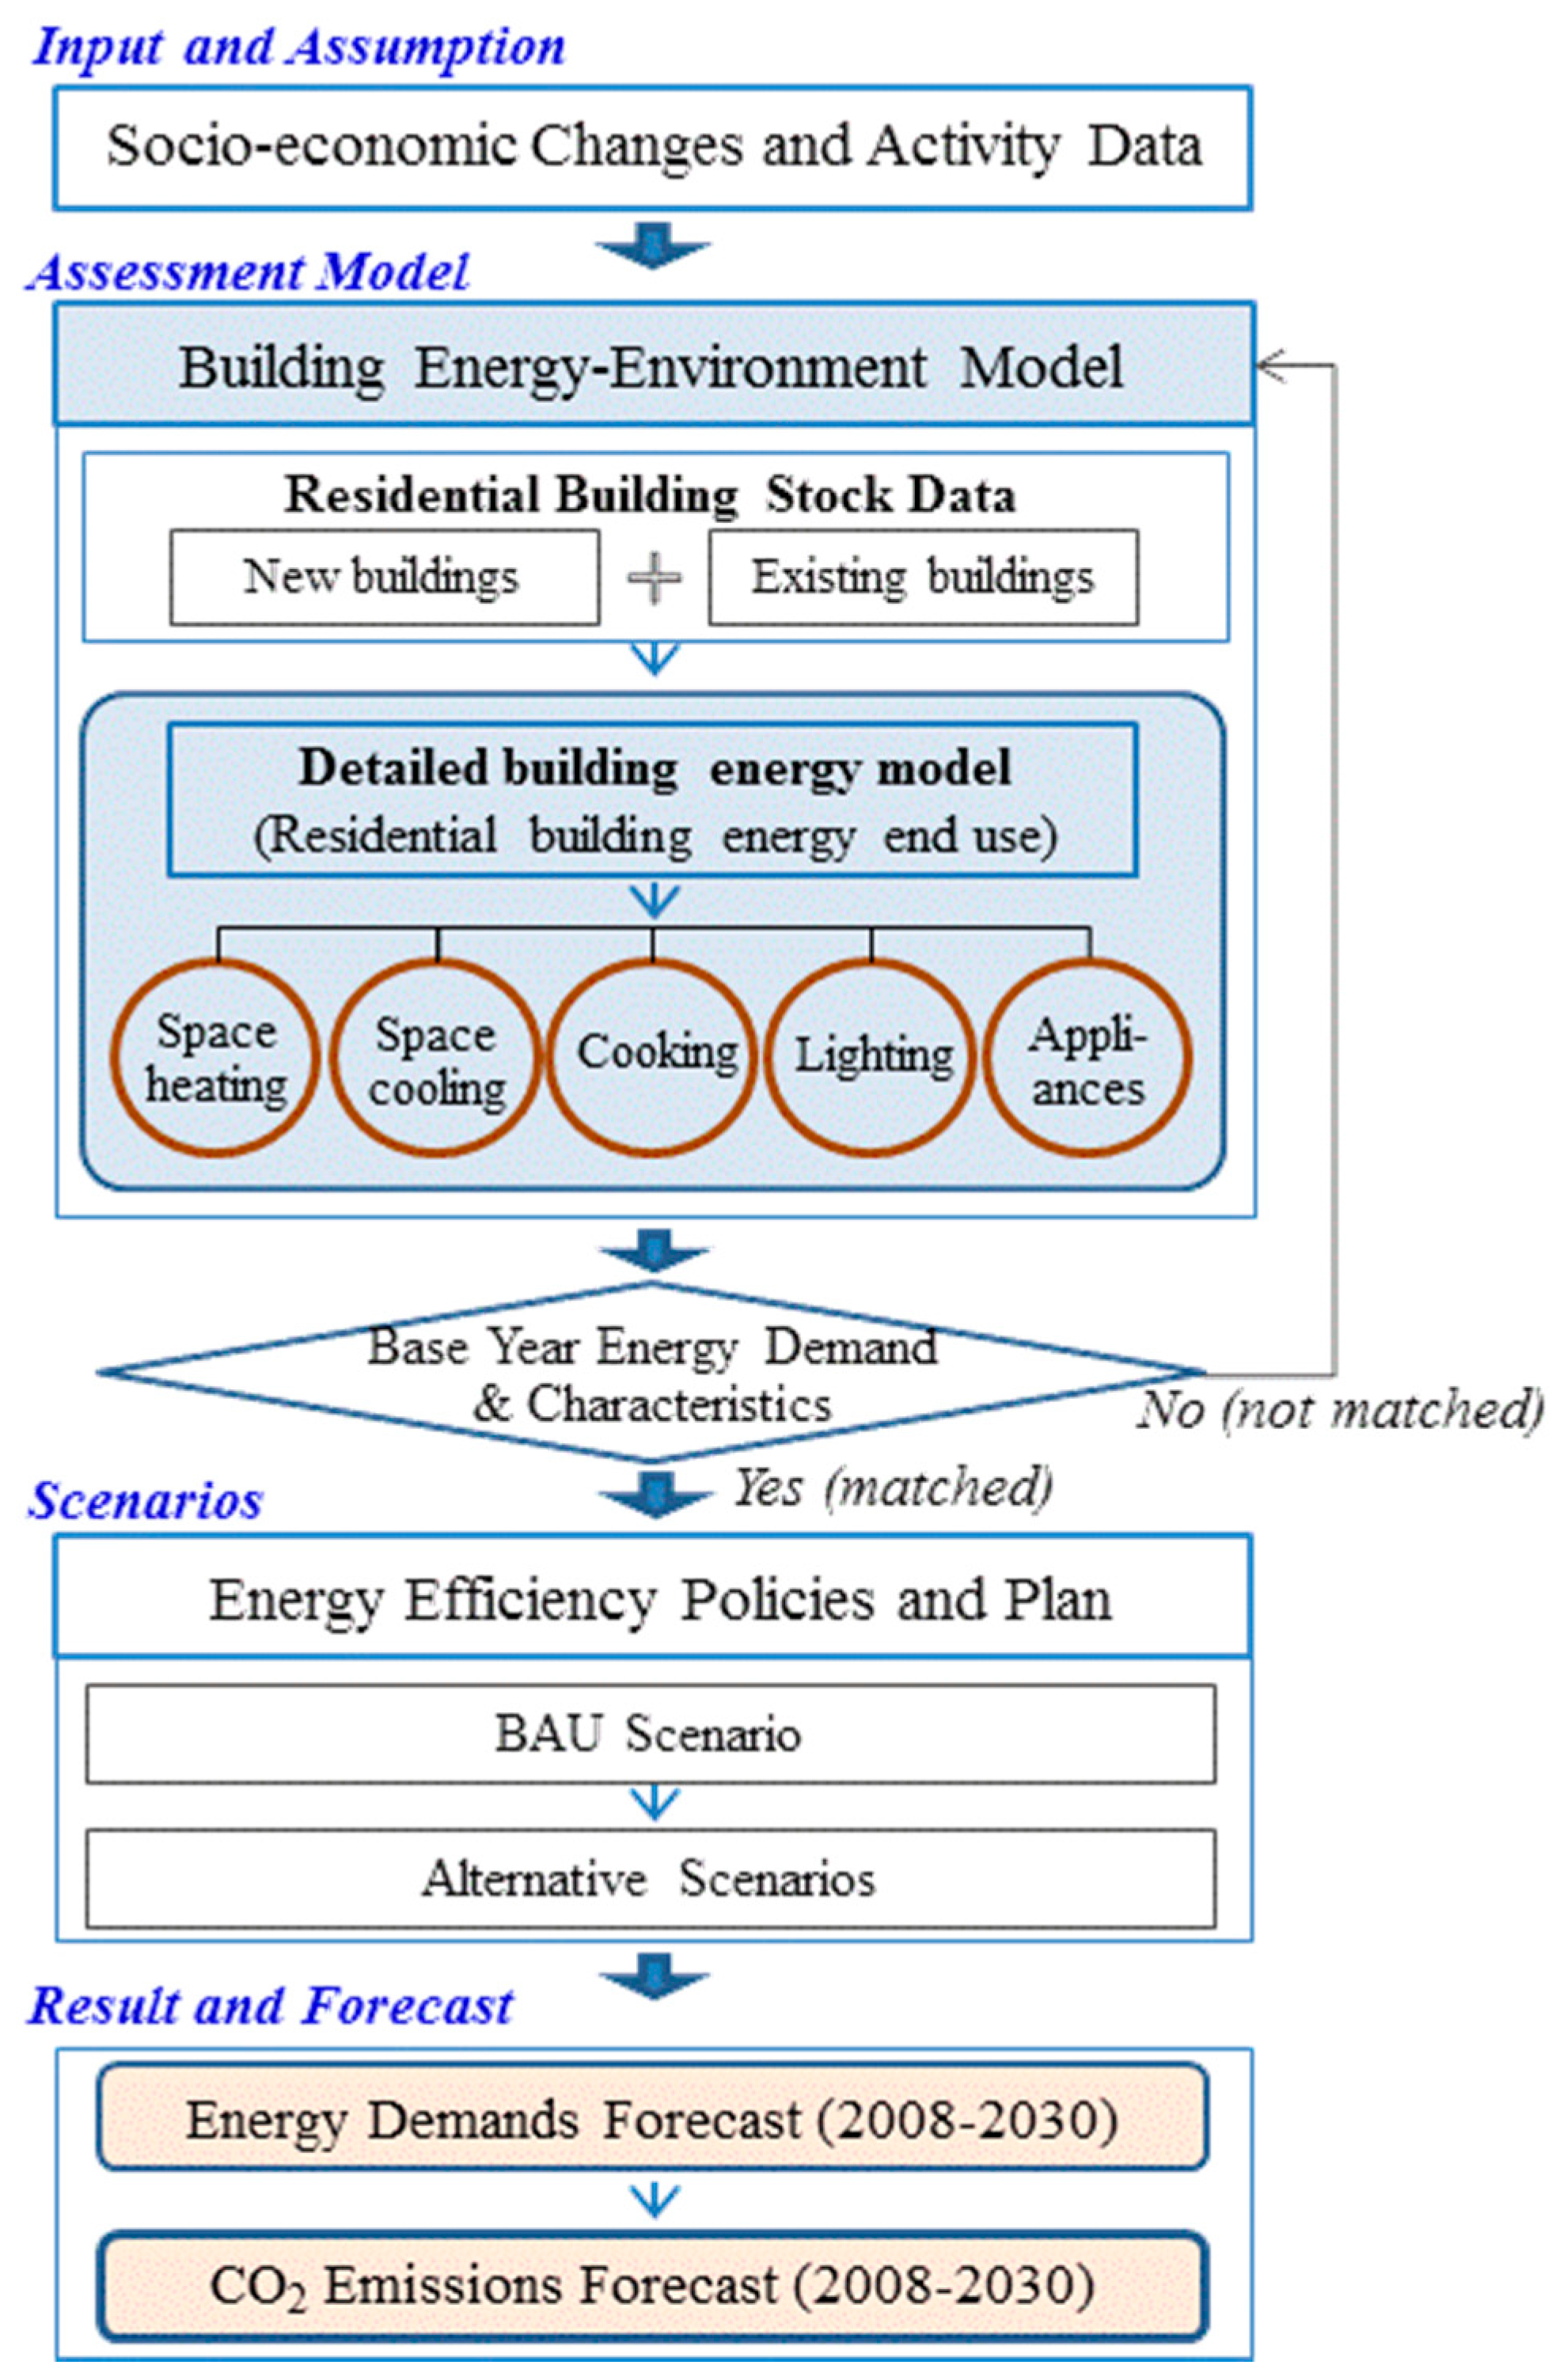
2.3. Basic Assumptions and Assessment Model Structure

A country’s total CO2 emission is influenced by many factors including economic growth, population, energy prices, industrial structure, weather and the development and distribution of energy-saving technologies. The business as usual (BAU) scenario forecasts these preconditions and reflects the results before estimating CO2 emissions. The base year data set was developed using statistics from relevant government agencies. The building energy–environment model used in this study is built on current accounts and future projections for the 20-year period 2010–2030. Energy consumption and CO2 emissions from residential building sector have been analyzed for the time span 2010–2030.
A key assumption relies on activity data such as economic growth rate, oil price, population and number of households, all of which are used to forecast energy demand of residential sector. The major socio-economic indicators based on the BAU scenario are presented in Table 1 [21,22,23,24]. We assume that South Korea’s population will peak at 49,340,000 persons in 2018, and then decline until 2030. The economic growth rate at the national level is 6.3% in 2010 and will decline to 2.24% in 2030. Oil prices reflected long-term oil price fluctuation by reference to the national energy plan (2008–2030) [24]. The number of households will increase to 19,871,000 households in 2030 because of increase of single-person households. The number of single-person households has more than doubled in the past 10 years. Total final energy consumption increased from 181.4 Mtoe in 2007 to 257.1 Mtoe in 2030, recording an increase rate of approximately 41.7%. These socio-economic assumptions are used as a major driving force for residential buildings and energy service within the building sector. The total number of residential buildings will increase from 12,980,000 units in 2007 to 15,759,000 units in 2030, an increase of approximately 21.4%. The key assumption variables and energy consumption forecasting reflects the national energy basic plan [24], energy statistics and energy balance [21,22].
General information and basic assumptions for estimating energy consumption and CO2 emissions of residential buildings are as follows:
  • Time period: 20 years (2010–2030)
  • Base year: 2007
  • Energy end use in residential buildings: space heating, space cooling, cooking, lighting, electrical appliances
  • Current accounts and future projections (from 2010 to 2030) of existing residential buildings and energy consumption of the residential building sector in South Korea were determined in a survey database in this study model
The structure and framework of the assessment model is presented in Figure 2. This building energy–environment model consists of four parts: input and assumption, assessment model, scenarios and result and forecast. The result and forecast part shows the annual output projection of energy consumption and CO2 emissions according to the BAU scenario and alternative scenarios. The data from socio-economic assumptions and the number of residential buildings are used as inputs for the building energy–environment model to create the residential building stock data and detailed building energy model (profile of residential building’s energy end-use). The residential building stock data consisted of new building data after base year (from 2008) and existing building data before the base year (by 2007). The detailed building energy model is comprised of five sectors: space heating, space cooling, cooking, lighting and appliances.
The main key issue is the representation of the expansion of residential building stock data for the number of residential buildings used in this model. We collected historical statistics about residential buildings, such as yearly numbers of residential buildings and new constructions between 1985 and 2010. After 2010, the forecast of number of households and the assumed population growth were used to calculate the total number of residential buildings to 2030. Particularly, residential building growth is strongly linked to household growth in Figure 3. We assumed that the lifespan of a residential building to be 40 years after construction and apply the demolition rate of 2.3% from the construction statistics [21,23]. The demolition rate means that 2.3% of the remaining building stock in any given year retires in the following year. A total residential building stock consists of new residential buildings and existing residential buildings (Figure 3). The number of existing residential buildings will decrease from 12,105,000 houses in 2010 to 7,601,000 houses in 2030. On the other hand, the number of new residential buildings will increase from 1,498,000 houses in 2010 to 8,159,000 houses in 2030, because the new residential building is the cumulative value of the number of residential building built after the base year.
The second key issue in this assessment model is to determine the energy service required for end-use energy in buildings by residents. The composition and scope of analysis with regard to energy service were divided into the space heating sector including hot water, space cooling, cooking, lighting and home electricity use. In addition, energy technology was created by collecting relevant data including data from the boiler, air conditioner, cooking devices, lighting and home appliances. All data are reflected on the analysis model. Energy sources in this model are separated into coal, oil, natural gas, district heat (heat), electricity and renewable energy.
The assessment model with LEAP model must match the national energy statistic and the characteristics of the end-use energy of residential buildings in the base year. If the result of assessment model did not match the base year’s energy consumption data, we calibrated the detail-building energy model and assumption data. The baseline case of residential building energy is determined in BAU scenario using this assessment model. The BAU scenario is composed of the current accounts and future projection from 2008 to 2030. This structure of model allows us to predict the energy consumption and CO2 emissions and to apply the alternative scenarios for CO2 reduction potential in the residential building sector.
The key variable used in the analysis to calculate CO2 emissions is the specific CO2 emissions factor by energy source. This is because CO2 emissions show a large difference depending on the emission factor, even if the same amount of energy is consumed. Table 2 presents the CO2 emission factors for calculating greenhouse-gas emissions in Korea. This study used the factor provided by the guideline [25] by Intergovernmental Panel on Climate Change (IPCC) as the CO2 emissions factor of fossil fuel when calculating CO2 emissions. The annual CO2 emission factor from the Korea Power Exchange was used as the electricity factor and its value was presented by the Korea’s Ministry of Environment for district heat [26].

3. Scenarios and Data Framework

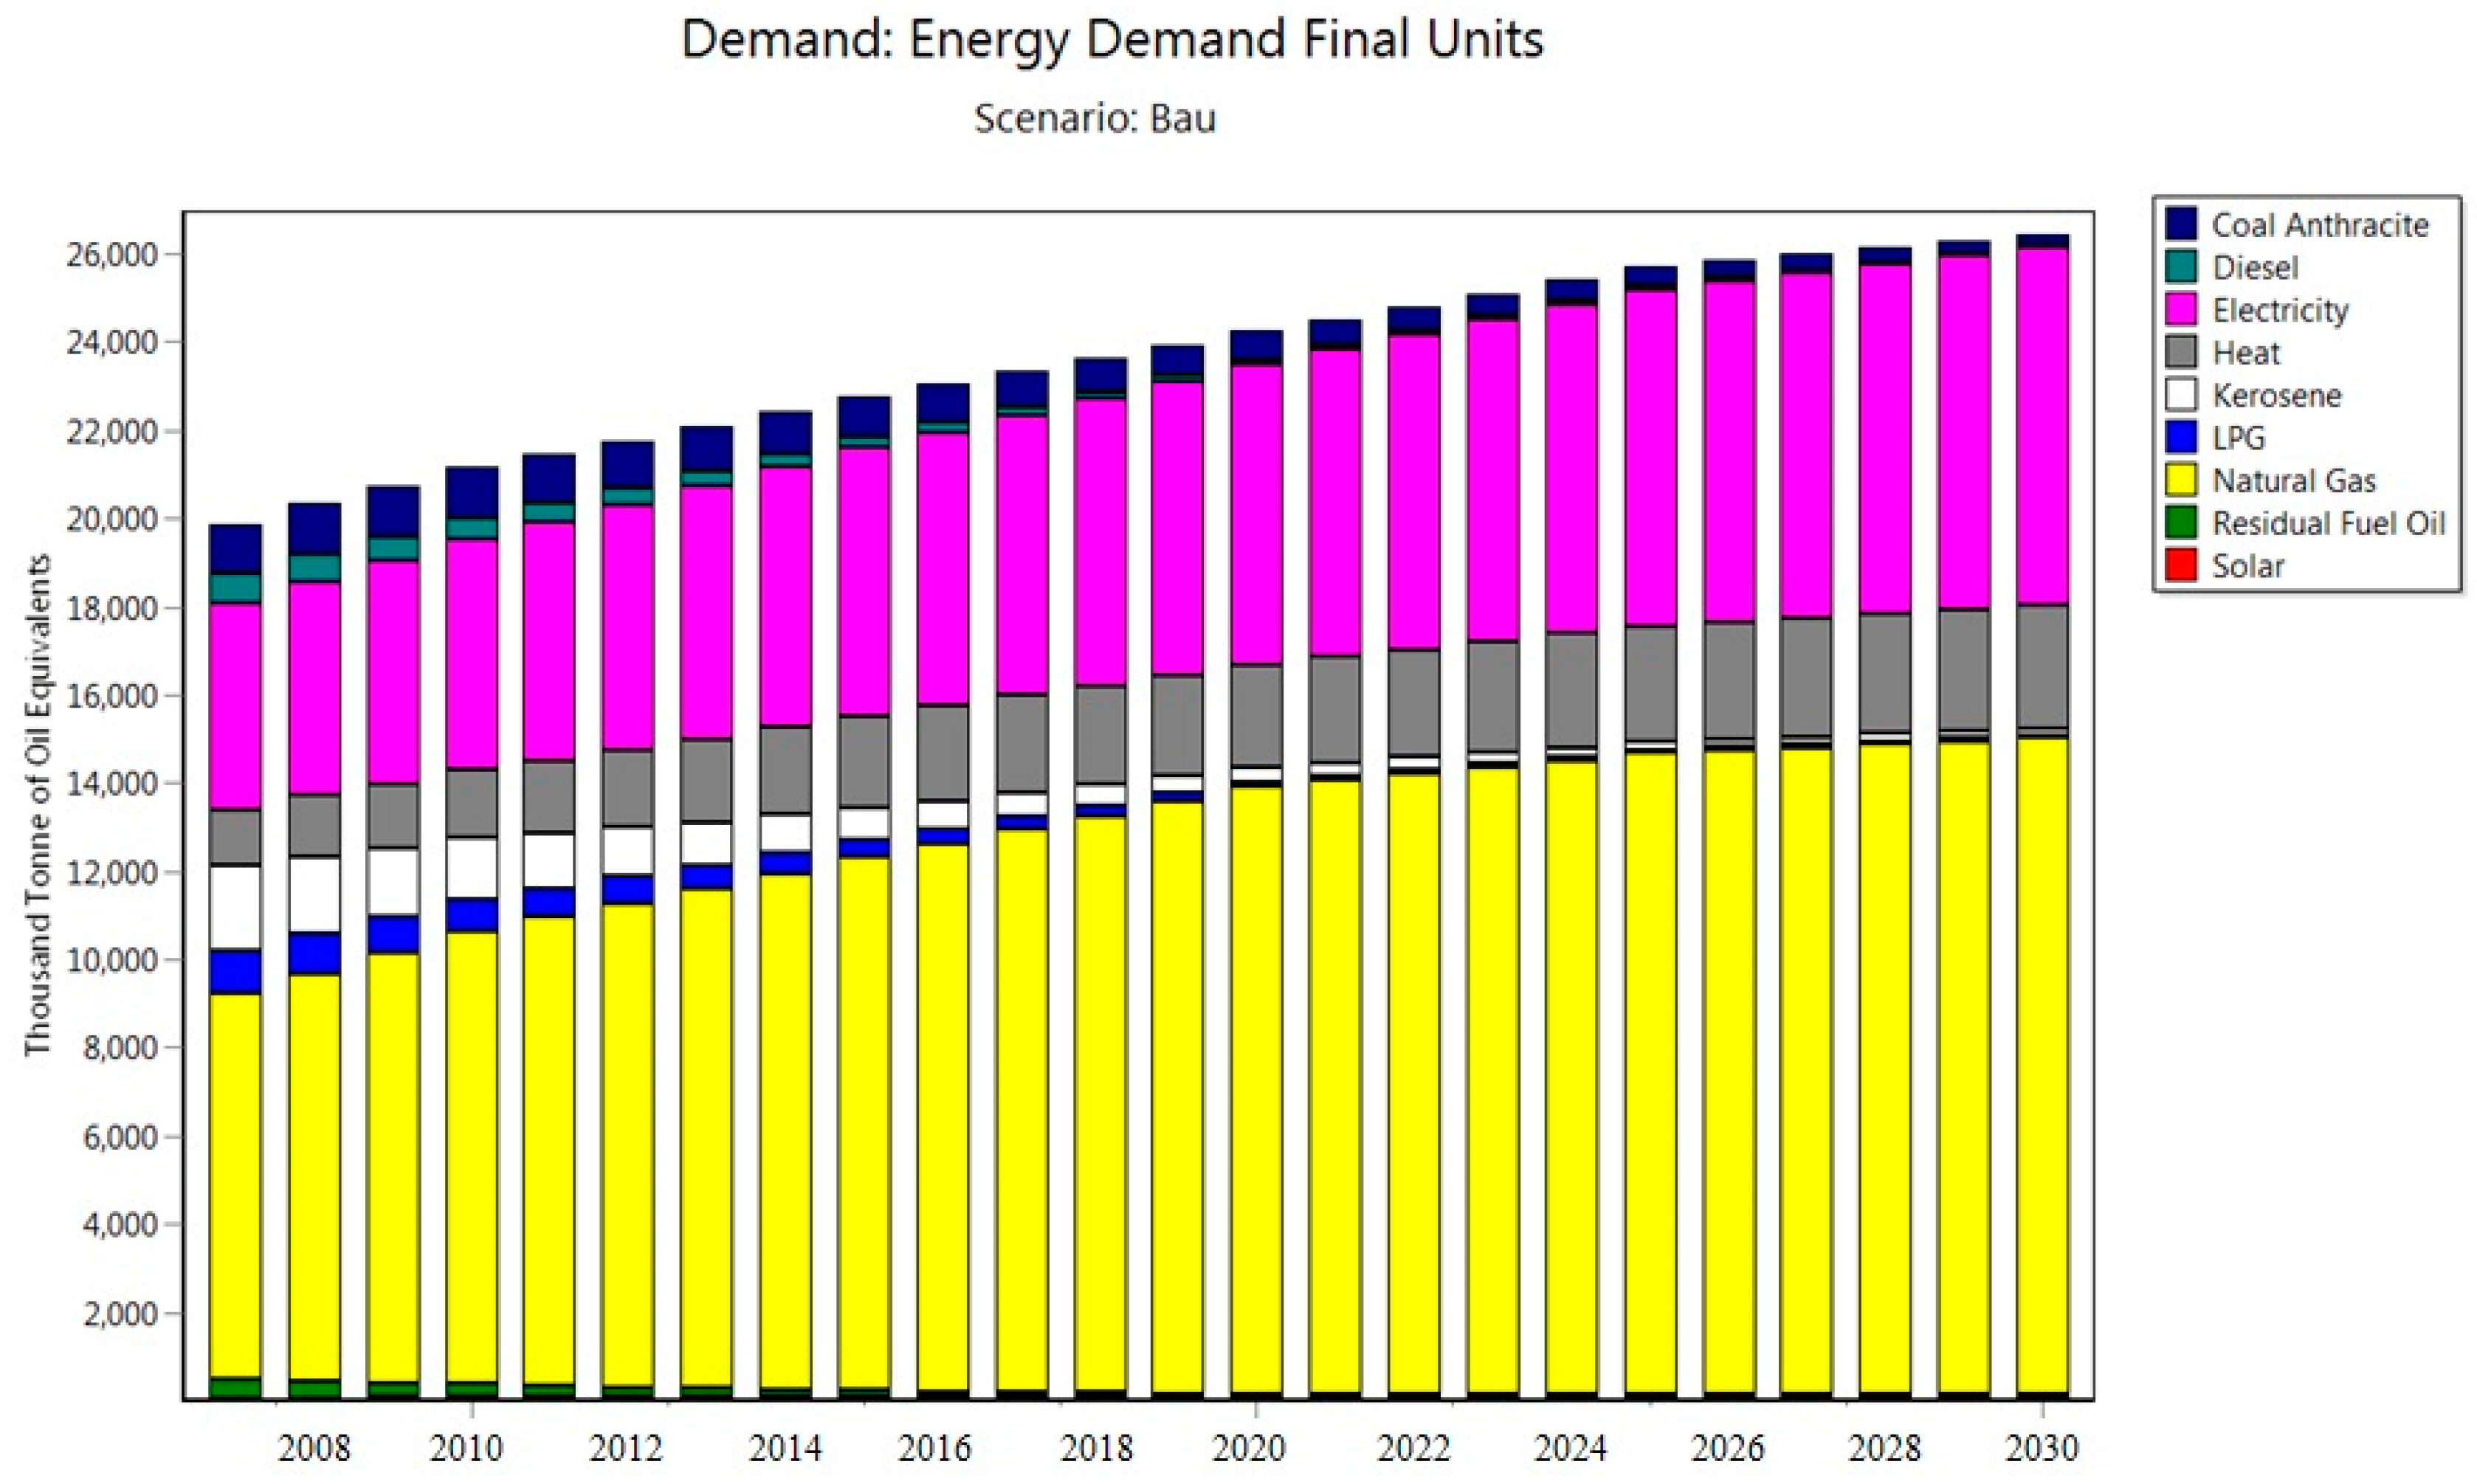
3.1. Business As Usual (BAU) Scenario

The baseline case of the residential building sector is determined in the BAU scenario using the assessment model of this study. The BAU scenario refers to the CO2 emissions estimate under the assumption shown in Section 2.3 that the tendency of social and economic growth will continue in the future after a basic year, and that technological efficiency will also continue to improve based on patterns seen from the past to the present.
Assessment results of the BAU scenario are shown in Table 3 and Figure 4. Total final energy consumption in residential buildings in 2007 is reported at 19.88 Mtoe. This shows a 5.6% error compared to 21.07 Mtoe, which was the final energy consumption in 2007 reported by Korea Energy Statistics [22]. The energy output of the BAU scenario in 2010 was 21.19 Mtoe, whereas the final energy output from Korea Energy Statistics was 21.18 Mtoe. Results of the BAU scenario during the period 2007–2010 are quite similar to the figures presented by Korea Energy Statistics [22]. The increase in the amount of energy expected to be consumed in 2030 was over 33% in the BAU scenario. On the basis of the final energy consumption in 2007 from Table 3, space heating accounted for about 67.5%, which is the largest proportion of energy consumption in residential buildings. Space heating accounts for most of the energy consumption and is a key factor in CO2 emissions of residential buildings. Space heating energy consumption is expected to increase 16.0% in 2030 compared to 2010. It was found that the energy consumption from home electrical appliances accounted for 17.5% of the total energy consumption in 2010. This rate is seen to increase by 4.8% from 2010 to 2030. In the BAU scenario, energy consumption continuously increased by 124.8% during the period 2010–2030. Figure 4 gives the demands of the energy source in the BAU scenario for the period 2007–2030. In 2030, the maximum energy consumption is expected to be come from natural gas (57.2%), electricity (31.0%) and district heat (10.3%). Natural gas and district heat are used for space heating in South Korea’s residential buildings. Natural gas increases by 148.6% from 2010 to 2030. Electricity is mostly used to operate home electrical appliances and lighting in households. Electricity consumption will rise by 179% by the year 2030. The energy consumption output of the BAU scenario was projected using the conventional trends (population, household and efficiency), the energy use patterns of residential buildings, the economic situation and the energy policy.
Table 4 shows the output projections of space heating energy in BAU scenario. It is shown that heating energy will increase by about 22% from 14.12 Mtoe in 2010 to 16.38 Mtoe in 2030. The annual rate of increase of space heating energy is 4.1%, which is the mean value for the time horizon. Natural gas, among the different heating energy sources, was estimated to increase from 61.8% in 2010 to 79.2% in 2030. Among the fossil fuels, anthracite and oil fuel are projected to decrease significantly from 26.0% in 2010 to 2.3% in 2030. The results of heating energy using the BAU scenario were analyzed to reflect the tendency with regard to an increased number of houses, the expanded pipe network of natural gas in a compact housing district, the tendency to prefer clean energy, and alternative fuels using natural gas and district heat. The Korean government promoted district heating, which uses high efficiency equipment that utilizes a combined heat and power (CHP). The use of CHP equipment can improve energy use efficiency by producing heat and power simultaneously [27]. Energy sources used in district heating in Korea were coal, oil, liquefied natural gas (LNG) and wastes. Heat from waste incineration accounted for about 21% and heat from the electricity generation using LNG and coal accounted for more than 70% [28,29]. After completion of the BAU scenario, energy and CO2 reduction potential of residential buildings were compared using the alternative scenarios.

3.2. Description of Alternative Scenarios

There are four alternative scenarios based on the implementation of residential building energy efficiency policies and plans [23,24,30,31,32,33,34] and technologies of the South Korean government: energy efficiency for new residential buildings (scenario I), refurbishment or renovation of existing residential buildings (scenario II), use of highly efficient boilers (scenario III) and use of a solar thermal energy system for heating spaces and water (scenario IV). The details of each scenario are shown in Table 5.

3.2.1. Scenario I

According to the IEA’s report, the building envelope and the good design of a building play a substantial role in determining the heating and cooling load for a desired indoor temperature [3]. It is estimated that the space heating and cooling accounted for 39% of the residential building sector’s CO2 emissions in 2007. Building envelopes, including walls, floors, ceilings, windows and doors are very important elements in determining heating and cooling demand.
It is possible to construct residential buildings with heating energy consumption reduced by over 40% by applying an energy-efficient design, using high-efficiency insulation technology as well as high-efficiency window technology [23]. South Korea’s major construction companies also report that apartment buildings can be constructed with 30%–40% reductions in energy consumption by promoting housing brands [35,36,37]. These energy-saving, sustainable houses can be supplied in numbers reaching about 1,684,000 by 2020. South Korea is pursuing a policy that residential buildings will require energy levels 30% lower than the current average in residential buildings from 2012 and will meet a passive house levels using high insulation, airtightness, heat recovery ventilation systems and various energy-saving technologies from 2017. Since 2009, the thermal insulation standards of building envelopes have been intensified to meet the passive house standard by 2017. All new residential buildings constructed after 2025 must likewise be constructed as energy-efficient buildings that do not demand any fossil fuel energy. It is a long-term roadmap set by the government. Scenario I includes the above-mentioned contents and is based on the green building activation plan for long-term building energy efficiency by the government.

3.2.2. Scenario II

The energy saving effect of reducing heat loss from buildings through energy retrofits for the existing residential building stock is expected to be huge. In OECD countries, most of the building stock was constructed before the 1970s (around 60% of the residential dwellings) and has very high space heating requirements. Refurbishing or renovating these buildings offers the largest abatement of potential heating energy demand [3].
The South Korean government is driving the project to transform the existing housing stock into energy efficient green homes [30]. To improve the energy efficiency of these buildings, an action plan for green building activation stipulates the continuation of retrofit programs for buildings and supply projects for green remodeling of buildings. Through the old housing renovation project, the government has a plan to retrofit 280,000 dwellings (existing housing) over 15 years until 2016. The government is promoting improvement of the energy efficiency of the existing buildings through the enactment of ‘the act on the promotion of green buildings’ [30]. The government introduced a building energy certification system that encourages people to select a more energy efficient building by attaching building energy certificates in building sales or rental processes. A government-funded green building remodeling program is operated by a green remodeling creation center to support the interest of cost US$0.25 million spent on energy improvements in 2015 [38]. In addition, from the 2012 housing budget, the Korean government spent about USD$66.1 million on repairing deteriorated public rental houses, and about USD$26.7 million on repairing houses belonging to socially vulnerable people.
Retrofitting residential buildings with energy efficiency improvements can result in up to 20% space heating energy savings. Houses with energy-saving, eco-friendly housing repair works are expected to make up about 8% of the total existing residential building stock in 2020, reaching 20% in 2030. South Korea is in the process of promoting the contents of this policy plan. Scenario II includes the above-mentioned contents.

3.2.3. Scenario III

Improved energy efficiency for the energy supply and demand parts within buildings can be considered the biggest factor for reducing CO2 emissions. Heating energy in residential building stock is generally supplied by a boiler for which natural gas is used as the energy source. Multi-family housing with over 20 families will require the installation of a high efficiency boiler with over 87% heating energy efficiency from 2010 [31].
Natural gas consumption increased by 5.2% annually from 2002 to 2007 and it is estimated that gas consumption of households will increase by an annual average of about 2.5% by 2022 [32]. We assume that the distribution of high efficiency boilers among the different natural gas boilers will increase from 11% in 2009 to 30% in 2015, 60% in 2020 and 100% in 2030. This plan is applied to new and existing residential buildings. This assumption is consistent with the historical trend of spread of high efficiency boiler in housing and long term natural gas supply and demand program.

3.2.4. Scenario IV

Since a solar thermal energy system is relatively more efficient and economically more feasible than alternatives, this new and renewable energy facility offers a large distribution potential. In addition, the IEA has declared solar technology a major measure in preparing for sustainable energy properties and as an efficient measure for reducing CO2 emissions [3]. A basic plan for new and renewable energy was set up to raise the percentage of new and renewable energy in primary energy from 2.6% in 2008 to 11% in 2030 [31]. The South Korean government is promoting a policy to raise the renewable energy distribution from the current 2.4% in 2007 to 11% in 2030 [23,31].
South Korea plans to supply the renewable energy system to one million dwelling houses by 2020, particularly to new residential buildings and the existing housing stock [33]. Although the solar thermal energy system is now being used as a renewable energy facility that effectively produces heating energy, the system supplies only about 50% of the heating energy required for residential buildings [39]. We assume that the installation of solar thermal energy system will be increased linearly up to 1,576,000 housings by 2030. In this scenario, residential buildings with solar thermal energy systems for heating will account for 1.05% of total residential building stock in 2010, 7.6% in 2020 and 10% in 2030.

4. Scenario Analysis Results and Discussion

The final energy consumption, CO2 emissions, invested amount cost and CO2 reduction potential in the alternative scenarios were analyzed, respectively and compared with the outcomes of the BAU scenario.

4.1. Energy Consumption and CO2 Emission

Table 6 shows the annual energy consumption projection using the assessment model of this study based on each alternative scenario (scenarios I–IV). Energy consumption in 2030 is projected to show a 25.2% increase in scenario I, a 31.1% increase in scenario II, a 33.1% increase in scenario III, and a 45.9% increase in scenario IV, relative to 2007. The energy reduction effect is shown to be highest in scenario I among all the alternative scenarios.
The time-horizon variation of global warming potential for each alternative scenario is shown in Table 7. According to a publication released by the South Korean government, total CO2 emissions in 2007, which was used as the base year, were 610.5 Mton CO2. The residential building sector accounted for 11.5% of emissions, with 70.47 Mton CO2. In 2007, CO2 emissions in the BAU scenario were 65.99 Mton CO2, about 6.4% less than the 70.47 Mton CO2 reported by the national CO2 emission statistics. In 2010, CO2 emissions in the BAU scenario were 70.14 Mton CO2, about 3.1% lower than 72.40 Mton CO2 reported by the national CO2 emission statistics. This is significant because the energy consumption and CO2 emissions in the real residential building sector were realistically reproduced and modeled by using the preconditions and variables collected in this study and through the BAU scenario. The data obtained are seen to have significant utilization value.
According to the CO2 emissions results in the BAU scenario, CO2 emissions in the residential building sector are projected to continually increase until 2030. Energy consumption in the residential building sector is expected to increase by about 33% from 2007 to 2030, and CO2 emissions are expected to increase by about 10.7%. As seen from the estimates on space heating energy consumption, this is due to the fact that consumption is expected to be transferred to low CO2 energy sources while the consumption of high CO2 fossil fuel is expected to decrease. The district heating system is expected to be supplied and used more, although the total energy consumption is expected to increase. In addition, continual efficiency improvements of the boiler and lighting devices are determined to be a key factor for this.
Through building energy efficiency planning in residential buildings after 2007, CO2 emissions were found to decrease in all scenarios. As each scenario reflects the energy efficiency in the residential buildings, CO2 emissions are expected to drop by 2030 in all alternative scenarios when compared to the BAU scenario. The CO2 emission in scenario I increased from 65.99 Mton CO2 in 2007 to 69.08 Mton CO2 in 2030. In the case of scenario I, since an energy-efficiency scenario for new residential buildings is being driven, CO2 emissions are seen to maintain their level in 2020. In scenario II, with energy retrofitting of the existing buildings, CO2 emissions increased from 70.08 Mton CO2 in 2010 to 72.19 Mton CO2 in 2030. Scenario III, which uses a high efficiency gas boiler, showed the lowest CO2 emissions among all alternative scenarios from 2010 to 2020. Scenario III yielded projections of 68.79 Mton CO2 in 2025 and 70.06 Mton CO2 in 2030. According to scenario IV, with regard to the introduction of solar thermal energy systems for heating energy, the CO2 emissions were found to increase by 8.4% in 2030. The energy consumption in scenario IV increases by 36.7% from 2007 to 2030, but CO2 emissions are projected to become relatively lower. This is because the renewable energy that is to be used as heating energy produced through the solar thermal energy system was evaluated as emitting zero CO2.

4.2. Cost

This study analyzed the discounted cumulative total costs for energy efficiency measures from 2007 to 2030 for each scenario. The results of the investment cost identified by the assessment model are shown in Table 8. All costs are shown in 2007 values. The investment includes the initial investment, maintenance cost and energy cost according to the scenario. Because the initial investment amount on solar system is quite significant, the 2030 cost in scenario IV is higher by about 16.4% compared to the BAU scenario.

4.3. CO2 Emission Reduction Potentials

Table 9 shows the amount of CO2 removed in each alternative scenario in 2007, 2010, 2015, 2020, 2025 and 2030. By 2030, the amount of CO2 removed in each alternative scenario from highest to lowest is as follows:
Energy efficiency for new residential buildings (scenario I) > use of high efficient boilers (scenario III) > use of a solar thermal energy system for heating spaces and water (scenario IV) > refurbishment of existing residential buildings (scenario II)
The CO2 emissions reduction in 2030 in scenario I is the highest at 3.99 Mton CO2. When the reduction effect was applied by 2020, the reduction through the use of a high-efficiency gas boiler (scenario III) was found to be the highest among the alternative scenarios at 1.63 Mton CO2 in 2020. The reduction potential achieved by supplying the solar thermal energy system (scenario IV) was found to be 1.01 Mton CO2 in 2020, and is expected to decrease to 1.53 Mton CO2 by 2030. According to the accumulated CO2 reduction potential in all scenarios, the reduction potential was 0.16 Mton CO2 in 2010, 4.48 Mton CO2 in 2020 and 9.41 Mton CO2 in 2030. This amount is equal to a reduction potential of about 12.9% compared to the CO2 emission by 2030 in the BAU scenario.
The unit reduction cost of scenario III, having the lowest CO2 emission levels among all the alternative scenarios was minus (−) 62.3 USD/ton of CO2 by 2030. Thus, scenario III is seen to have the most cost-effective measure. Because the solar thermal energy system (scenario IV) has significantly higher initial installation and maintenance costs, its projected unit reduction cost in 2030 was found to be 629.5 USD/ton of CO2.

5. Conclusions and Policy Implications

A major goal of improved building technologies and building energy policies is the reduction of CO2 emissions, which is also the primary goal of energy efficiency and carbon policies. The results obtained from the BAU scenario in estimating energy consumption and CO2 emissions in the residential building sector were based on the energy consumption characteristics of the current residential building sector and socio-economic development potential. The alternative scenarios were established based on energy-saving technologies and green building policy initiatives. This study provides insights into the trends in energy consumption and CO2 emissions in the residential building sector of South Korea.
This study focuses on both potential energy savings impacts and CO2 emission mitigation of the energy efficiency measures within residential buildings. We suggest the building energy–environment model using LEAP software. We developed it as a flexible tool for assessing the ability of the green-building strategies to achieve desired CO2 reductions goal. The results show that the CO2 emissions of residential buildings will have a significant impact on the building’s energy efficiency and on its energy usage.
CO2 emissions in the residential building sector are seen to increase from 65.99 Mton CO2 in 2007 to 71.46 Mton CO2 in 2020 and 73.07 Mton CO2 in 2030, translating to a 10.7% increase compared to 2007 in the BAU scenario. This is because energy consumption continually increases as the population and the numbers of dwellings increase. In particular, the energy consumed for heating energy was found to be the highest at 61.9–67.5%. Efficient heating energy technology is seen to be the more cost-effective measure for energy consumption and CO2 emission reduction.
This study analyzed the environmental and economic impact of energy technologies from the South Korean government’s energy efficiency and carbon policies. These technologies are capable of introducing a number of highly efficient new buildings, with energy retrofitting of existing buildings, high-efficiency gas boilers and solar thermal systems on the residential buildings through alternative scenarios by using the building energy–environment model. These alternative scenarios could help reduce the residential building sector’s energy consumption and its CO2 emission. The CO2 reduction amount potential by alternative scenarios was 12.9% compared to the potential of the BAU scenario by 2030. This CO2 emissions reduction potential is significant in terms of the country’s total CO2 emissions because it represents the combined effect of the building sector’s energy efficiency and the power sector’s decarbonization.
However, there remains technological, economic and institutional uncertainty with regard to the introduction of these technologies in future residential building markets. To overcome such limitations, technological supply systems or policies need to be promoted at the national level. It is also necessary to establish a long-term comprehensive plan and prepare a system for implementing such plans to activate the construction of low-energy green buildings by linking the plan to a long-term national CO2 reduction goal. Only when energy efficiency technologies in residential buildings are considered along with the measures to supply these technologies to the housing construction markets can these technologies be helpful in CO2 emission reduction in the residential building sector.

Acknowledgments

The author is grateful for the support of the Korea Institute of Civil Engineering and Building Technology (Key R&D project No. 2014-0047).

Conflicts of Interest

The author declares no conflict of interest.

References

  1. Kim, H.K. The Right Way to Know about Green Growth; Nanam Publishing House: Gyeonggi-Do, Korea, 2011. [Google Scholar]
  2. Erlandsson, M.; Bog, M. Generic LCA-methodology applicable for buildings, constructions and operation services-today practice and development needs. Build. Environ. 2003, 38, 919–938. [Google Scholar] [CrossRef]
  3. International Energy Agency (IEA). Energy Technology Perspectives 2010: Scenarios & Strategies to 2050; International Energy Agency: Paris, France, 2010. [Google Scholar]
  4. Radhi, H. Evaluation the potential impact of global warming on the UAE residential buildings—A contribution to reduce the CO2 emissions. Build. Environ. 2009, 44, 2451–2462. [Google Scholar] [CrossRef]
  5. Radhi, H. Can envelope codes reduce electricity and CO2 emissions in different types of buildings in the hot climate of Bahrain. Energy 2009, 34, 205–215. [Google Scholar] [CrossRef]
  6. Gaterell, M.R.; McEvoy, M.E. The impact of climate change uncertainties on the performance of energy efficiency measures applied to dwellings. Energy Build. 2005, 37, 982–995. [Google Scholar] [CrossRef]
  7. Li, J. Towards a low-carbon future in China’s building sector—A review of energy and climate models forecast. Energy Policy 2008, 36, 1736–1747. [Google Scholar] [CrossRef]
  8. Yu, S.; Eom, J.; Evans, M.; Clarke, L. A long-term, integrated impact assessment of alternative building energy code scenarios in China. Energy Policy 2014, 67, 626–639. [Google Scholar] [CrossRef]
  9. Korean Government. Korea’s Third National Communication under the United Nations Framework Convention on Climate Change; Korean Government: Seoul, Korea, 2011.
  10. Korean Government. Greenhouse Gas Reduction Targets by Sectors and Years; Korean Government: Seoul, Korea, 2011. (In Korean)
  11. Korean Government. The National Roadmap to Achieve the National Greenhouse Gas Emissions Reduction Target. Available online: http://me.go.kr/home/web/board/read.do?pagerOffset=0&maxPageItems=10&maxIndexPages=10&searchKey=&searchValue=&menuId=286&orgCd=&boardId=339265&boardMasterId=1&boardCategoryId=&decorator= (accessed on 21 October 2016). (In Korean)
  12. Stockholm Environmental Institute (SEI). Long-Range Energy Alternative Planning System-User Guide for LEAP, Web Version for LEAP 2015. Available online: http://www.energycommunity.org (accessed on 7 February 2017).
  13. Bose, R.K.; Srinivaschary, V. Policies to reduce energy use and environmental emissions in the transport sector: A case of Delhi city. Energy Policy 1997, 25, 1137–1150. [Google Scholar] [CrossRef]
  14. Ghanadan, R.; Koomey, J.G. Using energy scenarios to explore alternative energy pathways in California. Energy Policy 2005, 33, 1117–1142. [Google Scholar] [CrossRef]
  15. Shabbir, R.; Ahmad, S.S. Monitoring urban transport air pollution and energy demand in Rawalpindi and Islamabad using leap model. Energy 2010, 35, 2323–2332. [Google Scholar] [CrossRef]
  16. Tao, Z.; Zhao, L.; Changxin, Z. Research on the prospects of low-carbon economic development in China based on LEAP model. Energy Procedia 2011, 5, 695–699. [Google Scholar] [CrossRef]
  17. Yophy, H.; Jeffrey, B.Y.; Chieh-Yu, P. The long-term forecast of Taiwan’s energy supply and demand: LEAP model application. Energy Policy 2011, 39, 6790–6803. [Google Scholar]
  18. Shin, H.; Park, J.; Kim, H.; Shin, E. Environmental and economic assessment of landfill gas electricity generation in Korea using LEAP model. Energy Policy 2005, 33, 1261–1270. [Google Scholar] [CrossRef]
  19. Jun, S.; Lee, S.; Park, J.W.; Jeong, S.J.; Shin, H.C. The assessment of renewable energy planning on CO2 abatement in South Korea. Renew. Energy 2010, 35, 471–477. [Google Scholar] [CrossRef]
  20. Park, N.B.; Yun, S.J.; Jeon, E.C. An analysis of long-term scenarios for the transition to renewable energy in the Korean electricity sector. Energy Policy 2013, 52, 288–296. [Google Scholar] [CrossRef]
  21. Korean Statistical Information Service Database Portal. 2014. Available online: http://kosis.kr/eng (accessed on 30 September 2016).
  22. Korea Energy Economics Institute. Year of Energy Statistics 2013. Available online: http://www.keei.re.kr (accessed on 30 September 2014).
  23. The Action Plan for Green Building Activation (Government Report/2009/11); Korea Ministry of Construction and Transportation: Seoul, Korea, 2009. Available online: http://www.greengrowth.go.kr/?p=38696&cat=35 (accessed on 30 September 2016). (In Korean). (In Korean)
  24. Prime Minister’s Office; MOSF; MEST; MOFAT; MKE; ME; MLTM. The 1st Korean National Energy Basic Plan (2008–2030); Korean government: Seoul, Korea, 2008. (In Korean)
  25. International Panel on Climate Change (IPCC). IPCC Guidelines for National Greenhouse Gas Inventories; International Panel on Climate Change (IPCC): Hayama, Japan, 2006. [Google Scholar]
  26. Korea Ministry of Environment. Greenhouse Gas and Energy Target Management Scheme (Notification No. 2011-29). Available online: http://eng.me.go.kr (accessed on 30 August 2013).
  27. Park, S.; Lee, K.; Yoo, S. Economies of scale in the Korean district heating system: A variable cost function approach. Energy Policy 2016, 88, 197–203. [Google Scholar] [CrossRef]
  28. Korean Government. The Fourth Framework for the District Energy Supply; Korea Ministry of Trade, Industry & Energy: Seoul, Korea, 2014. (In Korean)
  29. Homepage of Korea District Heating Corporation. Available online: http://www.kdhc.co.kr (accessed on 9 February 2017).
  30. Korean Government. The Act on the Promotion of Green Buildings; Korea Ministry of Land, Transport and Maritime Affairs: Seoul, Korea, 2012. (In Korean)
  31. Korean Government. Construction Standard and Performance of Eco-Friendly House (Notification No. 2010-421); Korea Ministry of Construction and Transportation: Seoul, Korea, 2010. (In Korean)
  32. Korean Government. The 9th Plan for Long Term Natural Gas Supply and Demand Program; Korea Ministry of Knowledge Economy: Seoul, Korea, 2008. (In Korean)
  33. Korean Government. Third New and Renewable Energy Technology and Dissemination Program; Korea Ministry of Knowledge Economy: Seoul, Korea, 2008. (In Korean)
  34. Korea Ministry of Knowledge Economy. 1 Million Green Home Distribution Projects; Korea Ministry of Knowledge Economy: Seoul, Korea, 2009. (In Korean)
  35. Kim, S.G. Zero energy house (ZENER HEIM) case study. Rev. Archit. Build. Sci. 2010, 54, 48–54. [Google Scholar]
  36. Won, J.S. DAELIM ECO house technology development status and prospects. Rev. Archit. Build. Sci. 2012, 56, 18–25. [Google Scholar]
  37. Lee, M.J. Planning and implementation of Korea’s first zero energy housing complex. Rev. Archit. Build. Sci. 2014, 58, 47–53. [Google Scholar]
  38. Korea Ministry of Land, Infrastructure and Transport. Green Remodeling and Support Projects for Buildings. Available online: http://www.greenremodeling.or.kr/support/sup1000.asp (accessed on 30 September 2016). (In Korean)
  39. Lee, D.W. Overview and status of solar thermal systems. Mag. Soc. Air-Condit. Refrigerating Eng. Korea 2011, 40, 5–10. [Google Scholar]
Figure 1. Final energy consumption in residential building sector, 1997–2012.
Sustainability 09 00394 g001
Figure 2. The structure of the assessment model. BAU: business as usual.
Sustainability 09 00394 g002
Figure 3. Projected number of residential buildings—total residential building stock and number of households in South Korea, 2008–2030.
Sustainability 09 00394 g003
Figure 4. Annual final energy consumption in BAU scenario.
Sustainability 09 00394 g004
Table 1. Major socio-economic indicators.
ItemUnit2007201020202030
Economic growth rate%5.16.33.662.24
Oil priceUSD/bbl a96.091.470.082.0
PopulationThousand48,45648,87449,32648,635
Number of householdsThousand16,41717,15219,01219,871
Number of residential buildingsThousand12,98013,60315,07815,759
Total final energy consumptionMtoe b181.4193.8225.4257.1
a USD/bbl: US dollars per barrel of oil; b Mtoe: million tonnes of oil equivalent.
Table 2. CO2 emission factor in this study.
Energy SourceCO2 Emission Factor (Ton CO2/Toe)
Coal anthracite4.314
Natural gas2.343
Kerosene2.995
Liquefied petroleum gas (LPG)2.633
Electricity5.456
District heat2.681
Table 3. Results of energy demand by energy end-use, BAU scenario (Mtoe a, %).
Energy End Use200720102015202020252030
Space heating13.4314.1214.8015.5516.1316.38
(67.5)(66.7)(65.0)(64.1)(62.7)(61.9)
Space cooling0.360.450.600.750.870.89
(1.8)(2.1)(2.6)(3.1)(3.4)(3.3)
Cooking1.781.841.891.801.931.94
(9.0)(8.7)(8.3)(7.8)(7.5)(7.3)
Home electrical appliance3.313.714.324.915.525.90
(16.6)(17.5)(19.0)(20.3)(21.5)(22.3)
Lighting1.001.061.141.131.251.34
(5.0)(5.0)(5.0)(4.7)(4.9)(5.1)
Total19.8821.1922.7524.2425.7026.44
(100)(100)(100)(100)(100)(100)
a Mtoe: million tons of oil equivalent, calculated from this study using the LEAP model.
Table 4. Output projection for space heating energy by energy source type, BAU scenario (Mtoe a, %).
200720102015202020252030
Anthracite coal1.111.170.90.660.440.24
(8.3)(8.3)(6.1)(4.2)(2.7)(1.5)
Natural gas7.368.7310.3911.8912.6512.97
(54.8)(61.8)(70.2)(76.5)(78.4)(79.2)
District heat1.291.552.112.330.172.78
(9.6)(11.0)(14.3)(15.0)(16.4)(17.0)
Oil fuel3.602.511.200.460.170.13
(26.8)(17.7)(8.1)(2.9)(1.0)(0.8)
Renewable energy0.070.070.080.090.090.10
(0.5)(0.5)(0.5)(0.6)(0.6)(0.6)
Total13.4314.1214.8015.5516.1316.38
(100)(100)(100)(100)(100)(100)
a Mtoe: million tons of oil equivalent; calculated from this study using the long-range energy alternative planning (LEAP) model.
Table 5. Description and main conditions of alternative scenarios.
ScenarioDescriptionMain Condition
Scenario IEnergy efficiency for new residential buildings- Object: New residential buildings
- Heating energy efficiency: 40%
- Penetration rate: 60% by 2020, 100% by 2025
Scenario IIRefurbishment of existing residential buildings- Object: Existing residential building stock
- Heating energy efficiency: 20%
- Penetration rate: 8% by 2020, 20% by 2030
Scenario IIIHighly efficient boilers- Object: Total residential buildings that use gas boilers
- Energy efficiency of the boiler: more than 87%
- Penetration rate: 30% by 2015, 60% by 2020, 100% by 2030
Scenario IVSolar thermal energy system for heating space and water- Object: Total residential building stock
- The supply of green-house with solar thermal heating system
- Heating energy saving: 50%
- Penetration rate: 7.6% by 2020, 10% by 2030
Table 6. Annual output projection of energy consumption in alternative scenarios (Mtoe a).
200720102015202020252030
Scenario I19.8821.1622.5723.6824.6024.89
Scenario II19.8821.1722.6824.0725.4426.08
Scenario III19.8821.1722.4723.5524.7025.15
Scenario IV19.8821.2022.9924.7326.3327.18
a Mtoe: million tons of oil equivalent; calculated from this study using the LEAP model.
Table 7. CO2 emission potentials according to scenarios (Mton CO2).
200720102015202020252030
BAU scenario65.9970.1472.0871.4671.1273.07
Scenario I65.9970.1071.6070.0668.4169.08
Scenario II65.9970.0871.9071.0270.4872.19
Scenario III65.9970.1071.4269.8368.7970.06
Scenario IV65.9970.1271.5970.4569.8171.54
Table 8. Results in terms of costs according to scenarios (in millions, $USD).
200720102015202020252030
BAU scenario15,29114,08811,280913174445909
Scenario I15,29114,08411,263911374265890
Scenario II15,29114,09811,303917774995969
Scenario III15,29114,08111,185895572545722
Scenario IV15,29114,12511,97310,21285246876
Table 9. CO2 emission reduction potentials according to scenarios (Mton CO2).
200720102015202020252030
Scenario I0.00.040.481.402.713.99
Scenario II0.00.060.180.440.640.88
Scenario III0.00.040.661.632.333.01
Scenario IV0.00.020.491.011.311.53

