This study examines a small power system in SSA with a total nominal generation capacity of about 1000 MW, consisting of open-cycle gas turbine (OCGT) power plants for base load and diesel power plants for peak load, each fueled by HFO. Of the 48 countries of SSA, 26 have installed a generation capacity of less than 500 MW. A total of seven countries have installed a capacity of 500 to 1000 MW, while 13 countries have a generation capacity of between 1000 and 5000 MW. Two countries, Nigeria and South Africa, have installed a capacity of 9951 and 44,283 MW, respectively. In terms of electricity consumed, 24 of the countries in SSA consume less than 1 TWh of electricity, seven countries consume between 1 and 2 TWh, and 13 countries consume between 2 and 10 TWh and there are four countries, Mozambique, Nigeria, South Africa, and Zambia, with consumptions of 12, 24, 212, and 11 TWh, respectively [
17]. The generation capacity of the grid-based system is taken as 1000 MW in order to be descriptive of situations where utility-scale solar PV projects are actually being proposed and implemented. HFO was chosen as a fuel for these power plants due to its ease in terms of transportation, and the fact that the vast majority of power plants (both gas turbine and diesel) in Africa are using HFO or diesel rather than cheaper, but not available, natural gas [
18].
2.1. Data Specifications of the Solar PV Plant
The grid-connected solar PV plant envisioned in this study has a generation capacity of 30 MW, with an estimated cost of US$2.8 million per MW, making a total investment cost of US$84 million. The capital cost per MW for installed solar PV generation for this typical SSA country is estimated as the average cost for such plants being built and/or proposed by independent power producers (IPPs) in 2013–2015. The projects are in Burkina Faso (Zagtouli, 30 MW; Windiga, 22 MW), Egypt (Terra Sola, 2 GW), Ghana (Scatec, 50 MW; Blue Energy, 155 MW), Kenya (Canadian Solar, 50 MW), Mauritania (Masdar, 15 MW), Rwanda (Goldsol II, 10 MW; Scatec, 8.5 MW), and South Africa (Jasper Solar, 96 MW; SunEdison, 60 MW; Scatec, 75 MW, 40 MW) [
8,
19,
20,
21,
22,
23,
24,
25,
26,
27,
28,
29,
30,
31]. For operating and maintenance (O&M) costs, the world average estimate of 1.5% of the total initial investment cost of the PV system is employed [
32].
The extra total grid-level system cost necessitated by the introduction of solar PV generation is missing. In the absence of such studies for Africa, the estimate made for EU countries of US$11.91 (EUR 8.97) per MWh is taken as an approximate estimate of the total grid-level system cost of solar PV [
33]. The grid integration cost per MWh of solar generation is for the lowest level (2%) of PV penetration.
The size of this solar plant is typical of many projects that are being proposed for countries in SSA today. This proposed plant will be connected to the electricity grid of the country. It is assumed that the construction period will be one year for a solar PV plant and that it will have an operating life of 25 years. Annual degradation is assumed to be 0.6%. The annual solar radiation on angled panels is taken as 2023 kWh/m2 per year. This value is calculated by the authors as a yearly average irradiation on optimally inclined modules for SSA countries. The average radiation values for the period 1985–2004 are taken from the PVGIS-Helioclim database provided by the European Commission, Joint Research Centre, Institute for Energy and Transportation, Renewable Energies Unit. The power plant performance ratio is 75%.
The capacity factor is the ratio of the actual annual MW hours of electrical energy production per MW of capacity of a power plant divided by 8760 MWh. The higher the capacity factor of a new plant, the greater the amount of emissions reduced per MW of new capacity,
ceteris paribus. Solar PV plants can only reduce GHG emissions of the overall generation system when they are producing electricity, i.e. when the sun is shining, which is only a proportion of the time [
16]. Solar PV facilities have a capacity factor of 17.3% in SSA. Although this is a very high value compared to those found anywhere in Europe or in some other parts of the world, it is much lower than the capacity factors of diesel power plants. The capacity factor of a diesel power plant was assumed to be 66% in this analysis. The new diesel plants will reduce fuel use and emissions per MW of new capacity because they are more efficient than the existing plants that they are replacing on a one for one kWh basis. There is a marginal saving of fuel for each kWh produced by the new plants. The higher capacity factor of the diesel plants as compared to solar PV results in greater overall fuel savings by the new diesel plants than the alternative equivalent cost solar PV plant.
The carbon dioxide equivalent is a measure used to compare the emissions from various GHGs based on their global warming potential [
34] per kWh (CO
2E/kWh) of electricity generation. For solar PV technology it is 32 grams [
35], assuming an insolation of 1700 kWh/m
2/year, a performance ratio of 0.8, and a lifetime of 30 years. This value is a lifecycle estimate of GHG per kWh of electricity generation for solar PV systems.
2.3. Other Technical Specifications
Given the non-dispatchable nature of the solar plant, its operation will result in a reduction in generation by the open-cycle and diesel power plants. Hence, in this analysis the amount and the value of the fuel savings are computed on the fuel efficiency of the open-cycle and diesel power plants of approximately 0.246 L of HFO per kWh. For the purposes of this analysis, the assumption made here is that fuel efficiency in terms of HFO use by the highest running cost diesel and OCGT plants are the same per kWh. In most of the smaller utilities in SSA, it will be largely the most inefficient diesel plants that will be cut back in operating time when a more efficient diesel plant or a solar PV plant is introduced. Owing to the degradation of the existing plants, the annual fuel consumption per kWh will increase by 1% per year.
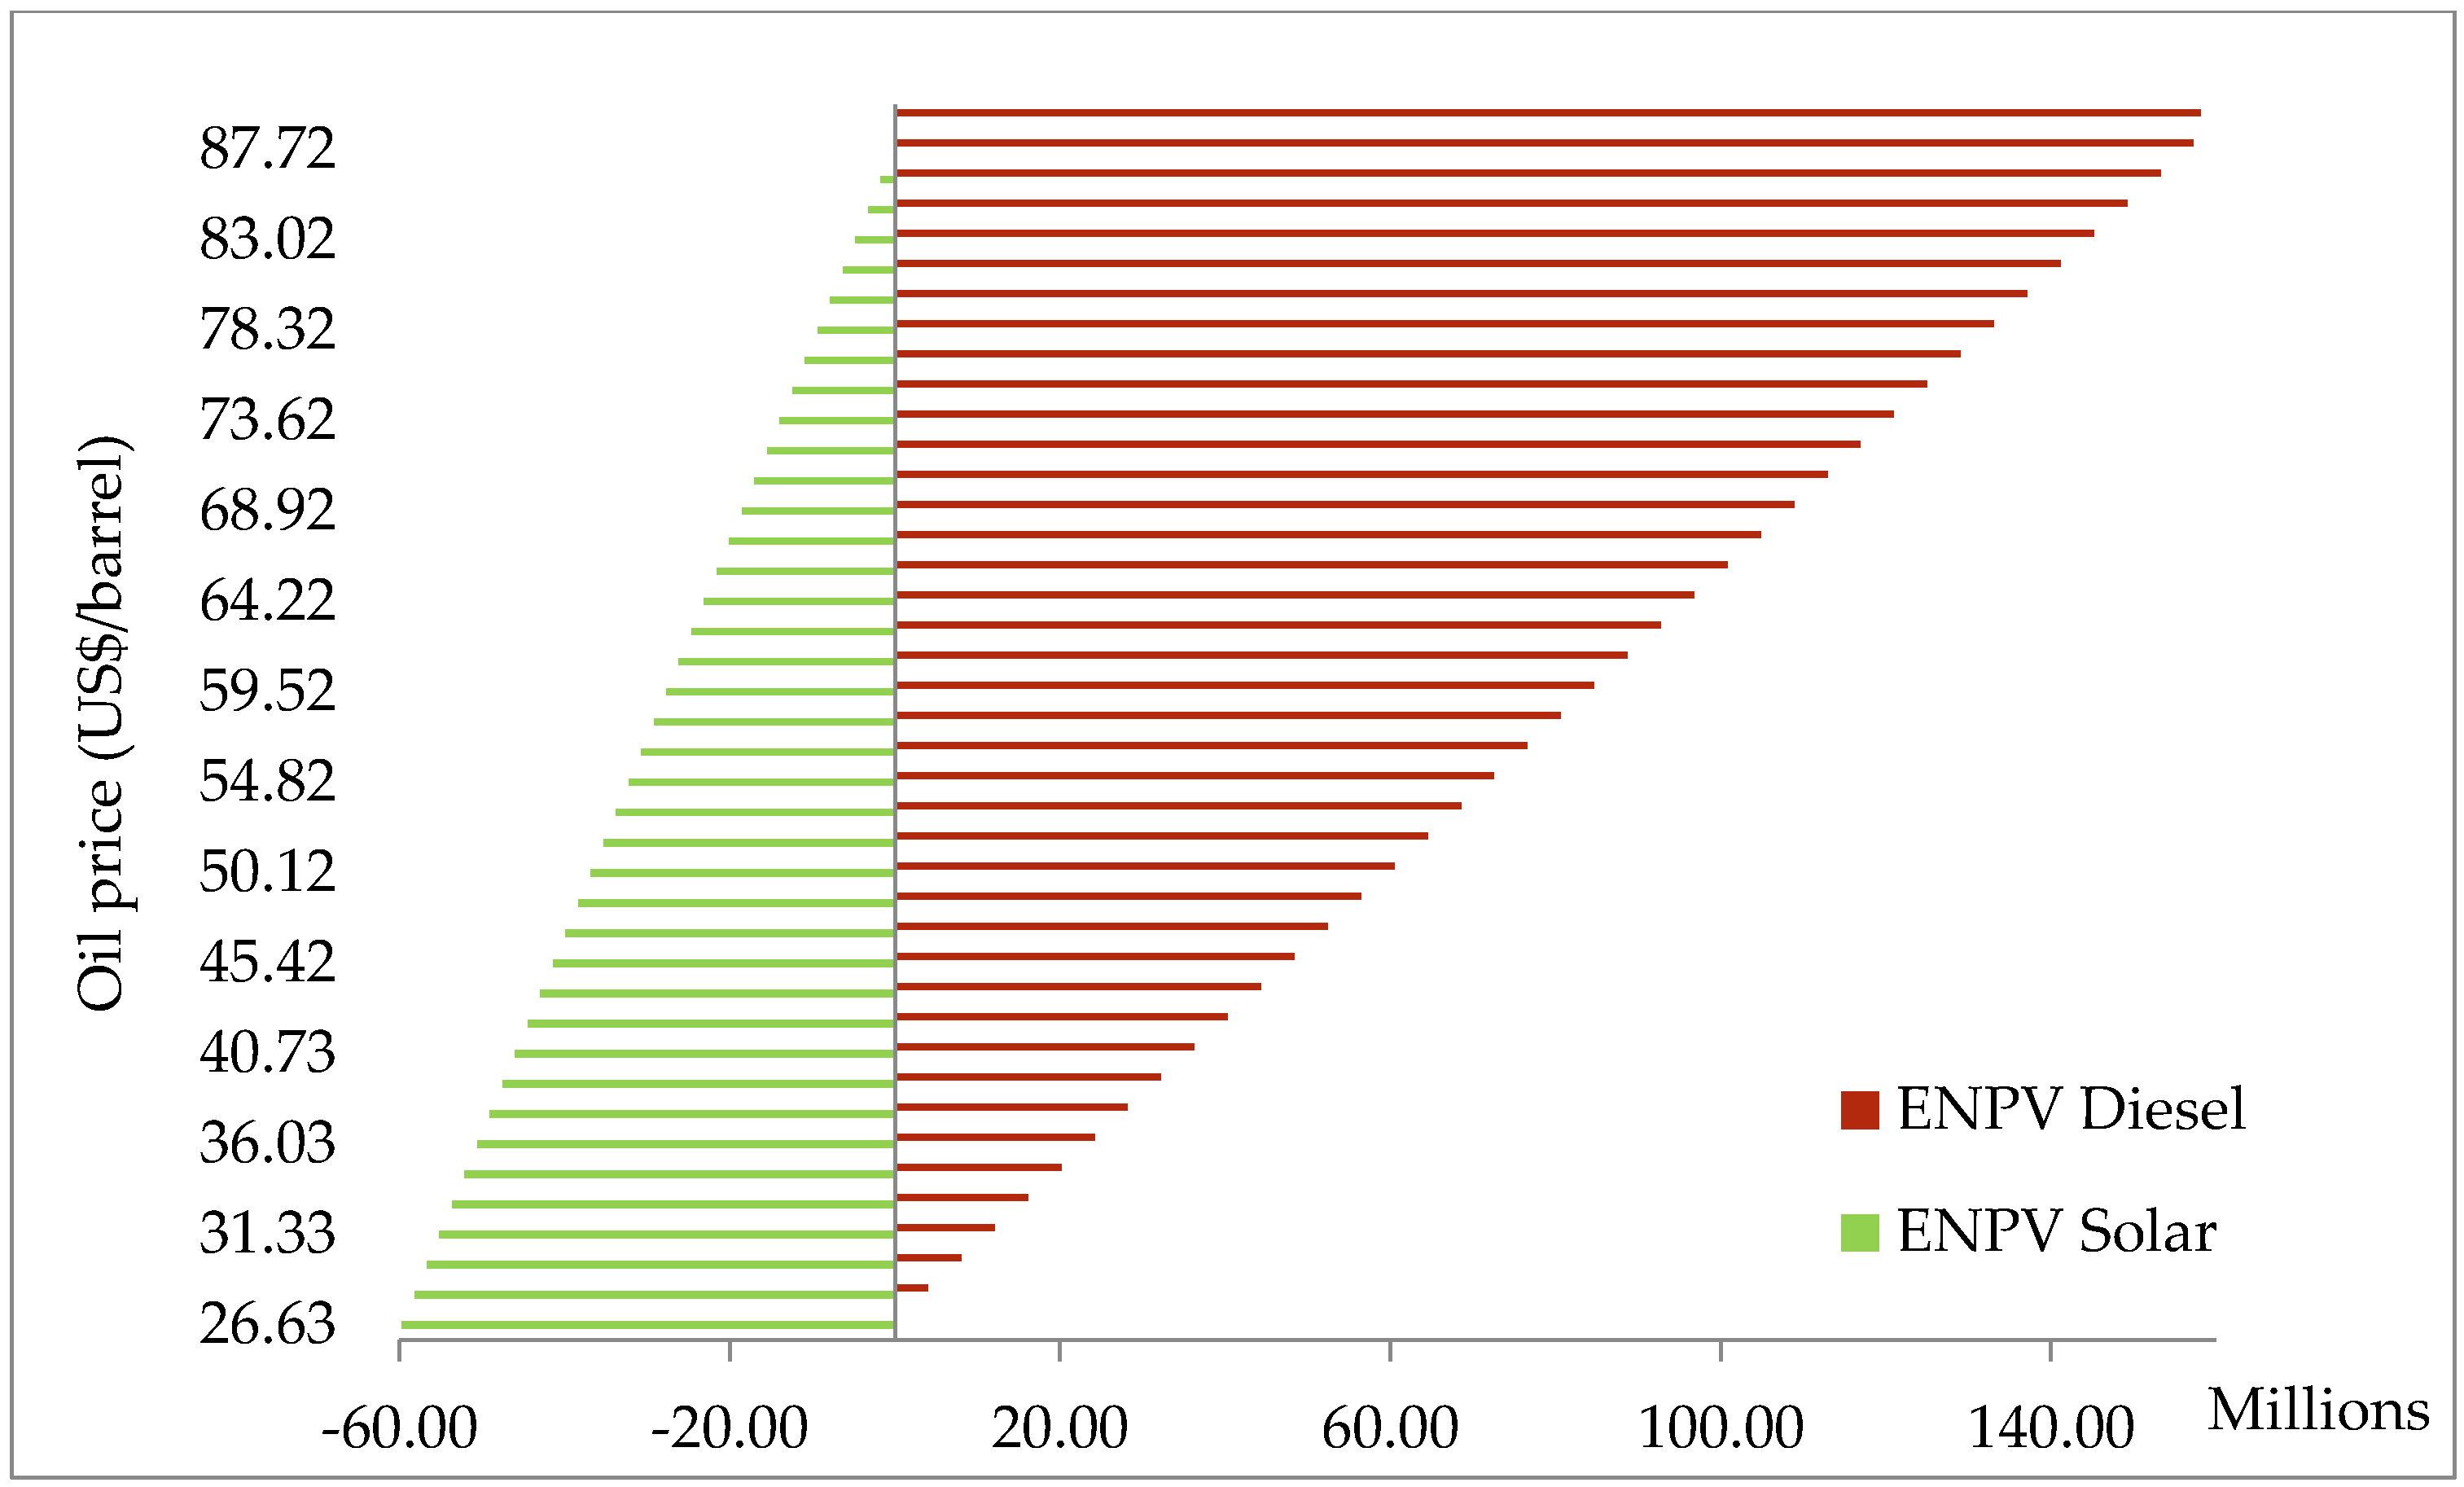
Oil price projections are based on US$454 per tonne (US$71.11 per barrel), which corresponds to the average price for HFO over the past 10 years. The current HFO price is US$ 171 per tonne (US$ 26.79 per barrel) [
41]. Since the projected benefits and costs of the power plants will be spread over a 20-year period, the average oil price for the last 10 years is taken as an estimate of oil price. For this analysis, the real price of crude oil is held constant at this level over the life of the plants. Hence, the delivered cost of HFO will average US$0.78 per L, expressed in 2016 prices.
The carbon dioxide equivalent per kWh of electricity generation using HFO is 778 grams. This value is a lifecycle estimate of GHG per kWh of electricity generation using HFO for various types of generators and turbines [
42]. The lifecycle estimate of GHG per litre of burning HFO to generate electricity is 3.126 kg. This value is obtained by using CO
2 emission factors based on fuel mass or volume, CH
4 and N
2O emission factors by fuel type and sector [
43], and Global Warming Potential (GWP) factors [
44]. Only CO
2, CH
4, and N
2O gases are used in calculating CO
2E because over 99% of the total CO
2E is due to CO
2 emissions [
43], and other GHGs, such as HFCs, are used as refrigerants, while PFCs and SF6 are used as manufacturing aids in the metal and semi-conductor industry [
44]. The assumption made here is that the lifecycle estimate of GHG per litre of burning HFO to generate electricity will be the same for various types of generators and turbines except for the difference in the energy transformation efficiency.
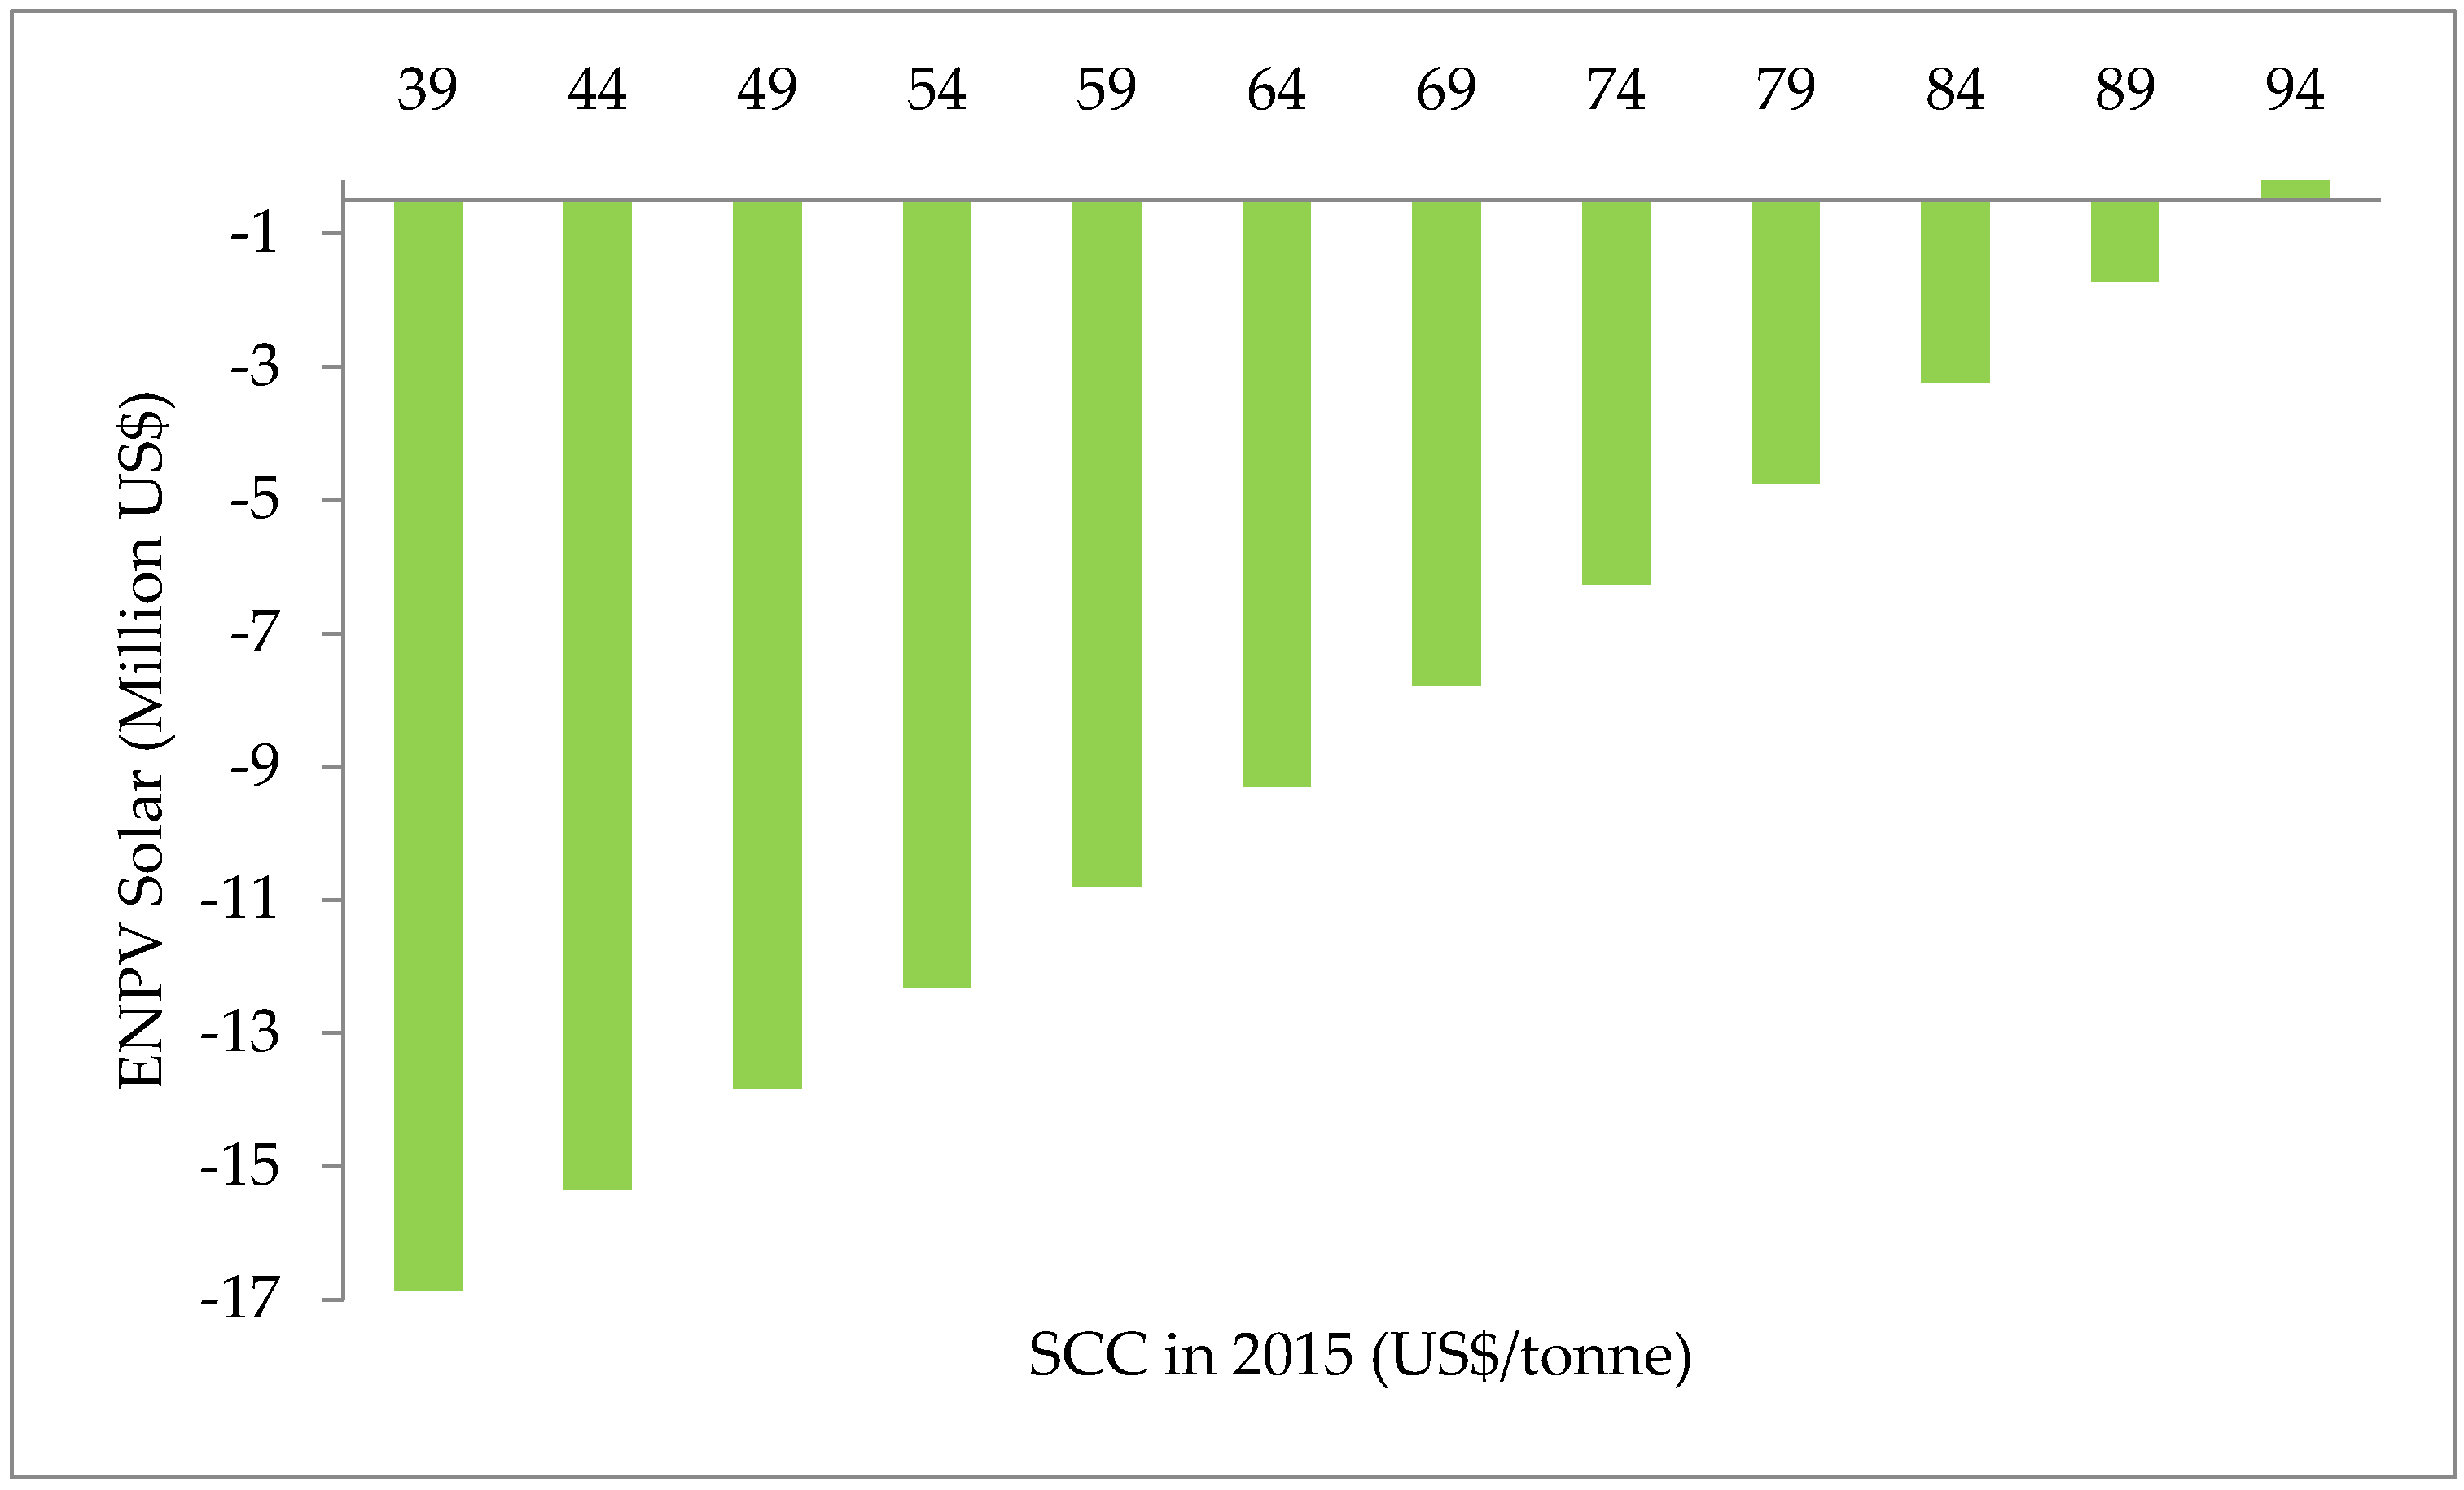
The gross calorific value of HFO is 41.73 MJ/L [
45]. The social cost of carbon emissions (SCC) is taken to be US$39 per tonne for 2015. There is also an upward trend in the SCC of 1.92% a year, as proposed by [
46].
2.4. Economic Benefit Calculation
Solar generation does not eliminate chronic blackouts and brownouts in a system that already has a reserve deficit, as it does not permanently increase the capacity of the system at peak hours. For some daytime hours during the year there will be no sunshine and, hence, no electricity generated. Solar generation replaces the electricity generated by the thermal plants, hence saving fuel. The main benefits of the solar PV plant are the savings on the amount of fuel and the O&M costs of the thermal plant, whose electricity generation it replaces. In this case, the solar PV plant is replacing generation by the OCGT and diesel plants.
A comparison is made in terms of ENPV as well as GHG savings if the same amount of scarce capital were invested in a solar PV facility as in diesel power generation. To make this analysis possible, the expected energy output for each type of power plant is calculated using the parameter values given in
Section 2.1,
Section 2.2 and
Section 2.3. The amount of electricity generated annually by the solar PV system,
ES (kWh), is calculated using the following equation:
where
Pk is the installed peak power, measured in watt-peak (
Wp),
PR is the system performance ratio, and
G is the yearly sum of global irradiation on a tilted plane of the PV module (kWh/m
2/year) [
47]. The performance ratio (PR) is the ratio between the actual and theoretical energy outputs of a solar PV plant. The closer the PR value is to 100%, the more efficiently the respective PV plant is operating. The amount of electricity generated annually by a diesel plant,
Ed (kWh), is calculated using the following equation:
where
NAC is the net available capacity for sale in watts (gross available capacity minus auxiliary usage). The gross available capacity is the available capacity after degradation multiplied by the availability factor.
PLF is the plant load factor, and
h is the number of hours in a year.
The amount of fuel saved and GHG emissions avoided are calculated on the basis of the energy output estimated previously. The amount of fuel saved by the solar PV plant,
FSs (L), is measured by the equation:
where
fex is the fuel requirement needed to generate 1 kWh of energy by existing diesel and thermal plants (L/kWh). The amount of fuel saved by a diesel plant,
FSd (L), is measured by the equation:
where
fd is the fuel requirement needed to generate 1 kWh of energy by a diesel plant (L/kWh) (
, because 1 kWh = 3.6 MJ).
The amount of GHG emissions avoided by a solar PV plant is measured in kilograms and calculated using the following formula:
where
is the carbon dioxide equivalent per kWh of electricity generation using HFO (kg CO2E/kWh) for various types of generator and turbine, and
is the carbon dioxide equivalent per kWh of electricity generation for solar PV technology (kg CO
2E/kWh). The amount of GHG emissions avoided by a diesel plant is measured in kilograms and calculated thus:
where
mlitre is the carbon dioxide equivalent per litre of fossil fuel burned (kg CO
2E/L).
When there are significant power outages, more electricity will be supplied to meet the suppressed demand during these peak periods. These increased sales will not be saving petroleum and GHG emissions but will be providing additional electricity to be consumed. If both technologies are supplying electricity during these peak periods, then the estimates of fuel savings would be somewhat overstated. While on a per kWh basis, the overstatement of fuel savings would be greater for the additional consumption being supplied by the solar PV plant; it is, however, more likely that a larger quantity of the suppressed consumption will be supplied by the new diesel generators as they do not have the reliability problems associated with the solar PV plant.
The expected economic benefit of solar PV and diesel plants is calculated using a cost–benefit analysis approach, making comparisons between the scenarios with and without the projects. Economic benefits, costs, and net present value (NPV) for each plant type can be expressed by the following equations:
where
EBt and
ECt are the economic benefits and costs of the plant,
Pft is the economic cost of fuel per litre,
SOMt is the savings on the variable (non-fuel) O&M cost of the plant it replaces,
SCCt is the social cost of carbon per tonne,
It is the investment cost of the plant,
FOMt is the fixed O&M cost of the plant, and
VOMt is the variable O&M cost of the plant, all at time
t and in US dollars.
EOCK is the economic opportunity cost of capital (%). A 12% economic discount rate is used in this study. This is the discount rate used by international institutions such as USAID and the African Development Bank in the economic analysis of their investment operations in Africa. In addition studies have been carried out to estimate the economic opportunity cost of capital (economic discount rate for countries in Africa) that generally support the use of a 12% discount rate. The results are 11% for South Africa [
48], 12% for Kenya [
49], and 13% for Rwanda [
50]. The countries that are more critically short of capital resources are likely to be facing an even higher economic opportunity cost of funds.
FSt is the amount of fuel saved by the plant in litres at time
t.
GHGet is the amount of GHG emissions avoided by the plant in tonnes at time
t, and
a is a coefficient equal to 0 in analysis from the country’s point of view and to 1 from the global point of view. Finally, a comparison is made between these two power plants (solar and diesel).
The levelized cost of energy (LCOE) per kWh is estimated for both solar PV and diesel plants using the formula:
where
Et is the quantity of electricity produced in year
t in kWh,
r is the discount rate, and
n is the economic operational lifetime of the system.


