Article

H2O2 Based Oxidation Processes for the Treatment of Real High Strength Aqueous Wastes

by
Maria Cristina Collivignarelli
1,
Roberta Pedrazzani
2,
Sabrina Sorlini
3,
Alessandro Abbà
1,* and
Giorgio Bertanza
3
1
Department of Civil Engineering and Architecture, University of Pavia, via Ferrata 1, 27100 Pavia, Italy
2
Department of Mechanical and Industrial Engineering, University of Brescia, via Branze 38, 25123 Brescia, Italy
3
Department of Civil, Environmental, Architectural Engineering and Mathematics, University of Brescia, via Branze 43, 25123 Brescia, Italy
*
Author to whom correspondence should be addressed.
Sustainability 2017, 9(2), 244; https://doi.org/10.3390/su9020244
Submission received: 1 December 2016 / Revised: 25 January 2017 / Accepted: 7 February 2017 / Published: 10 February 2017
(This article belongs to the Section Environmental Sustainability and Applications)

Abstract

:
This work was aimed at studying the applicability of H2O2-based oxidation processes (namely H2O2/UV, photo-Fenton, and Fenton) for the treatment of six real aqueous wastes. These wastes derived from chemical, pharmaceutical, and detergent production, and were characterised by high COD (chemical oxygen demand) and, in four cases, surfactant concentrations: overall, about 100 tests were conducted. The H2O2/UV and photo-Fenton processes proved to be very effective in COD removal, the efficiency being greater than 70%. The optimal treatment conditions for the H2O2/UV process were: 120 min reaction, H2O2/CODinitial dosage ratio = 1/2; the radiation intensity (up to 2000 W·L−1) revealed to be a crucial factor, especially in the earlier stage of the process (about 40 min): this aspect can be exploited to reduce the costs related to energy consumption. For the photo-Fenton process the following conditions were chosen: Fe2+/H2O2 ratio = 1/30; specific power input = 125 W·L−1; H2O2/CODinitial = 1/2; reaction time = 240 min. Photolytic reactions and the presence of dissolved oxygen revealed to be crucial factors for COD removal. The Fenton process, while showing a moderate efficiency (25% COD removal) in the treatment of high loaded wastewaters, provided excellent results in the treatment of aqueous wastes with high content of surfactants. An average yield removal of 70% for non-ionic surfactants (TAS) and 95% for anionic surfactants (MBAS) was obtained, under the following optimal conditions: Fe2+/H2O2 = 1/4, H2O2/CODinitial ratio = 1, and contact time = 30 min.

1. Introduction

Industrial aqueous wastes are significantly heterogeneous, even within the same factory, their characteristics changing by time, depending on the ongoing production activities. This poses a challenge for their treatment, there being three alternatives: (a) advanced biological processes, which may be able to treat high organic loads with a typical operational stability [1,2,3] and a very low sludge production [1,4]; (b) advanced chemical processes [5,6,7,8,9]; (c) or a combination of both [4,10,11]. In the past, chemical oxidation has been used for reducing the concentrations of residual organics, removing ammonia, controlling odors, and for disinfection purposes. Nowadays, chemical oxidation processes are recommended for improving the biological treatability of refractory organic compounds and reducing the inhibitory effects of specific substances towards the microbial growth [12,13].
The present research was focused on the application of some advanced oxidation processes (AOPs) for the treatment of high strength industrial aqueous wastes. These processes combine several oxidants and/or physical treatments, such as ultraviolet light and ultrasonic irradiation with or without the use of chemical catalysts. AOPs are based on the formation of hydroxyl radicals (OH), which promote radical chain reactions leading to the destruction of aromatic compounds, adsorbable organic halogen (AOX), detergents, pesticides, azo dyes, and phenols [5,6,12,14,15,16,17,18,19,20].
UV radiation is often used in combination with O3, H2O2, Fenton’s (H2O2/Fe2+) reagent and TiO2 catalyst to accelerate the radical formation and, thus, cause an indirect photolysis [21]. UV-based processes are negatively affected by high turbidity and intensive colour of wastewater [14].
In the UV/H2O2 combined process, the UV radiation activates H2O2, finally leading to the formation of the OH radical formation [22,23]. The effectiveness of the UV/H2O2 process depends on various conditions that affect its ability to degrade organic molecules. These conditions include the type and the concentration of the organic contaminants or dissolved inorganics (such as carbonates and metallic cations), light transmittance of the solutions, pH, temperature, and hydrogen peroxide dosage. An excessive concentration of H2O2 would act as a radical scavenger reducing the rate of oxidation, while a too low H2O2 dosage brings to an insufficiently hydroxyl radicals formation, thus decreasing the oxidation rate. The UV/H2O2 process is sensitive to the scavenging effects of carbonate ions for pH values in the range 8–9 [7,18].
The Fenton process has been the most widely used AOP [24] for wastewater treatment due to its simplicity in terms of equipment and management operation. However, it presents some disadvantages such as the production of chemical sludge, the high acid consumption for decreasing the pH (especially in case of high alkalinity wastewaters), the high concentrations of chloride and sulphate ions (depending on the kind of ferrous salt used) in the treated waste and the significant operating costs, due to sludge disposal and hydrogen peroxide consumption.
Fenton and H2O2/UV processes involve a significant ferrous salt dosage and a high energy consumption, respectively.
The photo-Fenton process (i.e., the Fenton process with additional exposure to UV radiation) overcomes these drawbacks. The reactions involved in this process are the following [7]:
Fe2+ + H2O2 → Fe3+ + OH + OH
Fe3+ + H2O + hν → Fe2+ + OH + H+
The two oxidation-reduction reactions occur repeatedly until complete mineralization of the organic pollutants to CO2 and H2O is achieved [7]. The main advantage of the photo-Fenton process compared to the Fenton one lies in the important reduction of reagent consumption and sludge production.
Notwithstanding the huge mole of literature findings, which underline the combined influence of several parameters on process efficiency (temperature, pH, reagent dosage, inorganic salts concentration, etc.) and suggest possible reaction mechanisms [7,11,25,26], the applicability of AOPs to real wastewater is still an open issue. Therefore, any hypothesis has to be fully validated by means of experimental tests that must be carried out under conditions which must be as close as possible to the real ones. In particular, the composition of the wastewater represents a crucial factor: hence, the real wastes to be treated should be used at this scope, instead of synthetic solutions (which use is more appropriate for theoretical investigations).
The present work was aimed at testing three AOPs (namely H2O2/UV, Fenton and photo-Fenton) for the pre-treatment, upstream a biological process, of six high strength aqueous wastes, four of them also being characterised by a high content of anionic and non-ionic surfactants. Case by case, the preferable treatment process and the optimal operating conditions were defined. Results are thought to be of general interest for practitioners facing the problem of treating such kinds of real wastewaters.

2. Materials and Methods

2.1. Aqueous Wastes

Six aqueous wastes were submitted to chemical oxidation tests (Table 1). Two of them (aqueous wastes 1, A.W.#1, and 2, A.W.#2) were treated in the phase I of the experimentation. These wastes derived from a pharmaceutical and a chemical factory, respectively. Both show high concentration of organic matter (COD up to >200,000 mg·L−1). The main components of A.W.#1 were methanol (70,000 mg·L−1), acetone (50,000 mg·L−1), and aromatic solvents (110,000–120,000 mg·L−1). The main organic substances in A.W.#2 were: acetone (75% vol.), dimethylformamide (23.5% vol.) and acetic acid (1.5% vol.).
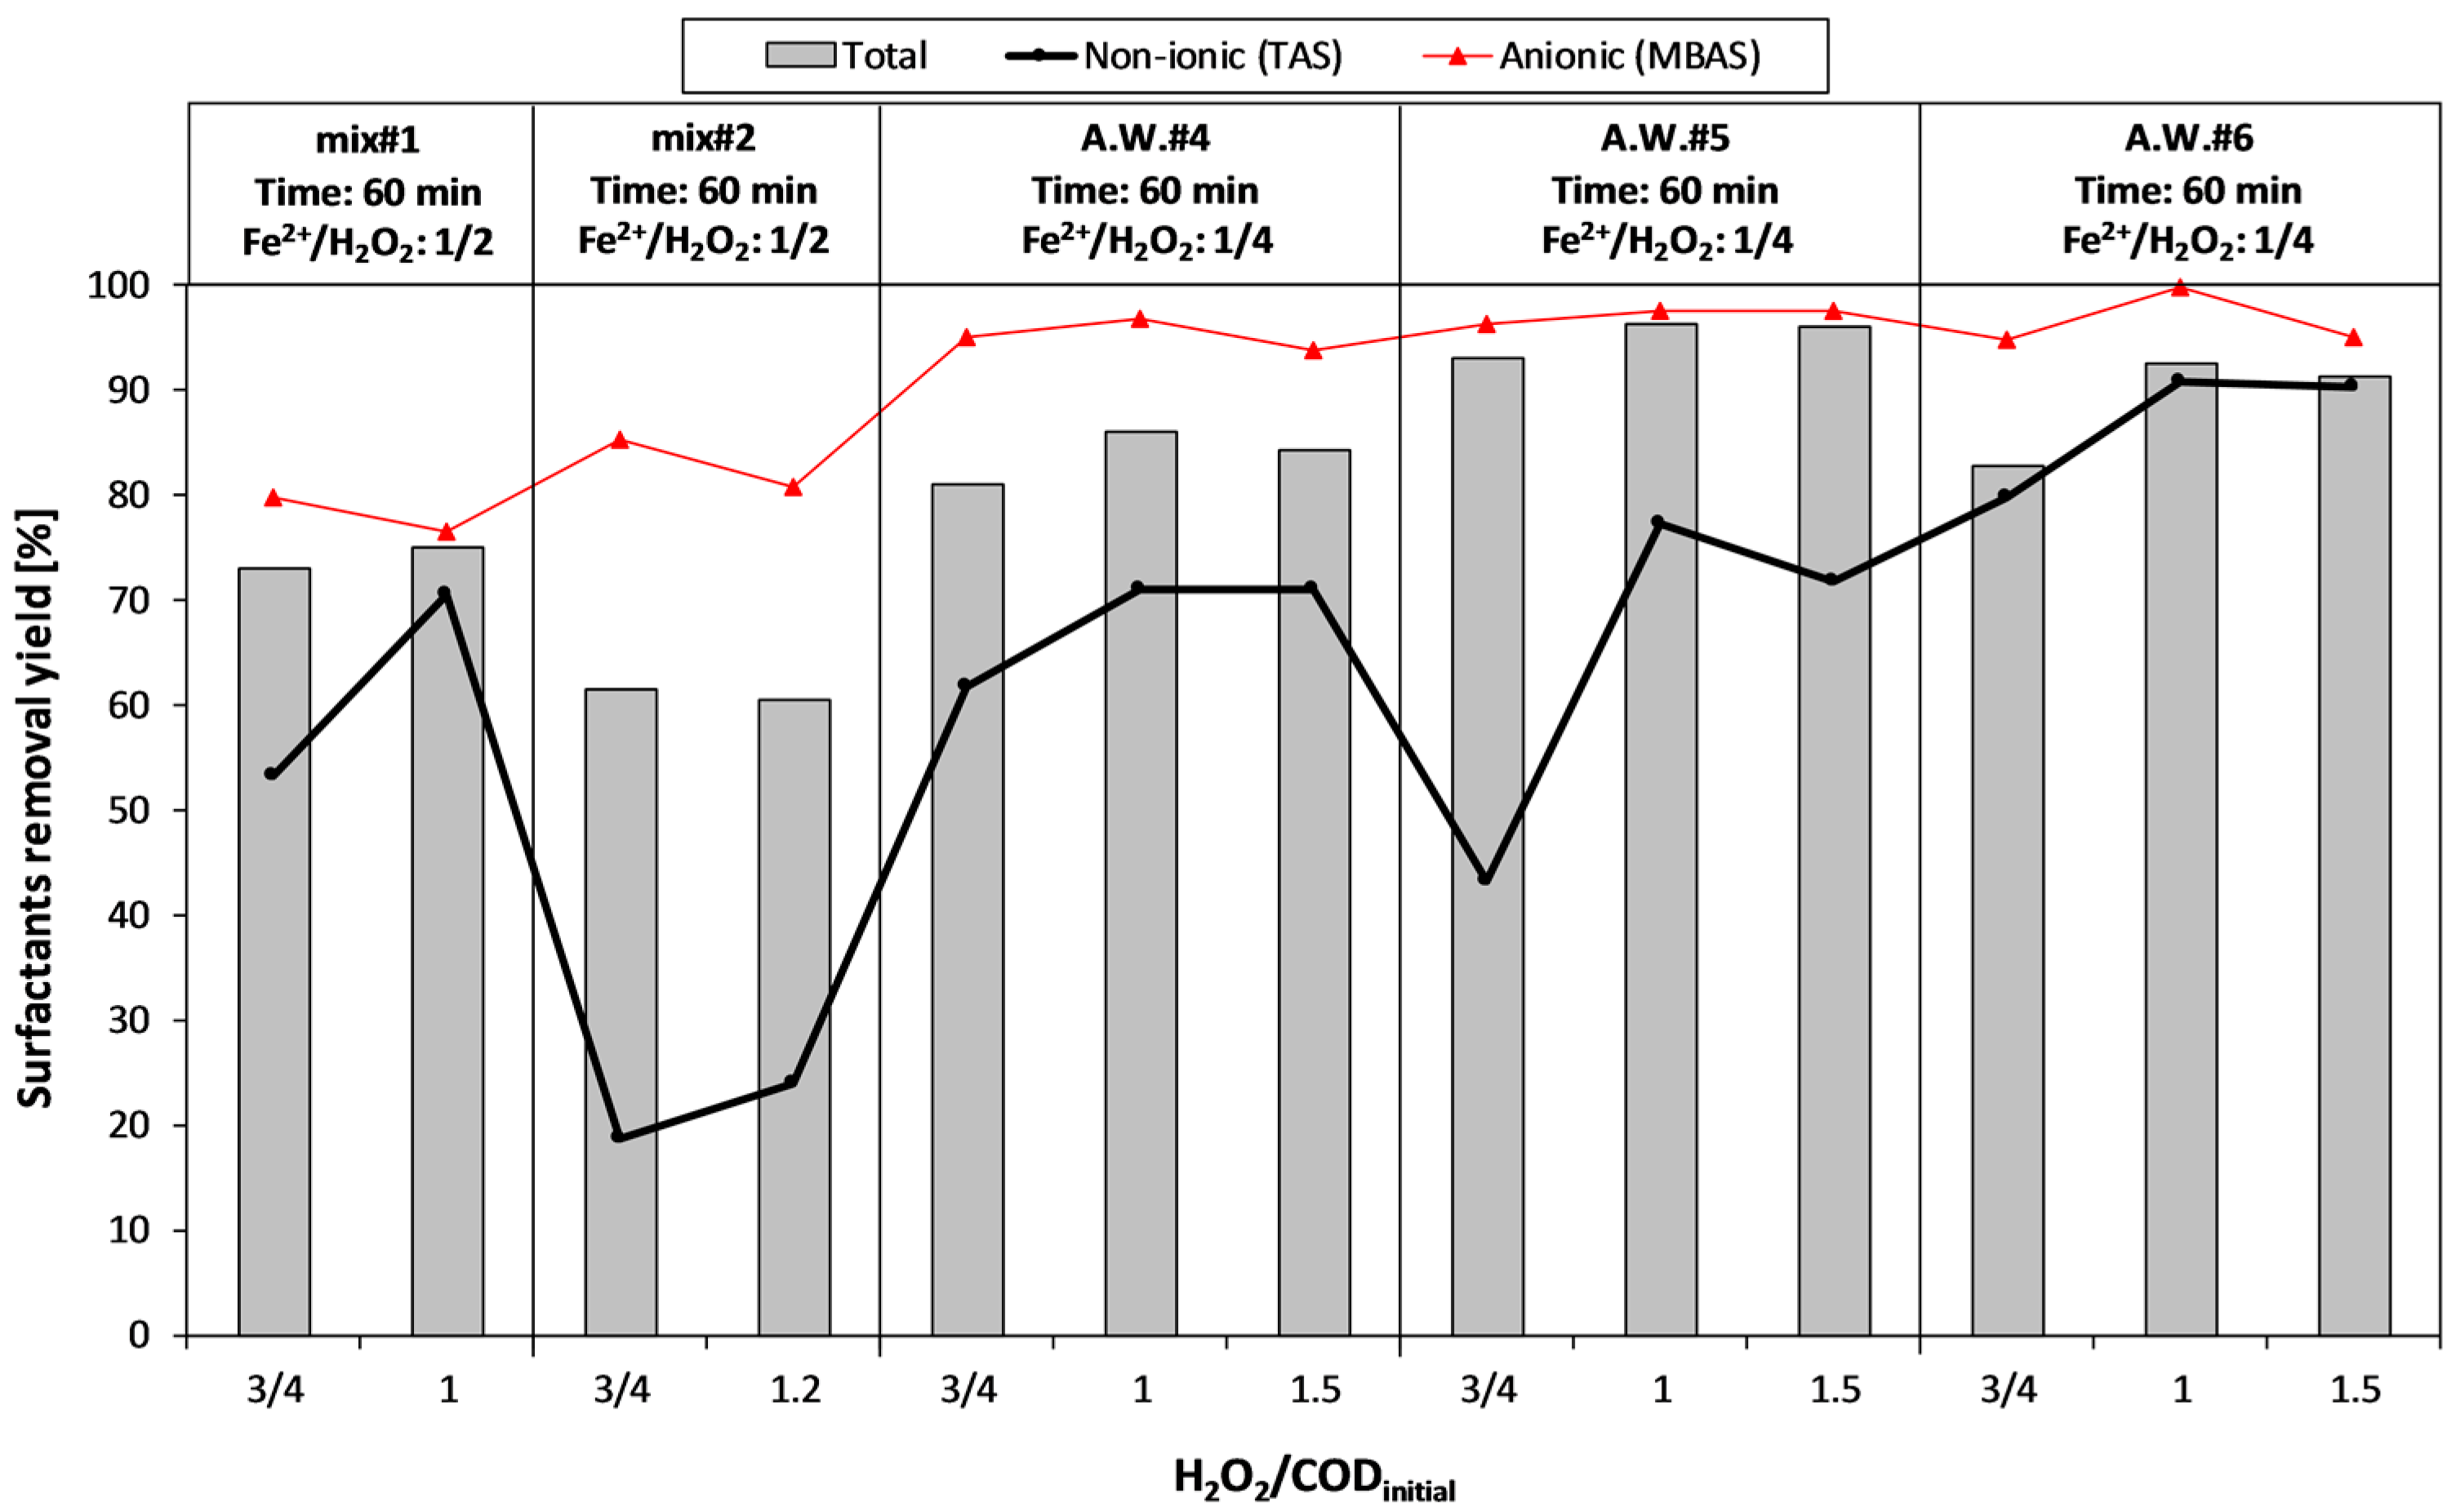
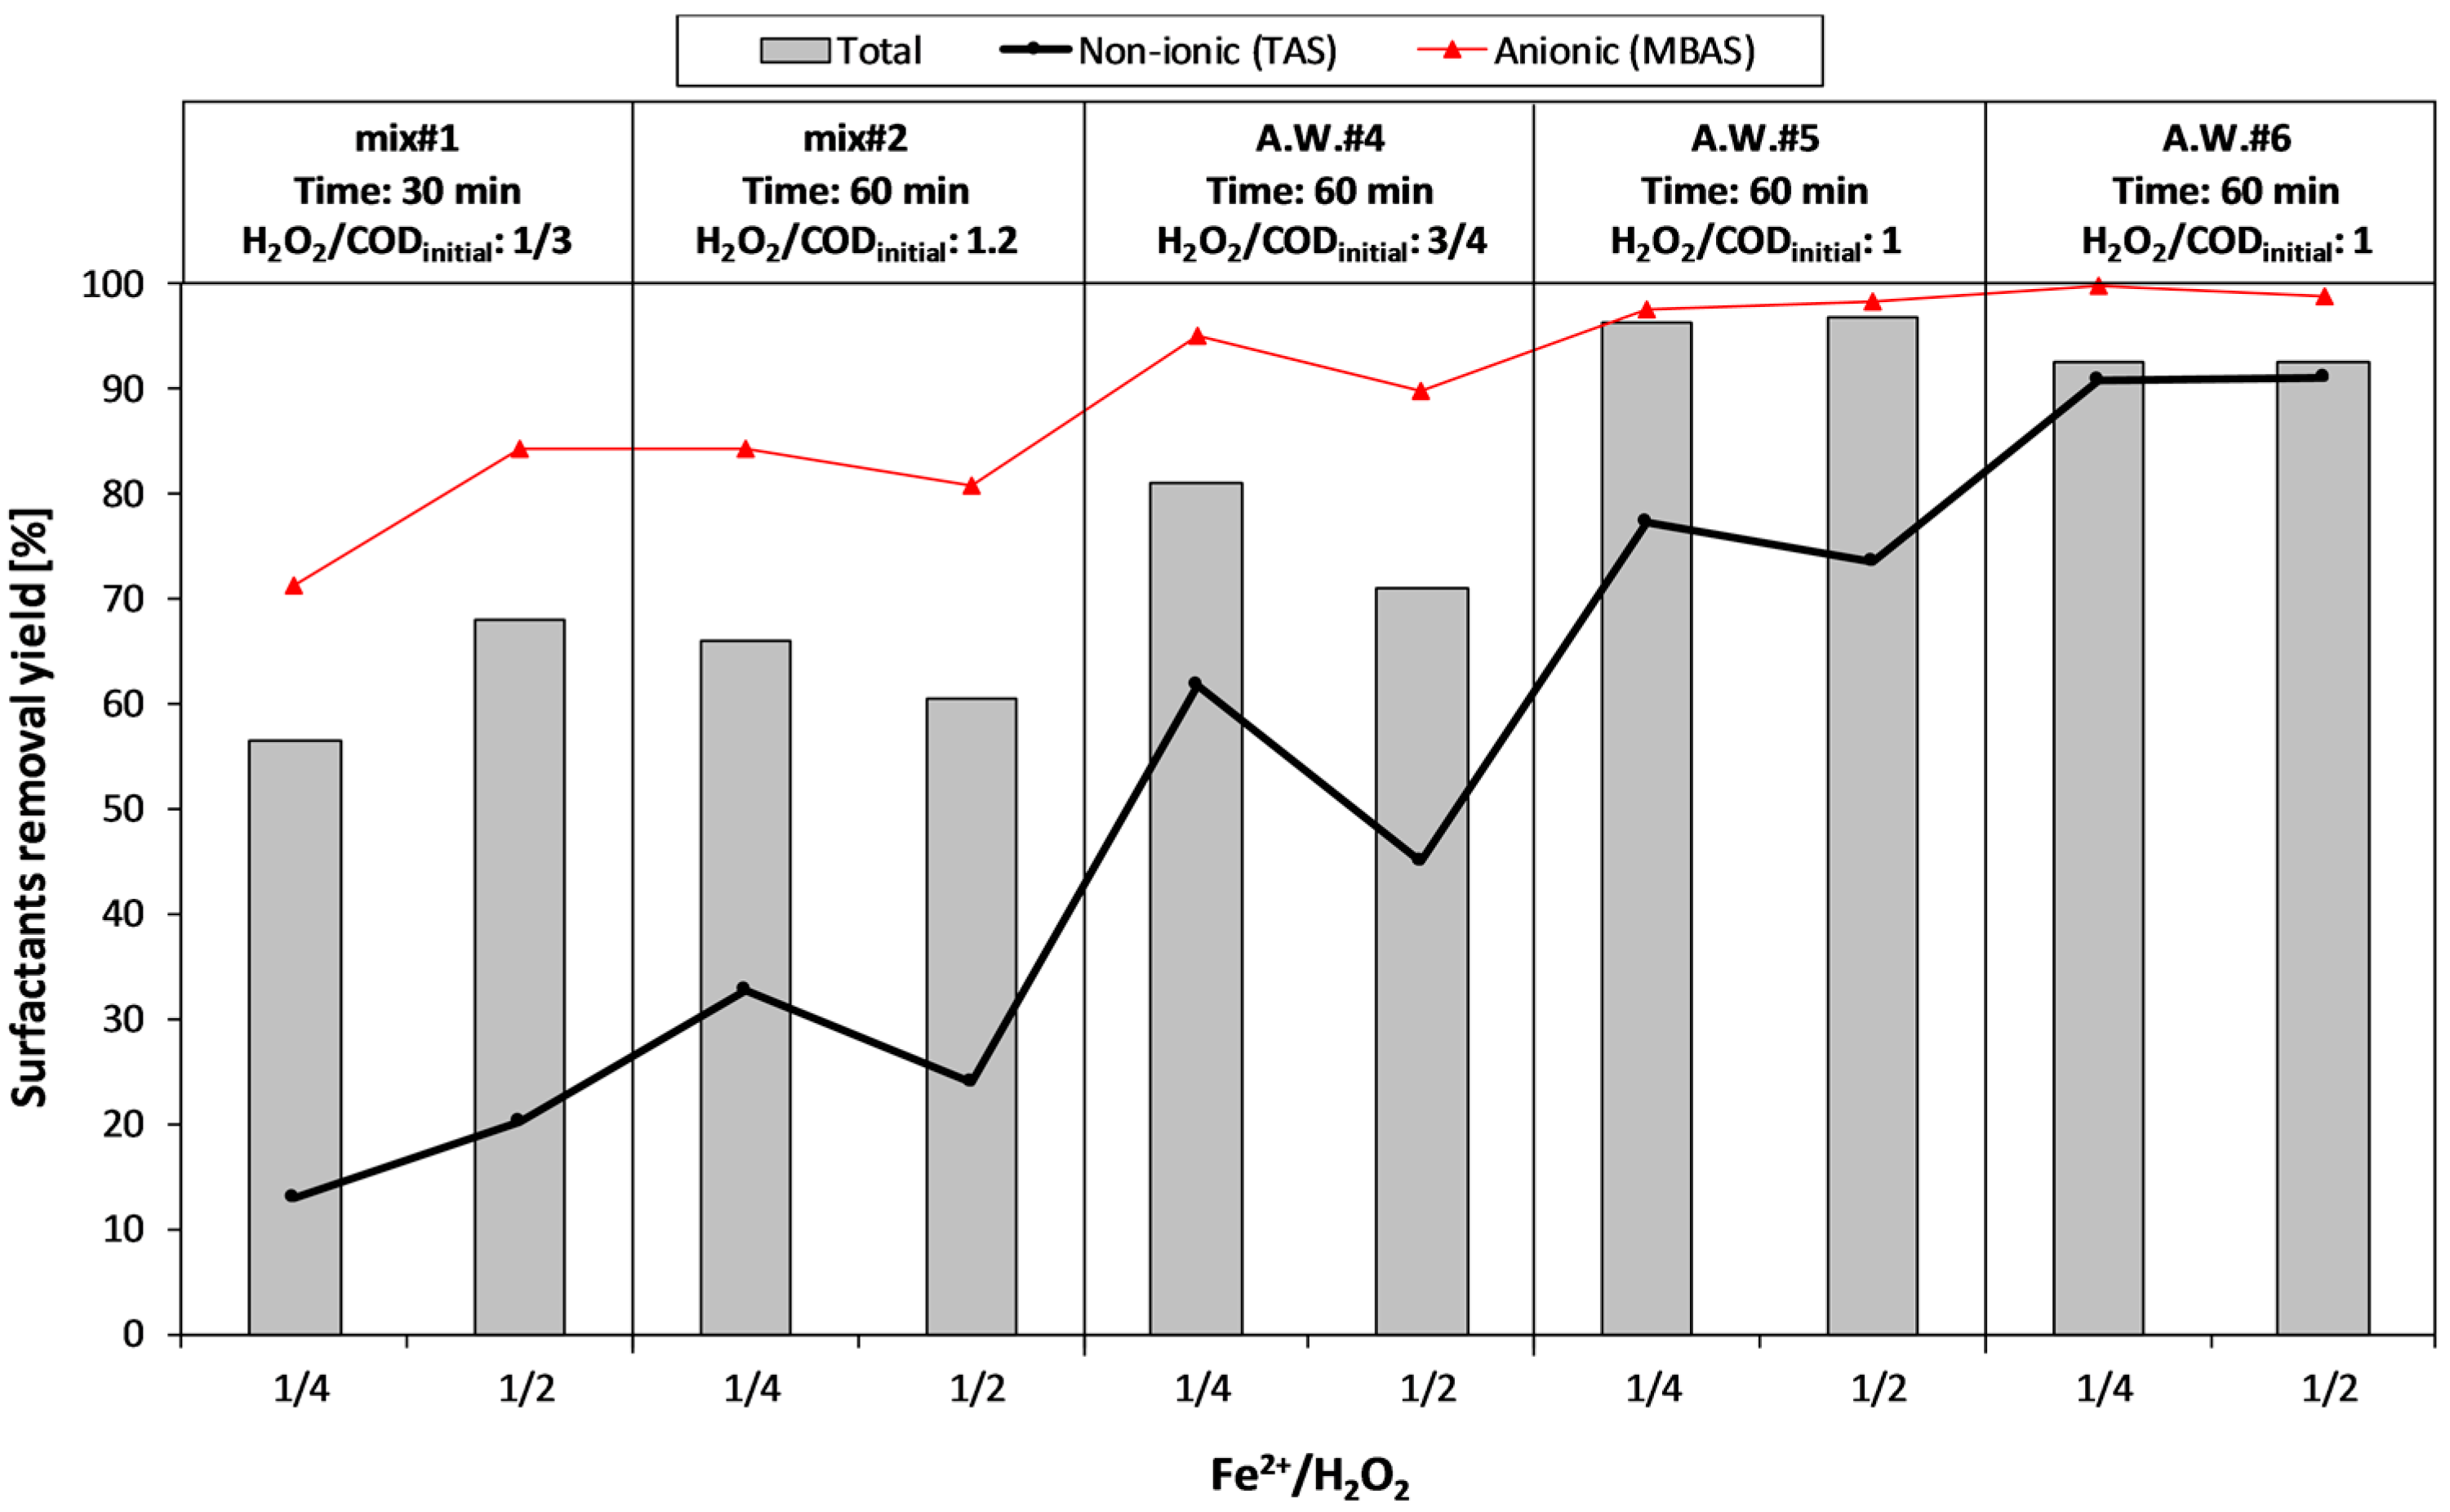
During the second experimental period (phase II), mainly focused on surfactant removal, four aqueous wastes deriving from the detergents production were treated. In this case, together with very high COD concentrations, a significant presence of anionic (MBAS) and non-ionic (TAS) surfactants (up to 13,000 and 17,000 mg·L−1, respectively) was measured. In order to reduce the acid dosage during the Fenton treatment, A.W.#3 was mixed with an acidic aqueous waste (COD = 30,000 mg·L−1, pH < 1.5), thus obtaining two mixtures: mix#1 (83% A.W.#3 + 17% acidic waste) and mix#2 (17% A.W.#3 + 83% acidic waste).
For some of the studied wastewaters, the biodegradability (as appears from the BOD5/COD ratio) was relatively high, thus suggesting the biological treatability also without the need of a chemical pre-treatment. Nevertheless, BOD measurements are obtained after the dilution of the samples. Indeed, in real applications, this is not the case: the so high level of contamination, poses serious problems to the biomass and microfauna of the activated sludge plant, in terms of metabolic inhibition (namely the nitrification process) and sludge settle-ability [27,28,29]. The results of OUR (Oxygen Uptake Rate) tests carried out on the aqueous wastes (the values obtained vary from 3.7 to 4.2 mgO2 gVSS−1·h−1, with respect to the exogenous value of 4.5 ± 0.7 mgO2 gVSS−1·h−1) clearly demonstrated this. These troubles may be even emphasized by surfactants. Therefore, a chemical pre-treatment might be a proper choice.

2.2. Pilot Scale Plants

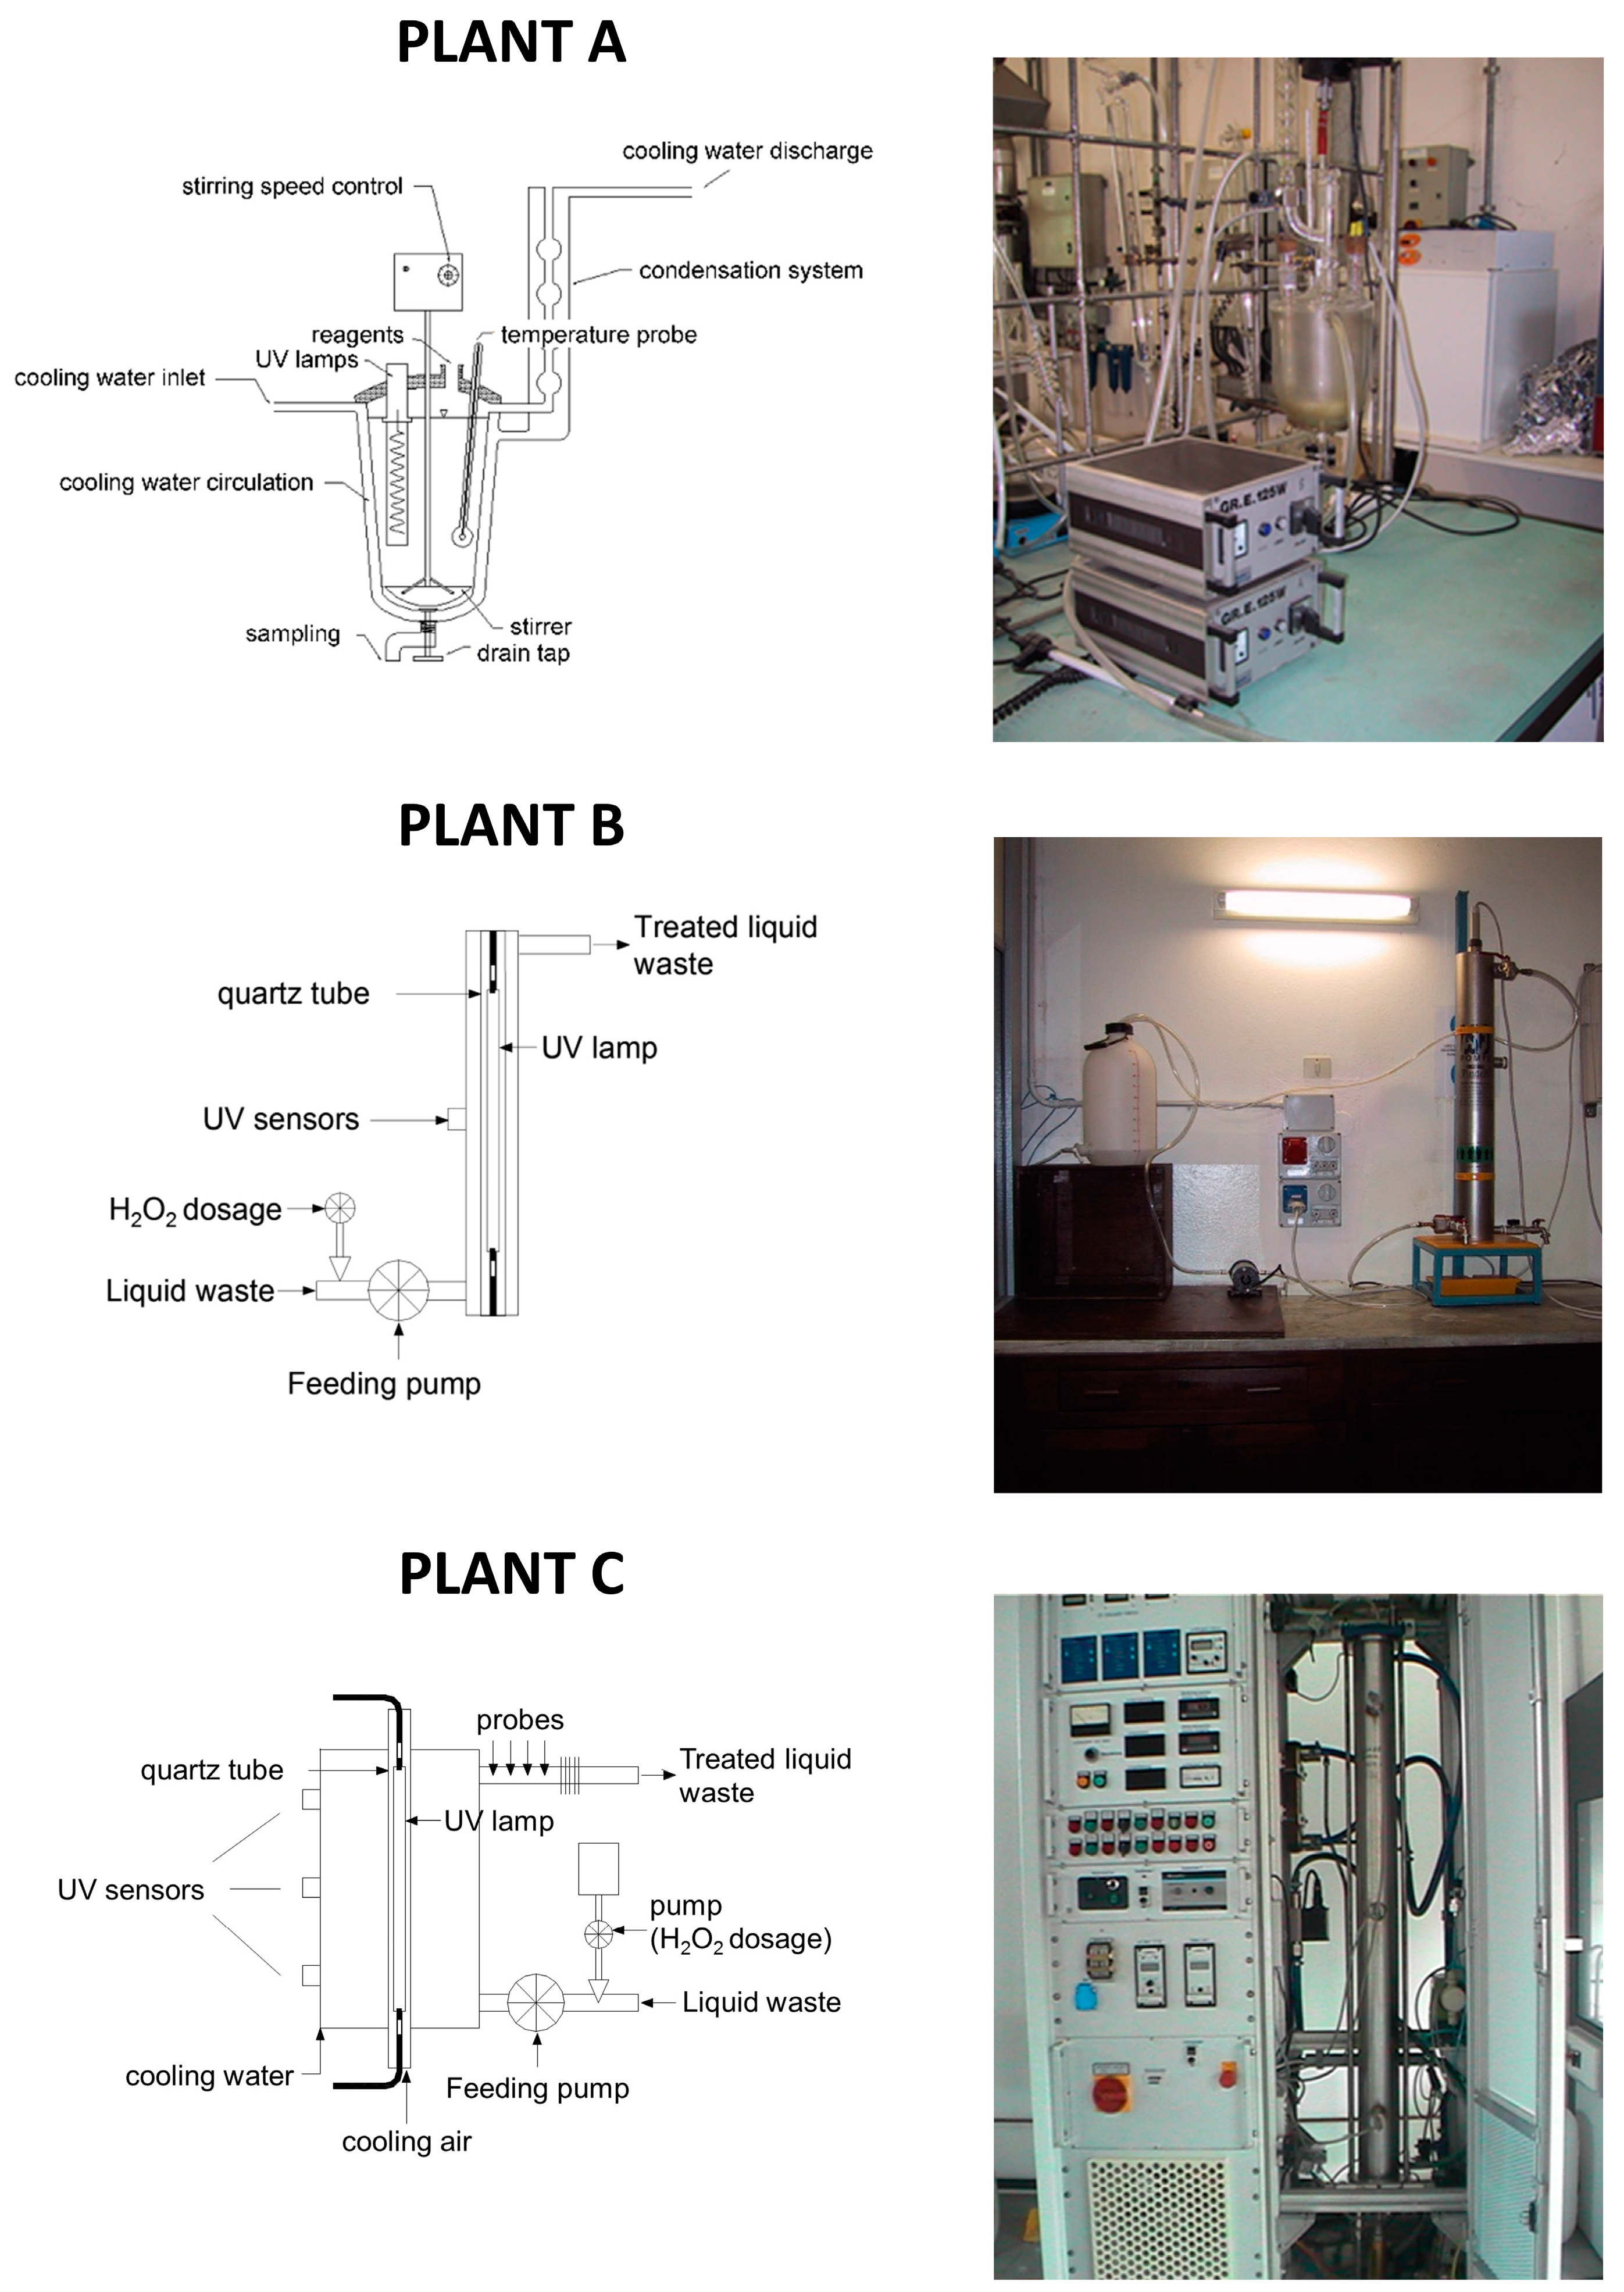
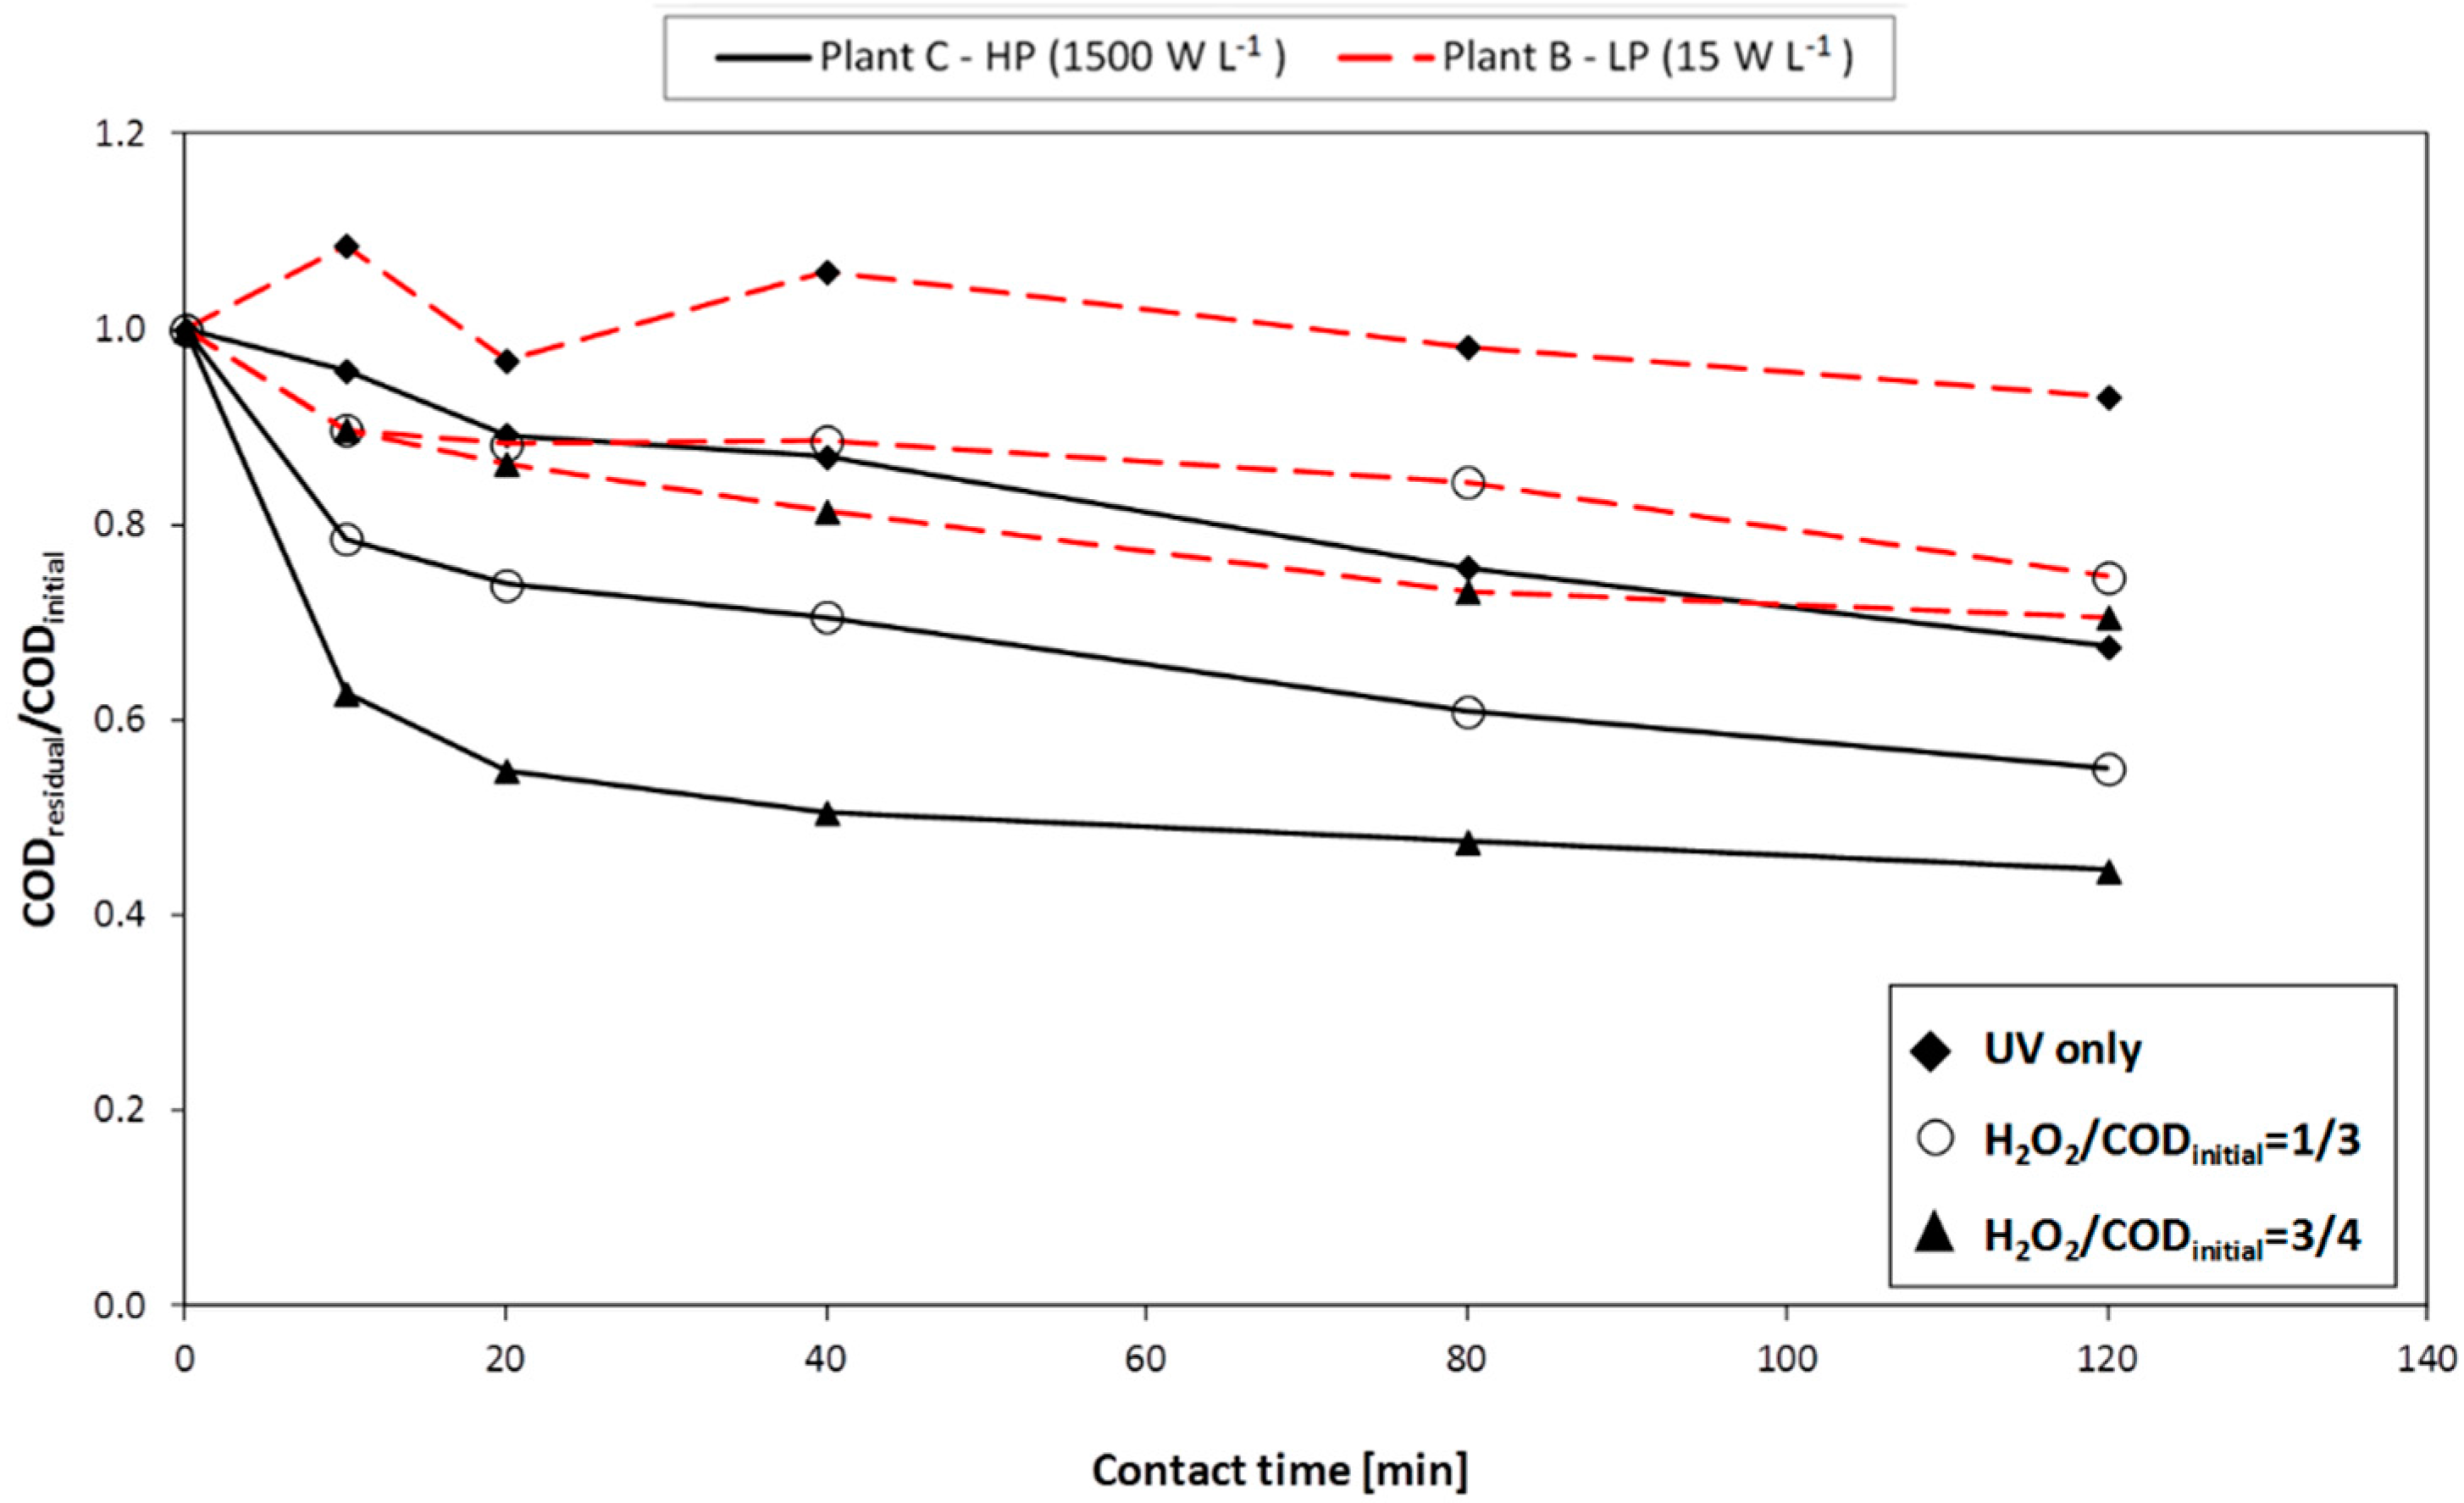
Photo-Fenton and H2O2/UV tests were carried out by means of three different plants (A, B, and C, respectively) with the aim of studying the influence of the UV lamp type (having different energy consumption and emission spectrum) and the reactor shape/geometry, both on the atmospheric oxygen transfer and on process performance. H2O2/UV tests were conducting using all the three plants; photo-Fenton tests were performed on plants A and B.
The main characteristics of the pilot scale plants (Figure 1) are reported below.
  • Plant A consists of a 2 L glass reactor; the cover is welded and a discharge valve is placed on the bottom. An external jacket connected to a cryostat is used for cooling the system. On the central cone a stirring device is applied. In the lateral cone two medium-high-pressure UV lamps are placed: each lamp has a power of 125 W (emission spectrum: 280–400 nm).
  • Plant B consists of AISI 316L stainless steel photo-reactor (8 L volume), containing one UV lamp. During the experimental work, two different kinds of lamp were used: the first is a low-pressure lamp with a power of 36 W (emission spectrum: 254 nm); the second is similar but with a power of 120 W. The following advantages may be ascribed to the use of low-pressure lamps: low surface temperature (40–50 °C), high power conversion efficiency (35%–40% of electric energy is converted into useful UV energy) and long duration (8000–10,000 h).
  • Plant C consists of: an AISI 316L stainless steel photo-reactor (10 L volume), a high-pressure UV lamp (power: 10–30 kW; emission spectrum: 200–700 nm), a feeding pump (with flowrate adjustable from 2 to 10 L·min−1), a pump for H2O2 dosage (flowrate adjustable up to 8 mL·min−1), probes for the measurement of flowrate, electrical conductivity, pH, redox potential, and temperature. The UV lamp used in this plant simulates solar radiation.
As regards the Fenton process, each test was carried out with the use of 1 L flask, rapidly mixed (by means of a magnetic stirrer).

2.3. Experimental Tests

During phase I, the high COD aqueous wastes (A.W.#1 and A.W.#2) were submitted to H2O2/UV, photo-Fenton and Fenton processes. During phase II, the Fenton process was tested for the treatment of A.W.#3 to #6, which were characterised by high concentrations of surfactants (see Table 1).
In Table 2 and Table 3 (which concerns the phase I and phase II, respectively) the operating conditions (oxidant dosage, plant used, reaction time) of all tests carried out during the experimental work are reported. The dosage of reagents is reported in terms of absolute concentrations and weight ratio between reagents (H2O2/CODinitial and Fe2+/H2O2). The aqueous wastes were diluted in order to limit the amount of reagents and simplify the experimental procedures at the laboratory scale: the concentrations of reagents shown in Table 2 and Table 3 are those actually employed for treating the diluted wastewaters.
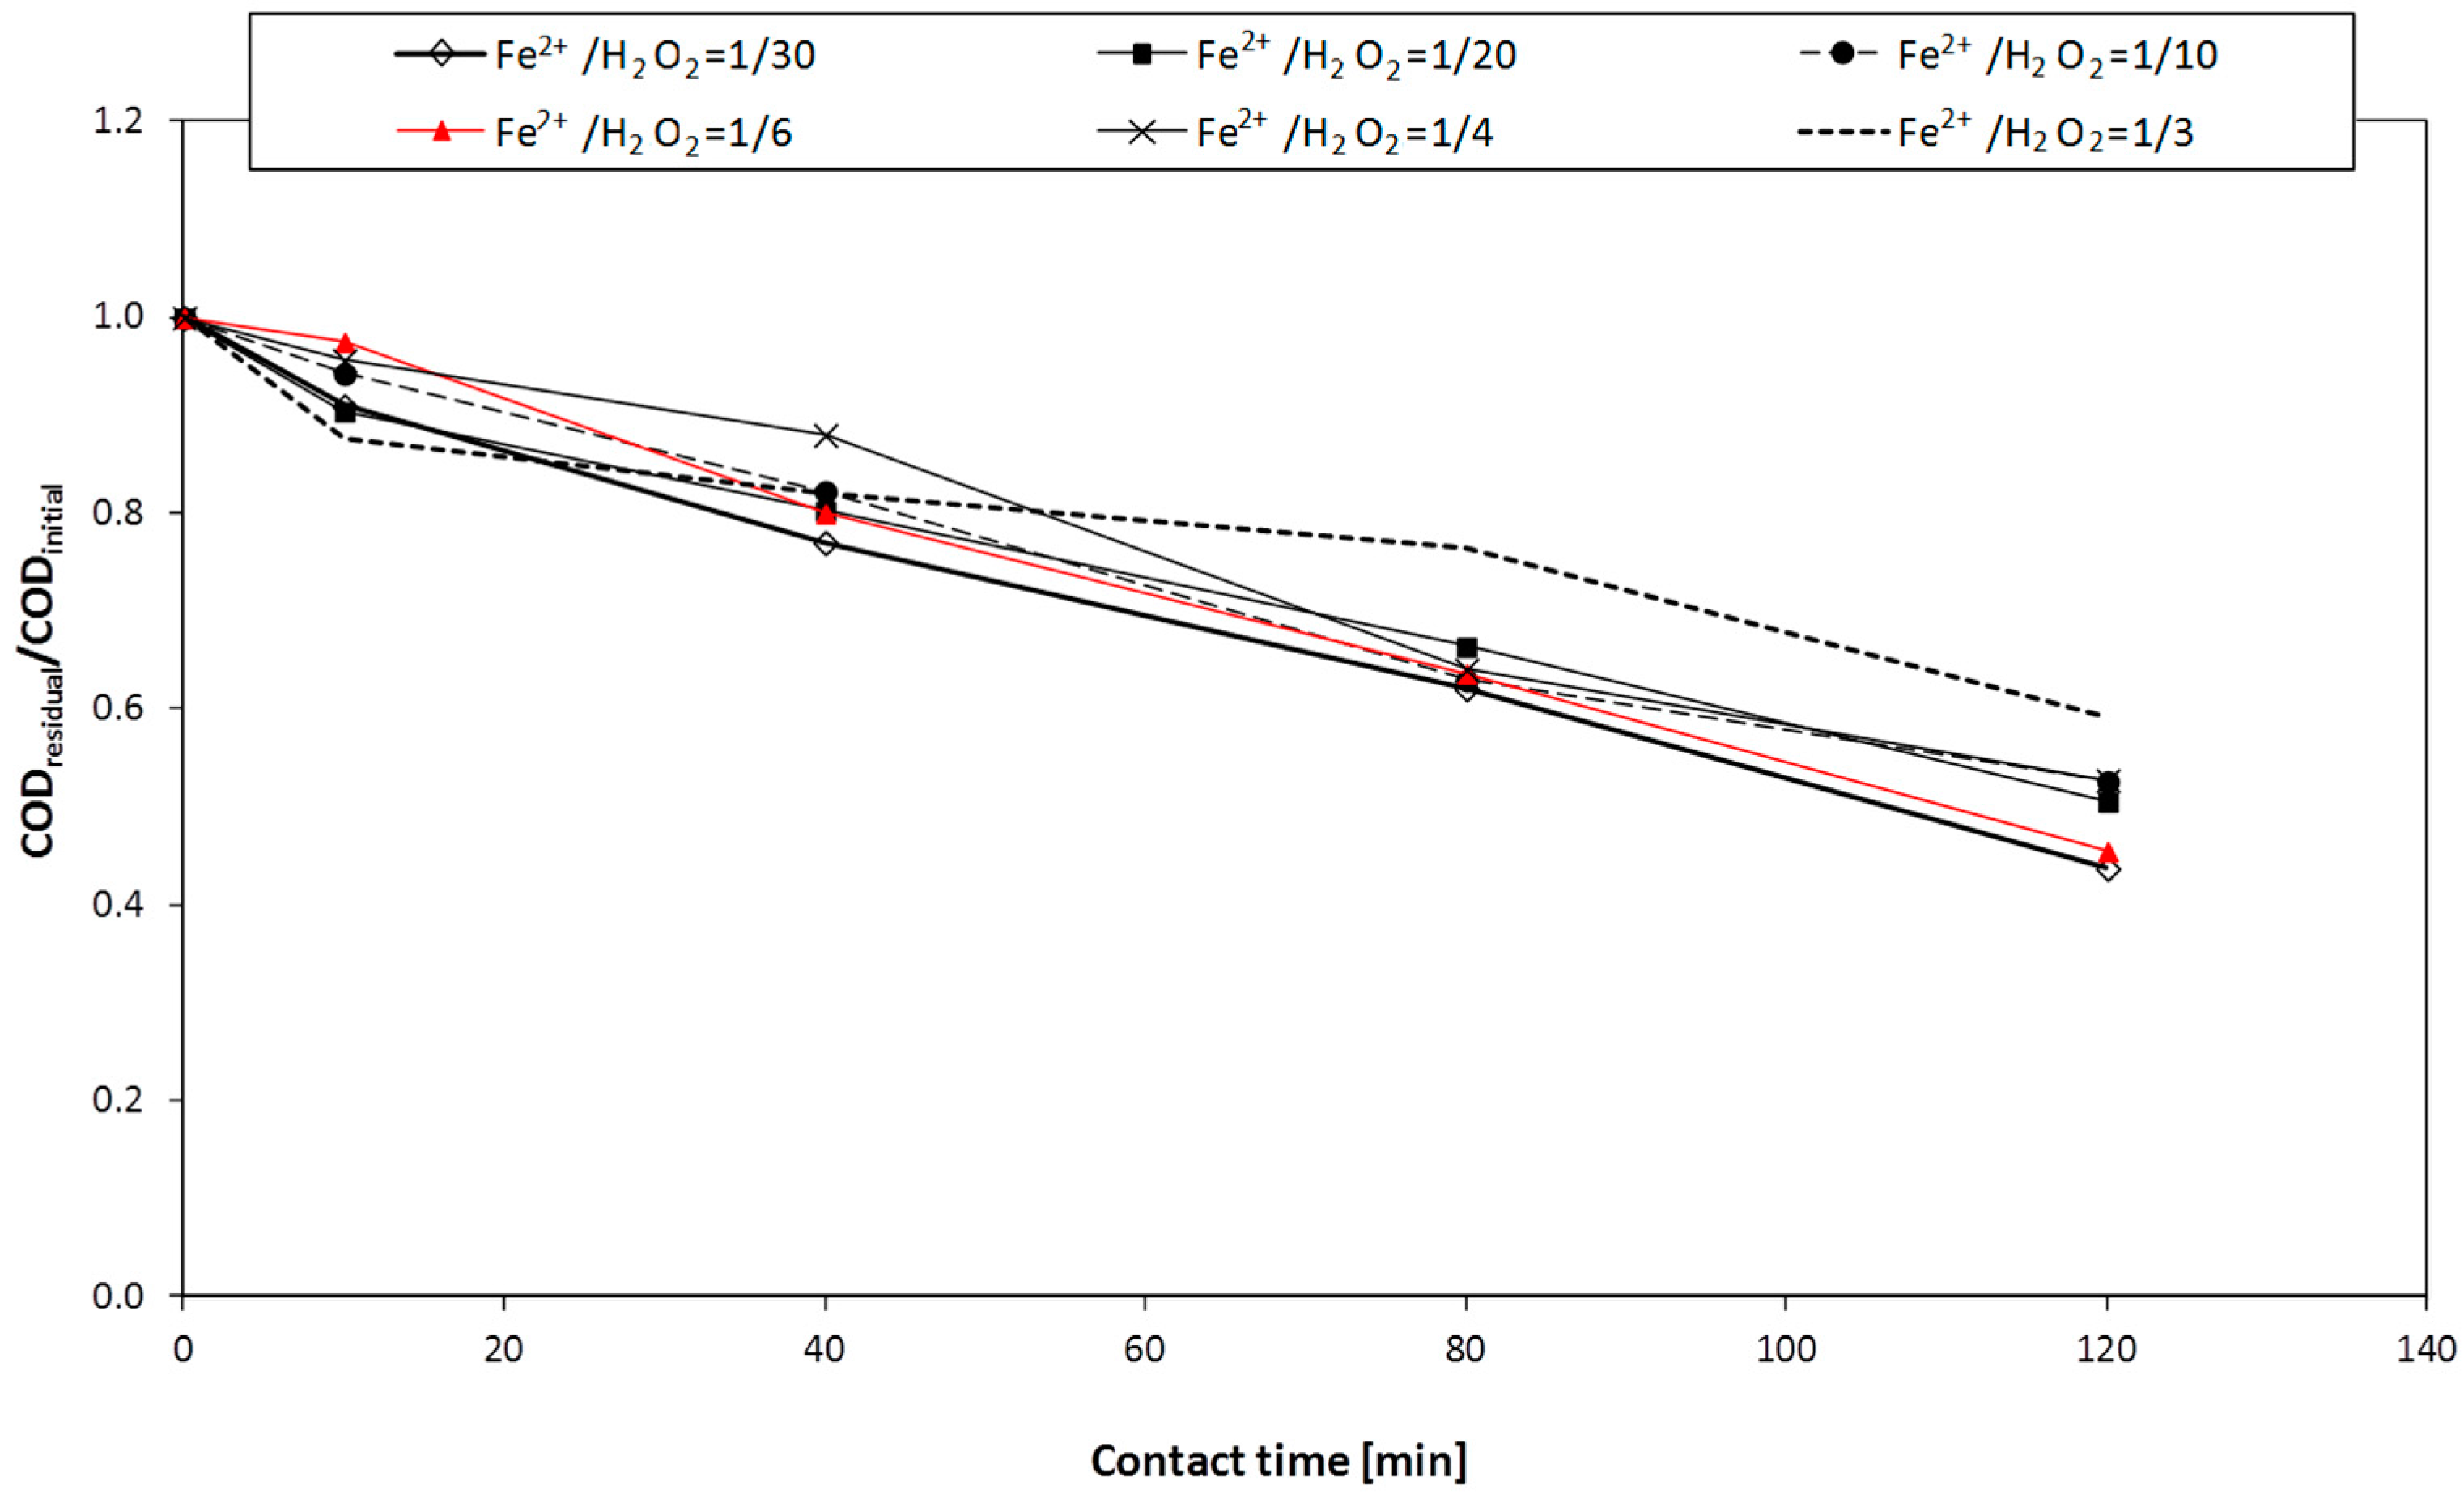
Since the AOPs were supposed to be used as a pre-treatment to a biological stage, the oxidant dosage was generally under the stoichiometric ratio, with respect to the initial COD of the sample.
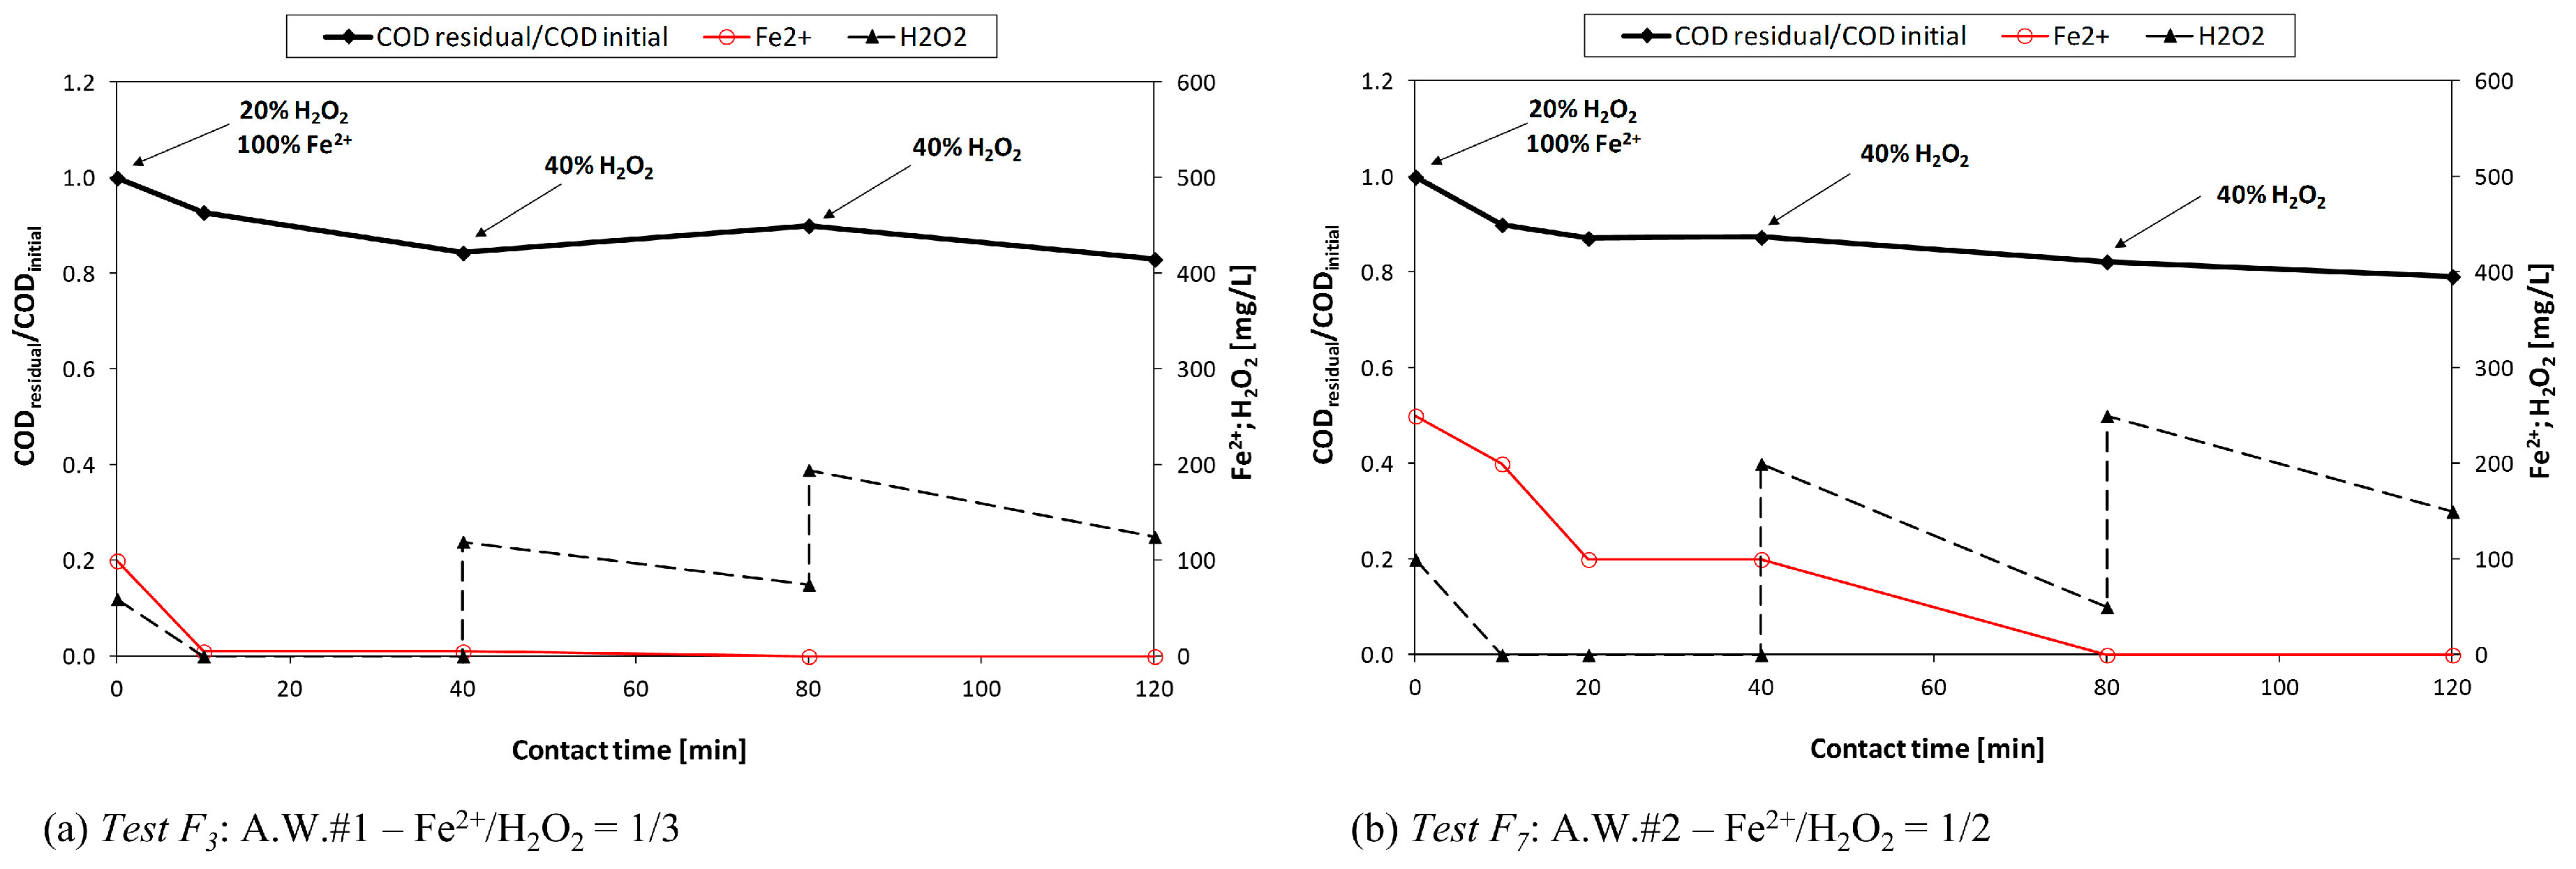
Three different reagent dosage criteria were adopted: (1) unique initial dosage; (2) consecutive additions (either at 0 and 40 min, or at 0, 40 and 80 min); or (3) continuous dosage.
As regards UV/H2O2 and photo-Fenton tests, the specific power of lamp, expressed as power (W) per volume of reactor (L), is shown in Table 2.
During some tests, air was inflated into the reactors, in order to assess possible effects on the overall efficiency of the process (e.g., in terms of mixing and mass transfer improvement or oxygen supply). Actually, in real facilities, pressurized air pipelines are often present for other purposes (e.g., the biological treatment plant or other industrial needs), so that the possibility to exploit this opportunity may be an interesting option.
Reaction time was varied from 30 to 240 min, based on the author’s experience on full scale facilities.
The tests exhibiting good performances were repeated in order to confirm the results obtained; about 100 oxidation tests were performed overall.

2.4. Analytical Methods

The concentrations of COD, N-NH4+, N-NO2, N-NO3, total nitrogen (TN), total phosphorus (TP), anionic surfactants (MBAS), and non-ionic surfactants (TAS) were measured according to standard methods for water and wastewater [30]. BOD5 was determined at 20 °C by inoculation of activated sludge from a municipal wastewater treatment plant.
pH was measured by means of a WTW (Ingolstadt, Germany) Sentix 940-3 probe. Residual concentrations of H2O2 and Fe2+ were measured by means colorimetric test strips (Merck–Darmstadt, Germany–MQuant™).
The chemical analyses were carried out three times on the same sample; the average values are reported in the results session.

3. Results and Discussion

3.1. Phase I: COD Removal

3.1.1. H2O2/UV Process

Figure 2 shows the effect of the hydrogen peroxide dosage on COD removal yields for A.W.#1 and A.W.#2. As highlighted above, the reagent dosages were kept below the stoichiometric ratio (with respect to the initial COD concentration), since chemical oxidation was considered to be applied as a pre-treatment upstream a biological process.
For both tested aqueous wastes, the increase of hydrogen peroxide dosage enhanced the COD removal efficiency. Nevertheless, the efficiency was only slightly improved for H2O2/CODinitial dosage ratios greater than 1/2, which can be regarded as an optimal value. Similarly, doubling the reaction time (from 120 up to 240 min) did not lead to an appreciable improvement of process performance.
The dosing mode of hydrogen peroxide did not affect the process efficiency in terms of COD removal (data not shown).
For all tests (with the exception of the one carried out on A.W.#2 with plant B and H2O2/CODinitial = 3/4), the ratio (H2O2 consumed/COD removed) was far below the stoichiometric value 2.125 gH2O2·gCOD−1 and it was proportional to the dosage of hydrogen peroxide dosage (Figure 2). This may be explained considering the reciprocal role of hydrogen peroxide and UV radiation: likely, the role of the oxidation mechanisms that involve H2O2, with respect to photolysis, depend on the hydrogen peroxide dosage.
The effect of the UV lamp type and power (expressed as W·L−1) on COD removal efficiency (tests performed on A.W.#2 with a contact time of 120 min) are shown in Figure 3.
Under the same dosage of hydrogen peroxide dosage conditions, the use of a high-pressure UV lamp (plant C) led to COD removal yields higher compared to those achieved with a low-pressure UV lamp (plant B).
In all case, the COD removal yields did not significantly increase after 80 min reaction (or 40 min in case of high pressure UV lamp). Therefore, the advantage of adopting a more powerful UV lamp was clear especially during the earliest stages of each test; this aspect is very important for practical applications: in case of a batch process, the power input could be progressively decreased over time, with an important energy saving.

3.1.2. Photo-Fenton Process

Photo-Fenton tests were carried out on plants A and B, equipped with medium-high and low pressure UV lamps, respectively.
The COD removal efficiency was not significantly influenced by the Fe2+ dosage (Figure 4 shows the results obtained with plant A). In effect, under the same hydrogen peroxide and iron dosage conditions, the results were more significantly influenced by the UV radiation intensity (data not shown). This could be partially related to the production of O3 due to irradiation of dissolved oxygen. Furthermore, the UV radiation “scavenging”, due to the reduction of Fe3+ to Fe2+, did not affect the overall process efficiency. This can be explained considering the following aspects: the UV radiation was oversupplied (the specific energy consumption being rather high; 830 kWh·kgCODremoved−1); the radiation consumed was compensated by the production of OH (due to the reaction between H2O2 and Fe2+). Based on these outcomes, additional photo-Fenton tests with the use of plant C (equipped with a high-pressure lamp with an emitted light wavelength in the range 200–700 nm) were not carried out.
Table 4 shows the COD removal efficiency achieved in two tests with different duration: 120 min (photo-Fenton test 1—P-F1) and 240 min (photo-Fenton test 2—P-F2). These tests were carried out on A.W.#1 using plant A (medium-high-pressure UV lamp, specific power = 125 W·L−1); H2O2/CODinitial and Fe2+/H2O2 ratios were kept at 1/2 and 1/30, respectively.
It can be observed that after 120 min reaction, an additional COD removal was achieved. Although after 80 min the residual hydrogen peroxide was equal to zero (Table 4), the oxidation was still in progress. It can be argued that the possible presence of dissolved oxygen (activated by UV radiation) and photolysis effect were crucial factors for COD removal. The presence of dissolved oxygen, due to the strong mixing conditions, was in effect also confirmed by [31,32,33].

3.1.3. Fenton Process

The Fenton tests were carried out both on A.W.#1 and A.W.#2 with the same hydrogen peroxide dosage (H2O2/CODinitial = 1/2) and a contact time of 120 min. The results are reported in Table 5.
A higher dosage of iron increased the COD removal yields, especially for A.W.#2 (Table 5); however, the removal efficiencies obtained during Fenton tests were lower, compared to the other AOPs. This was probably due to the low amount of dosed iron (the ratio [Fe2+]dosed/[H2O2]dosed being lower than 1) that was not sufficient to completely consume all the added hydrogen peroxide (see Figure 5).
Likely, the high presence of organic matter negatively interferes with the Fe2+ regeneration process, thus leading to the accumulation of H2O2 [33,34,35]: organic matter is an OH scavenger, involving the interruption of the radical chain reactions that lead to Fe2+ regeneration through this equation:
HO2 + Fe3+ → Fe2+ + O2 + H+,
where the radical HO2 can be produced by the following reaction:
OH + H2O2 → HO2 + H2O
The dosing mode did not significantly influence the process efficiency; in fact, the impulse addition of reagents (initial dosage) led to an initial increase in the reaction rate, but the final results were similar (data not shown).

3.2. Phase II: Anionic and Non-Ionic Surfactant Removal

Fenton Process

The effect of iron dosage on the removal efficiency of surfactants (MBAS and TAS) is reported in Figure 6.
The increase of iron dosage (from 1/4 to 1/2) involved a significant enhancement of total surfactant removal only for mix#1. Moreover, the anionic surfactants (MBAS) were more easily removed, with respect to the non-ionic surfactants (TAS).
The influence of hydrogen peroxide dosage on the surfactant removal efficiency is reported in Figure 7.
It can be seen that the increase of H2O2 dosage up to a value of the H2O2/CODinitial ratio equal to 1, led to an improvement of surfactants removal, especially for TAS. A further increase of the hydrogen peroxide dosage (from 1 to 1.5 H2O2/CODinitial) did not lead to any improvement in surfactant removal yields (both for anionic and non-ionic forms).
The influence of contact time on surfactants removal rate is shown in Table 6.
The removal of total surfactants did not significantly increased along with contact time, with the exception of A.W.#4: in this case, the removal yields, especially for TAS, passed from 40% to 60% and 80%, by increasing the reaction time from 30 min, to 60 and 120 min, respectively. As concerns A.W.#5 and A.W.#6, the effect of reaction time on surfactants removal was not significant, so that the optimal contact can be identified in 30 min.
Additionally, for mix#1, the slightly higher surfactant removal yield was due to the modification of iron dosage (from 1/5 to 1/2) rather than the increase of reaction time.

4. Conclusions

The integrated analysis of the results of this research leads to the following considerations.
  • The H2O2/UV process was very effective, yielding a COD removal efficiency higher than 70% in 120 min reaction, with a dosage of hydrogen peroxide lower than the stoichiometric value (the optimal H2O2/CODinitial dosage ratio being 1/2). The decrease of the UV power caused a significant reduction in the removal of COD, but the radiation intensity (up to 2000 W·L−1 in our experimentation) revealed to be a crucial factor especially in the earlier stage of the process (about for 40 min): this aspect can be exploited to reduce the costs related to energy consumption.
  • The results of the photo-Fenton process were comparable to those obtained with the H2O2/UV treatment in terms of COD removal, at a reaction time of 240 min. No significant catalytic effect was observed by the addition of iron (an Fe2+/H2O2 ratio of 1/30 was finally chosen). The specific power input was 125 W·L−1 (medium-high pressure Hg lamp) and the H2O2/CODinitial ratio was 1/2. Photolytic reactions and the presence of dissolved oxygen (activated by UV radiation), either inflated or transferred by strong mixing conditions, revealed to be crucial factors for COD removal, which occurred even after the complete disappearance of hydrogen peroxide.
  • The COD removal efficiency obtained with the Fenton process (phase I) was lower than 25%. The organic matter, present at very high concentration, exerted an inhibitory effect on the Fe2+ regeneration process, thus leading to the accumulation of H2O2.
  • On the contrary, Fenton oxidation exerted very good performance in the treatment of aqueous wastes with high concentrations of surfactants (phase II). In this case, the results showed that the optimal treatment conditions for surfactants removal are the following: Fe2+/H2O2 = 1/4, H2O2/CODinitial ratio = 1, and contact time = 30 min. These process conditions allowed to obtain an average removal yield of 70% for TAS and 95% for MBAS.

Acknowledgments

The authors would like to thank Paolo Rossi and the company ASMortara S.p.A. for giving the financial support to the experimental research. Special thanks to Engineer Rossana Cambiè for providing the linguistic revision of the paper.

Author Contributions

Maria Cristina Collivignarelli and Giorgio Bertanza supervised the experimental work and data analysis. Alessandro Abbà carried out the experimental tests and data analysis. Roberta Pedrazzani supervised pilot plant tests and chemical analyses. Sabrina Sorlini advised on the results interpretation.

Conflicts of Interest

The authors declare no conflicts of interest.

References

  1. Collivignarelli, M.C.; Abbà, A.; Bertanza, G. Treatment of high strength pharmaceutical wastewater in a Thermophilic Aerobic Membrane Reactor (TAMR). Water Res. 2014, 63, 190–198. [Google Scholar] [CrossRef] [PubMed]
  2. Collivignarelli, M.C.; Abbà, A.; Bertanza, G. Why use a Thermophilic Aerobic Membrane Reactor for the treatment of industrial wastewater/liquid waste? Environ. Technol. 2015, 36, 2115–2124. [Google Scholar] [CrossRef] [PubMed]
  3. Collivignarelli, M.C.; Castagnola, F.; Sordi, M.; Bertanza, G. Treatment of sewage sludge in a Thermophilic Membrane Reactor (TMR) with alternate aeration cycles. J. Environ. Manag. 2015, 162, 132–138. [Google Scholar] [CrossRef] [PubMed]
  4. Collivignarelli, M.C.; Bertanza, G.; Sordi, M.; Pedrazzani, R. High-strength wastewater treatment in a pure oxygen thermophilic process: 11-year operation and monitoring of different plant configurations. Water Sci. Technol. 2015, 71, 588–596. [Google Scholar] [CrossRef] [PubMed]
  5. Hermosilla, D.; Merayo, N.; Gascò, A.; Blanco, À. The application of advanced oxidation technologies to the treatment of effluents from the pulp and paper industry: A review. Environ. Sci. Pollut. Res. 2015, 22, 168–191. [Google Scholar] [CrossRef] [PubMed] [Green Version]
  6. Mohapatra, D.P.; Brar, S.K.; Tyagi, R.D.; Picard, P.; Surampalli, R.Y. Analysis and advanced oxidation treatment of a persistent pharmaceutical compound in wastewater and wastewater sludge-carbamazepine. Sci. Total Environ. 2014, 470–471, 58–75. [Google Scholar] [CrossRef] [PubMed]
  7. Muruganandham, M.; Suri, R.P.S.; Jafari, S.; Sillanpää, M.; Gang-Juan, L.; Wu, J.J.; Swaminathan, M. Recent Developments in Homogeneous Advanced Oxidation Processes for Water and Wastewater Treatment. Int. J. Photoenergy 2014, 2014, 821674. [Google Scholar] [CrossRef]
  8. Raboni, M.; Torretta, V.; Viotti, P.; Urbini, G. Experimental plant for the physical-chemical treatment of groundwater polluted by Municipal Solid Waste (MSW) leachate, with ammonia recovery. Ambiente e Agua 2013, 8, 22–32. [Google Scholar]
  9. Rada, E.C.; Istrate, I.A.; Ragazzi, M.; Andreottola, G.; Torretta, V. Analysis of Electro-Oxidation Suitability for Landfill Leachate Treatment through an Experimental Study. Sustainability 2013, 5, 3960–3975. [Google Scholar] [CrossRef] [Green Version]
  10. Bertanza, G.; Collivignarelli, M.C.; Crotti, B.M.; Pedrazzani, R. Integration between chemical oxidation and membrane thermophilic biological process. Water Sci. Technol. 2010, 61, 227–234. [Google Scholar] [CrossRef] [PubMed]
  11. Castro, E.; Avellaneda, A.; Marco, P. Combination of Advanced Oxidation Processes and Biological Treatment for the Removal of Benzidine-Derived Dyes. Environ. Prog. Sustain. Energy 2014, 33, 873–885. [Google Scholar] [CrossRef]
  12. Covinich, L.G.; Bengoechea, D.I.; Fenoglio, R.J.; Area, M.C. Advanced Oxidation Processes for Wastewater Treatment in the Pulp and Paper Industry: A Review. Am. J. Environ. Eng. 2014, 4, 56–70. [Google Scholar] [CrossRef]
  13. European Commission. Best Available Techniques (BAT) Reference Document for Common Waste water and Waste Gas; Treatment/Management Systems in the Chemical Sector—Final Draft July 2014; Joint Research Centre—Institute for Prospective Technological Studies Sustainable Production and Consumption Unit European IPPC Bureau: Seville, Spain, 2014. [Google Scholar]
  14. Munter, R. Advanced Oxidation Processes—Current Status and Prospects. Proc. Estonian Acad. Sci. Chem. 2001, 50, 59–80. [Google Scholar]
  15. Guivarch, E.; Oturan, N.; Oturan, M.A. Removal of organophosphorus pesticides from water by electrogenerated Fenton’s reagent. Environ. Chem. Lett. 2003, 1, 165–168. [Google Scholar] [CrossRef]
  16. Papić, S.; Koprivanac, N.; Božić, A.L.; Vujević, D.; Dragičević, S.K.; Kušić, H.; Peternel, I. Advanced Oxidation Processes in Azo Dye Wastewater Treatment. Water Environ. Res. 2006, 78, 572–579. [Google Scholar] [CrossRef] [PubMed]
  17. Dwyer, J.; Kavanagh, L.; Lant, P. The degradation of dissolved organic nitrogen associated with melanoidin using a UV/H2O2 AOP. Chemosphere 2008, 71, 1745–1753. [Google Scholar] [CrossRef] [PubMed]
  18. Sillanpää, M.E.T.; Kurniawan, T.A.; Lo, W.-H. Degradation of chelating agents in aqueous solution using advanced oxidation process (AOP). Chemosphere 2011, 83, 1443–1460. [Google Scholar] [CrossRef] [PubMed]
  19. James, C.P.; Germain, E.; Judd, S. Micropollutant removal by advanced oxidation of microfiltered secondary effluent for water reuse. Sep. Purif. Technol. 2014, 127, 77–83. [Google Scholar] [CrossRef] [Green Version]
  20. Yonar, T.; Yalili Kilic, M. Chemical oxygen demand and color removal from textile wastewater by UV/H2O2 using artificial neural networks. Water Environ. Res. 2014, 86, 2159–2165. [Google Scholar] [CrossRef] [PubMed]
  21. Mierzwa, J.C.; Subtil, E.L.; Hespanhol, I. UV/H2O2 process performance improvement by ultrafiltration and physicochemical clarification systems for industrial effluent pretreatment. Ambiente e Agua 2012, 7, 31–40. [Google Scholar] [CrossRef]
  22. Berbenni, P.; Cristoforetti, C. Trattamenti di ossidazione: Fondamenti (Fundaments on oxidation treatments). In Proceedings of the 42nd Professional Updating Course on Environmental-Sanitary Engineering—Drinking Water Treatment: Quality and Management Operations, Milan, Italy, 13–17 February 1995.
  23. Poyatos, J.M.; Muñio, M.M.; Almecija, M.C.; Torres, J.C.; Hontoria, E.; Osorio, F. Advanced Oxidation Processes for Wastewater Treatment: State of the Art. Water Air Soil Pollut. 2010, 205, 187–204. [Google Scholar] [CrossRef]
  24. Naumczyk, J.; Prokurat, I.; Marcinowski, P. Landfill Leachates Treatment by H2O2/UV, O3/H2O2, Modified Fenton, and Modified Photo-Fenton Methods. Int. J. Photoenergy 2012, 2012, 909157. [Google Scholar] [CrossRef]
  25. De, A.K.; Dutta, B.K.; Bhattacharjee, S. Reaction kinetics for the degradation of phenol and chlorinated phenols using Fenton’s reagent. Environ. Prog. 2006, 25, 64–71. [Google Scholar] [CrossRef]
  26. Argun, M.E.; Karatas, M. Application of Fenton process for decolorization of reactive black 5 from synthetic wastewater: Kinetics and thermodynamics. Environ. Prog. Sustain. Energy 2011, 30, 540–548. [Google Scholar] [CrossRef]
  27. Beltrán, F.J.; García-Araya, J.F.; Álvarez, P.M. Sodium Dodecylbenzenesulfonate Removal from Water and Wastewater. 1. Kinetics of Decomposition by Ozonation. Ind. Eng. Chem. Res. 2000, 39, 2214–2220. [Google Scholar] [CrossRef]
  28. Andreottola, G.; Foladori, P.; Guglielmi, G. Tecniche di depurazione avanzate: Biofiltrazione, bioreattori a membrana, sistemi a letti mobili. In Proceedings of the 1st Professional Updating Course on Environmental-Sanitary Engineering—The Project of Wastewater Treatment Plants in View of the New Regulation for the Prevenction of Water Pollution, Taranto, Italy, 27–28 September and 4–5 October 2002.
  29. Martins, R.C.; Silva, A.M.T.; Castro-Silva, S.; Garção-Nunes, P.; Quinta-Ferreira, R.M. Advanced oxidation processes for treatment of effluents from a detergent industry. Environ. Technol. 2011, 32, 1031–1041. [Google Scholar] [CrossRef] [PubMed]
  30. American Public Health Association (APHA); American Water Works Association (AWWA); Water Environment Federation (WEF). Standard Methods for the Examination of Water and Wastewater, 22nd ed.; American Public Health Association: Washington, DC, USA, 2012. [Google Scholar]
  31. De Laat, J.; Gallard, H. Catalytic decomposition of hydrogen by Fe(III) in homogeneous aqueous solution: Mechanism and kinetic modeling. Environ. Sci. Technol. 1999, 33, 2726–2732. [Google Scholar] [CrossRef]
  32. Utset, B.; Garcia, J.; Casado, J.; Domenech, X.; Peral, J. Replacement of H2O2 by O2 in Fenton and photo-Fenton reactions. Chemosphere 2000, 41, 1187–1192. [Google Scholar] [CrossRef]
  33. Yoon, J.; Lee, Y.; Kim, S. Investigation of the reaction pathway of OH radicals produced by Fenton oxidation in the conditions of wastewater treatment. Water Sci. Technol. 2001, 44, 15–21. [Google Scholar] [PubMed]
  34. Christensen, H.; Sehested, K.; Corfitzen, H. Reaction of hydroxyl radicals with hydrogen peroxides at ambient and elevated temperatures. J. Phys. Chem. 1982, 86, 1588–1590. [Google Scholar] [CrossRef]
  35. Rush, D.J.; Bielski, B.H.J. Pulse radiolytic studies of the reactions of HO2/O2 with Fe(II)/Fe(III) ions. The reactivity of HO2/O2 with ferric ions and its implication on the occurrence of the Haber-Weiss reaction. J. Phys. Chem. 1985, 89, 5062–5066. [Google Scholar] [CrossRef]
Figure 1. Pilot plants used for photo-Fenton (A and B) and H2O2/UV (A, B, and C) tests.
Sustainability 09 00244 g001
Figure 2. H2O2/UV process: effect of hydrogen peroxide dosage on COD removal efficiency.
Sustainability 09 00244 g002
Figure 3. H2O2/UV process: effect of the UV lamp (type and power) on COD removal efficiency (A.W.#2; contact time = 120 min).
Sustainability 09 00244 g003
Figure 4. Photo-Fenton process: effect of iron dosage on COD removal efficiency (A.W.#1; H2O2/CODinitial = 1/2; plant A-125 W·L−1).
Sustainability 09 00244 g004
Figure 5. Fenton process: concentrations of residual H2O2 and Fe2+ during test F3 (a) and F7 (b) (H2O2/CODinitial = 1/2; contact time = 120 min).
Sustainability 09 00244 g005
Figure 6. Fenton process: effect of iron dosage on the removal of surfactants.
Sustainability 09 00244 g006
Figure 7. Fenton process: effect of hydrogen peroxide dosage on the removal of surfactants.
Sustainability 09 00244 g007
Table 1. Main characteristics of aqueous wastes.
ParameterPhase I—COD RemovalPhase II—Surfactant Removal
A.W.#1A.W.#2A.W.#3A.W.#4A.W.#5A.W.#6
pH-5.2–5.45.6–5.76.5–6.75.6–5.95.2–5.58.1–8.6
CODmg·L−1200,000–220,00095,000–100,00018,000–20,00055,000–56,60048,000–50,00098,000–104,000
BOD5/COD-0.48–0.500.38–0.410.42–0.450.18–0.25n.a.n.a.
TNmg·L−1<0.53800–4000290–310<0.5<0.5<0.5
N-NH4+mg·L−1<0.520–2535–40<0.57–1060–70
N-NO3-mg·L−1<0.5<0.515–20<0.5<0.5<0.5
N-NO2-mg·L−1<0.1<0.10.15–0.2<0.1<0.1<0.1
TPmg·L−1<0.5<0.5380–420<0.5<0.5<0.5
TASmg·L−1n.a.n.a.20–25980–1020850–95015,000–17,000
MBASmg·L−1n.a.n.a.95–110149011,000–13,0003500–3800
TN: Total nitrogen; TP: Total phosphorus; n.a.: not available.
Table 2. Operating conditions adopted during H2O2/UV, photo-Fenton, and Fenton tests (phase I).
Process TestedContact Time (min)H2O2 DosageFe2+ DosageUVAir SupplyAqueous Waste Tested
(mg·L−1)H2O2/CODinitialDosing Mode(mg·L−1)Fe2+/H2O2Dosing ModeUV PlantLamp Power (W·L−1)
H2O2/UV1201501/4Initial---A-MHP125NoA.W.#1
1203601/2Initial125
1204002/3Initial125
1201501/4Consecutive125
1203001/2Consecutive125
2401601/4Initial125
2403001/2Initial125
2404002/3Initial125
2403001/2Initial62.5
120301/20Initial---B-LP4.5
601/10Initial
3001/2Initial
120------C-HP1500NoA.W.#2
1001/10Initial1500No
2001/5Initial1500No
3501/3Initial1500No
5001/2Initial1500No
7003/4Initial1500No
7003/4Continuous1500No
18003/2Continuous1500No
22505/2Continuous2000No
7003/4Initial1500Yes
7003/4Continuous1500Yes
120------B-LP15No
3501/3Initial
7003/4Initial
3501/3Initial
7003/4Continuous
Photo-Fenton1203001/2Consecutive101/30InitialA-MHP125NoA.W.#1
240101/30
120151/20
120251/10
120501/6
120671/4
1201001/3
120601/10Consecutive 101/6InitialB-LP4.5
3001/2501/6
Fenton1203001/2Consecutive151/20Initial--NoA.W.#1
501/6
1001/3
1205001/2Consecutive501/10Initial--NoA.W.#2
Consecutive1001/5InitialNo
Continuous1001/5InitialNo
Consecutive1001/5InitialYes
Consecutive1801/3InitialNo
Consecutive2501/2InitialNo
Consecutive2501/2ConsecutiveNo
Consecutive5001ConsecutiveNo
A-MHP: plant A with medium-high-pressure UV lamp (280–400 nm); B-LP: plant B with low-pressure UV lamp (254 nm); C-HP: plant C with high-pressure UV lamp (200–700 nm).
Table 3. Operating conditions adopted during Fenton tests (phase II).
Process TestedContact Time (min)H2O2 DosageFe2+ DosageAir SupplyAqueous Waste Tested
(mg·L−1)H2O2/CODinitialDosing Mode(mg·L−1)Fe2+/H2O2Dosing Mode
Fenton3036001/3Initial18001/2InitialNoA.W.#3
3036001/39001/4
3082003/416501/5
6011,000155001/2
6082003/441001/2
6010,5003/452001/2
6016,8001.284001/2
6016,8001.242001/4
6021,0003/4Initial52001/4InitialNoA.W.#4
6028,000170001/4
6021,0003/410,5001/2
3021,0003/452001/4
6042,0003/210,5001/4
12021,0003/452001/4
6094003/4Initial23501/4InitialNoA.W.#5
6012,500131001/4
6018,7003/247001/4
3094003/423501/4
6012,500162501/2
12012,500131001/4
6015,0003/4Initial37501/4InitialNoA.W.#6
6020,000150001/4
6030,0003/215,0001/2
3015,0003/437501/4
6020,000150001/4
12020,000150001/4
Table 4. Photo-Fenton: effect of contact time on COD removal efficiency (A.W.#1; H2O2/CODinitial = 1/2; Fe2+/H2O2 = 1/30; plant A-125 W·L−1).
Time (min)Photo-Fenton Test 1 (P-F1)Photo-Fenton Test 2 (P-F2)
COD Removal Yield (%)Residual H2O2 (mg·L−1)COD Removal Yield (%)Residual H2O2 (mg·L−1)
0----
101250950
402512012.5
80390400
120580620
160--610
200--650
240--720
Table 5. Fenton process: effect of iron dosage on COD removal efficiency (H2O2/CODinitial = 1/2; contact time = 120 min).
Fenton TestAqueous Waste TestedIron Dosage (Fe2+/H2O2)COD Removal Yield (%)
F1A.W.#11/2010
F21/611
F31/317
F4A.W.#21/103
F51/511
F61/316
F71/221
Table 6. Fenton process: effect of contact time on the removal of surfactants.
Aqueous Waste TestedIron Dosage (Fe2+/H2O2)H2O2 Dosage (H2O2/CODinitial)Contact Time (min)Removal Yield (%)
TASMBASTotal Surfactants
Mix#11/53/430527670
1/260538073
A.W.#41/43/430449071
60629581
120839992
A.W.#51/43/430709795
60439693
160779896
120769897
A.W.#61/43/430899490
60809583
160919993
120919892

