Article

Life Cycle Greenhouse Gas Analysis of Multiple Vehicle Fuel Pathways in China

1
Institute of Energy, Environment and Economy, Tsinghua University, Beijing 100084, China
2
China Automotive Energy Research Center, Tsinghua University, Beijing 100084, China
*
Author to whom correspondence should be addressed.
Sustainability 2017, 9(12), 2183; https://doi.org/10.3390/su9122183
Submission received: 1 September 2017 / Revised: 23 November 2017 / Accepted: 24 November 2017 / Published: 26 November 2017
(This article belongs to the Special Issue Carbon Footprint: As an Environmental Sustainability Indicator)

Abstract

:
The Tsinghua University Life Cycle Analysis Model (TLCAM) is applied to calculate the life cycle fossil energy consumption and greenhouse gas (GHG) emissions for more than 20 vehicle fuel pathways in China. In addition to conventional gasoline and diesel, these include coal- and gas-based vehicle fuels, and electric vehicle (EV) pathways. The results indicate the following. (1) China’s current dependence on coal and relative low-efficiency processes limits the potential for most alternative fuel pathways to decrease energy consumption and emissions; (2) Future low-carbon electricity pathways offer more obvious advantages, with coal-based pathways needing to adopt carbon dioxide capture and storage technology to compete; (3) A well-to-wheels analysis of the fossil energy consumption of vehicles fueled by compressed natural gas and liquefied natural gas (LNG) showed that they are comparable to conventional gasoline vehicles. However, importing rather than domestically producing LNG for vehicle use can decrease domestic GHG emissions by 35% and 31% compared with those of conventional gasoline and diesel vehicles, respectively; (4) The manufacturing and recovery of battery and vehicle in the EV analysis has significant impact on the overall ability of EVs to decrease fossil energy consumption and GHG emissions from ICEVs.

1. Introduction

1.1. Development of Alternative Vehicle Fuels in China

Over the past decade, China’s vehicle population has experienced rapid increasing. As of 2015, there were more than 172 million vehicles in China, a figure that has been growing at an average annual rate of 24.5% [1], which is certain to further drive China’s growing demand for vehicle fuels. Meanwhile oil supply security, CO2 and other air pollution from fossil fuel consumption have aroused widespread concern. Together, these have contributed to the increased attention focused on alternative fuels to replace conventional gasoline and diesel.
Currently available alternative combustion fuels include natural gas (NG) (such as compressed NG (CNG) and liquefied NG (LNG)), methanol, ethanol, biodiesel, and coal-to-liquid (CtL) derived fuels. Moreover, the development of electric vehicles (EVs) has also impacted the demand for conventional gasoline and diesel [2,3]. However, recent statistics show that, across all vehicle types, developments in alternative fuels have had a limited impact on the overall market. Approximately 29 million tons of conventional gasoline and diesel were replaced by alternative vehicle fuel in 2015, accounting for 10% of the total amount of gasoline and diesel consumed in that year (the figures for gasoline alone were 16.5 million tons and 14%, respectively) [2,3,4]. LNG, CTL, and biodiesel are alternatives to conventional diesel fuel, approximately 12.5 million tons of which was replaced by them in 2015, 7% of total diesel consumption in that year [2]. NG is the dominant replacement fuel and was responsible for 73% and 66% of the substitution of conventional gasoline and diesel fuels, respectively [4,5].

1.2. Life Cycle Studies of Vehicle Fuels

Life cycle analysis (LCA) of energy use and greenhouse gas (GHG) emissions has been an important aspect in a comprehensive evaluation of vehicle fuel pathways and has been studied by domestic and foreign scholars who have established specific models for different regions. The Greenhouse gas, Regulated Emissions and Energy use in Transportation (GREET) [6,7] and the Lifecycle Emissions Model (LEM) [8,9] are two of the famous LCA models that have been applied to analyze technical pathways in North America [10,11,12], Europe [13,14] and other regions [15,16,17]. The conclusions from such analyses reveal strong regional differences, suggesting that the basic model cannot be simply applied to other areas of the world.
Several publications have focused on LCA in the Chinese context for individual alternative vehicle fuels in recent years [18,19,20,21,22,23,24,25,26,27]. In addition, recently published are several comparative analyses between two or more pathways [28,29,30,31,32,33]. However, owing to a lack of detailed data for many intrinsic operations in the model, many of the conclusions have necessarily been drawn following the extrapolation of experimental data or uncertain future forecasts. Generally, comparative studies between individual pathways are relatively simple with limited analysis of the impact of decision-making in the models. Therefore, the current literature makes it difficult to gather sufficiently comparable research results to make comparisons and reach evidence-based conclusions.
To support the Chinese government's decision-making and to help its departments to establish scientific, long- and short-term vehicle energy strategies, it is urgent to develop an appropriate methodology and computational LCA model that can make comparisons between several vehicle fuel pathways. In recent years, the China Automotive Energy Research Center (CAERC) at Tsinghua University has used the GREET model (which was developed and parameterized for the U.S. energy production chain structure) as a basis for developing the Tsinghua University Life Cycle Analysis Model (TLCAM). The model employs as much localized data as possible to provide comprehensive LCA comparisons between the multiple fuel/vehicle pathways that reflect actual situations in China while using the same modeling platform. The model data are frequently updated to increase their relevance to the current policy-making context. A series of domestic vehicle fuel well-to-wheels (WTW) analyses have been published using TLCAM [23,33,34,35,36,37,38].
In TLCAM, the primary fossil energy input considers three fuel types: coal, oil, and NG. Nine types of end-use energy are principally analyzed: raw coal, crude oil, raw NG, clean coal, processed NG, diesel, gasoline, fuel oil and electricity. Three key GHGs are considered—CO2, CH4 and N2O—with iterative calculations used to include the upstream contribution to the fossil energy consumption and GHG emissions in the LCA. In this way, TLCAM offers a comprehensive and in-depth understanding of energy consumption and GHG emissions for multiple types of vehicle fuel pathways in China.

1.3. Aim and Structure of This Paper

This paper updates the life cycle primary fossil energy consumption and greenhouse gas intensity of end-use energy options in China. TLCAM is used to analyze the life-cycle GHG emissions and primary fossil energy consumption for gasoline, diesel, coal-based, NG-based and EVs.
Section 2 introduces the methodology, with all key data and assumptions for the researched vehicle fuel pathways detailed in Section 3. Section 4 presents the main results, and focuses on decreases in GHG emissions compared with conventional gasoline and diesel vehicles. The section also includes a sensitivity analysis of the carbon footprint of LNG fuel pathways and a detailed investigation of EVs. The final section (Section 5) provides some concluding remarks.

2. Methodology

2.1. Stages Covered and LCA System Boundary

Strictly speaking, a LCA analysis of energy consumption and GHG emissions for fuel use comprises two parts: the fuel and the vehicle cycles (Figure 1). In this paper, the system boundary for multiple vehicle fuel pathways only includes fuel cycle. However, the energy consumption and GHG emissions attributed to materials production and transportation, vehicle manufacture, vehicle decommissioning and recycling typically accounts for 10–20% of the total life cycle values, and the proportion for EV pathway is particularly higher owing to the material used in and the manufacture of system components (e.g., the battery and electric motor). Vehicle cycle also has been paid much attention in recent years. Therefore, while our study mainly focuses on analyzing the fuel pathways, we also extend the boundary to include the vehicle cycle to analyze the GHG emissions of vehicle and battery production.
The Well-to-Wheels (WTW) fuel cycle has two stages (as Figure 1 shows). Well-to-Pump (WTP) is the upstream production of the vehicle fuel and includes: resource exploitation and transportation; fuel production, transmission, distribution and storage; and the fuel-filling process. The Pump-to-Wheels (PTW) stage focuses on the fuel combustion and associated emissions from actually using the fuel in a vehicle. The WTW boundary includes the direct use of relevant process and transportation fuel but does not consider indirectly associated energy consumption from plant infrastructure and facilities during their manufacturing or other activities. We used the conventional oil-based pathways as our benchmark transportation fuel pathway. The stages used in the analyses of the other fuels in the study are shown in Table 1. The functional units are MJ/km and g CO2,e/km for energy consumption and GHG emissions, respectively, based on vehicle distance.

2.2. Calculation of Life Cycle Factors for End-Use Energy

In TLCAM, an end-use energy’s life cycle fossil energy intensity is defined as the total primary fossil energy consumption required to obtain and use 1 MJ of the end-use energy. We then defined the life cycle GHG emissions intensity as the GHG emissions associated with the production and use of 1 MJ of the end-use energy. Life cycle factors were calculated by the model using an automated iterative method [34]. Fuller details on the calculation methodology and the main data used are presented in the Appendix.

2.3. Calculation Methods for Life Cycle Intensity for Vehicle Fuel Pathways

The life cycle fossil energy intensity (MJ/MJ) and GHG emissions intensity (g CO2,e/MJ) of a specific vehicle fuel pathway were calculated as the sum of all end-use energy consumed across all of the WTW stages multiplied by the life cycle factors of these end-use energies as a process fuel. For vehicle fuel derived from oil, NG and coal sources, the analysis of the intensity of energy and GHG emissions contained two categories: (1) the intensity related to the direct use of the end-use energy (as, for example, in the diesel and gasoline pathways) which was calculated by TLCAM; and (2) taking a given end-use energy as a starting point, we calculated the sum of the total end-use energy consumption and composition for the subsequent production and transport sub-stages. This second stage involved multiplying and summing the corresponding process intensity factors and was used with pathways involving LPG, CNG, GTL, coal-based liquid fuels, and fossil energy electricity generation.
For a given vehicle fuel pathway, we assumed the pathway had n sub-stages (i.e., p = 1, 2,…, n) before the fuel was supplied for vehicle use. As Equation (1) shows, the fossil energy intensity was then calculated as the sum of the products of the nine end-use energies (i.e., j = 1, 2,…, 9) that were consumed in the various sub-stages (i.e., p = 1, 2,…, n) and the associated life cycle energy intensity:
E L C = p = 1 n j = 1 9 i = 1 3 ( E N p , j E F L C , j , i )
where E L C is the life cycle fossil energy intensity (MJ/MJ) of a given vehicle fuel pathway; E F L C , j , i (MJ/MJ) is the life cycle fossil energy type i intensity of end-use energy type j, which is taken from TLCAM’s calculated end-use energy intensity inventory, as described in the Appendix; and E N p , j (MJ/MJ) is the end-use energy type j that is consumed in sub-stage p. To carry out the calculation, we then obtained the total end-use energy consumption (or energy efficiency) for each sub-stage to acquire E N p , j .
For example, for a given CTL pathway, the fossil energy intensity was calculated using the following equations:
E L C = i = 1 3 ( E N p l a n t , 4 E F L C , 4 , i + E N p l a n t , 9 E F L C , 9 , i + j = 1 4 ( E N t r a n s p o r t , j E F L C , j , i ) )
E N p l a n t , 4 = S H p l a n t , 4 / η p l a n t
E N p l a n t , 9 = ( 1 S H p l a n t , 4 ) / η p l a n t
where E N p l a n t , 4 (MJ/MJ) represents the coal consumed by the chemical plant per MJ of liquid fuel produced; E N p l a n t , 9 (MJ/MJ) is the coal consumed to produce the electricity used to produce 1 MJ of liquid fuel; E N t r a n s p o r t , j (MJ/MJ) is the amount of end-use energy j consumed during the transport of 1 MJ of liquid fuel; S H p l a n t , 4 is the proportion of coal in the coal chemical plant’s total energy consumption; and η p l a n t is the plant’s overall energy efficiency.
For electricity pathways, losses during electricity transmission should be considered. For example, for the coal-powered electricity pathway, the calculation of the heat-value-based fossil energy intensity was carried out as follows:
E L C = i = 1 3 ( E N p l a n t , 4 E F L C , 4 , i )
E N p l a n t , 4 = 1 / ( η p l a n t ( 1 R t r a n s ) )
where R t r a n s represents the losses during electricity transmission.
Life cycle GHG emissions were calculated using the CO2-equivalent global warming potentials to directly sum the three main GHG emission intensities (CO2, CH4 and N2O) [39,40]:
G H G L C = C O 2 , L C + 25 C H 4 , L C + 298 N 2 O L C
Each of the GHG emission intensities ( C O 2 , L C , C H 4 , L C and N 2 O L C ) was determined by summing the product of the end-use energy and the corresponding GHG emission intensity for each sub-stage ( C O 2 , L C , j , C H 4 , L C , j and N 2 O L C , j ):
C O 2 , L C = p = 1 n j = 1 9 ( E N p , j C O 2 , L C , j )
C H 4 , L C = p = 1 n j = 1 9 ( E N p , j C H 4 , L C , j )
N 2 O L C = p = 1 n j = 1 9 ( E N p , j N 2 O L C , j )
For grid electricity, weighting was attributed to the different electricity pathways, W q (q = 1, 2…,). The energy intensity and GHG emission intensity of grid electricity was then calculated as follows:
E L C = q ( W q E L C , q )
G H G L C = q ( W q G H G L C , q )
where E F L C , q (MJ/MJ) is the life cycle fossil energy intensity and G H G L C , q (g CO2, e/MJ) is the life cycle GHG emissions intensity of the electricity pathway q.

2.4. Life Cycle Energy Use and GHG Emissions per km

When the vehicle efficiencies were taken into consideration, through multiplying the life cycle results of each fuel pathway by fuel efficiency, F E (km/MJ), we calculated the life cycle fossil energy input, E L C , d i s t (MJ/km), and the GHG emissions, G H G L C , d i s t (g CO2,e/km), per km of distance driven by the vehicle.
E L C , d i s t = E F L C F E
G H G L C , d i s t = G H G L C F E

3. Data and Assumptions

3.1. Basic Data and Parameters

The main data for the calculation of EFLC and GHGLC for the nine end-use energy options are listed in Appendix A. Table A2 presents original, China-specific data for oil-, NG-, and coal-based fuels and electricity. It includes energy conversion efficiencies, transport distances and the proportion of the different process fuels used in the various resource exploitation, transport, fuel processing and fuel production stages. The energy intensity and breakdown of fuels used by various transport modes are shown in Table A3. Together with the transport fuels’ lower heating values (MJ/kg), these data were then used to calculate the process fuel consumption to transport 1 MJ of feedstock or fuel to the end user. Direct and indirect GHG emissions released from the use of various energies in the Chinese context are shown in Table A4. Data on carbon content (CCj, g/MJ), fuel oxidation rate (FORj, g/MJ), and the direct CH4 (CH4,direct, g/MJ) and N2O (N2Odirect, g/MJ) emission factors were taken from authoritative literature [33,34,35,36,37,38,39]. Indirect CH4 emissions from non-combustion sources, including spills and losses during the resource extraction stage, were calculated using TLCAM.

3.2. Oil-Based Fuel Pathways

Imported and domestically produced crude oil needs to be transported to refineries across the country for refining. Refining oil products is a poly-generation process, and therefore it is necessary to proportion the distribution of energy consumption by the process among the various products. Average energy efficiency assumptions were based on a literature review. The energy efficiency of gasoline and diesel is shown in Table A2, and an energy efficiency of LPG plant was assumed to be 90.3% according to [41]. This value is unlikely to change substantially, even in the long term. For the energy consumption structure shown in Table A2, end-use energy consumption data for oil processing, coal coking and nuclear fuel processing was taken from the China Energy Statistical Yearbook 2016 [42].
Data relating to the transmission and distribution of gasoline, diesel and fuel oil is shown in Table A1. Similar data for LPG are shown in Table 2.

3.3. NG-Based Fuel Pathways

The main component of NG is the GHG methane (CH4). Leakage during the exploitation and processing of NG can have powerful GHG emission effects, potentially affecting the overall pathway’s energy savings and associated decrease in GHG emissions. The amount of fugitive CH4 during NG exploitation activities was assumed to be 0.34%.
Table 3 shows the energy efficiencies for the CNG, LNG and GTL pathways. LNG was divided into three types: imported LNG (LNG 1); LNG that was liquefied near to a domestic gas field (LNG 2); and liquefaction of NG post-transported via pipelines in China (LNG 3).
Parameters relating to the transmission and distribution of CNG, LNG and GTL are listed in Table 4. The WTW analysis of NG-based vehicle fuels is sensitive to the distance and mode by which NG is transported, which necessitated careful setting of these parameters. Given that CNG vehicles are mainly used in regions with rich NG resources, we assumed that the NG transport distance for CNG production was 300 km. CNG is directly used by vehicles, meaning that there was no further transmission and distribution included in the model. For LNG 1, after 6700 km of transport by ship, the LNG was assumed to be used after a short-distance transmission and distribution system. LNG 2 was directly liquefied at a domestic gas field and then transported by road for use. LNG 3 was transported via pipelines (1500 km), then liquefied and injected into a transmission and distribution system that was assumed to cover an average distance of 100 km. Plants producing GTL and other liquid fuels are always constructed near gas fields in China, so we assumed that NG was transported 100 km to the plant via a pipeline from the gas field. The transmission and distribution modes of GTL were then assumed to be the same as those of conventional diesel.

3.4. Coal-Based Fuel Pathways

Four CtL vehicle fuel pathways were included: methanol blended into vehicle gasoline; dimethyl ether (DME); and the direct and indirect production of synthetic oil productions from coal liquefaction. Many domestic plants, with varying energy efficiencies and fuel mixes, currently produce such fuels using coal as the raw material. For the direct CtL and indirect CtL (ICtL) pathways, we assumed that no extra electricity was needed, besides that supplied by the production plant’s in-house electricity generation units. Details of the relevant assumptions are listed in Table 5.
Different modes of transport can be employed for coal consumed in electricity production or in the production of coal-based vehicle fuels. Generally, such production plants are built near coal mines. Thus, based on existing plants, coal was assumed to be transported for 30 km by truck to reach the coal field from coal mines, and then 20 km by truck to reach the plants from coal field. Subsequent transmission and distribution of ethanol, DME, and coal-based liquid fuels were then assumed to be the same as for conventional diesel (Table A2).

3.5. Electricity Pathways

Relevant data for coal-, oil- and NG-based thermal electricity pathways are listed in Table A2. Hydro, nuclear, solar, biomass, and other forms of electricity generation also account for a sizable proportion of China’s electricity supply. As shown in Table 6, the fossil energy consumption by hydro, wind, and solar electricity is negligible [33,43,44]. However, emissions associated with facility construction and decommissioning should not be omitted. Especially for hydroelectricity, the creation of the reservoir can cause CO2, CH4 and other GHG emissions related to the biological degradation of vegetation. The life cycle emission factors of these power-generating options were approximated as 5 g CO2,e/MJ.

3.6. Carbon Dioxide Capture and Storage (CCS) Technology

Studies on the application of CCS technology for coal-burning plants suggest that an extra 80–160 kWh of electricity is required per ton of compressed CO2 obtained at a CO2 capture rate of approximately 90% [41,45,46,47]. We therefore assumed a figure of 140 kWh/t CO2, which corresponded to a decrease in the plant’s efficiency of 10% (for example from 40% to 30%). For the CO2 transport and storage stages, we assumed that energy consumption was negligible when compared with that of the capture stage.

3.7. Vehicle Size and Fuel Efficiency

The fuel economy of a mid-sized passenger vehicle was assumed to be 8 L of gasoline per 100 km. Taking the internal combustion engine (ICE) gasoline vehicle as the base case here, comparisons were then made by employing the fuel economy values of other combinations of vehicles and fuel production pathways (Table 7). WTW analysis results for various vehicle technologies were then calculated and compared for different fuels on a per km basis.

4. Results and Discussion

4.1. Life Cycle Primary Fossil Energy and Carbon Intensity of End-Use Energy in China

TLCAM model was used to recalculate and update the life cycle fossil energy and GHG emissions intensities of China’s major end-use energy options for 2015, as shown in Table 8.

4.2. Life Cycle Primary Energy Use of Multiple Vehicle Fuels

The primary energy consumption (total WTW fossil energy input) and energy conversion efficiency (the ratio between the heat value of the end-use fuel and WTW fossil energy input) for the various vehicle fuel pathways calculated by TLCAM are presented in Table 9. We found that oil- and NG-based gaseous fuels consumed similar amounts of primary fossil energy, from 1.198 to 1.282 MJ/MJ, with energy conversion efficiencies from 77.97% to 83.49%. GTL and coal-based fuel pathways ranked behind those based on oil with primary fossil energy inputs ranging from 2.141 to 2.629 MJ/MJ and energy conversion efficiencies from 38.03% to 46.71%. With application of CCS technology, the WTW fossil energy consumption of coal-based fuel pathways increased further (2.532–3.298 MJ/MJ), further decreasing the energy conversion efficiencies (30.32–39.49%). For the electricity pathways, at 4.030 MJ/MJ, the WTW fossil energy consumption input was particularly high for oil-fired electricity generation, with a conversion efficiency of just 24.81%. By contrast the WTW fossil energy consumption for nuclear- and biomass-powered electricity generation pathways were low, and negligible for that employing hydropower. The fossil energy consumption for the averaged grid electricity pathway was 2.250 MJ/MJ, reflecting the various sources of electricity that make up the grid’s electricity supply. The average energy conversion efficiency was 44.45%.
The primary fossil consumption results indicate that non-oil-based pathways can achieve a significant “oil-substitution effect” from a WTW life cycle point of view.

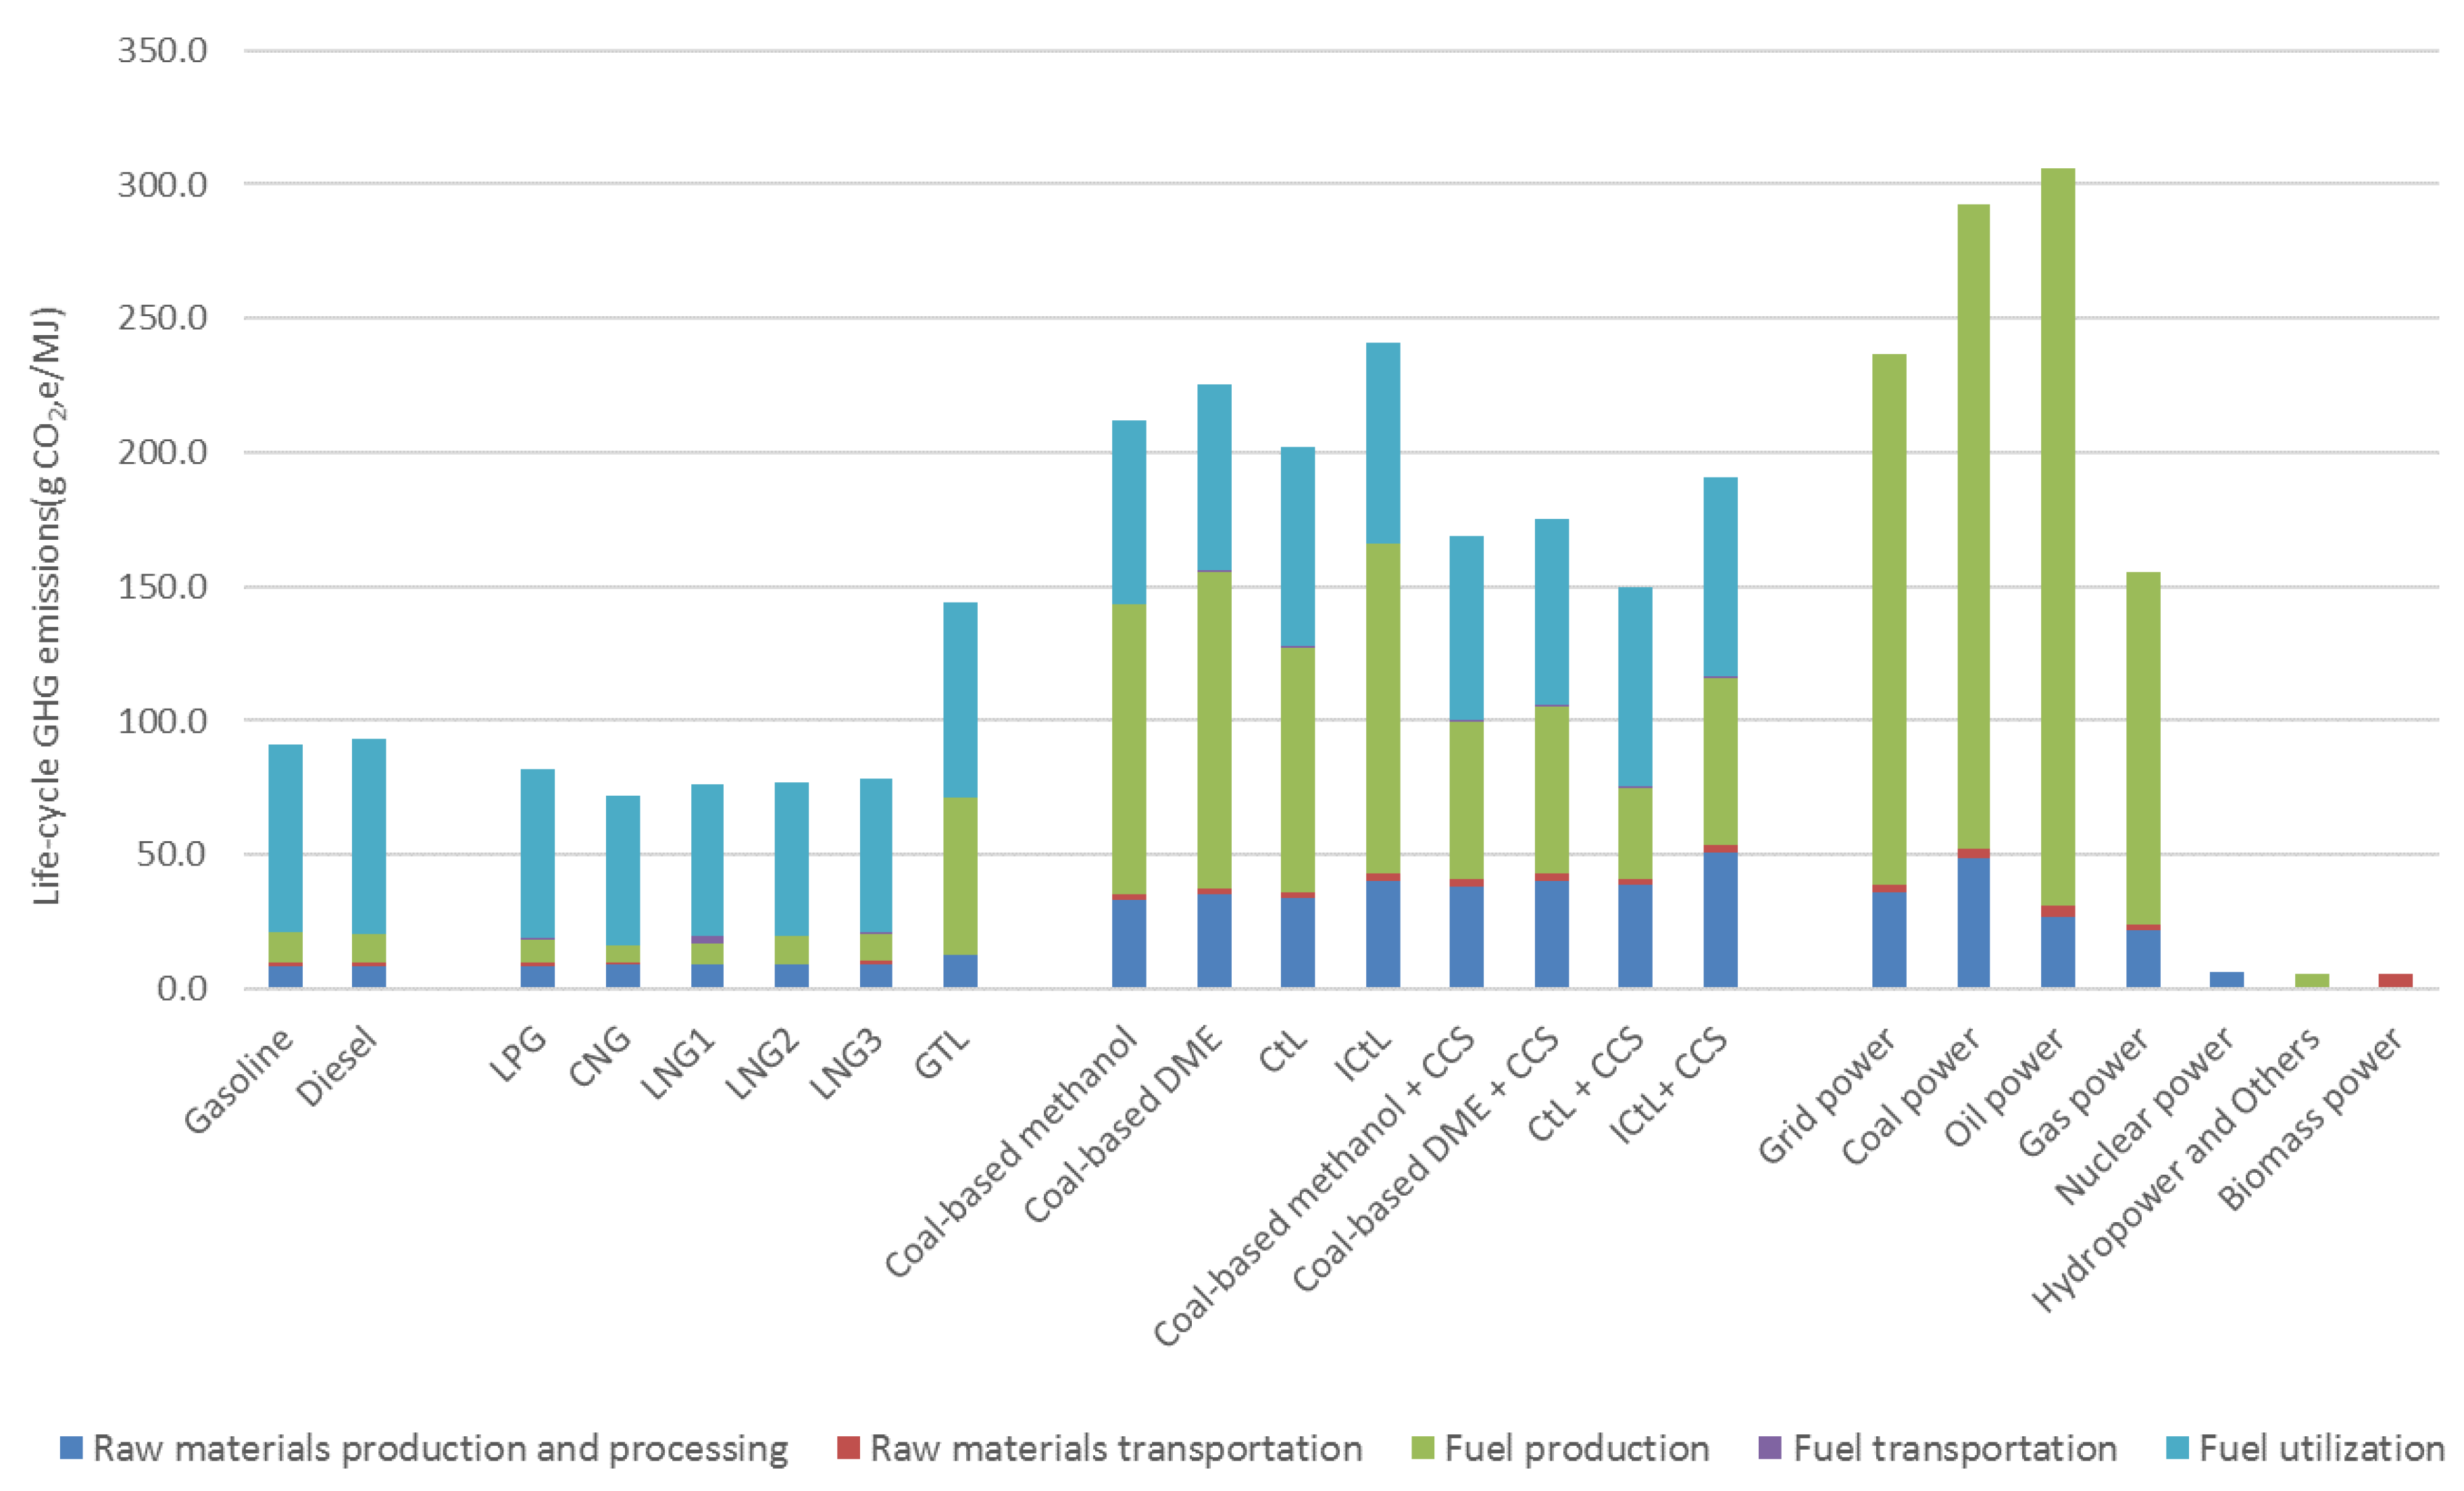
4.3. Life Cycle GHG Emissions Footprint of Different Vehicle Fuels

The life cycle GHG emissions per MJ of vehicle fuel produced and used for the various production/consumption stages are shown in Figure 2. The results indicate that, apart for biomass-powered electricity, GHG emissions associated with transportation (of both raw materials and fuel products) contributed very little to the total life cycle emissions (from 0.22% to 3.15%).

4.3.1. Oil-based Fuel Pathways

The life cycle GHG emissions for gasoline, diesel and LPG were 91.3, 93.3 and 82.2 g CO2,e/MJ, respectively. For oil-based fuel pathways, GHG emissions in the (upstream) WTP stages accounted for a modest fraction of the total emissions: 23.41%, 22.11% and 23.25% for gasoline, diesel and LPG, respectively. Meanwhile, for the same fuels, GHG emissions from the fuel-use stage dominated the WTW totals at 76.59%, 77.89% and 76.75%, respectively. During fuel use, GHG emissions from different fuel pathways are defined by the physical properties of the fuel, including their carbon content (CC) and the fuel oxidation rate (FOR).

4.3.2. NG-Based Fuel Pathways

At 72.3 g CO2,e/MJ, life cycle GHG emissions for CNG were a little lower than those of conventional oil-based fuels, with 21.95% of the total attributed to upstream processes. The total GHG emissions for GTL were 143.9 g CO2,e/MJ with a similar proportion attributed to upstream processes (49.53%) and fuel use phase (50.47%). Regarding the LNG pathways, all GHG emissions associated with LNG 2 and LNG 3 were released within domestic boundaries. The emissions for LNG 2 and LNG 3 were 77.2 and 78.1 g CO2,e/MJ, respectively, of which 25.99% and 26.90%, respectively, were attributed to upstream processes. For LNG 1, the upstream GHG emissions, which were assumed to be emitted outside of national boundaries, were 19.50 g CO2,e/MJ, 25.69% of the total (76.1 g CO2,e/MJ). These included NG exploitation and processing, NG liquefaction, and LNG transport to China, which accounted for 12.89%, 10.30%, and 2.50% of the total, respectively. The GHG emissions associated with LNG transmission and distribution, and LNG use, which were assumed to occur in China, represented 56.42 g CO2,e/MJ, or 74.31% of the total life cycle emissions.

4.3.3. Coal-Based Fuel Pathways

The life cycle GHG emissions for the methanol, DME, direct CtL and ICtL pathways were 212.1, 225.3, 202.1 and 240.6 g CO2,e/MJ, respectively, which were 2.2–2.6 times greater than those associated with conventional gasoline. The main reasons for such high values were the low energy conversion rates of coal-based fuel plants and the associated consumption of primary fossil energy, especially of coal with its very high carbon content. The GHG emissions from the upstream stages outweighed those from fuel use, ranging from 63.24% to 69.22% of the total. Introducing CCS decreased the life cycle GHG emissions of the methanol, DME, direct CtL and ICtL pathways by 20.45%, 22.29%, 26.04% and 20.67%, respectively. Simultaneously, the contribution from upstream operations fell to 59.41%, 60.39%, 50.30% and 61.07% of the total for the respective pathways.

4.3.4. Electricity (for EV) Pathways

For the EV pathways, almost all of the GHG emissions were generated in the upstream, fuel-production stage. The total GHG emissions associated with coal-derived electricity was 292.3 g CO2,e/MJ, in which the production, transportation and combustion of coal accounted for 16.72%, 1.10% and 82.17%, respectively. Similarly, GHG emissions associated with the production and transportation of oil in the oil-powered electricity pathway accounted for 8.74% and 1.44% of the total life cycle emissions, respectively. Adding the GHG emissions from its combustion in a power plant, the total GHG emissions for oil-derived electricity were 305.7 g CO2,e/MJ. The corresponding life cycle GHG emissions for gas-derived electricity were 155.5 g CO2,e/MJ, of which raw material production and transportation were responsible for 13.94% and 1.45%, respectively. Electricity pathways with non-fossil energy as the main raw material (such as nuclear, biomass and hydropower) had very small life cycle GHG emissions. Here, emissions tended to be concentrated in a specific sub-stage. For example, nearly all of the GHG emissions from of biomass-derived electricity was generated by transporting the raw material. The GHG emissions associated with the average grid electricity chain were 168 g CO2,e/MJ, with raw material production, raw material transportation and generation in the electricity plant accounting for 15.18%, 1.13% and 83.69%, respectively.

4.4. Comparison between NG-Based and Electricity Pathways

Table 10 shows a comparison of the varied results for NG-based and electricity pathways for studies conducted in China and several other countries. The current study updates previous work on China by considering the most up-to-date production technology that is in use in China today. Thus, fuel-conversion efficiencies are for the most part higher (Table A2), leading to a lower overall level of energy consumption and GHG emissions for the processes.
Nonetheless, the life cycle consumption of primary fossil energy and GHG emissions for the NG-based fuels and electricity pathways in China remained higher than those in other countries and regions. For electricity pathways, the difference is mainly due to the low proportion of low-carbon sources (29.1%) and the large proportion of coal electricity (67.9%) in China’s electricity mix [49], the latter being significantly higher than in the other countries in the comparison (0–34.3%) [7]. For NG-based fuel pathways, the differences can be attributed to: (1) China’s coal-dominated energy mix; (2) China’s lower efficiencies in the feedstock and fuel production stages (for example, for the CNG pathway, NG extraction, processing and CNG compression efficiencies in China were 96%, 94% and 96.9%, respectively [23,34], while the respective values for the US were 98%, 98% and 97.9% [7]); and (3) China’s higher energy intensities for various transport modes [32,34].

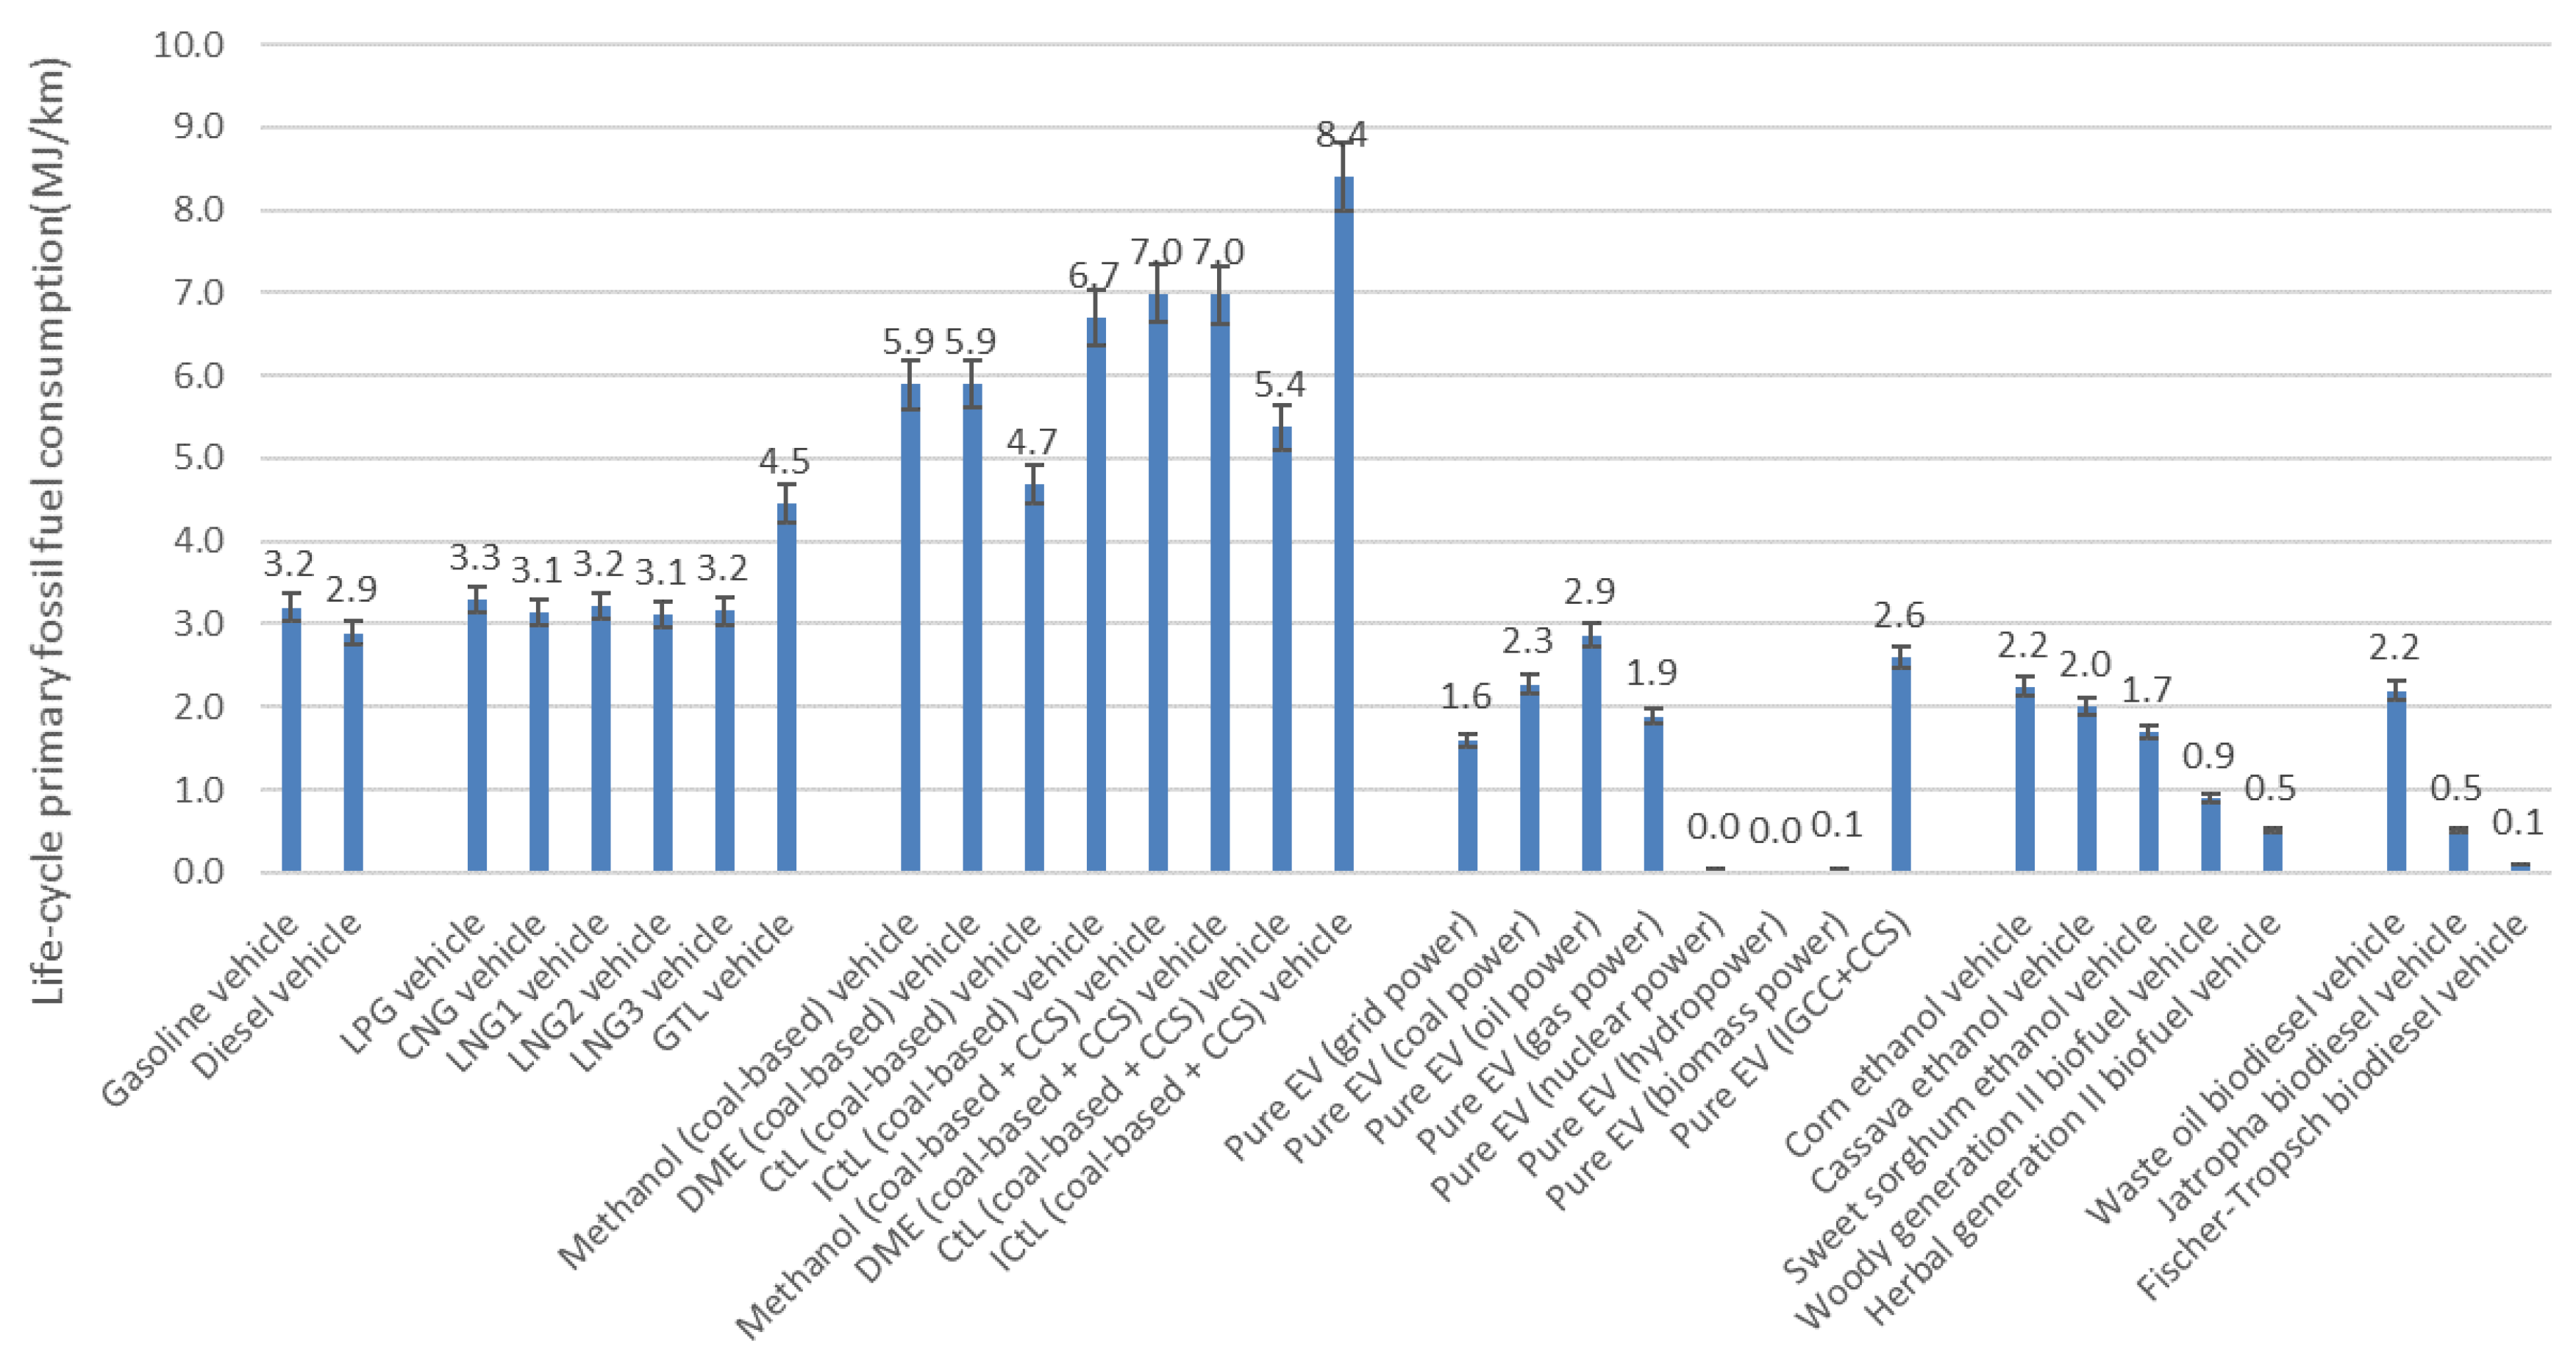
4.5. Comparison for WTW Results of Vehicle Fuels

As shown in Figure 3, the life cycle primary fossil energy consumption for the various vehicle fuels investigated was broadly ordered (from highest to lowest) as follows: coal-based fuels, GTL, conventional oil-based fuels, LNG, CNG, CCS-fitted electricity generation, generation I biofuels, grid-powered electricity, and generation II biofuels.
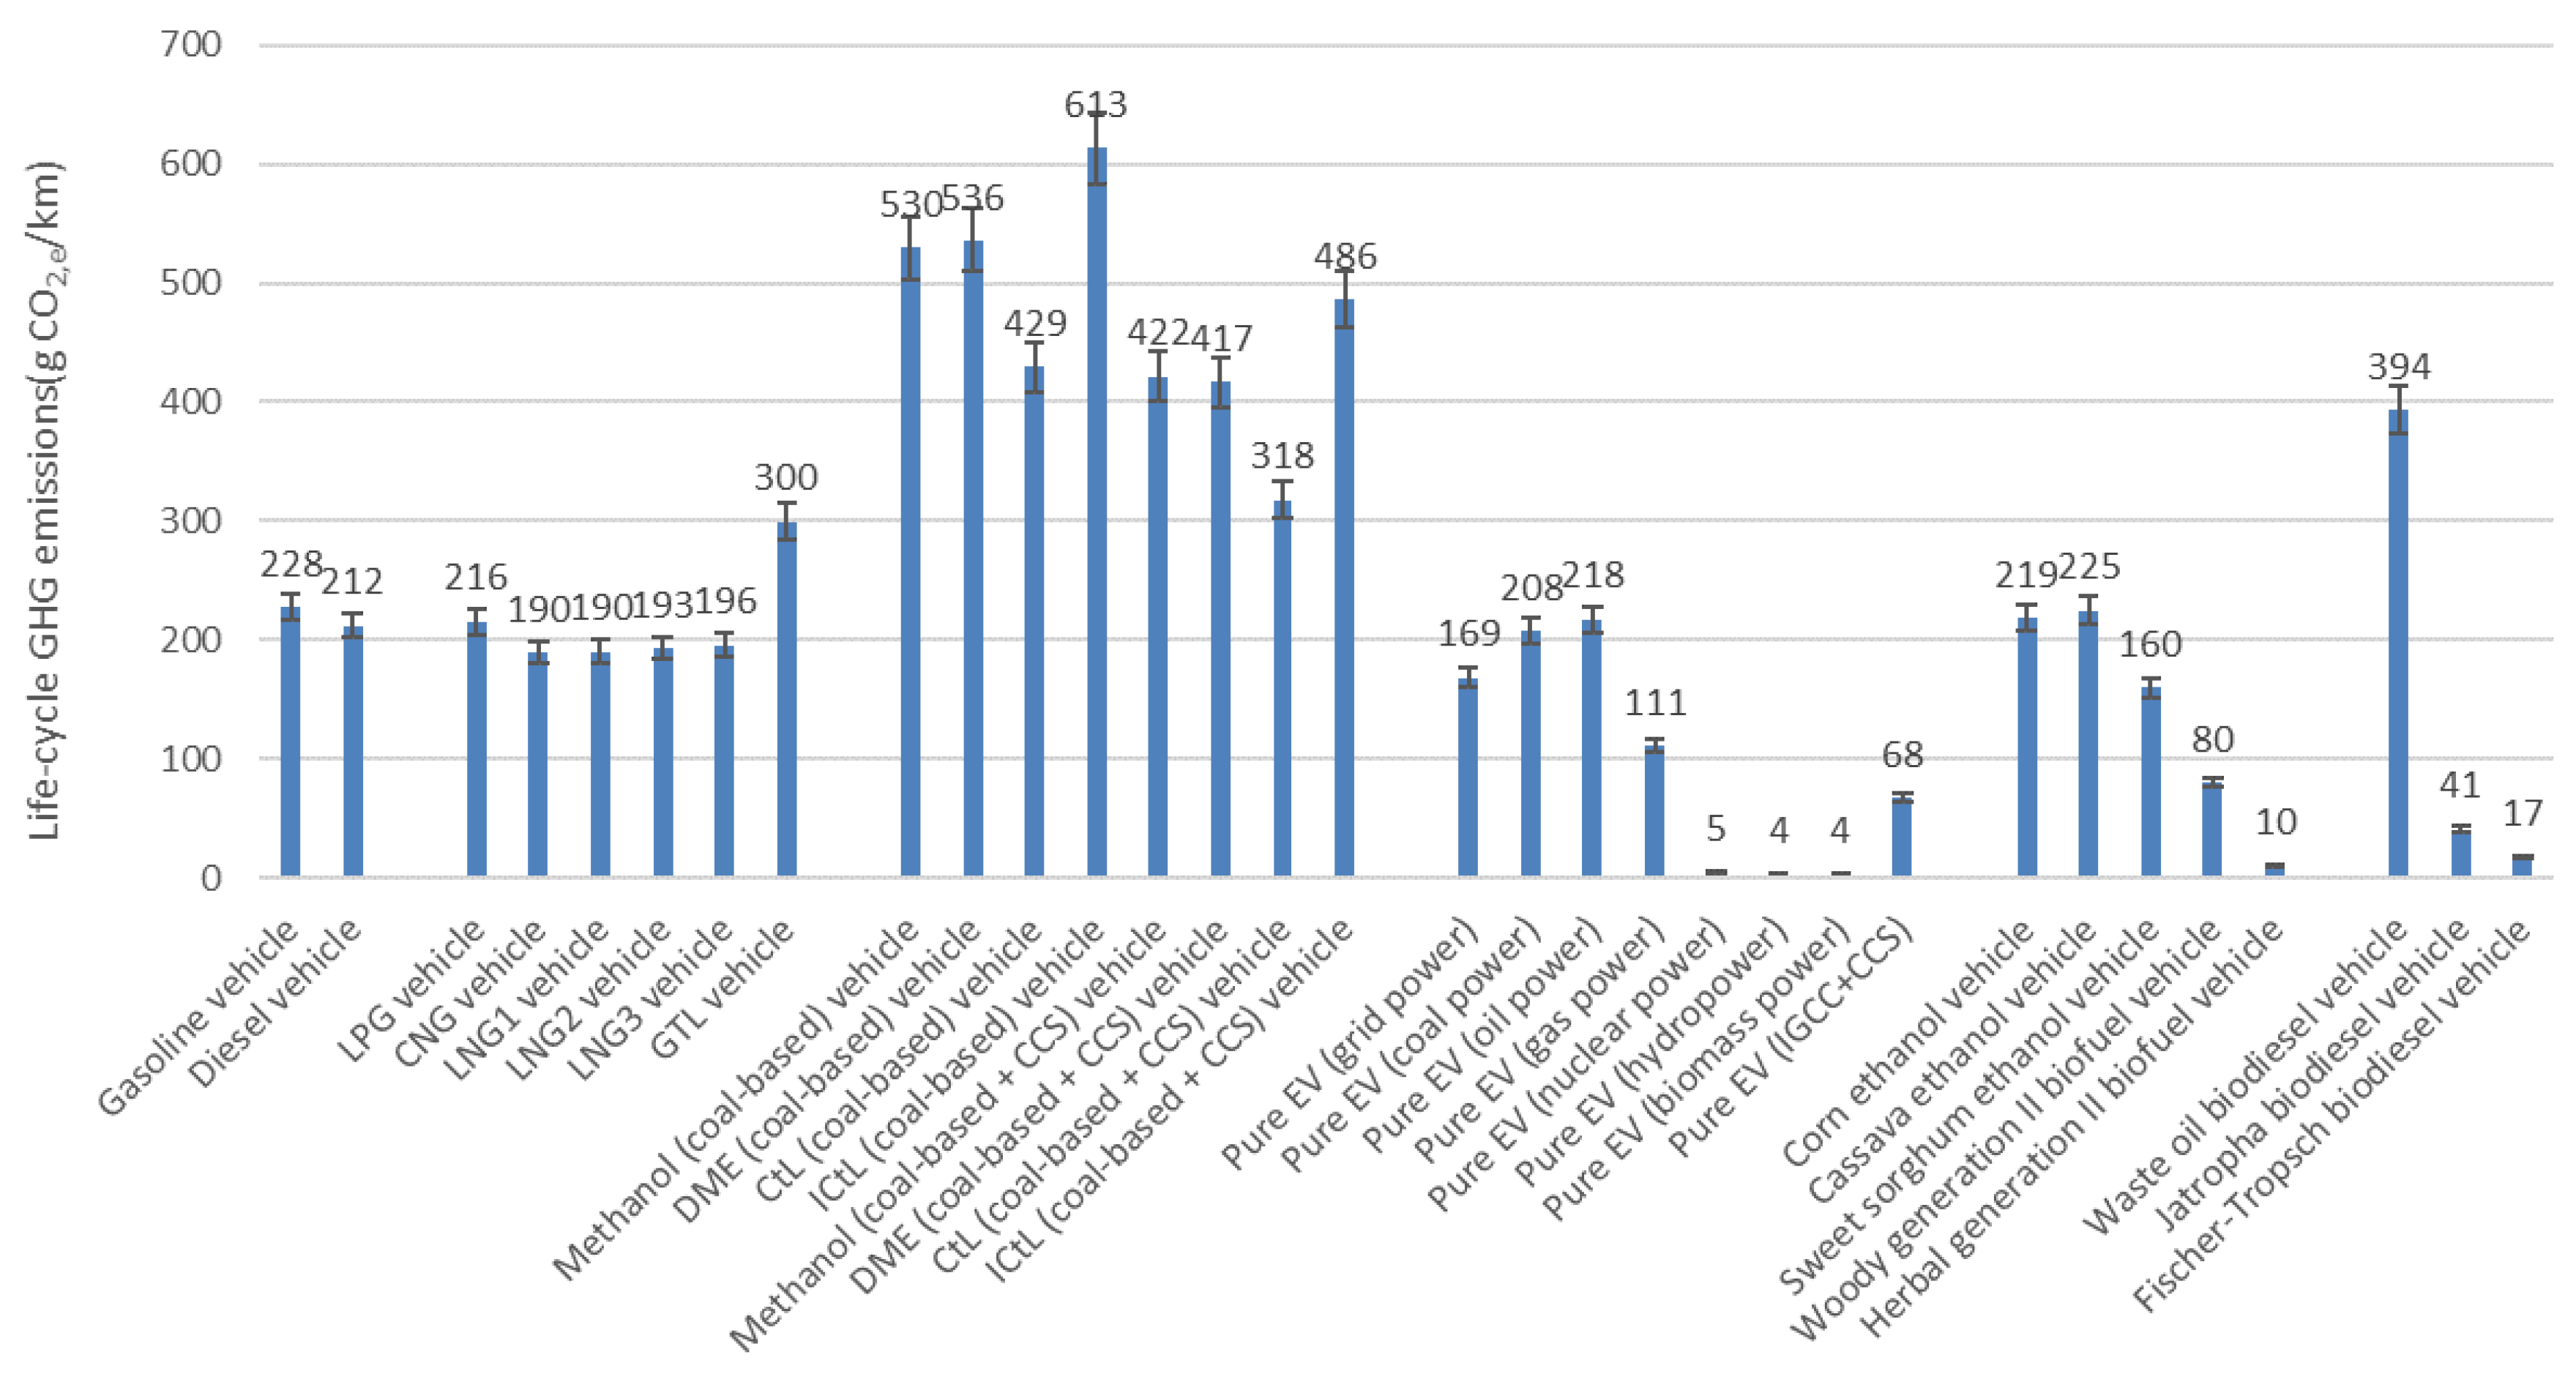
As shown in Figure 4, the order for life cycle GHG emissions was as follows (again, from highest to lowest): coal-based fuels, coal-based fuels with CCS, waste oil-derived biodiesel, GTL, conventional oil-based fuels, generation I biofuels, gaseous and liquefied NG fuels, grid-powered electricity, CCS-fitted power generation and generation II biofuels.
Here we refer to the WTW analyses results of biofuel vehicle pathways and coal electricity with CCS [35] in the previous reports [33,41] by CAERC using TLCAM to gain a more comprehensive understanding of energy consumption and GHG emissions for the different vehicle fuel pathways calculated in this study.
Fuels derived from a coal-powered process that was not equipped with CCS showed fossil energy inputs and GHG emissions that were 47–132% and 88–189% higher than those for conventional gasoline and diesel pathways, respectively. This was attributed to low conversion efficiencies in coal-powered fuel plants and coal’s high carbon content. Coal-powered methanol and DME plants in China are decentralized with the level of technology employed varying greatly, suggesting that the average value used here may mask a wide distribution of results. The application of CCS technology further increased the life cycle fossil energy inputs of coal-based fuel pathways. This resulted in life cycle primary energy consumption being 68–191% higher than in the conventional diesel and gasoline pathways, with the corresponding GHG emissions being 39–129% higher. Uncertainties surrounding CCS’s energy consumption and rate of carbon capture could further extend the range of real-world results for pathways that apply CCS.
While the life-cycle fossil energy consumption of the CNG and LNG pathways were almost the same as those for the conventional gasoline pathway, because the carbon content of NG is lower than that of oil, the CNG and LNG pathways reported lifecycle GHG emissions that were 14–17% lower than those for the conventional gasoline pathway, and 8–10% lower than those for the conventional diesel pathway. For LNG 1, domestic GHG emissions were 35% and 31% lower than those for conventional gasoline and diesel vehicles, respectively. Variance in results for CNG and LNG pathways can mainly be attributed to differences in the transport distance. For GTL pathways, life cycle fossil energy consumption was 54% greater than that for conventional diesel vehicles because the production efficiency of a GTL plant is relatively low. However, NG’s lower carbon content meant that life cycle GHG emissions were only 41% higher than those from conventional diesel vehicles. Variability in current and future conversion efficiencies for GTL plants could create a wide distribution around this average result.
Life cycle fossil energy consumption of EVs using grid electricity was 50% of that consumed by a comparable gasoline vehicle, and 55% of the amount consumed by a comparable diesel vehicle. This decrease was mainly attributed to the much higher energy efficiency of EVs compared with that of ICEs. Because coal is the major source of electricity generation in China, the EV-pathway GHG emissions were only 26% and 21% less than those for conventional gasoline and diesel vehicle pathways, respectively. Using electricity derived solely from coal or oil resulted in very similar results to those obtained for the conventional diesel vehicle pathway. However, using nuclear, biomass or hydro-electricity resulted in WTW fossil energy inputs and GHG emissions that were only 1–2% of those for conventional gasoline and diesel vehicle pathways.
Biofuels offer obvious potential to decrease fossil energy consumption and GHG emissions. Vehicles powered by Generation I biofuels were found to effect 1–30% decreases in GHG emissions and 30–47% decreases in the consumption of fossil energy inputs compared with results for conventional gasoline vehicles. The life cycle fossil energy consumption for the pathway based on waste oil biodiesel was 69% of that consumed for a comparable gasoline vehicle; however, life cycle GHG emissions were 73% higher than comparable diesel vehicle. For generation II biofuel vehicles, life cycle fossil energy consumption and GHG emissions were 72–97% and 65–93% lower than the comparable gasoline/diesel vehicle, respectively.

4.6. Sensitivity Analysis of Carbon Footprint of LNG Pathways and Coal-Based Fuel Pathways

From the analysis of the three LNG pathways considered, the efficiency of NG liquefaction and the mix of fuel during liquefication process impacted the GHG emissions intensity the most. Emissions intensity was only weakly sensitive to changes in the distance over which NG was transported and over which LNG was transmitted and distributed. Specifically, for the LNG 1 pathway, if we were to assume that the foreign liquefaction plant was powered by electricity and had an overall energy efficiency of 95.2%, re-calculation of the life cycle value yields a GHG emissions intensity of 79.1 g CO2,e/MJ, a 4.1% increase over a situation where the plant is powered by NG. For the LNG 2 pathway, if we assume that the liquefaction plant is powered by NG and has an overall energy efficiency of 90.2%, the total GHG emissions intensity would be 74.7 g CO2,e/MJ, a 3.2% decrease compared with the plant being powered by electricity. For the LNG 3 pathway, if we assume that the liquefaction plant is powered by NG and has an overall energy efficiency of 90.2%, the total GHG emissions intensity would be 75.7 g CO2,e/MJ, 3.15% lower than when the plant is powered by electricity. Meanwhile, a 50% decrease in NG transportation and LNG transmission and distribution distances results in GHG emissions intensities for the three pathways changing from 75.9, 77.2 and 78.1 g CO2,e/MJ to 75.4, 76.9 and 77.4 g CO2,e/MJ, respectively, representing respective decreases of 0.65%, 0.31% and 0.93%.
Compared to LNG pathways, coal-based fuel pathways were more sensitive to energy efficiency and the process fuel mix. For Direct CtL, ICtL, Methanol and DME pathways, if we were to assume that the overall energy efficiencies were 5% lower than before, the GHG emissions intensities would be 212.8, 253.2, 225.3 and 239.1 CO2,e/MJ, respectively, representing respective increase of 5.3%, 5.3%, 6.3% and 6.1%. For the four coal-based fuel pathways, if we assume that 50% of the process fuel were from extra electricity, the total GHG emissions intensities would be increased to 325.6, 387.8, 255.3 and 274.6 CO2,e/MJ, respectively, representing respective increase of 61.1%, 61.1%, 20.4% and 21.9% over the original situation. Meanwhile, a 50% decrease in coal transportation and coal-based fuel transmission and distribution distances results in GHG emissions intensities for the four pathways decreasing from 202.1, 240.6, 212.1 and 225.3 CO2,e/MJ to 200.8, 239.0, 210.8 and 223.9 CO2,e/MJ, respectively, representing respective decrease of 0.69%, 0.67%, 0.65% and 0.64%.

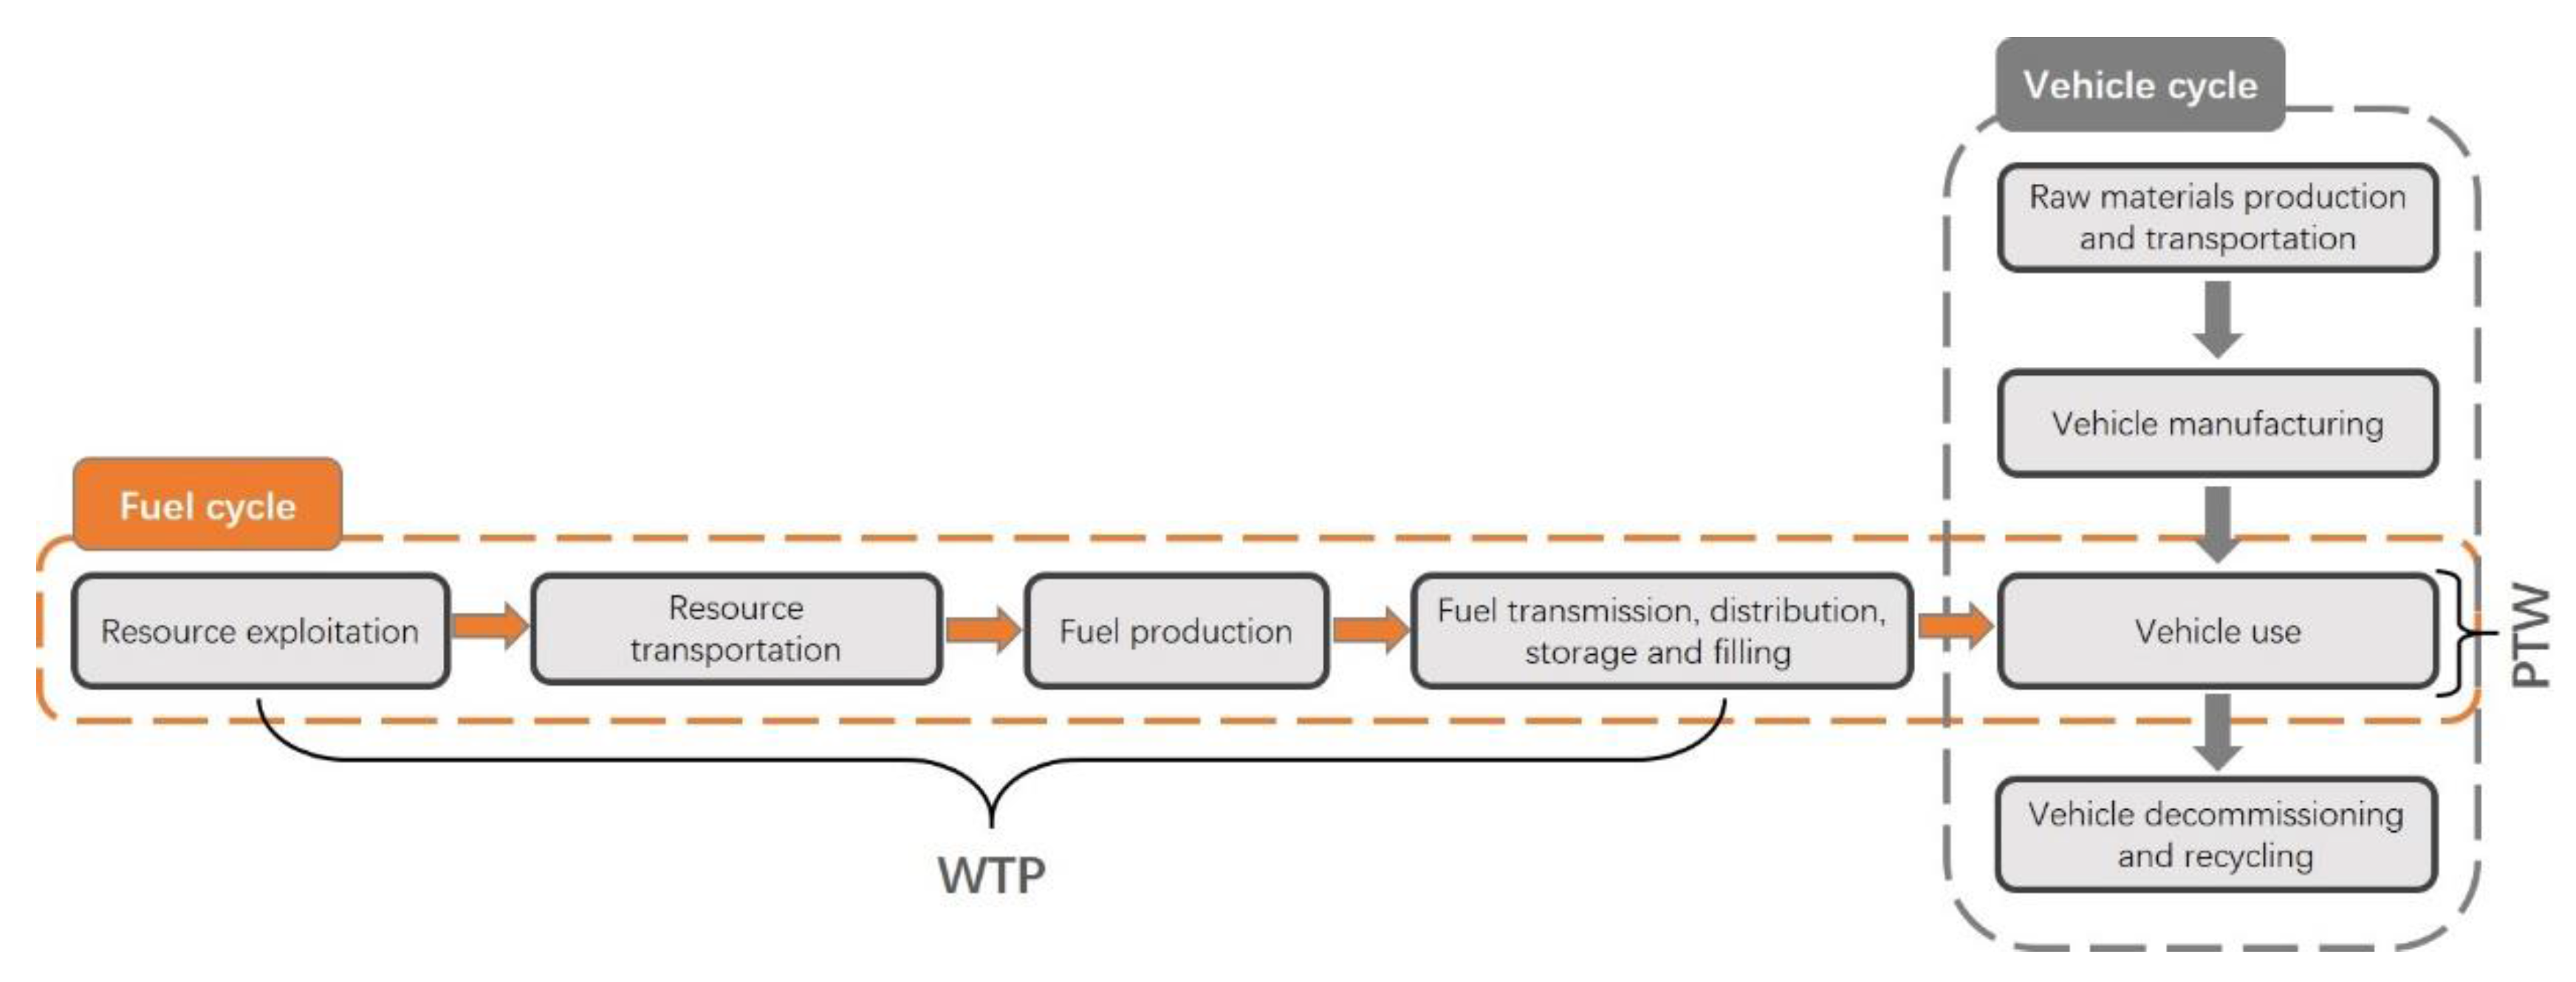
4.7. Impact of Expanding the System Boundary to Vehicle Cycle

Energy consumption and GHG emissions attributed to materials production and transportation, vehicle/battery manufacture, vehicle decommissioning and recycling typically are important in LCA but this kind of works are relied on credible data heavily. Referring to Qiao et al. [50], shown in Table 11, if vehicle lifetime was assumed to be 200,000 km, we could estimate the life cycle energy consumption of a standard mid-size BEV with Li(NiCoMn)O2 (NMC)/LiFePO4 (LFP) and an ICEV are 0.46/0.47 and 0.32 MJ/km, respectively, accounting for 44.3%/44.8% and 21.9% of the whole fuel cycle. The life cycle GHG emissions are 75.0/75.9 and 49.9 g CO2,e/km, respectively, representing 28.9%/29.5% and 9.9% of the whole fuel cycle. The life cycle GHG emissions from the production of a BEV with NMC/LFP and a ICEV are 14.6/14.7 and 9.2 t CO2,e. in earlier study [51]. Especially for the production of traction battery, the life cycle GHG emissions are significant, ranging from 2.7 to 3.1 t CO2,e in China [50,51,52]. The total energy consumption and GHG emissions resulted from vehicle cycle can be reduced largely when considering most of the material in the vehicles can be recycled though the impact was still obvious and could not be negligible [53].
Both the life cycle energy consumption and GHG emissions of a BEV were higher than those of an ICEV [50,51,52,53]. Compared with an equivalent ICEV, a BEV has a different motor, a traction battery and several other new systems that mean the life cycle results of vehicle cycle would be different due to the production of these new and additional components. For various ICEV pathways, the components of standard middle-size passenger vehicles are basically the same, with tiny difference among them such as spark plug. Thus, we assumed that the total GHG emissions from ICEV production were the same for different vehicle/fuel pathway in this paper.
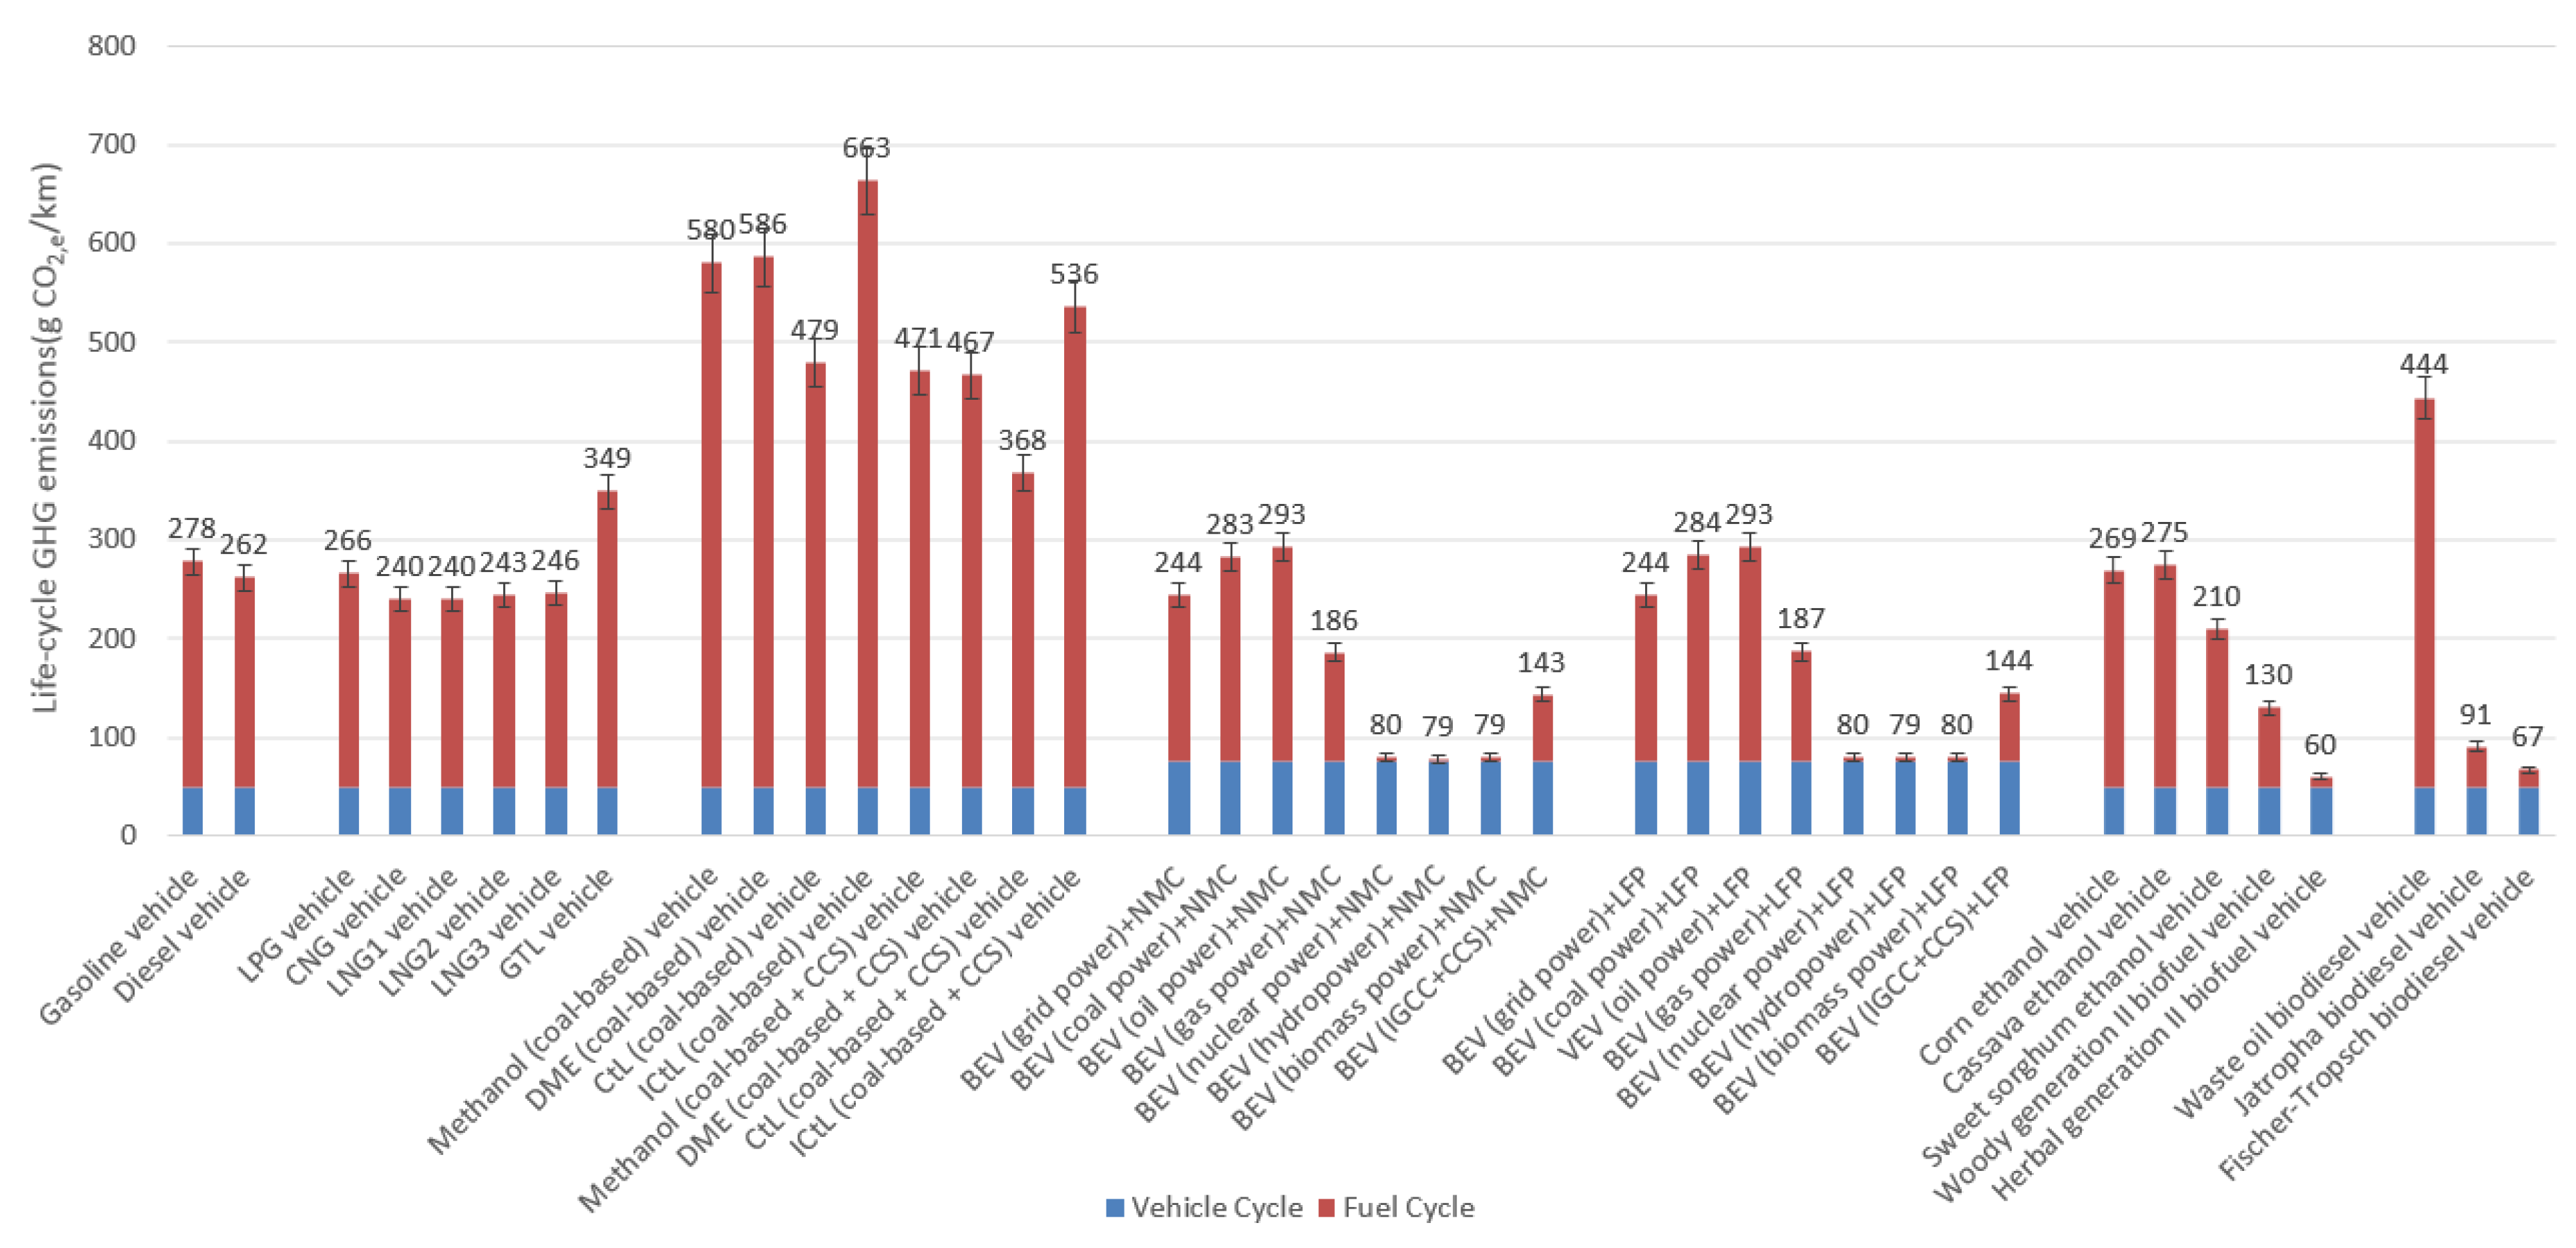
In other words, the inclusion of the vehicle cycle can improve the life cycle analysis method and update the existing results significantly. As shown in Figure 5, the total life cycle GHG emissions of a BEV charged by grid power is only 12% less than that of a gasoline vehicle. Particularly, coal -and oil-powered BEVs caused more GHG emissions than gasoline vehicles, due to that BEVs tended to have larger battery and new components which lead to higher emissions.
Three major factors were analyzed for sensitivity by Qiao et al. [50], including curb weight, GHG emissions factor of electricity production and traction battery. The results indicated that when the curb weight is changed by 10%, the GHG emissions from the production of a BEV with NMC/LFP and a ICEV would be influenced by 7.3%, 6.7% and 6.6%, respectively. Amounts of electricity is consumed during vehicle production, the result showed that the value respective were 3.7%, 3.8% and 3.9%, respectively, when the GHG emissions factor of grid mix changes by 10%.

4.8. Limitations and Further Work of Our Work

It should be noted that this analysis was not strictly compliant with the guidelines of ISO 14040 and 14044 and could not do compilation and evaluation of potential environmental impacts of a product system throughout its life cycle. However, as a very important method in energy system analysis, life cycle analysis method has been widely used globally. A great number of researchers have made efforts to conduct the life cycle analysis of different products and technical pathways. With the increasing demand of vehicle energy and global warming, life cycle energy consumption and GHG emissions have become critical and necessary information influencing the implementation of relevant energy policies, thus most of the studies mainly focus on the two indicators, but did not analyze all relevant environmental impacts as Zah et al. [54] done. To be honest, our analysis did also not fulfil the requirement of ISO standard, though we have made great effort to investigate the energy consumption and GHG emission of vehicle fuel in China.
In addition, the infrastructure and facilities manufacturing such as power plant and oil drilling, and maybe also the abrasive emissions were all important parts of LCA. They were excluded in the system boundary of this study and the significance of them deserve investigating with more credible data.
Furthermore, this analysis only took three types of primary fossil energy input into consideration, this limitation might underestimate the impact of non-fossil fuel energy such as nuclear power and renewable energy, thus the indicator based on cumulative energy consumption would be much more meaningful and practical than our current study.
One more limitation of our analysis is the full evaluation on non-fossil fuel energy has not been taken though the energy consumption and GHG emissions performance is investigated. Some scholars are arguing that the development of non-fossil fuel energy has broader and environmental impacts and cannot be ignored. For example, radioactive emissions are important for the full environmental impacts of nuclear power development.
Accordingly, plenty of works will be further taken to improve our work in future in two key dimensions, to expand the system boundary and to cover full environment impacts analysis.

5. Conclusions

This work has shown that it is important to include China-specific characteristics in the LCA of alternative fuel vehicles in China. The following specific conclusions may be drawn:
(1)
China’s current energy system is dominated by coal with a low overall energy efficiency. Together, these facts hinder the realization of potential decreases in fossil energy consumption and GHG emissions that alternative fuels may offer for vehicles, even if they are able to replace oil as the primary energy source.
(2)
The potential for decreasing the consumption of fossil energy and GHG emissions for the EV pathways, will be more easily realized in the future. Compared with a conventional ICE vehicle driven by coal-derived liquid fuel, coal-powered EV pathways will offer obvious advantages in the future. EV pathways that are powered by a low-carbon electricity grid offer the most potential for future alternative vehicle fuels.
(3)
NG-based fuel pathways showed similar levels of fossil energy consumption and GHG emissions to those for conventional gasoline and diesel vehicles. If only domestically emitted GHGs are considered, the emissions for vehicles in China powered by imported LNG are approximately a third less than for conventional gasoline and diesel vehicles.
(4)
The GHG emissions intensity and energy intensity of conventional coal-based fuel pathways are approximately 1.5–2.6 and 1.1–2.6 times greater, respectively, than those of the conventional gasoline pathway. Applying CCS increases fossil energy consumption to achieve the desired decrease in GHG emissions intensity; however, this remains much higher than that of the conventional gasoline pathway.
(5)
GHG emissions reduction effect of EV pathways will be lower when the vehicle cycle is included, because the GHG emissions from the production of an EV are higher great than ICEV. EVs charged by coal-power even show higher GHG emissions than those of gasoline ICEVs when both the vehicle-cycle and fuel cycle are included.
To promote alternative fuel/vehicle development and guarantee on-road vehicle energy demand, policymakers should establish near-, medium-, and long-term strategies and introduce practical policies to resolve the following key issues:
(i)
To satisfy the increasing on-road vehicle energy demand, in the near-to-medium term, the main aim should be to promote the development of NG-based and coal-based fuels to partly substitute oil-derived fuels. In the longer term, the goal is to promote the development of EVs and R & D into CCS technology to affect a significant replacement of oil consumption and a substantial decrease in GHG emissions.
(ii)
Combined technology-push and market-pull policies not only directly support the development of low-carbon fuel technology but also promote the large-scale industrial development and market penetration of low-carbon fuels. Corresponding recommendations include:
  • Encourage conventional vehicles to use fossil energy-saving technologies, such as hybrid EVs.
  • Promote the development of renewable energy, and accelerate R & D to commercialize CCS and other low-carbon electricity technologies.
  • Accelerate the construction of transmission, distribution, and filling infrastructure for alternative liquid fuels.
  • Support the demonstration of commercial operation of EVs to promote market expansion and the construction of charging infrastructure.
  • Promote low-carbon liquid alternative fuels through the active development of the coal chemical industry, application of CCS technology as well as the development of second generation biofuels.
  • Optimize the production process of vehicle (especially battery materials) to lower the GHG emissions during the manufacturing of vehicle.
  • Accelerate the vehicle recycling industry, and promote the development of effective vehicle recycling techniques.

Acknowledgments

This project was co-sponsored by the National Natural Science Foundation of China (71774095, 71690244 and 71673165) and International Science & Technology Cooperation Program of China (2016YFE0102200). The authors thank the reviewers for their valuable comments.

Author Contributions

Xunmin Ou conceived and designed the research framework. Tianduo Peng, Sheng Zhou, Zhiyi Yuan and Xunmin Ou analyzed the data and wrote the paper.

Conflicts of Interest

The authors declare no conflict of interest.

Nomenclature

Symbol
ithe type of primary fossil energy
jthe type of end-us energy
pthe number of sub-stage in the life cycle
qthe type of electricity pathway
ηenergy efficiency
Variable
CH4,LClife-cycle CH4 emission intensities (g/MJ)
CO2,LClife-cycle CO2 emission intensities (g/MJ)
ELClife-cycle primary fossil energy intensities (MJ/MJ)
EFLClife-cycle primary fossil energy consumption factors of end-use energy (MJ/MJ)
ENend-us energy consumption factors (MJ/MJ)
FEfuel/energy efficiency (MJ/km)
GHGLClife-cycle GHG emissions intensities (g CO2,e/MJ)
N2O,LClife-cycle N2O emission intensities (g/MJ)
SHproportions of end-use energy consumed in different sub-stages
Rthe losses during electricity transmission
Wproportions of different electricity pathways
Abbreviations
CCcarbon content
CCScarbon capture and storage
CO2,eCO2 equivalents
CAERCChina Automotive Energy Research Center, Tsinghua University
CNGcompressed natural gas
CtLcoal-to-liquid
DMEdimethyl ether
EVelectric vehicle
FORfuel oxidation rate
GHGgreenhouse gas
GREETThe Greenhouse gases, Regulated Emissions, and Energy use in Transportation model
GTLgas-to-liquid
ICEinternal combustion engine
ICEVinternal combustion engine vehicle
ICtLindirect coal-to-liquid
kmkilometer
LClife-cycle
LCAlife-cycle analysis
LEMLife cycle Emissions Model
LFPLiFePO4
LPGliquefied petroleum gas
LNGliquefied natural gas
NGnatural gas
NMCLi(NiCoMn)O2
PTWpump-to-wheels
TLCAMTsinghua life-cycle analysis model
WTPwell-to-pump
WTWwell-to-well

Appendix A. Calculation of Life Cycle Factors for a Given End-Use Energy

A.1. Basic Definitions and Assumptions

The fossil energy intensity (EFLC, MJ/MJ) and GHG emissions intensity (GHGLC, g CO2,e/MJ) for a given secondary energy (SE) were defined as the sum of all the primary fossil energy consumption (PFEC) and GHG emissions, respectively, across the entire fuel life cycle required to produce and use 1 MJ of the end-use energy.
As Table A1 shows, three fossil primary energies (PEs) were considered—coal, NG, and petroleum ( i represents the type of PE)—alongside nine SEs (represented by j , x or z ). For each SE, the LCA included m stages. For electricity generation (as denoted by n ), four energy sources were considered: coal, NG, oil and “other”.
Table A1. Energy types and production stages modeled.
No. i (PE) j , x or z (SE) m (Stage Name) n (Electricity Pathway)
1CoalCrude coal aFeedstock productionCoal-based
2NGCrude NG bFeedstock transportationNG- based
3PetroleumCrude oil bFuel productionOil-based
4--Coal cFuel transportationOthers
5--NG c----
6 Diesel
7 Gasoline
8 Residual oil
9 Electricity
Note: a only recovered; b recovered and processed; c recovered, processed and transported.

A.2. Calculation of Fossil Energy Intensity

E F L C , j (the life cycle PFEC intensity of SE j ) was calculated as the sum of all values of E F L C , j , i (the life cycle PE i intensity of SE j ):
E F L C , j = i = 1 3 E F L C , j , i   ( j = 1 , 2 , , 9 )
E F L C , j , i was calculated using E I m , j (the total PE input during sub-stage m to produce 1 MJ of SE j ), S H m , j , z (the share of SE z in the sub-stage m ’s total energy use per MJ of SE j produced) and E F L C , z , i (the life cycle PE i intensity of SE z ):
E F L C , j , i = m = 1 4 ( E I m , j z = 1 9 ( S H m , j , z E F L C , z , i ) ) + δ i , j δ i , j = { 1 w h e n ( i , j ) { ( 1 , 1 ) , ( 1 , 4 ) , ( 2 , 2 ) , ( 2 , 5 ) , ( 3 , 3 ) , ( 3 , 6 ) , ( 3 , 7 ) , ( 3 , 8 ) } 0 o t h e r w i s e
Thus, E F L C , j could be calculated as:
{ E F L C , j = i = 1 3 m = 1 4 ( E I m , j z = 1 9 ( S H m , j , z E F L C , z , i ) ) + γ j γ j = { 0 f o r j = 9 1 o t h e r w i s e
For a non-electricity SE ( j = 1 , 2 , , 8 ), E I was derived from sub-stage m’s energy-transformation efficiency factor per MJ of SE j obtained ( η m , j ) and the conversion factor from feedstock to fuel during the fuel production sub-stage for SE j ( ξ j ; MJ/MJ):
E I 1 , j = ( 1 / η 1 , j 1 ) / ξ j   ( j = 1 , 2 , , 8 )
E I 2 , j = ( 1 / η 2 , j 1 ) / ξ j   ( j = 1 , 2 , , 8 )
E I 3 , j = 1 / η 3 , j 1   ( j = 1 , 2 , , 8 )
E I 4 , j = 1 / η 4 , j 1   ( j = 1 , 2 , , 8 )
For electricity ( j = 9 ), the life cycle calculations were computed directly from sub-stage 3 using the nationally averaged supply mix to the grid:
E I m , 9 = { n = 1 4 ( R A n / η 3 , 9 , n / η 4 , 9 , n ) f o r m = 3 0 o t h e r w i s e
where R A n is the ratio of the nth electricity pathway to the total electricity generation; and η 3 , 9 , n and η 4 , 9 , n are the energy transformation efficiency factors for the electricity generation and the electricity transmission and distribution sub-stages for the nth electricity pathway, respectively.
Based on Equations (A1)–(A8), η m , j , ξ j and S H m , j , z were required for to calculate E F L C , j , i ( j = 1 , 2 , , 8 ) and R A n , η 3 , 9 , n and η 4 , 9 , n were necessary to calculate E F L C , 9 , i . Because coal, NG, and crude oil occur as both PEs and SEs, Equations (A2)–(A7) were solved using an iterative computational method.

A.3. Calculation of GHG Emissions Intensities

A.3.1. General Description

The life cycle GHG emissions intensity of SE j ( G H G L C , j ) consists of the three key types of GHG emissions ( C O 2 , C H 4 and N 2 O ). These types of GHG were converted into C O 2 equivalents ( C O 2 , e ) according to their global warming potential [39,40]:
G H G L C , j = C O 2 , L C , j + 25 C H 4 , L C , j + 298 N 2 O L C , j
where C O 2 , L C , j , C H 4 , L C , j and N 2 O L C , j are the life cycle C O 2 , C H 4 and N 2 O emission intensities for SE j, respectively.
Similar to E F L C , j , i , G H G L C , j was also calculated using an iterative method (which involved Equations (A12), (A15) and (A18)).

A.3.2. CO2 Emissions

C O 2 , L C , j consists of two parts: emissions from upstream processes ( C O 2 , u p , j , g/MJ) and direct emissions from the fuel-combustion process ( C O 2 , d i r e c t , g/MJ):
C O 2 , L C , j = C O 2 , u p , j + C O 2 , d i r e c t , j
C O 2 , d i r e c t , j = 44 12 C C j F O R j
where C C j is the carbon content of SE j (g/MJ); F O R j is the fuel oxidation rate of SE j ; and 44 12 is the mass conversion factor between C and CO2.
Upstream CO2 emissions ( C O 2 , u p , j ) result from the direct CO2 emissions during the production of SE x ( C O 2 , d i r e c t , x , g/MJ):
C O 2 , u p , j = m = 1 4 x = 1 9 ( E I m , j S H m , j , x ( C O 2 , d i r e c t , x + C O 2 , u p , x ) )
C O 2 , d i r e c t , x was then calculated using the following carbon-balance equation:
C O 2 , d i r e c t , x = 44 12 C C x F O R x
where C C x is the carbon content of SE x (g/MJ); F O R x is the fuel oxidation rate of SE x ; and 44 12 is the mass conversion rate between C and CO2.

A.3.3. CH4 Emissions

Similarly, C H 4 , L C , j also consists of an upstream part ( C H 4 , u p , j ) and a term that represents direct emissions from combustion ( C H 4 , d i r e c t , j ):
C H 4 , L C , j = C H 4 , u p , j + C H 4 , d i r e c t , j
C H 4 , u p , j = m = 1 4 x = 1 9 ( E I m , j S H m , j , x ( C H 4 , d i r e c t , m , x + C H 4 , u p , x ) ) + C H 4 , j , n o n c o m b
C H 4 , j , n o n c o m b = C H 4 , j , r e s o u r c e / ξ j
where C H 4 , d i r e c t , m , x is the direct CH4 emissions during the sub-stage m (g/MJ) of the production of SE x ; C H 4 , j , n o n c o m b corresponds to the indirect CH4 emissions from non-combustion sources, including spills and losses during NG extraction (g/MJ SE j ); and C H 4 , r e s o u r c e corresponds to indirect CH4 emissions during the resource extraction stage (g/MJ resource obtained).

A.3.4. N2O Emissions

N 2 O L C , j also consists of an upstream component ( N 2 O u p , j ) and direct emissions released during combustion ( N 2 O d i r e c t , j ):
N 2 O L C , j = N 2 O u p , j + N 2 O d i r e c t , j
N 2 O u p , j = m = 1 4 x = 1 9 ( E I m , j S H m , j , x ( N 2 O d i r e c t , m , x + N 2 O u p , x ) )
where N 2 O d i r e c t , m , x is the direct N2O emissions released for SE x during stage m (g/MJ).

A.4. Basic Calculation Data

This section presents the basic data used for the calculation of the life cycle fossil energy consumption factors (EFLC) and GHG emissions factors (GHGLC) for the nine end-use energies. Table A2 presents original, China-specific data for oil-, NG-, and coal-based fuels and electricity and includes energy conversion efficiencies, transport distances and the proportion of the different process fuels used in the various resource exploitation, transport, fuel processing and fuel production stages. The energy intensity and breakdown of fuels used by various transport modes are shown in Table A3. Direct and indirect GHG emissions released from the use of various energies in the Chinese context are shown in Table A4.
Table A2. Input data for LCA of different end-use energies.
ItemDescriptionData Source
(1) Oil exploitation
Crude oil import proportion64.4% (2015)[2]
Oil exploitation efficiency93% (Domestic), 98% (Imported)[7,34]
Fuel mix for oil exploitationRefined NG (43%), crude oil (28%), electricity (14%), diesel (9%), raw coal (4%) residual oil (1%) and gasoline (1%)[42]
(2) Oil transportation modeSea tanker: 60% (11,000 km); rail: 30% (942 km); pipeline: 78% (440 km); waterway: 10% (250 km)[34,55]
(3) Oil refining
Process fuel mix for oil refineryCrude oil (79%), raw coal (6%), electricity (6%), refined NG (4%), clean coal (3%), residual oil (2%)[42]
Gasoline production efficiency89.1%[34]
Diesel production efficiency89.7%[34]
Residual oil production efficiency94%[34]
(4) Gasoline, Diesel and Fuel oil transportation modeRailway: 50% (900 km); pipeline: 15% (160 km); waterway: 10% (1200 km); road (short distance): 10% (50 km)[34,55]
(5) NG exploitation and processing
NG exploitation efficiency96%[34]
Fuel mix for NG exploitationRefined NG (43%), crude oil (28%), electricity (14%), diesel (9%), raw coal (4%) residual oil (1%) and gasoline (1%)[42]
Leakage in NG exploitation stage0.34%
NG processing efficiency94%[34]
Fuel mix for NG processingRefined NG (99%) and electricity (1%)[42]
(6) NG transportation modePipeline: 100% (1500 km)[55]
(7) Coal exploitation and processing
Coal exploitation processing efficiency95%[34]
Fuel mix for coal exploitation and processing Raw coal (73%), electricity (15%), clean coal (8%), diesel (3%) and refined NG (1%)[42]
(8) Coal transportation modeRailway: 49% (642 km); waterway: 26% (650 km); road (long distance): 30% (310 km) and road (short distance): 100% (50 km)[42,55]
(9) Electricity supply mixCoal (67.2%), NG (3%), residual oil (0.1%) and many other sources (29.7%)[55]
(10) Loss ratio during transmission and distribution6.67%[55]
(11) Electricity supply efficienciesCoal-based (36.4%), oil-based (32.0%), NG-based (45.9%)[44]
Note: The sum of the proportions of individual transport modes may exceed 100%. We also assume that these values will not change substantially over the medium-to-long term. Refinery gas is used during the refining of crude oil but is not included in our scope of end-use energies. We therefore assumed that this refining byproduct did not consume additional primary fossil energy but had a GHG emission intensity of 65 g/MJ.
Table A3. Energy intensity and fuel structure of various transport modes [34].
Transport ModeEnergy Intensity (kJ/ton km)Fuel Types and Structures
Ocean23Fuel oil (100%)
Railway68Diesel (41%), electricity (59%)
Crude oil pipeline300Fuel oil (50%), electricity (50%)
NG pipeline372NG (90%), electricity (10%)
Water transport148Fuel oil (100%)
Short-distance highway1362Diesel (72%), gasoline (28%)
Long-distance highway1200Diesel (72%), gasoline (28%)
Table A4. Data related to direct and indirect GHG emissions for the Chinese context [39,45].
End-Use EnergyCCj (g/MJ)FORj (g/MJ)CH4,direct (g/MJ)CH4,noncomb (g/MJ)N2Odirect (g/MJ)
Raw coal24.080.90.0010.4060.001
Raw NG15.30.990.0010.0720.001
Crude oil200.980.0020.0090
Clean coal25.80.90.0010.4060.001
Processed NG15.70.990.0010.0720.001
Diesel20.20.980.0040.0090.002/0.028 a
Gasoline18.90.980.080.0090.002
Fuel oil21.10.980.0020.0090
Electricity------0.98--
Note: a The value of 0.002 is for vehicle but 0.028 for others.

References

  1. National Bureau of Statistics of China (NBSC). Annual Possession of Civil Vehicles; NBSC: Beijing, China, 2016. Available online: http://data.stats.gov.cn/easyquery.htm?cn=C01 (accessed on 10 March 2017).
  2. China National Petroleum Corporation (CNPC); Economics & Technology Research Institute. Domestic and Foreign Oil and Gas Industry Development Annual Report 2016; Petroleum Industry Press: Beijing, China, 2016. (In Chinese) [Google Scholar]
  3. China Electric Vehicles Committee of 100 (China EV 100). China EV 100 Annual Research Report; China EV 100: Beijing, China, 2017. (In Chinese) [Google Scholar]
  4. National Bureau of Statistics of China (NBSC). Annual Consumption of Gasoline and Diesel; NBSC: Beijing, China, 2016. Available online: http://data.stats.gov.cn/english/easyquery.htm?cn=C01 (accessed on 18 October 2016).
  5. Development Research Center the State Council (DRC). China Natural Gas Development Report 2016; Petroleum Industry Press: Beijing, China, 2016. (In Chinese)
  6. Wang, M.; Weber, T. Well-to-Wheels Energy Use and GHG Emissions of Advanced Fuel/Vehicles System—North American Analysis; Argonne National Laboratory: Lemont, IL, USA, 2001.
  7. Argonne National Laboratory (ANL). The Greenhouse Gases, Regulated Emissions, and Energy Use in Transportation Model; Argonne National Laboratory: Lemont, IL, USA, 2016. Available online: https://greet.es.anl.gov (accessed on 21 January 2017).
  8. Delluchi, M.A. Emissions of GHG from the Use of Transportation Fuels and Electricity—Volume1: Main Text; Center for Transportation Research, Argonne National Laboratory: Lemont, IL, USA, 1991.
  9. Delluchi, M.A. A Lifecycle Emissions Model (LEM): Main Texts; Institute of Transportation Studies, University of California: Davis, CA, USA, 2003. [Google Scholar]
  10. Wallace, J.; Wang, M.; Weber, T.; Finizza, A. GM Study: Well-to-Wheel Energy Use and Greenhouse Gas Emissions of Advanced Fuel/Vehicle Systems—North American Analysis; Technical Report; Argonne National Laboratory: Lemont, IL, USA, 2001.
  11. Muratori, M.; Moran, M.J.; Serra, E.; Rizzoni, G. Highly-resolved modeling of personal transportation energy consumption in the United States. Energy 2013, 58, 168–177. [Google Scholar] [CrossRef]
  12. Rahman, M.M.; Canter, C.; Kumar, A. Well-to-wheel life cycle assessment of transportation fuels derived from different North American conventional crudes. Appl. Energy 2015, 156, 159–173. [Google Scholar] [CrossRef]
  13. Concawe; EUCAR; EC Joint Research Centre. Well-to-Wheels Analysis of Future Automotive Fuels and Powertrains in the European Context. 2007. Available online: https://iet.jrc.ec.europa.eu/about-jec/sites/iet.jrc.ec.europa.eu.about-jec/files/documents/wtw3_wtw_report_eurformat.pdf (accessed on 8 December 2016).
  14. Torchio, M.F.; Santarelli, M.G. Energy, environmental and economic comparison of different powertrain/fuel options using well-to-wheels assessment, energy and external costs—European market analysis. Energy 2010, 35, 4156–4171. [Google Scholar] [CrossRef]
  15. Patil, V.; Shastry, V.; Himabindu, M. Life cycle analysis of energy and greenhouse gas emissions of automotive fuels in India: Part 2—Well-to-wheels analysis. Energy 2016, 96, 699–712. [Google Scholar] [CrossRef]
  16. Orsi, F.; Muratori, M.; Rocco, M. A multi-dimensional well-to-wheels analysis of passenger vehicles in different regions: Primary energy consumption, CO2 emissions, and economic cost. Appl. Energy 2016, 169, 197–209. [Google Scholar] [CrossRef]
  17. Choi, W.; Song, H.H. Well-to-wheel analysis on greenhouse gas emission and energy use with natural gas in Korea. Int. J. Life Cycle Assess. 2014, 19, 850–860. [Google Scholar] [CrossRef]
  18. Ou, X.; Yan, X.; Zhang, X. Using coal for transportation in China: Life cycle GHG of coal-based fuel and electric vehicle, and policy implications. Int. J. Greenh. Gas Control 2010, 4, 878–887. [Google Scholar] [CrossRef]
  19. Ke, W.; Zhang, S.; He, X. Well-to-wheels energy consumption and emissions of electric vehicles: Mid-term implications from real-world features and air pollution control progress. Appl. Energy 2017, 188, 367–377. [Google Scholar] [CrossRef]
  20. Zhang, L.; Huang, Z. Analysis of life cycle energy consumption and greenhouse gases emission of coal-based vehicle fuels. J. China Coal Soc. 2006, 31, 662–665. (In Chinese) [Google Scholar]
  21. Wang, L.; Xie, X.; Huang, Z. Life Cycle Energy Use and GHG Emissions Assessment for Coal Derived DME and FTD. Coal Chem. Ind. 2016, 44, 12–15. (In Chinese) [Google Scholar]
  22. Ou, X.; Zhang, X. Life-Cycle Analyses of Energy Consumption and GHG Emissions of Natural Gas-Based Alternative Vehicle Fuels in China. J. Energy 2013, 2013, 268263. [Google Scholar] [CrossRef]
  23. Ou, X.; Zhang, X.; Zhang, X. Life Cycle GHG of NG-Based Fuel and Electric Vehicle in China. Energies 2013, 6, 2644–2662. [Google Scholar] [CrossRef]
  24. Zhou, G.; Ou, X.; Zhang, X. Development of electric vehicles use in China: A study from the perspective of life-cycle energy consumption and greenhouse gas emissions. Energy Policy 2013, 59, 875–884. [Google Scholar] [CrossRef]
  25. Canals Casals, L.; Martinez-Laserna, E.; Amante García, B.; Nieto, N. Sustainability analysis of the electric vehicle use in Europe for CO2 emissions reduction. J. Clean. Prod. 2016, 127, 425–437. [Google Scholar] [CrossRef]
  26. Requia, W.J.; Adams, M.D.; Arain, A.; Koutrakis, P.; Ferguson, M. Carbon dioxide emissions of plug-in hybrid electric vehicles: A life-cycle analysis in eight Canadian cities. Renew. Sustain. Energy Rev. 2017, 78, 1390–1396. [Google Scholar] [CrossRef]
  27. Tamayao, M.M.; Michalek, J.J.; Hendrickson, C.; Azevedo, I.M.L. Regional variability and uncertainty of electric vehicle life cycle CO2 emissions across the United States. Environ. Sci. Technol. 2015, 49, 8844–8855. [Google Scholar] [CrossRef] [PubMed]
  28. Granovskii, M.; Dincer, I.; Rosen, M.A. Life cycle assessment of hydrogen fuel cell and gasoline vehicles. Int. J. Hydrog. Energy 2006, 31, 337–352. [Google Scholar] [CrossRef]
  29. Toyota (Toyota Motor Corporation). Well-to-Wheel Analysis of Greenhouse Gas Emissions of Automotive Fuels in the Japanese Context; Toyota Motor Corporation: Tokyo, Japan, 2004; Available online: http://www.mizuho-ir.co.jp/english/ (accessed on 26 February 2017).
  30. Van Mierlo, J.; Messagie, M.; Rangaraju, S. Comparative environmental assessment of alternative fueled vehicles using a life cycle assessment. Transp. Res. Procedia 2017, 25, 3435–3445. [Google Scholar] [CrossRef]
  31. Zhang, Q. Research on the Path Selection of Alternative Automobile Fuels Based on the LCA Theory; Tianjin University: Tianjin, China, 2012. [Google Scholar]
  32. Shen, W.; Han, W.J.; Chock, D.; Chai, Q.H.; Zhang, A.L. Well-to-wheels life cycle analysis of alternative fuels and vehicle technologies in China. Energy Policy 2012, 49, 296–307. [Google Scholar] [CrossRef]
  33. Ou, X.; Yan, X.; Zhang, X. Life cycle analysis on energy consumption and GHG emission intensities of alternative vehicle fuels in China. Appl. Energy 2012, 90, 218–224. [Google Scholar] [CrossRef]
  34. Li, X.; Ou, X.; Zhang, X.; Zhang, Q.; Zhang, X. Life cycle fossil energy consumption and greenhouse gas emission intensity of dominant secondary energy pathways of China in 2010. Energy 2013, 50, 15–23. [Google Scholar] [CrossRef]
  35. Ou, X.; Yan, X.; Zhang, X. Life-cycle energy consumption and greenhouse gas emissions for electricity generation and supply in China. Appl. Energy 2011, 88, 289–297. [Google Scholar] [CrossRef]
  36. Ou, X.; Zhang, X.; Chang, S. Energy consumption and GHG emissions of six biofuel pathways by LCA in (the) People’s Republic of China. Appl. Energy 2009, 86, 197–208. [Google Scholar] [CrossRef]
  37. Ou, X.; Zhang, X.; Chang, S. Alternative fuel buses currently in use in China: Life-cycle fossil energy use, GHG emissions and policy recommendations. Energy Policy 2010, 38, 406–418. [Google Scholar] [CrossRef]
  38. Ou, X.; Zhang, X.; Chang, S. Scenario analysis on alternative fuel/vehicle for China’s future road transport: Life-cycle energy demand and GHG emissions. Energy Policy 2010, 38, 3943–3956. [Google Scholar] [CrossRef]
  39. Intergovernmental Panel on Climate Change (IPCC). IPCC Guidelines for National GHG Inventories; IPCC: Geneva, Switzerland, 2006; Available online: http://www.ipcc-nggip.iges.or.jp/public/2006gl (accessed on 15 September 2015).
  40. Intergovernmental Panel on Climate Change (IPCC). IPCC Fourth Assessment Report: Climate Change 2007; IPCC: Geneva, Switzerland, 2007. [Google Scholar]
  41. Ou, X.M.; Zhang, X.L. Life Cycle Analysis of the Automotive Energy Pathways in China; Tsinghua University Press: Beijing, China, 2011. (In Chinese) [Google Scholar]
  42. Bureau of Statistics of China. China Energy Statistical Yearbook; China Statistics Press: Beijing, China, 2016.
  43. Weisser, D. A guide to life cycle greenhouse gas (GHG) emissions from electric supply technologies. Energy 2007, 32, 1543–1559. [Google Scholar] [CrossRef]
  44. China Academy of Engineering (CAE). Greenhouse Gas Emissions of Different Power Energy in China; Atomic Energy Press: Beijing, China, 2015. (In Chinese) [Google Scholar]
  45. Intergovernmental Panel on Climate Change (IPCC). Carbon Dioxide Capture and Storage: IPCC Special Report; IPCC: Geneva, Switzerland, 2005. [Google Scholar]
  46. Shen, W. Well-to-Wheel Analysis on Energy Use, GHG Emissions and Cost of Vehicle Fuels in Future China; Tsinghua University: Beijing, China, 2007. (In Chinese) [Google Scholar]
  47. Jaramillo, P.; Samaras, C.; Wakeley, H.; Meisterling, K. Greenhouse gas implications of using coal for transportation: Life cycle assessment of coal-to-liquids, plug-in hybrids, and hydrogen pathways. Energy Policy 2009, 37, 2689–2695. [Google Scholar] [CrossRef]
  48. Wang, R. Fuel-Cycle Assessment of Energy and Environmental Impacts from Electric Vehicles and Natural Gas Vehicles; Tsinghua University: Beijing, China, 2015. (In Chinese) [Google Scholar]
  49. Chinese Electricity Council (CEC). China Electric Power Statistics Analysis 2015; CEC: Beijing, China, 2016. (In Chinese) [Google Scholar]
  50. Qiao, Q.; Zhao, F.; Liu, Z.; Jiang, S.; Hao, H. Cradle-to-gate greenhouse gas emissions of battery electric and internal combustion engine vehicles in China. Appl. Energy 2017, 204, 1399–1411. [Google Scholar] [CrossRef]
  51. Qiao, Q.; Zhao, F.; Liu, Z.; Jiang, S.; Hao, H. Comparative Study on Life Cycle CO2, Emissions from the Production of Electric and Conventional Vehicles in China. Energy Procedia 2017, 105, 3584–3595. [Google Scholar] [CrossRef]
  52. Hao, H.; Mu, Z.; Jiang, S.; Liu, Z.; Zhao, F. GHG Emissions from the production of lithium-ion batteries for electric vehicles in China. Sustainability 2017, 9, 504. [Google Scholar] [CrossRef]
  53. Hao, H.; Qiao, Q.; Liu, Z.; Zhao, F. Impact of recycling on energy consumption and greenhouse gas emissions from electric vehicle production: The China 2025 case. Resour. Conserv. Recycl. 2017, 122, 114–125. [Google Scholar] [CrossRef]
  54. Zah, R.; Böni, H.; Gauch, M.; Hischier, R.; Lehmann, M.; Wäger, P. Life Cycle Assessment of Energy Products: Environmental Assessment of Biofuels; EMPA: Bern, Switzerland, 2007. [Google Scholar]
  55. China Traffic and Transportation Association (CTTA). Year Book of China Transportation and Communications 2014; China Communications Press: Beijing, China, 2016. [Google Scholar]
Figure 1. Stages and cycles included in life cycle analysis (LCA) system boundary.
Sustainability 09 02183 g001
Figure 2. Life cycle GHG emissions for various vehicle fuels by stage.
Sustainability 09 02183 g002
Figure 3. Life cycle primary fossil fuel consumption for various vehicle fuels (vehicle cycle excluded).
Sustainability 09 02183 g003
Figure 4. Life cycle GHG emissions for various vehicle fuels (vehicle cycle excluded).
Sustainability 09 02183 g004
Figure 5. Life cycle GHG emissions for various vehicle fuels (vehicle cycle included).
Sustainability 09 02183 g005
Table 1. Stages included in Well-to-Well (WTW) analysis for different fuel pathways.
Well-to-Pump (WTP)Pump-to-Wheels (PTW)
Resource ExploitationResource TransportationFuel ProductionFuel Transmission, Distribution, Storage and FillingFuel Utilization
Crude oil exploitationCrude oil transportationRefining gasoline, oxygenate refining, and oxygenated gasoline preparationGasoline transmission and distributionFuel combustion in the internal combustion engine
Refining dieselDiesel transmission and distribution
Refining LPG (Liquefied Petroleum Gas)LPG transmission and distribution
Coal mining, processing and washingCoal transportationCoal gasification and synthesis of methanolMethanol transmission and distribution
Coal gasification and synthesis of DME (Dimethyl Ether)DME transmission and distribution
Production of CtL (Coal to Liquid)CtL transmission and distribution
Gas exploitation and purificationNG transportationNG compressionCNG transmission and distribution
NG liquefactionLNG transmission and distribution
GTL (Gas to Liquid) productionGTL transmission and distribution
Crude oil, NG, coal, and other raw materials exploitation and processingTransportation of raw materialsRaw material electricity generationElectricity transport, distribution and battery chargingDriving electric motor
Table 2. LPG transmission and distribution parameters [34].
Modes of TransportOceanRailwayPipelineWaterHighway
Proportion (%)308001510
Average transport distance (km)70009000120050
Note: The sum of the proportions of individual transport modes may exceed 100%.
Table 3. Energy efficiencies for the different NG-based fuel pathways [7,23].
NG-Based FuelEnergy Efficiency (%)Process Fuel Mix
CNG96.9%NG (97%) and electricity (3%)
LNG 191.0%NG (98%) and electricity (2%)
LNG 295.19%Electricity (100%)
LNG 395.19%Electricity (100%)
GTL54.20%NG (100%)
Table 4. Transmission and distribution parameters for NG-based fuels [23].
NG-Based FuelTransport Mode
CNG- -
LNG 1Waterway: 100% (6700 km), Road vehicle: 100% (100 km)
LNG 2Road vehicle: 100% (100 km)
LNG 3Road vehicle: 100% (100 km)
GTLRailway: 50% (900 km); pipeline: 15% (160 km); waterway: 10% (1200 km); road (short distance): 10% (50 km)
Table 5. Energy efficiencies and process fuels for fuels produced via different CTL processes [33,41].
Coal-Based ProductEnergy Efficiency Process Fuel Mix
Coal-based methanol50.22%Coal (91%) and electricity (9%)
Coal-based DME47.46%Coal (93%) and electricity (7%)
Direct CtL49.30%Coal (100%)
Indirect CtL41.41%Coal (100%)
Table 6. Life cycle energy-use intensity and GHG-emissions intensity of non-fossil electricity-generating pathways.
Electricity TypeFossil Energy Use (MJ/MJ)GHG Emissions (g CO2,e/MJ)Data Source
Nuclear0.0636.506[33]
Biomass0.0765.846[43]
Hydro and Others05[44]
Table 7. PTW efficiency for various vehicle fuels in China [33,35,48].
Vehicle Fuel TypeVehicle Power Technology TypeRunning Distance per Unit of Energy (%) (Base = 100%)Energy Consumption per Unit of Distance (Base = 1.00)
GasolineICE100.01.00
DieselICE109.90.91
LPG ICE95.21.05
CNGICE95.21.05
LNGICE99.71.00
GTLICE120.00.83
EthanolICE100.01.00
Methanol ICE100.01.00
DMEICE105.00.95
BiodieselICE109.90.91
Direct CtLICE117.60.85
Indirect CtLICE98.01.02
ElectricityElectromotor351.00.28
Table 8. Calculated life cycle fossil energy and GHG emissions intensities for China in 2015.
ItemEFLCEFLC,CoalEFLC,NGEFLC,OilGHGLCCO2,upCH4,upN2Oup
UnitMJ/MJMJ/MJMJ/MJMJ/MJgCO2,e/MJg/MJg/MJmg/MJ
Raw coal1.0711.0680.0010.00298.35.7760.4340.127
Raw NG1.1410.0411.0520.04867.59.6600.0930.403
Crude oil1.0970.0280.0361.03379.26.6920.0240.279
Clean coal1.0861.0700.0020.01499.46.8460.4350.377
processed NG1.1450.0411.0560.04869.39.9340.0930.409
Diesel1.2590.0660.0471.14692.318.5750.0410.406
Gasoline1.2680.0680.0471.15390.219.2160.0420.411
Fuel oil1.1970.0520.0421.10290.814.0220.0340.360
Electricity2.2502.1400.0750.035203.4181.5070.8772.848
Table 9. Primary energy consumption and energy conversion efficiency of vehicle fuel pathways.
PathwayEnergy Consumption (MJ/MJ)Energy Conversion Efficiency (%)
Coal ConsumptionOil ConsumptionNG ConsumptionTotal Consumption
Gasoline0.0720.0521.1581.28277.98
Diesel0.0700.0511.1511.27378.57
LPG0.0490.0471.1611.25779.57
CNG0.0711.1200.0061.19883.49
LNG10.0151.2280.0401.28277.97
LNG20.1131.1180.0131.24480.37
LNG30.1161.1290.0141.25979.44
GTL0.0432.0460.0522.14146.71
Coal-based methanol2.2970.0120.0492.35842.40
Coal-based DME2.4170.0110.0532.48040.32
CtL2.1720.0040.0342.21045.25
ICtL2.5860.0040.0392.62938.03
Coal-based methanol + CCS2.7200.0180.0602.79735.75
Coal-based DME + CCS2.8530.0170.0632.93334.09
CtL + CCS2.4900.0040.0382.53239.49
ICtL + CCS3.2440.0050.0483.29830.32
Grid electricity2.1400.0750.0352.25044.45
Coal electricity3.1470.0050.0423.19431.31
Oil electricity0.1840.1503.6964.03024.81
Gas electricity0.0172.6250.0132.65637.65
Nuclear electricity0.0520.0050.0060.063--
Biomass electricity0.010.0020.0640.076--
Hydropower and Others0000--
Table 10. Energy consumption and GHG emission intensity results for NG-based and electricity pathways from different studies.
PathwayRegionEnergy Intensity (MJ/MJ)GHG Intensity (g CO2,e/MJ)Data Source
ElectricityChina2.25203This study
ElectricityChina2.70230[16]
ElectricityChina2.33230[7]
ElectricityUS1.92162[7]
ElectricityEurope1.52116[14]
CNGChina1.2072This study
CNGChina1.46--[32]
CNGChina1.2378[31]
CNGUS1.1677[7]
CNGEurope1.1971[14]
LNGChina1.28/LNG 1, 1.24/LNG 2, 1.26/LNG 375.9/LNG 1, 77.2/LNG 2, 78.1/LNG 3This study
LNGUS1.2176.4[7]
Table 11. Life cycle energy consumption and GHG emissions from vehicle cycle [50].
UnitICEVBEV-NMCBEV-LFP
Life cycle energy consumptionMJ/per vehicle63.51592,39294,341
Life cycle GHG emissionskg CO2,e/per vehicle998515,00515,174

