Abstract
The purpose of this research is to identify the status and role of mobile technology in achieving sustainable and smart tourism, and to suggest future research and strategy directions for academia and managers in practice. This research utilized multiple sources, such as patents, academic articles, and news, and selected methodologies optimized for the purpose of each study. Study 1 used Netminer, a social network analysis program, to analyze the relationships between patent’s International Patent Classification (IPC) codes. Study 2 used the T-LAB program for content analysis to analyze the texts of patents, journal articles, and news. Study 3 used the Leximancer program, which utilizes relative frequency to analyze mobile app consumer reviews. In study 1, we identified various forms of data related technologies and mobile technologies for smart city systems and maps. In study 2, we found the environment, sustainability, business, and market themes to be related to mobile technology. In study 3, we explored consumers’ attitudes and preferences for mobile travel app using their reviews. Advances in mobile technology are expected to create innovative experiences for consumers, foster a sustainable competitive advantage for tourism destinations and tourism-related suppliers, and create sustainable competencies for smart tourism.
1. Introduction
For the past three decades, research on tourism has endeavored to describe sustainability in the field. Through this effort, researchers were able to formulate the concept of sustainable tourism and have it show positive results by establishing a theoretical foundation and expanding the base of quantitative studies [1,2,3,4,5]. Furthermore, because mobile technology has become an indispensable commodity in daily life, its relationships with tourism, along its role, are key topics to be addressed in this field. This naturally leads to how to conceptualize mobile technology as a driver of change within a sustainable tourism framework and to establish a related theoretical foundation. In 2015, Gretzel et al. and Li et al. emphasized the role of mobile technology in tourism and attempted to conceptualize smart tourism, which further highlights the importance of the topic [6,7,8,9].
To formulate theoretical foundation and directions for empirical research on smart tourism based on mobile technology, it is essential to understand in advance the goals of tourism and how sustainability in tourism led to these goals. The theme of sustainability in tourism emerged as a regulatory interest to resolve environmental concerns and global inequality in the 1960s and 1970s, when global tourism exhibited growth [10], and this theme was primarily based on the observation of the negative impacts of tourism that exceed its the benefits. These negative impacts included inflation, housing price increase, temporary influx of strangers and the consequent increases in the crime rate, and undesirable influences on local children [1]. Sustainable development focused on the goal of minimizing negative impacts and maximizing social, environmental, and economic impacts by proposing moral and ethical goals to stakeholders, such as tourists, residents, and firms [10,11,12].
During this period, researchers explored the relationship between the competitiveness and sustainability of tourism desetinations [13], government interventions, regulations, and partnerships in sustainable tourism development [3,4], the creation of indicators to evaluate tourism sustainability [14], measurements of sustainability in tourism [15,16,17,18], and sustainable strategies in tourism [2,19,20,21]. However, the discussion on the role of technology in sustainable tourism was limited and was not a key aspect of the sustainable tourism conversation.
From 2007, with release of iPhone driving the adoption of the smartphone and the deployment of LTE and Wi-Fi mobile networks [22,23], mobile technology became an essential determinant of quality of life and the direction of an industry [24]. The diffusion of mobile technology in daily life and industries has surpassed expectations, and tourism is no exception [6,25]. The importance of ICT in tourism was acknowledged [26,27], and smart city was explored as the most commonly used label to represent sustainable city [28].
New technology changes the structure and process of an industry and brings opportunities and threats to stakeholders [29]. Through mobile technology, we can expect that tourism acquires sustainable competencies and contributes to economic development [6,9]. Researchers in the field of tourism should formulate the direction of empirical research and establish a theoretical foundation and conceptualization using the basic components of tourism, sustainability, and technology. By consideration, the technology axis should include mobile technology as an independent axis.
Gretzel et al. (2015) stated that smart tourism is tourism that collects and consolidates data on destinations, provides rich onsite experiences to users with the support of mobile technology, and creates value from a business perspective. Sources of data include the physical infrastructure, social connections, government/organizations, and human bodies/minds, and these integrated efforts are assumed to focus on efficiency and sustainability [6,8,30,31].
Mobile technology is expected to resolve challenges that have persisted. These challenges include precise and continuous assessment of the impact of tourism, analyzing mutual interactions between tourists and environments, monitoring and analyzing mutual interactions among other activities at the destination, and supporting tourism planning and tourism development by identifying a tourist’s needs and expectations [1,32].
Researchers are endeavoring to formulate the conceptual framework of smart tourism and expand the base of research by setting predictable relationships and responses among technology, tourists, the industry, residents, and the community [6,7,9,31,33]. The outputs of the effort include theoretical and conceptual systematization, a general description of technology, and consumers’ adoption of mobile technology in tourism [34,35,36]. All of these studies are essential to determining relationships among new technology, consumers, related players, and industries. However, at this point, we also need to adopt a comprehensive view of the current research landscape regarding the theme of mobile technology and tourism in both practice and academia.
The purpose of this research is to identify the role of mobile technology in achieving sustainable and smart tourism from the technology and customer perspectives, and to suggest future research and technology directions for academia and managers in practice. In the past, discussions on relationships between information technology and tourism occurred in both academia and practice under the theme of e-tourism [29,37]. We intend to formulate relationships between mobile technology and tourism and to clarify concepts using real field data by considering the findings and discussions on e-tourism with a particular focus on the uniqueness of mobile environments. Three research questions naturally arise from this purpose.
RQ1. What are the mobile technologies that is at its core in tourism and the relationship between technologies?
The first question also covers the similarities and differences between technologies in PC-based e-tourism and mobile tourism.
RQ2. What are the issues and variables related to mobile technology in tourism?
The second research questions covers the context and circumstance related to the stakeholders of a tour (e.g., tourists) under which mobile technology is utilized.
RQ3. What are the differences between the current and the past in consumer attitudes and satisfaction with mobile technology in tourism?
Answers to this question will provide implications for future directions of mobile technology.
This research is divided into two parts. The first part is a literature review that provides definitions of mobile technology in tourism from the existing literature, the role of mobile technology from the sustainability perspective, and the present role of mobile technology in tourism. Furthermore, the literature review identifies how existing studies were expanded from the perspectives of technology, customer and sustainability. The second part collects and analyses the data generated in the practical field to compare with the topics and perspectives identified in the literature review ultimately to deduce implications. This part uses real data to formulate the relationship between mobile technology and smart tourism while exploring future directions.
The second part consists of three studies. The first study identifies past and present mobile technology by analyzing the relationships between patent’s IPC codes. The mobile technology in tourism discussed in the literature review is a topic raised by researchers, and the practical patent data sets complement the studies that are required to have a holistic overview. Patents are viewed as implementations of technical ideology that can be consolidated in a technology map for a holistic overview of a field [38,39].
The second study analyzes recent trends in mobile technology and related issues by analyzing patent data, research papers, and news data related to mobile technology and tourism, using text mining. After a delay of 1 to 1.5 years, patents are publicized after submission, which means that a limitation exists in deducing the present state of the technology. Furthermore, patents emphasize the technological aspect, and the rights and novelty of a technology. Therefore, they are not appropriate for use in deducing how a technology is used by a user. Patent and research paper complement each other and allow for an analysis to find unexpected perspectives. News data is good material for identifying consumers’ interests and enterprises’ foci regarding the theme of mobile technology and tourism [40,41,42].
The third study considers the attitude of the actual consumer to cover the consumer aspect, which is one of the most important variables affecting mobile technology. The study selects mobile app services in tourism to explore consumer attitudes, preferences, and satisfaction.
This research is expected to contribute to the existing literature in three ways. First, this research provides the present status of mobile technology using field data from multiple sources to complement the conceptualization of smart tourism in the existing literature and to provide guidance on future research directions. The comprehensive analysis on patents, the academic literature, and news data identifies gaps in the research.
Second, whereas the existing literature focused on one or two mobile technologies in tourism as along with consumer attitudes, adoption [34], and satisfaction [43], this research explores technologies that should be addressed in the academia and that are attracting the interest of the practical field and consumers.
Lastly, this research traces the dynamic changes in consumer attitudes and satisfaction regarding mobile technology by reviewing mobile applications from different points in time. Consumer response can change because of new technology, and tracing such changes over time is meaningful. However, tracing the changes through surveys and observation requires significant resources. The alternative method employed by this study is to select two mobile apps that are different in both chronology and initial startup, and to identify differences in consumer attitudes (For example, TripAdvisor is a review-based service that started in the PC-based social networking and virtual communities, whereas Google Trips is a service launched relatively recently and started as a mobile-based service.).
2. Literature Review
2.1. Sustainability and Tourism
Sustainability has been discussed as a key topic in tourism, however, its conceptual ambiguity prevents it from having a precise definition [44,45]. UNEP and WTO define sustainability as follows, but this definition is subject to multiple interpretations.
“Tourism that takes full account of its current and future economic, social and environmental impacts, addressing the needs of vistitors, the industry, the environment, and host communities.”
Depending on the perspective of researchers and the theoretical base, certain studies emphasized the physical environment, whereas others emphasized industry or community [10,45].
Two sustainable theoretical frameworks for tourism that are used to comprehensively consider its impacts on the destination region are quality of life (QoL) and the new mobilities paradigm (NMP). Moscardo et al. (2014) suggested a qualitative approach to sustainability using QoL, indicating that it can be used as a qualitative index to measure the sustainability of tourism rather than relying on quantitative indices such as income or production [1,46]. The QoL of individual tourists, stakeholders from departing/transit/destination regions and workers in tourism industries are covered by this discussion [1,46,47]. Using QoL in sustainable tourism enables an analysis of the working environment of a tourism worker and the impact of carbon emissions on the destination. Using QoL also allows for the anlaysis to be extended to industries deeply related to tourism. QoL depends on various forms of capital, and such capitals supports QoL. Moscardo et al. (2014) restructured the argument of Emery and Flora (2006) and suggested seven types of capital: financial, natural, built, social, cultural, human, and political [1,47].
Financial capital means accessibility to investments, such as income and savings, and natural capital includes landscape and environmental systems. Built capital is a physical facility and infrastructure, such as buildings and transport systems, whereas social capital consists of social network features (e.g., trust, reciprocity, and cooperation). Cultural capital is a value shared by a human group, and human capital is the attributes (e.g., health, knowledge, and skills) of people that constitute the community. Finally, political capital indicates the ability to access political decision making and exert influence [1,47]. QoL and capital concepts provide a useful conceptual framework for analyzing the impacts of mobile technology on QoL in tourism. This framework naturally bridges mobile technology and sustainable tourism.
Another sustainable tourism framework is the concept of NMP [47,48]. NMP is a type of social phenomenon caused by globalization and technological advances, provides a foundation for modern society, and consists of features of modernity. NMP is neither fixed nor bounded, but emphasizes mobility and interconnections [47,49]. In the past, discussions revolved around the distance and frequency of transportation and physical movements. However, recent discussions have expanded the scope of movement from physical to virtual, imaginative, and even social and cultural. In social science, the moving entity is expanded further from people to things, ideas, and capital. The relationship between mobilities and mobile technology can provide an important hint of the role of mobile technology in tourism. Cresswell (2010) proposed the following six facets of mobility, which may serve as a systematic tool to describe the effect of mobile technology on tourism [48].
- (i)
- motive force (or reason for moving/stopping);
- (ii)
- velocity (or speed of movement);
- (iii)
- rhythm (or regularity of movement);
- (iv)
- route (or existing channels of movement);
- (v)
- experience (or emotional interpretation of movement); and,
- (vi)
- friction (or barriers to movement).
Assuming that the sustainability of tourism is an achievable and practical objective [14], issues related to measuring and assessing sustainability ultimately exist. The methodology of sustainability assessment has been thoroughly discussed, and devising an indicator to assess sustainability continues [14,50,51,52]. Sustainability is not a challenge for the tourism industry alone, but for all fields that aim to achieve it. If mobile technology enhances sustainability in tourism, one must be able to assess it as confirmation [53].
Major challenges to assessing sustainability include quantification of the QoL or well-being, boundary issues, and integration valuation issues. Despite these challenges, researchers have been endeavoring to devise various measurement tools and indicators [14,50,51,52]. Although covering the discussion in this field is out of the scope of this paper, the following models and concepts are noteworthy for the purpose of this research. In addition to the models described (QoL and the capital concept), the European Environmental Agency’s DPSIR model (driving forces-pressure-state-impact-responses) [52], and system quality concept, which consists of a human system and an ecosystem, as proposed by Ko (2005) are good examples [14]. In addition, Schianetz et al. (2009) provided some indicators and concepts that can reinforce the conceptual framework for qualitatively assessing the role of mobile technology in tourism. Noteworthy indicators include stress (e.g., water shortage or crime indices), efficiency (e.g., energy efficiency of cars or buildings), performance (e.g., waste generated), and early warning, whereas concepts such as environmental management, eco-labeling, and tourism carrying capacity are worthwhile to reference [50,51] (Table 1).

Table 1.
Sustainability assessment considerations for mobile technology contribution.
2.2. Smart Tourism, Customers, and Technology
2.2.1. Definition of Smart Tourism
Tourism entities now interact in real time with data and information given that mobile devices owned by individuals serve as multiple touch points. Therefore, mobile technology now plays a key role in determining the form of tourism and the behavior of entities related to tourism.
Researchers are conceptualizing the phenomenon as the theme of smart tourism and are attempting to expand its scope [6,7,9,31]. From the perspective of information services, smart tourism is an information service and support system for tourists traveling alone [9]. In the past, when using the terminology of a smart tourism destination [54,55,56], some researchers and organizations directly and/or indirectly referred to smart tourism and emphasized clean, green, and the ethical provisioning of high quality services (UNWTO), digital connectivity and civic engagement between tourists and destinations [57], and smart cities.
A firm conceptualization of smart tourism began with Gretzel et al. (2015) and Li et al. (2016) [6,9]. The conceptualization of smart tourism by Gretzel et al. and Li et al. is considered a comprehensive approach. They call for researchers and practical managers to firmly establish the conceptualization of smart tourism and to accumulate theoretical and practical cases. The definition of smart tourism by Gretzel et al. and Li et al. is as follows:
“Ubiquitous tour information service which is combined, cooperated with, optimized and improved upon during the tour activities in the form of ubiquitous processes, space and time, media, direction, terminals, and organizations to the individual tourists”.(Li et al.) [9]
“Tourism supported by integrated efforts at a destination to collect and aggregate/harness data derived from physical infrastructure, social connections, government/organizational sources and human bodies/minds in combination with the use of advanced technologies to transform that data into on-site experiences and business value-propositions with a clear focus on efficiency, sustainability and experience enrichment”.(Gretzel et al.) [6,43]
Li et al. defined smart tourism in the national context of China, which implicitly contains the government’s policy perspective of fostering tourism that contributes to economic development. This tourism aims to acquire the sustainable competitive advantage of a destination and for tourism related firms through the support of ubiquitous technology. In contrast, Gretzel et al. emphasized collecting, aggregating, and harnessing new data from new information channels while additionally acknowledging the importance of the roles of various entities, such as physical infrastructure, social connections, and government. Such a conceptualization of smart tourism by Gretzel et al. is materialized by the concept of the smart tourism ecosystem (STE) [30]. Conceptualization of the STE is a tourism system that uses smart technology to create, manage, and deliver intelligent experiences. The STE includes functionalities, such as collection, processing, and data exchange, as well as a variety of participants, and assumes that they pursue economic and environmental sustainability [30].
The two definitions are different but have some commonalities, such as emphasis on the mobile technology and mobile environment, as indicated by the terms “ubiquitous” and “onsite experiences”.
Recent research on smart tourism starts from the definition of smart tourism [6,9], formulation of the concept of a smart tourism ecosystem [30], conceptualization of a smart tourism destination on the basis of the perspsective of perceiving a smart city as the origin of smart tourism [55,56,58], and conceptualization of the competitiveness of a smart tourism destination [31]. The definition is expanded to a smart city case [59], and applications of smart cities [60]. It is worthwhile to note that the implementation of a recommendation system [61] and an intelligent system including information queries [62,63] is considered a prerequisite system for realizing smart tourism. In addition, essential smart tourism technology was expanded to research on data collection and analysis technology [64,65,66,67], communication technology [68], geomatics and navigation technology [69,70] and app design technology [71].
According to the definition of smart tourism as referred to in the previous paragraphs, smart tourism consists of suppliers, users, adjacent players and related systems. These entities mutually interact through features of services provided by the technology [30]. In tourism, studies on information technology applications adopted three perspectives: technology development perspective, supplier perspective, and consumer perspective [72]. In this case, the support systems established by firms and suppliers can be considered as a materialization of technology. Therefore, we deeply study the existing literature on smart tourism from two major perspectives: the technology perspective and the customer perspective [73].
2.2.2. Smart Tourism from the Technology Perspective
The role of information and communication technology (ICT) became important when the Internet was adopted as a distribution channel. At the time, the research on ICT revolved around PC-based Internet access and devices that used this technology, which were introduced within the concept of e-tourism [43,74]. The studies were similar to the research on e-commerce, in that consumers adopted online tools to engage in e-commerce in tourism, which expanded the tourism channel and, consequently, enhanced the competency of tourism firms. Therefore, a travel user’s usage pattern started to change and firms’ response patterns, including technology preparation, also changed. Thus, a review of e-tourism centered on PC-based Internet is indispensable in identifying the relationship between mobile technology and tourism, because it considers changes in consumer usage patterns and firms’ technological response patterns. Using research on consumers’ use of the Internet for travel planning from the satisfaction perspectives, Xiang et al. (2015) identified that most travelers fully adapted to such planning through the Internet. They pointed out that social networking sites and video sharing are becoming more popular for trip planning, that the desktop computer is being used less frequently, and that tablet computers and GPS are being used more frequently.
Various classification methods exist for mobile technology as an enabler and an indispensable factor of smart tourism. Mobile technology can be classified as infrastructure that collects and delivers data, such as a network, a sensor, a chip and IoT, or it can be classified as technology that aggregates, analyzes, and optimizes data. Alternatively, it can be classified as platform services, such as apps, the cloud, and open API [7]. Although mobile technology is a broad concept, it can be classified into four major categories. The first category is technology related to data collection, analysis, and communication. This category includes search technologies, sensors that collect data that arise from mutual interactions between tourists and the environment, and short-range wireless communication technologies, such as RFID and NFC [67,75,76,77]. When users generate information using geotags containing location data, technology to retrieve the data from the geotag and filter them is also necessary. In addition, technology that retrieves user profiles and integrates other information is also necessary [78,79]. Technologies related to data include new methods of data collection, data analysis, data exchange, data sharing, and communication [75]. Developing data analytic algorithms for tourism is also necessary, although not covered thoroughly in tourism research [80]. Recently, attempts haves been made to analyze a destination’s image from the perspective of information quality, which indicates that data visualization is also becoming a focus in this field [81]. In tourism, technology must aggregate data and information, and support ubiquitous connectivity and real-time synchronization to create new experiences for users [82].
Depending on the entity that generates data, requirements for technology can be changed. For example, voluntary uploads of local information (including images, reviews, ratings, and comments for advise) will require different technology depending on whether the data are text or video. If large video and images are being uploaded, technology that guarantees video image quality, networking, and storage must be supported. Usability and ease of use for services must be ensured [79] and collaboration tools must be supported if content generation requires collaboration. If available information is in proprietary or is volunteered, a criterion must exist for deciding on the source that provides higher quality information to users [79]. Technology in smart tourism is linked with customer’s various behavior.
The second type of technology is the mobile device, which is at the forefront of user interfaces that enable users to access data and information. The presence of an individual device suitable for a service can determine the survival of the service. The mobile device that a customer brings along represents the integration of positioning technology (e.g., GPS) [83,84] and generate context-aware data [85]. Through mobile devices, tourist can enjoy novel and innovative experiences, and the consumer or tourism-related firms can manage such experiences [75,86].
The third type of technology partially overlaps with the first two types; however, it is also meaningful to separately discuss systems that materialize tourism in practice as another technology. In tourism, studies on tourism technology, from the perspective of management information systems, initially had the objectives of internal inventory control, which later shifted to a computerized reservation system (CRS) to stimulate business transactions and airline bookings [87]. The literature in this area includes Bill and Pirkko’s assessment of the efficiacy of self-booking for travel [88], research on CRS of the air and rail industries among the transport industries [89], the research by Leo et al. on Austrian tourism information and reservation systems [90], and the design of ticket systems [91]. Reservations, recommend systems [92], intelligent advisory systems [93], knowledge management systems for tourism [94], and tourism risk assessment systems [95] are forms of a technology (system) for comprehensively supporting smart decisions.
If technology is an essential component of the implementation of a system, the most researched system as a technology is the recommendation system [96]. A recommendation system can be classified into three systems. The first type of system allows users to collaborate and rate a product. The second is a content-based filtering system that recommends genres on the basis of product categories, and the last is a knowledge-based recommender system used for high involvement products. Information retrieval techniques are used for the second, and detailed product descriptions and constraints must be provided for the third [96]. Furthermore, implementation of these systems must consider dialog design, usability aspects, and adaptivity [96].
External systems include transportation and payment systems, and each system shares optimized data while obeying local regulations. Technology must ensure optimization that is compliant with local policies [6,30].
Lastly, newly emerging technologies include data-related functionalities that are implemented as systems. The first theme of mobile technology in tourism that is attracting researchers’ interest is short range wireless technology such as Radio frequency identification (RFID) [97,98,99] and Near field communication (NFC) [67,76,77,100]. The second theme includes augmented reality [101,102,103,104] and virtual reality [105], which enables a pre-experience for a user [33]. This theme is noted in tourism research as tourism marketing tools [106]. The third theme includes Internet of Things (IoT), cloud computing, and big data [107,108,109,110,111,112,113]. Sensor technology that constitutes IoT will play a critical role in collecting real time data for big data analytics [30].
Smart tourism research is expecting new forms of business and innovation resulting from convergence technology and new types of content, devices, and services [6,7,33,114]. As highlighted by Hojer and Wangel (2015), development of a single technology is not enough; however, interconnection and synchronization of different technologies can make more significant contributions to smart tourism [30,115]. Although it is important to analyze how an individual mobile technology impacts tourism and the mutual interaction among customers, it is also important to consider convergence technology in tourism.
2.2.3. Smart Tourism from the Customer Perspective
In academia, research on consumer behavior and attitude is primarily comprise of adopting a technology in tourism (e.g., e-tourism) and satisfying users who use the technology. These studies also use intent to adopt or satisfaction as the dependent variable.
Studies using the technology adoption model (TAM), Extended TAM, and unified theory of acceptance and use of technology (UTAUT) theories propose and evaluate research questions on adoption factors and constructs [116]. In addition, these studies approach the point of adoption as pre-trip, during-trip, or post-trip [36]. These studies usually target web-based services and social media of e-tourism or mobile information systems that include mobile devices and mobile applications. The fruits of the existing literature include research on the adoption of travel apps [117], consideration of user satisfaction with mobile technology use [118], and a review of studies on adoption in tourism [36].
In relation to consumer adoption, the task technology fit (TTF) theory frequently arises in the MIS literature. TTF is defined as “the matching of the capabilities of the technology to the demands of the task” [119,120], which is positively related to ease of use, usefulness, and tool functionality. Ultimately, it is positively related to the use of a specific tool [119]. Although not directly related to tourism, Gebauer and Shaw (2004) asserted that mobile e-procurement system implementation enables request for simple and highly functional (data processing, information access, communication, and notification) mobile applications for successful mobile e-procurement using the TTF theory [121].
Relating TTF theory with mobile technology in tourism, it can be hypothesized that the fit between mobile technology and tourists’ task in smart tourism are positively related to the intention to use or purchase mobile tourism services. This paper does not validate the hypothesis using theories (e.g., TAM and TTF) based on surveys. However, using the TTF frame of Dishaw et al. (1999) and Yu and Yu (2010), the following indicators that assess the fit of mobile technology with tourists’ tasks in smart tourism can be deduced [119,122].
- (i)
- Provides the tour’s path and expenses beforehand;
- (ii)
- Defines beforehand objects, relationships, and processes that are to be experienced during the tour, which are provided as planned during the tour;
- (iii)
- Provides personalized data and information optimized to an individual’s context;
- (iv)
- Enables a fit between the tourism system and the user’s life style; and
- (v)
- When on the move, enables mobile tourism services to be easily understood and used.
If TTF as measured by (i)–(v) is high, then there is a high probability of adopting mobile tourism services. As can be seen, TTF theory provides a good framework for mobile technology in tourism.
Customer behavior in tourism can be analyzed from the perspective of the decision-making process. According to Engel et al. (1990), consumer decision making is a five-stage process: (i) need recognition; (ii) information search; (iii) evaluation of alternatives; (iv) purchase decision; and (v) post-purchase behavior [123].
To explain tours as the decision-making related to purchasing specific products and services from the tourist’s perspective, a tourist interprets a tour as the purchase of airline tickets, accommodations, car rental services, and tour packages. In turn, the decision making process entails (i) needs recognition [29,33]; (ii) tracking or tracing; (iii) evaluation; (iv) booking, and payment; and (v) repurchase of tour products or services [7]. In the presence of a variety of services, the user that uses intelligent services seeks to integrate separate services into one and purchase these services through one click in real time [79].
A more comprehensive scrutiny of the consumer decision-making process from the perspective of tourists’ experience, shows that there will be motivations and desires for a tour before the tour, planning for the tour, the decision to tour, selection of tour packages, real time decisions including modifying the initial plan on the basis of interactions with the destination’s things, environments, and people, and post-tour extensions [35]. During or after the tour, the tourist can express satisfaction for a product or a service, or express dissatisfaction through complaints [33,43]. Satisfaction and complaints can be expressed during and after the tour. Each experience may be described as a linear set of serial processes, as in the case of general consumer decision making [123]. However, certain process may overlap or be shuffled, such as planning, go/not go decisions, and modifications. If tourists are not restricted to specific locations when collecting information, and if the information is personalized to be specific to one’s personal context, thus enabling real-time decision making, the experience process becomes more complex and exhibits a non-linear pattern.
A tourist’s experiences are generated through interactions with various entities. The tourist can start a tour through a variety of relationships and may create new relationships during and/or after the tour. From the perspective of relationships, consumer behavior indicates that the following relationships affect consumer behavior: relationships with suppliers of tourism products and services, tourist-resident relationships with local environments and citizens, and tourist-tourist relationships with other tourists through review and/or recommendations when planning or during tours [33]. Consumer behavior must also be considered from the relationship perspective and researchers must identify how mobile technology will affect these relationships.
In the previous sections, we proposed considering technology trends and consumer behavior on the basis of the litearture on e-tourism. For e-tourism, Park and Gretzel (2007) identified information quality, ease of use, security/privacy, interactivity, accessibility, personalization, and trust as the top- ranking attributes for the success of a tourism-related website. Kim et al. (2013) suggested economic value, enjoyment, time savings, mobility and use context (when no travel card is available, when there is no cash, when in a hurry, when the tourism product needs to be purchased imminently, when purchasing of a tour package requires waiting) as factors that influence the satisfaction of mobile tourism shopping (MTS) [124]. We must also consider how mobile technology is related to these factors.
2.3. Tourism and Consumer Reviews Online or through Mobile Applications
The existing literature that analyzes consumer reviews in mobile apps can be classified into two types. The first type of study emphasizes the use of consumer reviews as content, and the premise is that the contents of the review are used as information for decision-making support systems. One of the initial topics of technologies that support tourism was how to specify recommendation systems. For recommendation systems, it is important to determine the information on which the recommendation is based. Given the pervasive nature of the Internet in everyday life, the studies aim to establish new recommendation systems primarily based on consumer reviews on the Internet [125,126,127].
Generation of studies on online reviews are in line with practical importance [128]. Researchers are analyzing the type of consumers (e.g., high involvement tourists) affected by certain attributes of online reviews (e.g., product ranking) during decision making [127], and some are researching the relationship between satisfaction with hotel services and the type of hotel (e.g., luxury or budget) and reviews (positive or negative) [129].
Online recommendation systems based on consumer reviews date back to the 2000s, when TripAdvisor started its PC-based web service. The major review-based service cases in tourism are Uber, Airbnb and TripAdvisor. Many attempts in academia have been made to analyze TripAdvisor, which has attracted the interests of tourists from the beginning. One such study includes the emphasis on the gamification funware functionality of the TripAdvisor service [130]. Another study explores TripAdvisor’s online review data from the perspective of hotel attribute importance using a conjoint method. This study concludes that specific attributes have a stronger impact on users than do general reviews [131]. One study evaluates the value of e-WOM by relating the image of a destination’s shopping, accommodations, meals outside hotels, transportation, and attractions with an evaluation, and is in line with the first type of consumer review study [132].
The use of mobile Internet exceeds that of fixed Internet, and research on mobile app reviews should be stimulated in extension of past studies on online reviews. The consumer also composes and accesses reviews through mobile devices regardless of whether the mobile web or a mobile app is used. Therefore, commonalities and differences between online reviews of PC-based Internet use and reviews of mobile apps should also be considered. For example, although mobile applications enables booking hotel rooms, some groups still exhibit PC-centric usage patterns, which identifies the behavior of groups with access to both mobile and fixed Internet.
The second set of studies considers the consumer review as a type of social media and analyzes consumer attitudes and behavior from this perspective. By nature, recommendation systems have social media features. This category uses adoption models to research social media usage [133] and emphasizes the role of social media for online tourism information [134] and for the effect of sharing social media’s tourism experience on motivation [135]. The role of social media that also contains the functionalities of a review site is becoming more significant as a new information source. Therefore, it is necessary to examine how social media plays a role as an information source in tourism and how consumers’ usage patterns for social media are changing. In addition, although access to social media through PC and the Internet is commonplace, advances in mobile technology have made access to social media through mobile applications.
Although research that focuses on the development and user interface of mobile apps [136,137], and functionalities [117] does not directly analyze consumer reviews, it is useful when exploring consumer reviews on mobile apps. As usage patterns shift from fixed PC-based online tools to mobile apps, these studies highlight the importance of the mobile app and its design for tourist satisfaction [71,138].
The mobile review composed on a mobile device can be written when the user is moving; users need not switch devices (from mobile device to PC and vice versa) to complete the review. Development of mobile technology must take into account these considerations.
2.4. Research Process and Framework
Summarizing the literature review, the topic of sustainability has been researched in the field of tourism and recent advances in mobile technology in society have given rise to smart tourism that connects tourism, sustainability, and mobile technology. The literature can be classified into sustainable tourism and related research, conceptualization of smart tourism, and the connection between sustainability and smart tourism through mobile technology. These studies can be approached from two major perspectives: the consumer perspective and the technology perspective.
Mobile technology not only enriches and enhances individual user’s experience, but also contributes to enhancing the competency of related destinations and players. Mobile technology can support individual tourists or support firms related to tourism. To do this, mobile technology can intervene in data processes (collection, processing, and communication), or support the data analysis. Mobile technology can also be related to residents of local destinations and industries, and the systems surrounding the destination. Because the conceptualization of smart tourism proceeds and the literature calls for qualitative and quantitative expansions to research, this paper collects and analyzes vast amounts of field data to precisely identify the status of mobile technology and to deduce related issues. Doing so provides guideline for directions of developments of mobile technology in tourism, of future research, and of the industry’s responses.
The research objective will be achieved through the following processes and studies.
In study 1, we collect and analyze patent data to identify the past and the present of mobile technology in tourism and to evaluate whether a single or convergent technology exists. International Patent Classification (IPC) information on patents is utilized and the data are analyzed using network analysis. In study 2, we complement study 1 and deduce issues and variables related to mobile technology in tourism, as identified in study 1. Additionally, we collect academic articles and news data, which are analyzed using content analysis based on text mining. Whereas study1 analyzes the relationships between patent’s IPC codes, study 2 analyzes the texts represented in title, abstract, and claims of patents. Among the variables and themes deduced in study 2, study 3 explores the mobile technology user’s attitude and behavior from the customer perspective. We collect customer reviews from mobile apps for tourism (TripAdvisor, Needham, MA, USA; Google Trips, Mountain View, CA, USA) and conduct a comparative analysis, which is visualized in Figure 1.
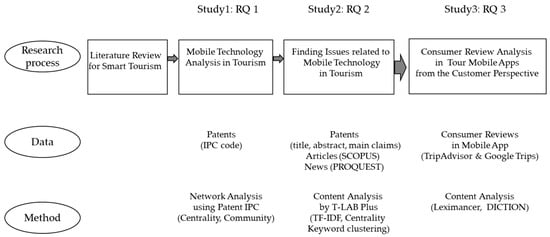
Figure 1.
Research process and output.
3. Study 1
3.1. Data
The purpose of study 1 is to explore the status of mobile technology in tourism through patents. Patent data source was patent database from U.S., EU, China, Korea, Japan, WIPO, Germany, U.K., and France via a commercial Patent Database service WISDOMAIN (www.wisdomain.com). We selected patents from the patent database that are related to mobile technology in tourism. Patents expressed in English and those with a search equation that includes either tourism or tourist, along with mobile technology, were selected. A retrieval query was used to ensure the comprehensiveness by using relatively comprehensive and overlapping words. The keywords that express mobile technology were the terms in literature review that were related to mobile technology. We added the term “mobile” to ensure that technologies not covered by the literature review are considered. We cleansed the data by reviewing individual patents to filter out irrelevant patents with ambiguous keywords. Out of 1282 patents, 1246 were selected for analysis. The following a retrieval query shows the keywords used in the search.
TAF = (tourism or tourist) AND TAF = (mobile OR augmented reality OR virtual reality OR NFC OR Sensor OR RFID OR Gamification OR mobile applications OR M-booking OR M-commerce OR beacon OR social media OR SNS OR GPS OR map OR smartphone OR mobile phone OR mobile Internet OR navigation)
3.2. Method
3.2.1. Patents and IPC Codes
Each patent consists of a title, abstract, claims, and International Patent Classification (IPC) code, and possess two or more IPC codes if it belongs to two or more industries (Figure 2a). We analyze the status of mobile technology in tourism using the IPC of the collected patents. The IPC is divided into 70,000 subsections and shows the industry with which the patent is affiliated [139,140]. There are other indices, such as the U.S. Patent Classification and Cooperative patent classification (CPC). Whereas CPC provides a more granular classification of 140,000 subsections, not all patents are publicized with CPC and, thus, we use IPC [141,142].
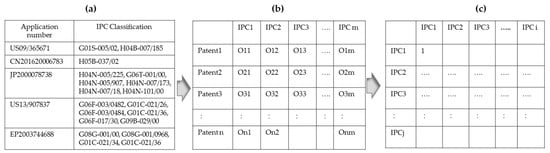
Figure 2.
International Patent Classification (IPC) analysis process.
We first analyze with which IPC each patent is affiliated, provide a descriptive analysis of the classified IPC (whether there is only one or more), and deduce the most frequently occurring IPC. Second, we map the IPC of the selected patents in the form of Patent × IPC matrix (Figure 2b) and further convert it to the IPC × IPC matrix form (Figure 2c) to develop a network model. Each IPC becomes a node in the network and a connection among IPCs becomes the link. From the IPC × IPC matrix, one can deduce the IPC code with the greatest centrality, and we use clustering analysis based on the cohesion between IPC codes. If the centrality value of an IPC is high, the IPC code can be considered to express essential technology [143]. Clustering based on cohesion groups similar IPC codes and shows the technologies that can be grouped [144]. For the case in which a patent holds two or more IPC, this situation can be interpreted as convergence case of mobile technology in tourism.
3.2.2. Network Analysis and NetMiner
This research used NetMiner, a software tool for network analysis and visualization. Along with UCINET and Pajek, NetMiner is a representative tool for social network analysis [145,146,147]. Centrality is an index used to evaluate the impact of a node and is further divided into degree Centrality, closeness centrality, and betweenness centrality. Degree centrality shows how many nodes are connected to the node and, consequently, shows the impact of the node.
Closeness centrality shows the dependence between nodes.
Betweenness centrality shows the extent to which the node mediates between two other nodes [148,149].
Community analysis is a methodology to identify node groups that have more links within the group than the number of links between the groups. There are many algorithms depending on the criterion to identify groups. We use the Clauset-Newman-Moore (CNM) algorithm devised by Clauset, Newman, and Moore. This “greedy” algorithm maximizes “modularity” as proposed by Newman. The CNM algorithm starts out with each node forming a group and proceeds to consolidate these small groups, which means that it is an agglomerative algorithm. We finally select the group with the higheset modular value deduced by CNM [150,151,152,153].
3.3. Result
3.3.1. IPC analysis and Technology Convergence
The 1246 patents considered to reflect mobile technology in tourism were classified into a total of 149 IPCs when the classification was based on major code (consists of four letters) and 804 IPCs when the classification was based on complete IPC code. One patent can be classified as one or more IPCs. A patent can be affiliated with six IPCs (major code) or nine IPCs (complete code). Table 2 shows the number of patents per number of affiliated IPC codes for all selected patents. Among 1246 patents, 565 patents (45%) are affiliated with two or more major IPC codes and 779 patents (62%) are affiliated with two or more complete IPC codes. This result indicates that convergence technologies comprise a higher portion of mobile technology in tourism than a single standalone technology. Therefore, it is important to converge different technologies to implement the features desired by customers and firms.
Table 2.
IPC code frequency.
The IPC major code classification indicates that the IPC with highest number of patents was G06Q (Data Processing), followed by H04W (Wireless Communication Networks) and G06F (Electric Digital Data Processing) (Table 3).
Table 3.
IPC code frequency and technology summary.
The IPC complete code classification indicates that data processing to materialize a travel agency’s service had the highest number of patents affiliated with it (G06Q-050/14, G06Q-050/10), followed by location-based technology (H04W-004/02), data retrieval technology (G06F-017/30), navigation and maps-related technologies (G01C-021/00, G01C-021/34, G09B-029/00, G09B-029/10, G01S-005/02), displaying technology including visual and audible information (G09F-027/00), transmission and communication technologies (H04L-029/08, H04N-005/225), and presentation technology (G06K-017/00) (Table 3).
We can also map mobile technology on consumer decision-making and tour experience process. During the stage in which a consumer recognizes needs [29,33], is motivated, and has desires, mobile technology is expected to further drive motivation by communicating information that considers the consumer’s lifestyle and preferences in the form of an image (in addition to simple text). A travel agency’s data processing technology (G06Q-050/14) and route searching and guidance technology (G01C-021/34) contribute to tracking and tracing information, and image-related technology (G09F-027/00) enhances the quality of the information provided. Such technology enhances the quality of the decision making by providing appropriate information for tourists when planning tours and selecting tour packages. Support of services (H04W-004/02), information retrieval (G06F-017/30), and route searching and guidance (G01C-021/34) technologies based on a user’s location are necessary for tourist’ interaction with a destination’s people, things, and environment. These technologies are expected to support users in making real-time decisions including modifying the initial plan by providing additional information. Device and visualization technology (G09B) are key to the process of accessing information through devices to use the overall service.
3.3.2. Centrality Analysis
The Top 10 IPC codes listed in order of decreasing centrality are shown in Table 4. Although there are some differences for the three centrality indices, we observe that G09F, G06Q, H04B, and H04N exhibit a high centrality value for all three indices. Having a high centrality value indicates that it is connected to other IPC codes, has stronger dependence on other IPCs, and is positioned between other IPC codes such that it has higher probability of mediating two IPCs.
Table 4.
IPC centrality.
G09F (Displaying), H04B (Transmission), and H04M (Telephonic Communication) show relatively high centrality because these technologies are essential to materializing a complete mobile technology. Therefore, these technologies are connected to other IPCs and other IPCs are more dependent on these three technologies.
From the data technology perspective, data technologies can be classified as collecting (G06F), processing (G06Q), and visualizing technologies (G09F). We observe that data processing technologies (G06Q) comprise major portions of data technology. Displaying (G09F) as a visualization technology, especially displaying a map to the user, and telephonic (H04M) were also identified as important.
3.3.3. Community Analysis
Community modularity analysis based on cohesion deduced six communities as described in Table 5 and Figure 3. G1 consists of technologies related to vehicle and transportation, G2 of technologies to generate, arrange, code, store, and transmit image data necessary for intra-city navigation systems, G3 of systems that constitute smart cities, devices that constitute systems, and equipment that comprises these systems, G4 of data processing and related devices, G5 of technologies related to various forms of data (e.g., photo, optical and speech), and G6 of city systems ,data processing, and computer systems for computational modeling.
Table 5.
IPC code and technology sector by community.
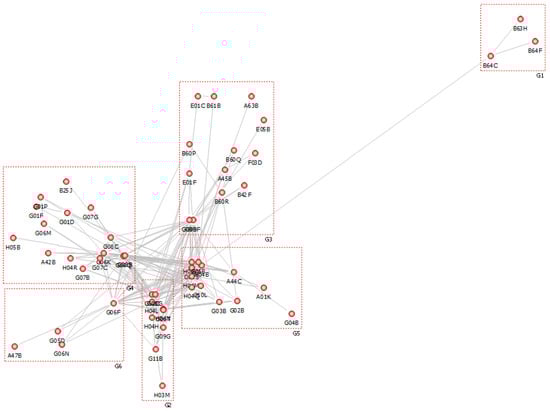
Figure 3.
Community modularity analysis through patent IPC code.
A tourist’s relationship are described in greater detail through community analysis. These relationships are expected to be more closely related to residents through a navigation system, city’s transportation system (G2), and data processing technology within a city’s system (G6). These relationships also enable the exchange of various personal context-aware information among tourists with the support of various forms of data, including photographs, optical data, and speech (G5). These relationships can be initiated before a tour, can persist through real-time Q&A during the tour, and may finally be in the form of sharing experiences after the tour.
4. Study 2
4.1. Data
The purpose of study 2 is first to specify the status of technology by extracting keywords of patents identified in study 1 and, second, to expand the data sources to academic articles and news to explore issues other than mobile technology, such as sustainability, stakeholders, and consumers. Therefore, this study explores the relationship between technologies (displaying, data processing, transmission/communication, navigation/map, tourism system, and city system) and other themes/stakeholders by applying content analysis to data gathered from multiple sources.
By expanding the source of data to patents, academic articles, and news, we expect to cover both academic and practical perspectives on topics ranging from technology to users and the industry. We used patents expressed in English, academic articles from the Scopus database, and news from the ProQuest database. Among the 1246 patents analyzed in study 1, 1175 were finally selected for analysis after the second filtering. The title, abstract, and main claims were the inputs for the content analysis. We selected 621 articles in the tourism field from the Scopus database and that target mobile technology. We used the following queries as criteria in the titles, or the abstracts, or keywords of the articles.
[tour OR tourist OR tourism] AND [mobile technology OR app OR mobile app OR mobile web OR mobile OR technology OR smartphone OR NFD OR RFID OR beacon OR cloud OR LBS OR] OR [smart tourism]
Of 621 articles since 1987 extracted, where 554 articles were published in 2007 or after (89% of all extracted articles) and 606 articles were published in 2000 or after (98% of extracted articles). Mobile technology related articles emerged in 1995 while 10 articles published between 1987 and 1994 were selected based on keywords related to new technology and information technology. These 10 articles were not the result of a search inquiry for “mobile technology” per se, but we included these articles because we intended to identify smart tourism variables related to mobile technology based on the literature on PC-based e-tourism.
For news data, we selected 1870 news articles from the ProQuest database, where tour or travel is included in either the title or the abstract of the news, and mobile technology, or smartphone, or app is included in the news. News articles fromg 1991 to April 2017 were targets and 88% of these articles were from 2010 or later.
4.2. Method
4.2.1. Content Analysis and T-LAB
Content analysis is a methodology that deduces category with meaning from a large amount of text data [40,154]. Content analysis was initially used as propaganda analysis in politics and as a personality characteristics research tool in psychology. The initial stage of content analysis was qualitative; however, computer assistance enabled simple statistical processing, such as counts of specific terms and categories to which the terms belong [155] (e.g., the Nvivo or MaxQDA program that supports manual coding and data management for theory building). The methodology has been expanded to the deduction of concepts and themes using automatic coding based on mathematical algorithms, sentiment analysis based on a dictionary, and text mining that utilizes natural language processing (NLP) [156,157].
In study 2, we utilized computer-based content analysis using T-LAB as a text mining software tool. T-LAB is an all-in-one software tool that can be used as a linguistic and statistical tool for text analysis. T-LAB processes textual data quantitatively and enables a qualitative interpretation for a contextual understanding of the output [158]. By using T-LAB, we can calculate the co-occurrence relationship among key-terms, cluster textual units using unsupervised learning, and apply sentiment analysis if dictionary is additionally defined [159].
T-LAB analyzes the data using lexical units (LU), which includes terms and phrases, and context units (CU). A LU is a set of words or lemmas wherein words are listed as they appear in the corpus and a lemma is listed and classified according to linguistics criteria or dictionaries. The former is selected for this study. A CU is an extract of text separated by punctuation and consists of elementary contexts (EC), such as sentences, fragments, and paragraphs, and variables [160,161].
4.2.2. Keyword Selection and Association Index
When extracting words from the text, we need to measure the importance of the word. Although it is common to use the frequency of the word to measure importance, we employ Term Frequency-Inverse Document Frequency (TF-IDF) to select the keyword.
TF-IDF is one of the indices of text mining based on a mathematical algorithm that determines the importance of a word in documents that comprise the corpus. TF-IDF does not merely count the occurrence but also processes the frequency using the probability of occurrence. TF-IDF is an index wherein the inverse of DF is multiplied with TF, and an increase in DF reduces the importance because a word that occurs in multiple documents has high probability of occurrence [162,163,164].
The association index is calculated by T-LAB, and the centrality of the measured keywords is deduced by co-word analysis [159]. Co-word analysis is an informetric content analysis method that analyzes the knowledge structure of the target by exploiting occurrence patterns of a word or noun phrase in the text. Co-word analysis interprets the relationship among the ideas of the analysis target. By using co-word analysis, one can identify the central theme of a specific field by measuring the centrality of keywords in documents generated within the field.
The association index is also called similarity coefficients and is used to analyze co-occurrences of words in a phrase [159]. A rigorous definition of the association index is that it measures the co-occurrence of lexical units (LU) within elementary contexts (EC). As Figure 4 shows, the association index deduces coefficients after the EC × LU matrix is transformed into a LU × LU matrix. For the case of cosine coefficients, Equation (5) holds true.
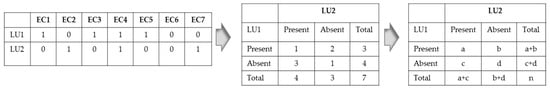
Figure 4.
Association index calculation process 1. 1 The contents of the Figure 4 are recalculated from the following literatures: Lancia, F. T-lab plus–user’s manual, tools for text analysis (2016).
4.2.3. Thematic Analysis and Clustering
Clusters are homogeneous entities within a group but are heterogeneous between groups. With no prior information on the population or category, cluster analysis groups entities into a few groups on the basis of distance and/or similarities between records. The main purpose of cluster analysis is to divide the entities into a few groups and to understand the whole by reviewing the big parts [165,166].
In content analysis, cluster analysis can cluster closely related and frequently occurring keywords into one group [167,168]. Analyzing co-occurrences between keywords can deduce the main theme, and clusters can be deduced from the set of words that are related and that co-occur in the text.
In the T-LAB software tool, clustering is based on maximum similarity criterion. Therefore, elements in the same cluster are maximally similar, whereas they are maximally different from elements of a different cluster [169]. T-LAB uses an automatic and unsupervised clustering algorithm, especially the bisecting K-means method [169,170]. The K-means method is a widely used clustering technique based on an iterative centroid-based divisive algorithm. The bisecting K-means method uses a variant of the K-means method algorithm and is known to be more efficient for document-processing problems. This algorithm aims to reduce the computational demand at the expense of sub-optimality. T-LAB’s clustering process first creates a matrix in the form of CU × LU. In this case, the matrix includes either presence or absence values. The second phase runs TF-IDF normalization and scales row vectors to unit length (Euclidean norm). The final phase measures cosine coefficients and clusters CUs. T-LAB groups words with high probability of occurrence that co-occur in the same elementary CU (e.g., same text segments) and makes indication using the chi-square test. We named the clusters depending on their elements (e.g., words and sentences) [167].
4.3. Result
4.3.1. Word Frequency and Association Index
We identify the top 10 keywords in terms of occurrence measured. Because the absolute number of words and occurrences of words in the texts analyzed are different, it is more meaningful to consider the rank. Although the information keyword did not occur in the top 10 keywords within patents, it frequently occurred in the articles as the top keyword. Tourist and user keywords imply that technology is described in relation to its users. We observe that features of technology (e.g., data, control, and connect) and implementation of technology (e.g., module, system, and terminal) frequently occur. In the academic articles (Scopus DB), services to support the smart experience of a user/tourist at the destination are expressed, along with frequent occurrences of systems and applications as means to materialize the smart experience. It is worth noting that news data uniquely have two words (business and company) that ranked within the top 10 (Table 6).
Table 6.
Word frequency by sources.
By listing the keywords in decreasing order of the association index that measures connectivity between words, a similar pattern to that of word frequency is observed. The difference for patents is that store function, data, server as a hub to store data, navigation functiona and data display function are considered important. For articles, experience and social additionally appear as important keywords. For news, the pattern was almost the same as that of word frequency, and words such as service, company, business, device, and user were identified as having a high association index; see Table 7. Whereas the functionality of mobile technology and its implementations were considered important in the patent database, user experience and mobile communications technology (data, device, and network) as support for the experience were described in academia articles. On the other hand, news source exhibited business related-keywords, such as company.
Table 7.
Word centrality.
4.3.2. Word Clustering
In study 1, we clustered a patent’s IPC based on cohesion, however, in this study, we cluster using keywords. The patents were clustered into four groups (Table 8, Figure 5), journal articles into three groups and news into three groups. The words listed in the table were proven to be statistically significant in the chi-square test and the themes of the cluster were named by the authors.
Table 8.
Patent clustering by keyword.
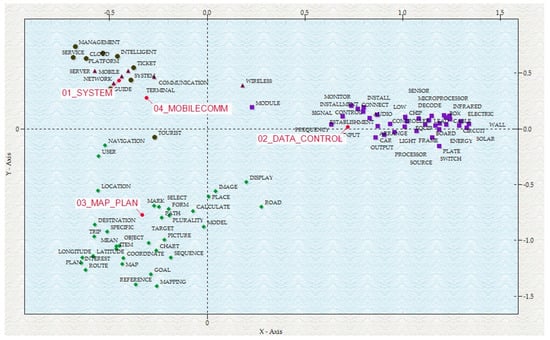
Figure 5.
Clustering based on patent keyword.
For patent clusters, cluster 1 (23.58% of the variance) describes the tourism system. This system is an intelligent guide and management system that materializes the service. The following quote can serve as representative of cluster 1. (Even if grammatical error existed in a directly quoted sentence, it was quoted without modification.)
“Intelligent guide system, portable tour guide device and tour guide system. The invention discloses an intelligent guide system, a portable tour guide device and a tour guide system.”
Cluster 2 (16.5% of the variance) is mainly characterized by technologies that control and manage data. From the semantic perspective, cluster 2 consists of verbs that describe the action that processes data and nouns that describe hardware components.
“one audio guide system lead system, its characteristic lies in including the control circuit and recording and sending_out control circuit, the recording electric circuit, the playback electric circuit, reader and RFID label; And the control circuit and reader connect.”
Cluster 3 (24.28% of the variance) is significantly associated with map technology. It describes the route plan using a specific guidance map, and matching with postings. “Picture” in cluster 3 indicates either a map picture or image technology. To better understand the nature of the cluster, we highlight a few quotes related to picture:
“States the image superimposition processing unit to be used_to state the map picture superimposition, in states in the image, will superimpose to state the map picture the image to save to state the memory cell; Stated the memory cell to be used_to save superimposition to state the map picture the image.”
On the other hand, “coordinates” mapped to cluster 3 indicated GPS coordinates during the implementation of map technology.
Cluster 4 mainly represents the general elements of mobile communication technology (35.64% of the variance). The cluster describes data transmission from a mobile communications terminal and network servers related to communications.
“sending a positioning request to a mobile network server from a mobile communication terminal, acquiring information of the current position at which the mobile communication terminal is located by the mobile network server based on a CELL-ID database in the mobile network server.”
Cluster 1 is similar to cluster 4. As indicated in the following figure, these clusters are located in proximity to each other in the second quadrant. They also have a similar test value score for latent factor 2, which determines clusters (factor 2: cluster 1 (66.044), cluster 4 (59.095)) (Appendix A Table A1 and Table A2).
There were three clusters of journal articles (Table 9). Cluster 1 is based on consumer experience and represents the importance of the consumer’s perspective of academia when approaching mobile technology in tourism. Cluster 2 shows the response of the technology by describing the implementation of these technologies as apps and systems in a mobile environment. Cluster 3 deals with the environment and sustainability, and represents the importance of the sustainability perspective in research on tourism. More specifically, cluster 1 (41.87% of the variance) consists of keywords related to customer experience. “Intention”, with the fifth largest chi square value, seems to be the influence in studies related to TAM, as indicated in the following quotes. Although smaller in number, studies that approach tourism from the perspective of service quality and satisfaction were also clustered in cluster 1 [171].
“Our findings revealed that argument quality had a positive effect on perceived usefulness and source credibility positively affected perceived usefulness and social relationships.”“This study presents a tourist loyalty model of tourism mobile commerce and explores the relationship of service quality, tourist satisfaction, tourist trust and tourist loyalty.”
Table 9.
Journal articles (Scopus DB) clustering by keyword.
Cluster 2 (42.88% of the variance) grouped keywords from the perspective of mobile technology. The cluster is used to describe the implementation of systems that enable application use and consumption of information in a mobile setting. A noteworthy keyword in this cluster is “recommendation” (X2 = 97.5, p < 0.05), where examples include a mobile location-based recommender system for tourism mobile commerce and personalized recommendations for a mobile tourism multimedia selection.
“A location-aware recommender system for tourism mobile commerce. With rapid development of the mobile commerce, exploring new applications and services for mobile environments has become a hot topic.”“Personalized recommendation of mobile tourism: A multidimensional user model. With rapid advances in e-business and mobile technology.”
Cluster 3 (15.26% of the variance) has keywords that are more associated with the interaction in tourism between cultural heritage and users. Representative texts point to sustainable development and need to consider cultural heritage in tourism development. Architecture keywords have the fifth largest chi-square value, indicating a model architecture for implementing smart tourism.
“This article makes an introduction to studies about sustainable development of combining display of cultural heritage and cultural relics and tourism exploitation on the premise of protection.”
Lastly, the news collected from the ProQuest database were grouped into three clusters (Table 10). Cluster 1 (Mobile Device: 24.25% of the variance) is more associated with keywords such as device, wireless, and phone; cluster 2 (City Guide: 40.99% of the variance) is the most significant and describes the situation in which the tourist is guided through a city by apps and maps; and cluster 3 (Business Ecosystem: 34.76% of the variance) represents the market as the place in which business occurs, the company as an entity of the business, and technology as the essential component of the business. Texts that represent cluster 1 describe the situation of consuming travel information using smartphone, as follows:
“Mobile devices; smart travel: majority of smartphone owners now access travel information on their devices. Smartphones become pocket travel agents for growing number of americans.”
Table 10.
News (ProQuest DB) clustering by keyword.
The following text, which represents cluster 2, describes the travel app’s role as a city tour guide.
“San_Francisco city guide download the free telegraph travel app, featuring expert guides to destinations including paris, rome, New_York.”
Cluster 3, called the business ecosystem by the authors, describes the relationship between travel companies and a mobile technology company.
“the leading mobile travel platform and mobile technology provider for airlines and travel companies with an extensive customer base across the global travel industry.”
5. Study 3
5.1. Data and Background
In study 3, we explore the relationship between mobile technology and customers by analyzing user reviews from the TripAdvisor mobile apps and the Google Trips mobile app. From TripAdvisor, 3464 reviews from September 2015 to April 2017 were analyzed, as were 834 Google Trips reviews from September 2016 (launch of the service) to April 2017. The reviews were crawled on the basis of Google Play.
TripAdvisor is a forerunner of recommendation services based on user review data [7]. TripAdvisor started out as a web service and expanded to a mobile service (recently provided in the form of a mobile app). It is also a mobile app that started during the initial stages of e-tourism and has the highest number of queries in Google Trend among all tour apps. The core functionality of TripAdvisor is enabling tourists to share reviews of hotels and restaurants and connecting the users to sites that can make reservations for hotels and restaurants. TripAdvisor also provides information on tourist attractions and historic places, along with maps and routes. Because TripAdvisor started out as review site, it is the web and mobile service with highest number of reviews. However, the mobile app is considered less convenient than the web site in searching and accessing information.
On the other hand, Google Trips is a pure mobile tourism app service that has attracted the media’s attention. Google Trips is a travel app linked to Google Maps and Gmail, and provides route functionality. It recommends tourist attractions with “things to do” and enables users to share reviews. The “day plans” functionality plans the trip for the user using a destination set on the basis of the user’s past search history from the Google search engine. Google Trips exploits all of Google’s web and mobile resources, including recommendations for food, drinks, restaurants, phone numbers, ratings, general information, routes, and need to know tips. However, Google Trips does not enable making direct reservations.
The most significant difference between TripAdvisor and Google Trips is that TripAdvisor started out as a web service and expanded to the mobile platform, whereas Google Trips was launched as a mobile service from the start. In terms of the chronology, TripAdvisor is a service launched in the era of e-tourism, whereas Google Trips was launched very recently (2016). Third, Google Trips is strong in scheduling, and providing links to Gmail and the convenience of using Google Maps, whereas TripAdvisor provides highest number of reviews and researvation functionality.
TripAdvisor was selected because it is the top tour app in terms of queries, as found through Google Trends. Google Trips was selected because it is the most recently launched global travel app and it provides comprehensive functionalities through its linkage with Google and Google Maps. In addition, Google Trips includes most of the functionality of mobile technology in tourism, as deduced from the patents, academic papers, and news data in study 1 and study 2.
5.2. Method
We analyze the review text using content analysis based on text mining. The first utilizes computer-based content analysis using Leximancer, which overcomes the potential bias and error of researchers of qualitative analysis while ensuring reliability and reproducibility of the results. Leximancer is based on corpus linguistics observations and uses a statistical algorithm. It generates information such as concept and theme using unsupervised learning on the basis of inputs, including frequency and pattern of co-occurrence. The concepts deduced by Leximancer indicate keyword groups that co-occur most frequently within the text, and the themes indicate the group of concepts that are clustered on the concept map. The name of the theme takes after the name of the most prominent concept [40,172]. Connectivity indicates the relative importance of a theme and hits indicates the number of text excerpts that matches each concept [123,135].
Leximancer uses co-occurrence information as T-LAB, but uses a different algorithm when extracting. Leximancer uses two different algorithms serially (semantic extraction and relational extraction). In the first stage, a naive Bayesian co-occurrence metric (not only how frequently two words co-occur but also how often they occur apart) is used. In the second stage, text segments are classified using learned semantic classifiers. Leximancer deduces the relative co-occurrence frequency, because general co-occurrence information generates asymmetric information if the frequency of concepts is considered. Taking into account that consumer reviews are in the form of free talking by users, it is necessary to control the counts of frequently occurring words and to avoid interpretation of incidental interactions between concepts as real interactions. Minimizing errors, therefore, requires using relative co-occurrence that considers the frequency of concepts, which is the reason that study 3 uses Leximancer instead of T-LAB.
First, deduced concepts and themes are mapped to the timeframe of the review through the correspondence analysis provided by Leximancer. Because three years of TripAdvisor data and one year of Google Trips data are considered, the relative trends were analyzed by dividing both into seven time sub-frames (TripAdvisor in quarters and Google Trips in months).
Second, we reviewed the expressions related to evaluation and the keywords related to mobile app service functions. By identifying the keywords related to functions, we referred to the existing literature and the role of mobile technology as deduced in study 1 and study 2 [173]. We deduced attributes of functions related to the information sought by the user, functionalities that the user wants when using the service with his or her device, and the legacy systems that need to be interconnected with the new mobile technology. Words that express evaluation were selected from the results of Kang et al. (2014) [174], and we identified keywords that express a positive review and those that express a negative review. To ensure reliability, we compared words selected by both authors. Keywords that were not agreed on were included in the list only if confirmed in the source text and both authors agreed on including them [129,175,176]. Finally, a third-party expert who plans and develops mobile apps confirmed the list of words.
Third, we used DICTION, a dictionary-based computerized content analysis program, and SPSS to statistically evaluate whether the evaluation of the service provided is different for the two services. DICTION is based on linguistic theory and uses 33 different diction libraries to text mining. DICTION calculates scores of preset variables using statical weighting procedures that relate the same words and words that have related meanings but that are different in form.
DICTION is a useful tool comparing the characteristics of two or more groups when expressed in texts. Among the 40 variables calculated by DICTION, we used scores of praise, blame, and satisfaction variables as they were considered to be related to evaluation. The scores of the praise, blame and satisfaction variables were compared using ANCOVA. ANCOVA was used because the length of each review was different. The total words analyzed, which indicates the length of the review, was set as a covariate.
5.3. Result
5.3.1. Theme and Concept in TripAdvisor and Google Trips User Reviews
In the TripAdvisor user reviews, concepts related to the theme of hotels have high hits and connectivity with other words as keywords. This is followed by the theme of need, which contains search, city, and information as related concepts. The third theme describes food, and the fourth theme indicates evaluation of the app with its name as helpful. Overall, information (e.g., hotel, city and food) and evaluation (helpful) have high connectivity and frequency for TripAdvisor (Table 11).
Table 11.
Themes and concepts in TripAdvisor app review.
In contrast, the case of Google Trips indicates that reservations (representing app functionality) and useful (representing evaluation) have high hits and connectivity (Table 12). This result is distinct from the TripAdvisor app in that, in the reviews, users of TripAdvisor focus on food, hotel, and evaluating reviews on the basis of being helpful.
Table 12.
Themes and concepts in Google Trip app review.
For Google Trips, the themes of reservation and useful require further investigation. This is because Google Trips does not directly offer reservation functionality to its users; therefore, further investigation is needed on how the theme was deduced. The representative quotes that determine reservation as a theme are noted as follows and consist of users’ desire for the functionality fully provided in the future and complaints on linkages with Gmail.
“Option to add reservations manually will make it awesome.”“Would love to use but cannot App looks like it would be very useful; unfortunately, it isn’t pulling any of my reservations from my Gmail and there is no way to manually enter them.”“ok but cant edit the reservations??? good thing is that it will consolidate all bookings from emails however, I cannot edit the reservations?”
The texts that determined useful as a theme expressed either the usefulness of linkage with Google Calendar and Google map or the complaints on errors in the linkage with Gmail. Whether the reviews are positive or negative, these are in the context of the experience provided by Google services.
“Thank God everything was also scheduled in Google Calendar, so I use that a lot with cab drivers.”“Very useful, tailored on my Google experience It’s cool, I just would add the map of the city in order to quickly find streets or shops, without downloading Maps offline. Thx Google;).”
Figure 6 is derived from matching the concepts deduced from review texts with reviews periods using correspondence analysis. Dividing the reviews of each app into seven time points results in seven quarters that have elapsed since the launch of TripAdvisor in July 2015 and seven months that have elapsed since the launch of Google Trips in September 2016. Figure 6 shows how themes and concepts have evolved over time. TripAdvisor was linked to the themes of photo and update until the first quarter after the launch, and was more strongly linked with themes related to evaluation, such as love and easy, in the second and third quarter. In the fourth quarter, the trend continued and TripAdvisor was more strongly linked with themes related to evaluation, such as helpful and nice. This was followed by themes of food and photo in the fifth quarter, and the theme of food in the sixth quarter. Finally, TripAdvisor was more linked to themes related to offline and corresponding concepts, such as phone, map, and download, in the seventh quarter. Given that Google Trips was recently launched, its time points were in the interval of months rather than quarters. In the first month, Google Trips was more strongly linked with the concept of useful and the theme of nice, followed by the theme of better in the second month and the themes of nice and basic in the third month. In the fourth month, Google Trips was more linked with keywords related to evaluation, such as helpful, wrong, and limited. In the fifth month, Google Trips was more linked to the theme of reservation. In the sixth month, Google Trips was more strongly linked to keywords related to a negative review, such as useless. Finally, the seventh month is more strongly linked to Google. The overall results indicate that Google Trips reviews exhibited more frequent occurrences of words related to evaluation, such as useful, helpful, nice, better, useless, word, and limited.
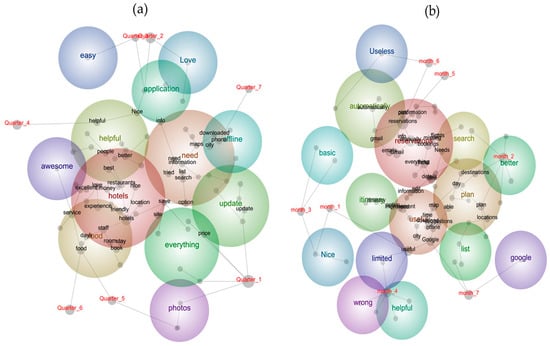
Figure 6.
Themes and concepts in user reviews for mobile tourism apps: (a) TripAdvisor, (b) Google Trips.
Because the keywords that describe the functionalities and the evaluation of the two apps differ, we must further consider the differences as shown in the following Section 5.3.2.
5.3.2. Keywords for Function and Evaluation Appraisal
Keywords for function express the functionalities that the app services need to support, those that devices need to support. A common tendency is to want information on hotels, flights, restaurants, cities and attractions, with emphasis on transportation (e.g., airline, car, bus, and train) for Google Trips. Mandatory main functionalities include reservation, recommend, map, and share. Functionalities for manipulation of services and devices include download, display, compare, detect, and option. Specifically for Google Trips, keywords that stand out are combine, integrate, and merge. There are many indications to link the service with an e-mail service and both the usefulness and the complaints related to linking to Gmail are highlighted for Google Trips (Table 13).
Table 13.
Comparison of keywords from the function and evaluation perspective.
A tendency exists for TripAdvisor to have greater variety of keywords because it was launched before Google Trips. Keywords targeted to devices such as desktop, phone, button, and battery are unique to TripAdvisor.
Keywords related to an evaluation range from positive to negative, with positive comprising the relative majority. It is interesting to observe that a variety of words expressing positive (e.g., perfect, useful, brilliant, essential, user-friendly, smart, top) and negative (e.g., annoy, frustrate, clunky, fabulous, glitch, hard, hate, rubbish, slow, stupid, suck) occur. In addition, evaluation keywords indicating failure of a specific functionality (e.g., bug, fail, lack and problem) are observed.
It should be noted that consideration is required to interpret words such as good and comfortable, because they can be listed serially with negative words (e.g., not good). The data processing process should ensure that such errors do not arise in sentiment analysis.
5.3.3. Comparative DICTION Analysis of Reviews of the Two Apps
TripAdvisor and Google Trips were not launched on the same date. TripAdvisor’s mobile app was released in July 2015 and Google Trips was released in September 2016. In the previous chapters, we qualitatively compared the reviews of the two apps using content analysis, which means that the findings cannot be evaluated in terms of statistical significance. In this chapter, we use the dictionary-based DICTION software tool to attempt to quantify evaluation indices of each app and to attempt to compare the two apps to identify statistically significant differences. A comparison of the two apps needs to include how these apps with different timeframes can be compared. We may compare the reviews of the apps in a same timeframe for both, however, doing so indicates a difference in maturity for the apps and users’ familiarity with the app, which need to be considered in the analysis. Alternatively, we may set the same time interval after the launch. However, doing so means that consumers from 2015 will be compared with consumers from 2016, and these consumers will have different familiarity and experiences in IT. This research resolves these issues by conducting the analysis in both ways and comparing the results.
First, we compare the reviews within the timeframe from September 2016 to April 2017. In this case, one must consider that the ages of the apps are differ. Second, we compare the reviews from the apps’ launch to seven months after the launch. For Google Trips, this timeframe is from September 2016 to seven months after, and for TripAdvisor it is from July 2015 to seven months after. Although it is possible to qualitatively analyze the reviews, we use scores deduced from DICTION’s analysis of the texts. We selected praise, blame, and satisfaction variables among the 40 variables deduced by DICTION because they are related to an evaluation of the apps’ reviews [177]. The first analysis that compared the same timeframe of September 2016 to April 2017 indicated that we may not support the hypothesis that the evaluation of the two apps are different. This is because the blame and satisfaction scores did not meet the assumption of homogeneity of variance, whereas the praise score met the assumption, but its p-value was 0.333, indicating that there is no statistically significant difference in the reviews of the two apps (Table 14).
Table 14.
ANCOVA results for evaluation variables by app. (September 2016 to April 2017).
The second analysis that compared the seven months after the launch included praise and blame because they met the assumption of homogeneity of variance. For blame, the p-value was 0.436, which did not reject the null hypothesis. However, for praise, the p-value was 0.032, and we concluded that statistically significant difference exists between the praise score means of TripAdvisor and Google Trips (Table 15). Taking into account that consumers’ mobile experience was in the initial stage for TripAdvisor and consumers had accumulated a more enriched mobile experience for Google Trips in the timeframe concerned, it is natural to see that TripAdvisor has a higher praise score.
Table 15.
ANCOVA results for evaluation variables by app.
Because the praise scores of the two apps show a statistically significant difference, we conducted a correlation analysis between the praise score and the frequency of the keywords related to evaluation as deduced from the previous parts of study 3. We also included satisfaction scores that were excluded because they did not meet the assumption of homogeneity of variance. The keywords that are positively correlated with a p-value of less than 0.05 are listed in Table 16. TripAdvisor had greater variety of keywords with a positive correlation. It is also worthwhile to note that there is no keyword that is positively correlated with both praise and satisfaction, despite the fact that the two signify similar meaning. It should be highlighted that easy is positively correlated with praise, and amaze, awesome and fun is positively correlated with satisfaction.
Table 16.
Correlation analysis.
Mixing the scores of the variables deduced by DICTION and other quantitative indices (e.g., evaluation keyword) to conduct statistical analysis has already been attempted in other studies, and this research ensured that the analysis is in line with that of these studies [178,179,180].
6. Discussion and Conclusions
6.1. Theoretical Implications for Sustainability and Smart Tourism
One of the purposes of our research is to understand smart tourism from the perspective of sustainability. As identified in study 2, the keywords environment and sustainability indicate that scholars are considering smart tourism in relation to sustainable tourism. Although the tendency is to research mobile technology in tourism from the perspective of user (i.e., tourist) and his or her satisfaction and intention to use, it cannot be denied that mobile technology in tourism is basically related to sustainable tourism. The development of destinations considering environmental effects and cultural heritage [181,182,183], and the role of ICT in connecting services to smart city communities [28] are also discussed in the realm of sustainable tourism.
It is difficult to acknowledge the contribution of mobile technology (as identified in study 1) to sustainability in tourism without precise measurements or assessments. However, this contribution can be deduced qualitatively from various frameworks in the existing literature. First, we can use the concept of QoL to determine whether mobile technology in tourism enhances QoL or brings increases in the various types of capitals that contribute to QoL. Second, we review the relationship between mobile technology and indicators and the concepts of sustainability introduced in the literature review. Third, we apply a new mobility paradigm as proposed by Creswell (2010) and Moscardo (2013). Based on studies 1, 2 and 3, we subsequently describe the role of mobile technology in a hypothetical situation, which allows for an evaluation of the impacts on sustainability.
“Mobile technology provides various information to the user (i.e., tourist) and assists with real-time decision making. Consumers use mobile devices and map related systems to acquire sufficient information, to set routes to destinations, and to modify routes if necessary. By using mobile technology, consumers can capitalize on opportunities and create value. Destinations can use data gathering technology and big data processing technology based on sensors to measure and respond beforehand to potential negative effects on the environment. Firms, as suppliers, can create economic value by providing information optimized for individuals that is processed from context aware data gathered on the basis of users’ lifestyle and location.”
First, from the perspective of QoL and capital, frequent and long tourist visits to a destination can increase GDP growth (economic development) and residents’ financial capital. Sensor, big data analysis, and data processing technology qualitatively enhance both environmental systems (natural capital) and transport systems (built capital). Use of mobile Internet and travel mobile apps, given the nature of social media, enhances the tourist-tourist relationship and, in turn, increases social capital through reciprocity and cooperation. Real-time communication enables transactors to share value and increase cultural capital. Sharing knowledge reduces asymmetric information and increases human capital. The evolution of mobile technology further reduces asymmetric information in other fields and develops participatory democracy that increases political capital. Increases in these various types of capitals leads to growth in QoL and brings positive impacts on sustainability.
Second, the responses of the destination and the supplier reinforce responses and measurements of state, as described in the DPSIR model. This results in improvements in real-time measurements of the environmental impacts of system quality, enhances management, and fosters growth in the competency of policy formulation. Furthermore, energy efficiency, early warnings, and environmental management improve as the sustainability indicators and concepts.
This discussion assumes that tourists have homogeneous characteristics and objectives. The previous discussion can be altered depending on the length of stay at a destination, the number of visits to a destination, the objectives for visiting a destination, and interactions with residents. In the event that many tourists are attracted to a destination because of promotions and/or advertisements through mobile technology, both positive and negative impacts coexist in economic, environmental, and social dimensions. If tourists that aim for employment at the destination (indicating that they may stay for a long period) are included, employment relationship at the destination can become uncertain. Therefore, the contribution of mobile technology depends on the nature of the tourist, the forms of engagement with residents, and the industry/employment structure of the destination.
Third, we can infer the relationship between mobile technology and mobility by utilizing Moscardo’s framework that considers a tourist’s duration, frequency, and engagement in the context of six dimensions of mobilities. Whereas the first part of the discussion focused on the direct effect of QoL and capital on mobile technology, this third part focuses on the sequence of effects through which mobile technology affects mobility and mobility affects capital. The combination of mobility variables can create a diversity of phenomenon for mobility in tourism.
- (i)
- In terms of motivation, why do tourists move? Is it enforced or voluntary? Although many factors affect motivation, the classification by Moscardo et al. (2013) of archetypal tourists—whose objective is leisure and joy—is voluntary in motivation, whereas movement caused by economic necessity is enforced movement. If the role of mobile technology is described in the narrow scope of the archetypal tourist, data gathering and process technologies generate information relevant to the personal context and provide information to users. In turn, this motivates users to tour and encourages overall financial and social benefits.
- (ii)
- In terms of speed, it is difficult to identify mobile technology factors that affect the velocity of movements. The existing literature indicates that slower speeds lead to positive impacts. Therefore, if mobile technology causes tourists to move slowly, a positive impact would exist in terms of sustainability. However, it is difficult to conclude with certainty whether or not mobile technology allows tourists to move slowly.
- (iii)
- In terms of rhythm, it is important to determine whether or not tourists moves in predictable patterns. Although it may differ for types of tourists, systematic accumulation of data enables making predictions and/or forecasts for these tourists.
- (iv)
- It is difficult to determine the effects of mobile technology on routes (even when types of tourist are considered). If tourists have adequate access to the required information to make decision, they make appropriate decisions that suit their objectives and can move within or out of the region when new information is obtained [47]. If integrated information systems across regions are available, such movement can be further stimulated. According to Moscardo, a wider range of movements within regions brings positive effects to capital. However, the positive effect of movements across regions, is still unconfirmed in the literature. If mobile technology can resolve the negative effects from movements across regions, the relationship between mobility and sustainability may contrast with that in the existing literature. Therefore, additional data and empirical research is essential.
- (v)
- The longer and more frequent a tourist’s visit is and the deeper his or her engagement, the more positive the impact that tourism may bring. Because mobile services in tourism resemble social networks in nature, they are likely to deepen the engagement with the community of tourist’s destination. Therefore, we cautiously infer that mobility may positively affect sustainability.
Because the effects of mobility on sustainability depend on various factors, such as a destination’s tourist type, demographics, and geographics, it is difficult to estimate the serial relationship from mobile technology to mobility to sustainability. Relating to the QoL and capital that contribute to sustainability, types of tourists and destinations can change the effect on capital [47]. For example, various dimensions, such as the objective of the tour, the length of the stay, and employment of tourists at destinations, may have different impacts on sustainability. The tourist may have visited for leisure (short holiday), to relax after retirement, or for a job to earn money (e.g., younger generations). Further complicating the issue is that the objective of a tour can change during the tour.
Destinations can also differ socially, economically and physically. The destination can be a sparse region with little population or can be an agricultural region. In general, smart tourism that is defined on the basis of the role and functionality of mobile technology tends to not consider tourist type and destination characteristics. Because the definition of new concepts in the initial stages requires clarification of the concept, it is a positive that the concept of the smart city focuses on few variables based on rational assumptions. However, after the conceptual framework has been consolidated, it should be expanded to various studies that consider the type of tourist and the characteristics of destination-related smart tourism.
Advances in mobile technology can provide bountiful and appropriate information to tourists, enabling tourists to make decisions that maximize their own well-being. Destinations and firms can use refined and accumulated data to make accurate predictions and to respond effectively. However, trends and consumer preferences (e.g., slow food and the slow culture movement) can bring about different directions of changes to the mobile industry regardless of the contribution of mobile technology. In this case, the choice is up to consumers, whereas accumulation of data and responses to changes are up to the firm and the destination.
Theoretically, it is also meaningful to combine the role of mobile technology in smart tourism with the theory discussed in existing literature. The effect of mobile technology on consumers’ decision making can be inferred by applying the TTF theory of adoption. With the assistance of mobile technology, consumers can recognize various data (G06K) and are provided with image with a sufficient amount of high quality data (H04N). Such information is not only provided before the tour but also during the tour considering a user’s location (H04W-004/02); thus it is optimized for personal context. Accumulated information includes individuals’ lifestyle information (G06F-017/30), which is easily understandable and accessible through the support of visualization technology (G06K-017/00). The quality of personal decision making improves, and increases in the TTF of a tour drives the adoption of mobile tour services based on mobile technology [119].
This paper is theoretically significant in that it extends beyond simple analysis of mobile technology as a factor of tourism and considers relationship among tourism, mobile technology and sustainability. For this, this paper considers sustainability related concepts such as QoL, six facets of mobility proposed by Cresswell (2010) and the sustainability indicator to identify the relationship between sustainability and mobile technology. This ultimately provides an outlook to analyze the smart tourism concept from the perspective of sustainability. Moreover, while existing literature conceptualizes smart tourism by systematically devising frameworks based on existing literature and research results, this paper uses real field data from multiple sources to provide realistic direction for smart tourism conceptualization and theory.
Furthermore, we also identified from analysis of real field data that smart tourism can be understood from the sustainability perspective related to markets, environments, residents and related firms, in addition to traditional view of technology and consumer perspective.
6.2. Research Limitations
Comprehensive analysis based on multiple data sources to depict the overall landscape is indispensable because the conceptualization of smart tourism is in the initial stages and the need exists to establish a theoretical foundation and literature base. However, this research still faces the following challenges, which future studies need to overcome.
First, study 1 focused only on IPC for patent analysis. Some studies used citation/inventor or the CPC to analyze patents. Although the CPC has a more granular classification than the IPC has, this study chose the IPC because not all patents are classified according to the CPC. Furthermore, the citation was not selected because it tends to place greater importance on a patent as time passes (i.e., older patents are more likely to be considered important). In addition, the objective of study 1 was to provide an overall image of technology, making the IPC sufficient. The relative weakness in details for IPC analysis have been partially complemented by the centrality analysis of the keyword matrix in study 2.
Second, although the text mining methodology based on computer-generated coding primarily filters researchers’ prejudices and errors, a manual analysis of the text is required to interpret specific keywords/clusters with multiple meanings. Therefore, a precise analysis requires more time.
Third, analysis of consumer reviews of mobile apps aims to identify the functionalities desired by consumers and to explore the variables related to consumer emotions and evaluations. However, we observe that the number of reviews is not as vast as conventional text data and that the reviews of two apps do not meet the assumption of having homogeneity of variance. Therefore, we were limited in analyzing differences in praise scores from the analysis of the reviews within the same timeframe or the differences in praise and blame scores from the analysis of reviews created within seven months after the app launched. This limitation may have resulted from the fact that the amount of review data is not sufficient for statistical analysis, data were not cleansed sufficiently, or the dictionary for the content analysis did not sufficiently include variables related to evaluation and emotion. To overcome these limitations, future studies must ensure that big data are collected and that a dictionary including words related to evaluation and emotion is used.
Furthermore, the risk exists of including fake reviews when analyzing consumer reviews. When there are many fake reviews, the validity and accuracy of the research is at stake. We believe that our criterion of crawling reviews that are indicated as helpful by users would have minimized such errors.
Lastly, TripAdvisor and Google Trips reviews were common in that they were evaluations of app use but were not consistent regarding the point in time during which the app was used. There was no distinction among whether the review was done before the actual tour, during the tour, or after the tour. Because consumer behavior may differ depending on context-aware information during those different points in time, future studies should consider the point in time during which the reviews were created, if possible.
6.3. Future Research Direction
6.3.1. Empirical Research on the Relationship between Mobile Technology and Sustainability
We hypothetically proposed a relationship between mobile technology and sustainability on the basis of results of studies 1–3, and conceptual frameworks such as QoL, type of capital, new mobility paradigm and sustainability indicator. This proposition is not empirical research based on practical data, and thus, requires validation by future researches. Furthermore, researchers must decide on whether or not to consider the type of tourists, the breadth and depth of movement, and various characteristics (demographics, economic positioning, industry structure, and infrastructure) of a destination. Furthermore, empirical considerations and discussions are needed on whether such types of destinations should be taken into account or whether such segmentation is unnecessary. These issues can be addressed by either case studies or analysis of big data using individual context data (profile and behavior).
6.3.2. Network Environments and Consumer Costs
When understanding mobile technology, it is also essential to consider factors related to the cost burden of users and the level of technology. If a tourist seeks access to information during a tour, the network environment must be able to provide the needed coverage and speed, and the cost of being always connected must be affordable to users. If either the destination’s network environment is unfavorable or the data consumption costs exceed the tourist’s willingness to pay, the user must prepare by downloading the minimum required data to his or her device before departing [79]. Although it is important to consider the design and implementation of mobile technology and/or service that is to be adopted to smart tourism, considering the technology’s level needed to support its objective and its cost is indispensable because these factors may change consumer behavior.
E-tourism expanded under the assumption of consumers’ use of PC-based fixed Internet, however, smart tourism leverages the mobile Internet that serves as a channel for information and mobile technology. In addition, future research should address which of fixed Internet and mobile Internet is selected by consumers depending on the type of trip, the decision process, environments, and consumer costs.
6.3.3. The Role of Mobile Application and Text Mining in Tourism
In this research, the mobile app was considered a window of contact between mobile technology and consumers. The mobile app is a tool for consumers to collect tourism-related information, a tool for planning a tour, and a window for purchasing tour packages. Tourists interact with other tourists, firms that supply tour services, and other systems related to tours through mobile apps. Therefore, the mobile app is a strategic point of contact for the supplier to develop because it serves as an information channel for consumers. Therefore, it is crucial to consider the new types of information channels that may emerge in the future [6,34,43,184] and differences in consumer behavior that use the tools relative to the traditional information channel. Tourism-related suppliers must prepare beforehand responses to these new situations. The mobile app bears significance for firms and consumers as a strong practical tool and for academic researchers as a future research topic.
The mobile app can be a useful tool for researchers to develop and complement the existing literature. In the past, tourism research used surveys on the relationships among quality, usefulness, satisfaction, and intention to visit a destination [171] to identify consumer behavior. However, we can elaborate on existing methodologies based on data collection using surveys by considering consumer behavior through studies on mobile app reviews. For example, this complementary measure can help researchers identify relevant variables before applying the TAM and service quality and satisfaction theories. Taking the results of the Google Trips app as an example, the “useful” theme deduced from the analysis may infer that perceived usefulness affects intention to use. The results of the analysis on the two apps indicate that expressions for evaluation can be potential variables to explain adoption and satisfaction. Study 3 was an attempt in this context, however, researchers must ensure the validity of the research even when unstructured data are used. In this research, we manually checked the text to validate the interpretation of the keywords deduced using text mining. This is an indispensable task for text mining research but also a limitation of the methodology, which cannot automatize all processes. This task of confirming the contexts of deduced keywords/themes also applies to other fields using big data. A complete automatic process is expected to be developed through the development and enhancement of artificial intelligence (especially natural language processing). Therefore, it is necessary for the academic field and the business field to collaborate to develop the necessary algorithms and to share knowledge.
6.3.4. Proposal of Research Direction for the Innovation Perspective
The results of studies 1–3 imply that the role of mobile technology in tourism can be evaluated on the basis of users and is likely to operate to enhance value to a user. Therefore, these results suggest the importance of research on users and imply a shift from past research on destination. From the consumer perspective, we need to consider users’ potential tour scenarios and mobile technology’s response to support these scenarios.
However, the mobile technology in tourism based on the responses of end users is focused on enhancing these users’ unmet needs expressed by their words. Therefore, these incremental improvement [185] will consequently indicate that the response will be minimal. To bring breakthrough innovation rather than incremental innovation to tourism [186], observing a tourist’s actions and an understanding of stakeholders’ interests must be taken into account in response [187,188]. We hope that sensor technology and big data contribute into breakthrough innovation and we believe that approaches that reflect the future-oriented opinions of experts are necessary in future research.
6.3.5. Data Monopoly by Mobile Technology Platform Player and Its Governance
One factor that was not considered in this research is the monopoly by the first mover given the first-mover advantage latent in mobile technology [189,190]. When mobile technology is deployed as an infrastructure based on a specific standard/dominant design, other technology cannot enter into the market and the fate of tourism is also likely to rely on the dominant technology [191,192,193]. This hinders the sustainable growth of firms in other industries and new entrant firms. Although the discussion may be out of the scope of this research as a theme of industry structure and monopoly/oligopoly, future studies must focus on it because of the possibility that the platform player dominates the mobile technology to determine the governance of tourism planning and the competency of tourism destination.
6.3.6. Tourism Ecosystem and Digital Twin
In consideration of smart tourism, for which consumers are important, the relationship between tourists and other entities such as destination, firms, systems, related industries, and other tourists must be considered. We also introduced the research by Grezel et al., which uses the concept of a smart tourism ecosystem to describe players and related systems of tourism. Understanding smart tourism from the perspective of a business ecosystem can increase the interest of managers and researchers in participants of smart tourism. These findings, which indicate smart tourism is a business ecosystem, are still valid from the perspective of sustainability and are meaningful as a catalyst to stimulate diversity in research. Specifically, mobile technology makes service and data moveable, which makes ecosystems more open and enables coordination and collaboration among entities of smart tourism ecosystem, including government agencies and stakeholders from other industries. New technologies that comprise smart tourism support new forms of collaboration and foster innovation that creates value [6].
From the perspective of tourism ecosystem, we believe that digital twin technology—a technology that forecasts outcomes for complex relationships among entities through simulation—will play an important role in tourism. Digital twin technology is one of the top 10 strategic technologies selected by Gartner and is a concept proposed by General Electric (GE). This technology creates a twin in the digital world within a computer and forecasts the outcomes using computer simulation [194,195]. This technology was first applied to manufacturing [196,197], the military [198,199], and buildings [200]. It can be applied to cities using computer simulation to create a digital twin of a city and to forecast issues related to lifestyle and disasters. For tourism, we can create a digital twin of a tourism destination as a set of participants (tourist, supplier, resident consumer, government, and other industry supplier) and collect and/or analyze data related to smart tourism. Furthermore, using indicators that can measure various types of data, we will be able to assess from the perspective of sustainability the positive and negative impacts on tourism participants and resources. This assessment will enable a priori evaluation of business viability [1] and robust tourism development. For this purpose, the systematic accumulation of relevant data and optimized integration of other systems must precede through the required contribution from mobile technology.
We have been observing the commoditization of mobile Internet, smartphone and mobile apps, along with the rapid adoption of social media through fixed Internet and mobile Internet. In the mobile connected society, consumers directly access data/information and systems share/integrate data saved in databases [29]. The development of mobile technology creates innovative experiences for consumers, fosters a sustainable competitive advantage for suppliers related to tourism destinations, and brings sustainable competency to tourism [7]. Ultimately, mobile technology will provide new opportunities for value creation [201]. We hope that this research provides guidance on research directions for mobile technology to enhance value creation in the future.
Acknowledgments
This paper was supported by Kumoh National Institute of Technology.
Author Contributions
Sungbum Kim designed the overall framework of the research, and drafted the manuscript. Dongwook Kim conducted literature review, collected the data, and reviewed the draft. All authors read the final manuscript and approved it for final submission.
Conflicts of Interest
The authors declare no conflict of interest.
Appendix A
Table A1.
Relationship between clusters and factors (patent clustering) *.
Table A1.
Relationship between clusters and factors (patent clustering) *.
| Factor 1 Data Control Technology | Factor 2 Mobile Communication | Factor 3 System | |
|---|---|---|---|
| Cluster 1 System | −68.616 | 66.044 | 89.044 |
| Cluster 2 Data control technology | 167.664 | 4.839 | 9.923 |
| Cluster 3 map and plan | −57.228 | −132.169 | 9.223 |
| Cluster 4 Mobile communication technology | −65.418 | 59.095 | −93.206 |
* The value of each cell are test values provided by T-LAB which correspond to the statistical significance and have threshold values (±) 1.96 (p = 0.05). The higher the test value, more significant the cluster is in defining a factor.
Table A2.
Explanatory factors (patent clustering).
Table A2.
Explanatory factors (patent clustering).
| POLE(+) | ||||||||
|---|---|---|---|---|---|---|---|---|
| Type | Elements | Test Values | Type | Elements | Test Values | Type | Elements | Test Values |
| Factor 1 | Factor 2 | Factor 3 | ||||||
| LEM | connect | 34.371 | LEM | system | 26.928 | LEM | system | 29.813 |
| LEM | control | 33.776 | LEM | service | 23.850 | LEM | management | 24.781 |
| LEM | circuit | 29.984 | LEM | terminal | 23.776 | LEM | service | 23.499 |
| LEM | electric | 26.239 | LEM | management | 21.667 | LEM | intelligent | 21.895 |
| LEM | sensor | 25.580 | LEM | server | 20.220 | LEM | guide | 19.659 |
| LEM | equip | 21.109 | LEM | mobile | 19.884 | LEM | platform | 18.007 |
| LEM | signal | 20.697 | LEM | intelligent | 18.709 | LEM | virtual | 16.437 |
| LEM | controller | 20.571 | LEM | platform | 16.448 | LEM | disclose | 15.890 |
| LEM | monitor | 19.223 | LEM | communication | 15.580 | LEM | subsystem | 12.363 |
| LEM | output | 18.644 | LEM | guide | 15.314 | LEM | realize | 11.473 |
References
- Moscardo, G.; Murphy, L. There is no such thing as sustainable tourism: Re-conceptualizing tourism as a tool for sustainability. Sustainability 2014, 6, 2538–2561. [Google Scholar] [CrossRef]
- Montaño-Vallef, A. Sustainability strategy as a source of competitive advantages in the tourism industry. A model for the integration of natural resources. Eur. J. Tour. Res. 2016, 14, 106–109. [Google Scholar]
- Klemm, M. Sustainable tourism development. Tour. Manag. 1992, 13, 169–180. [Google Scholar] [CrossRef]
- Mak, J.; Moncur, J.E.T. Sustainable tourism development: Managing hawaii’s ”unique“ touristic resource—Hanauma bay. J. Travel Res. 1995, 33, 51–57. [Google Scholar] [CrossRef]
- Camargo, B.A.; Gretzel, U. What do tourism students know about sustainability and sustainable tourism? An exploratory study of latin american students. J. Teach. Travel Tour. 2017, 17, 1–17. [Google Scholar] [CrossRef]
- Gretzel, U.; Sigala, M.; Xiang, Z.; Koo, C. Smart tourism: Foundations and developments. Electron. Mark. 2015, 25, 179–188. [Google Scholar] [CrossRef]
- Koo, C.; Park, J.; Lee, J.N. Smart tourism: Traveler, business, and organizational perspectives. Inf. Manag. 2017, 54, 683–686. [Google Scholar] [CrossRef]
- Werthner, H.; Koo, C.; Gretzel, U.; Lamsfus, C. Special issue on smart tourism systems: Convergence of information technologies, business models, and experiences. Comput. Hum. Behav. 2015, 50, 556–557. [Google Scholar] [CrossRef]
- Li, Y.; Hu, C.; Huang, C.; Duan, L. The concept of smart tourism in the context of tourism information services. Tour. Manag. 2017, 58, 293–300. [Google Scholar] [CrossRef]
- Saarinen, J. Critical sustainability: Setting the limits to growth and responsibility in tourism. Sustainability 2014, 6, 1–17. [Google Scholar] [CrossRef]
- Wheeller, B. Sustaining the ego. J. Sustain. Tour. 1993, 1, 121–129. [Google Scholar] [CrossRef]
- Smith, D.M. Geography and ethics: A moral turn? Prog. Hum. Geogr. 1997, 21, 583–590. [Google Scholar] [CrossRef]
- Cucculelli, M.; Goffi, G. Does sustainability enhance tourism destination competitiveness? Evidence from italian destinations of excellence. J. Clean. Prod. 2016, 111, 370–382. [Google Scholar] [CrossRef]
- Ko, T.G. Development of a tourism sustainability assessment procedure: A conceptual approach. Tour. Manag. 2005, 26, 431–445. [Google Scholar] [CrossRef]
- Pérez, V.E.; Santoyo, A.H.; Guerrero, F.; León, M.A.; da Silva, C.L.; Caballero, R. Measuring the sustainability of cuban tourism destinations considering stakeholders’ perceptions. Int. J. Tour. Res. 2017. [Google Scholar] [CrossRef]
- Huang, Y.; Coelho, V.R. Sustainability performance assessment focusing on coral reef protection by the tourism industry in the coral triangle region. Tour. Manag. 2017, 59, 510–527. [Google Scholar] [CrossRef]
- Weber, F.; Taufer, B. Assessing the sustainability of tourism products-as simple as it gets. Int. J. Sustain. Dev. Plan. 2016, 11, 325–333. [Google Scholar] [CrossRef]
- Hamid, M.A.; Isa, S.M. Measuring sustainability levels of tour operator businesses using sustainable tourism indicators: A conceptual perspective. In Heritage, Culture and Society: Research Agenda and Best Practices in the Hospitality and Tourism Industry, Proceedings of the 3rd International Hospitality and Tourism Conference, IHTC 2016 and 2nd International Seminar on Tourism, ISOT 2016, Bandung, Indonesia, 10–12 October 2016; CRC Press: Boca Raton, FL, USA, 2016; pp. 601–606. [Google Scholar]
- Marlina, E. Geotourism as a strategy of geosite empowerment towards the tourism sustainability in gunungkidul regency, indonesia. Int. J. Smart Home 2016, 10, 131–148. [Google Scholar]
- Gázquez-Abad, J.C.; Huertas-García, R.; Vázquez-Gómez, M.D.; Casas Romeo, A. Drivers of sustainability strategies in spain’s wine tourism industry. Cornell Hosp. Q. 2015, 56, 106–117. [Google Scholar] [CrossRef]
- De Leaniz, P.M.G.; del Bosque, I.R. Sustainability: A competitive advantage in the tourism industry. In Handbook on Tourism Development and Management; Nova Science, Cop.: New York, NY, USA, 2015; pp. 39–58. [Google Scholar]
- Byun, J.; Kim, B.W.; Ko, C.Y.; Byun, J.W. 4G LTE network access system and pricing model for IoT MVNOs: Spreading smart tourism. Multimedia Tools Appl. 2017, 76, 19665–19688. [Google Scholar] [CrossRef]
- Mithat Üner, M.; Güven, F.; Tamer Cavusgil, S. Bundling of telecom offerings: An empirical investigation in the turkish market. Telecommun. Policy 2015, 39, 53–64. [Google Scholar] [CrossRef]
- Duxbury, L.; Smart, R. The “myth of separate worlds”: An exploration of how mobile technology has redefined work-life balance. In Creating Balance? International Perspectives on the Work-Life Integration of Professionals; Kaiser, S., Ringlstetter, M.J., Eikhof, D.R., Pina e Cunha, M., Eds.; Springer: Berlin/Heidelberg, Germany, 2011; pp. 269–284. [Google Scholar]
- Neuhofer, B.; Buhalis, D.; Ladkin, A. A typology of technology-enhanced tourism experiences. Int. J. Tour. Res. 2014, 16, 340–350. [Google Scholar] [CrossRef]
- Ali, A.; Frew, A.J. ICT and sustainable tourism development: An innovative perspective. J. Hosp. Tour. Technol. 2014, 5, 2–16. [Google Scholar] [CrossRef]
- Stockdale, R. Managing customer relationships in the self-service environment of e-tourism. J. Vacat. Mark. 2007, 13, 205–219. [Google Scholar] [CrossRef]
- Bifulco, F.; Tregua, M.; Amitrano, C.C.; D’Auria, A. Ict and sustainability in smart cities management. Int. J. Public Sect. Manag. 2016, 29, 132–147. [Google Scholar] [CrossRef]
- Buhalis, D.; Law, R. Progress in information technology and tourism management: 20 years on and 10 years after the internet-the state of etourism research. Tour. Manag. 2008, 29, 609–623. [Google Scholar] [CrossRef]
- Gretzel, U.; Werthner, H.; Koo, C.; Lamsfus, C. Conceptual foundations for understanding smart tourism ecosystems. Comput. Hum. Behav. 2015, 50, 558–563. [Google Scholar] [CrossRef]
- Kooa, C.; Shinb, S.; Gretzelc, U.; Hunterd, W.C.; Chunge, N. Conceptualization of smart tourism destination competitiveness. Asia Pac. J. Inf. Syst. 2016, 26, 561–576. [Google Scholar]
- Moscardo, G. Exploring social representations of tourism planning: Issues for governance. J. Sustain. Tour. 2011, 19, 423–436. [Google Scholar] [CrossRef]
- Hunter, W.C.; Chung, N.; Gretzel, U.; Koo, C. Constructivist research in smart tourism. Asia Pac. J. Inf. Syst. 2015, 25, 105–120. [Google Scholar]
- Kaplanidou, K.; Vogt, C. A structural analysis of destination travel intentions as a function of web site features. J. Travel Res. 2006, 45, 204–216. [Google Scholar] [CrossRef]
- Chung, N.; Koo, C.; Lee, K. Assessing the impact of mobile technology on exhibition attendees’ unplanned booth visit behaviour. Sustainability 2017, 9, 884. [Google Scholar] [CrossRef]
- Ukpabi, D.C.; Karjaluoto, H. Consumers’ acceptance of information and communications technology in tourism: A review. Telemat. Inform. 2017, 34, 618–644. [Google Scholar] [CrossRef]
- Werthner, H.; Alzua-Sorzabal, A.; Cantoni, L.; Dickinger, A.; Gretzel, U.; Jannach, D.; Neidhardt, J.; Pröll, B.; Ricci, F.; Scaglione, M.; et al. Future research issues in it and tourism: A manifesto as a result of the jitt workshop in june 2014, Vienna. Inf. Technol. Tour. 2015, 15, 1–15. [Google Scholar] [CrossRef]
- Jeong, Y.; Yoon, B. Development of patent roadmap based on technology roadmap by analyzing patterns of patent development. Technovation 2015, 39, 37–52. [Google Scholar] [CrossRef]
- Lee, S.; Yoon, B.; Lee, C.; Park, J. Business planning based on technological capabilities: Patent analysis for technology-driven roadmapping. Technol. Forecast. Soc. Chang. 2009, 76, 769–786. [Google Scholar] [CrossRef]
- Kim, D.; Kim, S. Sustainable supply chain based on news articles and sustainability reports: Text mining with leximancer and diction. Sustainability 2017, 9, 1008. [Google Scholar] [CrossRef]
- Qu, M.; Tahvanainen, L.; Ahponen, P.; Pelkonen, P. Bio-energy in china: Content analysis of news articles on chinese professional internet platforms. Energy Policy 2009, 37, 2300–2309. [Google Scholar] [CrossRef]
- Cho, S.; Hong, Y. Netizens’ evaluations of corporate social responsibility: Content analysis of csr news stories and online readers’ comments. Public Relat. Rev. 2009, 35, 147–149. [Google Scholar] [CrossRef]
- Huang, C.D.; Goo, J.; Nam, K.; Yoo, C.W. Smart tourism technologies in travel planning: The role of exploration and exploitation. Inf. Manag. 2017, 54, 757–770. [Google Scholar] [CrossRef]
- Hardy, A.; Beeton, R.J.S.; Pearson, L. Sustainable tourism: An overview of the concept and its position in relation to conceptualisations of tourism. J. Sustain. Tour. 2002, 10, 475–496. [Google Scholar] [CrossRef]
- Lu, J.; Nepal, S.K. Sustainable tourism research: An analysis of papers published in the journal of sustainable tourism. J. Sustain. Tour. 2009, 17, 5–16. [Google Scholar] [CrossRef]
- Moscardo, G. Tourism and quality of life: Towards a more critical approach. Tour. Hospitality Res. 2009, 9, 159–170. [Google Scholar] [CrossRef]
- Moscardo, G.; Konovalov, E.; Murphy, L.; McGehee, N. Mobilities, community well-being and sustainable tourism. J. Sustain. Tour. 2013, 21, 532–556. [Google Scholar] [CrossRef]
- Cresswell, T. Towards a politics of mobility. Environ. Plan. D Soc. Space 2010, 28, 17–31. [Google Scholar] [CrossRef]
- Sheller, M.; Urry, J. The new mobilities paradigm. Environ. Plan. A 2006, 38, 207–226. [Google Scholar] [CrossRef]
- Schianetz, K.; Kavanagh, L.; Lockington, D. Concepts and tools for comprehensive sustainability assessments for tourism destinations: A comparative review. J. Sustain. Tour. 2007, 15, 369–389. [Google Scholar] [CrossRef]
- Lin, T.; Xue, X.-Z.; Lu, C.-Y. Analysis of coastal wetland changes using the “DPSIR” model: A case study in Xiamen, China. Coast. Manag. 2007, 35, 289–303. [Google Scholar] [CrossRef]
- Fernández, J.I.P.; Rivero, M.S. Measuring tourism sustainability: Proposal for a composite index. Tour. Econ. 2009, 15, 277–296. [Google Scholar] [CrossRef]
- Cocklin, C.R. Methodological problems in evaluating sustainability. Environ. Conserv. 2009, 16, 343–351. [Google Scholar] [CrossRef]
- Jovicic, D.Z. From the traditional understanding of tourism destination to the smart tourism destination. Curr. Issues Tour. 2017, 1–7. [Google Scholar] [CrossRef]
- Lamsfus, C.; Martín, D.; Alzua-Sorzabal, A.; Torres-Manzanera, E. Smart tourism destinations: An extended conception of smart cities focusing on human mobility. In Information and Communication Technologies in Tourism 2015, Proceedings of the International Conference, Lugano, Switzerland, 3–6 February 2015; Tussyadiah, I., Inversini, A., Eds.; Springer International Publishing: Cham, Switzerland, 2015; pp. 363–375. [Google Scholar]
- Buhalis, D.; Amaranggana, A. Smart tourism destinations enhancing tourism experience through personalisation of services. In Information and Communication Technologies in Tourism 2015, Proceedings of the International Conference, Lugano, Switzerland, 3–6 February 2015; Tussyadiah, I., Inversini, A., Eds.; Springer International Publishing: Cham, Switzerland, 2015; pp. 377–389. [Google Scholar]
- Molz, J.G. Travel Connections: Tourism, Technology and Togetherness in a Mobile World; Taylor and Francis: Oxford, UK, 2012; pp. 1–202. [Google Scholar]
- Boes, K.; Buhalis, D.; Inversini, A. Conceptualising smart tourism destination dimensions. In Information and Communication Technologies in Tourism 2015, Proceedings of the International Conference, Lugano, Switzerland, 3–6 February 2015; Tussyadiah, I., Inversini, A., Eds.; Springer International Publishing: Cham, Switzerland, 2015; pp. 391–403. [Google Scholar]
- Chatfield, A.T.; Reddick, C.G. Smart city implementation through shared vision of social innovation for environmental sustainability: A case study of Kitakyushu, Japan. Soc. Sci. Comput. Rev. 2016, 34, 757–773. [Google Scholar] [CrossRef]
- Su, K.; Li, J.; Fu, H. Smart city and the applications. In Proceedings of the 2011 International Conference on Electronics, Communications and Control (ICECC), Ningbo, China, 9–11 September 2011; pp. 1028–1031. [Google Scholar]
- Liu, H.L.; Li, J.H.; Peng, J. A novel recommendation system for the personalized smart tourism route: Design and implementation. In Proceedings of the 2015 IEEE 14th International Conference on Cognitive Informatics and Cognitive Computing, ICCI*CC 2015, Beijing, China, 6–8 July 2015; pp. 291–296. [Google Scholar]
- Zeng, Y.C.; Chan, Y.H.; Lin, T.Y.; Shih, M.J.; Hsieh, P.Y.; Chao, G.L. Scene feature recognition-enabled framework for mobile service information query system. In Human Interface and the Management of Information. Information and Knowledge in Context; Yamamoto, S., Ed.; Springer: Cham, Switzerland, 2015; Volume 9173, pp. 64–74. [Google Scholar]
- Babli, M.; Ibáñez, J.; Sebastiá, L.; Garrido, A.; Onaindia, E. An intelligent system for smart tourism simulation in a dynamic environment. CEUR Workshop Proc. 2016, 1724, 15–22. [Google Scholar]
- Kim, J.Y.; Canina, L. An analysis of smart tourism system satisfaction scores: The role of priced versus average quality. Comput. Hum. Behav. 2015, 50, 610–617. [Google Scholar] [CrossRef]
- Marine-Roig, E.; Anton Clavé, S. Tourism analytics with massive user-generated content: A case study of barcelona. J. Destin. Mark. Manag. 2015, 4, 162–172. [Google Scholar] [CrossRef]
- Sibunruang, W.; Uthaisar, S. Smart tourism center: The interpretation of the interactive cultural tourism route. In Interdisciplinary Behavior and Social Sciences, Proceedings of the 3rd International Congress on Interdisciplinary Behavior and Social Sciences, ICIBSoS 2014, Bali, Indonesia, 1–2 November 2015; CRC Press: Boca Raton, FL, USA, 2015; pp. 233–236. [Google Scholar]
- Basili, A.; Liguori, W.; Palumbo, F. NFC smart tourist card: Combining mobile and contactless technologies towards a smart tourist experience. In Proceedings of the 2014 IEEE 23rd International WETICE Conference (WETICE), Parma, Italy, 23–25 June 2014; Reddy, S.M., Ed.; IEEE Computer Society: Washington, DC, USA, 2014; pp. 249–254. [Google Scholar]
- Perez-Jimenez, R.; Rabadan, J.; Rufo, J.; Solana, E.; Luna-Rivera, J.M. Visible light communications technologies for smart tourism destinations. In Proceedings of the 2015 IEEE First International Smart Cities Conference (ISC2), Guadalajara, Mexico, 25–28 October 2015; Institute of Electrical and Electronics Engineers Inc.: Piscataway, NJ, USA, 2015. [Google Scholar]
- Li, D.; Shan, J.; Shao, Z.; Zhou, X.; Yao, Y. Geomatics for smart cities—Concept, key techniques, and applications. Geo-Spat. Inf. Sci. 2013, 16, 13–24. [Google Scholar] [CrossRef]
- Wolff, A.; Mulholland, P. Navigation strategies in the cityscape/datascape. In Proceedings of the 2015 ACM International Joint Conference on Pervasive and Ubiquitous Computing and the 2015 ACM International Symposium on Wearable Computers, Osaka, Japan, 7–11 September 2015; Association for Computing Machinery, Inc.: New York, NY, USA, 2015; pp. 1143–1152. [Google Scholar]
- Park, B.; Yim, J. Design of an android app for gyeongju smart tourism. In Computer Science and Its Applications; Jeong, H.Y., Stojmenovic, I., Park, J.J., Yi, G., Eds.; Springer: Berlin/Heidelberg, Germany, 2015; Volume 330, pp. 991–995. [Google Scholar]
- Law, R.; Leung, R.; Buhalis, D. Information technology applications in hospitality and tourism: A review of publications from 2005 to 2007. J. Travel Tour. Mark. 2009, 26, 599–623. [Google Scholar] [CrossRef]
- Law, R.; Buhalis, D.; Cobanoglu, C. Progress on information and communication technologies in hospitality and tourism. Int. J. Contemp. Hosp. Manag. 2014, 26, 727–750. [Google Scholar] [CrossRef]
- Xiang, Z.; Wang, D.; O’Leary, J.T.; Fesenmaier, D.R. Adapting to the internet. J. Travel Res. 2015, 54, 511–527. [Google Scholar] [CrossRef]
- Gretzel, U.; Koo, C.; Sigala, M.; Xiang, Z. Special issue on smart tourism: Convergence of information technologies, experiences, and theories. Electron. Mark. 2015, 25, 175–177. [Google Scholar] [CrossRef]
- Borrego-Jaraba, F.; Luque Ruiz, I.; Gómez-Nieto, M.Á. NFC Solution for the Development of Smart Scenarios Supporting Tourism Applications and Surfing in Urban Environments; Lecture Notes in Computer Science (Including Subseries Lecture Notes in Artificial Intelligence and Lecture Notes in Bioinformatics); Springer: Berlin/Heidelberg, Germany, 2010; Volume 6098, pp. 229–238. [Google Scholar]
- Han, H.; Park, A.; Chung, N.; Lee, K.J. A near field communication adoption and its impact on expo visitors’ behavior. Int. J. Inf. Manag. 2016, 36, 1328–1339. [Google Scholar] [CrossRef]
- Krinkin, K.; Yudenok, K. Geo-coding in smart environment: Integration principles of smart-M3 and geo2tag. In Internet of Things, Smart Spaces, and Next Generation Networking; Balandin, S., Andreev, S., Koucheryavy, Y., Eds.; Springer: Berlin/Heidelberg, Germany, 2013; Volume 8121, pp. 107–116. [Google Scholar]
- Teslya, N.; Ponomarev, A. Smart tourism destination support scenario based on human-computer cloud. In Proceedings of the 2016 19th Conference of Open Innovations Association (FRUCT), Jyvaskyla, Finland, 7–11 November 2016; Tyutina, T., Balandin, S., Eds.; IEEE Computer Society: Washington, DC, USA, 2017; pp. 242–247. [Google Scholar]
- Albusaidi, H.S.; Udupi, P.K.; Dattana, V. Integrated data analytic tourism dashboard (IDATD). In Proceedings of the 2016 5th International Conference on Reliability, Infocom Technologies and Optimization (Trends and Future Directions) (ICRITO), Noida, India, 7–9 September 2016; Shukla, B., Khatri, S.K., Kapur, P.K., Eds.; Institute of Electrical and Electronics Engineers Inc.: Piscataway, NJ, USA, 2016; pp. 497–500. [Google Scholar]
- Kim, S.-E.; Lee, K.Y.; Shin, S.I.; Yang, S.-B. Effects of tourism information quality in social media on destination image formation: The case of sina weibo. Inf. Manag. 2017, 54, 687–702. [Google Scholar] [CrossRef]
- Neuhofer, B.; Buhalis, D.; Ladkin, A. Smart technologies for personalized experiences: A case study in the hospitality domain. Electron. Mark. 2015, 25, 243–254. [Google Scholar] [CrossRef]
- Hu, Z.; Wang, Z.; Liu, H.; Bie, H. Self-service folk tourism guiding technology on mobile terminal with multi-mode: Application of gps and electronic map. In Proceedings of the 2010 IEEE International Geoscience and Remote Sensing Symposium (IGARSS), Honolulu, HI, USA, 25–30 July 2010; pp. 4553–4556. [Google Scholar]
- Kim, H.C.; Kim, Y.S. Smart tourism information system using location-based technology. Int. J. Softw. Eng. Appl. 2016, 10, 11–24. [Google Scholar] [CrossRef]
- Feng, W.L.; Duan, Y.C.; Huang, M.X.; Dong, L.F.; Zhou, X.Y.; Hu, T. A research on smart tourism service mechanism based on context awareness. Appl. Mech. Mater. 2014, 519–520, 750–756. [Google Scholar] [CrossRef]
- Atzori, L.; Iera, A.; Morabito, G. The internet of things: A survey. Comput. Netw. 2010, 54, 2787–2805. [Google Scholar] [CrossRef]
- Copeland, D.G.; McKenney, J.L. Airline reservations systems: Lessons from history. MIS Q. 1988, 12, 353–370. [Google Scholar] [CrossRef]
- Anckar, B.; Walden, P. Self-booking of high- and low-complexity travel products: Exploratory findings. Inf. Technol. Tour. 2001, 4, 151–165. [Google Scholar] [CrossRef]
- Mitev, N.N. Electronic markets in transport: Comparing the globalization of air and rail computerized reservation systems. Electron. Mark. 1999, 9, 215–225. [Google Scholar] [CrossRef]
- Bauemberger, L.; Reiger, S. Info austria/eurostart austria. Electron. Mark. 1996, 6, 18–19. [Google Scholar] [CrossRef]
- Dalli, A.; Bri, S. Design of Electronic Ticket System for Smart Tourism. In Proceedings of the 2016 12th International Conference on Signal-Image Technology & Internet-Based Systems (SITIS), Naples, Italy, 28 November–1 December 2016; De Pietro, G., Dipanda, A., Chbeir, R., Gallo, L., Yetongnon, K., Eds.; Institute of Electrical and Electronics Engineers Inc.: Piscataway, NJ, USA, 2017; pp. 490–492. [Google Scholar]
- Varfolomeyev, A.; Korzun, D.; Ivanovs, A.; Soms, H.; Petrina, O. Smart Space Based Recommendation Service for Historical Tourism. Procedia Comput. Sci. 2015, 77, 85–91. [Google Scholar] [CrossRef]
- Pasichnyk, V.; Artemenko, O. Intelligent Advisory Systems and Information Technology Support for Decision Making in Tourism. In Proceedings of the 2015 Xth International Scientific and Technical Conference “Computer Sciences and Information Technologies” (CSIT), Lviv, Ukraine, 14–17 September 2015; Institute of Electrical and Electronics Engineers Inc.: Piscataway, NJ, USA, 2015; pp. 16–21. [Google Scholar]
- Mouhim, S.; El Aoufi, A.; Cherkaoui, C.; Megder, E.; Mammass, D. Towards a knowledge management system for tourism based on the semantic web technology. In Proceedings of the 2011 International Conference on the Multimedia Computing and Systems (ICMCS), Ouarzazate, Morocco, 7–9 April 2011. [Google Scholar]
- Tsai, C.H. Web-based tourism risk assessment system incorporating web-gis & hip technologies. Int. J. Comput. Appl. Technol. 2017, 55, 128–137. [Google Scholar]
- Felfernig, A.; Gordea, S.; Jannach, D.; Teppan, E.; Zanker, M. A short survey of recommendation technologies in travel and tourism. OGAI J. 2006, 25, 17–22. [Google Scholar]
- Chen, T.F. Applying RFID technology in tourism industry: The case study of hotel in Taipei. Adv. Mater. Res. 2013, 630, 439–445. [Google Scholar] [CrossRef]
- Huang, W.; Zhu, B. In Management of tourism group and technology of the personalized tour based on RFID. In Proceedings of the 2011 Chinese Control and Decision Conference (CCDC), Mianyang, China, 23–25 May 2011; pp. 975–978. [Google Scholar]
- Hsieh, M.Y.; Li, K.C. Monitoring procedures for tourism using rfid and google maps technologies. In Proceedings of the 2010 IET International Conference on Frontier Computing—Theory, Technologies and Applications, Taichung, Taiwan, 4–6 August 2010; pp. 215–220. [Google Scholar]
- Pesonen, J.; Horster, E. Near field communication technology in tourism. Tour. Manag. Perspect. 2012, 4, 11–18. [Google Scholar] [CrossRef]
- Ramos, C.M.Q.; Henriques, C.H.N.; Lanquar, R. Augmented reality for smart tourism in religious heritage itineraries: Tourism experiences in the technological age. In Handbook of Research on Human-Computer Interfaces, Developments, and Applications; IGI Global: Hershey, PA, USA, 2016; pp. 245–272. [Google Scholar]
- Dadwal, S.S.; Hassan, A. The augmented reality marketing: A merger of marketing and technology in tourism. In Emerging Innovative Marketing Strategies in the Tourism Industry; IGI Global: Hershey, PA, USA, 2015; pp. 78–96. [Google Scholar]
- Tian, F.; Xu, F.; Fu, J. Augmented Reality Technology Overview for Tourism App Development. In Proceedings of the 2013 International Conference on Machine Learning and Cybernetics (ICMLC), Tianjin, China, 14–17 July 2013; IEEE Computer Society: Washington, DC, USA, 2013; pp. 1483–1489. [Google Scholar]
- Lin, P.J.; Kao, C.C.; Lam, K.H.; Tsai, I.C. Design and Implementation of a Tourism System Using Mobile Augmented Reality and GIS Technologies; Chen, C.Y., Yang, C.F., Juang, J., Eds.; Springer: Cham, Switzerland, 2014; Volume 293, pp. 1093–1099. [Google Scholar]
- Huang, Y.C.; Backman, K.F.; Backman, S.J.; Chang, L.L. Exploring the implications of virtual reality technology in tourism marketing: An integrated research framework. Int. J. Tour. Res. 2016, 18, 116–128. [Google Scholar] [CrossRef]
- Çeltek, E. Smart technologies: Augmented reality applications in tourism marketing. In Emerging Innovative Marketing Strategies in the Tourism Industry; IGI Global: Hershey, PA, USA, 2015; pp. 116–132. [Google Scholar]
- Gautam, B.P.; Asami, H.; Batajoo, A.; Fujisaki, T. Regional revival through iot enabled smart tourism process framework (STPF): A proposal. In Proceedings of the 2016 Joint 8th International Conference on Soft Computing and Intelligent Systems and 2016 17th International Symposium on Advanced Intelligent Systems, SCIS-ISIS 2016, Sapporo, Japan, 25–28 August 2016; pp. 743–748. [Google Scholar]
- Miah, S.J.; Vu, H.Q.; Gammack, J.; McGrath, M. A big data analytics method for tourist behaviour analysis. Inf. Manag. 2016. [Google Scholar] [CrossRef]
- Sakthivel, R.; Parthipan, V.; Dhanasekaran, D. Big data analytics on smart and connected communities using internet of things. Int. J. Pharm. Technol. 2016, 8, 19590–19601. [Google Scholar]
- Sun, Y.; Song, H.; Jara, A.J.; Bie, R. Internet of things and big data analytics for smart and connected communities. IEEE Access 2016, 4, 766–773. [Google Scholar] [CrossRef]
- Dlodlo, N.; Gcaba, O.; Smith, A. Internet of Things Technologies in Smart Cities; Institute of Electrical and Electronics Engineers Inc.: Piscataway, NJ, USA, 2016. [Google Scholar]
- Almobaideen, W.; Krayshan, R.; Allan, M.; Saadeh, M. Internet of things: Geographical routing based on healthcare centers vicinity for mobile smart tourism destination. Technol. Forecast. Soc. Chang. 2017, 123, 342–350. [Google Scholar] [CrossRef]
- Nitti, M.; Pilloni, V.; Giusto, D.; Popescu, V. IoT architecture for a sustainable tourism application in a smart city environment. Mob. Inf. Syst. 2017, 2017. [Google Scholar] [CrossRef]
- Koo, C.; Shin, S.; Kim, K.; Kim, C.; Chung, N. Smart tourism of the korea: A Case Study, 2013. In Proceedings of the Pacific Asia Conference on Information Systems, Jeju Island, Korea, 18–22 June 2013. [Google Scholar]
- Höjer, M.; Wangel, J. Smart sustainable cities: Definition and challenges. In ICT Innovations for Sustainability; Hilty, L.M., Aebischer, B., Eds.; Springer International Publishing: Cham, Switzerland, 2015; pp. 333–349. [Google Scholar]
- Buhalis, D.; Deimezi, O. E-tourism developments in greece: Information communication technologies adoption for the strategic management of the greek tourism industry. Tour. Hosp. Res. 2004, 5, 103–130. [Google Scholar] [CrossRef]
- Lu, J.; Mao, Z.; Wang, M.; Hu, L. Goodbye maps, hello apps? Exploring the influential determinants of travel app adoption. Curr. Issues Tour. 2015, 18, 1059–1079. [Google Scholar] [CrossRef]
- Bogicevic, V.; Bujisic, M.; Bilgihan, A.; Yang, W.; Cobanoglu, C. The impact of traveler-focused airport technology on traveler satisfaction. Technol. Forecast. Soc. Chang. 2017, 123, 351–361. [Google Scholar] [CrossRef]
- Dishaw, M.T.; Strong, D.M. Extending the technology acceptance model with task–technology fit constructs. Inf. Manag. 1999, 36, 9–21. [Google Scholar] [CrossRef]
- Goodhue, D.L.; Thompson, R.L. Task-technology fit and individual performance. MIS Q. 1995, 19, 213–236. [Google Scholar] [CrossRef]
- Gebauer, J.; Shaw, M.J. Success factors and impacts of mobile business applications: Results from a mobile e-procurement study. Int. J. Electron. Commer. 2004, 8, 19–41. [Google Scholar]
- Yu, T.-K.; Yu, T.-Y. Modelling the factors that affect individuals’ utilisation of online learning systems: An empirical study combining the task technology fit model with the theory of planned behaviour. Br. J. Educ. Technol. 2010, 41, 1003–1017. [Google Scholar] [CrossRef]
- Engel, J.F.; Blackwell, R.D.; Miniard, P.W. Consumer Behaviour, 6th ed.; Dryden Press: Hinsdale, IL, USA, 1990. [Google Scholar]
- Kim, M.J.; Chung, N.; Lee, C.K.; Preis, M.W. Motivations and use context in mobile tourism shopping: Applying contingency and task-technology fit theories. Int. J. Tour. Res. 2015, 17, 13–24. [Google Scholar] [CrossRef]
- Phillips, P.; Zigan, K.; Santos Silva, M.M.; Schegg, R. The interactive effects of online reviews on the determinants of swiss hotel performance: A neural network analysis. Tour. Manag. 2015, 50, 130–141. [Google Scholar] [CrossRef]
- Park, S.; Nicolau, J.L. Asymmetric effects of online consumer reviews. Ann. Tour. Res. 2015, 50, 67–83. [Google Scholar] [CrossRef]
- Filieri, R.; McLeay, F. E-wom and accommodation: An analysis of the factors that influence travelers’ adoption of information from online reviews. J. Travel Res. 2014, 53, 44–57. [Google Scholar] [CrossRef]
- Hu, Y.-H.; Chen, K.; Lee, P.-J. The effect of user-controllable filters on the prediction of online hotel reviews. Inf. Manag. 2016. [Google Scholar] [CrossRef]
- Li, H.; Ye, Q.; Law, R. Determinants of customer satisfaction in the hotel industry: An application of online review analysis. Asia Pac. J. Tour. Res. 2013, 18, 784–802. [Google Scholar] [CrossRef]
- Sigala, M. The application and impact of gamification funware on trip planning and experiences: The case of tripadvisor’s funware. Electron. Mark. 2015, 25, 189–209. [Google Scholar] [CrossRef]
- Raguseo, E.; Neirotti, P.; Paolucci, E. How small hotels can drive value their way in infomediation. The case of ‘italian hotels vs. Otas and tripadvisor’. Inf. Manag. 2016. [Google Scholar] [CrossRef]
- Leung, D.; Law, R.; Lee, H.A. The perceived destination image of hong kong on ctrip.Com. Int. J. Tour. Res. 2011, 13, 124–140. [Google Scholar] [CrossRef]
- Chung, N.; Koo, C. The use of social media in travel information search. Telemat. Inform. 2015, 32, 215–229. [Google Scholar] [CrossRef]
- Xiang, Z.; Gretzel, U. Role of social media in online travel information search. Tour. Manag. 2010, 31, 179–188. [Google Scholar] [CrossRef]
- Munar, A.M.; Jacobsen, J.K.S. Motivations for sharing tourism experiences through social media. Tour. Manag. 2014, 43, 46–54. [Google Scholar] [CrossRef]
- Holzer, A.; Ondrus, J. Mobile application market: A developer’s perspective. Telemat. Inform. 2011, 28, 22–31. [Google Scholar] [CrossRef]
- Charland, A.; Leroux, B. Mobile application development: Web vs. Native. Commun. ACM 2011, 54, 49–53. [Google Scholar] [CrossRef]
- Palumbo, F. Developing a new service for the digital traveler satisfaction: The smart tourist app. Int. J. Digit. Account. Res. 2015, 15, 33–67. [Google Scholar] [CrossRef]
- Jun, S.; Lee, S.-J. Emerging technology forecasting using new patent information analysis. Int. J. Softw. Eng. Appl. 2012, 6. [Google Scholar]
- Park, S.; Lee, S.J.; Jun, S. A network analysis model for selecting sustainable technology. Sustainability 2015, 7, 13126–13141. [Google Scholar] [CrossRef]
- Giachanou, A.; Salampasis, M.; Paltoglou, G. Multilayer source selection as a tool for supporting patent search and classification. Inf. Retr. J. 2015, 18, 559–585. [Google Scholar] [CrossRef]
- Kim, G.; Bae, J. A novel approach to forecast promising technology through patent analysis. Technol. Forecast. Soc. Chang. 2017, 117, 228–237. [Google Scholar] [CrossRef]
- Sternitzke, C.; Bartkowski, A.; Schramm, R. Visualizing patent statistics by means of social network analysis tools. World Pat. Inf. 2008, 30, 115–131. [Google Scholar] [CrossRef]
- Examining technological innovation of apple using patent analysis. Ind. Manag. Data Syst. 2013, 113, 890–907.
- Koochakzadeh, N.; Sarraf, A.; Kianmehr, K.; Rokne, J.; Alhajj, R. NetDriller: A powerful social network analysis tool. In Proceedings of the 2011 IEEE 11th International Conference on Data Mining Workshops, Vancouver, BC, Canada, 11 December 2011; pp. 1235–1238. [Google Scholar]
- Yoon, J.; Kim, K. Trendperceptor: A property–function based technology intelligence system for identifying technology trends from patents. Expert Syst. Appl. 2012, 39, 2927–2938. [Google Scholar] [CrossRef]
- Suroso, J.S. Strengthening of innovation network to improvethe regional competitiveness towards social transformation (case study in cimahi). Procedia Comput. Sci. 2015, 59, 382–391. [Google Scholar] [CrossRef]
- Iacobucci, D.; Henderson, G.; Marcati, A.; Chang, J. Network analyses of brand switching behavior. Int. J. Res. Mark. 1996, 13, 415–429. [Google Scholar] [CrossRef]
- Grebitus, C.; Bruhn, M. Analyzing semantic networks of pork quality by means of concept mapping. Food Qual. Preference 2008, 19, 86–96. [Google Scholar] [CrossRef]
- Theodoridis, S.; Koutroumbas, K. Pattern Recognition, 4th ed.; Academic: London, UK, 2008. [Google Scholar]
- Wakita, K.; Tsurumi, T. Finding community structure in mega-scale social networks: [Extended abstract]. In Proceedings of the 16th International Conference on World Wide Web, Banff, AB, Canada, 8–12 May 2007; ACM: Banff, AB, Canada, 2007; pp. 1275–1276. [Google Scholar]
- Hu, F.; Liu, Y. A new algorithm cnm-centrality of detecting communities based on node centrality. Phys. A Stat. Mech. Appl. 2016, 446, 138–151. [Google Scholar] [CrossRef]
- Newman, M.E.J. Modularity and community structure in networks. Proc. Natl. Acad. Sci. USA 2006, 103, 8577–8582. [Google Scholar] [CrossRef] [PubMed]
- Fisk, K.; Fitzgerald, R.; Cokley, J. Controversial new sciences in the media: Content analysis of global reporting of nanotechnology during the last decade. Media Int. Aust. 2014, 156–166. [Google Scholar] [CrossRef]
- Cretchley, J.; Gallois, C.; Chenery, H.; Smith, A. Conversations between carers and people with schizophrenia: A qualitative analysis using leximancer. Qual. Health Res. 2010, 20, 1611–1628. [Google Scholar] [CrossRef] [PubMed]
- Rajman, M.; Besançon, R. Text mining: Natural language techniques and text mining applications. In Data Mining and Reverse Engineering: Searching for Semantics, Proceedings of the IFIP TC2 WG2.6 IFIP Seventh Conference on Database Semantics (DS-7), Leysin, Switzerland, 7–10 October 1997; Spaccapietra, S., Maryanski, F., Eds.; Springer: Boston, MA, USA, 1998; pp. 50–64. [Google Scholar]
- Yu, C.H.; Jannasch-Pennell, A.; DiGangi, S. Compatibility between text mining and qualitative research in the perspectives of grounded theory, content analysis, and reliability. Qual. Rep. 2011, 16, 730. [Google Scholar]
- Biraghi, S.; Gambetti, R.C. Corporate branding: Where are we? A systematic communication-based inquiry. J. Mark. Commun. 2015, 21, 260–283. [Google Scholar] [CrossRef]
- Lancia, F. T-Lab Plus—User’s Manual, Tools for Text Analysis; T-LAB di Lancia Franco: Roccasecca, Italy, 2016. [Google Scholar]
- Barello, S.; Leone, D.; Danese, S.; Vegni, E. Inflammatory bowel diseases and psychological issues: A new approach for a systematic analysis of the academic debate. Psychol. Health Med. 2014, 19, 559–571. [Google Scholar] [CrossRef] [PubMed]
- Gilardi, S.; Lozza, E. Inquiry-based learning and undergraduates’ professional identity development: Assessment of a field research-based course. Innov. High. Educ. 2009, 34, 245–256. [Google Scholar] [CrossRef]
- Salton, G.; Buckley, C. Term-weighting approaches in automatic text retrieval. Inf. Process. Manag. 1988, 24, 513–523. [Google Scholar] [CrossRef]
- Kim, G.; Lee, J.; Jang, D.; Park, S. Technology clusters exploration for patent portfolio through patent abstract analysis. Sustainability 2016, 8, 1252. [Google Scholar] [CrossRef]
- Yu, X.; Li, M.; Kim, K.; Chung, J.; Ryu, K. Emerging pattern-based clustering of web users utilizing a simple page-linked graph. Sustainability 2016, 8, 239. [Google Scholar] [CrossRef]
- Punj, G.; Stewart, D.W. Cluster analysis in marketing research: Review and suggestions for application. J. Mark. Res. 1983, 20, 134–148. [Google Scholar] [CrossRef]
- Kostoff, R.N.; Del Río, J.A.; Cortés, H.D.; Smith, C.; Smith, A.; Wagner, C.; Leydesdorff, L.; Karypis, G.; Malpohl, G.; Tshiteya, R. Clustering methodologies for identifying country core competencies. J. Inf. Sci. 2007, 33, 21–40. [Google Scholar] [CrossRef]
- Wang, X.D.; Liu, J.J.; Sheng, F.S. Analysis of hotspots in the field of domestic knowledge discovery based on co-word analysis method. Cybern. Inf. Technol. 2014, 14, 145–158. [Google Scholar] [CrossRef]
- Aggarwal, C.C.; Zhai, C. A survey of text clustering algorithms. In Mining Text Data; Aggarwal, C.C., Zhai, C., Eds.; Springer: Boston, MA, USA, 2012; pp. 77–128. [Google Scholar]
- Accordini, M.; Saita, E.; Irtelli, F.; Buratti, M.; Savuto, G. Stories of change: The text analysis of handovers in an italian psychiatric residential care home. J. Psychiatr. Ment. Health Nurs. 2017, 24, 232–242. [Google Scholar] [CrossRef] [PubMed]
- Savaresi, S.M.; Boley, D.L. On the performance of bisecting k-means and PDDP. In Proceedings of the 2001 SIAM International Conference on Data Mining, Chicago, IL, USA, 5–7 April 2001; pp. 1–14. [Google Scholar]
- Chung, N.; Lee, H.; Lee, S.J.; Koo, C. The influence of tourism website on tourists’ behavior to determine destination selection: A case study of creative economy in korea. Technol. Forecast. Soc. Chang. 2015, 96, 130–143. [Google Scholar] [CrossRef]
- Leximancer Pty Ltd. Leximancer User Guide Release 4.5; Leximancer Pty Ltd.: Brisbane, Australia, 2016; pp. 1–136. [Google Scholar]
- Yang, Z.; Fang, X. Online service quality dimensions and their relationships with satisfaction: A content analysis of customer reviews of securities brokerage services. Int. J. Serv. Ind. Manag. 2004, 15, 302–326. [Google Scholar] [CrossRef]
- Kang, D.; Park, Y. Review-based measurement of customer satisfaction in mobile service: Sentiment analysis and vikor approach. Expert Syst. Appl. 2014, 41, 1041–1050. [Google Scholar] [CrossRef]
- Magnini, V.P.; Crotts, J.C.; Zehrer, A. Understanding customer delight. J. Travel Res. 2011, 50, 535–545. [Google Scholar] [CrossRef]
- Zhou, L.; Ye, S.; Pearce, P.L.; Wu, M.-Y. Refreshing hotel satisfaction studies by reconfiguring customer review data. Int. J. Hosp. Manag. 2014, 38, 1–10. [Google Scholar] [CrossRef]
- Carroll, R.P.H.A.C.E. Diction 7.1 Help Manual: The Text Analysis Program; Digitext, Inc.: Austin, TX, USA, 2015. [Google Scholar]
- Tama-Sweet, I. Changes in earnings announcement tone and insider sales. Adv. Account. 2014, 30, 276–282. [Google Scholar] [CrossRef]
- Allison, T.H.; Davis, B.C.; Short, J.C.; Webb, J.W. Crowdfunding in a prosocial microlending environment: Examining the role of intrinsic versus extrinsic cues. Entrepreneurship Theory Pract. 2015, 39, 53–73. [Google Scholar] [CrossRef]
- Arena, C.; Bozzolan, S.; Michelon, G. Environmental reporting: Transparency to stakeholders or stakeholder manipulation? An analysis of disclosure tone and the role of the board of directors. Corp. Soc. Responsib. Environ. Manag. 2015, 22, 346–361. [Google Scholar] [CrossRef]
- Trinh, T.T.; Ryan, C. Heritage and cultural tourism: The role of the aesthetic when visiting mỹ sơn and cham museum, vietnam. Curr. Issues Tour. 2016, 19, 564–589. [Google Scholar] [CrossRef]
- McKercher, B.; Ho, P.S.Y.; du Cros, H. Relationship between tourism and cultural heritage management: Evidence from hong kong. Tour. Manag. 2005, 26, 539–548. [Google Scholar] [CrossRef]
- Du Cros, H. A new model to assist in planning for sustainable cultural heritage tourism. Int. J. Tour. Res. 2001, 3, 165–170. [Google Scholar] [CrossRef]
- No, E.; Kim, J.K. Comparing the attributes of online tourism information sources. Comput. Hum. Behav. 2015, 50, 564–575. [Google Scholar] [CrossRef]
- Benner, M.J.; Tushman, M.L. Exploitation, exploration, and process management: The productivity dilemma revisited. Acad. Manag. Rev. 2003, 28, 238–256. [Google Scholar]
- Eisenberg, I. Lead-user research for breakthrough innovation. Res. Technol. Manag. 2011, 54, 50–58. [Google Scholar] [CrossRef]
- Van Kleef, E.; van Trijp, H.C.M.; Luning, P. Consumer research in the early stages of new product development: A critical review of methods and techniques. Food Qual. Preference 2005, 16, 181–201. [Google Scholar] [CrossRef]
- Srivastava, M.K.; Gnyawali, D.R. When do relational resources matter? Leveraging portfolio technological resources for breakthrough innovation. Acad. Manag. J. 2011, 54, 797–810. [Google Scholar] [CrossRef]
- Lieberman, M.B.; Montgomery, D.B. First-mover advantages. Strateg. Manag. J. 1988, 9, 41–58. [Google Scholar] [CrossRef]
- Kerin, R.A.; Varadarajan, P.R.; Peterson, R.A. First-mover advantage: A synthesis, conceptual framework, and research propositions. J. Mark. 1992, 56, 33–52. [Google Scholar] [CrossRef]
- Suárez, F.F.; Utterback, J.M. Dominant designs and the survival of firms. Strateg. Manag. J. 1995, 16, 415–430. [Google Scholar] [CrossRef]
- Tegarden, L.F.; Hatfield, D.E.; Echols, A.E. Doomed from the start: What is the value of selecting a future dominant design? Strateg. Manag. J. 1999, 20, 495–518. [Google Scholar] [CrossRef]
- Suarez, F.F.; Lanzolla, G. The role of environmental dynamics in building a first mover advantage theory. Acad. Manag. Rev. 2007, 32, 377–392. [Google Scholar] [CrossRef]
- Boschert, S.; Rosen, R. Digital twin-the simulation aspect. In Mechatronic Futures: Challenges and Solutions for Mechatronic Systems and Their Designers; Springer International Publishing: Cham, Switzerland, 2016; pp. 59–74. [Google Scholar]
- Gartner. Gartner’s Top 10 Strategic Technology Trends for 2017. Available online: Http://www.Gartner.Com/smarterwithgartner/gartners-top-10-technology-trends-2017 (accessed on 25 June 2017).
- Waurzyniak, P. Plm’s digital twins offer virtual view of manufacturing. Manuf. Eng. 2017, 158, 67–73. [Google Scholar]
- Schleich, B.; Anwer, N.; Mathieu, L.; Wartzack, S. Shaping the digital twin for design and production engineering. CIRP Ann. Manuf. Technol. 2017, 66, 141–144. [Google Scholar] [CrossRef]
- Kraft, E.M. The US Air Force Digital Thread/Digital Twin—Life Cycle Integration and Use of Computational and Experimental Knowledge, 2016; American Institute of Aeronautics and Astronautics Inc. (AIAA): Reston, VA, USA, 2016. [Google Scholar]
- Glaessgen, E.H.; Stargel, D.S. The digital twin paradigm for future nasa and U.S. Air force vehicles. In Proceedings of the 53rd AIAA/ASME/ASCE/AHS/ASC Structures, Structural Dynamics and Materials Conference—Special Session on the Digital Twin, Honolulu, HI, USA, 23–26 April 2012. [Google Scholar]
- DebRoy, T.; Zhang, W.; Turner, J.; Babu, S.S. Building digital twins of 3d printing machines. Scr. Mater. 2017, 135, 119–124. [Google Scholar] [CrossRef]
- Lazer, D.; Pentland, A.; Adamic, L.; Aral, S.; Barabasi, A.L.; Brewer, D.; Christakis, N.; Contractor, N.; Fowler, J.; Gutmann, M.; et al. Life in the network: The coming age of computational social science. Science 2009, 323, 721–723. [Google Scholar] [CrossRef] [PubMed]
© 2017 by the authors. Licensee MDPI, Basel, Switzerland. This article is an open access article distributed under the terms and conditions of the Creative Commons Attribution (CC BY) license (http://creativecommons.org/licenses/by/4.0/).