1. Introduction
Non-revenue water (NRW) includes water lost from physical incidents such as pipe leaks caused by bursts in a water distribution system and water-related commercial losses stemming from illegal connections, unmetered public use and meter error [
1]. NRW ratio is 5–50% for major countries. Singapore, Denmark and Netherlands have the lowest NRW ratio (5–6%), while Chile (34%) and Mexico (51%) have the highest NRW ratio [
2]. According to data from Korea waterworks 2015 [
3], the NRW ratio of major cities in Korea is the lowest in Seoul at 4.9% and the highest in Gwangju at 56.8%. Incheon has an NRW ratio of 11.2%, lower than the national average of 16.3%percent.
Incheon takes its tap water from Paldang Dam via a single pipeline, thus making it vulnerable to pipe breakage due to accident or disaster [
4,
5]. This makes consumers likely to suffer damage due to suspension of water supply. To prevent this, the management of hydraulic pressure in the pipe network and regular evaluation of pipe deterioration are recommended measures. A decrease in the NRW ratio correlates to the reduction of leak quantity by optimal operation management in a district metered areas (DMA).
Analysis of the effects of pipe damage on the overall water distribution system helps determine what to improve first in the water pipeline [
5]. A systematic plan for replacement and remediation is in effect for the maintenance of the city waterworks [
6,
7,
8]. Though improvement projects for old waterworks are being implemented, it is difficult to reduce the system’s economic losses and improve its function via the evaluation of old pipes and accident prevention, which depend on empirical judgment [
9,
10].
Therefore, research and analysis of the factors affecting leaks when deciding the priority of water distribution system maintenance are needed, as well as identifying the physical and operational factors affecting leaks with parameters such as hydraulic pressure, deteriorated pipe ratio and water supply quantity. To decrease the NRW ratio, studies such as those on pipe network analysis, reliability enhancement, diagnosis of pipe network technology and evaluation of pipe deterioration for optimal water distribution were conducted in previous research.
Determining the level of leaks and bursts in the overall volume of NRW, a performance indicator was found for comparing leak management in water supply system: The Infrastructure Leakage Index (ILI) [
11,
12,
13].
In addition, studies have been carried out on the parameters of a water distribution system. A regression equation for predicting the NRW ratio was developed using statistical analysis by acquiring main parameter and statistical data on the analysis of water distribution system [
14]. And water supply and the operating and maintenance cost of a water distribution system was suggested [
15]. The system for performance indicators revised for small water supply utilities. Principal component analysis (PCA) was used to reduce the dimensionality of the original data [
16,
17].
These statistical techniques and performance indicators were helpful in forecasting NRW, and a number of parameters of water distribution systems were proposed and analyzed. This suggested numerous approaches to improve the accuracy of NRW ratio prediction, as well as a scientific approach toward the sustainable management of water distribution systems.
A well-established DMA in water distribution systems can be analyzed through physical and operational parameters [
18]. To estimate the NRW ratio, including the amount of water leaks, the main parameters of water distribution systems appropriate for regional characteristics are selected, and the NRW calculation model, which was developed by statistical analysis, plays an important role in the planning and operating of DMA.
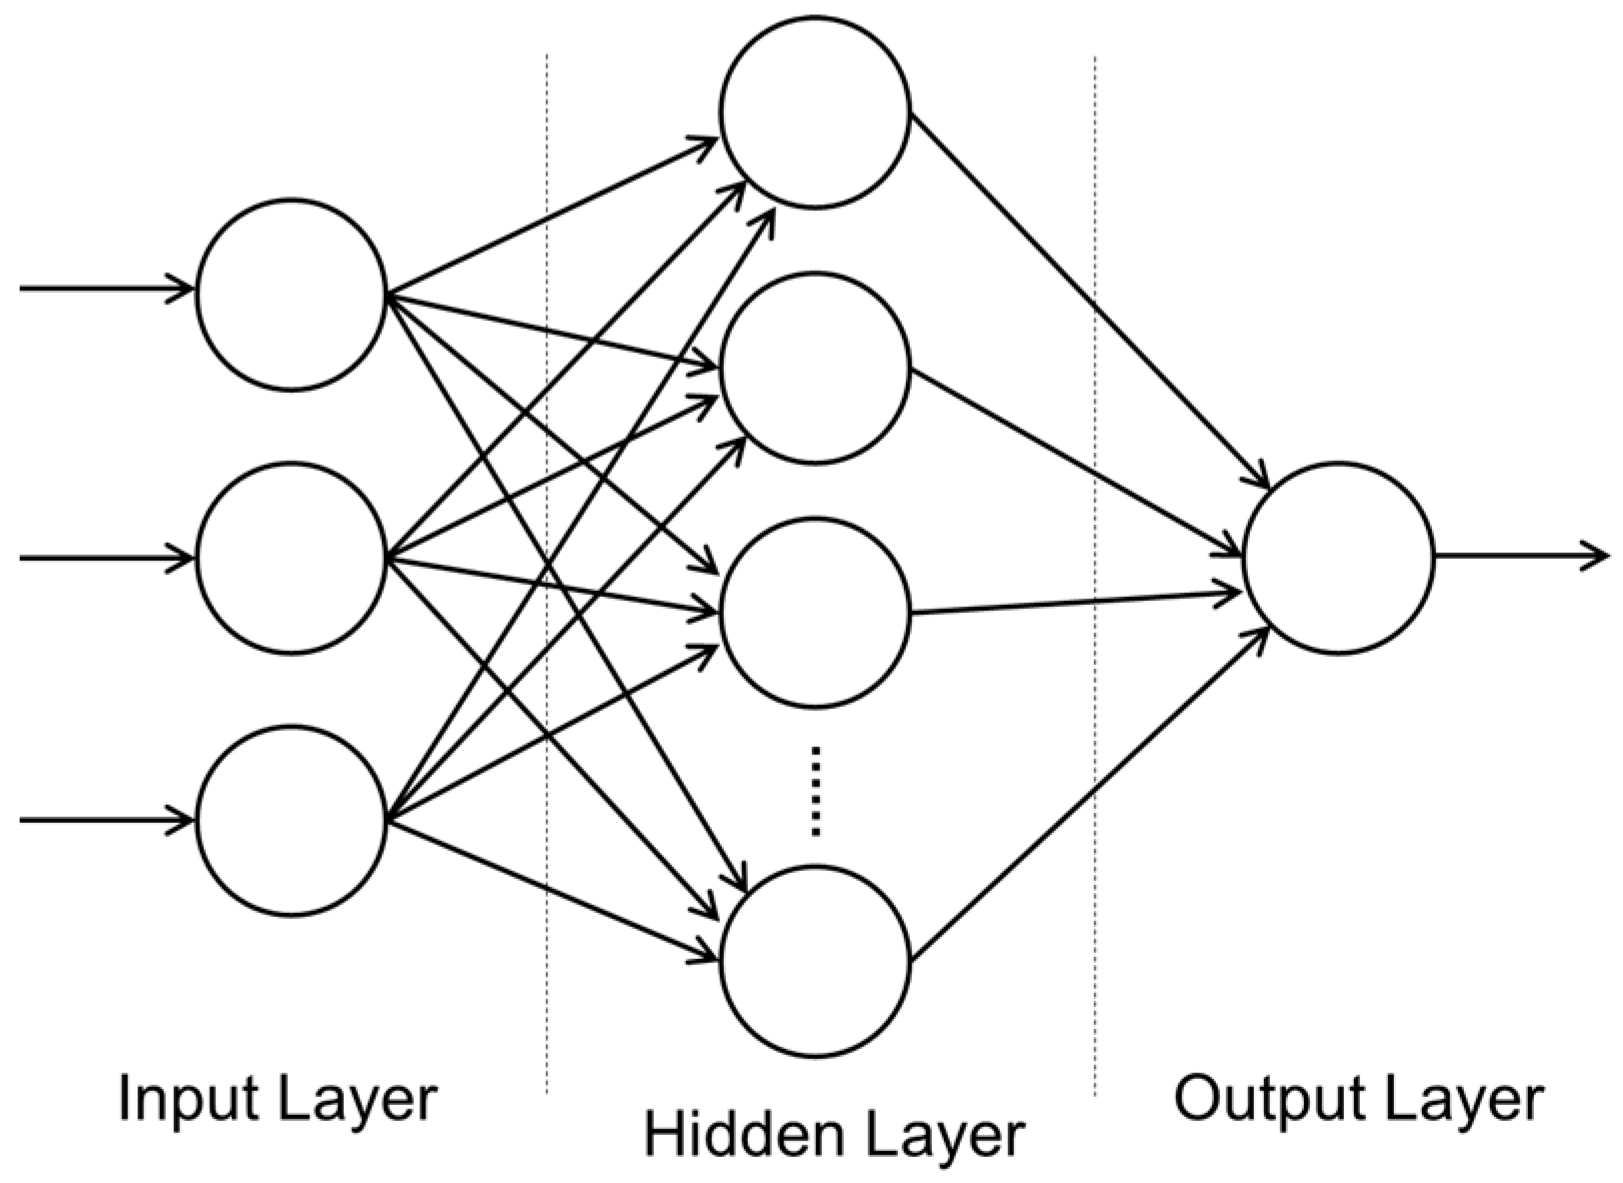
An artificial neural network (ANN) is a model used for predicting dependent variables through statistical learning algorithms when sufficient data on independent variables are available to describe dependent variables. Due to the lack of sufficient learning data, however, the ANN model has not been widely used in the estimation of the NRW ratio.
Major ANN studies applied to water distribution systems in recent years are as follows. A procedure to devise a general operating policy toward reservoir operation from a dynamic programming using neural network (DPN) was suggested [
19]. Relatively new technique of using ANNs researched for forecasting short-term water demand [
20]. ANNs in water quality modeling, as well as for the process and control of treating drinking water used in water distribution systems [
21]. Research on the application of ANNs for analysis of data from sensors measuring hydraulic parameters are presented [
22]. Additionally, the efficiency of computational intelligence techniques was compared in water demand forecasting [
23].
Recent research about ANN used it as a means of estimating the temporal variation of analytic factors such as real-time water quality, operation of reservoir and short-term demand forecasting. The application of an ANN to water distribution systems for estimating NRW and parameter analysis, however, proved insufficient.
In this study, a model for NRW ratio calculation for Incheon was developed by considering an ANN and parameters of major water distribution systems. The statistical method was used to compare the results of the ANN and real measured values according to the removal of outliers through the use of Z-score standardization.
The results of the NRW ratio by multiple regression analysis and an ANN were compared through accuracy assessment analysis. To estimate the NRW ratio, parameters including deteriorated pipe ratio, water supply quantity per demand junction and demand energy ratio were selected in the previous research [
24]. Demand energy was calculated using simulated nodal hydraulic pressure and demand using EPANET 2.0 (Environmental Protection Agency, Cincinnati, OH, USA, 2000), a hydraulic numerical analysis model for water distribution systems.
4. Statistical Analysis of Main Parameters in Water Distribution Systems
4.1. Selection and Characteristics of Main Parameters
Analysis of the technical diagnosis results of Incheon’s water pipe network established in 2015 showed that water pipe deterioration in the DMA system greatly influences NRW [
29]. The deteriorated pipe ratio, pipe length, mean pipe diameter, number of demand junctions, water supply quantity, number of leaks and demand energy ratio of DMAs were selected as parameters that could affect the NRW ratio.
To derive the parameters with high correlation with the NRW ratio, three parameters were selected: the deteriorated pipe ratio, demand energy ratio and water supply quantity per junction through multiple regression analysis. From the previous research, the main parameters selected according to the statistically significant order of multiple regression analysis [
24]; this is described in detail in
Section 4.3.
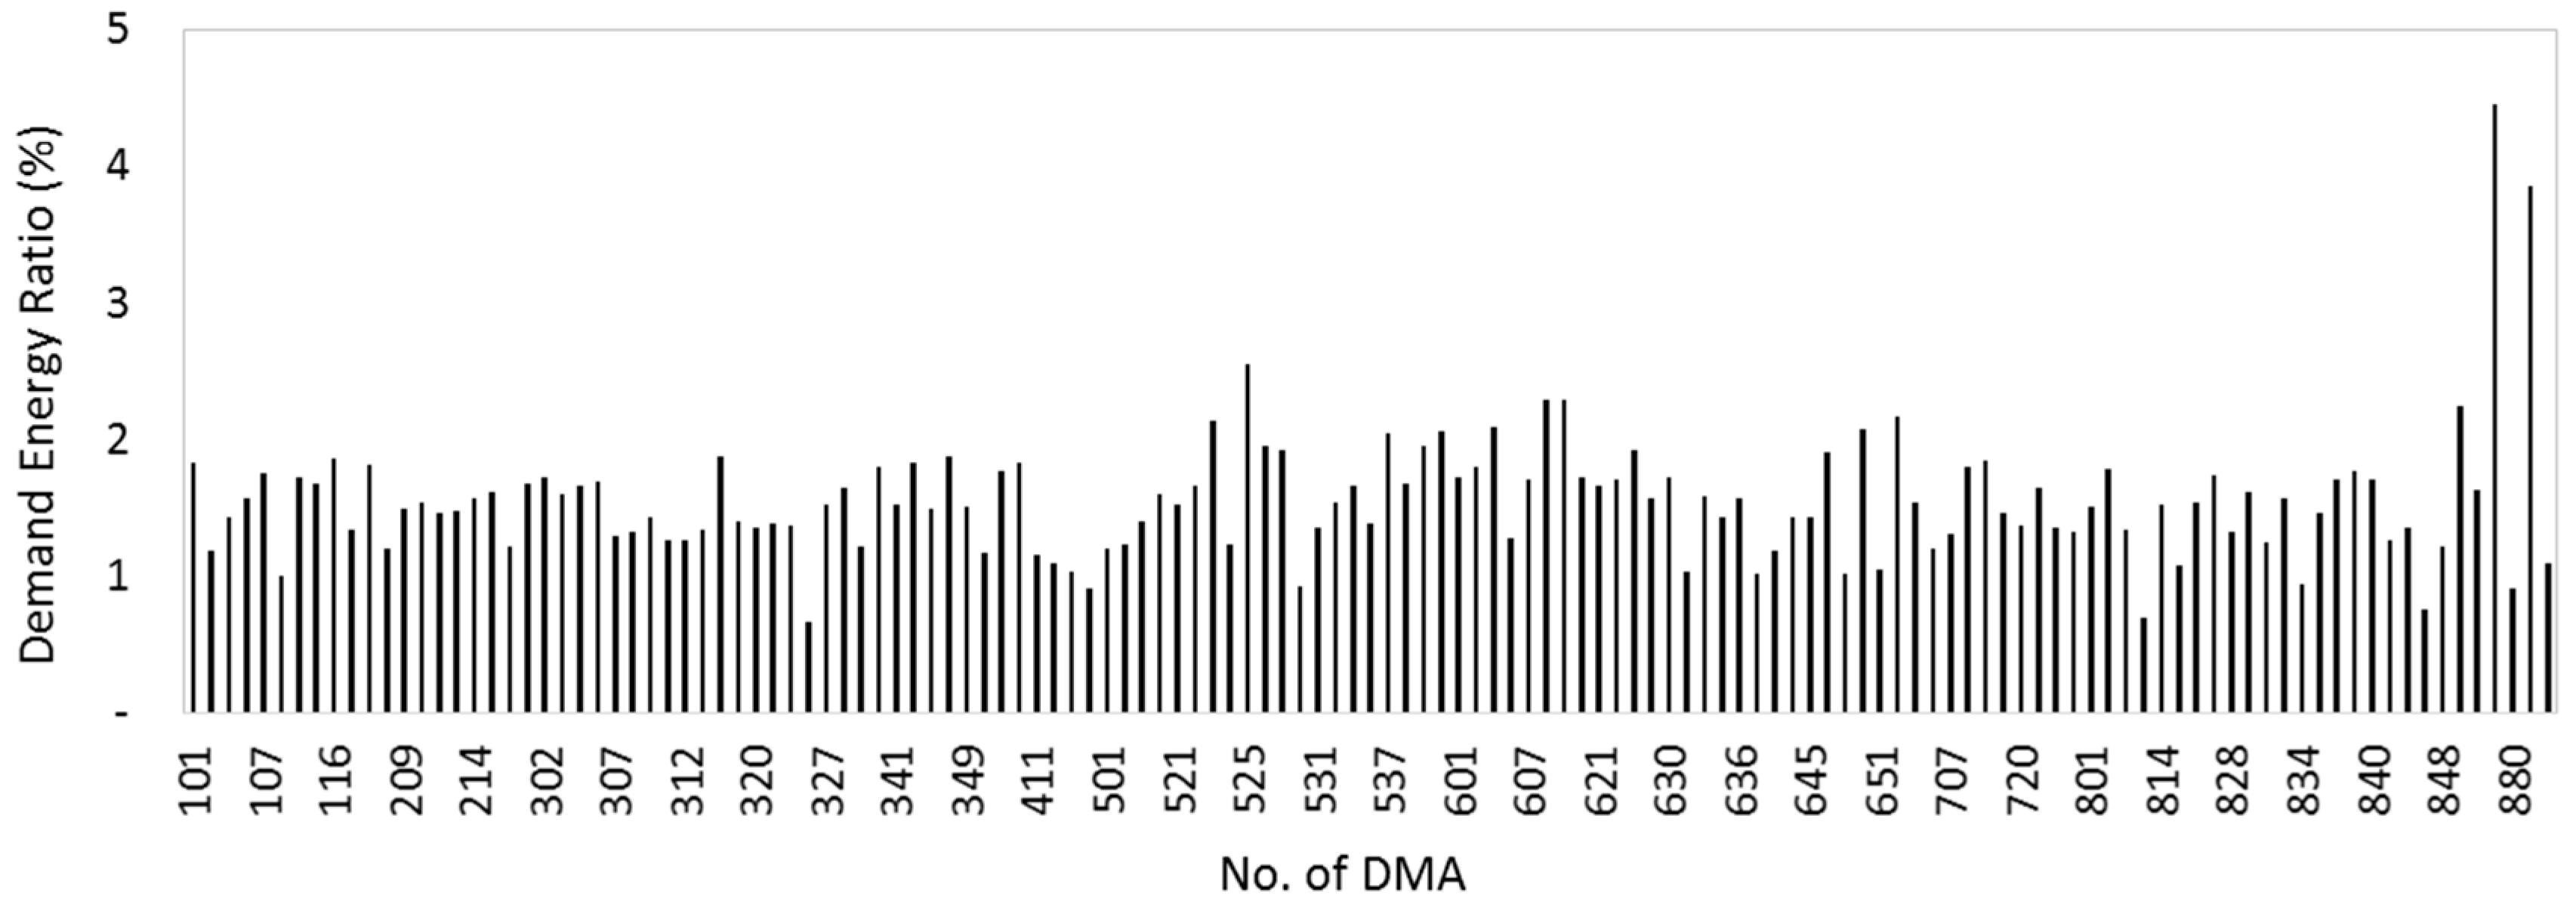
The demand energy ratio is calculated by dividing the actual supply energy by the minimum required energy in the water supply network. The deteriorated pipe ratio is a parameter determined by pipe installation by year and pipe material. The number of leaks tends to increase as the degree of aging rises, and the water supply quantity per demand junction increases in apartments and densely populated districts.
4.2. Correlation Analysis of Each Parameter
To analyze the correlations between the parameters of water distribution systems, the physical and operational data of selected parameters in each DMA were used based on a diagnosis of Incheon’s water network technology done in 2015. Data on 135 DMAs in Incheon were collected.
Table 2 shows the correlation analysis results for each parameter. The deteriorated pipe ratio and the number of leaks had a high correlation with the NRW ratio [
24]. A positive correlation tendency was seen with the NRW ratio in the number of demand junctions and demand energy ratio, but the Pearson correlation coefficient of under 0.5 shows a low relationship with the measured NRW ratio. And the same coefficient between the water supply quantity and pipe length was 0.71, showing the highest correlation among the 10 used parameters.
As a result of the correlation analysis, the Pearson correlation coefficient was less than 0.5, except for the deteriorated pipe ratio, and the correlation between the NRW ratio and used parameters were found to be not high. The negative correlation coefficient was represented by figures such as the mean pipe diameter, mean pipe length per demand junction, water supply quantity per demand junction and water supply quantity.
Table 3 is results of basic statistical analysis of used parameters of Incheon, 135 DMAs were selected and data collection was done.
4.3. Selection of Main Parameters for Estimation of NRW Ratio
To analyze the correlation between the NRW ratio and the main parameters of water distribution systems, 135 DMAs were used excluding those unfinished, non-operating or abnormally operating among 367 DMAs of Incheon underwent multiple regression analysis. For this analysis, the number of demand junctions, pipe length, mean pipe diameter, water supply quantity per demand junction, number of leaks, deteriorated pipe ratio, demand energy ratio, pipe length per demand junction and water supply quantity were selected as independent variables in the multiple regression model, and the NRW ratio was selected as the dependent variable.
As a result of the multiple regression analysis using the stepwise selection method, the deteriorated pipe ratio (%), water supply quantity per demand junction (m
3/day/junction) and demand energy ratio (%) were selected under the condition that satisfied statistical significance (T-statistics and probability value are statistically satisfied). A multiple regression equation with three independent variables was thus derived for estimation of the NRW ratio.
Table 4 shows the statistical results of all parameters used to estimate the NRW ratio using multiple regression analysis.
In statistical hypothesis testing, the probability value (
p-value) is the probability for a given statistical model that, when the null hypothesis is true, the statistical summary (such as the sample mean difference between two compared groups) is the same as or of higher than the measured results. If the
p-value is higher than 0.05 and the T-statistic is lower than 1.196, this means it is not statistically significant [
30].
Table 5 shows the results of multiple regression analysis with the NRW ratio as a dependent variable. This is considered reliable because the T-statistic of independent supply variables is more than ±1.96 and the
p-value is less than 0.05 [
24].
From the multiple regression analysis of
Table 5, the regression equation of the NRW ratio can be defined as Equation (5). As the parameter affecting the NRW ratio, the deteriorated pipe ratio was 0.663, the demand energy ratio was 4.310, and the amount of water supply per demand junction 0.069. The value of each parameter is calculated according to Equation (5). In addition to these three parameters, the NRW ratio is fixed at 4.684 percent as the constant, and the ratios of deteriorated pipe and demand energy are increasing parameters. The water supply quantity per demand junction is a decreasing parameter in the estimation of the NRW ratio.
where,
is the NRW ratio (%),
is the deteriorated pipe ratio (%),
is the demand energy ratio (%), and
is the amount of water supply per demand junction (m
3/day/junction)
As the demand energy ratio of DMAs in Incheon is calculated between 1 and 2 except for those on high elevation ground, it shows that the NRW ratio can be raised within 10% according to the energy ratio. In an area with high water supply such as apartment and dense population areas, the NRW ratio will decrease.
5. Estimation of NRW Ratio Using ANN
5.1. Model Construction of ANN
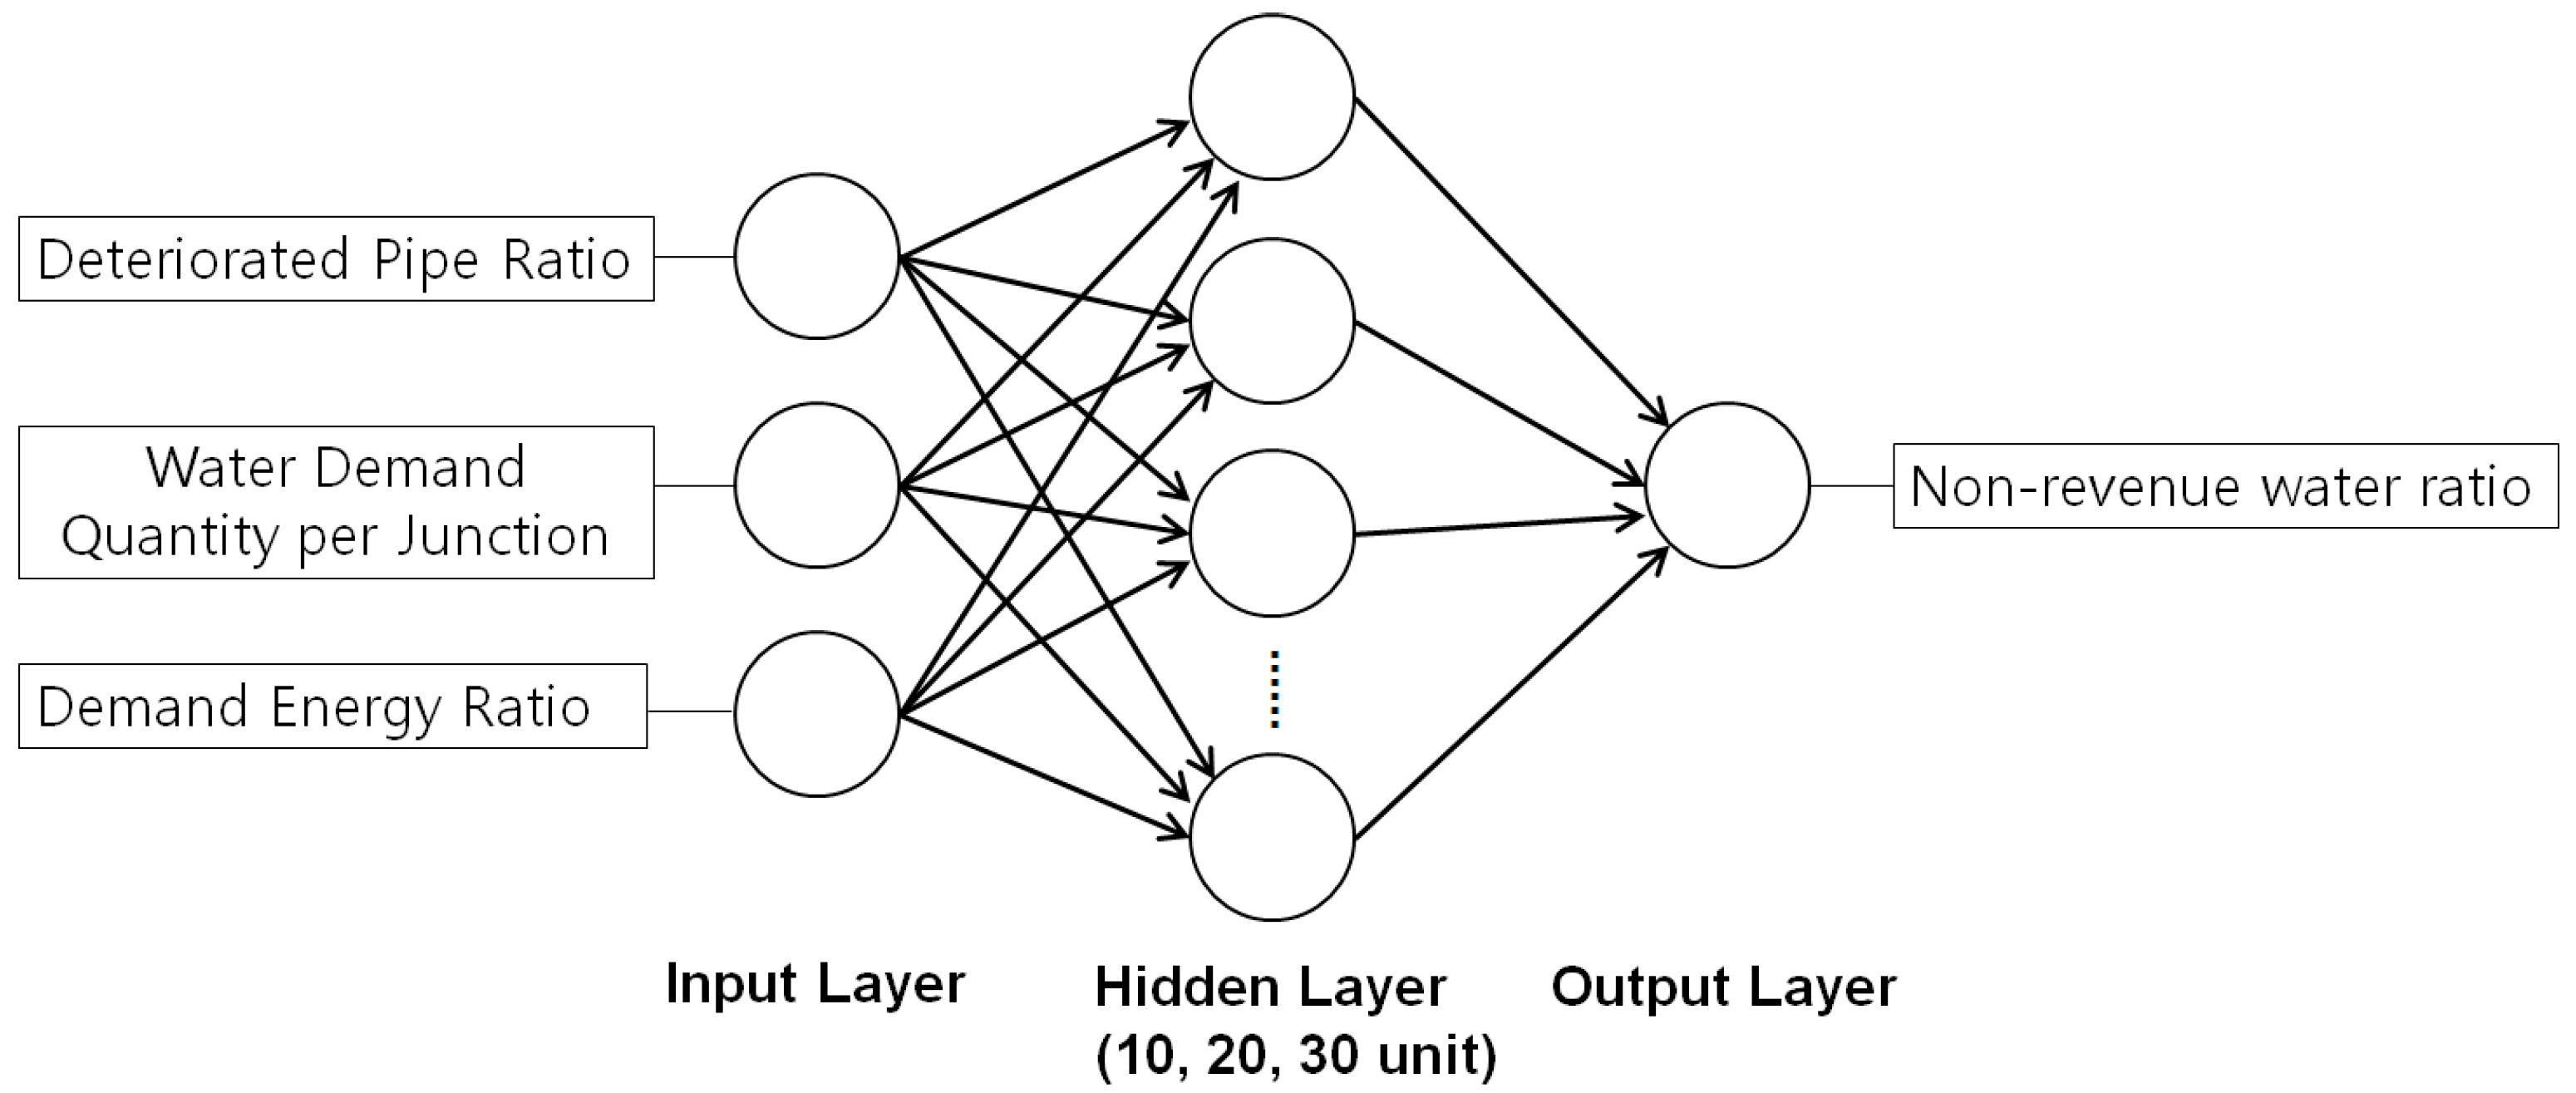
To estimate the NRW ratio using an artificial neural network (ANN), the results of multiple regression analysis were used to determine independent variables with the three parameters of the ratios of deteriorated pipe and demand energy and the water supply quantity per demand junction. The objective function was used to calculate the NRW ratio (%) via ANN.
Figure 4 represents the constructed ANN model used in this study.
If many parameters are used, the problem of over-fitting could occur in ANN simulation, so the modeling case is made with a minimum number of parameters. An ANN simulation was performed by using 10, 20 and 30 neurons in the hidden layer.
5.2. Estimation of NRW Ratio via ANN
The ANN model was built using a single layer of an ANN structure and a back propagation algorithm. In the learning method of back propagation, an input signal to an input layer is transferred to hidden and output layers through the transfer function between layers. By comparing the transmitted signal with the desired one, the error between the target and learning values is determined in the final output layer. The error is again transmitted in the reverse direction and then the weight of each layer is updated.
This study implemented an ANN using the MATLAB program. A neural network toolbox was used in MATLAB and the Levenberg-Marquardt method of back propagation was used for training. This network training function updated weight and bias values according to the Levenberg-Marquardt optimization.
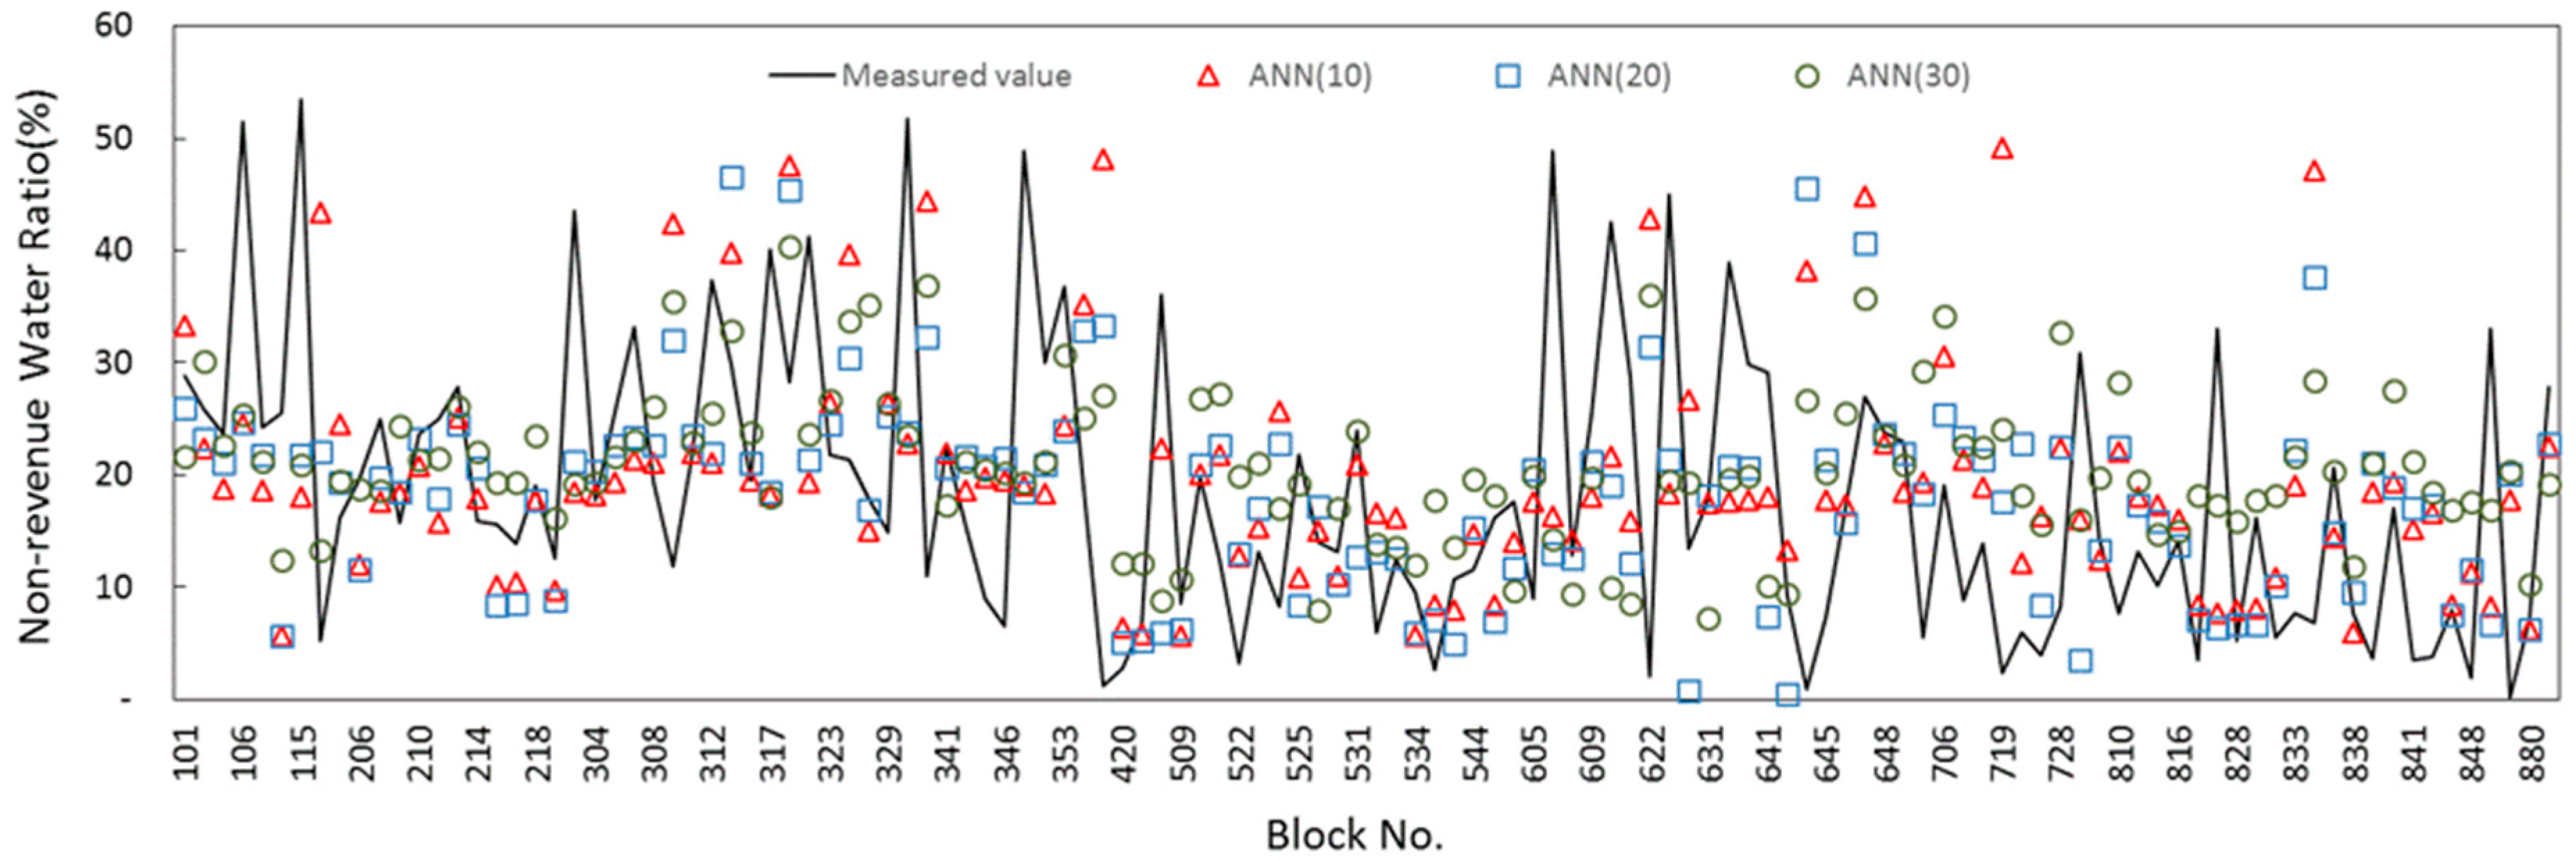
Figure 5 is the NRW ratio derived from ANN. The grey solid line shows the result of NRW by measurement, and the estimated NRW ratio of each DMA is shown when the number of neurons in the hidden layer is set to 10, 20 and 30, respectively. The measured NRW ratio was 0.5–58.9 percent, while the NRW ratio by ANN was estimated to be within 0.5–49.1 percent. The mean error rate was 18.4 percent for the measured NRW ratio and 19.3, 18.0 and 20.4 percent for the 10, 20 and 30 hidden layers, respectively. And the multiple regression equation showed the closest value of 18.5 percent.
5.3. Estimation of NRW Ratio Using ANN with Outlier Removal Case
The Z-score method can be used to distinguish the difference and distribution of the data used when conducting the result analysis. The Z-score is a dimensionless quantity obtained by subtracting the population mean from an individual raw score and then dividing the difference by the population standard deviation [
31]. This conversion process is called standardizing or normalizing. The mean and standard deviation are used to determine how far the data deviate from the average when the standard deviation is taken as a unit, and the method of Z-score is shown in Equation (6).
where
μ is mean of the population and
σ is the standard deviation.
The outlier can be estimated through the Z-score method. The mean of the standardized Z-scores calculated is 0, and the standard deviation is 1. As a result, values above ±3 are considered far away from the mean. In this study, the analysis was performed after excluding the DMA data for the parameter with the absolute value of the standardized Z-score of 3 or more among the main parameters of water distribution systems.
Finally, 122 sets of DMA data satisfying the Z-score among 135 sets of data were selected and used in the ANN analysis.
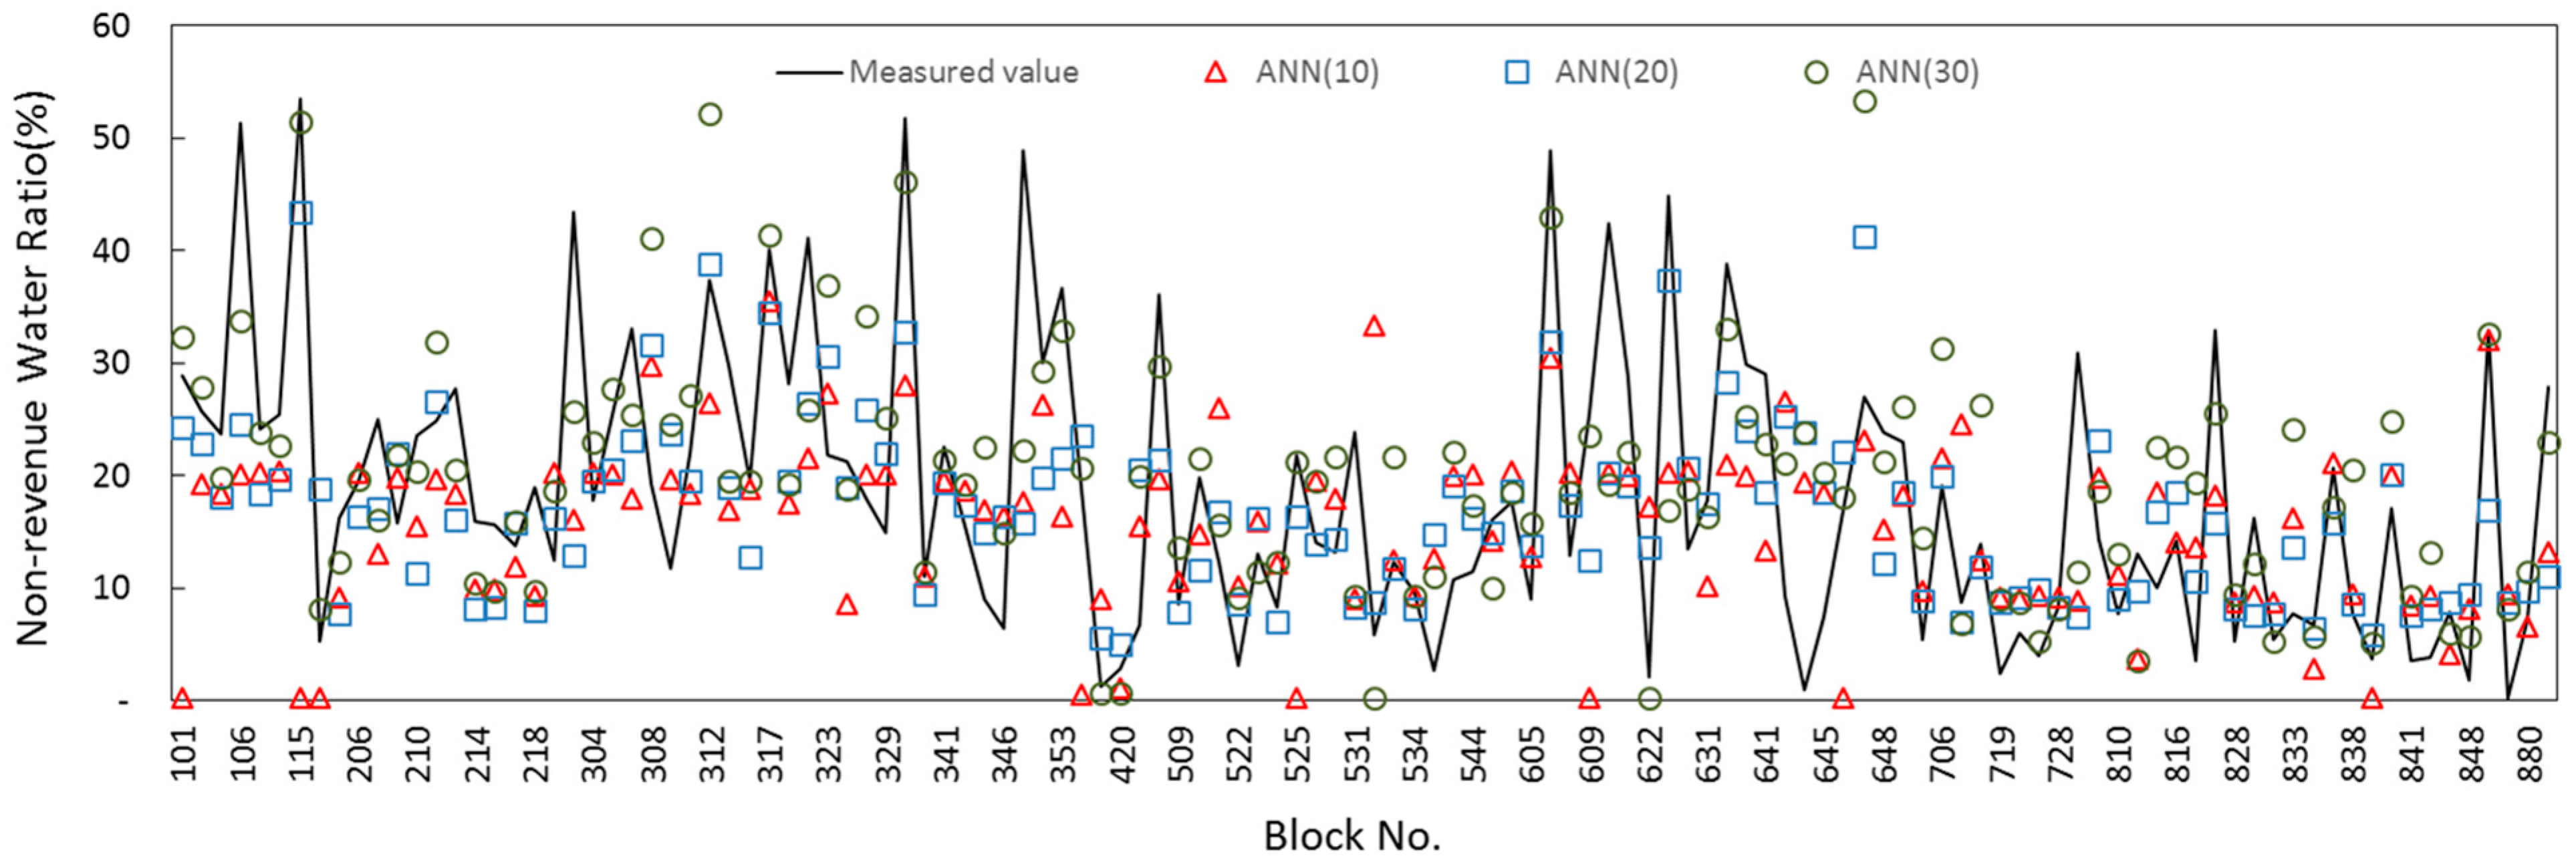
Figure 6 show the results of the NRW ratio derived from the ANN estimated after excluding the abnormal value by the Z-score.
ANN (10) shows a tendency toward underestimation than the measured NRW ratio, and part of the results largely deviate from measured values. Under the condition in which the outlier was removed, the higher the number of neurons, the higher the accuracy with the measured value.
5.4. Analysis of Estimation Results of NRW Ratio via ANN
To evaluate the accuracy of the multiple regression equations as proposed in the multiple regression analysis and the results of the ANN model developed in this study, an error ratio analysis was performed to evaluate the difference between the measured and model values. Accuracy analysis can be estimated by comparing the measured value with the value generated by the ANN model.
For this purpose, the mean absolute error (MAE), mean square error (MSE), PBIAS (percent of BIAS) which evaluates the bias of the estimation result, and the
G-value which is represent the goodness of fit were used as prediction methods. The calculation method of each equation is shown in Equations from (7) to (10) [
29], and the comparison between the measured and model estimation values can be more accurately evaluated through regression analysis.
where
is the estimated value at
i and
is the mean value of data.
If MAE and MSE are smaller, the estimated value is more accurate. If PBIAS is close to 0, the estimation result represents less bias. A G value of 100 is a perfect estimation. If the G value is negative, it is less reliable than using the average of data values as a predictor. MSE, MSE, PBIAS and
G-value were used to verify the accuracy of the NRW ratio (%) estimated by the ANN.
Table 6 shows the results of the NRW ratio’s accuracy assessment by the ANN and the multiple regression equation.
The ANN (20) with 20 neurons using original data satisfies the MAE, MSE and G-value and the resulting range of values closest to the measured NRW ratio (%). In the case of PBIAS, which shows the data’s bias, the multiple regression equation shows the lowest value, indicating less biased results than others from the ANN. The ANN (30) with 30 neurons showed the highest accuracy among all assessment regulations of the PBIAS, MAE, MSE and G-value when the outlier was removed by the Z-score method. As a result of analyzing the data with the outlier removed by the Z-score, the accuracy of ANN (20) and ANN (30) was found higher than that of the original data used as a condition.
ANN (30) showed the highest accuracy among all results, and ANN (20) of the original data represented the least biased NRW ratio.
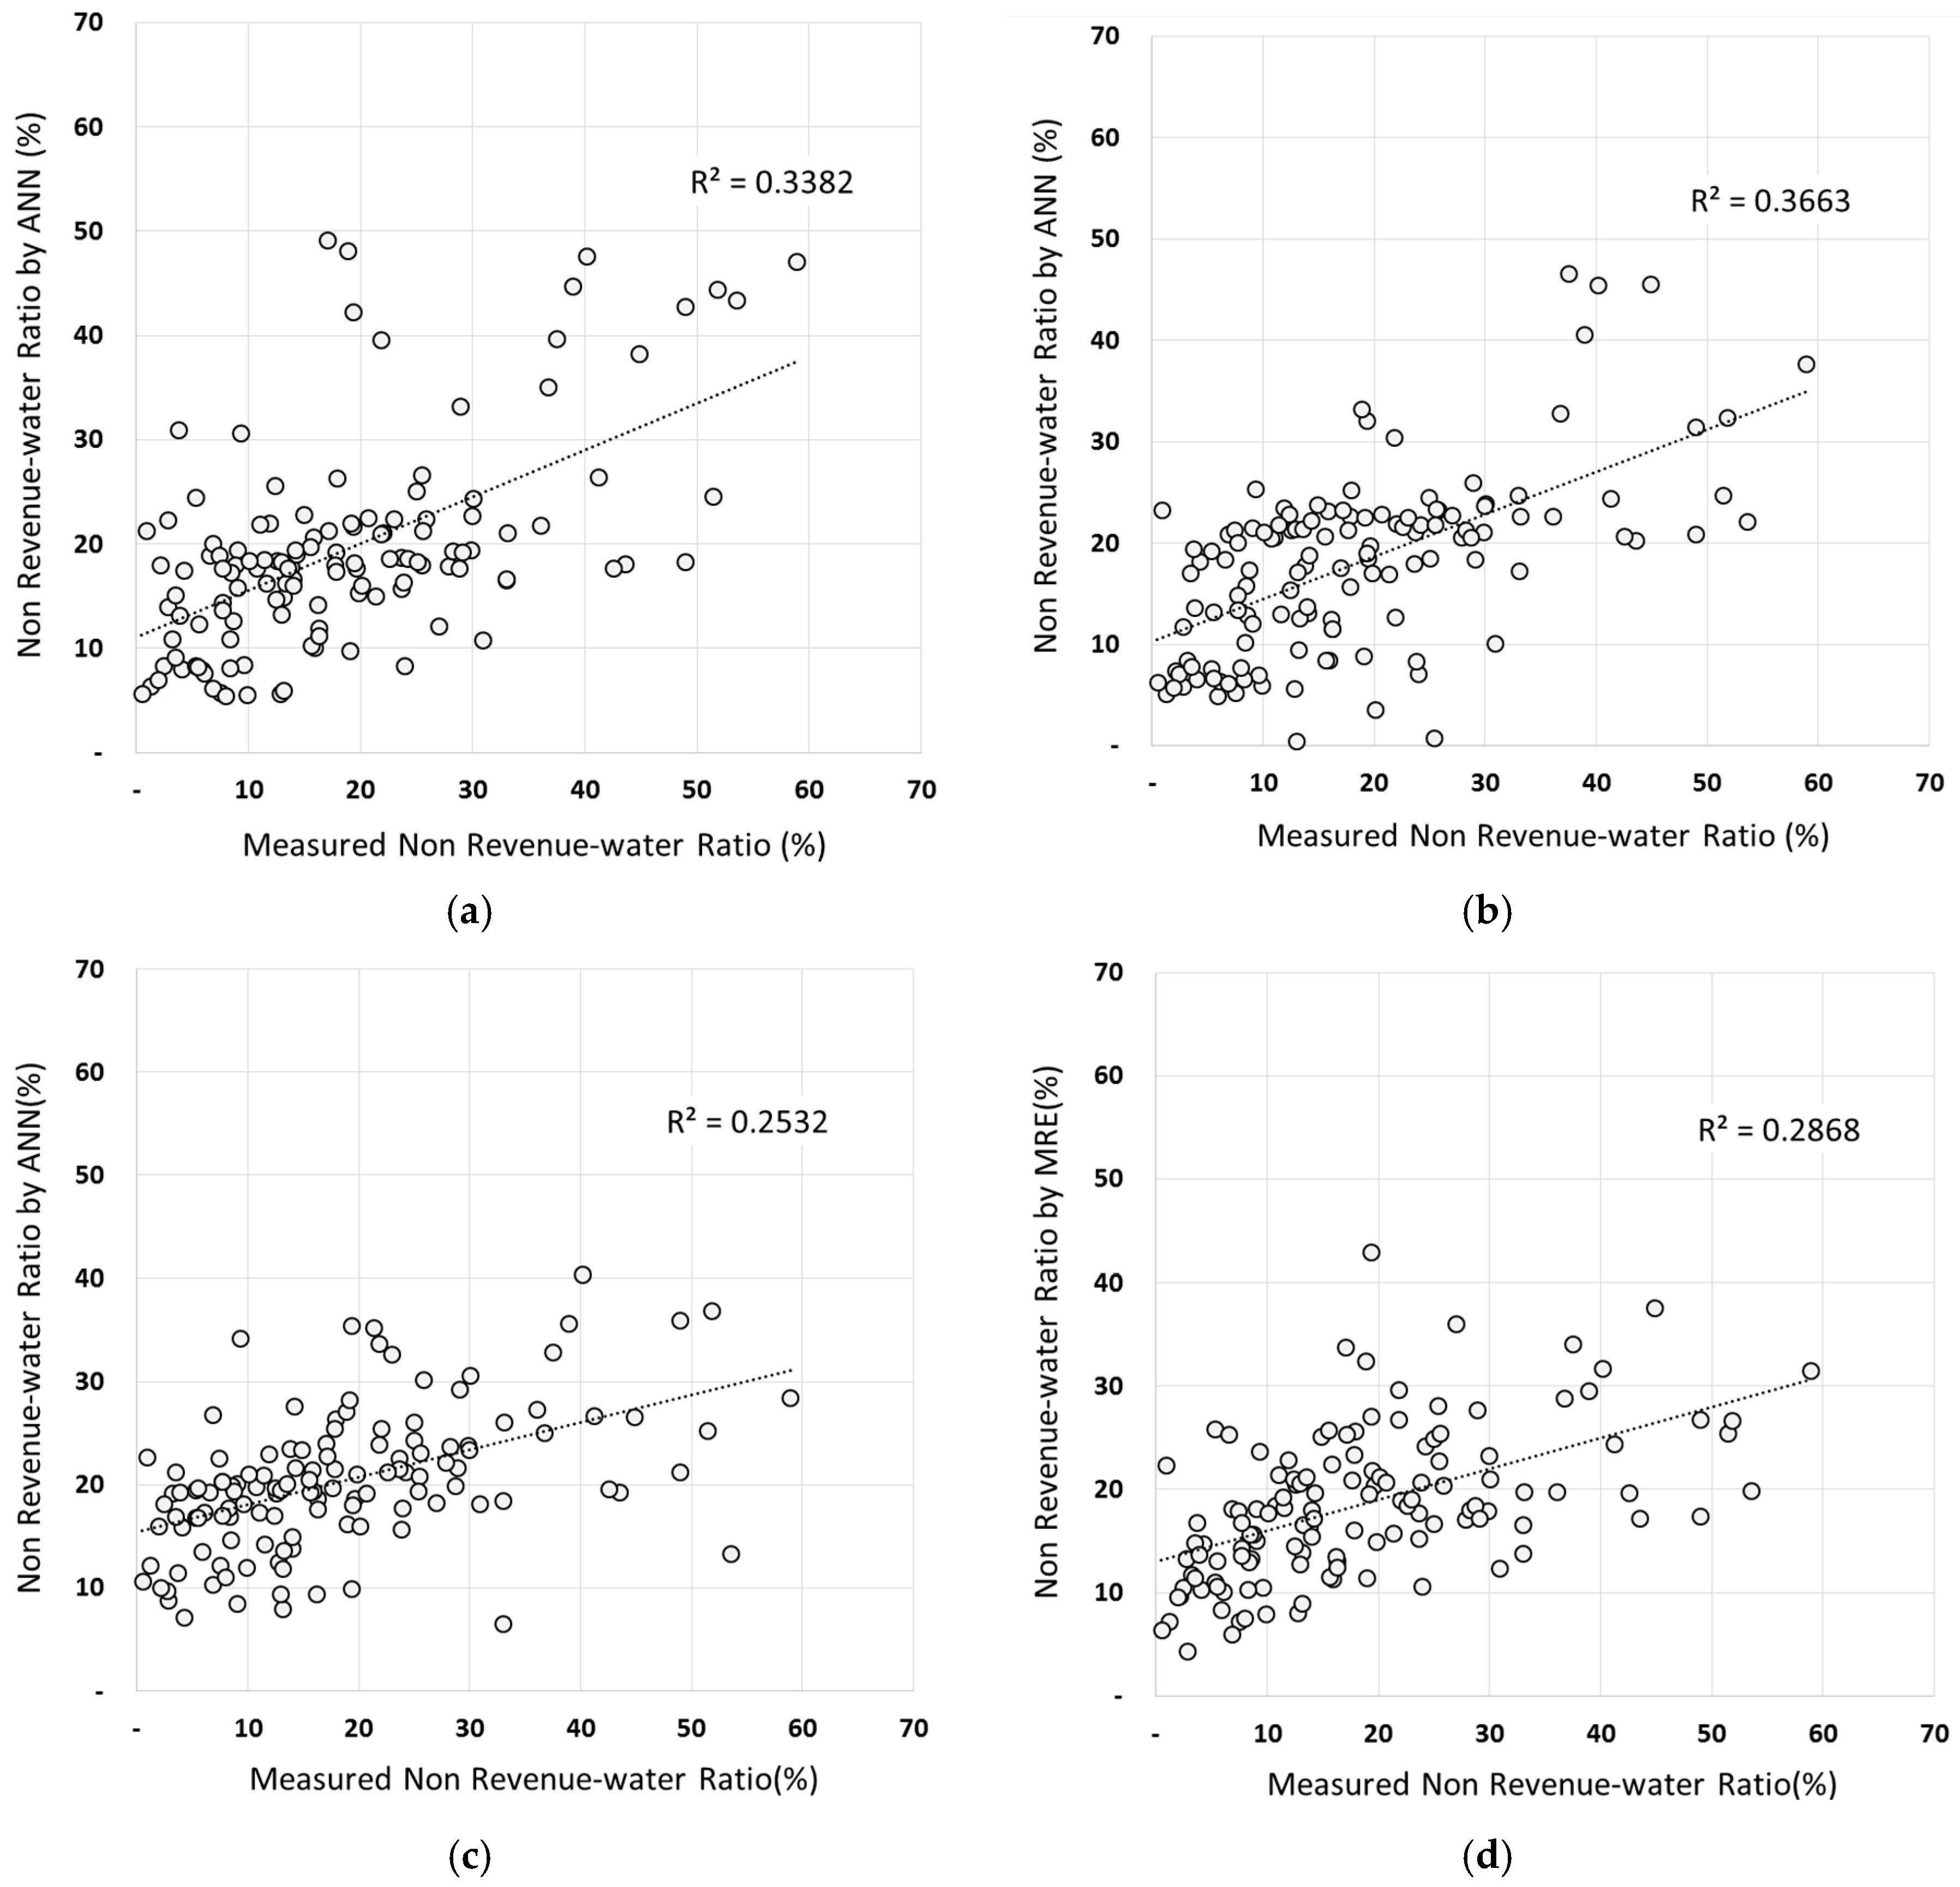
Figure 7 shows the results of a scatter plot analysis of original data without using the
Z-score method. The
of the ANN model with 20 hidden layers was 0.3663 and the correlation coefficient was higher than the ANN model with 10 or 30 hidden layers and multiple regression analysis. These are the same results in
Table 4 and the ANN model with 20 hidden neurons seems highly accurate.
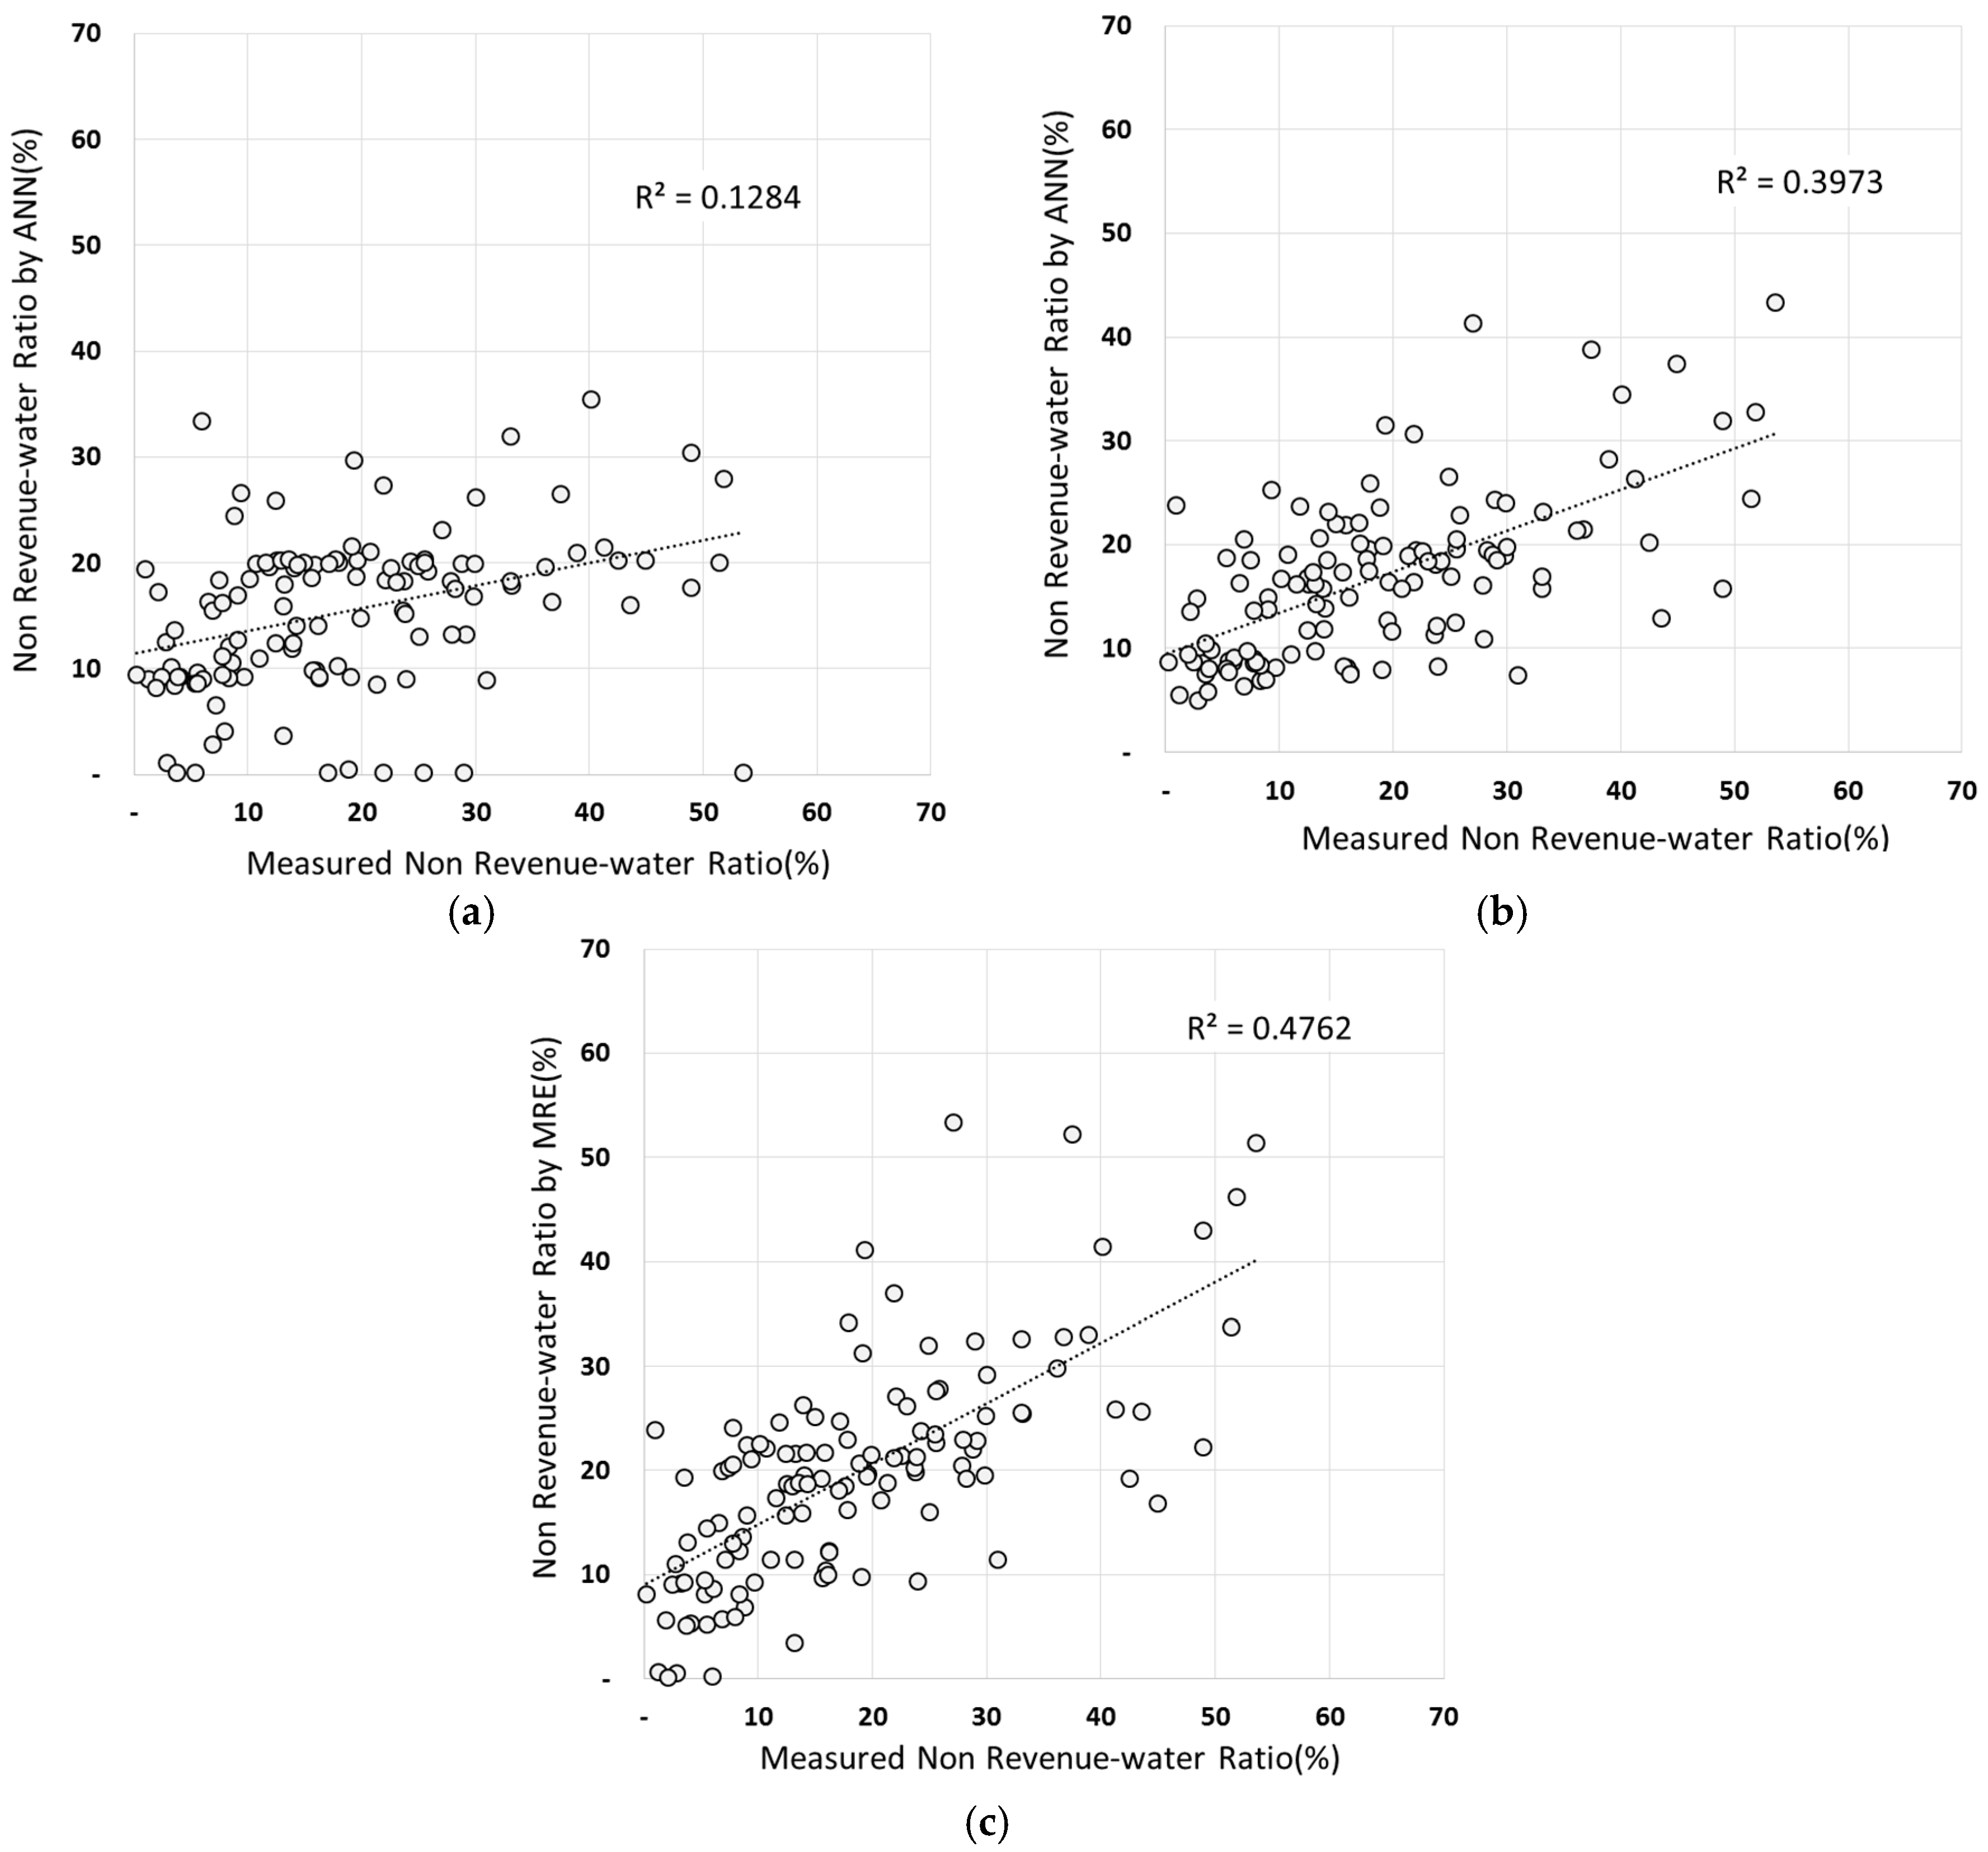
Figure 8 shows the results after excluding the abnormal values using the Z-score method. The accuracy of the ANN model was found to be the most accurate under the condition of 30 hidden layers. An
of 0.476 denotes high similarity than other neuron cases. In the case of the ANN model, six cases were used to estimate the NRW ratio, and the accuracy was high or low depending on the number of hidden layers compared with the multiple regression equation comparing the previous research [
24].
6. Conclusions
The present study developed a model for estimating the NRW ratio using an ANN based on specific parameters affecting leaks in the water distribution systems of Incheon. Accuracy assessment and scatter plot analysis were used to select the optimal ANN model cases. The following conclusions were therefore drawn.
First, the estimation model for the NRW ratio was developed by an ANN in the water distribution systems of Incheon. In comparison with the multiple regression equation, the ANN-estimated NRW ratio was more accurate when the appropriate number of hidden layers was applied. Improvement of about 40 percent occurred compared with the NRW ratio derived from a multiple regression equation. This proves that the selected parameters such as water supply quantity per demand junction, deteriorated pipe ratio and demand energy ratio are valid for estimating the NRW.
Second, analysis of the outlier of independent variables is crucial when applying the ANN model. If the NRW ratio was applied to the ANN model by eliminating the outlier data through the Z-score method, the results of the NRW ratio would have been similar to the measured value than in cases in which the outlier data were not removed. The accuracy of NRW prediction can be improved through the accuracy and outlier verification of the collected data of each DMA.
Third, the optimal number of hidden layers is needed when estimating the NRW ratio via ANN. When developing the ANN model, this study set hidden layers with 10, 20 and 30 neurons. If the number of hidden layers is set up with more detailed numbers, however, more accurate results from an ANN can be expected.
The estimation model for the NRW ratio developed through this study can be applicable to the water distribution systems of Incheon. The development model is expected to help set the direction of improvement of the analysis of water distribution systems and the optimal operation of water supply and waterworks facilities for the construction of DMAs in Incheon. The model can also help enhance the revenue water ratio and diagnostic operation of water distribution systems.


