Article

The Indirect Roles of Roads in Soil Erosion Evolution in Jiangxi Province, China: A Large Scale Perspective

1
Institute of Geographic Sciences and Natural Resources Research, Chinese Academy of Sciences, Beijing 100101, China
2
Jiangsu Center for Collaborative Innovation in Geographical Information Resource Development and Application, No. 1 Wenyuan Rd., Nanjing 210023, China
*
Author to whom correspondence should be addressed.
Sustainability 2017, 9(1), 129; https://doi.org/10.3390/su9010129
Submission received: 21 October 2016 / Revised: 4 January 2017 / Accepted: 12 January 2017 / Published: 18 January 2017
(This article belongs to the Section Environmental Sustainability and Applications)

Abstract

:
As elicitors of terrestrial system change (e.g., land use transformation) through the introduction of anthropogenic causes, the spatial patterns and levels of roads might be more detrimental to the long-term health of ecosystems at a large scale than the road paving itself. This paper reveals the relationship between soil erosion and roads from a large-scale perspective in Jiangxi Province, China. Temporal and spatial distribution characteristics of artificial and natural drive factors of soil erosion alongside roads were addressed. It was found that, from 1990 to 2010, Jiangxi Province experienced an obvious reduction in soil erosion (the mean annual soil erosion rate decreased from 930.8 t·km−2·a−1 to 522.0 t·km−2·a−1), which was positively correlated with road density (p < 0.01). The maximum soil erosion reduction occurred at a distance of 0–1 km from the village roads. The order of soil erosion effects of the four levels of roads is: Village road > county road > provincial/national road. We emphasize that studying the indirect roles of roads in soil erosion is strongly dependent on a comprehensive consideration of historical policy and the economic development stage in a study area. This paper highlights the indirect role of village roads in soil erosion evolution.

1. Introduction

Transportation systems have a significant influence on terrestrial ecosystems [1,2]. The construction of roads can directly remove existing vegetation, disturb stream systems [2], fragment landscapes [3,4], and act as barriers to animal movement [5]. In addition, road traffic can introduce pollutants and exotic elements [6] and kill animals [7]. Clearly, these direct ecological impacts of roads, which are of interest to transportation geographers and ecologists, mainly occur on roads or adjacent non-road areas with a short influence radius. Meanwhile, there are also the indirect ecological effects of roads that occur at a broader scale in subtle manifestations [1,8,9].
These indirect effects are tightly associated with increased contact with human activities [1]. For example, and especially in developing countries, forests near the roads suffer from more pressure due to human disturbances than those that are far away from roads [10]. Quite understandably, people cannot reach their destination and transport natural resources without roads. The magnitude of that utilization is closely related to road accessibility, determined by the presence or absence and quality classes of road [3,9,10,11]. Previous research has shown that the indirect ecological effects of roads can extend a great distance into adjacent landscapes, and could be more detrimental to ecological health than direct effects [12]. However, the indirect ecological effects of roads have not been well-studied, especially from the macroscale perspective. This may be due to the limitations of traditional road ecological concepts. With the development of a (Geographic Information System) GIS-based distributed model and the data acquisition that has been advanced by remote sensing technology, geographers have a unique opportunity to perform this task.
Jiangxi Province holds an important position in the process of socioeconomic development in China, however, this position is characterized by a typically fragile. According to relevant research, serious soil erosion due to water has been found to be the cause of the most severe environmental degradation in Jiangxi Province [13,14]. Realizing the existence of the indirect ecological effects of roads, we cannot help but wonder about the relationship between soil erosion and roads, from a macroscale perspective, in this region. The key objectives in this paper are to: (1) estimate the annual soil erosion rate in the study area for 1990 and 2010, based on the Revised Universal Soil Loss Equation (RUSLE) model; and (2) reveal the temporal and spatial relationship between soil erosion and roads at four levels (country, provincial, county, and village) by using spatial pattern analyses and statistical analyses. Our work can contribute to the development of the science of road ecology, and provide a theoretical basis for soil erosion control.

2. Materials and Methods
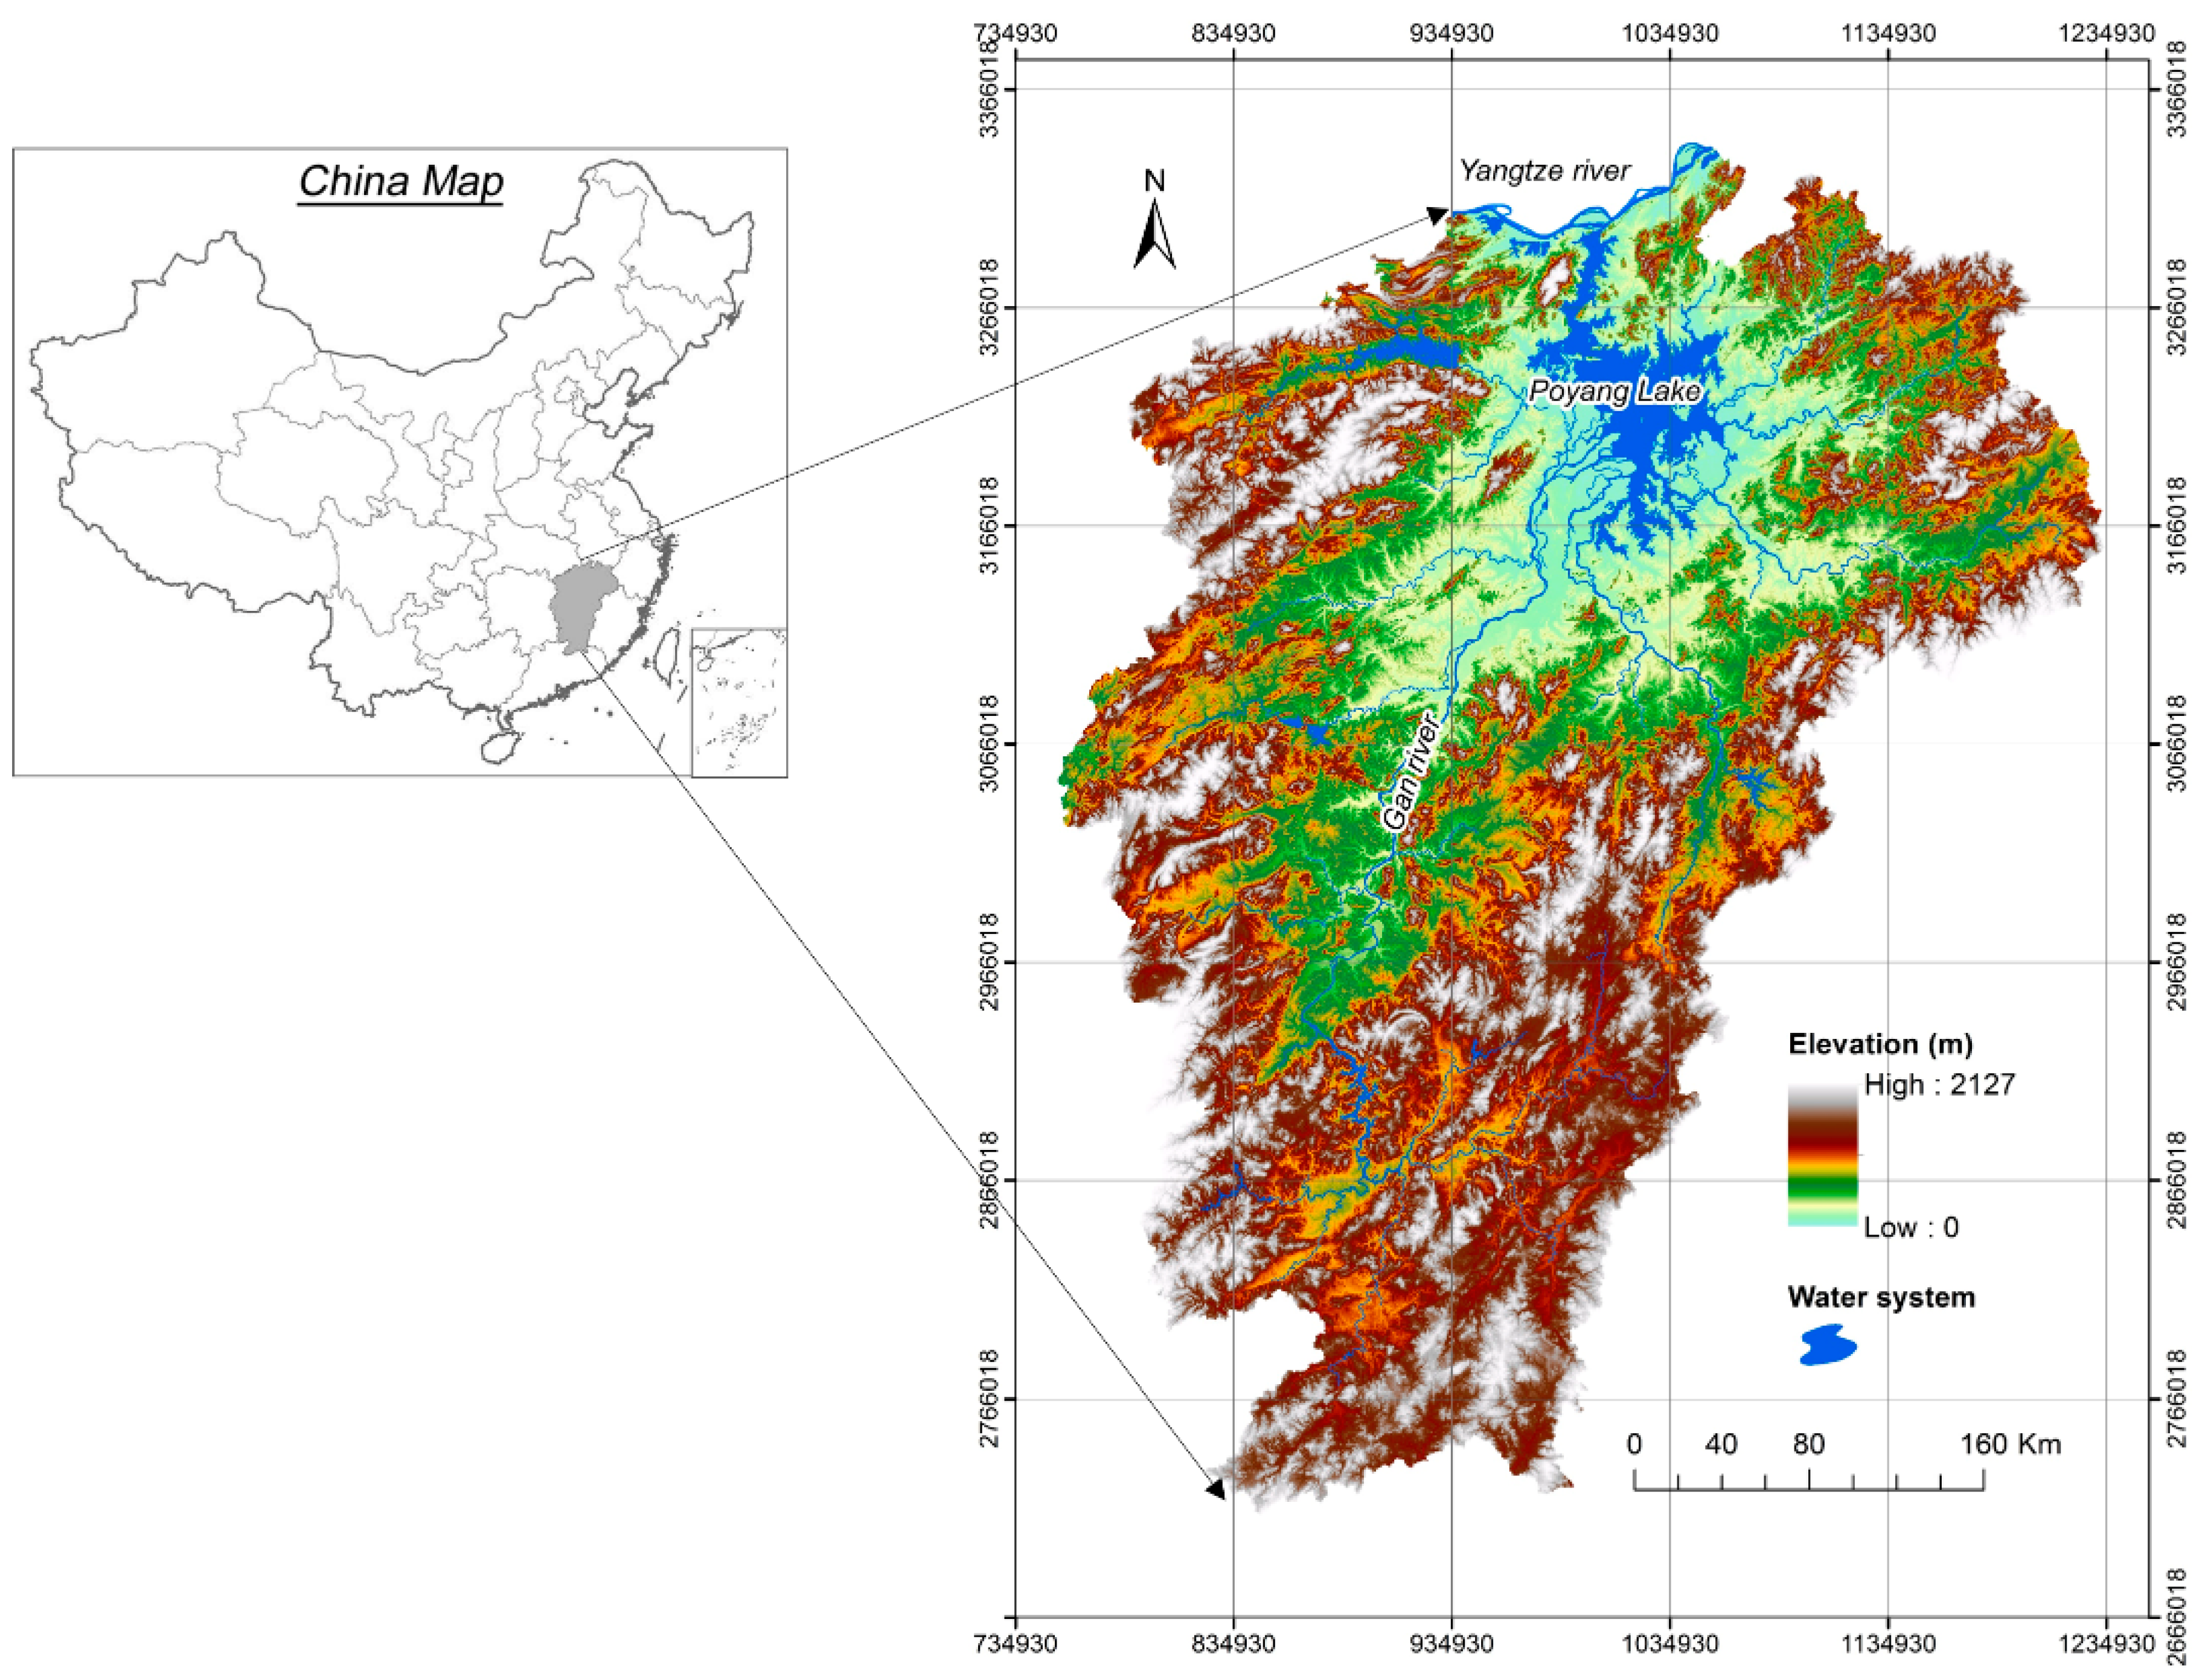
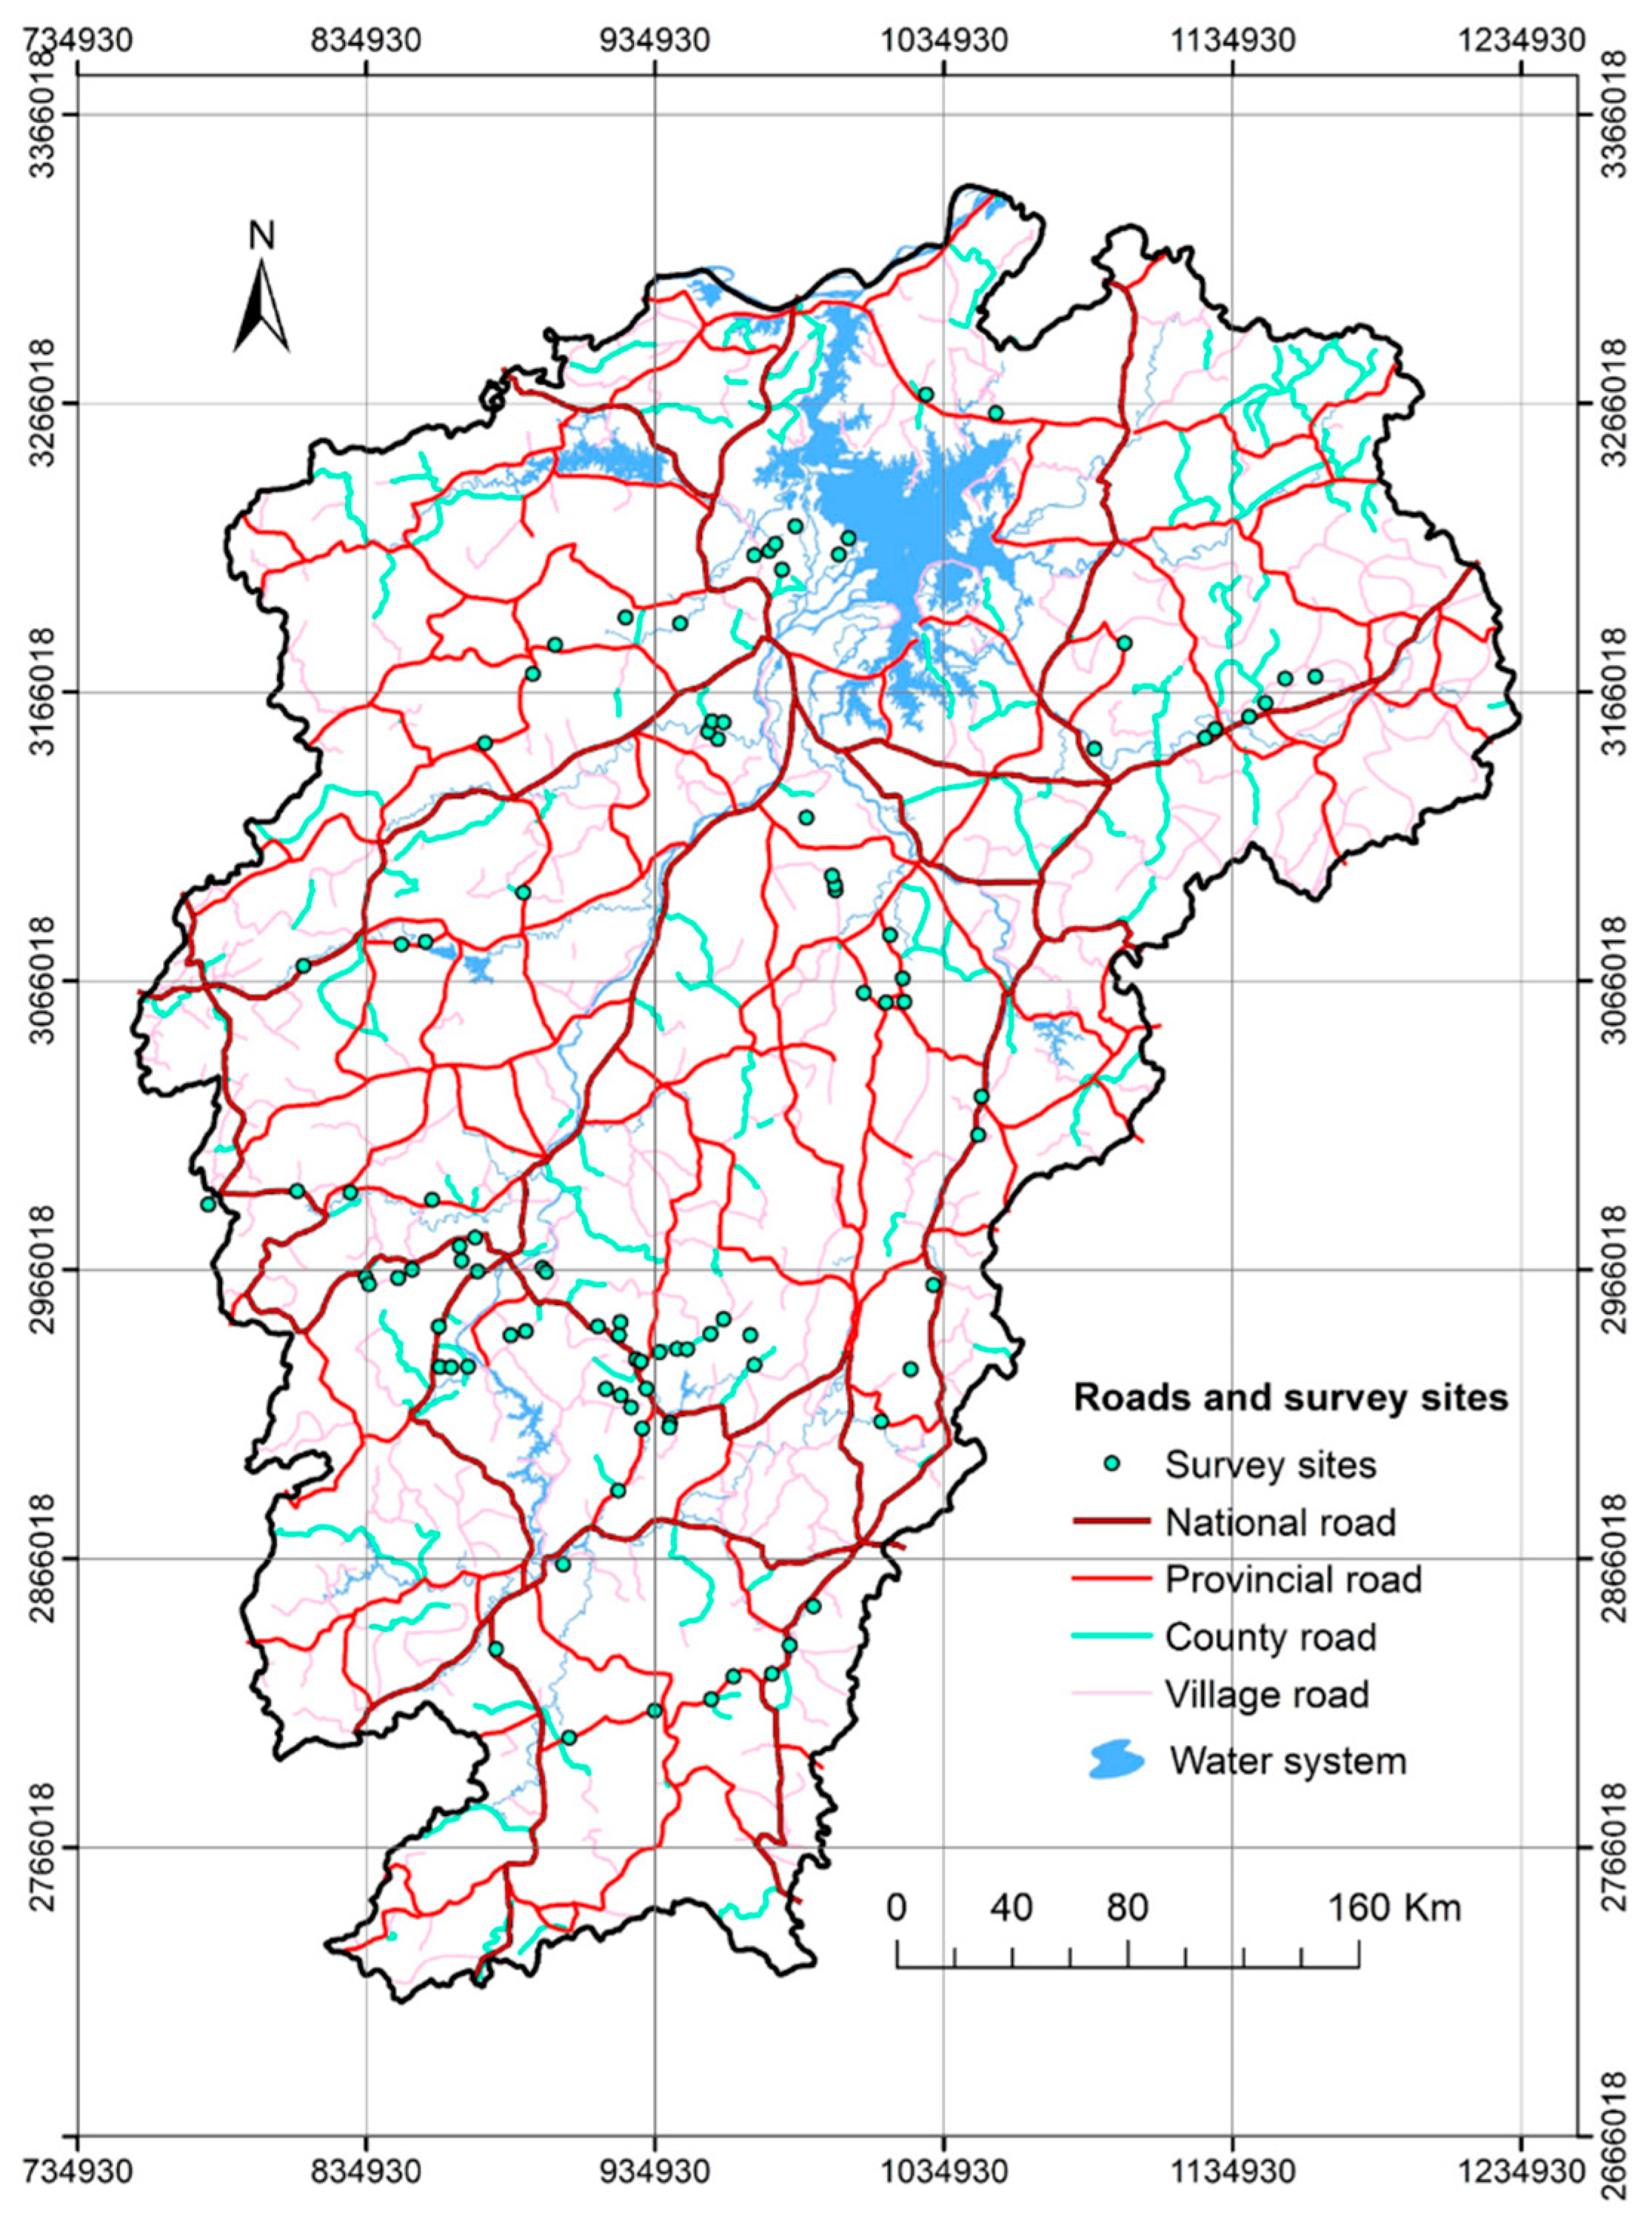
2.1. Study Area

Jiangxi Province, which is located in UTM zone 49 (756.45–1234.02 km east, 2706.34–3344.91 km north) (Figure 1), is representative of the hilly regions of South China. It covers an area of 166,900 km2 and is surrounded by the provinces of Zhejiang, Hubei, Fujian, Guangdong, Hunan, and Anhui provinces. The climate (typical subtropical climate) is generally moist with an average annual temperature of 17.7 °C, an average annual precipitation of 1786 mm, and a daily maximum temperature of around 40 °C. The river systems in the study area are well developed, and include Poyang Lake and Ganjing River (the primary river). Poyang Lake, the largest fresh water lake in China, is located in the north of Jiangxi Province. Ganjiang River covers an area of 79,173 km2 as a main tributary of the Yangtze River. Flat alluvial plains and smoothly undulated mountain lands, located predominately in the mid-north region of the study area, account for about 35% of the total area of the territory. Mountains with numerous intra-mountainous valleys and uplands belong to the main landscape of the rest of the territory. Despite the steeper slope, soil erosion in mountains areas is under control due to the high coverage rate of forests, which have an efficient function in soil and water conservation [15]. Construction land, farmland, grass, forest, open forest, shrub, and orchard are the main land use types. In 2000, China implemented the “Returning Farmland To Forest” Program for ecological reconstruction and the control of soil erosion by water in the study area. By 2010, most steeply sloped cultivated lands, which are not suitable for grain production, had been converted into grass and forest lands by the program [16,17].

2.2. Materials

A total of 34 remote sensing images (Landsat-5 TM images) were applied to generate the Normalized Difference Vegetation Index (NDVI) for the years from 1990 and 2010, utilizing the NDVI module in ENVI 4.7 software. These images were from The Institute of Remote Sensing and Digital Earth, the Chinese Academy of Sciences (CAS). A Digital Elevation Model (DEM) with a spatial resolution of 30 m, generated from 1:50,000 topographic maps (provided by the Institute of Geographic Sciences and Natural Resources Research (IGSNRR), the Chinese Academy of Sciences) using the ArcGIS 10.2 3D analysis tool, was chosen for the geometric correction process, using the method of mapping polynomials. For each (Thematic Mapper) TM/(Operational Land Imager) OLI image, there are at least 5 Ground Control Points (GCPs) in order to guarantee accuracy. The Root Mean Squared Error (RMS error) was not more than 0.5 pixels. Atmospheric correction was conducted using the (Fast Line-of-sight Atmospheric Analysis of Spectral Hypercubes) FLAASH module in the Environment for Visualizing Images 4.7 (ENVI) software.
Land use maps of corresponding years were provided by the Data Center for Resources and Environmental Sciences, Chinese Academy of Sciences (RESDC), which were generated by using a visual interpretation method [18]. In October 2013, we performed an integrated field survey (Figure 2), including land use types, NDVI, and soil erosion intensity across the study area, to support the accuracy validation. An accumulated survey length of 3063 km, 1336 photos and a total of 93 patches with latitude and longitude information were recorded as the field survey database. Validation showed that the accuracy of the land use map for 2010 was 94.3%.
Daily precipitation datasets from 48 weather stations (including 29 stations located in study area and 19 stations surrounding it) for 28 years (1987–2014) were obtained from the China Meteorological Data Sharing Service System. Slope (in degrees) was generated from the DEM in a GIS environment. Road data from 2001 in a vector format (Figure 2) at a 1:250,000 scale was extracted from the traffic map of Jiangsu Province, published by the Jiangxi Surveying and Mapping Bureau. In the study area, the roads (mainly paved with asphalt concrete) can be categorized into four levels, each with different functions and distribution characteristics. The detailed descriptions are presented in Table 1. It is worth noting that village roads utilized in this paper refer to roads linking large villages and towns. Taking all roads linking small and scattered resident areas into account would be too complex. The 2nd Soil Survey Data of China at 1:1,000,000 scale and the spatial data concerning the “Returning Farmland To Forest” project (1990 to 2010) were obtained from IGSNRR. All raster data have been converted into raster at a 1-km grid cell, so that spatial analyses can be performed using the same cell size and map projection.

2.3. Methods

2.3.1. Estimation of Annual Soil Erosion Rate

The Revised Universal Soil Loss Equation (RUSLE) [19] was applied in order to estimate the annual soil erosion rate at the raster cell level. As one of the most widely used empirical models quantifying soil erosion by water, the RUSLE has several prominent advantages. Its efficiency and simplicity have won the favor of scientists, especially due to the fact that the input factors of the RUSLE can be processed in geographic information system (GIS) software, which handily enables the estimation of soil erosion in a raster map. In addition, RUSLE has been tested over many years and the drawbacks are already known. For example, at a regional scale, the estimated soil erosion rate should be applied for comparative purposes [20]. In this paper (which is a comparative study), this limitation can be ignored.
The RUSLE equation is given by:
A = R × K × LS × C × P
where A is the estimated annual soil erosion rate (t·km−2·a−1); R is the erosivity factor of rainfall (MJ·mm·km−2·h−1·a−1); K is the erodibility factor of soil (t·km2·h·km−2·MJ−1·mm−1); LS is the slope and length factor (dimensionless); C is the vegetation coverage factor (dimensionless, valued between 0 and 1); and P is the conversation support-practice factor (dimensionless, valued between 0 and 1).
As an empirical model, RUSLE, as well as former version (USL), are based on massive experiments carried out in the USA. To enable its application in China, many scholars have modified the methodology of factor calculation by considering the practical situation of China [21,22,23,24,25]. The methods adopted in this paper are all widely accepted and compatible for the study area. To reduce the length of the paper, the calculation of input factors are presented briefly (Table 2). A total of 92 field data were collected to assess the accuracy of the soil erosion map. The accuracy was 91%.

2.3.2. Buffer Analysis and Regression Analyses

With the support of ArcGIS 10.2 software ((Environmental Systems Research Institute) ESRI, Redlands, America), buffer zones with distance of 1 km, 2 km, 3 km, ⋯, 8 km from roads, for each level were created. By overlapping road buffer zones and spatial distribution maps of soil erosion (including annual soil erosion rates of 1990 and 2010 and the change from 1990 to 2010), slope, rural settlements and implementing areas of ecological project, we can obtain temporal and spatial distribution characteristics of soil erosion and its artificial and natural driving factors alongside roads at various levels. Areas covered by two or more buffer zones were excluded to avoid the mutual interference among roads.
To quantitatively measure the relationship between soil erosion and roads, coefficients of determination (R2) and P value were estimated utilizing linear regression equations, with mean annual soil erosion rate (MASER) as the dependent variable, and distance to road and road density as the independent variables, respectively.

3. Results

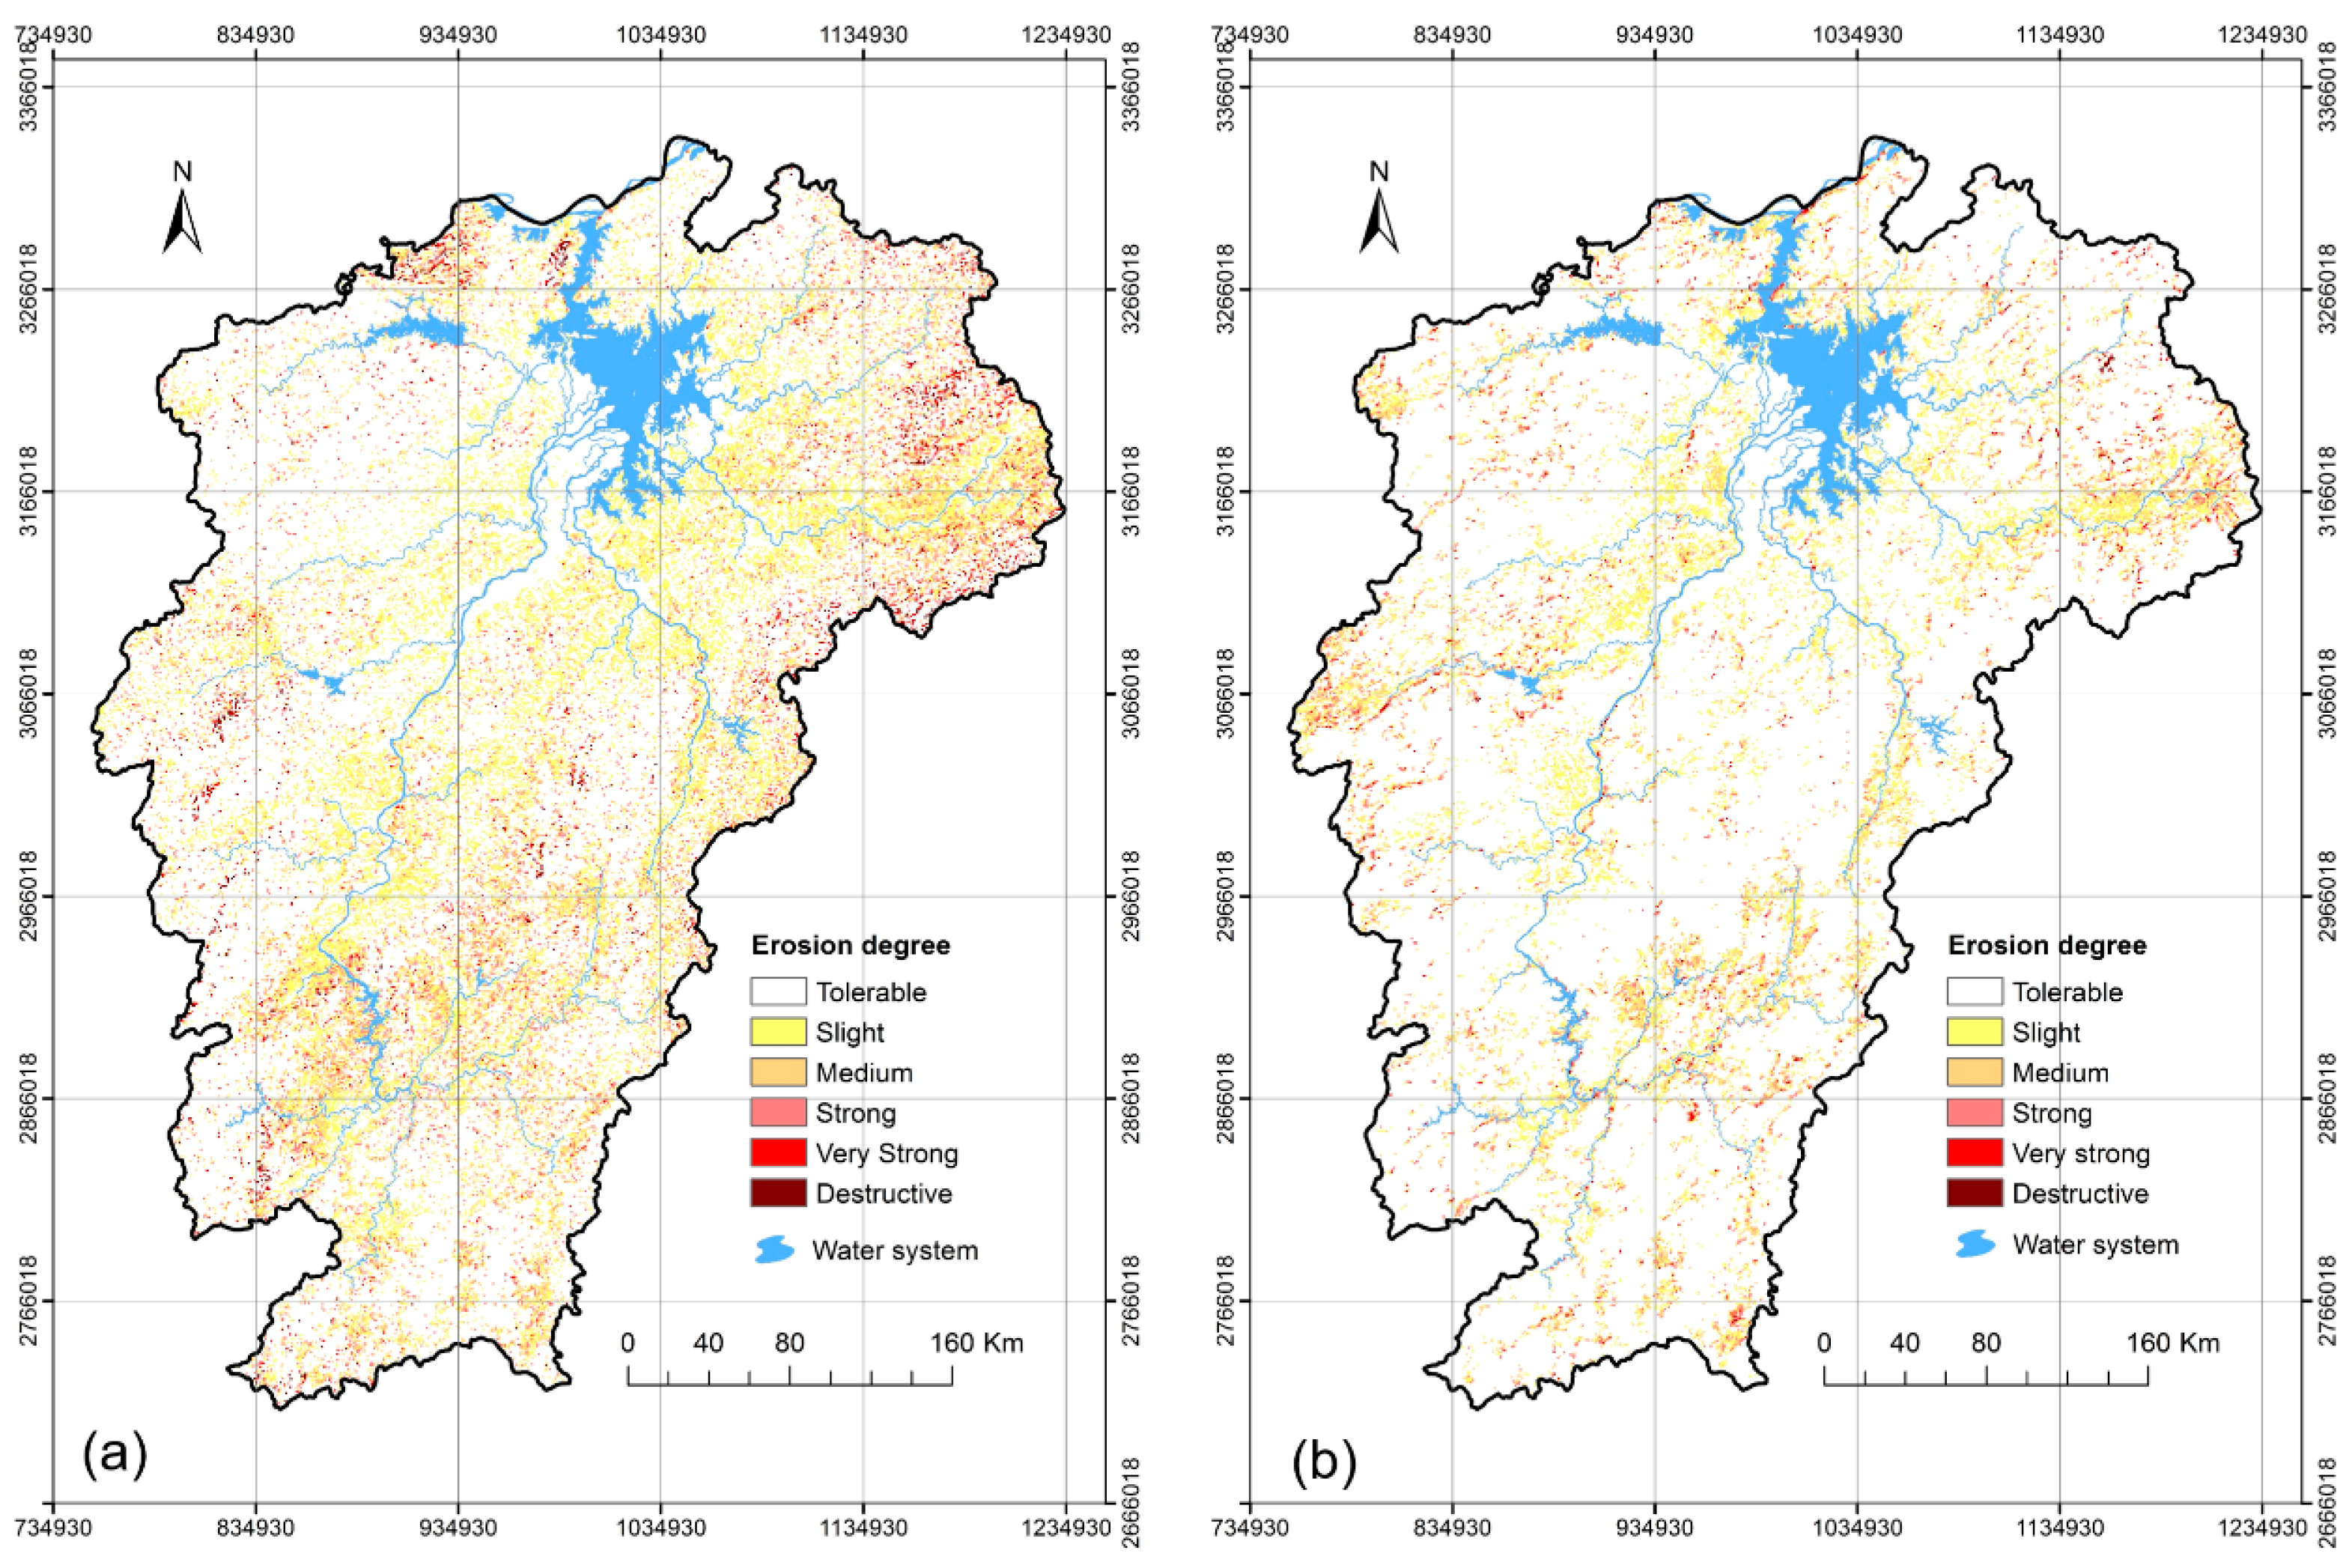
3.1. Soil Erosion Intensity

By utilizing the RUSLE model, the soil erosion maps of the study area were generated for 1990 and 2010, respectively. To clearly display the soil erosion intensity and its variation, the estimated results were classified into six degrees, according to the “Standards for Classification and Gradation of Soil Erosion SL 190-2007” [26] (Figure 3). The classifying standard is as follows: Tolerable degree (<500 t·km−2·a−1), slight degree (500–2500 t·km−2·a−1), medium degree (2500–5000 t·km−2·a−1), strong (5000–8000 t·km−2·a−1), very strong (8000–15,000 t·km−2·a−1), and destructive (≥15,000 t·km−2·a−1).
It was found that areas of tolerable degrees dominated the study area in both 1990 and 2010, accounting for 72.7% and 83.8% of the total area, respectively. As illustrated in Table 3, in 1990, the order of areas was tolerable, slight, medium, strong, very strong, and destructive. That order was maintained in 2010. From 1990 to 2010, areas experiencing changes of erosion degrees occupied 49,141 km2, accounting for 30% of the total area. Among them, areas undergoing the deterioration process of soil erosion covered 17,397 km2, and those undergoing reduction processes covered 31,744 km2. From 1990 to 2010, there was an increase in the tolerable degrees (increasing by 14.6%) and a relatively obvious decrease in slight, medium, strong, very strong, and destructive degrees. On the whole, there was an obvious reduction of soil erosion (companied by a notable spatial patterns change) in the study area from 1990 to 2010.

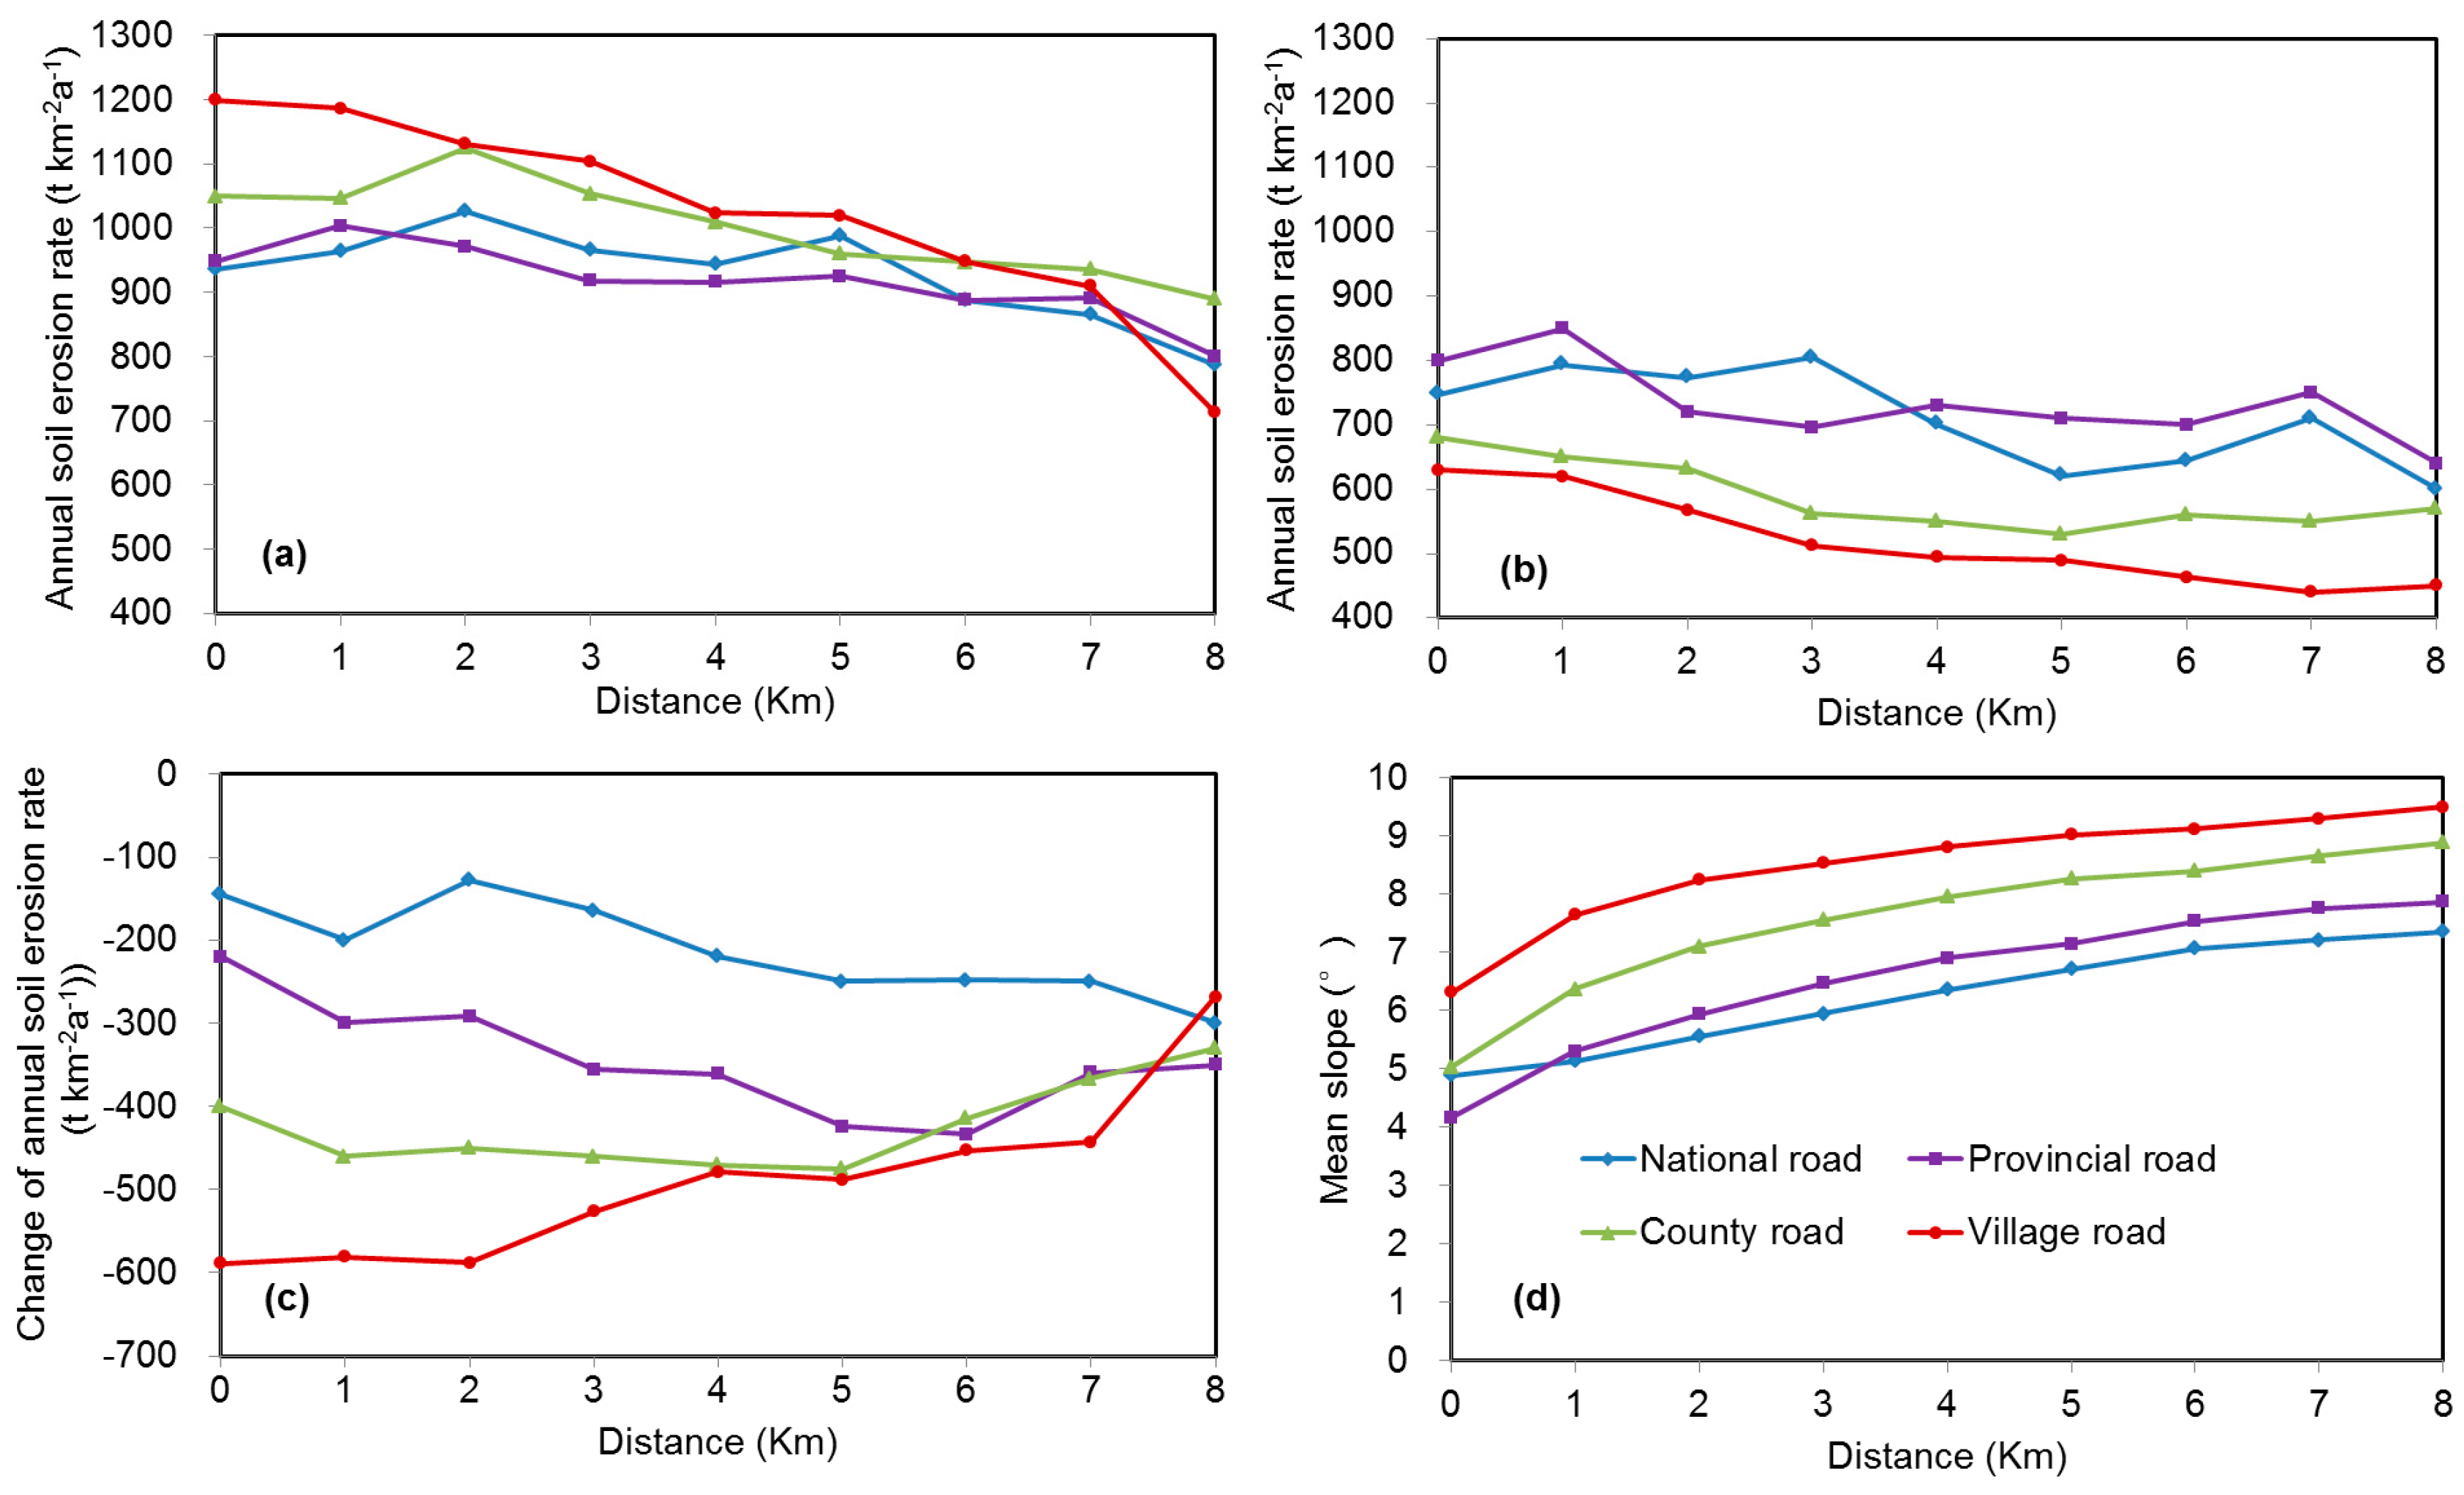
3.2. Relationship between Soil Erosion and Distance to Roads

Figure 4a shows the distribution patterns of the annual soil erosion rate in 1990 along roads. A similar tendency was found in four levels of cases (national, provincial, county, and village): Annual soil erosion rate decreased significantly with increasing distance to roads. The most severe soil erosion occurred at a distance of 0–1 km from village roads, with a mean annual soil erosion rate in the buffer strip beyond 1190 t·km−2·a−1. Generally speaking, the order of annual soil erosion rate is: Village road > county road > provincial road > national road, and the difference in annual soil erosion rates among the four levels of roads decreased as distance to roads increased. Table 4 shows the monotonic relationship between soil erosion and distance to road. In 1990, village roads, having the highest R2 = 0.91, affected soil erosion more greatly than the other three levels of roads.
With regards to 2010, village roads also had the highest R2 (0.92) (Table 4). Figure 4b exhibits a general order of annual soil erosion rates along the four levels of roads: National/provincial road > county road > village road (the difference between provincial and national roads is not significant). Although increasing the distance to roads can generally reduce the annual soil erosion rate, the slopes of linear regression lines of the four road levels have declined compared to those in 1990 (Table 4). One exception was national roads (with a non-significant increase from 19.11 to 21.38). These observations might be explained by the evolution pattern of annual soil erosion rates from 1990 to 2010 along roads, shown in Figure 4c. It was found that, from 1990 to 2010, soil erosion reduction was more likely to occur in areas near road baselines. The largest reduction of soil erosion occurred at a distance of 0–1 km from village roads, with the mean annual soil erosion rate in buffer strips reduced by more than 589 t·km−2·a−1. From Figure 4c, we can also see that soil erosion reduction from 1990 to 2010 along various levels of roads regularly rank in the following order: Village road > county road > provincial road > national road. With the increase in distance to roads, the difference in soil erosion reduction among the four levels of roads declined.

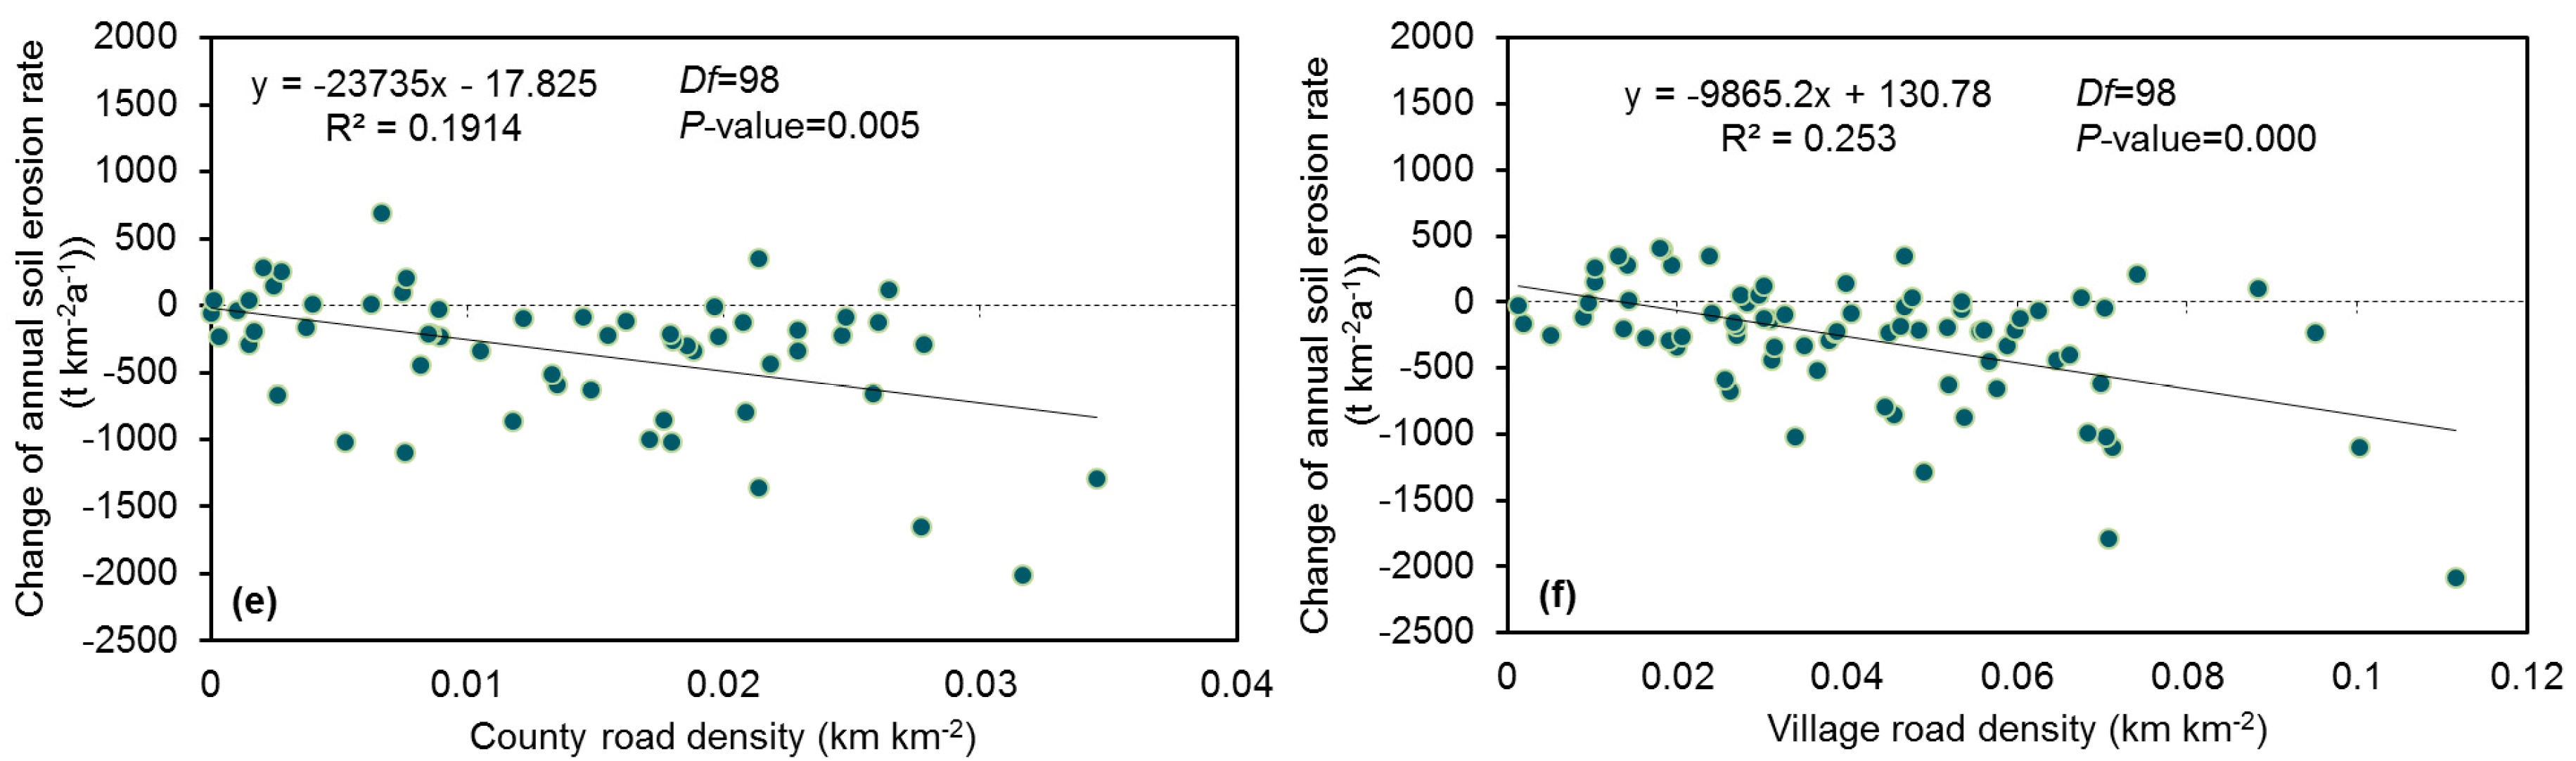
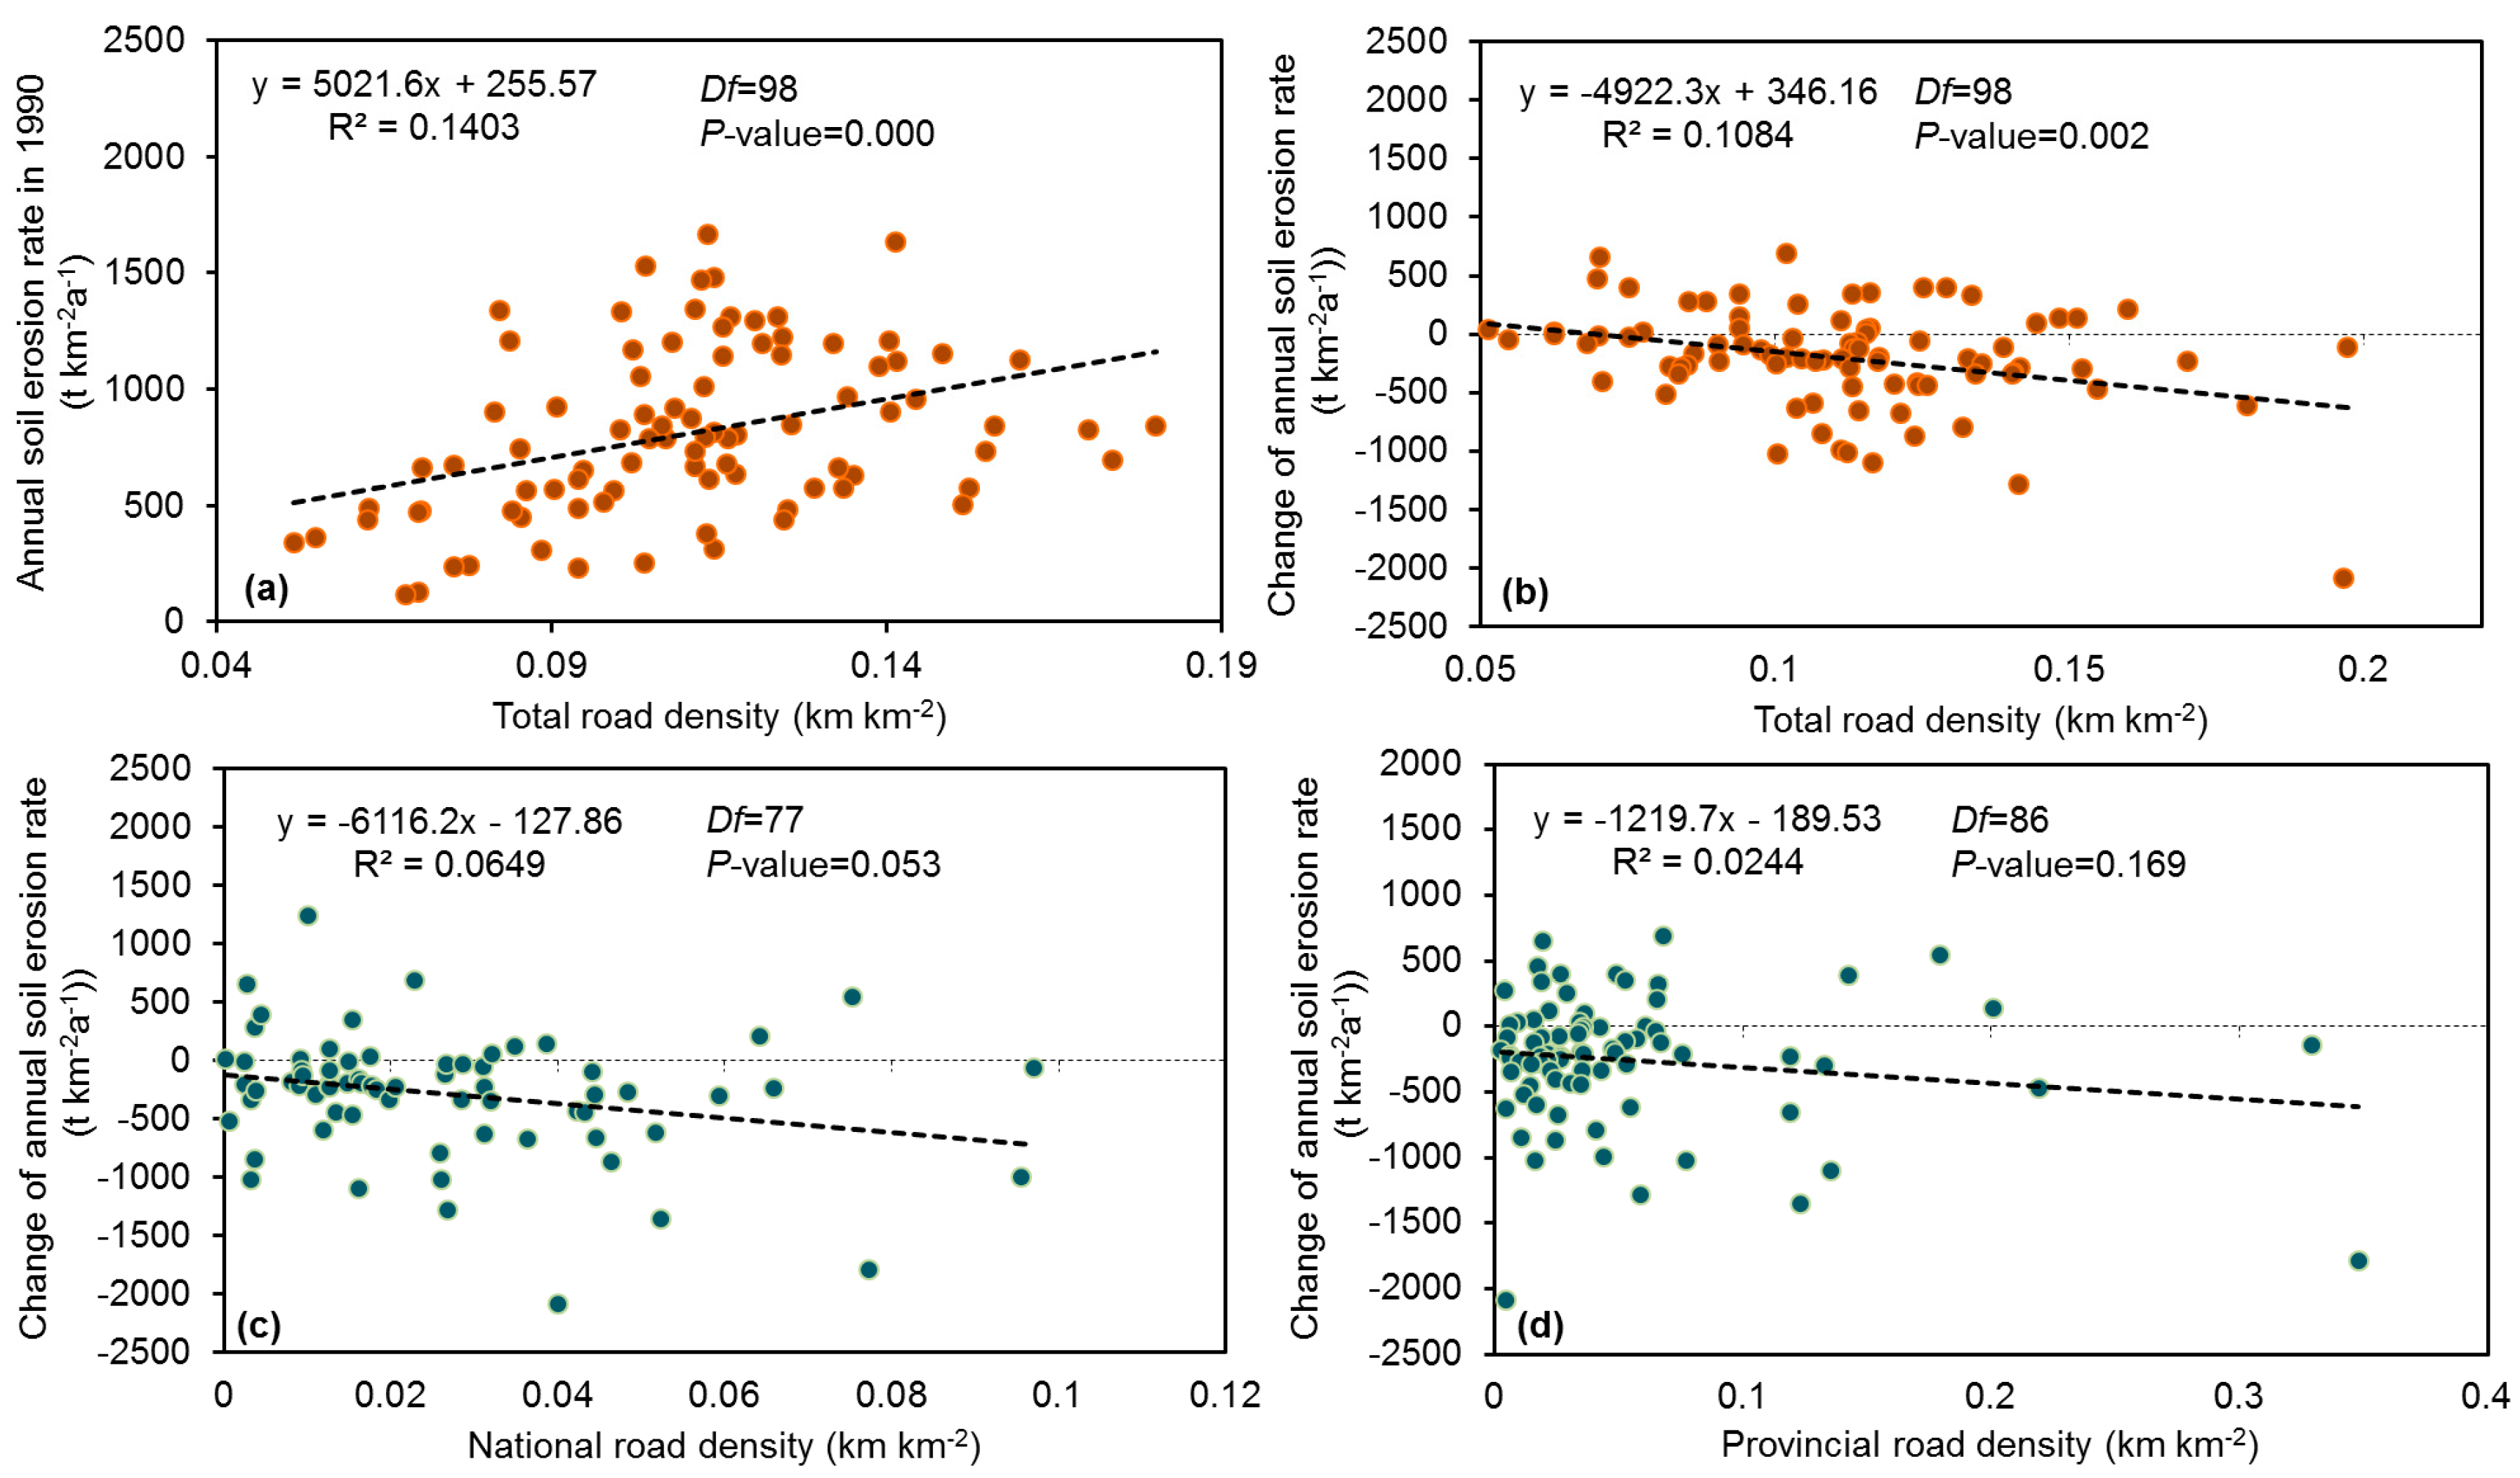
3.3. Relationship between Roil Erosion and Road Density

At the county level, we calculated the mean annual soil erosion rate (MASER) and road density (the ratio of the length of the county’s roads to the county’s land area, km·km−2) and investigated their relationship by utilizing linear regression analyses.
As shown in Figure 5a, in 1990 the annual soil erosion rate was positively correlated with the total road density (p < 0.01), however, there was a significant negative correlation between the change in annual soil erosion rate from 1990 to 2010 and the total road density (R2 = 0.1084, p < 0.01). In other words, over 20 years, the presence of the road was able to significantly enable soil erosion reduction. By comparing Figure 5c,d, we realized that the village road density with the lowest p value (0.000) had the strongest influence on soil erosion changes, and next came county villager road density (p = 0.005). The statistical relationship between national and provincial road densities and changes in annual soil erosion rates failed to reach a significant level.

4. Discussion

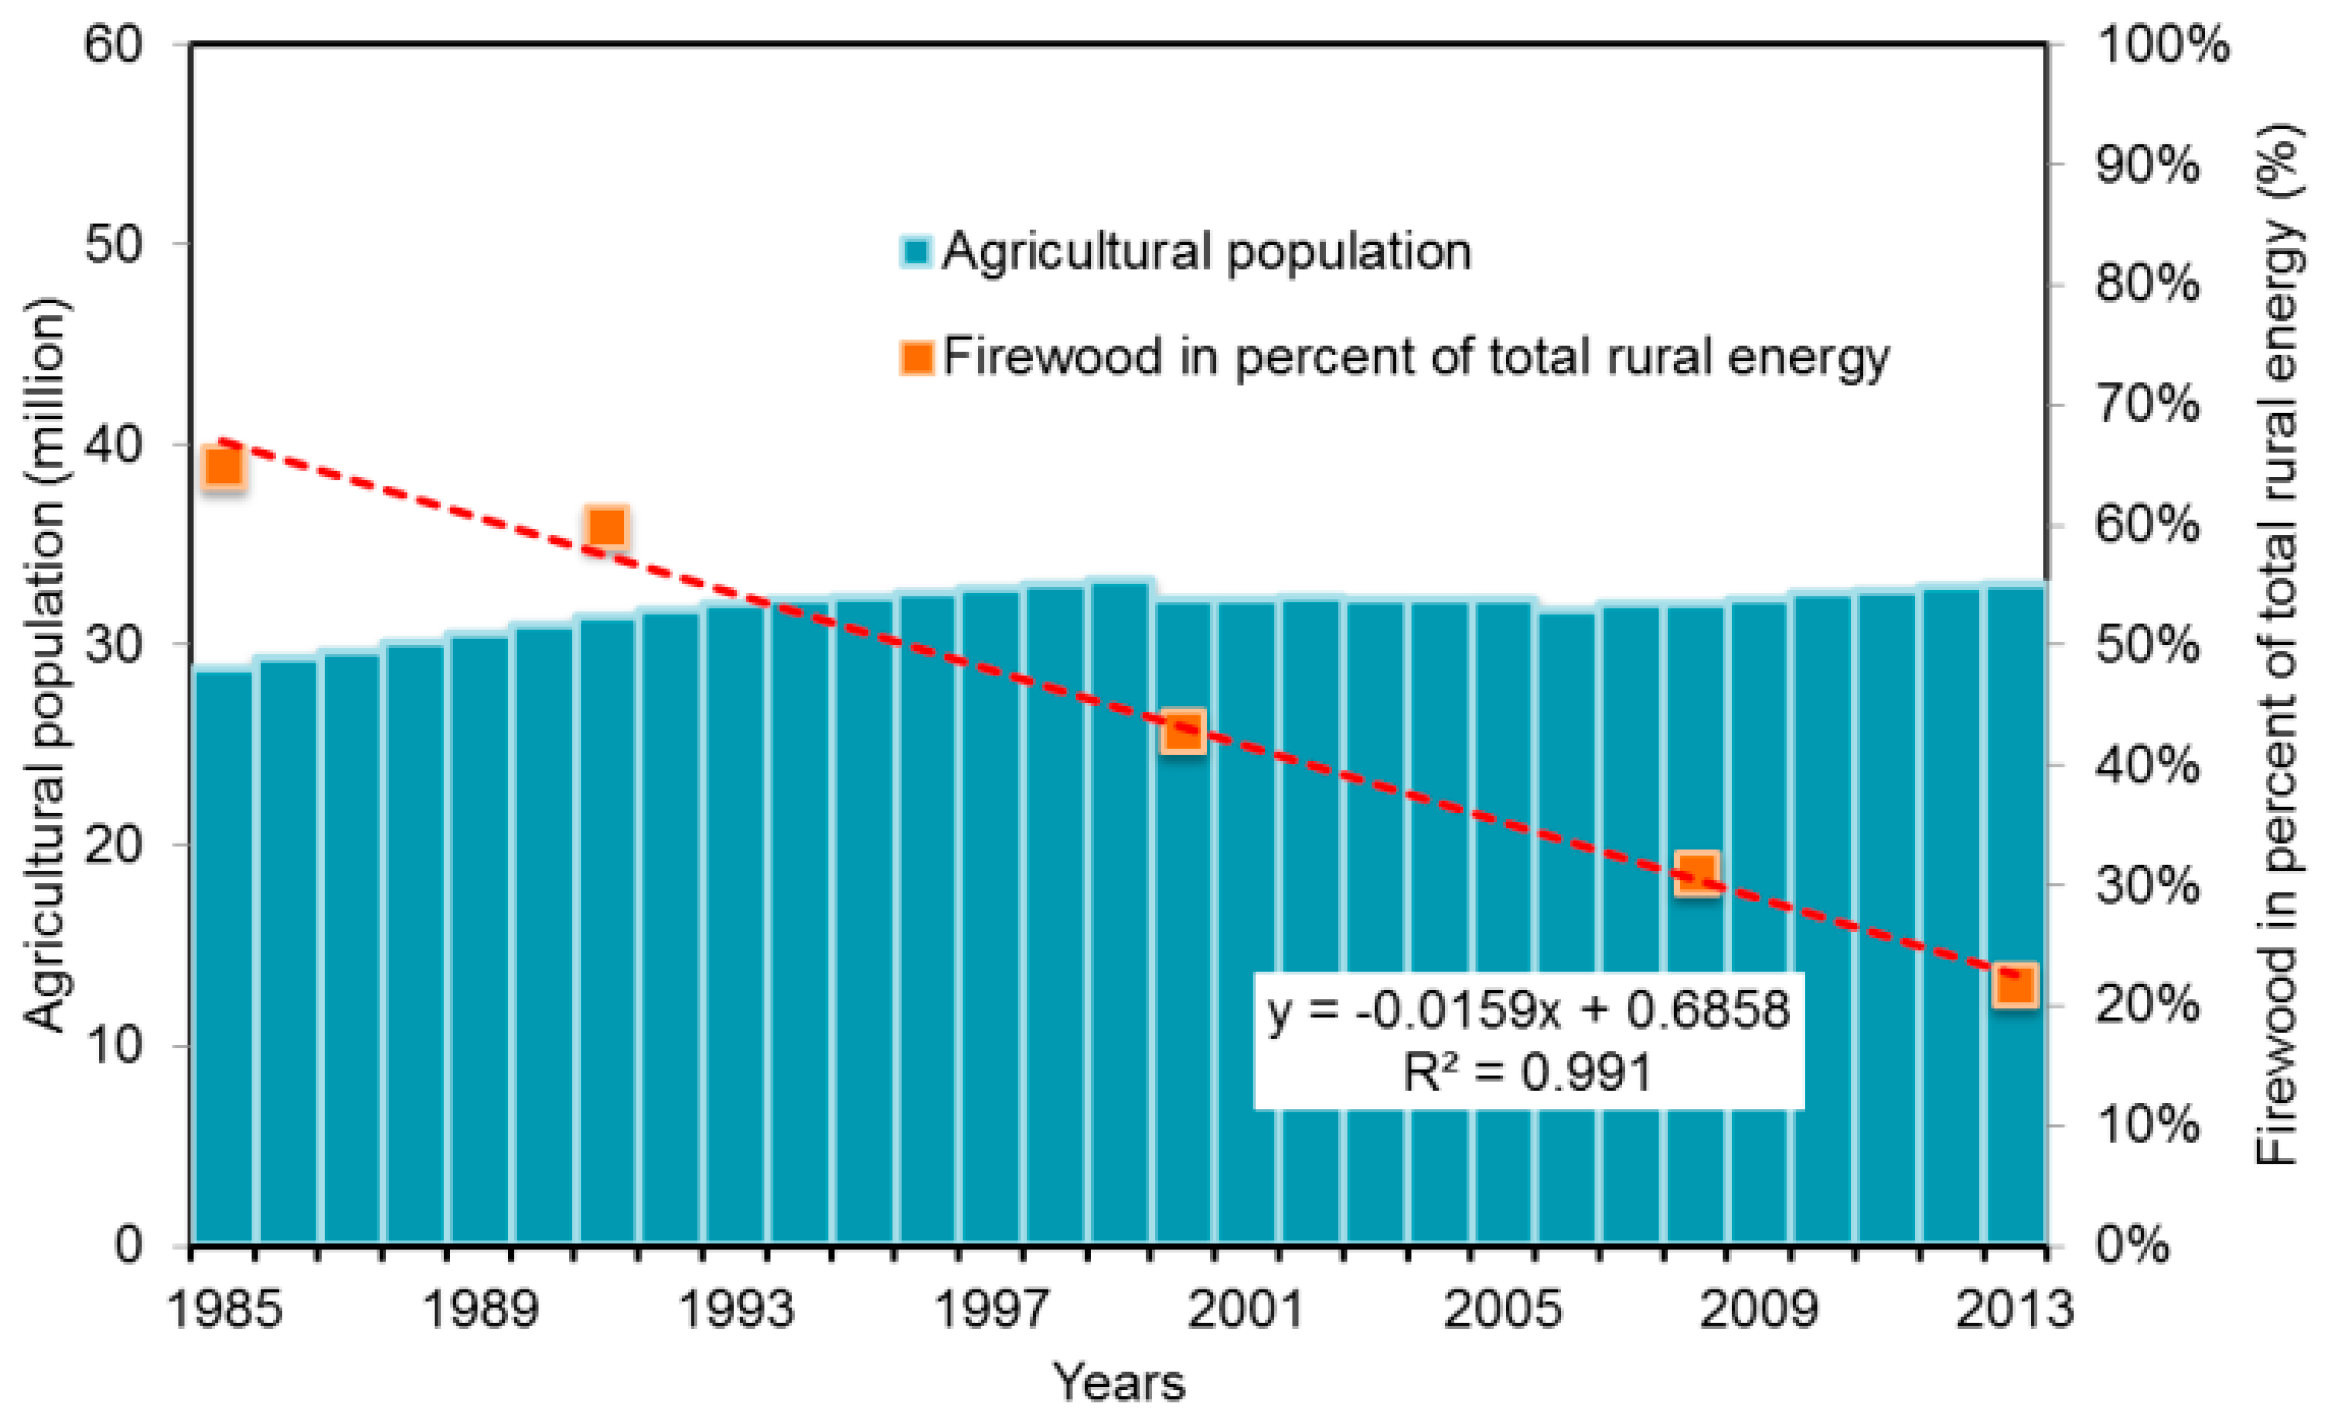
4.1. The Soil Erosion Effects of Roads Are Strongly Associated with the Historical Policy and Economic Development Stage of the Study Area

The indirect ecological effects of roads originate from the comprehensive influence of several factors (e.g., policy, ecological projects, the economic situation, and agricultural practices) that can generate a large-scale influence on ecological systems [9,27]. For example, deforested land reclamation may extend outward up to several kilometers from road baselines, greatly altering the surface landscape. However, these factors can change over time. Previous studies showed that the impacts of human activities on soil erosion (amelioration or deterioration) can be time dependent [28,29] in a given area.
Before 1990, Jiangxi Province (study area) was in an undeveloped phase, and tree felling and biomass fuels collecting (especially fire wood) were the most popular forestry resources utilization models in rural areas [30], and land reclamation of steep areas was not widely forbidden. For example, according to the regression equation fitted in Figure 6, 63.8% of total rural energy came from wood-cutting. At that time, the wood-cutting industry obtained governmental approval, partly because of low economic level (fossil fuels, such as coal and oil were relatively expensive). Those human activities were closely related to road accessibility, which was manifested in our study: Severer soil erosion was more likely to occur in areas closer to road baselines (Figure 4a) or with high road densities (Figure 5a). Therefore, before 1990 (lacking a substantial ecological restoration project), roads can be characterized as a contributor to forest shrinkage and the spread of soil erosion but also provide accessibility for local residents.
From 1990 to 2010, there was an obvious reduction in soil erosion. The Chinese government might serve a crucial role [33], and restrained illegal wood cutting and carried out several and ecological restoration programs over those 20 years. For instance, the “Returning Farmland to Forest” program (enforced in Jiangxi Province from 2000 to 2010) was one of the most important ecological projects of 21st century in China [16]. Previous study suggested that most soil erosion restoration programs have been implemented relatively close to areas with convenient transport facilities in China [34]. There was also rapid economic development, which prompted the implement of the project “sending electricity to the villages” in 2003 [31], and, thus, resulting in a reduction of firewood consumption. As seen in Figure 6, firewood, in percentage of total rural energy in the study area, decreased obviously, from 65% in 1985 to 21.7% in 2010. In contrast, the agricultural population had not significantly increased. Consequently, we believe that human activities have generated a generally positive effect on soil erosion control during 1990–2010, which can be corroborated by the obvious reduction in soil erosion in the areas alongside the road baselines (Figure 4c) and in counties with a high road density (Figure 5b) in our study. In this case, roads played a prompting role for soil erosion reduction.
The role change of roads in soil erosion control (from “negative” to “positive”) enables us to conclude that studying the indirect ecological effects of roads should be based on a good acknowledgement of the time background of the study area.

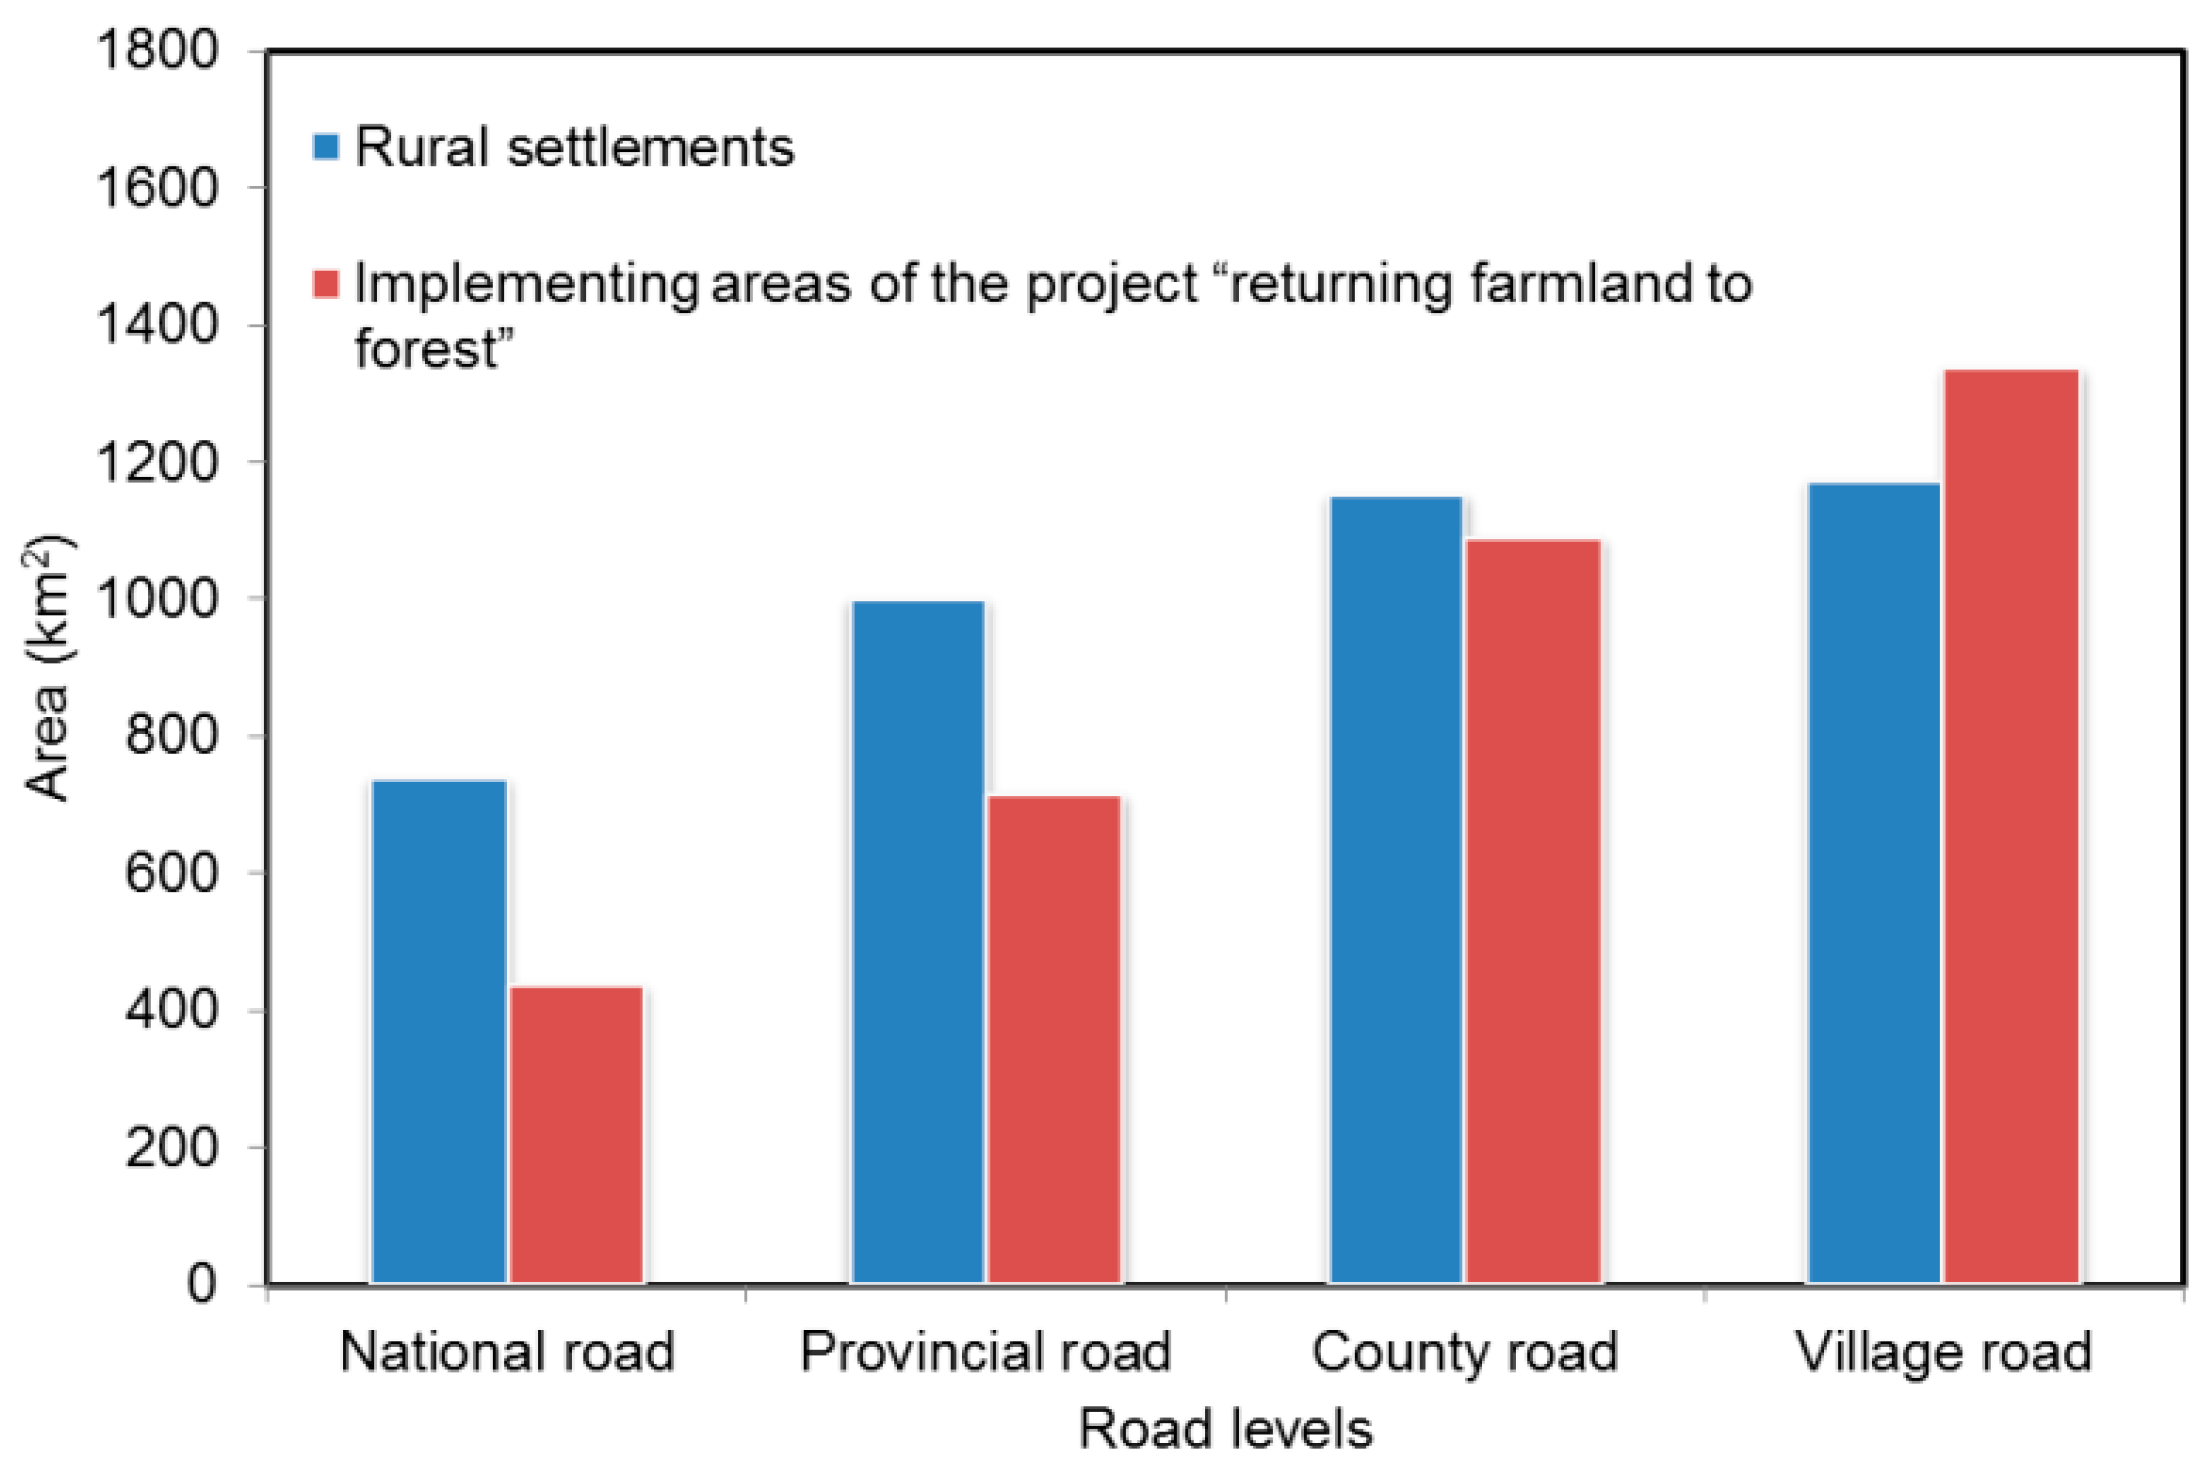
4.2. The Soil Erosion Effects of Road Vary in Different Road Levels

From a large-scale perspective, the area of land that can be ecologically affected by roads is possibly vast. The four levels of roads differing in transport function and spatial patterns, might have different combinations of driving factors in road-affected zones, such as land use, topography, and soil property, which can all significantly influence soil erosion evolution [14,29,35]. This is a theoretical explanation for the variations in soil erosion effects among the four levels of roads.
As shown in the Result, among the four levels of roads (national, provincial, county, and village), village roads can generate a greater influence on soil erosion than the other three levels of roads. These may be due to the special transport functions and spatial distributions of village road. Differing from national, provincial, and county roads, village roads are a fundamental auxiliary facility for human activities in vast rural areas. Previous studies have pointed out that the amelioration or deterioration of soil erosion in a given region is closely related to the behavior of local peasants [11,36,37]. Land slope, as a natural key factor, has a considerable impact on soil erosion by promoting surface runoff and limiting the growth of plants [38,39]. Studies have demonstrated that the relatively sharper slope in rural areas also amplify the amelioration or deterioration of soil erosion [40]. In this paper, we have investigated the spatial patterns of slope and rural settlements alongside the roads of four levels. As shown in Figure 4d, the slopes tend to be steeper with increasing distance to the road baseline. The order of the mean slope alongside the roads of the four levels is: Village road > county road > provincial road > national road. In addition, as illustrated by spatial data concerning rural settlements (in the year of 2010) and implementing areas of the ecological project from 1990 to 2010, provided by IGSNRR, the buffer strip (0–8) km from village roads had the largest area of rural settlements and implementation areas of the project “Returning Farmland to Forest” (Figure 7). It is well known that settlements can largely dominate the distribution patterns of human activity intensity [41,42,43]; therefore, in Jiangxi Province, village roads can be more crucial for soil erosion evolution than other levels of roads by closely linking to steeper slopes and stronger anthropogenic ecology disturbances. In the same way, we can reasonably identify the weak influence of national and provincial roads on soil erosion and that the affecting ability of county roads falls between village roads and national/provincial roads.
Although recent research concerning the impacts of roads on soil erosion mainly focus on the direct impacts of roads, such as sediment delivery caused by road-concentrated flow [44,45], our study revealed the importance of the indirect role of roads on soil erosion evolution by conducting a buffer analysis and regression analysis. It is notable that the studies addressing the relationship between roads and landscapes have achieved great progress [2,4,9,10], and the landscape is crucial for soil erosion process at a large scale [29]. We believe that the utilization of this progress incorporating a more efficient method, such as multiple regression or structural equation modeling, could greatly promote future research.

5. Conclusions

In this paper, by utilizing the RUSLE model and remote sensing data, we estimated the spatial annual soil erosion rate in Jiangxi Province for the years 1990 and 2010, respectively. It was found that there was an obvious reduction of soil erosion with mean annual soil erosion rates decreasing from 930.8 t·km−2·a−1 in 1990 to 522.0 t·km−2·a−1 in 2010. By combining the spatial analysis technology and regression analysis method, we revealed a relationship between annual soil erosion rates and distances to road and road density. The temporal and spatial distribution characteristics of artificial and natural driving factors of soil erosion along roads were also investigated. It was found that roads played a prompting role in soil erosion reduction over these 20 years. This can be partly explained by roads providing accessibility for substantial ecological restoration programs. The soil erosion effects of roads vary in different road levels. The most influential are those of villages. The indirect ecological effects of roads can be closely associated with policy and economic development situations in a given region, which makes it a necessity for researchers to have sufficient knowledge of the time background. This study provides a theoretical basis for soil conservation and road planning in Jiangxi Province and may promote the development of “Road Ecology” science.

Acknowledgments

The work was supported by the Project of the National Natural Science Foundation of China (41271173, 41301155) and a special project of the Ministry of Science and Technology (2012FY111800-01-01). Many thanks go to the anonymous reviewers for the comments on the manuscript.

Author Contributions

Linlin Xiao and Hongyan Cai designed this study, and Linlin Xiao was responsible for the writing. Xiaohuan Yang were responsible for the data collection and processing. All the authors were involved in result analyses and discussion.

Conflicts of Interest

The authors declare no conflict of interest.

References

  1. Coffin, A.W. From roadkill to road ecology: A review of the ecological effects of roads. J. Transp. Geogr. 2007, 15, 396–406. [Google Scholar] [CrossRef]
  2. Mo, W.B.; Wang, Y.; Zhang, Y.Z.; Zhuang, D.F. Impacts of road network expansion on landscape ecological risk in a megacity, China: A case study of Beijing. Sci. Total Environ. 2017, 574, 1000–1011. [Google Scholar] [CrossRef] [PubMed]
  3. Cai, X.J.; Wu, Z.F.; Cheng, J. Using kernel density estimation to assess the spatial pattern of road density and its impacts on landscape fragmentation. Int. J. Geogr. Inf. Sci. 2013, 27, 222–230. [Google Scholar] [CrossRef]
  4. Martín, B.; Ortega, E.; Otero, I.; Arce, R.M. Landscape character assessment with GIS using map-based indicators and photographs in the relationship between landscape and roads. J. Environ. Manag. 2016, 180, 324–334. [Google Scholar] [CrossRef] [PubMed]
  5. Ji, S.N.; Jiang, Z.G.; Li, L.L. Impact of different road types on small mammals in Mt. Kalamaili Nature Reserve. Transp. Res. Part D 2017, 50, 223–233. [Google Scholar] [CrossRef]
  6. Trombulak, S.C.; Frissell, C.A. Review of ecological effects of roads on terrestrial and aquatic communities. Conserv. Biol. 2002, 14, 18–30. [Google Scholar] [CrossRef]
  7. Saeki, M.; Macdonald, D.W. The effects of traffic on the raccoon dog (Nyctereutes procyonoides viverrinus) and other mammals in Japan. Biol. Conserv. 2004, 118, 559–571. [Google Scholar] [CrossRef]
  8. Lee, M.L.; Power, S.A. Direct and indirect effects of roads and road vehicles on the plant community composition of calcareous grasslands. Environ. Pollut. 2013, 176, 106–113. [Google Scholar] [CrossRef] [PubMed]
  9. Liu, S.L.; Dong, Y.H.; Deng, L. Forest fragmentation and landscape connectivity change associated with road network extension and city expansion: A case study in the Lancang River valley. Ecol. Indic. 2014, 36, 160–168. [Google Scholar] [CrossRef]
  10. Hu, X.S.; Zhang, L.Y.; Ye, L.M.; Lin, Y.H.; Qiu, R.Z. Locating spatial variation in the association between road network and forest biomass carbon accumulation. Ecol. Indic. 2017, 73, 214–223. [Google Scholar] [CrossRef]
  11. Morschel, J.; Fox, D.M.; Bruno, J.F. Limiting sediment deposition on roadways: Topographic controls on vulnerable roads and cost analysis of planting grass buffer strips. Environ. Sci. Policy 2004, 7, 39–45. [Google Scholar] [CrossRef]
  12. Altrichter, M.; Boaglio, G.I. Distribution and relative abundance of peccaries in the Argentine Chaco: Associations with human factors. Biol. Conserv. 2004, 116, 217–225. [Google Scholar] [CrossRef]
  13. Liang, Y.; Yang, X.; Su, C.L.; Sun, B.; Pan, X.Z. EI-based analysis of variation and trends of soil erosion of red soil region on a county scale. Acta Pedol. Sin. 2009, 46, 24–29. (In Chinese) [Google Scholar]
  14. Xiao, L.L.; Yang, X.H.; Cai, H.Y. Responses of Sediment Yield to Vegetation Cover Changes in the Poyang Lake Drainage Area, China. Water 2016, 8, 1–16. [Google Scholar] [CrossRef]
  15. Xiao, L.L.; Yang, X.H.; Chen, S.X.; Cai, H.Y. An assessment of erosivity distribution and its influence on the effectiveness of land use conversion for reducing soil erosion in Jiangxi, China. Catena 2015, 125, 50–60. [Google Scholar] [CrossRef]
  16. Deng, L.; Shangguan, Z.P.; Li, R. Effects of the grain-for-green program on soil erosion in China. Int. J. Sediment Res. 2012, 27, 120–127. [Google Scholar] [CrossRef]
  17. Xiao, L.L.; Yang, X.H.; Cai, H.Y. Cultivated land changes and agricultural potential productivity in Mainland China. Sustainability 2015, 7, 11893–11908. [Google Scholar] [CrossRef]
  18. Liu, J.Y.; Liu, M.L.; Tian, H.Q.; Zhuang, D.F.; Zhang, Z.X.; Zhang, W. Spatial and temporal patterns of China’s cropland during 1990–2000: An analysis based on Landsat TM data. Remote Sens. Environ. 2005, 98, 442–456. [Google Scholar] [CrossRef]
  19. Renard, K.G.; Foster, G.R.; Weesies, G.A.; McCool, D.K.; Yoder, D.C. Predicting Soil Loss by Water: A Guide to Conservation Planning with the Revised Soil Loss Equation (RSULE); US Department of Agriculture: Washington, DC, USA, 1997; Volume 703.
  20. Šúri, M.; Cebecauer, T.; Hofierka, J.; Fulajtár, E. Soil erosion assessment of Slovakia at a regional scale using GIS. Ekológia (Bratislava) 2002, 21, 404–422. [Google Scholar]
  21. Liu, B.Y.; Nearing, M.A.; Risse, L.M. Slope gradient effects on soil loss for steeps lopes. Trans. ASAE 1994, 37, 1835–1840. (In Chinese) [Google Scholar] [CrossRef]
  22. Sharpley, A.N.; Williams, J.R. (Eds.) EPIC-Erosion/Productivity Impact Calculator: 1. Model Documentation; United States Department of Agriculture: Washington, DC, USA, 1990; Volume 235.
  23. Cai, C.F.; Ding, S.W.; Shi, Z.H. Study of applying USLE and geographical information system IDRISI to predict soil erosion in small watershed. J. Soil Water Conserv. 2000, 14, 19–24. (In Chinese) [Google Scholar]
  24. Zhang, W.B.; Xie, Y. Rainfall erosivity estimation using daily rainfall amounts. Sci. Geogr. Sin. 2002, 22, 705–711. (In Chinese) [Google Scholar]
  25. Shu, H.; Jiang, M.X. Evaluating soil erosion in Jiangxi province with USLE model and remote sensing technology during 1995–2005. China Environ. Sci. 2011, 31, 1197–1203. (In Chinese) [Google Scholar]
  26. Ministry of Water Resources of the People’s Republic of China. Standards for Classification and Gradation of Soil Erosion (SL 190–2007); China Standards Press: Beijing, China, 2007.
  27. Ahn, K.H.; Merwade, V. Quantifying the relative impact of climate and human activities on streamflow. J. Hydrol. 2014, 515, 257–266. [Google Scholar] [CrossRef]
  28. Cebecauer, T.; Hofierka, T. The consequences of land-cover changes on soil erosion distribution in Slovakia. Geomorphology 2008, 98, 187–198. [Google Scholar] [CrossRef]
  29. Zhang, S.H.; Fan, W.W.; Li, Y.Q. The influence of changes in land use and landscape patterns on soil erosion in a watershed. Sci. Total Environ. 2017, 574, 34–45. [Google Scholar] [CrossRef] [PubMed]
  30. Shi, X.Z.; Liang, Y.; Gong, Z.T. Biological practices and soil conservation in Southern China. J. Crop Prod. 2000, 3, 41–48. [Google Scholar] [CrossRef]
  31. Zhang, L.X.; Hu, Q.H.; Wang, C.B. Rural energy in China: Pattern and policy. Trans. Chin. Soc. Agric. Eng. 2011, 27, 1–9. [Google Scholar] [CrossRef]
  32. Wang, X.H.; Hao, X.R.; Jin, L. Study on rural household energy consumption in China based on household investigation from typical counties. Trans. Chin. Soc. Agric. Eng. 2014, 30, 206–212. [Google Scholar]
  33. Shi, X.Z.; Wang, K.; Warner, E.D.; Yu, D.S.; Wang, H.J.; Yang, R.W.; Liang, Y.; Shi, D.M. Relationship between soil erosion and distance to roadways in undeveloped areas of China. Catena 2008, 72, 30–313. [Google Scholar] [CrossRef]
  34. Xu, E.Q.; Zhang, H.Q.; Li, M.X. Mining spatial information to investigate the evolution of karst rocky desertification and its human driving forces in Changshun, China. Sci. Total Environ. 2013, 458–460, 419–426. [Google Scholar] [CrossRef] [PubMed]
  35. Kosmas, C.; Gerontidis, S.T.; Marathianou, M. The effect of land use change on soils and vegetation over various lithological formations on Lesvos (Greece). Catena 2000, 40, 51–68. [Google Scholar] [CrossRef]
  36. Zhang, C.L.; Xie, S.H.; Zeng, J.L. Investigation on the state and prevention of artificial soil erosion in Jiangxi Province. Trans. CSAE 2008, 24, 54–57. (In Chinese) [Google Scholar]
  37. Boardman, J.; Bateman, S.; Seymour, S. Understanding the influence of farmer motivations on changes to soil erosion risk on sites of former serious erosion in the South Downs National Park, UK. Land Use Policy 2017, 60, 298–312. [Google Scholar] [CrossRef]
  38. Koulouri, M.; Giourga, C. Land abandonment and slope gradient as key factors of soil erosion in Mediterranean terraced lands. Catena 2007, 69, 274–281. [Google Scholar] [CrossRef]
  39. Li, M.A.; Yao, W.Y.; Li, Z.B.; Liu, P.L.; Shen, Z.Z. Effects of landforms on the erosion rate in a small watershed by the 137Cs tracing method. J. Environ. Radioact. 2010, 101, 380–384. [Google Scholar] [CrossRef] [PubMed]
  40. Feng, X.M.; Wang, Y.F.; Chen, L.D.; Fu, B.J.; Bai, G.S. Modeling soil erosion and its response to land-use change in hilly catchments of the Chinese Loess Plateau. Geomorphology 2010, 118, 239–248. [Google Scholar] [CrossRef]
  41. Narayanaraj, G.; Wimberly, M.C. Influences of forest roads on the spatial patterns of human- and lightning-caused wildfire ignitions. Appl. Geogr. 2012, 32, 878–888. [Google Scholar] [CrossRef]
  42. Chas-Amil, M.L.; Touza, J.; García-Martínez, E. Forest fires in the wildland-urban interface: A spatial analysis of forest fragmentation and human impacts. Appl. Geogr. 2013, 43, 127–137. [Google Scholar] [CrossRef]
  43. Dotterweich, M.; Stankoviansky, M.; Minár, J.; Koco, Š.; Papčo, P. Human induced soil erosion and gully system development in the Late Holocene and future perspectives on landscape evolution: Myjava Hill Land, Slovakia. Geomorphology 2013, 201, 227–245. [Google Scholar] [CrossRef]
  44. Parsakhoo, A.; Lotfalian, M.; Kavian, A. Prediction of the soil erosion in a forest and sediment yield from road network through GIS and SEDMODL. Int. J. Sediment Res. 2014, 29, 118–125. [Google Scholar] [CrossRef]
  45. Liu, Y.J.; Hu, J.M.; Wang, T.W. Effects of vegetation cover and road-concentrated flow on hillslope erosion in rainfall and scouring simulation tests in the Three Gorges Reservoir Area, China. Catena 2016, 136, 108–117. [Google Scholar] [CrossRef]
Figure 1. Geographic location of Jiangxi Province. The detail shows the Digital Elevation Model of the study area.
Sustainability 09 00129 g001
Figure 2. Roads of various levels and survey sites.
Sustainability 09 00129 g002
Figure 3. Soil erosion maps of Jiangxi Province, (a) 1990; (b) 2010.
Sustainability 09 00129 g003
Figure 4. Distribution of soil erosion and slopes of land surfaces alongside roads belonging to four levels. (a) Soil erosion in 1990; (b) soil erosion in 2010; (c) soil erosion change from 1990 to 2010; (d) slope of land surface alongside the four levels of roads.
Sustainability 09 00129 g004
Figure 5. The scatter map of road density and annual soil erosion rate. (a) Relationship between mean the Annual Soil Erosion Rate (MASER) and total road density in 1990; (b) relationship between MASER and total road density in 2010; (c) relationship between change of MASER and national road density; (d) relationship between change of MASER and provincial road density; (e) relationship between change of MASER and county road density; (f) relationship between change of MASER and village road density.
Sustainability 09 00129 g005aSustainability 09 00129 g005b
Figure 6. Agricultural population and firewood consumption in the study area. The agricultural population data were extracted from the Jiangxi Statistics Yearbook from 1985 to 2013. The firewood consumption data were extracted from the studies of Zhang et al. [31] and Wang et al. [32].
Sustainability 09 00129 g006
Figure 7. Area of rural settlements (2010) and implementing areas of the project “Returning Farmland to Forest” (1990–2010) distributed in a buffer strip 0–8 km from the road.
Sustainability 09 00129 g007
Table 1. Descriptions for each level road.
Road LevelsDescription
NationalMain roadways providing access between important political and large economic centers.
ProvincialMain roadways connecting political cities, economic centers, and large mining areas.
CountyMain roadways providing access from the county seats to other counties or undeveloped cities.
VillageBranch roads linking villages and relating closely to the daily lives of rural residents.
Table 2. Input factors for the Revised Universal Soil Loss Equation (RUSLE).
FactorsInput DataMethod
RMeteorological dataZhang and Xie, 2002 [24]
KSoil survey dataSharpley and Williams, 1990 [22]
LSDigital Elevation ModelLiu et al., 1994 [21]
CNDVICai et al., 2000 [23]
PLand use mapShu and Jiang, 2011 [25]
Table 3. Description of the soil erosion and its changes.
Erosion DegreesArea (km2)Area Change (km2)Relative Change a (%)
19902010
Tolerable121,463139,95318,49015.2
Slight25,16414,675−10,489−41.6
Medium11,8238076−3,747−31.6
Strong63843307−3077−48.2
Very strong1330793−537−40.3
Destructive755115−640−84.7
a relative change expressed as percentages is defined as the ratio of “area change” to “area in 1990”.
Table 4. Interaction between soil erosion and distance to roads.
YearRoad LevelsCorrelation ModelR2p
1990NationalY = −19.11X + 1025.20.520.027
ProvincialY = −18.12X + 1008.40.740.003
CountyY = −23.70X + 1120.50.770.002
VillageY = −53.80X + 1295.20.910.000
2010NationalY = −21.38X + 817.570.600.015
ProvincialY = −16.10X + 813.430.510.030
CountyY = −15.26X + 663.310.630.011
VillageY = −24.86X + 642.970.920.000
Note: Y is annual soil erosion rate (t·km2·a1); X is distance to roads (km); the degree of freedom (df) of the regression equations is 7.

