Article

The Impact of Morphological Features on Summer Temperature Variations on the Example of Two Residential Neighborhoods in Ljubljana, Slovenia

1
Faculty of Architecture, University of Ljubljana, Zoisova Street 12, 1000 Ljubljana, Slovenia
2
Department for Architecture, Faculty of Technical Sciences, University of Priština in Kosovska Mitrovica, Kneza Miloša Street 7, 38220 Kosovska Mitrovica, Kosovo
*
Author to whom correspondence should be addressed.
Sustainability 2017, 9(1), 122; https://doi.org/10.3390/su9010122
Submission received: 28 November 2016 / Revised: 6 January 2017 / Accepted: 12 January 2017 / Published: 14 January 2017
(This article belongs to the Special Issue Urban Heat Island)

Abstract

:
The study conducted in this paper is focused on a predominantly residential area of the City of Ljubljana—Koseze, which is characterized by generally favorable (bio)climatic conditions. Nonetheless, thermal satellite images showed that residential neighborhoods within the Koseze district display unexpected variations in summer temperatures. This observation called into question the benefits of existing bioclimatic features and indicated the need to investigate and compare two neighborhoods with similar urban parameters, with the aim to identify morphological differential characteristics impacting urban heat island (UHI) intensity. By applying the study methodology based on a literature review, surveys of key precedents, detailed mapping in two Koseze locations, in situ measurements, observations and recordings, thermal imagery, and the analyses of statistical data, as well as by defining the four main categories of morphological urban parameters—structure, cover, fabric and metabolism, it was concluded that both neighborhoods have common morphological elements mitigating the UHI effect. Additionally, it was found that the neighborhood with higher UHI intensity has several less favorable features, such as busier roads, larger surface of parking corridors, and the existence of underground parking space. The traffic as an element of urban morphology hence represents the main cause of differences among UHI levels in the two Koseze neighborhoods.

1. Introduction

Numerous negative manifestations of climate change, such as the changes in humidity, clouds, rain patterns, the strength and frequency of weather events (fog, snow, storms), and the damage done by weather [1], as well as the increase of air, ground and ocean temperature, being the direct response to global warming, progressively affect local and global environment. To restrain climate change it would be necessary to add ecosystem services to world business [2]. “Urban areas are especially vulnerable to high temperature, which will intensify in the future due to climate change” [3] (p. 1). Climate change, its local manifestations, and the features of a city itself together contribute to the occurrence of different negative alterations and phenomena such as the intensification of the urban heat island (UHI). UHI effect is a phenomenon where significant temperature difference between inner micro-climates of a city and their neighboring micro-climates can be perceived [4]. Increased ambience temperatures deteriorate the physical well-being of a city’s population, as a result of thermoregulatory system damage induced by heat stress in the form of heat syncope, thermal exhaustion, cardiovascular stress, cardiorespiratory diseases, and heat stroke [4].
The UHI effect in cities and its mitigation measures is the focus of many studies. According to Emmanuel and Loconsole [5], even when urban growth has subsided, the local warming that results from urban morphology (increased built cover, anthropogenic heat generation, pollution, lack of vegetation) generates local heat islands. O’Malley et al. [6] demonstrate that building form, orientation, and layout are among the most effective UHI mitigation strategies. Harnessing natural wind patterns in designing the layout of buildings and presence of water in the form of urban water bodies, such as ponds, are also suggested to reduce temperature. Furthermore, the use of high-albedo materials (light-colored paving tiles) is suggested for UHI mitigation [7]. Materials for pavements with low albedo, like asphalt, brick and stone, intensify the UHI phenomenon [8]. The reduction of surface temperatures of materials directly mitigates negative UHI effects. Increasing the albedo of the urban surfaces and planting trees could effectively mitigate the UHI phenomenon [9]. Huang and Ye [10] demonstrate the significance of vegetation in urban centers on the case study of Beijing. Urban vegetation and urban forest play an important role in decreasing LST (land surface temperature). “The apparent influence of urban vegetation and urban forest on LST varies with the spatial resolution of the imagery, and peaks at the resolutions ranging from 90 m to 120 m (ibidem)”. Vegetation makes the environment cooler through evaporation from the Earth’s surface and transpiration of the vegetation [8]. The UHI effect is mitigated by grass, shrubs (e.g., hedges of a height of 1.5 m), and trees of 5–10 m in height with dense crowns [6]. Oke’s model [11] approaches the heat island phenomenon both vertically and horizontally. According to the vertical scale, he defines different types as: Air UHI (Urban Canopy Layer UCL, and Urban Boundary Layer UBL), Surface UHI, and Subsurface UHI. The UCL encompasses the urban cover layer below the average height of buildings [12]. Discovering the microscale in urban areas can be clarified through the relationship between urban form, roofing materials, and UHI (including air and surface characteristics), with a particular reference on the impact to the morphology of a housing area.
Today, cities all over the world encounter the increase of UHI intensity, and so is the case with the City of Ljubljana, the largest urban area in Slovenia, where 13.87% of total country’s population reside (in 2016 Slovenia had a population of 2,064,188) [13]. The City of Ljubljana is located 46°03′20″ N/14°30′30″ E, at 298 m altitude, and has a total area of 274.99 km2 [8], with 287,218 inhabitants [13]; the population density is 1044.4 inhabit./km2 [13]. The climate in Ljubljana is characterized by the transition between Mediterranean and Continental climates, with moderately cold winters (with temperatures below 3.9 °C [13]) and warm summers (with temperature up to 25 °C [14] (pp. 5–6)). During the winter months, the city area experiences the temperature inversion (often with heavy fog formation) [15]. The average annual temperature, in 2014, was 12.6 °C and annual precipitation was 1850.5 mm [16]. In Ljubljana, the average temperature in June 2016 was 19.9 °C, which is 0.8 °C above the long-term average (of the period 1981–2010) and within the limits of normal variability [14] (p. 6). The average soil temperature at a depth of 2 cm for June 2015 was 22.6 °C (at a depth of 10 cm and 100 cm it was 22.3 °C and 17.8 °C, respectively); for July 2015 it was 26.3 °C (at a depth of 10 cm and 100 cm it was 25.9 °C and 21.3 °C, respectively) [16]. The wind direction for June (in 2015) prevailed from SSW or W (at 2:00 p.m. with an average speed of 2.5 km/h; and at a 24-h average with an average speed of 1.2 km/h) [16].
UHI of Ljubljana is distinct, affected by different factors such as green areas, location, land use, types of building and roofing materials, layout of buildings, their energy efficiency, and other; some of Ljubljana’s districts are constantly warmer that others, and specific areas are definitive hot spots [17] (pp. 328–330). Referring to Komac [17], there are significant differences between the UHI index for urban (inner-city Ljubljana Bežigrad station, 46°07′ N, 14°52′ E, 299 m a.s.l.) and rural (rural station Brnik, 46°22′ N, 14°22′ E, 364 m a.s.l.) areas of Ljubljana [17]. The UHI intensity-cycle (calculated by Komac [17] for the period from 20 to 26 July 2011) of daily heating/nocturnal cooling reached the third highest value in the selected period (4.95 K) [17]. The wind varied from calm in the night/early morning time to having a top speed of around 2–3 m/s in the afternoon (both stations); air humidity was the lowest at that time (both stations). The weak SW wind and low humidity caused low night-time temperatures, especially at the rural station where the UHI intensity rose by 0.5–2 K [17] (pp. 363–365).
Nonetheless, a major part of the City of Ljubljana (Figure 1) is currently not intensively affected by the UHI phenomenon (Figure 2). In general, temperature variations in urban areas with a low UHI effect have not been studied sufficiently in the literature. The greatest attention is placed on the studies proving its existence and proposing methodologies for mitigating high UHI intensity. Thus the paper aims to address the following research questions: Is there a relationship between urban climate concentration and urban morphology in residential areas with low UHI, and if so, what are the differences in locations with similar parameters? Additionally, how to identify relevant research parameters when there is a multitude of indicators available?
Following the adoption of the master plan of urban development of Ljubljana in January 1966, there was an expansion of housing construction, which provided for the development in a shape of a five-pointed star whose vertices expand along the main access roads to the urban center. Housing development focused on two categories: neighborhoods with apartment blocks for concentration of large-scale population and residential areas on the outskirts with low buildings, corresponding, in structure, more to rural rather than urban areas. When studying the quality of the living environment in terms of impacts of temperature on UHI creation, we were mostly interested in the neighborhoods considered as high-quality products of Slovenian urban design and architecture. “In many cases the planning of residential buildings is no longer based on the fundamental elements which helped form the types of residential buildings (users’ basic needs, functional processes which dictate organization and gabarits of buildings and external spaces, location characteristics, etc.), but on other criteria (economic feasibility study, analysis of residents’ purchase power, allowed utilization of land for construction, etc.) which often fail to consider the complexity of programmes and spatial design of residential buildings” [18] (p. 138). On the other hand, citizen science and crowdsourced information offer new insights into the urban parameters and allow for collection of “large datasets [...] that would otherwise not be possible” [19] (p. 2). This also creates new, unexploited opportunities for the City of Ljubljana.
We limited our study to the period of modernist neighborhoods (1960–1985) and some contemporary examples built after 2000. Figure 3 shows that most of these areas had lower UHI (up to a maximum of 29.5 °C—a parameter defined by Pogačar [20] as a threshold value for detecting heat waves), which means that urban design of these neighborhoods, both modernist and contemporary, included environmental parameters which favorably affect the comfort of living. We investigated the relationship between urban morphology and overheating in terms of Oke’s [11] vertical scale: Air UHI, Surface UHI, and Subsurface UHI.

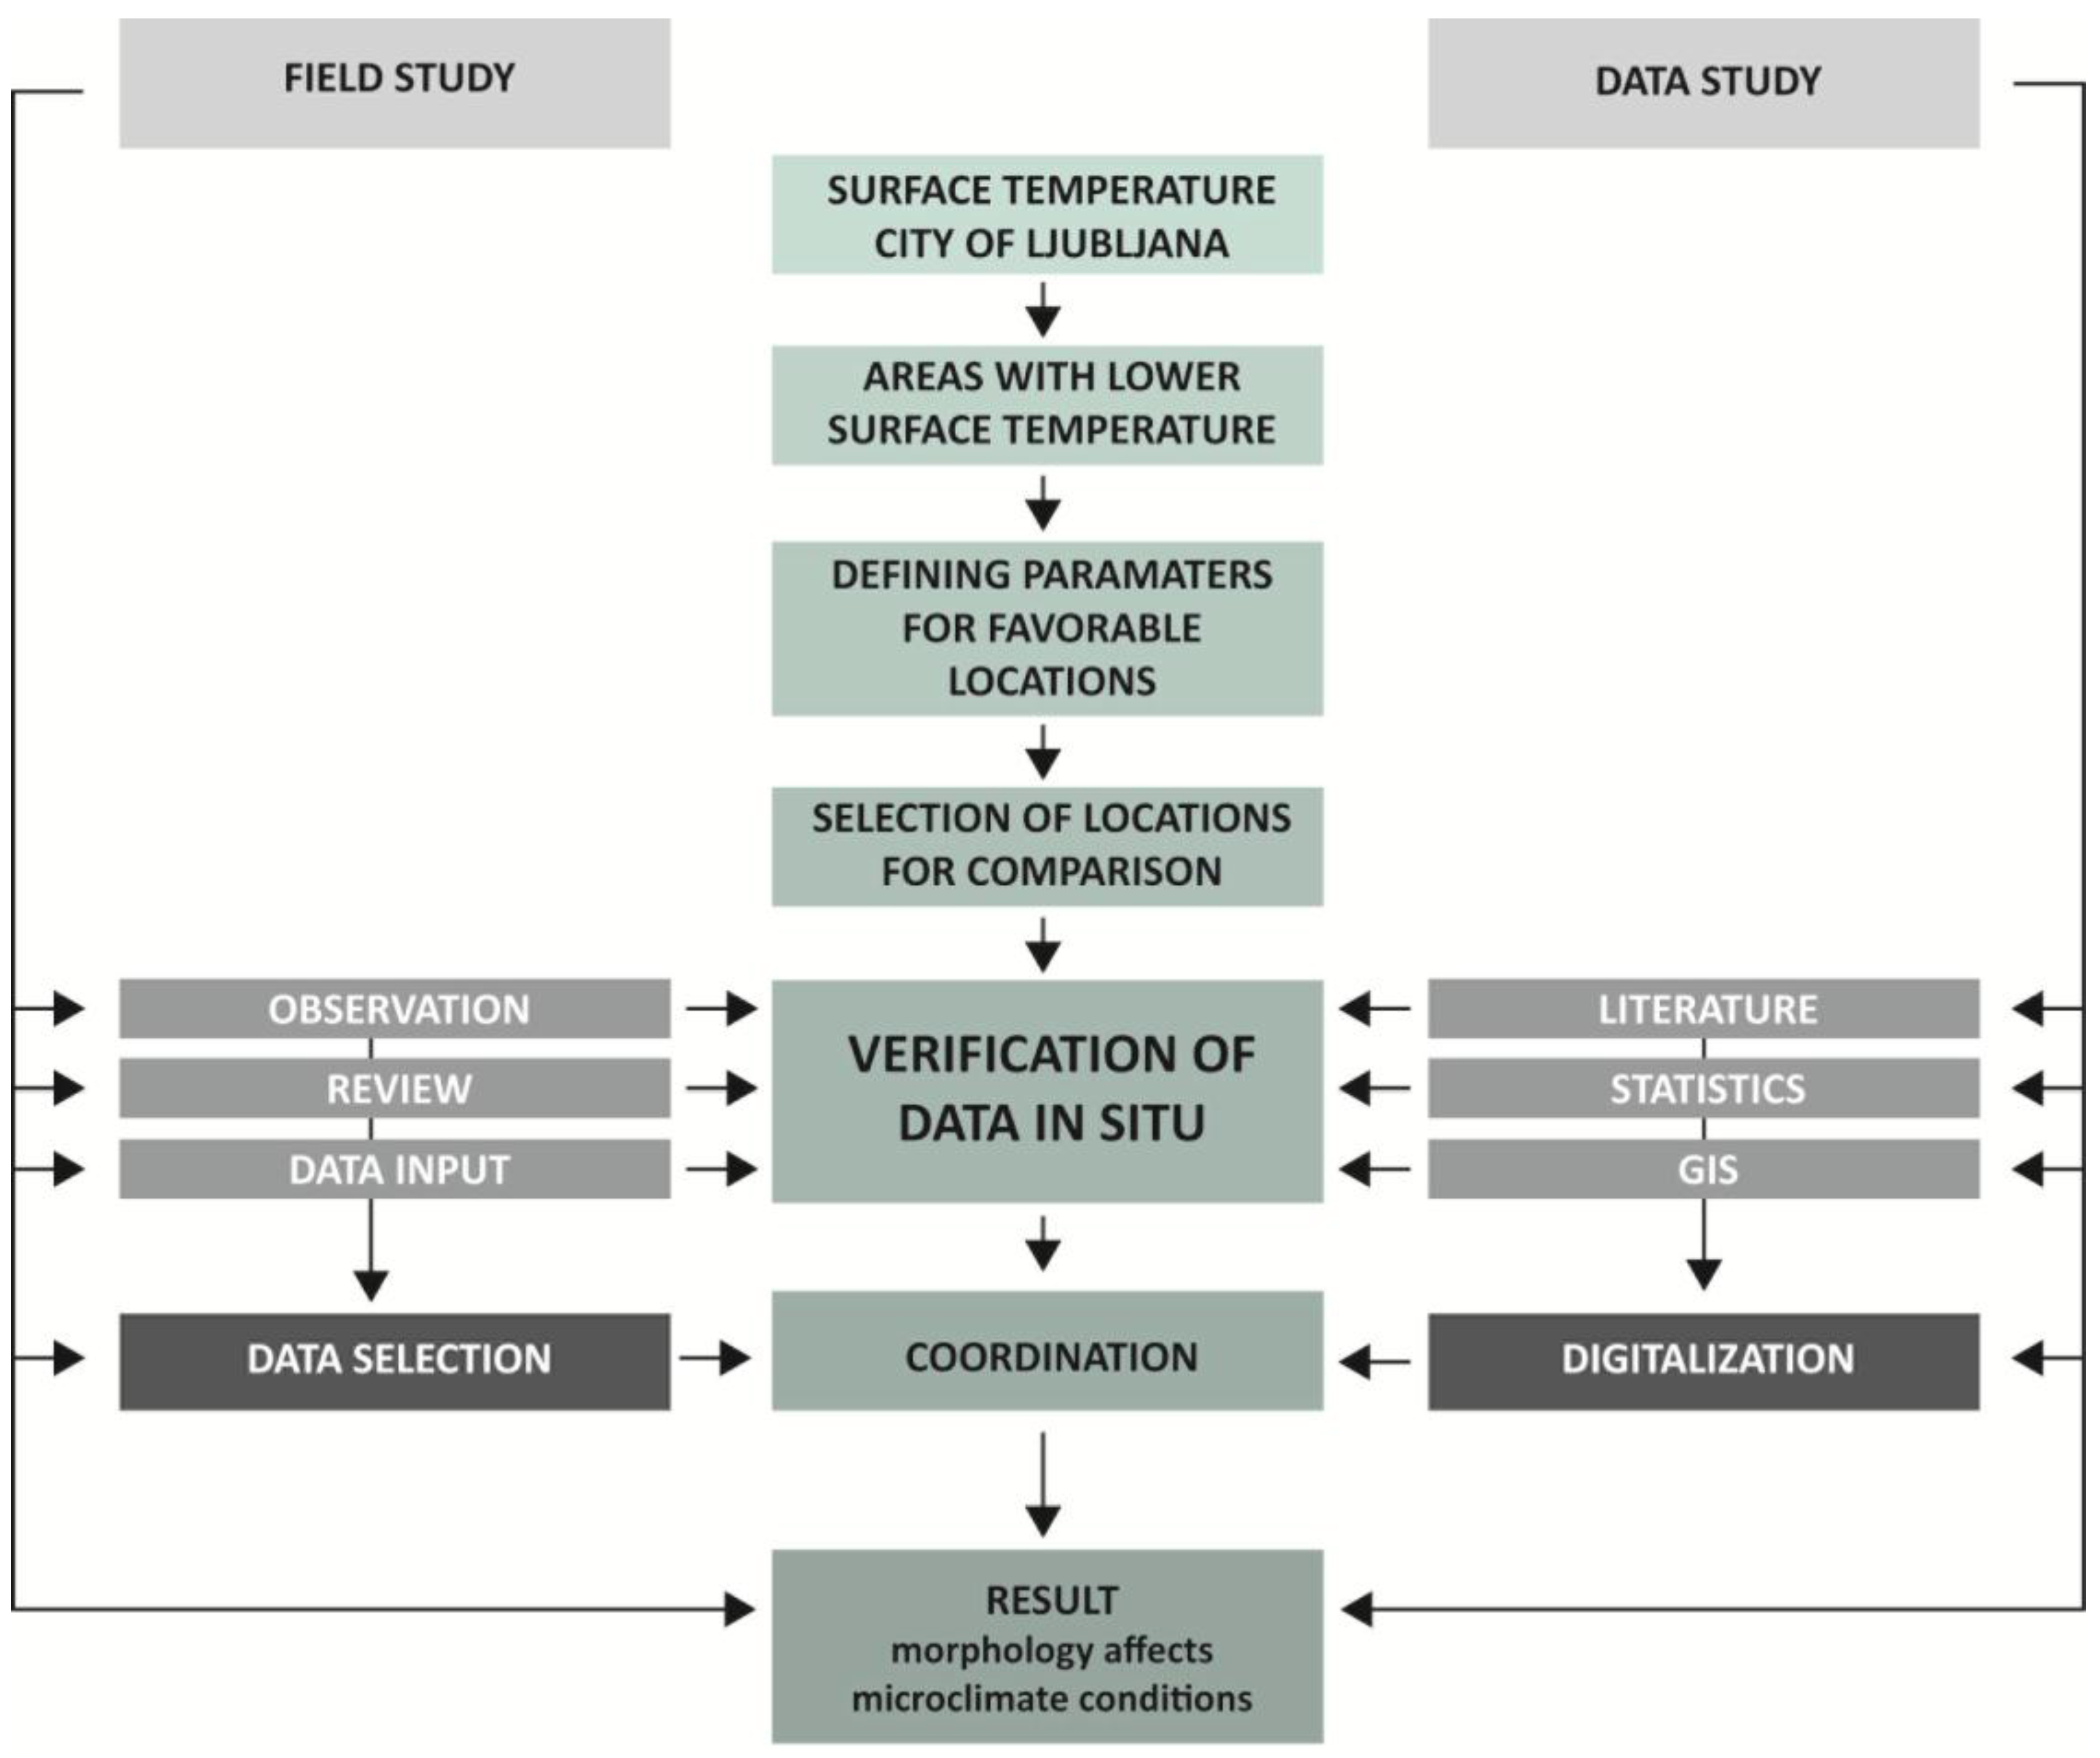
2. Materials and Methods
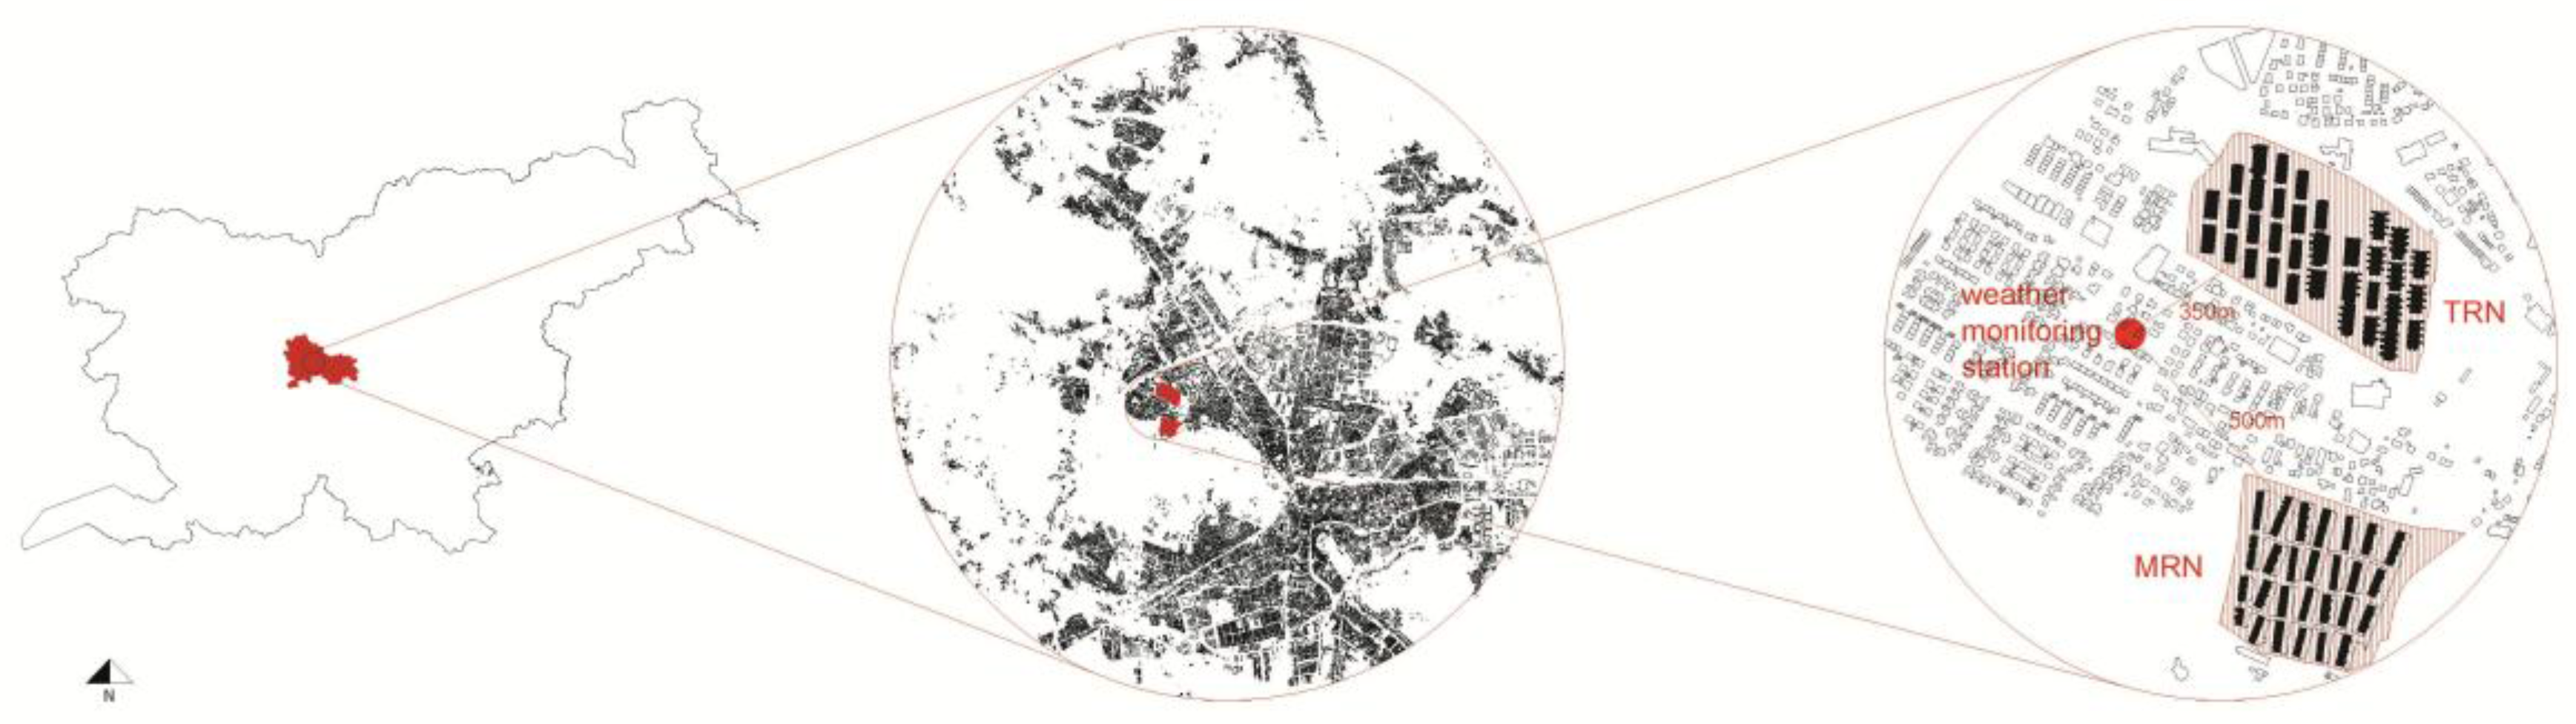
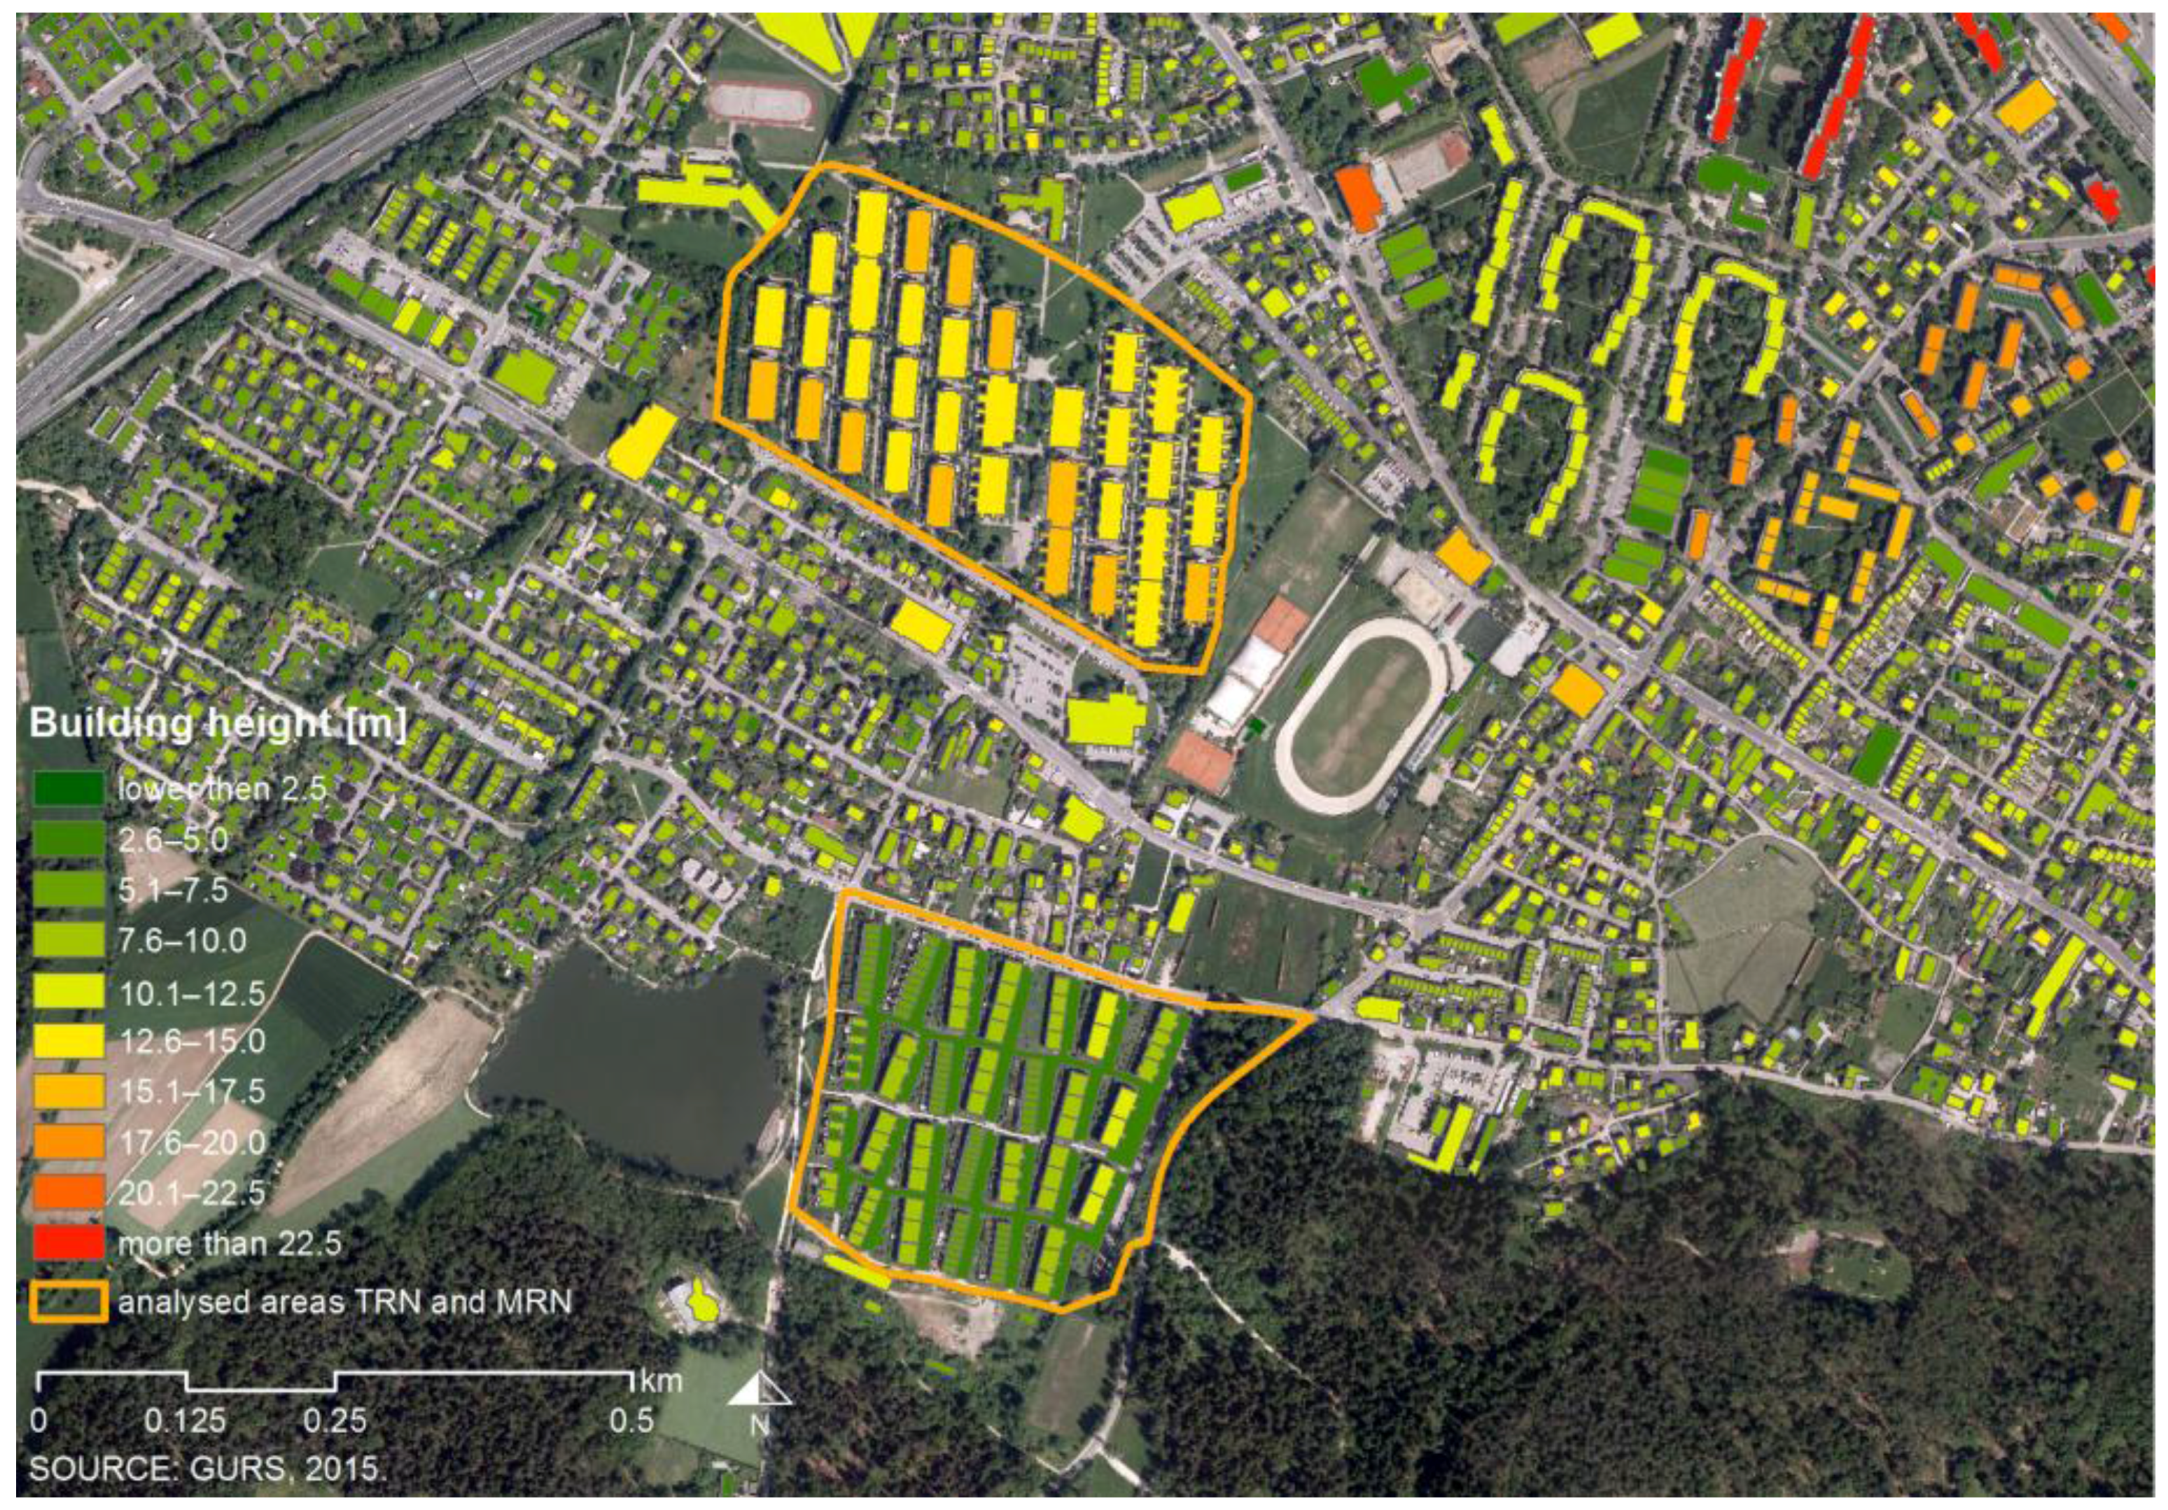
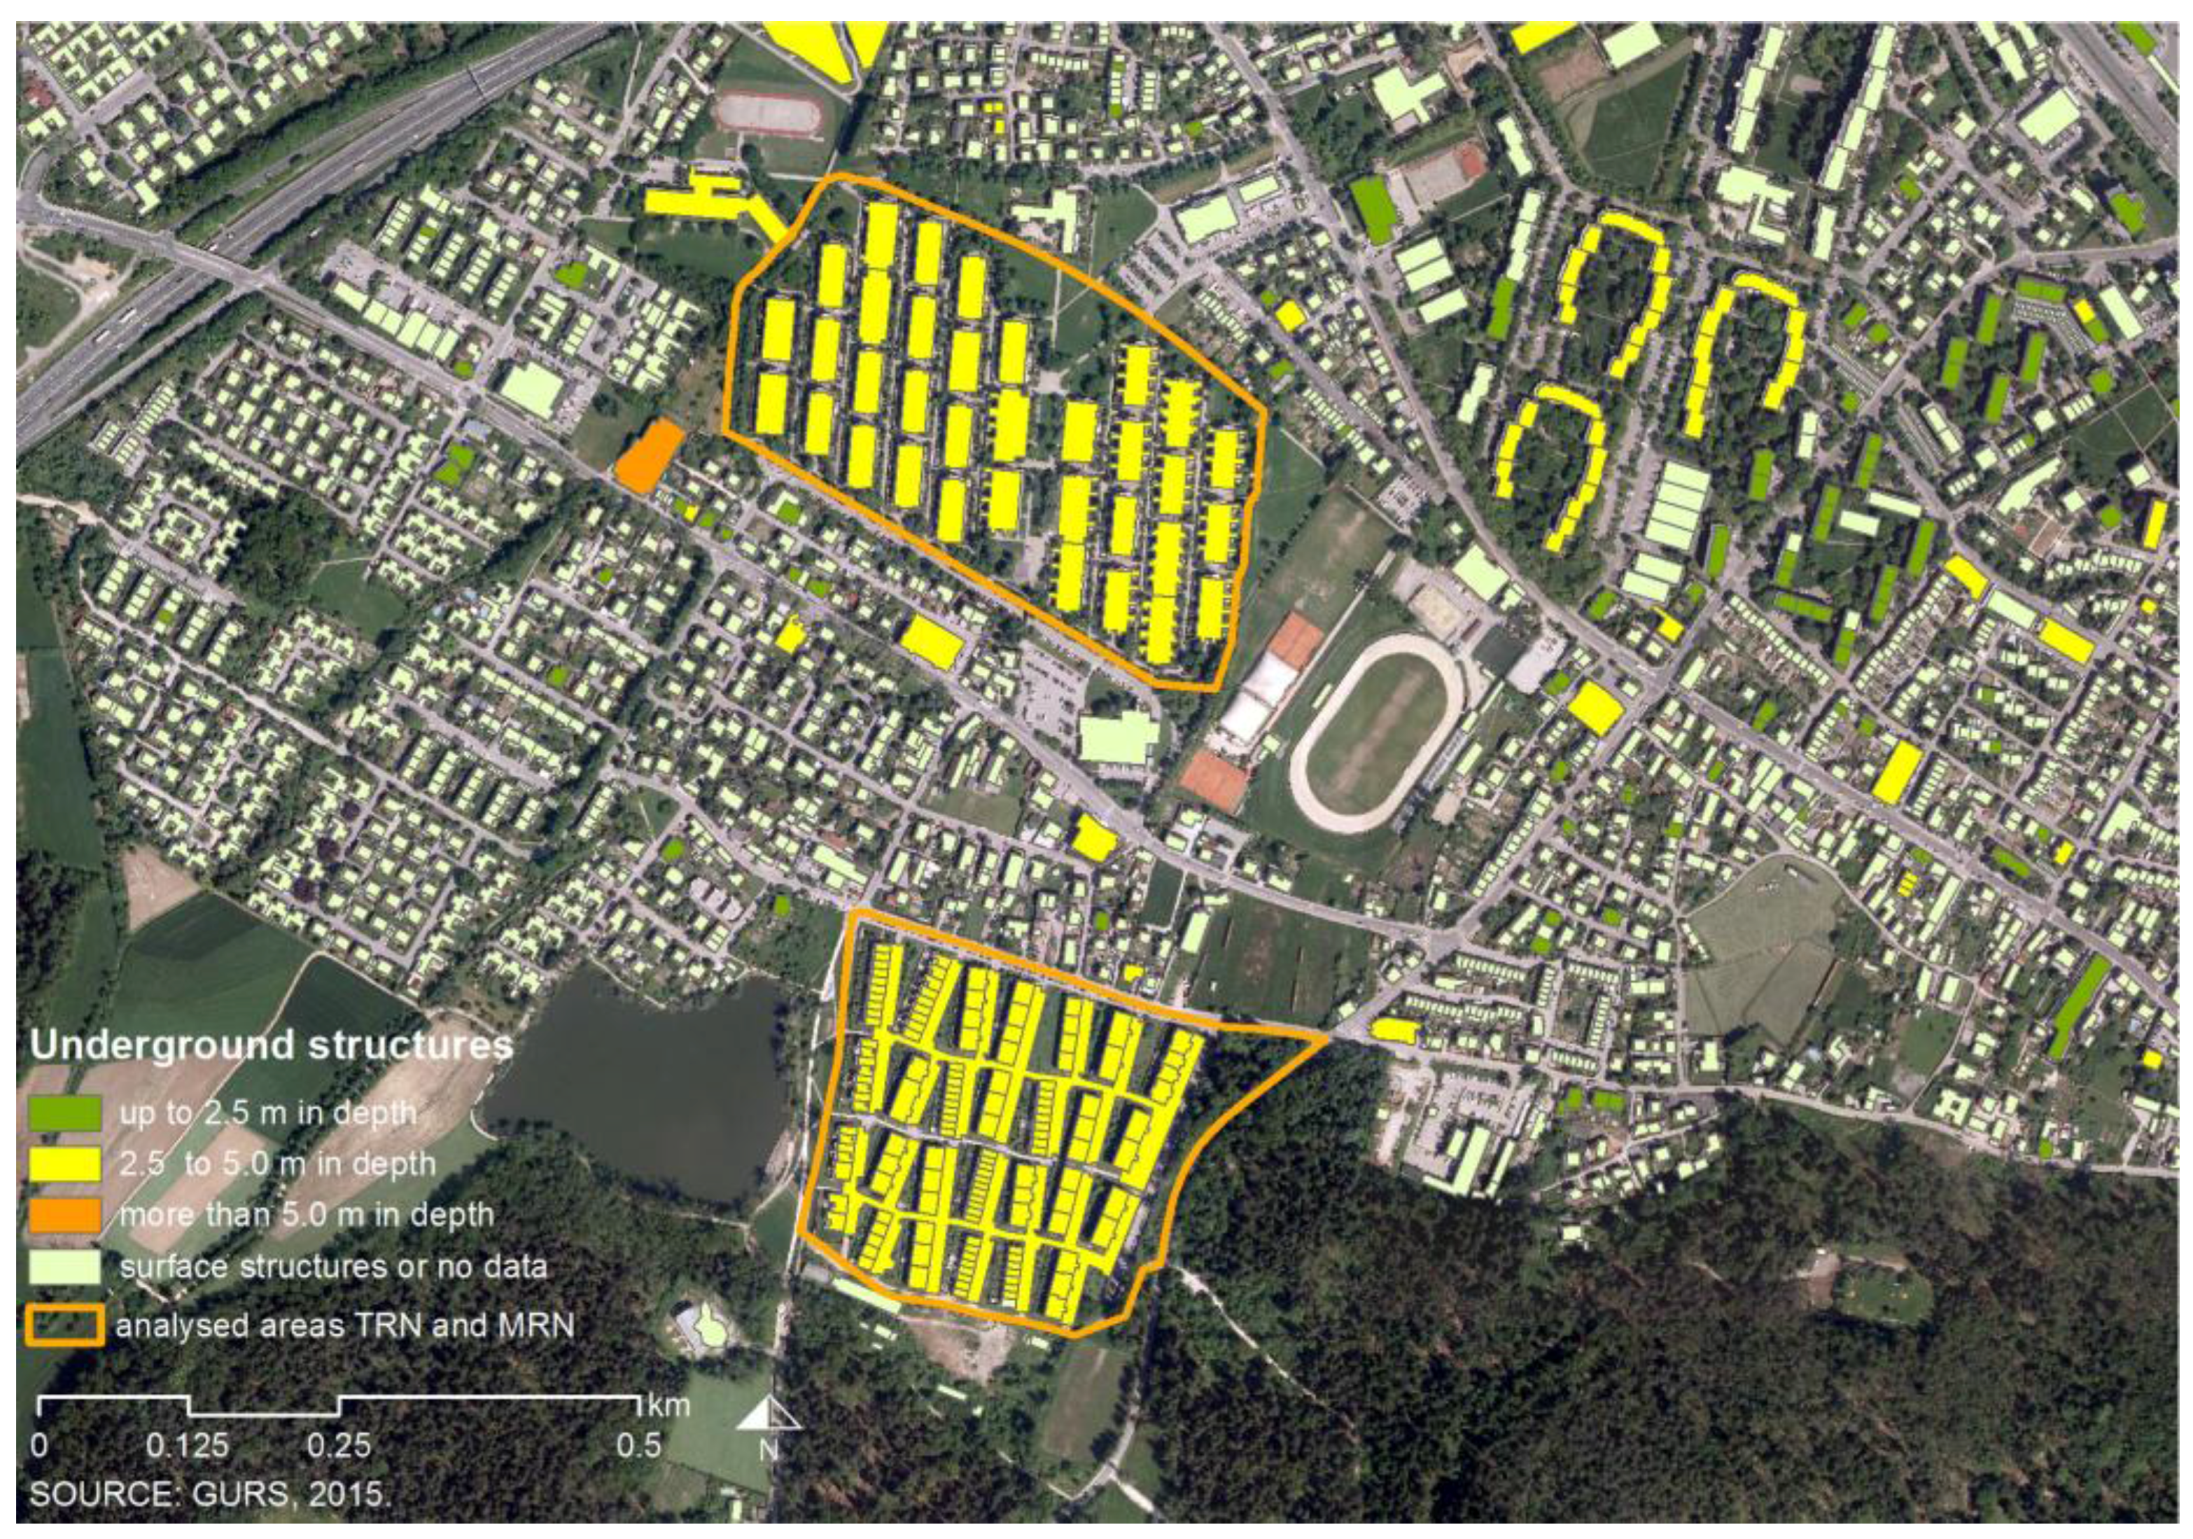
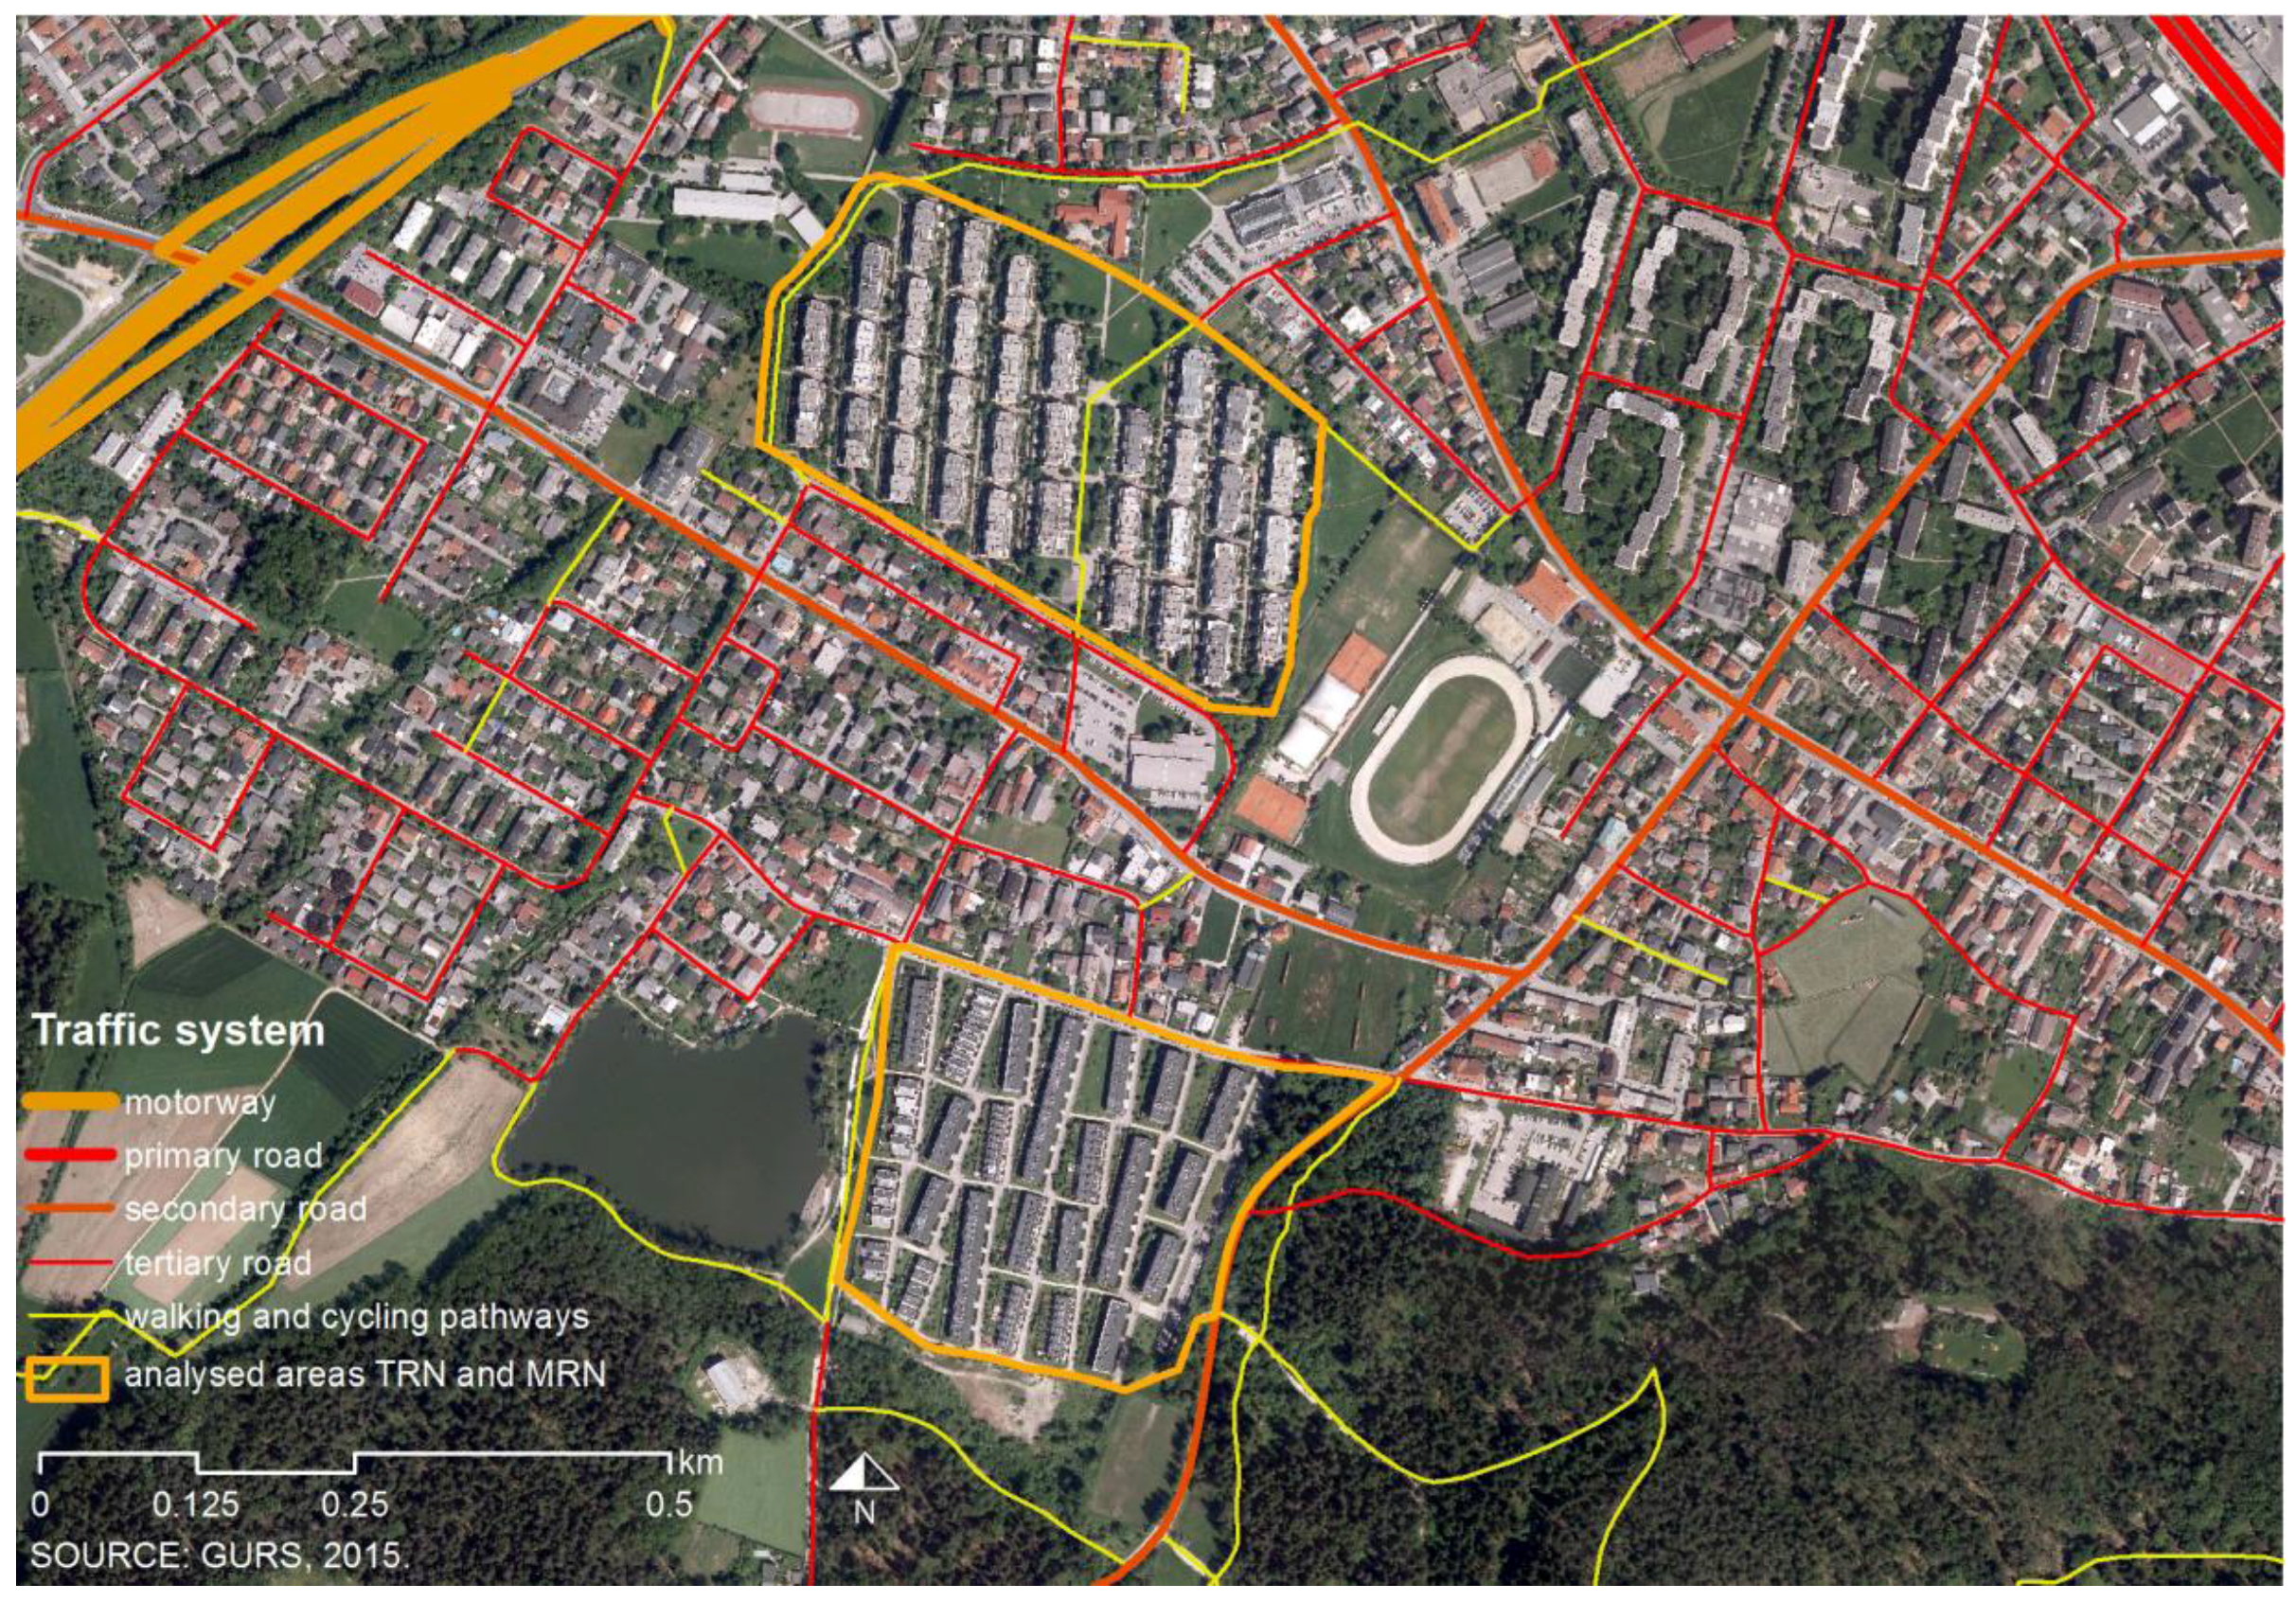
2.1. Study Area

To investigate the impact of morphological features on urban climate (temperature) across residential areas, two neighborhoods with similar urban parameters in Koseze, a district in Ljubljana, were selected (Figure 4 and Figure 5): a terraced residential neighborhood (hereinafter: TRN) and the Mostec residential neighborhood (hereinafter: MRN). Koseze is an area situated at NW of Ljubljana, characterized by generally favorable climate parameters, which are regarded as borders with the bioclimatic elements that regulate summer temperatures, i.e., the urban forest (Šišenski hrib) and the pond (Koseški bajer).
TRN/The terraced residential neighborhood (1974) was designed as a neighborhood of long, linear, and low residential buildings with terraces, containing in total 1564 apartments [21,22]. The idea of TRN was based on providing for high-quality living conditions and excluding car traffic from the pedestrian level. The terraced shape of the G+3 buildings with an inclined profile and atrium apartments on the ground floor is designed to blend with the building structure involving pedestrian-only streets between gardens [23]. The neighborhood is a composition of terraced blocks of the same design, which narrow down towards the top. So each apartment has its own outdoor space, a terrace. The parallel apartment blocks which are, in terms of their orientation, inclined at an angle of 5° (in NE–SW direction) are separated by “no-traffic” green belts. The Koseze terraced neighborhood was selected among 100 nationally significant architectural and urban design works of Slovenian Modernism of the 20th century, i.e., as part of the Slovenian cultural heritage [24]. In 2010, its population was 3251 [13] (Figure 6).
MRN/The Mostec residential neighborhood (2002) has a contemporary organic composition organised as a transition from the surrounding development to the green forest space. The area is characterized by the mix of various structures of social small-scale construction, natural surroundings, and the diverse architectural expression of buildings. Its urban design is based on the idea of a gradual softening at the contact of urban and green areas of the city outskirts with the introduction of urban belt-like features in a more natural space. This is undoubtedly a good solution in the sense of landscape organization and landscape protection criteria [25]. The exchange of building typologies creates a more authentic atmosphere within the neighborhood [25]. In 2010, its population was 858 [13] (Figure 6).
The UHI map for Koseze reveals that the MRN neighborhood, located in the immediate proximity of the urban forest (Šišenski hrib) and the pond (Koseški bajer), has higher UHI than the more distant TRN neighborhood with similar urban parameters (Figure 7). This put into question the impact of natural bioclimatic features on summer temperatures and underlined the need to thoroughly investigate and compare the two neighborhoods, i.e., to identify and describe those morphological differential characteristics that impact UHI intensity.

2.2. Methods and Tools

The initial question of this study was raised to identify urban morphological conditions of livable small communities in relation to thermal satellite imagery and the UHI effect. Are there any relations between UHI levels and urban design and planning in the two Koseze cases, or is the situation just an “accidental” outcome of the design solutions made? What is the significance of densities, floor space prescriptions, plot sizes or land use, and accessibility parameters? How important are single elements on the micro-scale, such as envelope materials and colors, openings, greenery, pavements, or water bodies?
The methodology employed for this study consists of a literature review, surveys of key precedents, and detailed mapping. The study into UHI changing and its impact on the comfort of living in an open space is focused on two levels at the micro-scale, including the correlation between urban morphology and climate change in open spaces or voids: (1) Interconnection of urban morphology and climate impacts through mapping and spatial analysis; (2) Observation of detailed climate parameters with an emphasis on temperature variability. We were particularly looking for, and studied, deviations, i.e., elements that do not follow the theoretical starting points.
The 95th percentile of the UHI appears well correlated with population density. In addition, there is an inverse proportionality between UHI and the percentage of surface area covered by green vegetation, although the relation with open water remains unclear [26]. Oke [11] defined four significant controls on urban climate including urban structure, urban cover, urban fabric, and urban metabolism (anthropogenic heat, water, and pollution). These four controls, playing important roles in creating certain urban climatic environments, are all related to urban morphology:
  • urban structure: urban density, dimensions of buildings and in-between spaces, street widths and spacing, building typology, programme (housing, mixed use), and the weighted density;
  • urban cover: fractions of built-up/paved/vegetated surfaces, vegetation type (tall vegetation impacts shadowing), bare soil and water;
  • urban fabric: type of materials, colors, materialized surface properties in terms of heat conduction, heat storage, and other;
  • urban metabolism: heat, water, and pollutants due to human activity on the micro scale (recording elements as: density of inhabitants in open space, air conditioning, rubbish bins, cars, open fires, and other).
This study articulates the elements of urban morphology, urban cover, urban fabric, and urban metabolism, with an emphasis on the changing of temperature comfort in the open space. Fundamentally, the study implements combined morphological research methodologies with statistics, field observations, and analyses in TRN and MRN neighborhoods, as follows:
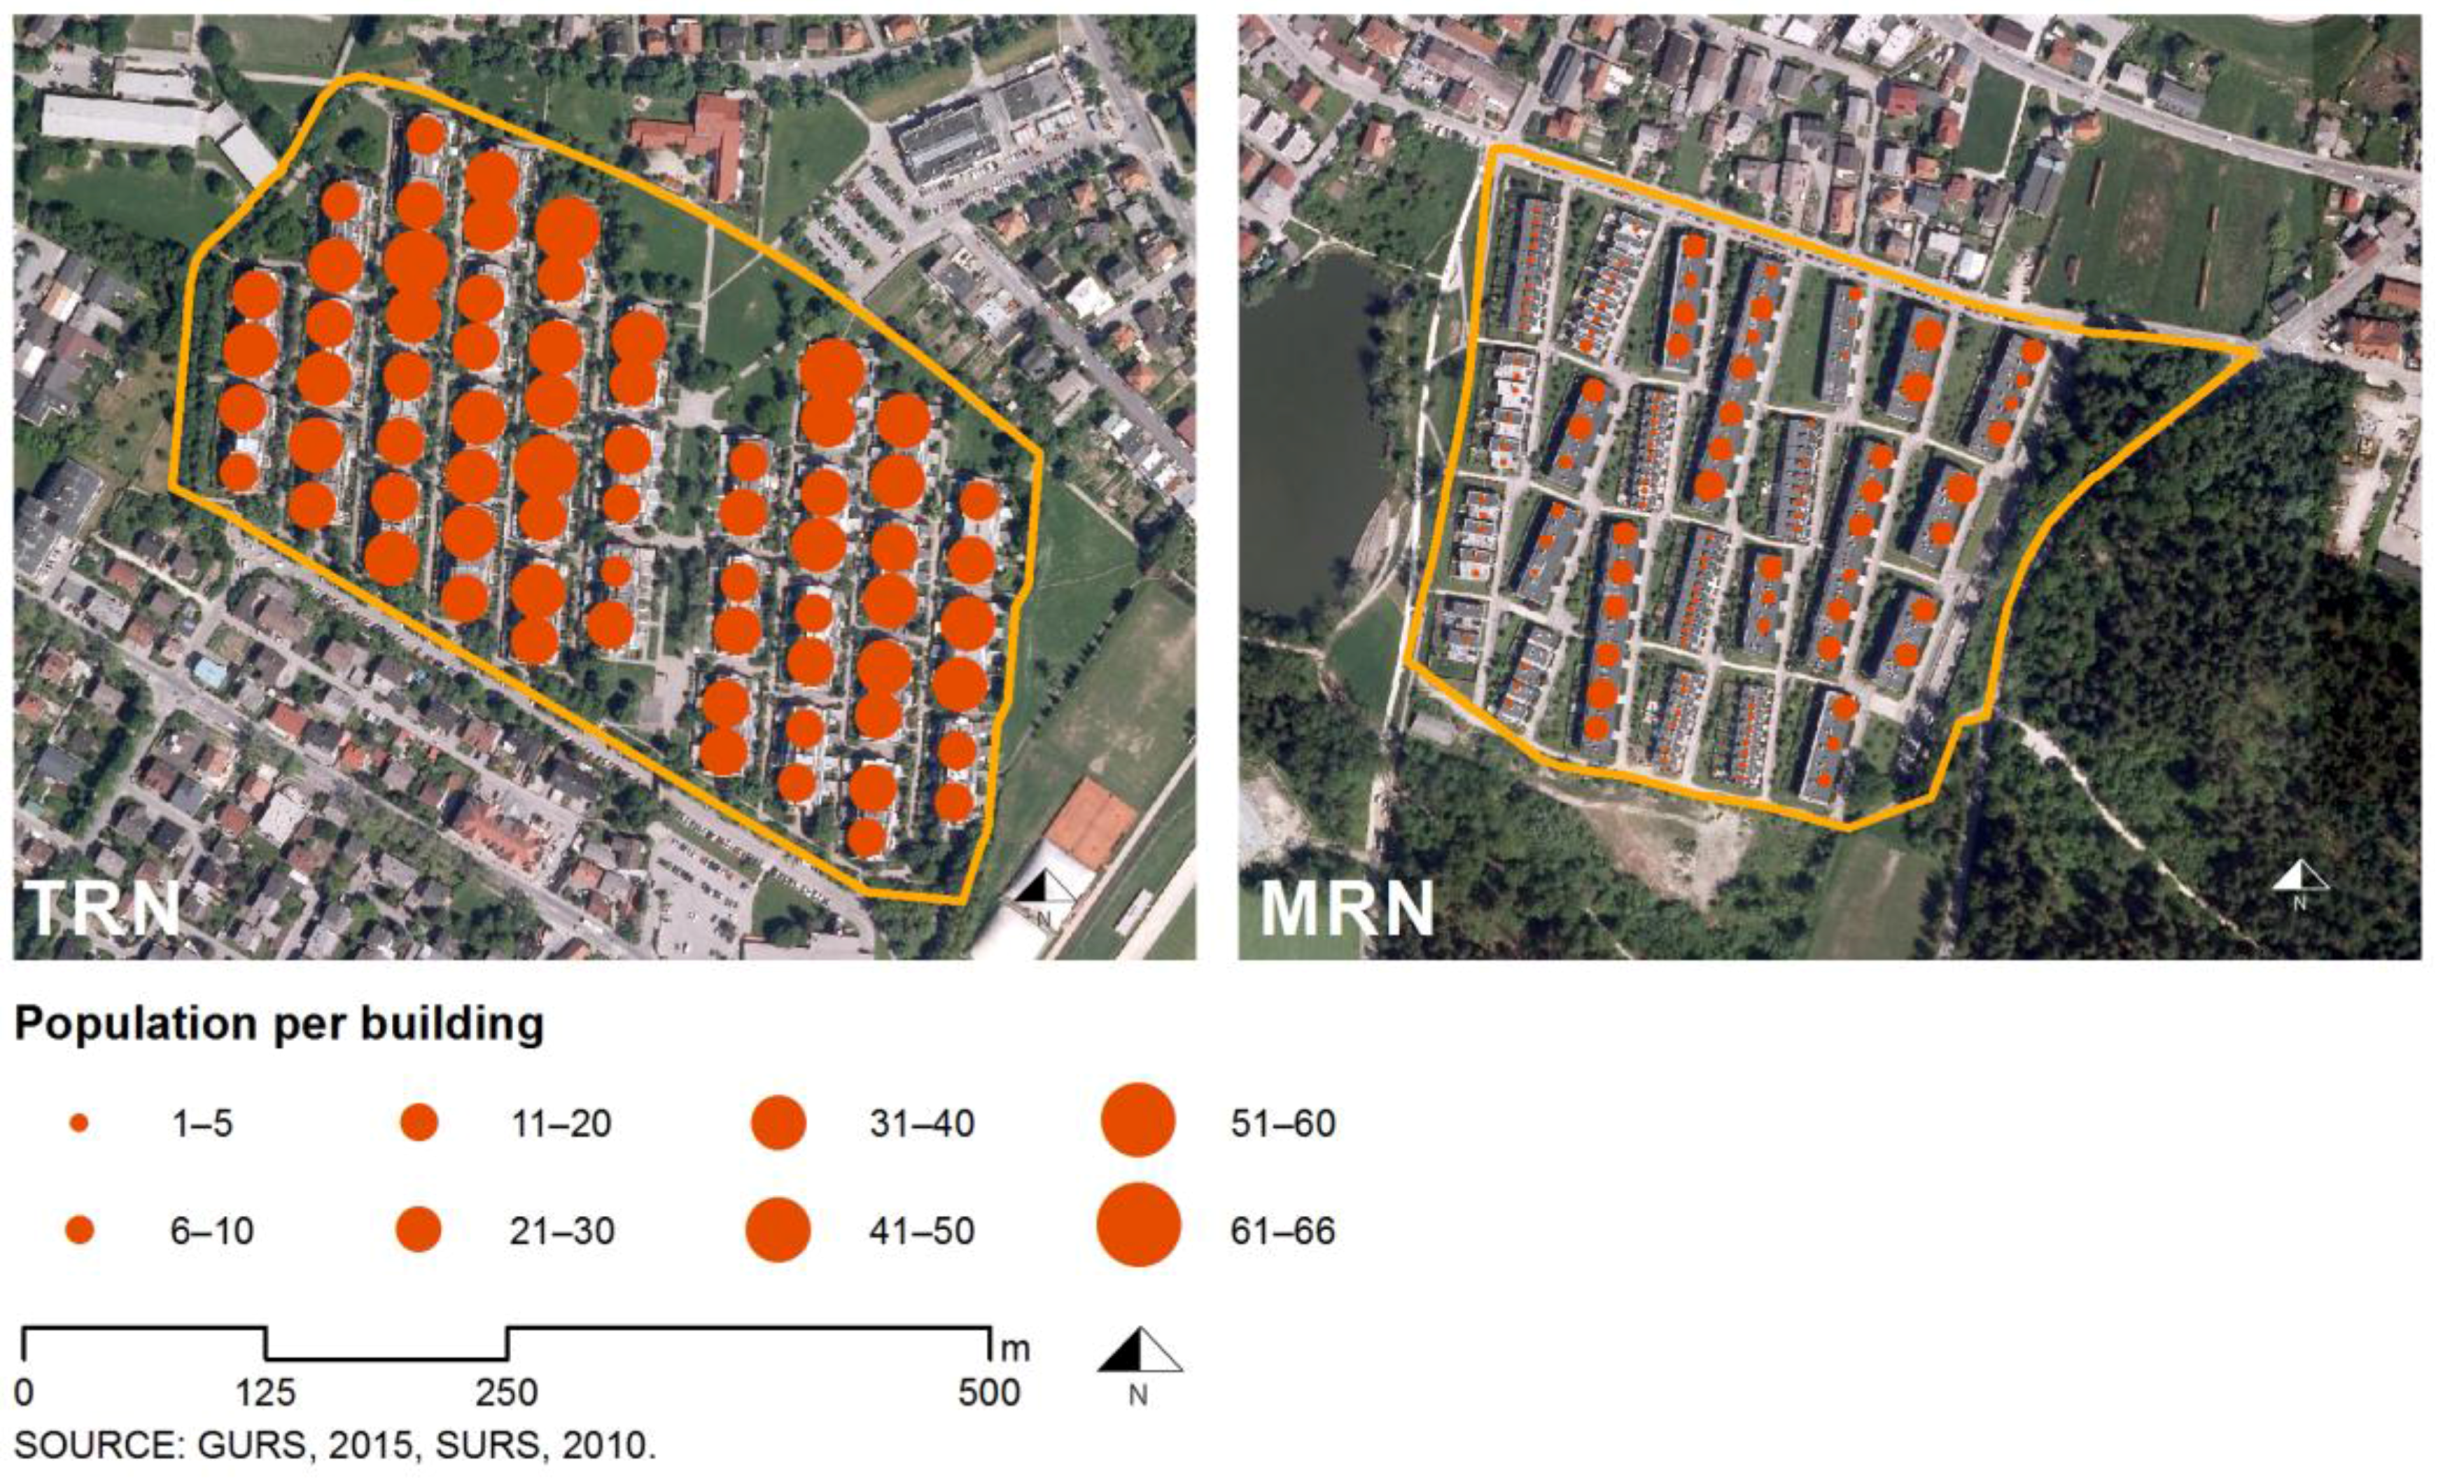
  • Compilation of historical maps, competition data, urban composition and processes of development (inventory of urban history and morphological evolution). Mapping of demographic data (population, density); urban history (origin, developing phases, and key alterations); geomorphological (topography, reliefs, terrain type, and climate conditions), and urban morphological data (border conditions). Analysis of urban morphology using GIS mapping. Data by the Surveying and Mapping Authority of the Republic of Slovenia. Software used: Esri ArcGis Software.
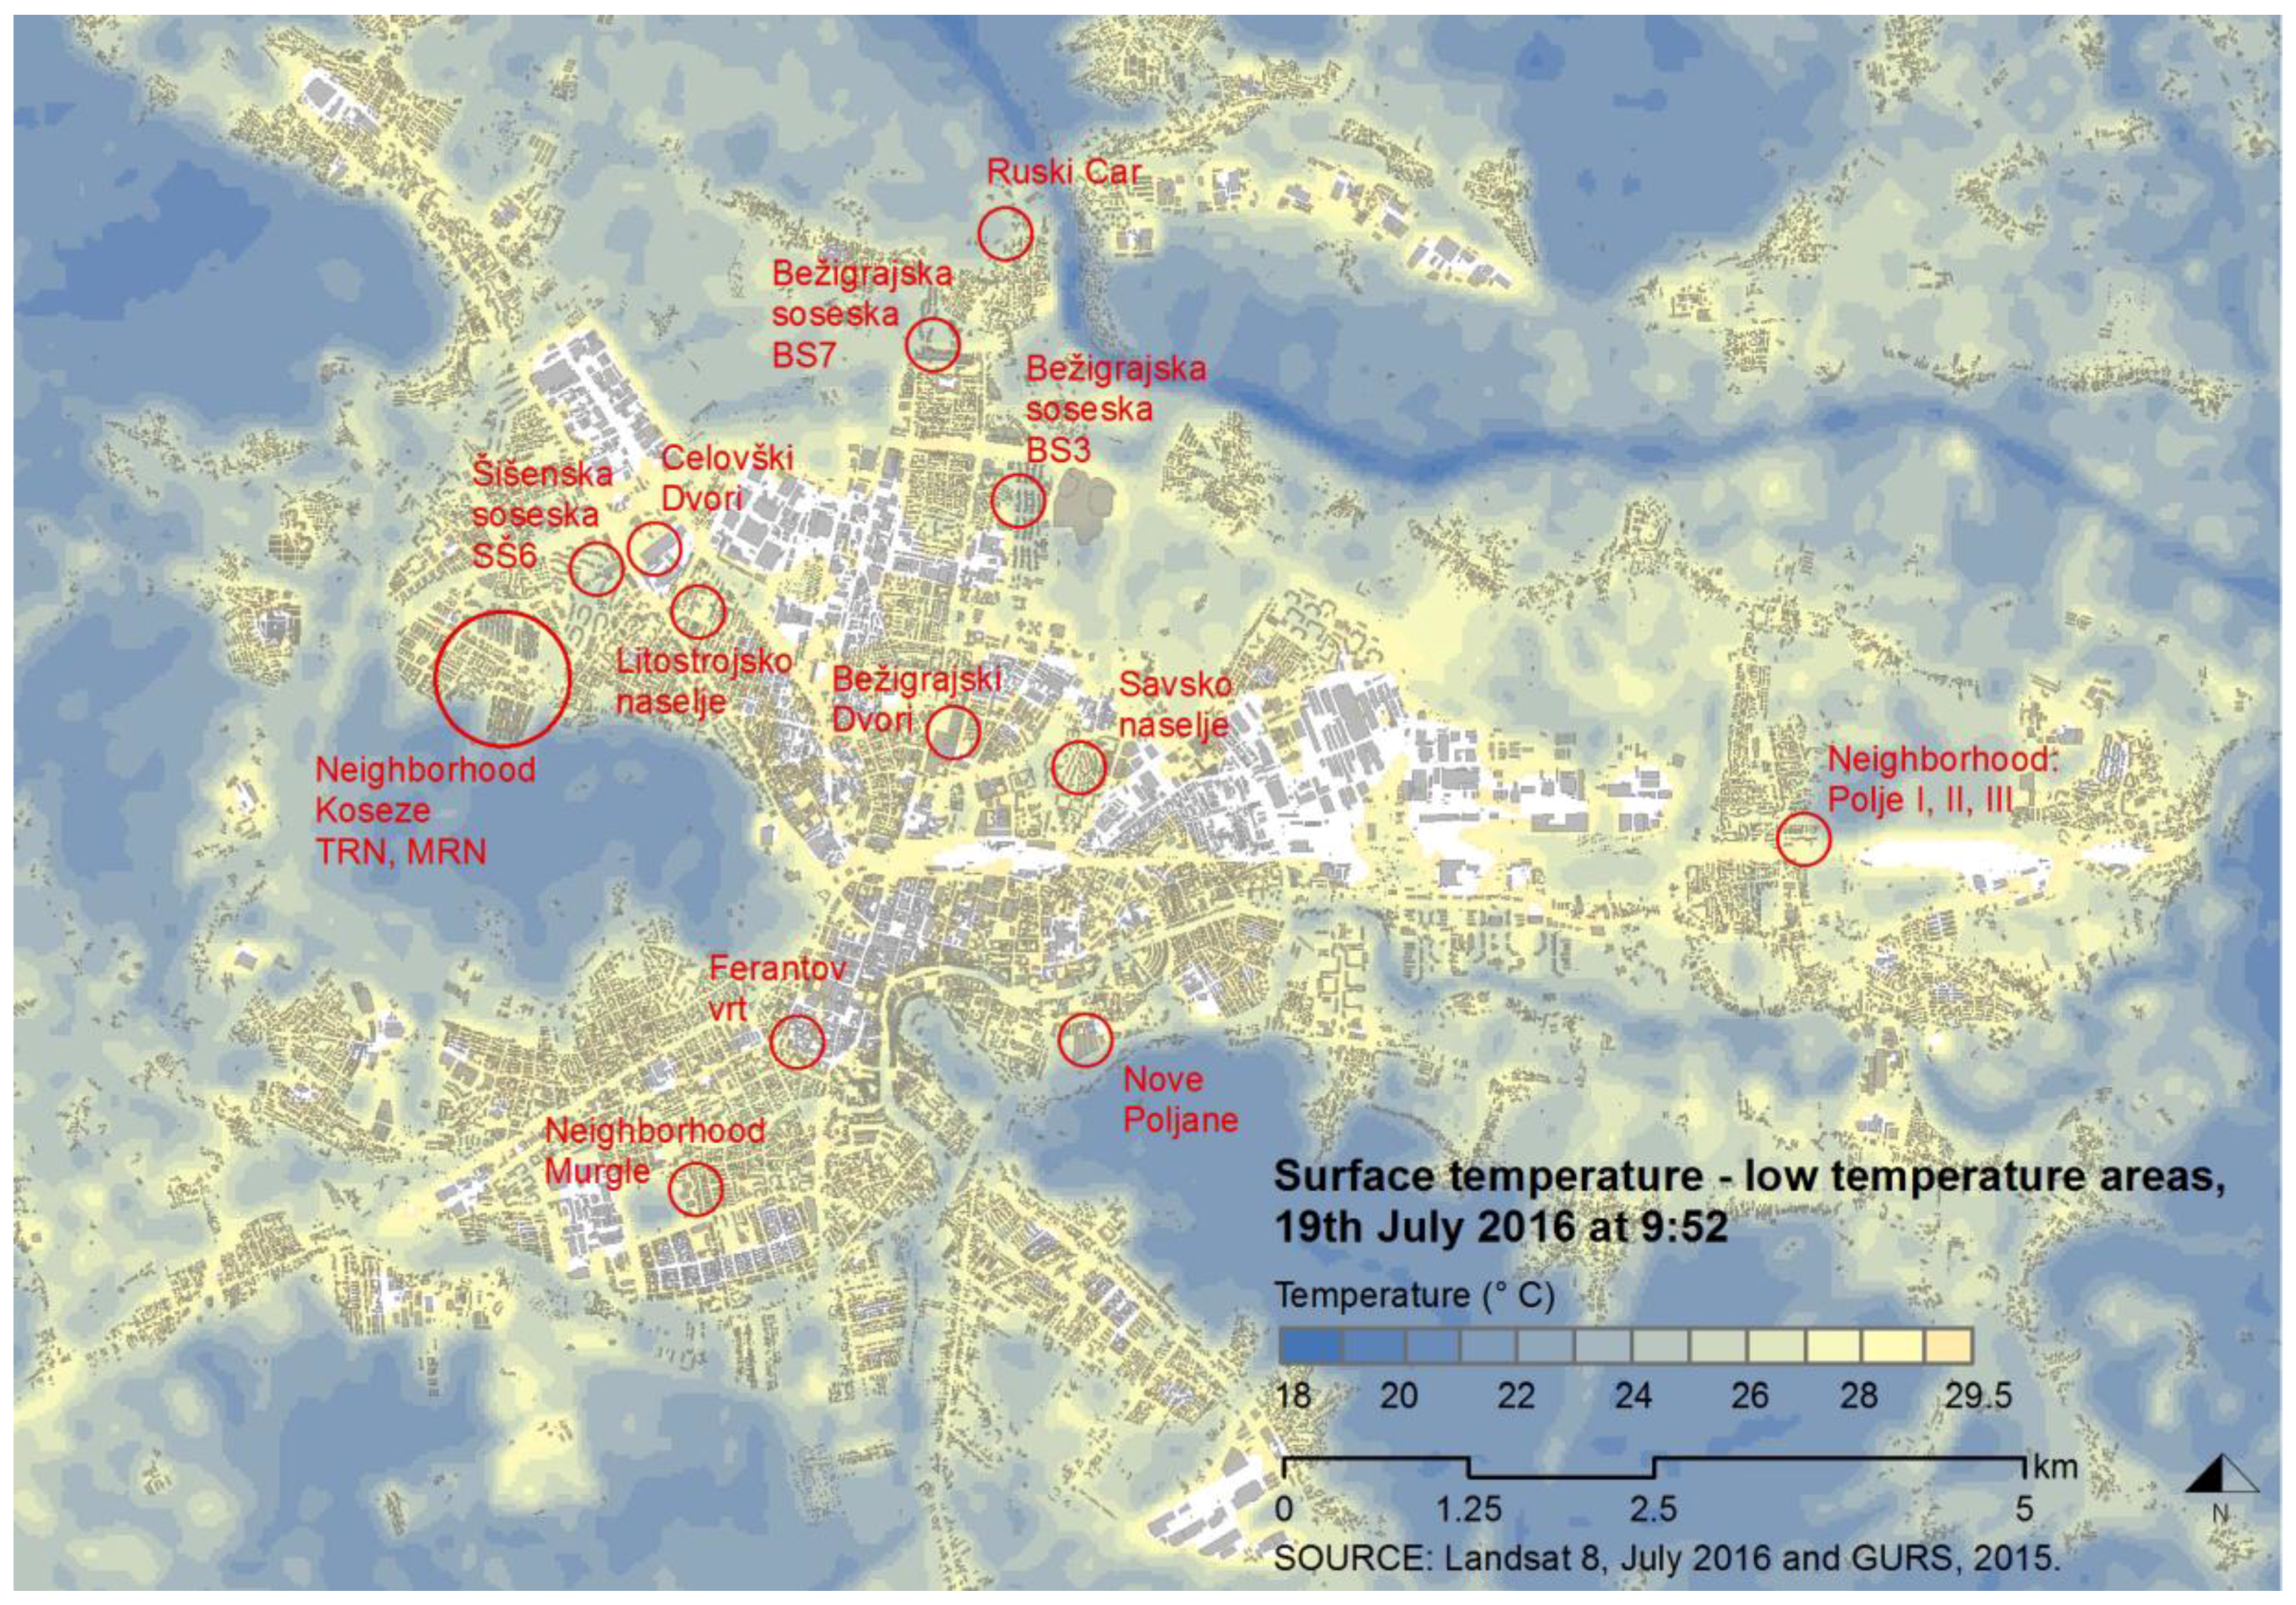
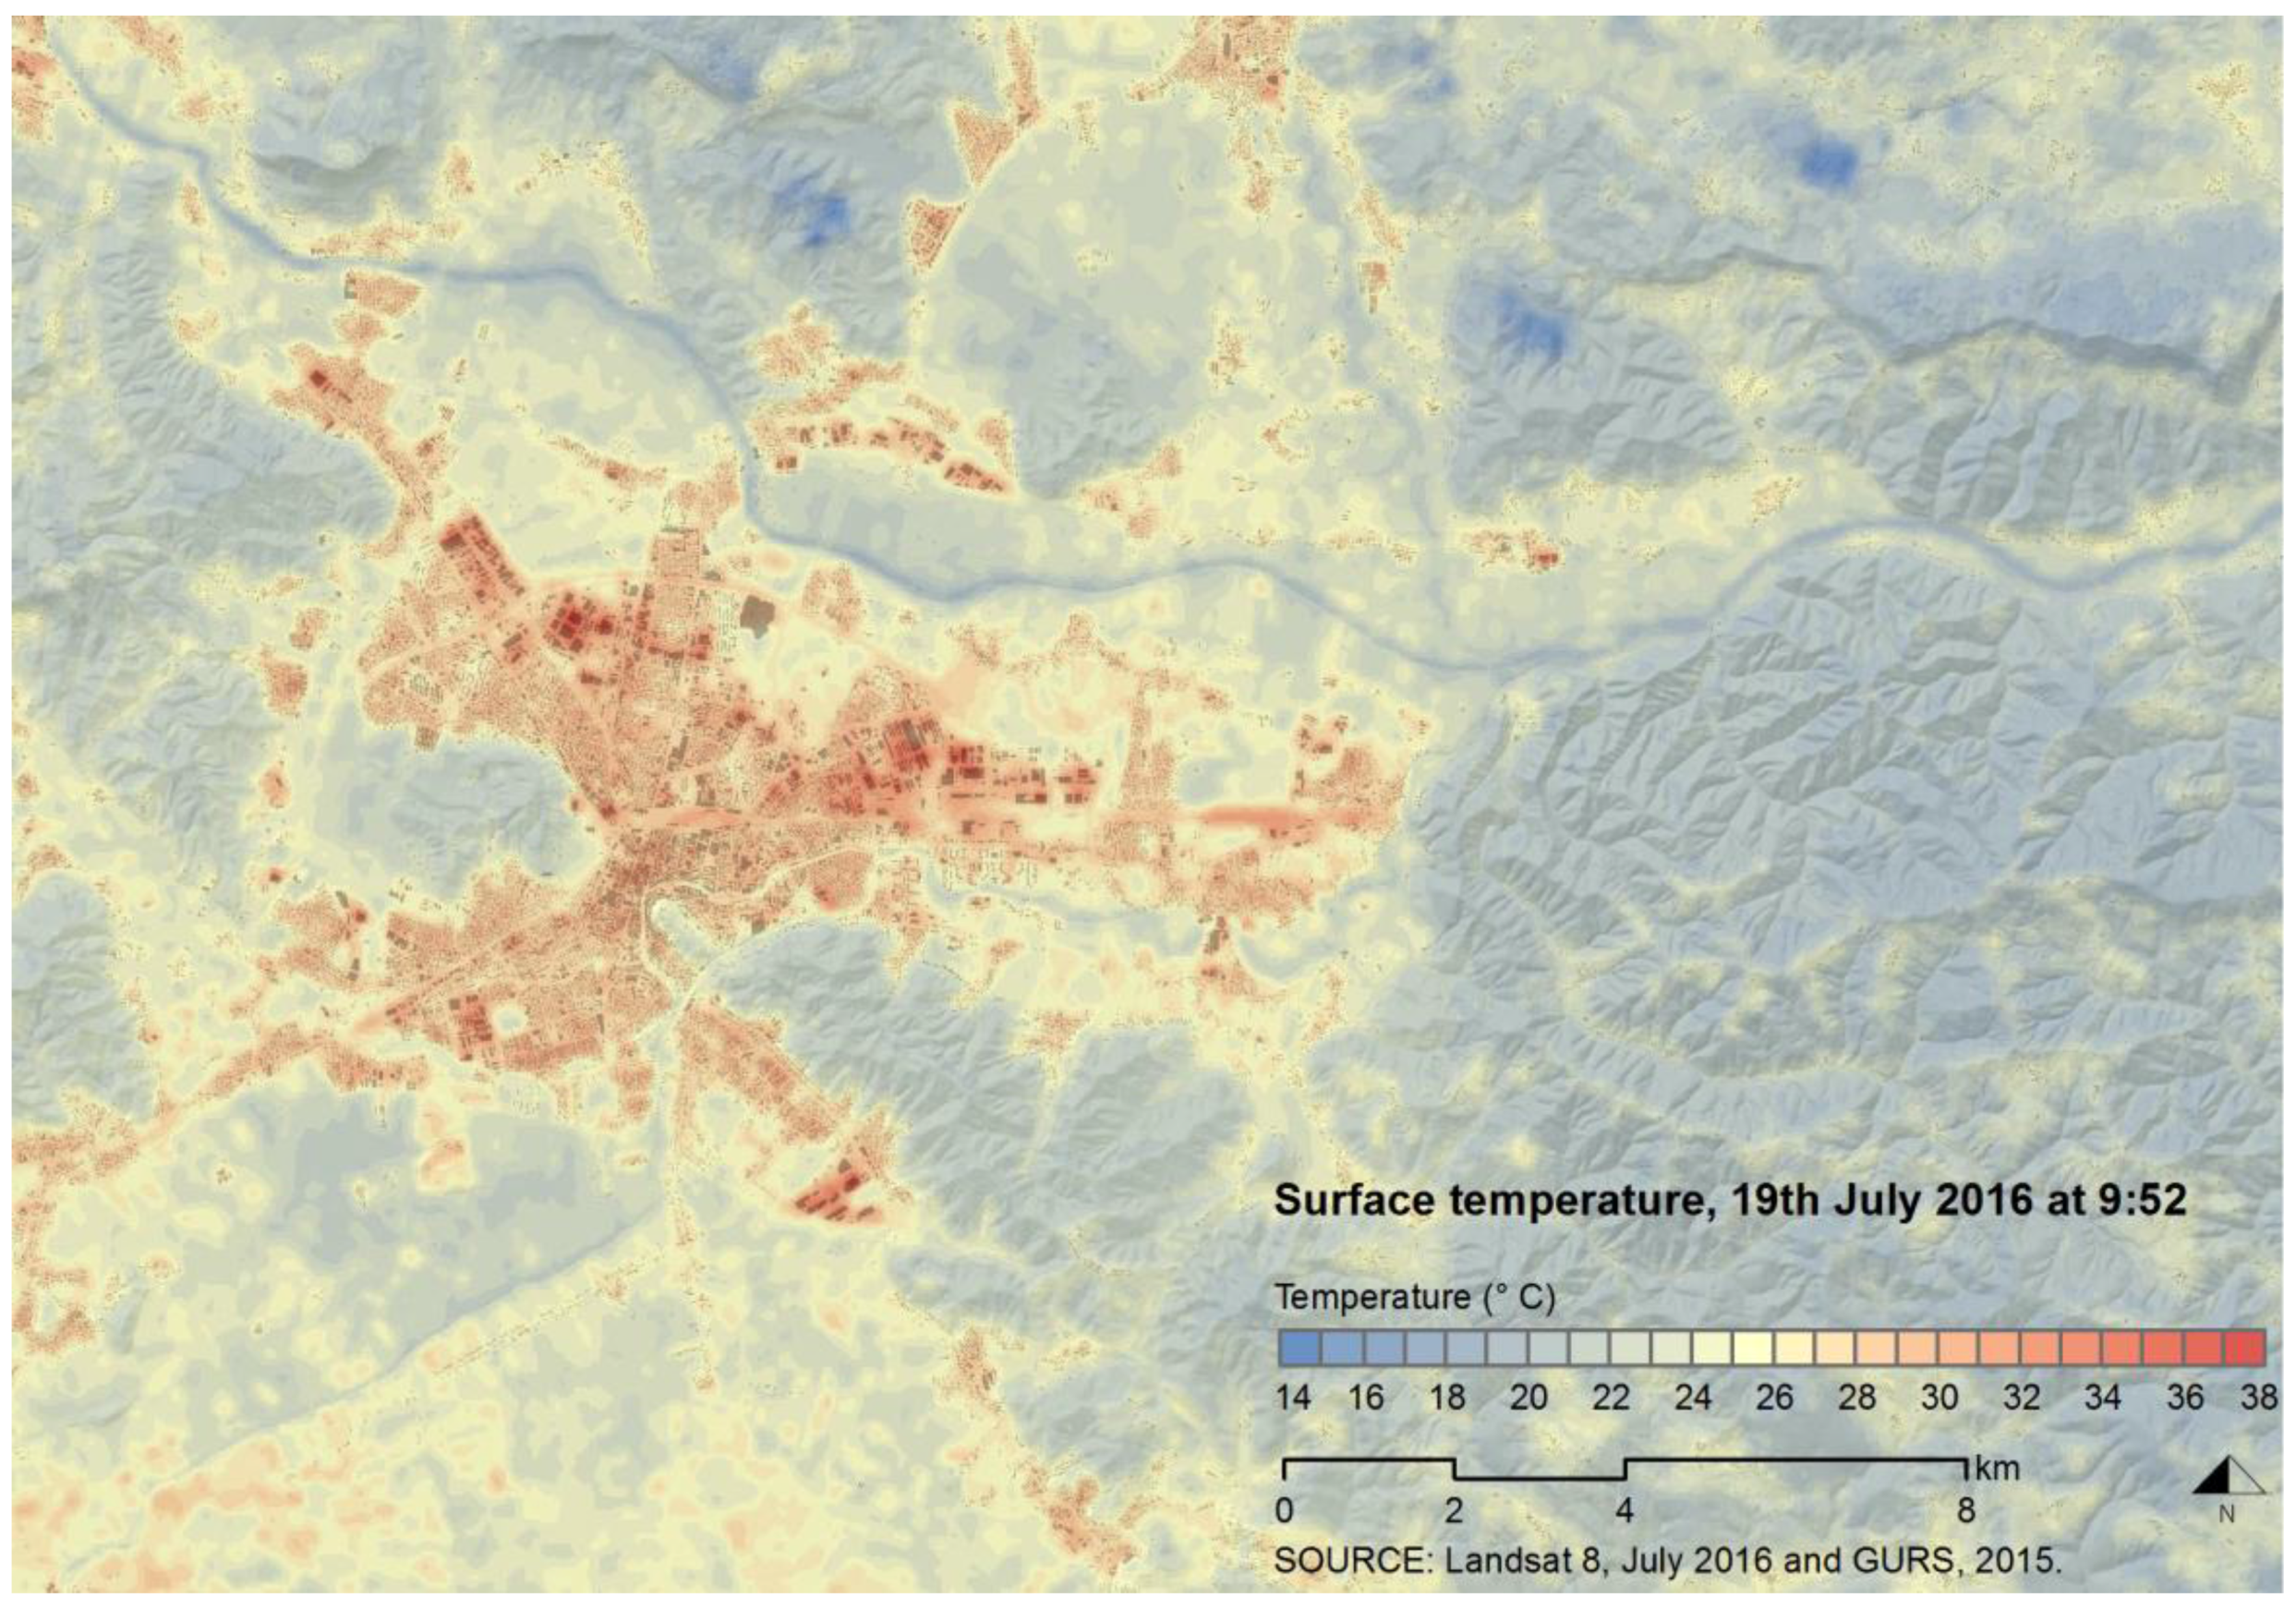
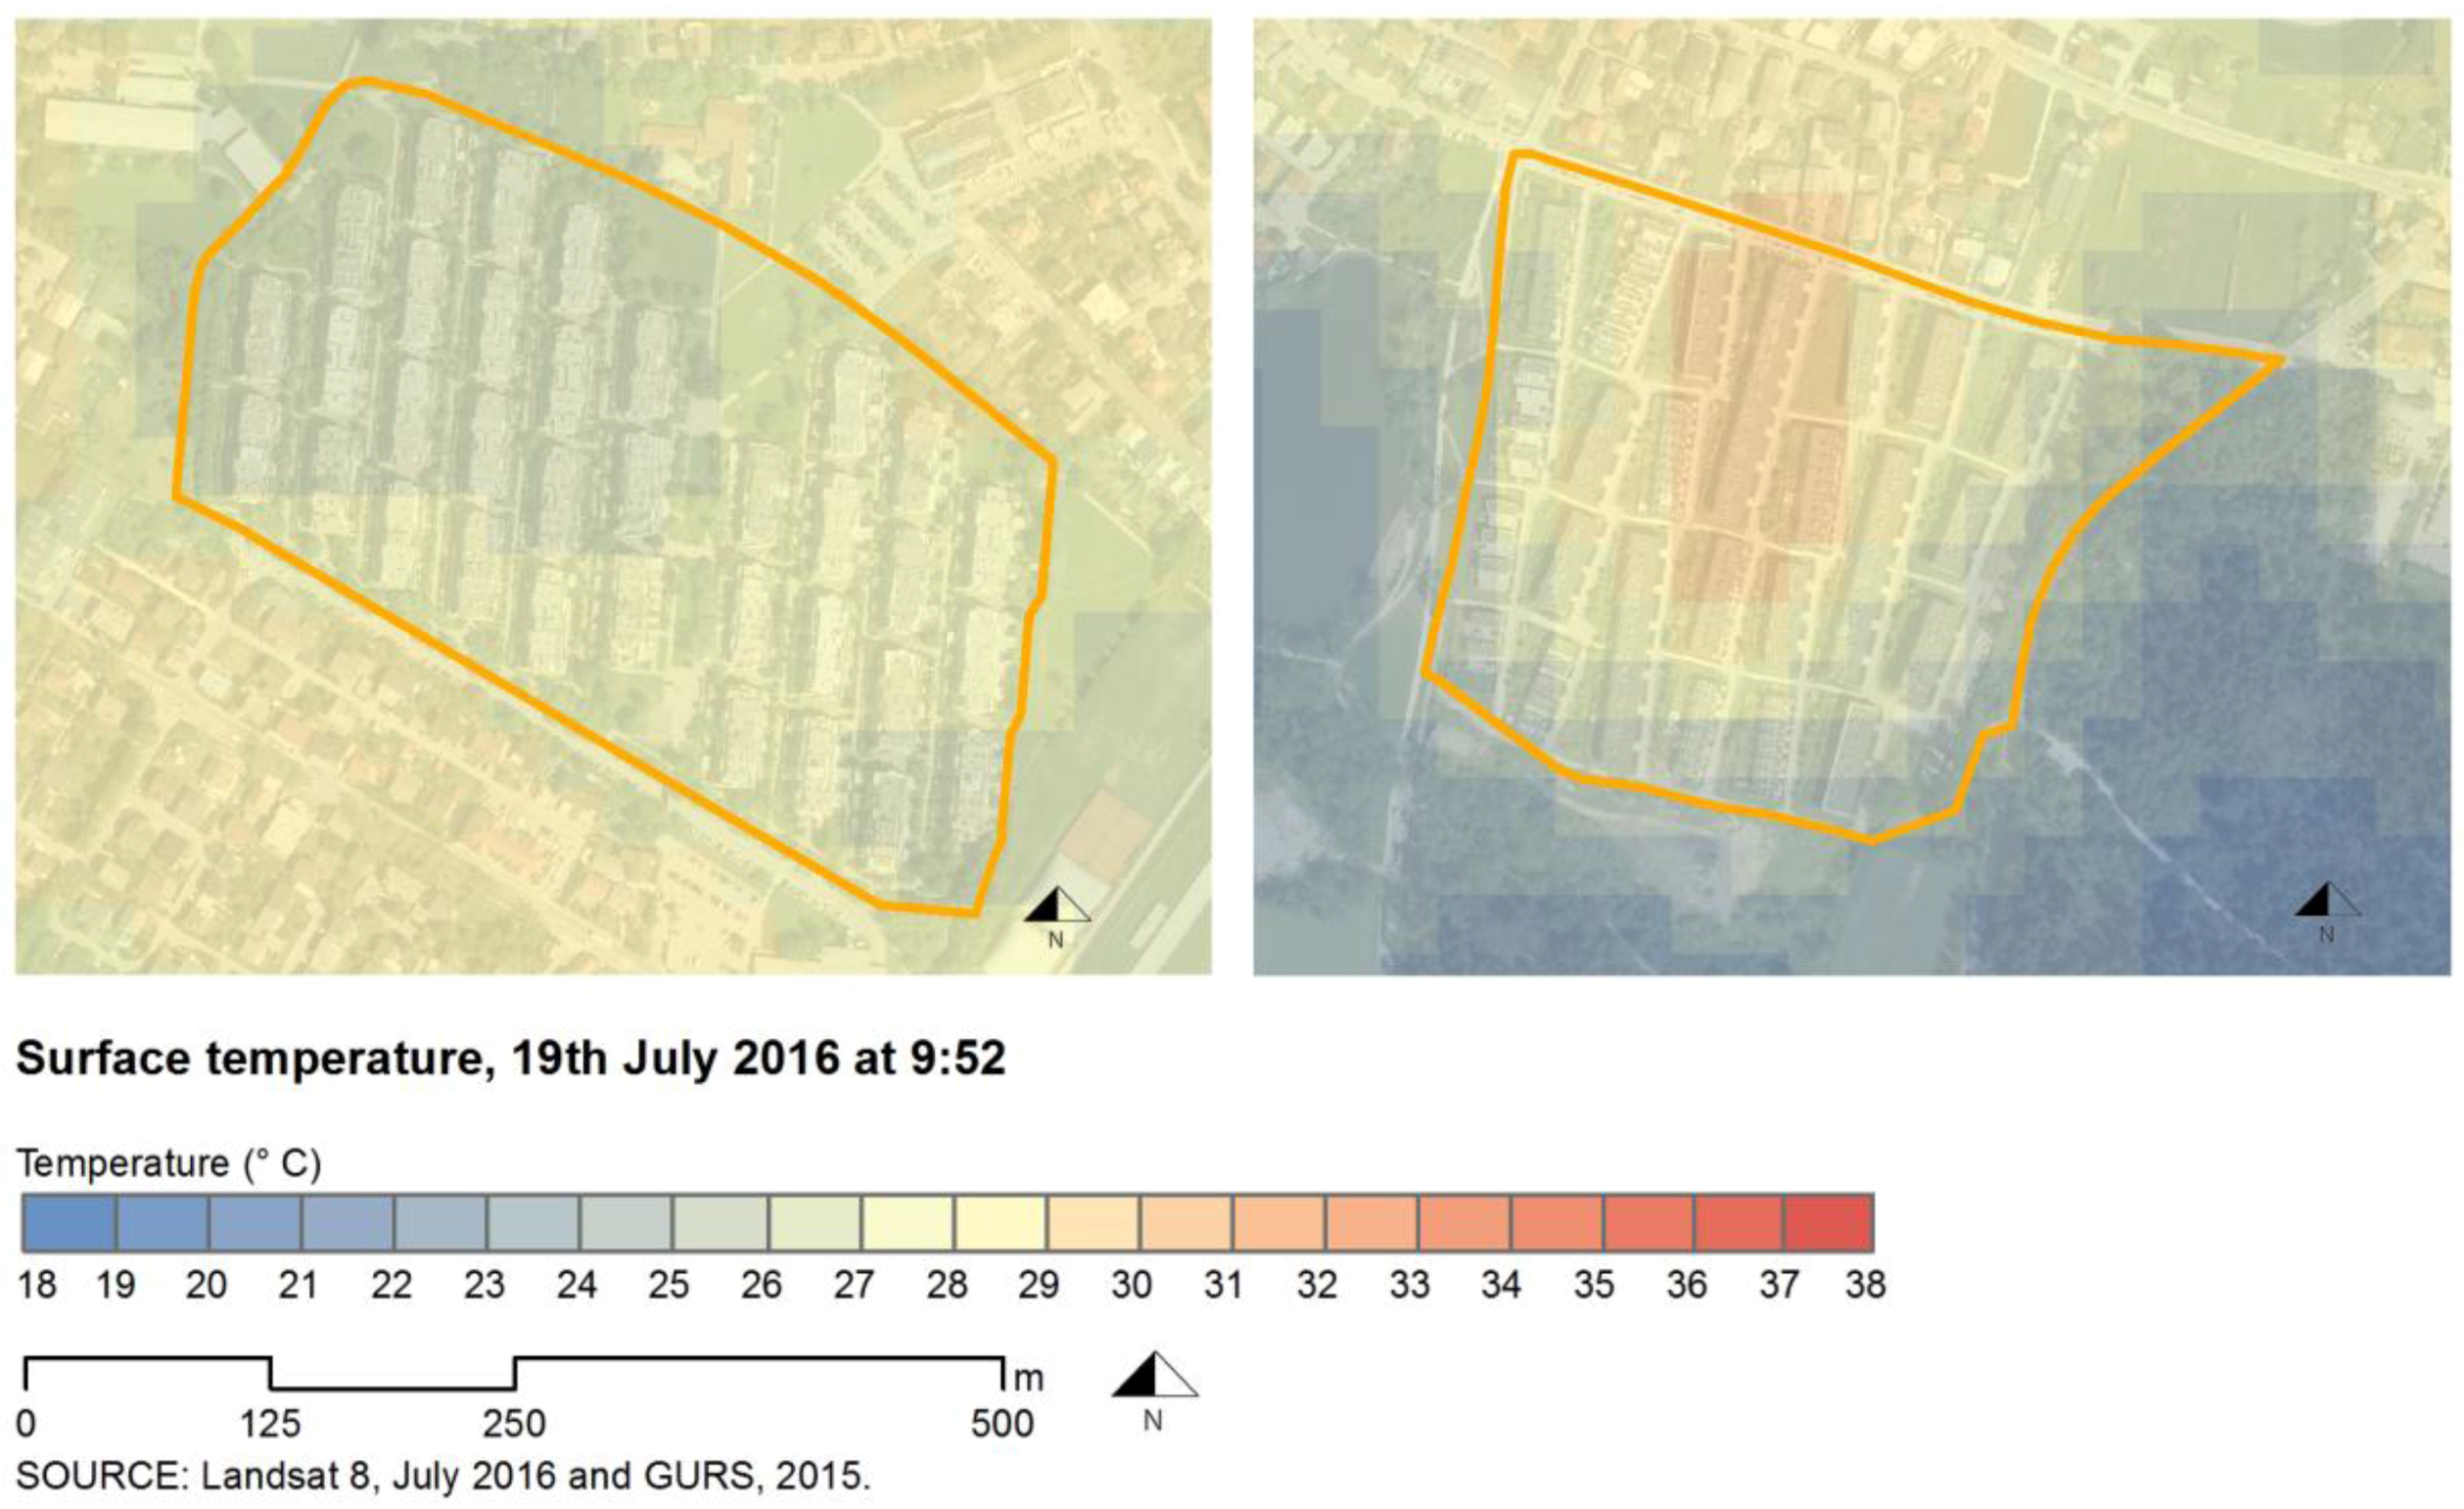
  • Thermal satellite imagery was done based on Landsat data obtained from [27]. Landsat 8 satellite (launched as the Landsat Data Continuity Mission—LDCM on 11 February 2013) mission continues the acquisition of high-quality data that meet both NASA and USGS scientific and operational requirements for observing land use and land change [27]. We used Landsat 8 images for the production of the thermal map. This satellite records the Earth’s surface in 11 spectral bands suitable for observing the various activities on the Earth’s surface. Here we used Band 10. The thermal infrared bend or TIR shows surface heat. The images were processed using Esri ArcGis Software, which were transformed in a way to calculate temperature for each pixel separately.
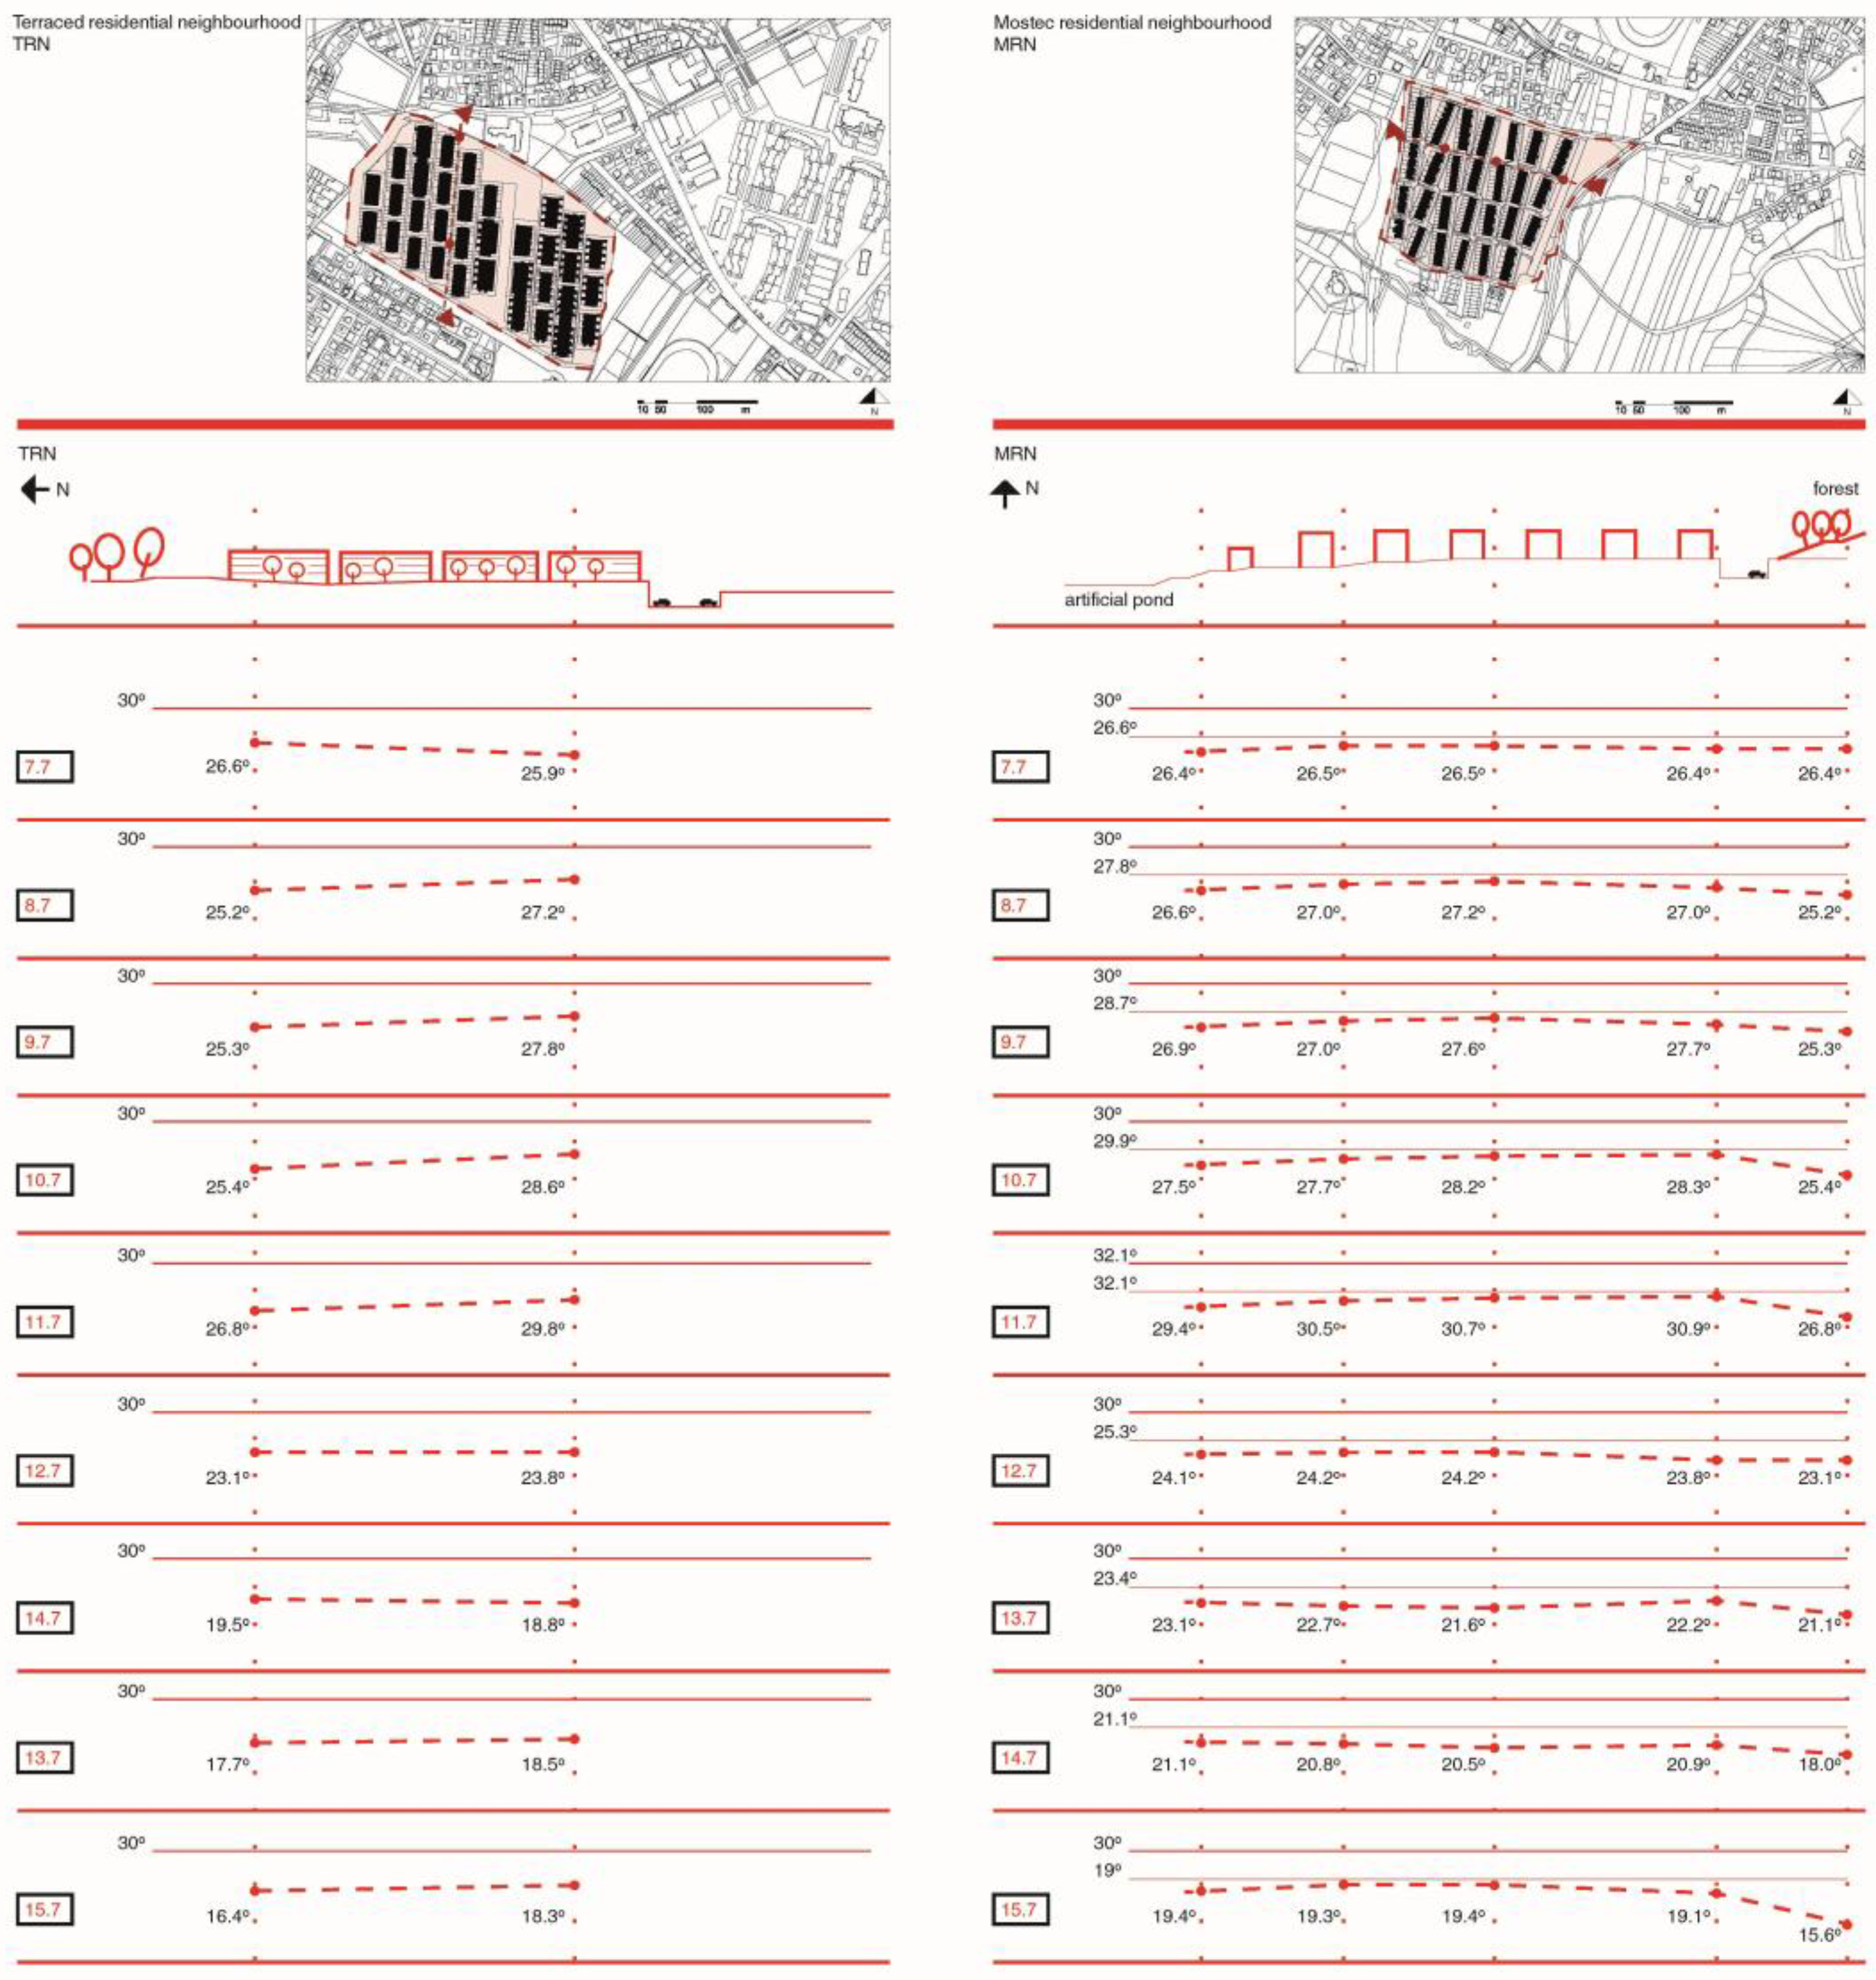
  • In situ measurement of air temperature; analysis of data on temperature at both locations, July 2016 (Figure 8). Observations were carried out during July 2016. Air temperatures were measured at many locations, 1.2 m above the ground in both neighborhoods from 7 to 15 July 2016, every day at 7 p.m. The locations were selected based on the data revealing higher temperatures than in the surroundings. During the recording period, the summer temperatures were first increasing, then decreasing, while the temperature differences between the warmest and the coldest days were more than 10 K. These data were compared against the temperatures recorded at the Koseze automated weather station, which is situated 5 m and 290 m away from the TRN and MRN neighborhoods, respectively (i.e., considering the minimum distance to the first building). In all cases, the measured temperature in the neighborhood was higher than that recorded at the weather station outside the densely built-up area.
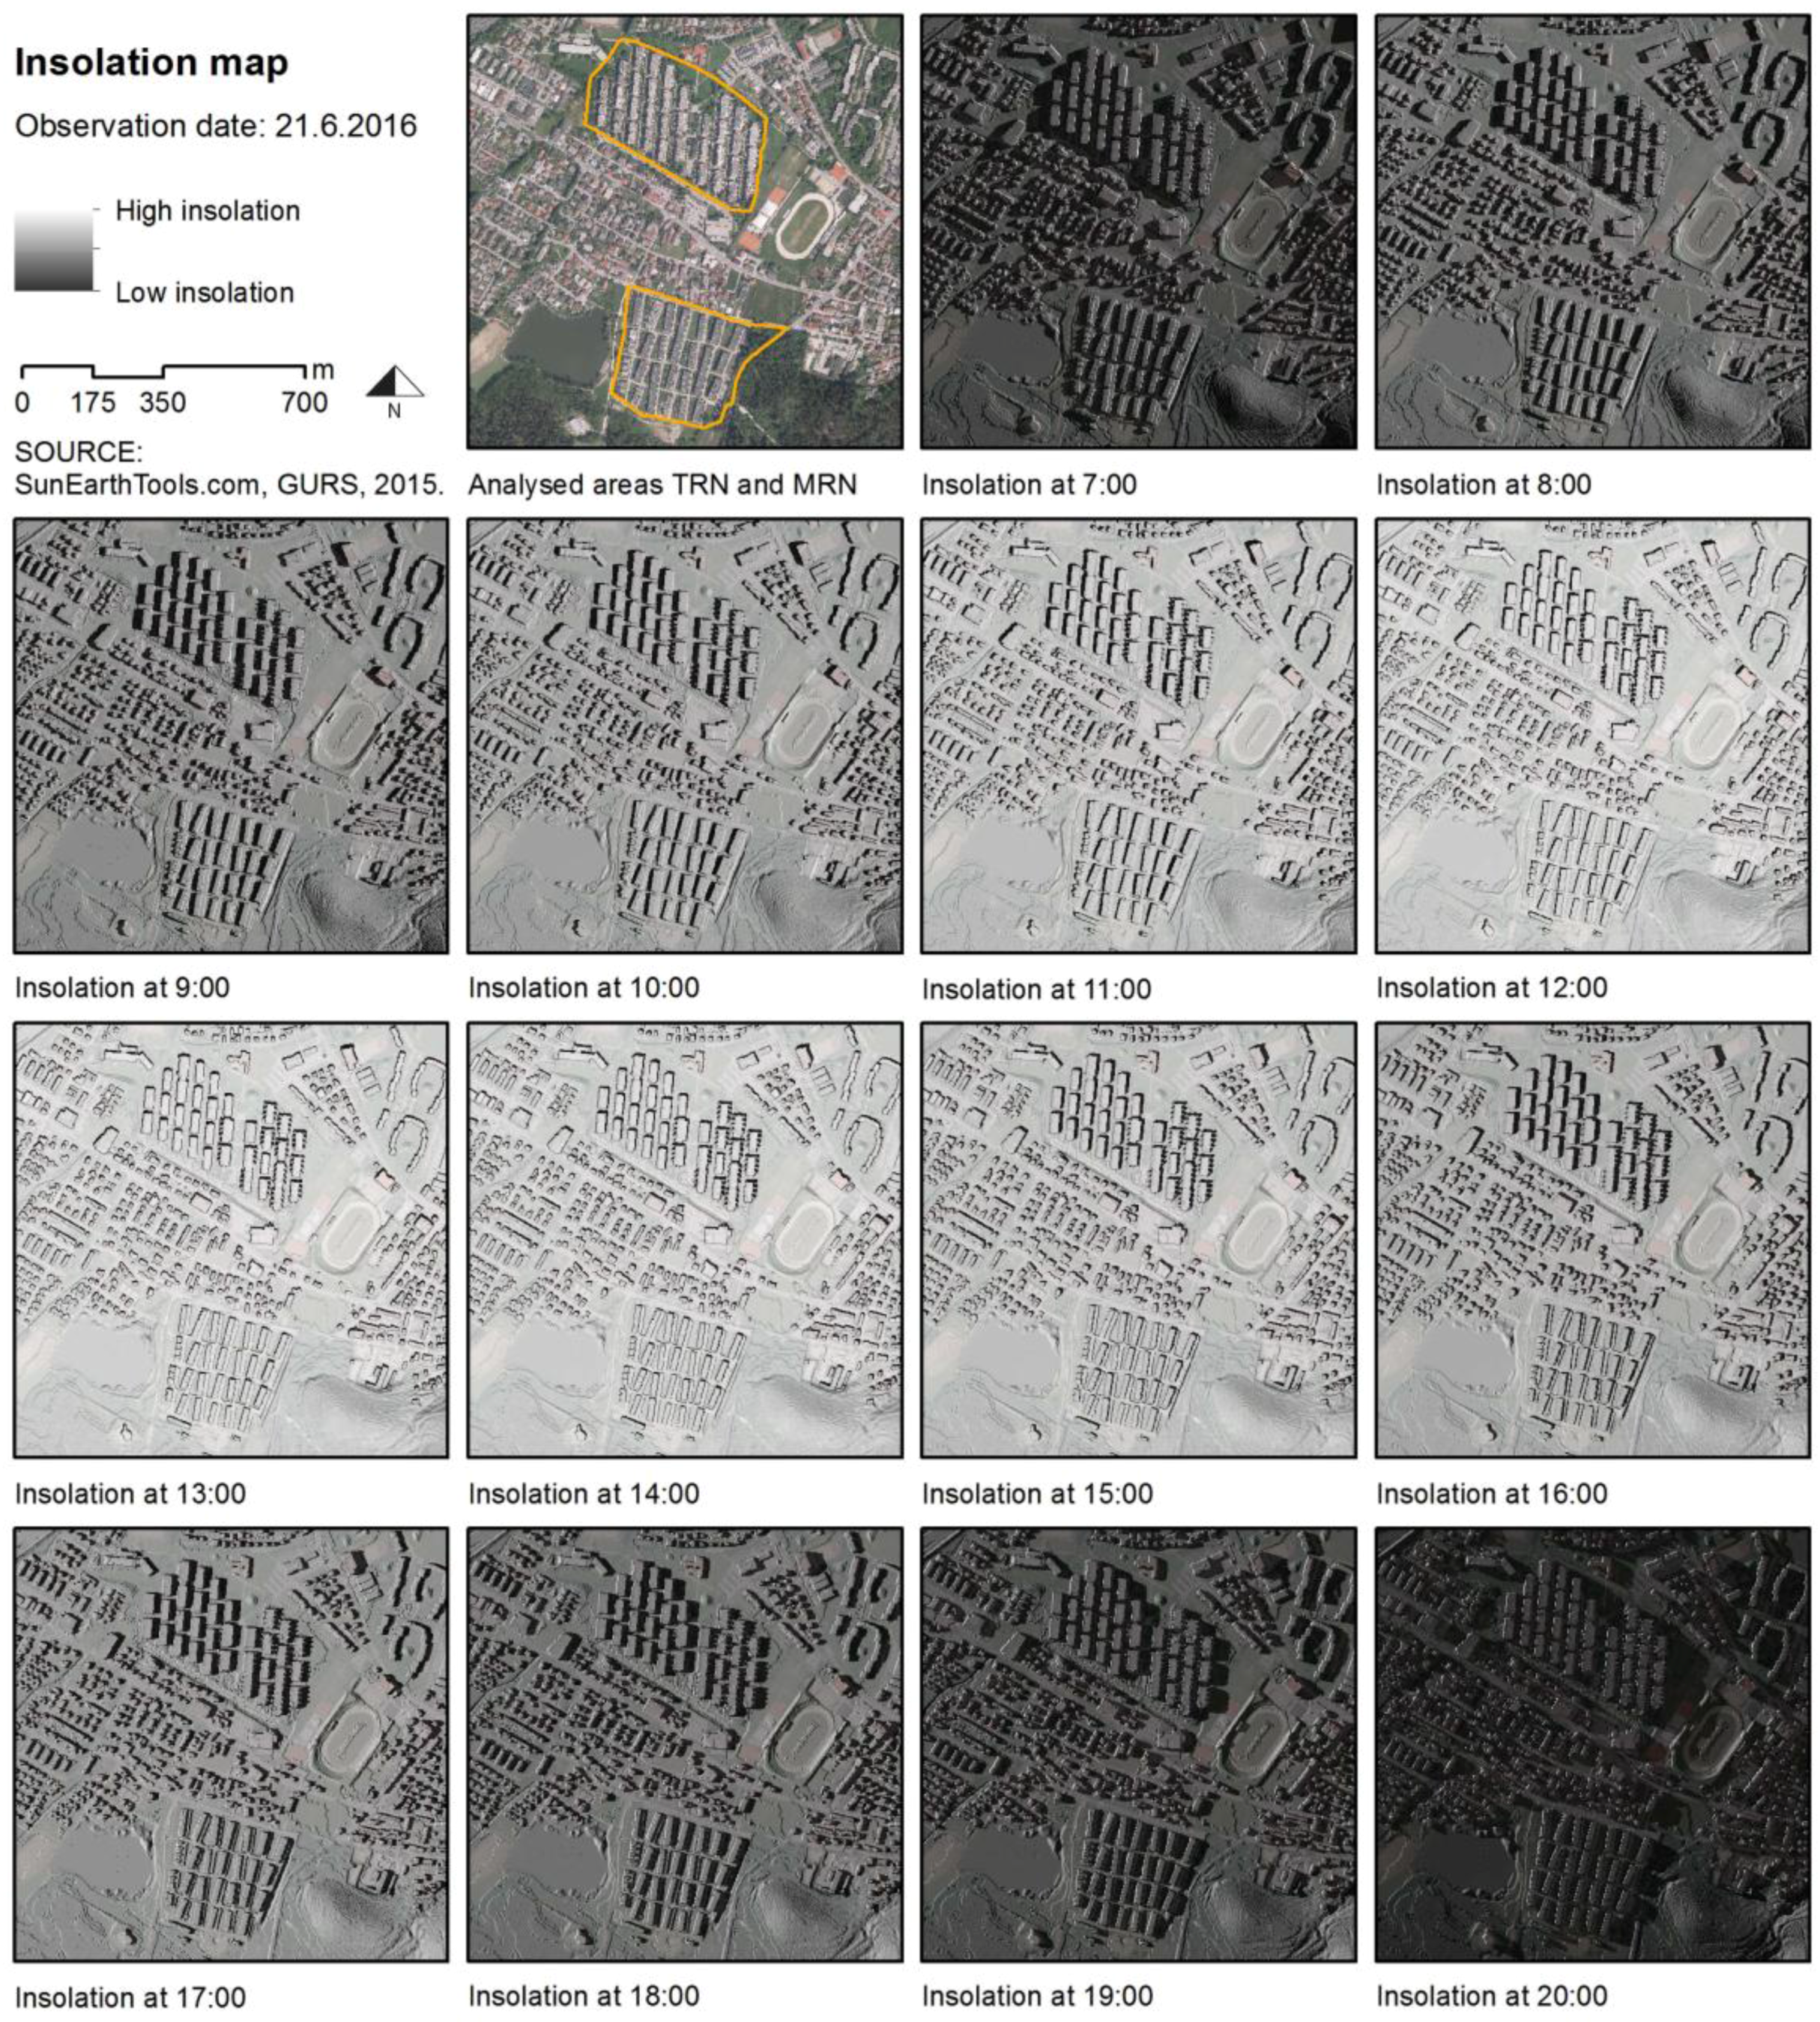
  • Analysis of insolation on 21 March 2016, 21 June 2016 (Figure 9), 23 September 2016, and 21 December 2016. The data were acquired via the Lidar viewer by the Slovenian Environmental Agency [16], processed using Esri ArcGis Software, and transformed into the digital terrain model. A solar insolation map was produced according to the movement of the sun.
  • Analysis of the wind speed and temperature recorded between 7 July and 15 July 2016 at the local meteorological station [28]. The average wind speed for the selected period was from 1.35 to 2.68 km/h, the average temperature was from 15.93 °C to 25.83 °C [28].
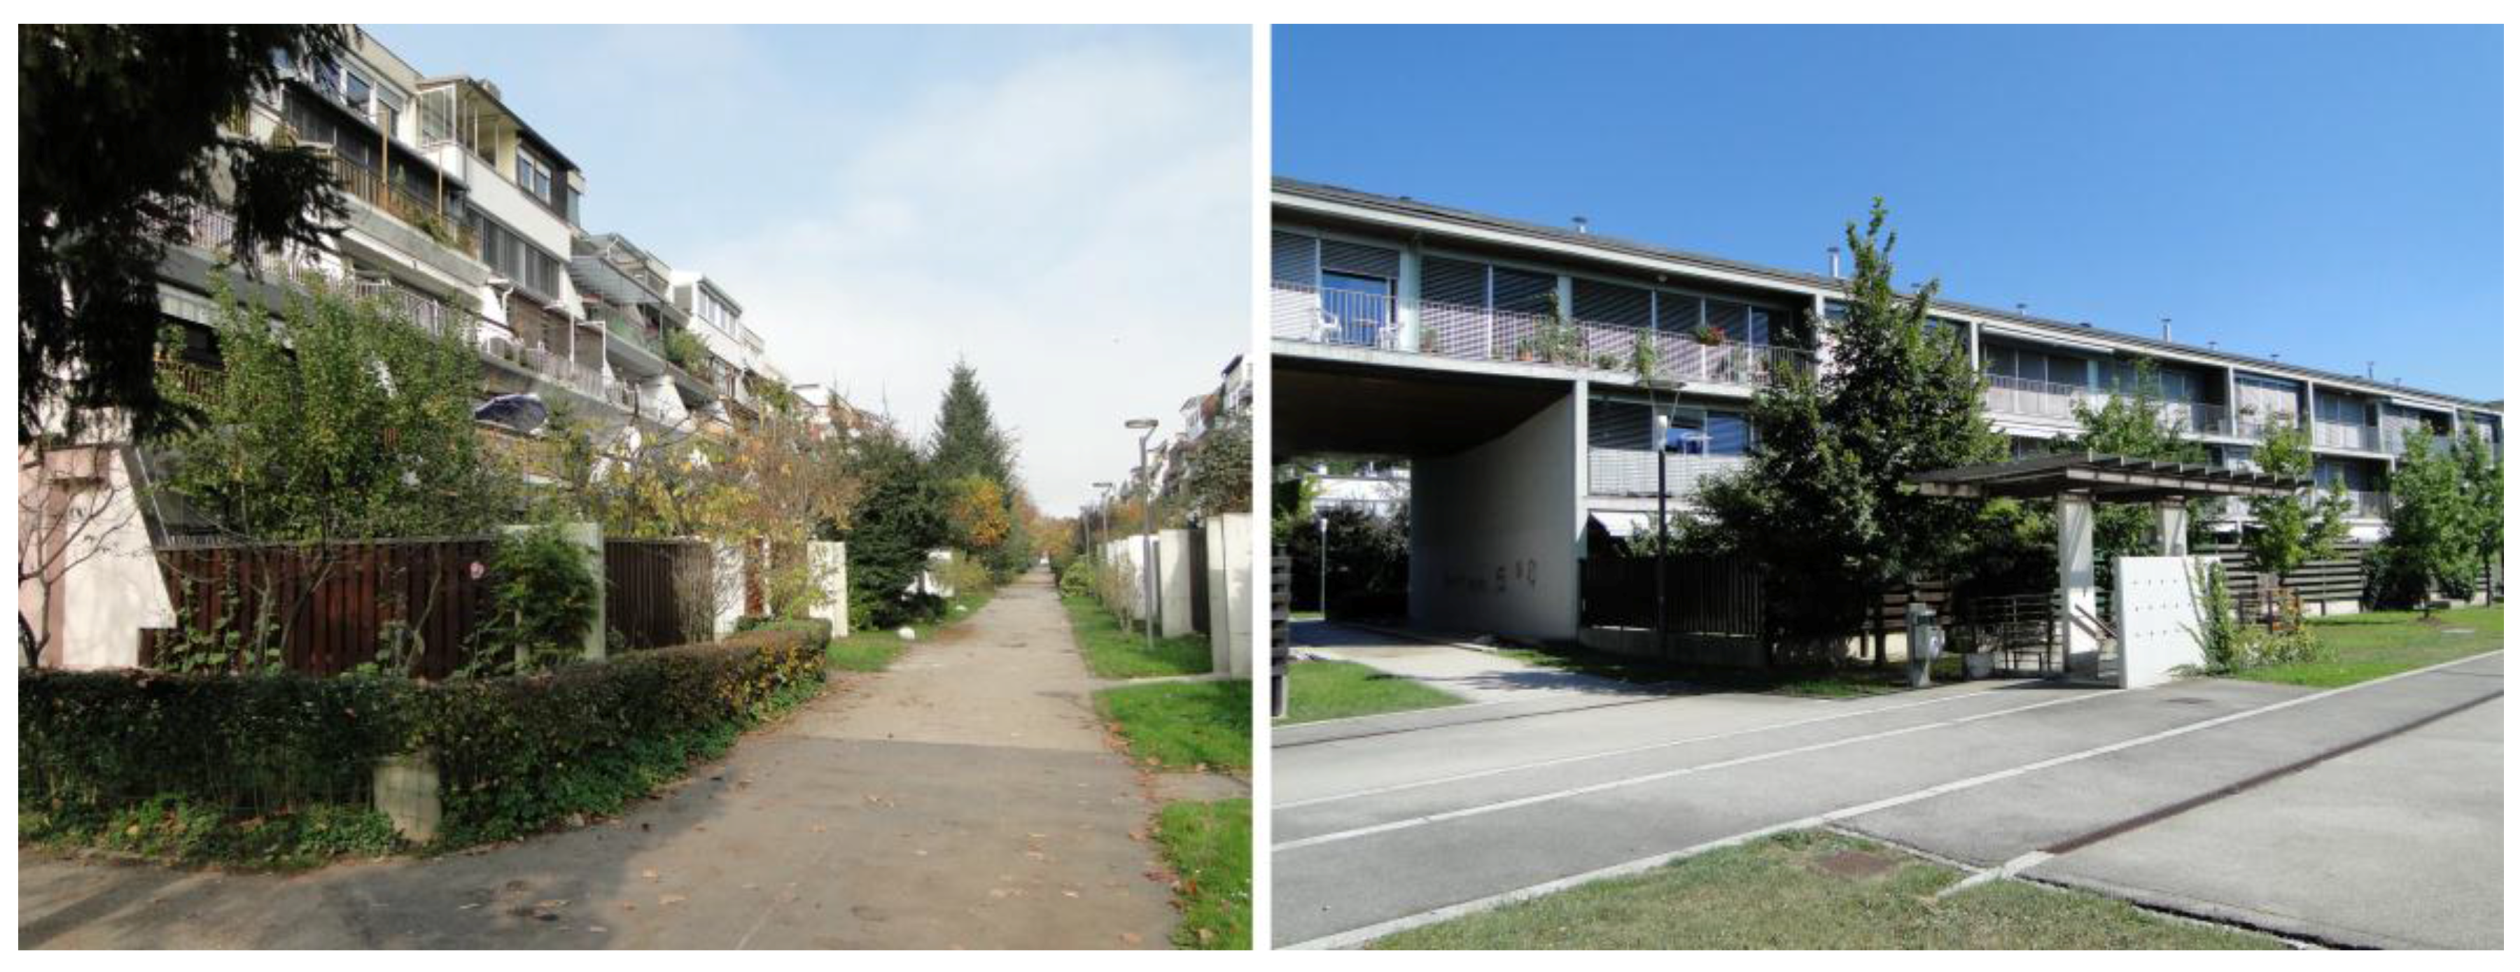
  • Fieldwork and photographic recording: site visits and street views dated from May to October 2016.
Figure 10 gives a summary of the study methodology, a brief overview of the linear path of data checking, i.e., the thermal satellite imagery providing the information on the importance and value of UHI, harmonisation of the data obtained during field work, and analysis of urban morphology through mapping (GIS). The results of the spatial legibility method for understanding the changing of micro-local conditions are given below.

3. Results

This study reveals the unseen interconnections between the four explored categories of parameters on the micro scale and the importance of their impact on temperature changes.
Based on the methodological approach toward interconnecting urban morphology with climate impact data, by registering them on the micro level of both locations (TRN and MRN), we made a synthesis of the urban morphology and in-site measurements regarding Oke’s [11] definition of four significant controls on urban climate.

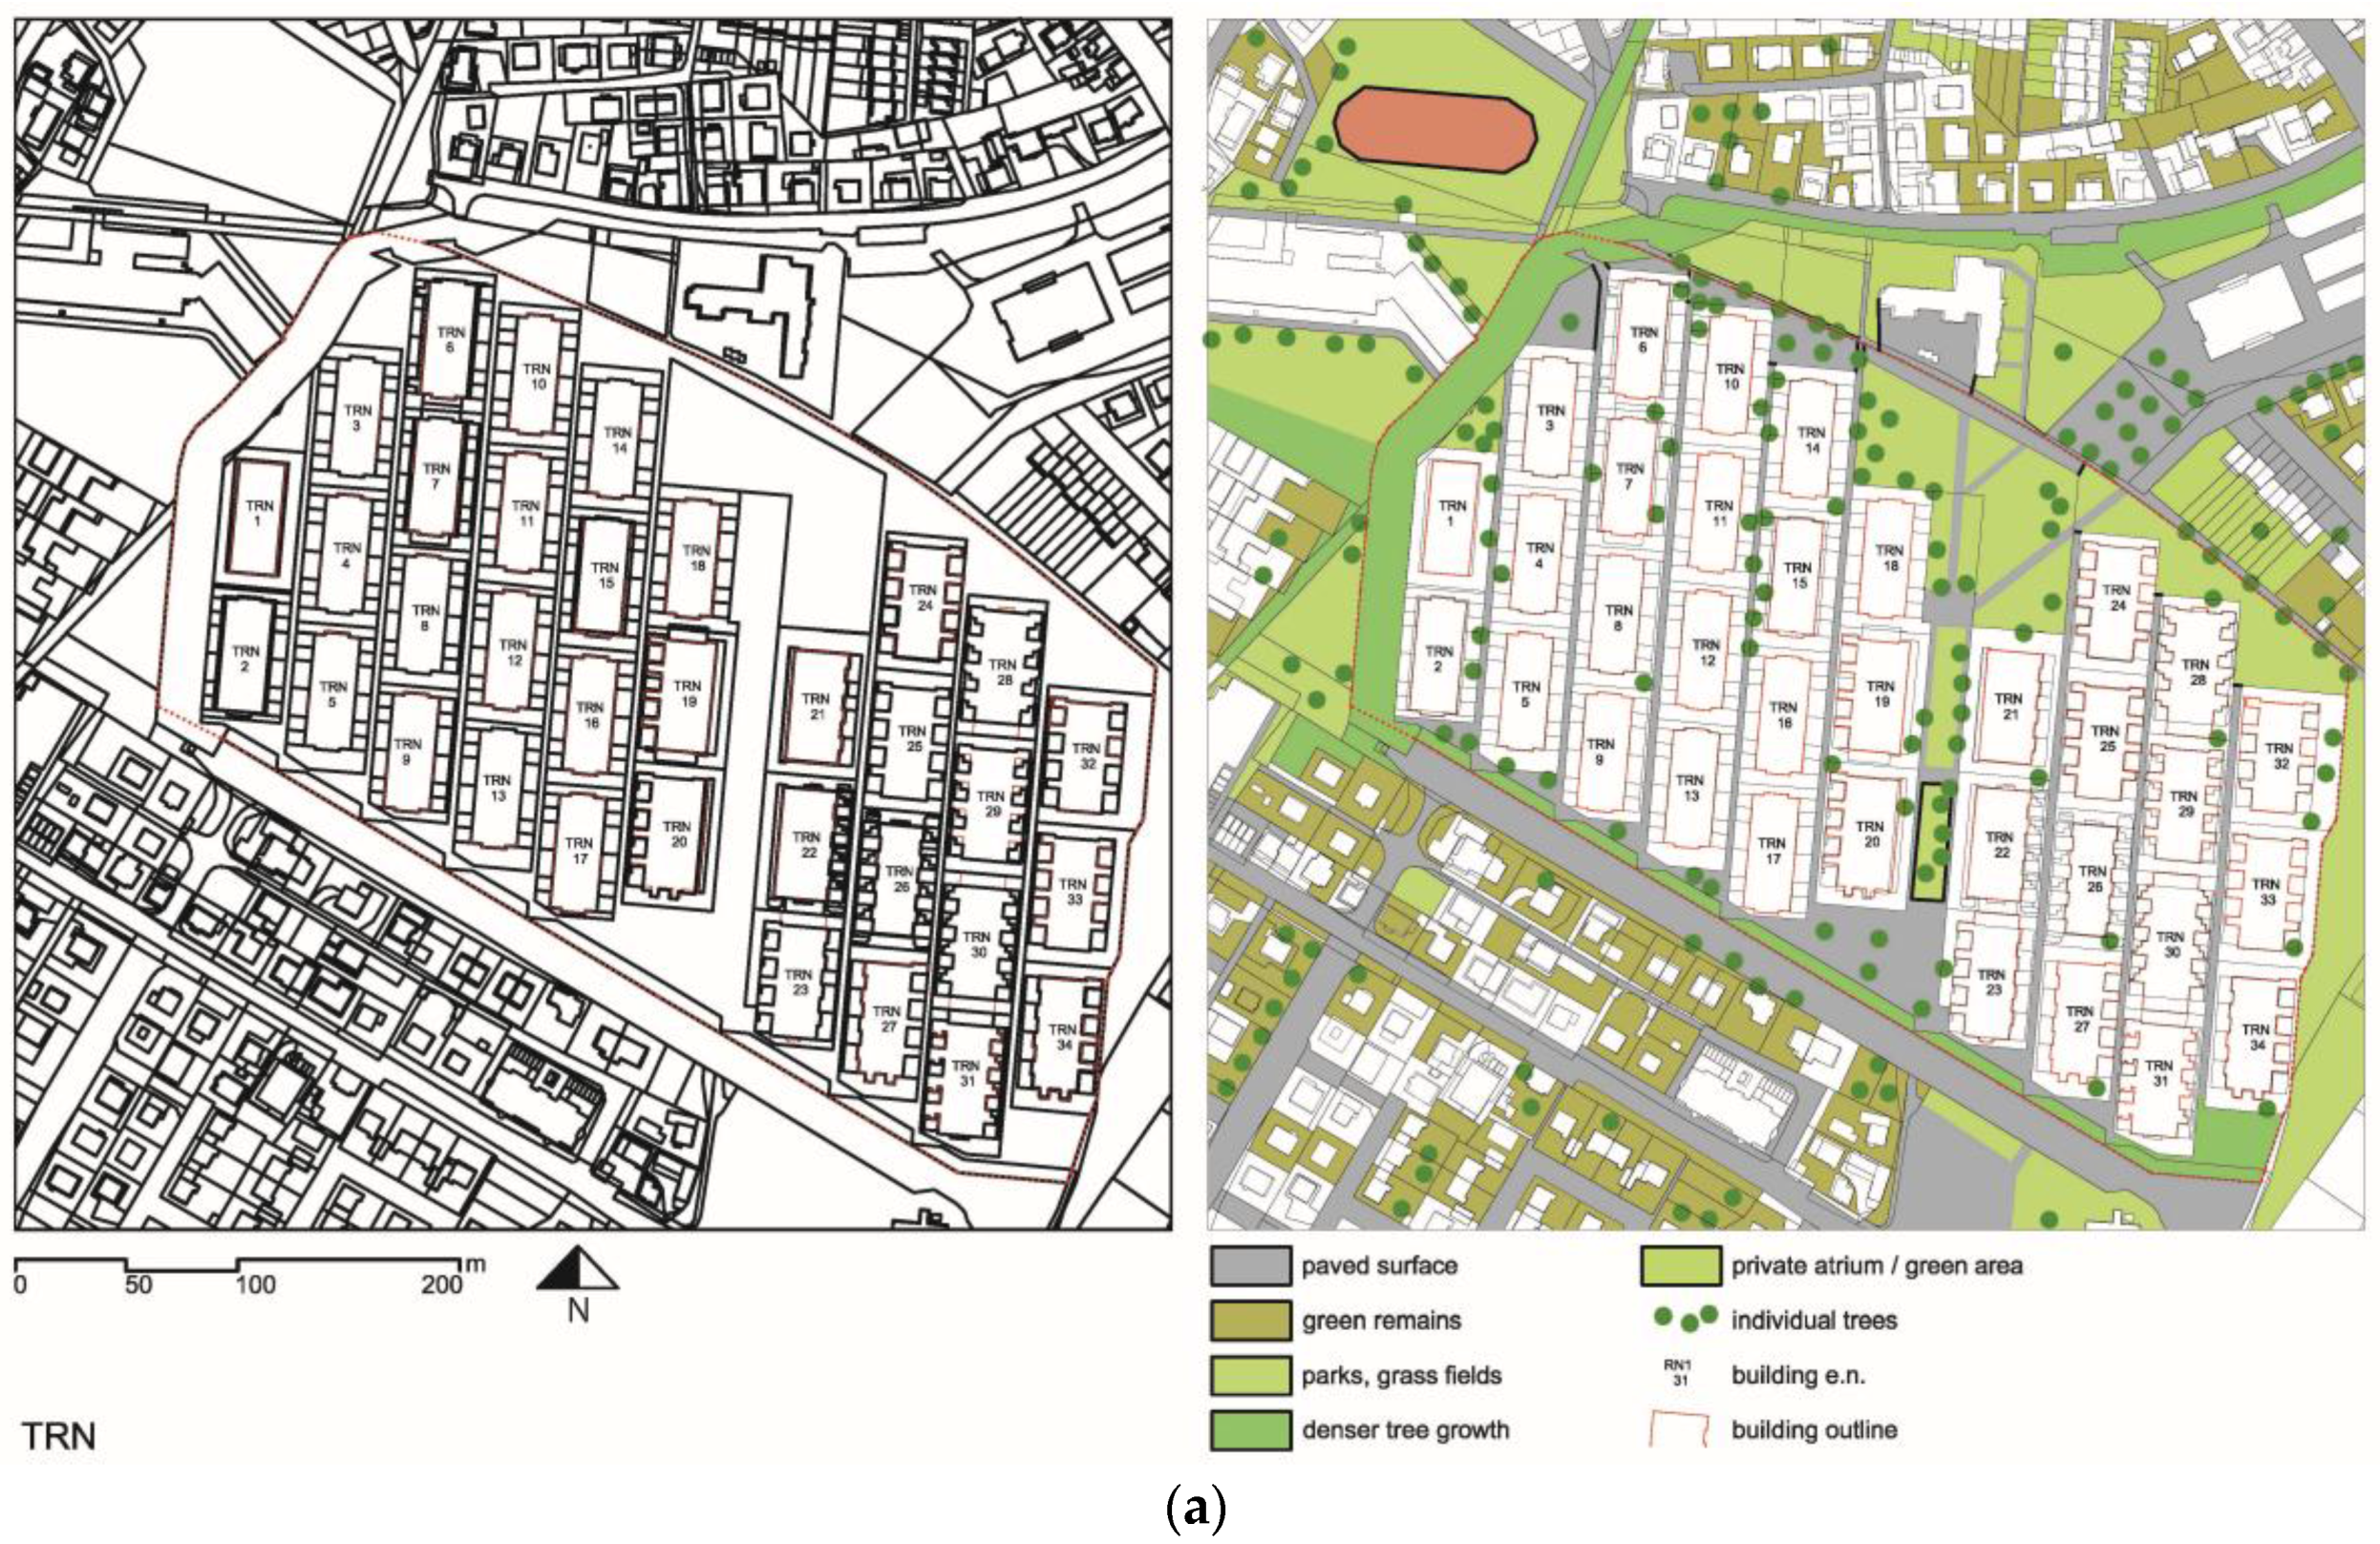
3.1. Urban Morphology—Density, Orientation and Openness

As to their relationship to morphology, we investigated elements such as: size of structures, height of the built structure, dimension and orientation of buildings, presence of voids in the built area, specific shapes of high rises, changing of shadows because of the built structure, play of light and shadows during the day, possibility of wind flows. Figure 11 shows the height of buildings; the tables provide details on building characteristics (Table 1, Table 2 and Table 3). We find that the overheating produced by UHI in MRN is greater despite the lower height of buildings. The composition of diverse family houses and block construction in MRN, in a diversified composition, prevents a more favorable impact of wind direction. The closed set-up in the NE–SW direction reduces air flow in both locations. The distances between buildings in MRN are greater. In terms of air overheating, the shape of the buildings has the main impact on the difference between the locations, i.e., terraced-type of construction in TRN and blocks in MRN. The vegetation on terraces in TRN has a cooling effect, while roof surfaces, otherwise causing overheating, are smaller with terraced construction. The surfaces creating overheating in MRN are larger, despite larger green areas, due to the larger distance between buildings. The overheating of floor surfaces is also affected by the existence or absence of basement. In MRN, underground levels act as an additional warm surface. The differences in air overheating are due to the various building typologies affecting also insolation and shading of the outdoor space (Figure 9). In TRN, terraces provide the shading of the outdoor space (either of the eastern or the western façade). In MRN (family houses and blocks) there is almost no shade between 12:00 and 4:00 p.m. Also, distances provided between some buildings (in TRN the average width of streets is 20.50 m, in MRN 27.00 m) are favorable in terms of shading, but also unpleasant, i.e., confined (deviation from the original design and densification of development on the account of building density).
Finally, the height of buildings and the distance between buildings are less significant than building typology and orientation.

3.2. Urban Cover—Connections between Cover, Function, and Material

In terms of land use, the following elements were studied: traffic system, parking areas (locations, exposure, openness of lots, density of use, number of vehicles), pedestrian and bicycle trails and their size, uses of the ground floor, built-up areas and open spaces (gardens, greenery and pavement material vs. volume of buildings), green surfaces (in the location, on the border, or in the surrounding), surrounding landscape (water, vegetation, topography, wind, radiation), humidity (season and precipitation). The use of green areas in TRN is much more prominent, because vegetation is found throughout the terraced apartment buildings (greening of balconies, as provided for in the architectural design); trees are added in the streets between the buildings. Street space design with high trees reduces surface overheating, regardless of the choice of pavement material. In TRN, many surfaces are covered by tree canopies (shading). Figure 12 (in connection to Table 1, Table 2 and Table 3) shows the elements in relation to existence or absence of basement; the tables detail the parameters. Stationary traffic has also an important impact on overheating. Car park areas are larger in MRN, they reach outside the buildings’ outline and, as a consequence, during the summer the number of overheated vehicles at the location is greater. A detailed overview of land use shows that underground car parks in MRN impact the overheating of the upper green plots and the pathway at the site. In MRN, where there could be some positive effect from the near-by forest, there is an open corridor (concrete canal) for parking at the level of the basement, which means that heat is further accumulated. This eliminates all potential positive effects of the border condition, i.e., the forest.
In conclusion, in terms of the surfaces influencing the overheating of outdoor air, the existence of basement and tree height are the main influence parameters. Unfavorable morphological design reduces the positive effect of border conditions such as the forest and the pond in MRN.

3.3. Urban Fabric—Surfaces and Materials

Given the selection of materials for the final surfaces, our study was focused on the following elements: buildings (plaster, wood, metal, plastics, material vs. openings), glass facades (openness, orientation, shading of openings, see Figure 5), roofs (gradient, orientation, material), pavements (concrete, stone, asphalt, etc.), slopes and border conditions. In the upper surfaces, where UHI is expressed, we determined the temperature differences of materials of the built areas and their dependence on the exposition, orientation, and presence of shadow, vicinity of greenery, and border conditions. Looking at Figure 13 (in connection to Table 1, Table 2 and Table 3) and by observing the spatial characteristics of the building façades on the ground, we can see the following: in MRN the structures with larger glass-enclosed parts of the façade and added shading and canopies are oriented towards W, while in E directions the glazed surfaces are smaller, protected from the sun, and there are no canopies. In TRN the proportion of glazing on the façade is larger than in MRN; however, the terraces provide the canopy to the lower ground, therefore direct exposure of the glass-enclosed areas to the sun is smaller. The façade surfaces of buildings in MRN are more diverse in color, while the choice of materials is also diverse and reflected on the façades in the visual composition of various elements. In connection with overheating, it is important to detect darker colors, metal façade linings, and asphalt surfaces (the latter was added as the influence of border conditions and pavement).
In terms of use of materials, the share of glass on façades has the greatest significance, increasing air overheating in a combination with contemporary façades with clean lines (without canopies).

3.4. Urban Metabolism—The Impact of Human Activities

In this category, our study referred to the elements concerning human activities, even though many other elements were recorded as well, i.e., elements added by individuals themselves, either planned or not, such as: air conditioning installations, shading, bins, cars (even though both locations are closed for traffic), open fires, etc. When visiting the locations, it became clear that some of these elements were unpredictable, so we neglected their significance. Road congestion and cars (Figure 14; in connection to Table 1, Table 2 and Table 3) also cause overheating. Both study locations are “surrounded by” busy transport roads, which however do not significantly impact the overheating inside the locations. The presence of a growing number of users outdoors has a great impact on overheating. In connection with the morphology of buildings (and based on field investigations) we found that the movement of users in TRN is completely different than that in MRN. In MRN, users mostly spend time at the pond for two reasons: there are water areas and vegetation, while there is a lack of shades between buildings. In TRN they move within the entire area (park, shading, and vegetation). The number of users decreases with higher temperature (the lack of shade). On the other hand, we found that in terms of overheating of surfaces, air-conditioning installations have a greater influence on the ventilation of the attic level in MRN than exterior air-conditioning installations in TRN, which are additionally mounted on the façade. The impact of garbage bins on overheating due to decomposition is also negligible, as their quantity is rather insignificant and they are regularly emptied.
In the sense of urban metabolism at both sites, there are no key elements (population density is low and so the number of elements influencing the metabolism is also low) that would affect overheating or any other parameters. The City of Ljubljana’s strategy is focused on zero waste, and in 2016 the city was proclaimed Green Capital. The verification of data and the conditions at TRN and MRN prove that the mentioned strategy is also implemented in practice.

4. Discussion

The fact that the temperature in urban areas is different than that in its rural surroundings but also within the urban area due to intra-urban differences in land use and surface characteristics [29] is well demonstrated on the example of Koseze area of the City of Ljubljana, which was the subject of the study presented here. Favorable climate conditions of Koseze, in comparison with other areas of Ljubljana, can be brought into relation with its land-use purpose, density and associated anthropogenic effect, as well as land cover.
Both neighborhoods, TRN and MRN, have some common elements, which mitigate the UHI effect.

4.1. Green Areas

Vegetation is the most reasonable solution when selecting UHI mitigation measures. Urbanisation increases surface temperatures in cities and affects the heat balance, while vegetation efficiently cools urban areas. Vegetation canopies cool the environment by providing shade and by transpiration of water through leaves [30]; evapotranspiration can transform a large portion of incoming solar radiation to the surface, which otherwise contributes to the underground heat storage, into latent heat, and makes the ground surface cooler [31]. Increasing the vegetation land cover could considerably reduce surface temperatures [32]; trees of a height of 5–10 m or thick hedges of a height of 1.5 m help to control the overheating of surfaces in buildings [33]; green areas reduce air-conditioning energy use and avoid carbon emission [34]. The cooling extent of a green area is also affected by the features of its surrounding areas, such as the density of buildings, the height/weight ratio, direction of streets, and the existence of plants [34].

4.2. Orientation of Buildings’ Axes in Approx. N–S Direction

Orientation of buildings, on the one hand, influences the rate of air mass movement between buildings, while the canyon between the construction lines can, depending on the wind direction, increase or reduce its speed, which influences how temperature is sensed. It is sensible to exploit natural wind patterns, as this can lower the temperature [34]. The heat of direct solar radiation is accumulated in building masses, which affects the heat of the environment, also with a time lag, while the relationship between solar energy and heat accumulation depends on the albedo of the material used on building surfaces. The orientation, connected to morphology, is important due to the shading of outdoor surfaces in both neighborhoods.

4.3. Urban Morphology

It was found that urban networks and structures play an important role in temperature conditions in the built environment; the results show that building form, orientation, and layout are among the most efficient strategies for mitigating the UHI effect [6]. Similarly, the organization in the form of an open street is significant or, according to O’Malley [6], the “presence of urban street canyons [results] in lower rates of long-wave radiation loss during the night”; O’Malley also elaborates the significance of urban morphology “reduced speed of wind caused by design and layout of the built environment”. In the case of Koseze, i.e., TRN and MRN, the latter is the decisive factor, i.e., that building dimensions, in-between spaces, offsets of residential apartment buildings, and the diversity in height and street width influence the differences in UHI in combination with other parameters.

4.4. Pedestrian Areas

Both neighborhoods are traffic-free. Parking is provided in an underground garage, the concrete corridors for entering the garages at the edge of both neighborhoods increase the temperatures in micro locations. From the viewpoint of the user, it is very important to know who the area is intended for as “parking lot building materials are known to create a heat island effect” [35] (p. 69). Despite the lack of parking spaces in both neighborhoods, surface materials also affect air overheating (paved surfaces) [36], as in the case of pathways and cycling trails in TRN and MRN, particularly the use of asphalt for paths, while this is less evident in MRN where concrete paving is only used in W–E direction. In the case of Koseze, TRN and MRN, transport roads and car park areas, as elements of overheating, are excluded.
MRN has additional elements mitigating the UHI effect, particularly in the sense of creating border conditions.

4.5. Immediate Vicinity of a Native Forest at the Edge of the Neighborhood

Based on measurements, Ca showed that even a small park with dense trees and greenery affects the temperature comfort in the middle of densely built-up areas. Strong local windscool the built environment and reduce heat intensity [31]. In this case, MRN is at an advantage in the sense of green areas (trees), as it has a forest to the SE as the edge of the neighborhood. However, the influence of wind is negligible (in the summer the W and SW wind directions prevail in the hours when UHI is the highest), as it does not include the orientation of the forest area. Thus, the forest area provides the neighborhood with an insignificant quantity of cool air.

4.6. Water Areas—A Pond

Water in the form of urban inland water bodies functions as an urban “sink”, the water has a cooling effect on the hot air [37]. According to Slingerland [38] (p. VI) “It can be seen that water is a good mitigation measure, because DTS (Distributed Temperature Sensing) measurements show that a minimum of 14% of daily incoming solar energy is absorbed by surface water”. In the study on the influence of water on overheating, he also suggests, “the directly measureable cooling effect of vegetation is larger than the cooling effect of water” [38]. The pond area is at a distance of 40 m from the built structure (the closest distance between the building and water). There is no water element inside the location so we expect that the external influence to the edge of the location is minimal in terms of reducing overheating; this also relates to urban morphology, because in the pond direction already the first set of buildings creates a linear barrier.
Urban forests can influence fluxes of energy and mitigate summer temperatures [39,40]. While this refers to the area of Koseze as a whole, when compared to other Ljubljana areas, the study showed that there are significant variations between different parts of Koseze—the neighborhoods. The deviation in UHI intensity occurring in Koseze was explained by variable morphological characteristics between the two studied residential neighborhood developments. The study has shown that neighborhood morphology affects its microclimate to the level to annul the potentials of bioclimatic features of the immediate surroundings, which are in this case the forest and the water body—the pond. MRN’s location, which is in the immediate proximity to the forest and the pond, had higher summer temperatures due to less favorable morphological features, which are: busy roads and parking corridors (concrete). We find that underground car parks greatly affect overheating despite the seemingly green composition of urban morphology (case of MRN).

5. Conclusions

The paper discusses the summer temperature conditions in two residential neighbourhoods. The neighbourhoods are located in close proximity, they have a similar morphological structure, and similar climate conditions; however, one of the neighbourhoods has a significantly higher UHI intensity than the other. The study deals with a synthesis of the urban morphology and on-site measurements regarding Oke’s definition [11] of four significant controls on urban climate, including urban structure, urban cover, urban fabric, and urban metabolism.
Based on this study we find that there is a significant relationship between urban climate concentration and urban morphology in residential areas with low UHI, particularly in terms of parameters relating to wind flow capacity, insolation, existence or absence of basement, and surface overheating, while the impact of border conditions on overheating is less significant. The key parameters with the cooling effect are: green areas and their placement and the lack of traffic areas, particularly stationary traffic (i.e., parking). The studying of the correlation between UHI and urban morphology characteristics, including on-site checking, explains the impact of the parameters on surface temperatures that significantly influence the comfort of living quality in the neighbourhoods’ outdoor spaces.

Acknowledgments

Alenka Fikfak and Saja Kosanović acknowledge the project: KLABS—Creating the Network of Knowledge Labs for Sustainable and Resilient Environments, 561675-EPP-1-2015-1-XK-EPPKA2-CBHE-JP. Martina Zbašnik-Senegačnik and Alenka Fikfak would like to acknowledge the Slovenian Research Agency for its financial support within the frame of the Programme Group P5-0068.

Author Contributions

Alenka Fikfak conceived and executed the research and drafted the manuscript. Martina Zbašnik-Senegačnik and Saja Kosanović supervised the research and helped to write and improve the draft manuscript. Martina Zbašnik Senegačnik carried out temperature measurements, gathered data in the field, and contributed photographic material. Cartographic materials in GIS and thermal maps were prepared by Miha Konjar. Janez P. Grom produced digital maps and performed on-site checks. All authors read and approved the final manuscript for submission.

Conflicts of Interest

The authors declare no conflict of interest.

References

  1. Kosanović, S.; Hildebrand, L.; Stević, G.; Fikfak, A. Resilience of inland urban areas to disasters occurred due to extreme precipitations. Open Urban Stud. Demogr. J. 2015, 1, 41–51. [Google Scholar] [CrossRef]
  2. Plut, D. Vrednotenje geografskega okolja in okoljska etika. Dela 2008, 29, 63–75. [Google Scholar] [CrossRef]
  3. Arnds, D.; Böhner, J.; Bechtel, B. Spatio-temporal variance and meteorological drivers of the urban heat island in a European city. Theor. Appl. Climatol. 2015. [Google Scholar] [CrossRef]
  4. Cocci Grifoni, R.; D’Onofrio, R.; Sargolini, M.; Pierantozzi, M.A. Parametric Optimization Approach to Mitigating the Urban Heat Island Effect: A Case Study in Ancona, Italy. Sustainability 2016, 8, 896. [Google Scholar] [CrossRef]
  5. Emmanuel, R.; Loconsole, A. Green infrastructure as an adaptation approach to tackling urban overheating in the Glasgow Clyde Valley Region, UK. Landsc. Urban Plan. 2015, 138, 71–86. [Google Scholar] [CrossRef]
  6. O’Malley, C.; Piroozfarb, P.A.E.; Farr, E.R.P.; Gates, J. An investigation into minimizing urban heat island (UHI) effects: A UK perspective. Energy Procedia 2014, 62, 72–80. [Google Scholar] [CrossRef]
  7. Erell, E.; Pearlmutter, D.; Boneh, D.; Bar Kutiel, P. Effect of high-albedo materials on pedestrian heat stress in urban street canyons. Urban Clim. 2014, 10, 367–386. [Google Scholar] [CrossRef]
  8. Salata, F.; Golasi, I.; de Lieto Vollaro, A.; de Lieto Vollaro, R. How high albedo and traditional buildings’ materials and vegetationaffect the quality of urban microclimate. A case study. Energy Build. 2015, 99, 32–49. [Google Scholar] [CrossRef]
  9. Prado, R.T.A.; Ferreira, F.L. Measurement of albedo and analysis of its influence the surface temperature of building roof materials. Energy Build. 2005, 37, 295–300. [Google Scholar] [CrossRef]
  10. Huang, C.; Ye, X. Spatial Modeling of Urban Vegetation and Land Surface Temperature: A Case Study of Beijing. Sustainability 2015, 7, 9478–9504. [Google Scholar] [CrossRef]
  11. Oke, T.R. Initial guidance to obtain representative meteorological observations at urban sites. In Instruments and Observing Methods; World Meteorological Organization: Geneva, Switzerland, 2006; Available online: http://weather.gladstonefamily.net/UrbanMetOps.pdf (accessed on 15 May 2016).
  12. Fregolent, L.; Ferro, D.; Magni, F.; Maragno, D.; Martinucci, D.; Fornaciari, G. Mitigation of and Adaptation to UHI Phenomena: The Padua Case Study. In Counteracting Urban Heat Island Effects in a Global Climate Change Scenario; Musco, F., Ed.; Springer: Venice, Italy, 2016; pp. 221–256. [Google Scholar]
  13. Statistical Office of the Republic of Slovenia. SI-Stat Data Portal. Available online: http://www.stat.si/eng/index.asp (accessed on 10 July 2016).
  14. Cegnar, T. Meteorologija, podnebne razmere v juniju 2016. In Naše Okolje; Cegnar, T., Knez, J., Eds.; Ministrstvo za Okolje in Prostor, Agencija RS za Okolje: Ljubljana, Slovenia, 2016; pp. 3–23. Available online: http://www.arso.gov.si/o%20agenciji/knji%C5%BEnica/mese%C4%8Dni%20bilten/NASE%20OKOLJE%20-%20Junij%202016.pdf (accessed on 10 July 2016). [Google Scholar]
  15. Kosanović, S.; Fikfak, A. Development of criteria for ecological evaluation of private residential lots in urban areas. Energy Build. 2016, 115, 69–77. [Google Scholar] [CrossRef]
  16. Ministry of Environment and Spatial Planning, Slovenian Environment Agency—Web CDS. Available online: http://www.gu.gov.si/en/ (accessed on 10 July 2016).
  17. Komac, B.; Ciglič, R.; Loose, A.; Pavšek, M.; Čermelj, S.; Oštir, K.; Kokalj, Ž.; Topole, M. Urban Heat Island in the Ljubljana City. In Counteracting Urban Heat Island Effects in a Global Climate Change Scenario; Musco, F., Ed.; SpringerOpen: London, UK, 2016; pp. 323–344. [Google Scholar]
  18. Čok, G. Residential buildings and sustainable development in Slovenia (Stambene zgrade i održivi razvoj u Sloveniji). Prostor 2014, 22, 134–147. [Google Scholar]
  19. See, L.; Mooney, P.; Foody, G.; Bastin, L.; Comber, A.; Estima, J.; Fritz, S.; Kerle, N.; Jiang, B.; Laakso, M.; et al. Crowdsourcing, Citizen Science or Volunteered Geographic Information? The Current State of Crowdsourced Geographic Information. ISPRS Int. J. Geo-Inf. 2016, 5, 55. [Google Scholar] [CrossRef]
  20. Pogačar, T.; Zalar, M.; Črepinšek, Z.; Kajfež Bogataj, L. Vročinski valovi v Sloveniji. In Proceedings of the Conference VIVUS—On Agriculture, Environmentalism, Horticulture and Floristics, Food Production and Processing and Nutrition, with Knowledge and Experience to New Entrepreneurial Opportunities, Naklo, Slovenia, 20–21 April 2016; Biotechnical Centre Naklo: Naklo, Slovenia, 2016; pp. 58–64. Available online: http://www.s-bts.kr.edus.si/uploads/media/08_Pogacar_Zalar_Crepinsek_Kajfez_Bogataj_Z.pdf (accessed on 20 December 2016). [Google Scholar]
  21. Novelirani Zazidalni Načrt za Območje Kosez. Available online: http://www.dlib.si/stream/URN:NBN:SI:DOC-ZJAGO5P8/71bae9c3-71b8-4aae-b06e-0a04d5961673/PDF (accessed on 23 November 2016).
  22. Gabrijelčič, A. Zaton soseske. Mladina 2016, 24. Available online: http://www.mladina.si/174873/zaton-soseske/ (accessed on 23 November 2016). [Google Scholar]
  23. Katalog stanovanjske gradnje v zadnjih 20. letih. AB 1984, 68/69, 70–119.
  24. Po Soseski Koseze z Arhitektom Viktorjem Pustom. Available online: http://www.napovednik.com/dogodek334133_po_soseski_koseze_z_arhitektom_viktorjem_pustom (accessed on 23 November 2016).
  25. Agrostroj. List 1996, 17, 30–35.
  26. Steeneveld, G.J.; Koopmans, S.; Heusinkveld, B.G.; van Hove, L.W.A.; Holtslag, A.A.M. Quantifying urban heat island effects and human comfort for cities of variable size and urban morphology in The Netherlands. J. Geophys. Res. 2011, 116, D20129. [Google Scholar] [CrossRef]
  27. Landsat Project Description. Available online: http://landsat.usgs.gov/about_project_descriptions.php (accessed on 10 July 2016).
  28. Vremensko Društvo Zevs. Available online: http://www.geostik.com/stat/ArhivPod.asp?Tip=K (accessed on 20 December 2016).
  29. Hart, M.A.; Sailor, D.J. Quantifying the influence of land-use and surface characteristics on spatial variability in the urban heat island. Theor. Appl. Climatol. 2009, 95, 397–406. [Google Scholar] [CrossRef]
  30. Onishi, A.; Cao, X.; Ito, T.; Shi, F.; Imura, H. Evaluating the potential for urban heat-island mitigation by greening parking lots. Urban For. Urban Green. 2010, 9, 323–332. [Google Scholar] [CrossRef]
  31. Ca, V.T.; Asaeda, T.; Abu, E.M. Reductions in air conditioning energy caused by a nearby park. Energy Build. 1998, 29, 83–92. [Google Scholar] [CrossRef]
  32. Srivanit, M.; Kazunori, H. The Influence of Urban Morphology Indicators on Summer Diurnal Range of Urban Climate in Bangkok Metropolitan Area, Thailand. Int. J. Civ. Environ. Eng. 2011, 11, 34–46. [Google Scholar]
  33. Bajsanski, I.; Stojakovic, V.; Jovanovic, M. Effect of tree location on mitigating parking lot insolation. Comput. Environ. Urban Syst. 2016, 56, 59–67. [Google Scholar] [CrossRef]
  34. Lin, W.; Wu, T.; Zhang, C.; Yu, T. Carbon savings resulting from the cooling effect of green areas: A case study in Beijing. Environ. Pollut. 2011, 159, 2148–2154. [Google Scholar] [CrossRef] [PubMed]
  35. Davis, A.Y.; Pijanowskia, B.C.; Robinsona, K.D.; Kidwellb, P.B. Estimating parking lot footprints in the Upper Great Lakes Region of the USA. Landsc. Urban Plan. 2010, 96, 68–77. [Google Scholar] [CrossRef]
  36. Echevarría Icaza, L.; van den Dobbelsteen, A.; van der Hoeven, F. Integrating Urban Heat Assessment in Urban Plans. Sustainability 2016, 8, 320. [Google Scholar] [CrossRef]
  37. Radhi, H.; Fikry, F.; Sharples, S. Impacts of urbanisation on the thermal behaviour of new built up environments: A scoping study of the urban heat island in Bahrain. Landsc. Urban Plan. 2013, 113, 47–61. [Google Scholar] [CrossRef]
  38. Slingerland, J. Mitigation of the Urban Heat Island Effect by Using Water and Vegetation. Master Thesis, Faculty of Civil Engineering and Geosciences, Delft University of Technology, Delft, The Netherlands, 2012. [Google Scholar]
  39. McPherson, E.G.; Nowak, D.; Heisler, G.; Grimmond, S.; Souch, C.; Grant, R.; Rowntree, R. Quantifying urban forest structure, function, and value: The Chicago Urban Forest Climate Project. Urban Ecosyst. 1997, 1, 49–61. [Google Scholar] [CrossRef]
  40. Zhou, Y.; Shepherd, J.M. Atlanta’s urban heat island under extreme heat conditions and potential mitigation strategies. Nat. Hazards 2010, 52, 639–668. [Google Scholar] [CrossRef]
Figure 1. City of Ljubljana, Slovenia.
Sustainability 09 00122 g001
Figure 2. Surface temperature in the City of Ljubljana.
Sustainability 09 00122 g002
Figure 3. Low surface temperature (UHI effect) in selected neighborhoods, City of Ljubljana.
Sustainability 09 00122 g003
Figure 4. Ljubljana—a terraced residential neighborhood from 1974 (TRN, left); Mostec residential neighborhood from 2002 (MRN, right).
Sustainability 09 00122 g004
Figure 5. TRN (left), MRN (right)—neighborhoods at eye level.
Sustainability 09 00122 g005
Figure 6. Population in TRN and MRN, in 2010. The map shows the points/house numbers with at least one resident.
Sustainability 09 00122 g006
Figure 7. Surface temperature at TRN and MRN sites.
Sustainability 09 00122 g007
Figure 8. In situ measurement of air temperature; TRN (left) and MRN (right).
Sustainability 09 00122 g008
Figure 9. Daytime insolation on 21 June 2016.
Sustainability 09 00122 g009
Figure 10. Flowchart of the study framework.
Sustainability 09 00122 g010
Figure 11. Urban density and urban structure at TRN and MRN.
Sustainability 09 00122 g011
Figure 12. Underground structures in TRN and MRN.
Sustainability 09 00122 g012
Figure 13. (a) Spatial characteristics of the building and urban cover in TRN; (b) Spatial characteristics of the building and urban cover in MRN.
Sustainability 09 00122 g013aSustainability 09 00122 g013b
Figure 14. Road congestion in TRN and MRN.
Sustainability 09 00122 g014
Table 1. TRN and MRN.
NeighborhoodTotal Neighborhood Area (m2)House NumbersNumber of BuildingsAverage Building High (m)Surface Covered by Buildings (m2)Surface Covered by Buildings (%)PopulationPopulation Density (pop/km2)
TRN114,193.19683514.6341,829.8536.63325128,469.29
MRN89,712.071361337.7521,908.2224.408569541.63
Table 2. Building characteristics in TRN.
Building
ID
TypologyG-Floor UseLevelFootprint m2E-FacadeE-Glazing
% (approx.)
W-FacadeW-Glazing
% (approx.)
TRN_1R/CMCG + 41050PLC85%GF85%
TRN_2RRG + 41100PLC85%GF85%
TRN_3RRG + 41100PLC85%GF85%
TRN_4RRG + 41100PLC85%GF85%
TRN_5RRG + 41100PLC85%GF85%
TRN_6RRG + 41100PLC85%GF85%
TRN_7RRG + 41100PLC85%GF85%
TRN_8RRG + 41100PLC85%GF85%
TRN_9RRG + 41100PLC85%GF85%
TRN_10RRG + 41100PLC85%GF85%
TRN_11R/CMCG + 41100PLC85%GF85%
TRN_12RRG + 41100PLC85%GF85%
TRN_13RRG + 41100PLC85%GF85%
TRN_14RRG + 41100PLC85%GF85%
TRN_15RRG + 41100PLC85%GF85%
TRN_16R/CCOG + 41100PLC85%GF85%
TRN_17RRG + 41100PLC85%GF85%
TRN_18RRG + 41100PLC85%GF85%
TRN_19R/CCG + 41280PLC85%GF85%
TRN_20R/CCG + 41370PLC85%GF85%
TRN_21R/CCG + 41200PLC85%GF85%
TRN_22R/CCG + 41200PLC85%GF85%
TRN_23R/CC/ConsG + 41280PLC85%GF85%
TRN_24RRG + 41260PLC85%GF85%
TRN_25RRG + 41230PLC85%GF85%
TRN_26RRG + 4950PLC85%GF85%
TRN_27RRG + 41200PLC85%GF85%
TRN_28R/CSCG + 41480PLC85%GF85%
TRN_29RRG + 41200PLC85%GF85%
TRN_30RRG + 41480PLC85%GF85%
TRN_31RRG + 41310PLC85%GF85%
TRN_32RRG + 41200PLC85%GF85%
TRN_33R/CACG + 41200PLC85%GF85%
TRN_34R/CTOG + 41200PLC85%GF85%
TOTAL m2 39,790
AREA m2114,193FIS0.35
TRN: the number of buildings is 35, the total area of the neighborhood is 114,193.18 m2, the average building height is 14.63 m, the surface covered by buildings is 41,829.85 m2 or 36.60%. Abbreviations: R—residential; C—commercial; MC—marketing company; CO—community office; TOK—tourist office; Cons—consulate; SC—sports club; AC—accounting company; PLC—pastel colours; GF—glazed façade.
Table 3. Building characteristics in MRN.
Building
ID
TypologyG-Floor UseLevelFootprint m2E-FacadeE-Glazing
% (approx.)
W-FacadeW-Glazing
% (approx.)
MRN_1RHRG + 1900W50%GF70%
MRN_2RHRG + 1660G50%GF70%
MRN_3RHRG + 1495G50%GF70%
MRN_4RHRG + 1380G/B50%G/B70%
MRN_5RHRG + 1990G70%GF70%
MRN_6RRG + 2570Y70%GF70%
MRN_7RRG + 2810Y70%GF70%
MRN_8RHRG + 1650G50%GF70%
MRN_9RRG + 21160Y40%Z60%
MRN_10RHRG + 1750R/G50%GF70%
MRN_11RRG + 2850G90%Gr50%
MRN_12RRG + 2850G90%Gr50%
MRN_13RRG + 21150LPG90%G50%
MRN_14RRG + 2850G90%G50%
MRN_15RHRG + 1770W50%GF70%
MRN_16RHRG + 1680W50%GF70%
MRN_17R/CCG + 1760G/B60%G/B45%
MRN_18RHRG + 1760Y50%GF70%
MRN_19RRG + 2780Y50%Y50%
MRN_20RHRG + 1650Y50%GF70%
MRN_21RRG + 3880B50%B70%
MRN_22RRG + 2850Gr90%Gr50%
MRN_23RRG + 2850Gr90%Gr50%
MRN_24RRG + 2890Y50%Y50%
MRN_25RRG + 2970G50%G50%
MRN_26RRG + 3780B50%B50%
MRN_27RRG + 3850B50%B50%
TOTAL m2 21,535
AREA m289,712FIS0.24
MRN: the number of buildings is 133, the total area of the neighborhood is 89,712.07 m2, the average building height is 7.75 m, the surface covered by buildings is 21,908.23 m2 or 24.40%. Abbreviations: R—residential; RH—row houses; C—commercial; PLC—pastel light colours; GF—glazed facade; W—white; Y—yellow; G—Grey; Gr—green; R—red; B—brown.

